


TM
OneTouch Series II
Network Assistant
Users Manual
September 1999 Rev. 1, 11/00
© 1999, 2000 Fluke Corporation. All rights reserved. Printed in USA
All product names are trademarks of their respective companies.

LIMITED WARRANTY & LIMITATION OF LIABILITY
Fluke Corporation (Fluke) warrants its products to be free from
defects in material and workmanship under normal use and
service for one (1) year, beginning on the date of shipment. This
warranty extends only to the original buyer or end-user custom er
of a Fluke authorized reseller, and does not apply to fuses, bat-
teries or to any product which, in Fluke’s opinion, has been misused, altered, neglected or damaged by accident or abnormal
conditions of operation or handling. Fluke warrants that software
will operate on appropriate Fluke instruments substantially in
accordance with its functional specific ati ons for 90 days and that
it has been properly recorded on non-defective media. Fluke
does not warrant that software will be error free or operate without interruption.
Fluke authorized resellers shall extend this warranty on new and
unused products to end-user customers only but have no
authority to extend a greater or different warranty on behalf of
Fluke.
Fluke’s warranty obligation is limited, at Fluke’s option, to refund
of the purchase price, or free of charge repair or replacement of
a defective product which is returned to an authorized Fluke
Service Center within the warranty period.
To obtain warranty service, call Fluke for instructions at the
number listed in the Appendix. Following warranty repair, the
product will be returned to Buyer, transportation prepaid (FOB
Destination). If Fluke determines that the failure was caused by
misuse, alteration, accident or abnormal condition of operation or
handling, Fluke will provide an estimate of repair costs and obtain authorization before commencing the work. Following repair, the product will be returned to the Buyer transportat i on
prepaid and the Buyer will be billed for the repair and return
transportation charges (FOB Shipping Point).
Warranty service is available outside the United States only if
product was purchased through a Fluke Authorized Sales Outlet
in the country of use or the applicable Fluke international price
was paid. Product transported from the United States for which
the applicable Fluke international price was not paid must be
returned to the U.S. to receive warranty service, at the shipment
expense and risk of Buyer. Fluke reserves the right to invoice
Buyer for importation costs of repair/replacem ent parts when
product purchased in one country is submitted for repair in another country.
THIS WARRANTY IS PURCHASER’S SOLE AND EXCLUSIVE
REMEDY AND IS IN LIEU OF ALL OTHER WARRANTIES,
EXPRESS OR IMPLIED, INCLUDING BUT NOT LIMITED TO
ANY IMPLIED WARRANTY OF MERCHANTABILI TY OR FITNESS FOR A PARTICULAR PURPOSE. FLUKE SHALL NOT
BE LIABLE FOR ANY SPECIAL, INDIRECT, INCIDENTAL OR
CONSEQUENTIAL DAMAGES OR LOSSES , INCLUDING
LOSS OF DATA, WHETHER ARISING FROM BREACH OF
WARRANTY OR BASED ON CONTRACT, TORT, RELIANCE
OR ANY OTHER THEORY.
Since some countries or states do not allow limitation of the term
of an implied warranty, or exclusion or limitation of incidental or
consequential damages, the limitations and excl usi ons of this
warranty may not apply to every buyer. If any provision of this
Warranty is held invalid or unenforceable by a court of competent jurisdiction, such holding will not affect the validity or enforceability of any other provision of this warranty.
Fluke Corporation
P.O. Box 9090
Everett WA 98206-9090
FlukeEurope B.V.
P.O. Box 1186
5602 B.D. Eindhoven
The Netherlands

Table of Contents
Chapter Title Page
1 Introduction.................................................................................................................. 1-1
Introducing the OneTouch Series II Network Assistant.................................................. 1-1
Software Version....................................................................................................... 1-2
Supplied Equipment.................................................................................................. 1-2
Optional Equipment .................................................................................................. 1-2
Placing Orders and Getting Assistance .................................................................... 1-3
2 Autotest and Central Setup......................................................................................... 2-1
Introduction....................................................................................................................2-1
Device Discovery Process........................................................................................ 2-2
Identifying Routers............................................................................................... 2-2
Device Icons......................................................................................................... 2-3
Station Detail Display................................................................................................ 2-8
Viewing Multiple Protocols on Station Detail Displays.......................................... 2-9
NetWare Devices List ............................................................................................... 2-9
NetWare Print Server List.............................................................................................. 2-11
TCP/IP Devices Display............................................................................................ 2-11
Sorting ...................................................................................................................... 2-15
Address Entry Keypad.............................................................................................. 2-16
i

OneTouch Series II
Users Manual
Central Setup ............................................................................................................ 2-17
IP Config............................................................................................................... 2-17
Using DHCP to Get an IP Source Address........................................................... 2-19
SNMP ................................................................................................................... 2-21
3 Network Health............................................................................................................. 3-1
Introduction ....................................................................................................................3-1
Interpreting Error Results .......................................................................................... 3-8
Collisions.............................................................................................................. 3-8
Late Collisions...................................................................................................... 3-8
Short Frames........................................................................................................ 3-8
Jabbers................................................................................................................. 3-8
Bad Frame Check Sequence (FCS)..................................................................... 3-8
Tracking Addresses................................................................................................... 3-9
Local vs. Remote Stations......................................................................................... 3-9
4 Cable Tests................................................................................................................... 4-1
Introduction ....................................................................................................................4-1
Cable Autotest........................................................................................................... 4-2
Split Pairs.............................................................................................................. 4-2
Cable Length Results ........................................................................................... 4-2
Wiremap Cable..................................................................................................... 4-3
Identifying Cables...................................................................................................... 4-4
Toner.................................................................................................................... 4-4
Define Cable......................................................................................................... 4-4
Basic Cable Concepts............................................................................................... 4-4
Twisted Pair Cables.............................................................................................. 4-5
Reversed Pair....................................................................................................... 4-6
ii

Contents
Crossed Pair ........................................................................................................ 4-6
Split Pair............................................................................................................... 4-6
Cable Length........................................................................................................ 4-7
Cable Termination................................................................................................ 4-8
Test Fiber Optic Cable................................................................................................... 4-10
Ensuring Accurate Measurements............................................................................ 4-10
Setting a Reference.................................................................................................. 4-10
Measuring Optical Loss............................................................................................. 4-11
Measuring Output Power.......................................................................................... 4-11
5 NIC/Hub Tests.............................................................................................................. 5-1
Introduction....................................................................................................................5-1
NIC Autotest.............................................................................................................. 5-2
Hub Autotest............................................................................................................. 5-3
Viewing Hub Capabilities.......................................................................................... 5-3
NIC Detector............................................................................................................. 5-4
Flash Hub Port.......................................................................................................... 5-4
6 Connectivity Tests....................................................................................................... 6-1
Introduction....................................................................................................................6-1
IP Trace Route.......................................................................................................... 6-2
IP & NetWare Ping.................................................................................................... 6-2
Entering IPX Addresses....................................................................................... 6-3
Conducting a Ping Station Test................................................................................. 6-4
Key Device Ping........................................................................................................ 6-6
Interpreting Ping Test Results................................................................................... 6-8
ConfigMaster............................................................................................................. 6-8
Station Locator.......................................................................................................... 6-10
(continued)
iii

OneTouch Series II
Users Manual
Find MAC.............................................................................................................. 6-10
Find IP.................................................................................................................. 6-11
Mode of Operation................................................................................................ 6-11
Results.................................................................................................................. 6-11
7 ITO – Internetwork Throughput Option...................................................................... 7-1
Introduction ....................................................................................................................7-1
ITO/xDSL Throughput Test ....................................................................................... 7-2
ITO/xDSL Theory of Operation............................................................................. 7-2
Basic Operation.................................................................................................... 7-4
Conducting a Throughput Test............................................................................. 7-4
Connecting and configuring the Remote Unit....................................................... 7-7
Connecting and configuring the Local Unit........................................................... 7-7
Results Displayed During the Throughput Test.................................................... 7-13
Final Test Results................................................................................................. 7-13
ITO/xDSL Traffic Generator....................................................................................... 7-15
MAC Mode............................................................................................................ 7-17
IP Mode................................................................................................................ 7-17
MAC and IP Mode Results.................................................................................... 7-18
Ping Mode ............................................................................................................ 7-19
Ping Mode Results................................................................................................ 7-20
Appendices
A Specifications.......................................................................................................... A-1
B Basic Maintenance.................................................................................................. B-1
C Web Remote Control............................................................................................... C-1
D Glossary.................................................................................................................. D-1
Index
iv

List of Tables
Table Title Page
2-1. Device Icons ......................................................................................................................... 2-4
2-2. TCP/IP Device Icons............................................................................................................. 2-13
3-1. Network Health Meters ......................................................................................................... 3-5
4-1. Fiber Test Terminology......................................................................................................... 4-11
7-1. ITO and xDSL Terminology .................................................................................................. 7-1
v

OneTouch Series II
Users Manual
vi

List of Figures
Figure Title Page
1-1. OneTouch-10/100 Series II Network Assistant..................................................................... 1-2
2-1. Autotest Display.................................................................................................................... 2-2
2-2. Station Filter.......................................................................................................................... 2-6
2-3. Station List Information......................................................................................................... 2-6
2-4. NetBIOS Information............................................................................................................. 2-6
2-5. Novell Server Information ..................................................................................................... 2-7
2-6. Station Detail ........................................................................................................................ 2-8
2-7. Ping SNMP Results .............................................................................................................. 2-9
2-8. Station Running Multiple Protocols....................................................................................... 2-9
2-9. NetWare File Server List....................................................................................................... 2-10
2-10. Netware File Server Information........................................................................................... 2-11
2-11. TCP/IP Devices Display........................................................................................................ 2-12
2-12. Local Station List................................................................................................................... 2-15
2-13. Sort Options.......................................................................................................................... 2-16
2-14. Address Entry Keypad.......................................................................................................... 2-16
2-15. Central Setup........................................................................................................................ 2-17
2-16. IP Address Configuration...................................................................................................... 2-18
2-17. Address Entry Keypad.......................................................................................................... 2-19
2-18. DHCP Display....................................................................................................................... 2-20
vii

OneTouch Series II
Users Manual
2-19. Security Setup....................................................................................................................... 2-21
2-20. SNMP.................................................................................................................................... 2-22
2-21. Community String Editor........................................................................................................ 2-23
3-1. Network Health...................................................................................................................... 3-1
3-2. Top Senders Display............................................................................................................. 3-2
3-3. Station Detail......................................................................................................................... 3-3
3-4. Network Health Test Meter Icon............................................................................................ 3-3
3-5. Station Addresses ................................................................................................................. 3-8
4-1. Cable Tests ........................................................................................................................... 4-1
4-2. Wiremap Results................................................................................................................... 4-3
4-3. Reversed Pair........................................................................................................................ 4-6
4-4. Crossed Pair.......................................................................................................................... 4-6
4-5. Split Pair................................................................................................................................ 4-7
4-6. Cable Termination................................................................................................................. 4-9
4-7. Fiber Test Results................................................................................................................. 4-12
4-8. Connections for Setting a Reference Level........................................................................... 4-13
4-9. Connections for Measuring Optical Loss............................................................................... 4-14
4-10. Connections for Measuring Output Power............................................................................. 4-15
5-1. NIC/Hub Test......................................................................................................................... 5-1
5-2. NIC Autotest.......................................................................................................................... 5-2
5-3. Hub Autotest Display............................................................................................................. 5-3
5-4. NIC Detector.......................................................................................................................... 5-4
5-5. Flash Hub Port Display.......................................................................................................... 5-6
6-1. Connectivity Tests Display .................................................................................................... 6-1
6-2. IP Trace Route ...................................................................................................................... 6-2
6-3. IP & NetWare Ping Display.................................................................................................... 6-2
6-4. NetWare Ping........................................................................................................................ 6-3
6-5. IP Ping................................................................................................................................... 6-3
viii

Contents
6-6. IP and NetWare Ping............................................................................................................ 6-5
6-7. IP Ping Results ..................................................................................................................... 6-5
6-8. NetWare Ping Results........................................................................................................... 6-5
6-9. Ping Key Devices.................................................................................................................. 6-6
6-10. IP Configuration.......................................................................................................... .......... 6-7
6-11. Edit Key Devices................................................................................................................... 6-7
6-12. ConfigMaster ........................................................................................................................ 6-9
6-13. Station Locator...................................................................................................................... 6-10
6-14. Station Locator Information................................................................................................... 6-12
7-1. Local and Remote Units........................................................................................................ 7-3
7-2. ITO Local Unit and Possible Remote Unit Locations ............................................................ 7-5
7-3. xDSL Test Connections........................................................................................................ 7-6
7-4. Local Unit Configuration Display for Throughput Test........................................................... 7-8
7-5. xDSL Central Office (Remote) Connections ......................................................................... 7-9
7-6. xDSL Subscriber-end Connections ....................................................................................... 7-10
7-7. ITO Results Shown During the Test...................................................................................... 7-13
7-8. Final ITO Throughput Test Results....................................................................................... 7-14
7-9. Traffic Generator Setup Display............................................................................................ 7-16
7-10. MAC or IP Mode Sample Results......................................................................................... 7-19
7-11. Ping Mode Sample Results................................................................................................... 7-21
C-1. Web Agent............................................................................................................................ C-2
(continued)
ix

OneTouch Series II
Users Manual
x

Chapter 1
Introduction
Introducing the OneTouch Series II
Network Assistant
The Fluke OneTouch Series II Network Assistant
(hereafter referred to as the "Network Assistant") provides
quick solutions to the most common problems found
when installing and troubleshooting Ethernet networks.
The Network Assistant is a portable, handheld instrument
that is operated using a touchscreen user interface.
XCaution
Take care not to damage the touchscreen
with any sharp, pointed, or hard objects. For
additional information, see “Essentials” in
the Getting Started Manual.
The OneTouch Series II is available in three models:
q
OneTouch Series II 10
q
OneTouch Series II 10/100
q
OneTouch Series II 10/100 Pro
OneTouch Series II Pro features include:
q
Station Locator
q
Key Device Ping
q
ConfigMaster
q
Web Remote Control
These features are discussed throughout this manual in
the pertinent sections. Read the
Network Assistant Getting Started Manual
that came with your purchase to become familiar with and
quickly begin using your OneTouch Series II Network
Assistant. You can also access
http://www.flukenetworks.com and navigate to the
OneTouch Series II area to access software and
OneTouch Series II
(P/N 1279870)
1-1
OneTouch Series II
Users Manual
documents. Adobe Acrobat Reader is required to view the
documents. It is included on the CD-ROM that came with
your purchase or downloadable from www.adobe.com.
Software Version
To determine the version of the software in the OneTouch
Series II Network Assistant, press the green button to turn
the Network Assistant on then press
The software version number is displayed on the Help
screen. To update the software version for your Network
Assistant, read the
Manual
and the OneTouch Link program online help.
OneTouch Series II Getting Started
.
Supplied Equipment
The following is supplied with the Network Assistant:
NiMH Rechargeable Battery Pack
Universal AC Power Adapter
Cable Identifier 1
Instrument Softcase
Power Cord
Network Assistant Strap and Holster
CD-ROM Disk
OneTouch Series II Users Manual
OneTouch Link Program
OneTouch Reporter
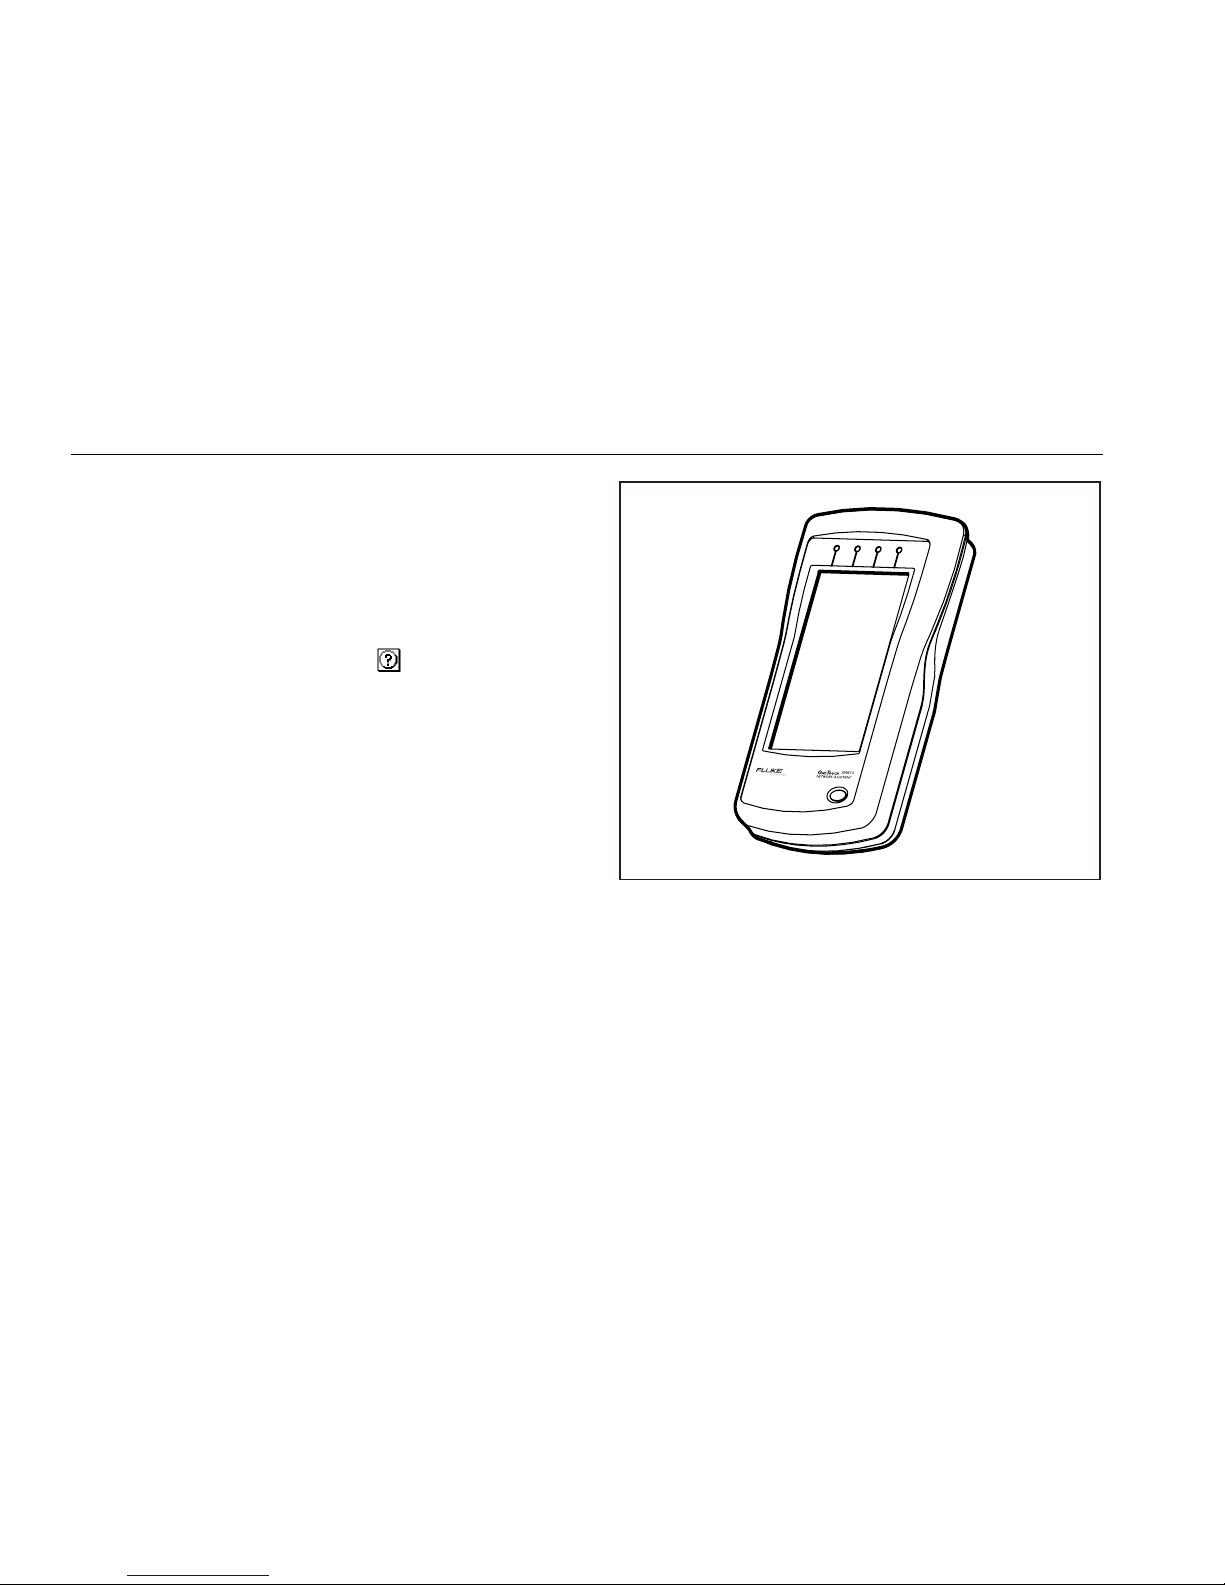
ace010f.eps
Figure 1-1. OneTouch-10/100 Series II Network
Assistant
Optional Equipment
The following optional items and can be purchased
through Fluke or your local distributor:
NiMH Rechargeable Battery Pack (P/N N6600/NBP)
Cable Identifier Set -- numbers 2 through 6 (P/N
N6600/RA)
1-2

UTP Accessory Kit (P/N N6703)
Extra
Placing Orders and Getting Assistance
To locate an authorized service center, visit us on the
World Wide Web at www.flukenetworks.com or call
Fluke using the phone numbers listed below:
For application related questions, send email to:
fluke-assist@flukenetworks.com.
OneTouch Series II Network Assistant Getting
Started Manual
North America : 1-800-28FLUKE (1-800-283-5853)
Europe: +31 40-267-8300
Japan: +81-3-3434-0188
Singapore: +65Anywhere in the world: +1-425-446-4519
-738-5655
*
Introduction
Introducing the OneTouch Series II Network Assistant
1
1-3

Introduction
AutoTest and Central Setup are two critical elements of
using your Network Assistant. To run AutoTest, press
(AutoTest) on the top-level display. The Network
Assistant will take one of several courses of action.
q
If a link pulse is detected, it searches for devices on
the network. The devices on your segment are
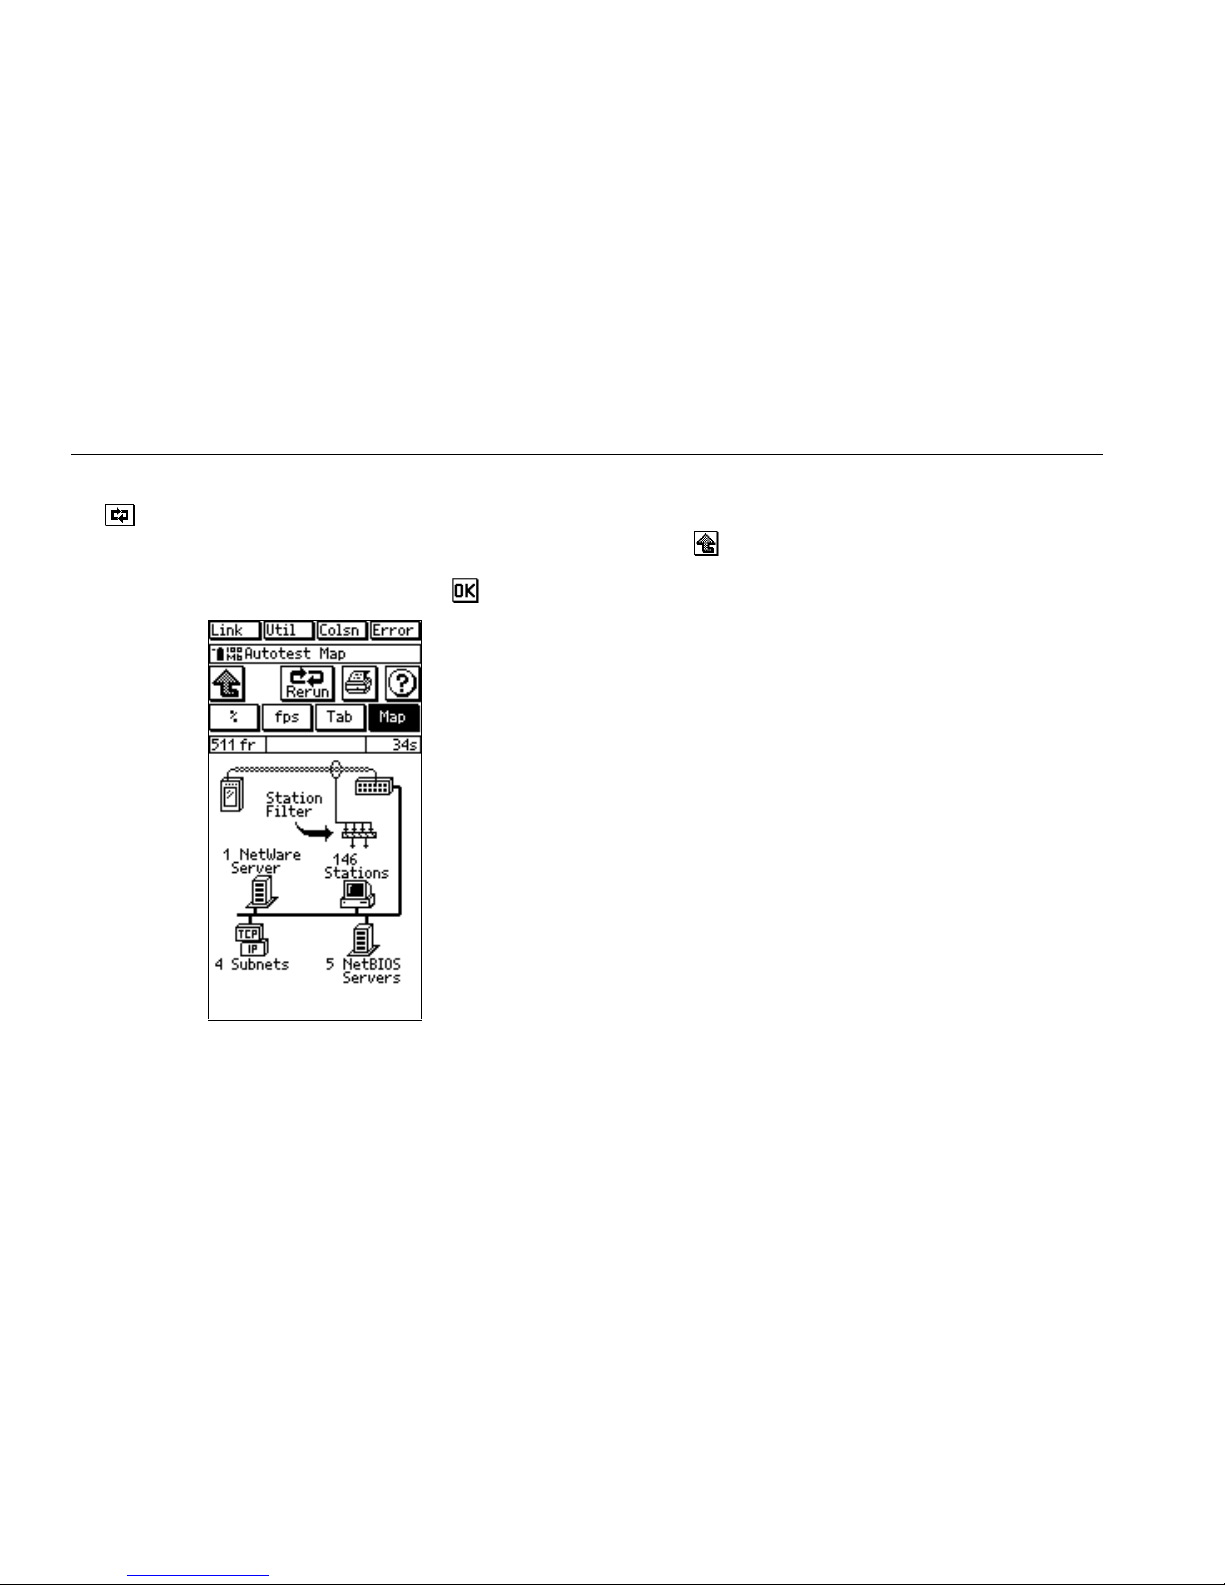
shown by protocol on the AutoTest display. The map
view shows a summary of device types, including the
Network Assista nt itself and the hub , which
shows hub capability (Figure 2-1).
q
If it detects a wire mapper (office locator), it will map
the cable.
q
If it detects the Fiber Optic Module (FOM), it will
report the results.
Chapter 2
Autotest and Central Setup
q
If it detects an open cable, it will perform Time
Domain Reflectometry (TDR) on the cable to
determine cable length, characteristic impedance,
and other parameters.
q
If no link pulse is detected but it detects termination,
no data will be found and you will see the message,
No cable tests when plugged into an active
device.
or NIC that is not turned on.
If link is detected, you can get the same information via
AutoTest or Network Health from the main menu. You
can then use the tabs to navigate between the different
views. The difference between AutoTest and Network
Health is that AutoTest restarts the discovery process
from the beginning, including DHCP addresse s (if
enabled). Network Health allows you to view the
information without a discovery restart. Pressing AutoTest
is the same as unplugging the network cable and then
This could happen if it is plugged into a hub
2-1
OneTouch Series II
Users Manual
plugging it back in. This is also the same as pressing
the
(Rerun) button.
Press a displayed device, cable, or hub icon to see a
popup screen showing more information about that item.
Close the resulting popup screen by pressing
.
ace201s.bmp
Figure 2-1. AutoTest Display
AutoTest continues to discover devices and to count
frames and errors even after you exit the screen by
pressing
(up one level). The Network Health test runs
in the background (read Chapter 3).
Device Discovery Process
When you attach the Network Assistant to a network, it
immediately begins searching for servers, routers,
printers, and switches. This search occurs whenever the
Network Assistant gains link pulse regardless of the
current menu.
During the discovery process (5-20 seconds, depending
on network), the Network Assistant processes only the
discovery response frames and broadcast frames. When
the discovery process has finished, the Network Assistant
goes into promiscuous mode. In this mode, it processes all
frames and reports all stations that talk on the network.
Identifying Routers
The Network Assistant also transmits RIP requests and
ICMP router requests as part of its router discovery
process. These discovery packets request router
information, allowing the Network Assistant to locate
routers that have little traffic and are not sending routing
updates.
2-2

The Network Assistant will identify as a router any device
advertising one of the following router protocols: RIP,
IGRP, EIGRP, IRDP, or OSPF.
Therefore, if a router is statically configured (i.e., is not
sending out routing updates), it may not show up as a
router.
The Network Assistant will identify any IP device that is
transmitting periodic router updates as a router. Therefore,
the Network Assistant identifies a workstation that is
inadvertently configured as a router.
Device Icons
Pressing a flashing device icon displays a popup screen
that shows information about problems with that device.
Autotest and Central Setup
Introduction
2
Close the popup window by pressing
icons are described in Table 2-1.
. The device
2-3
OneTouch Series II
Users Manual
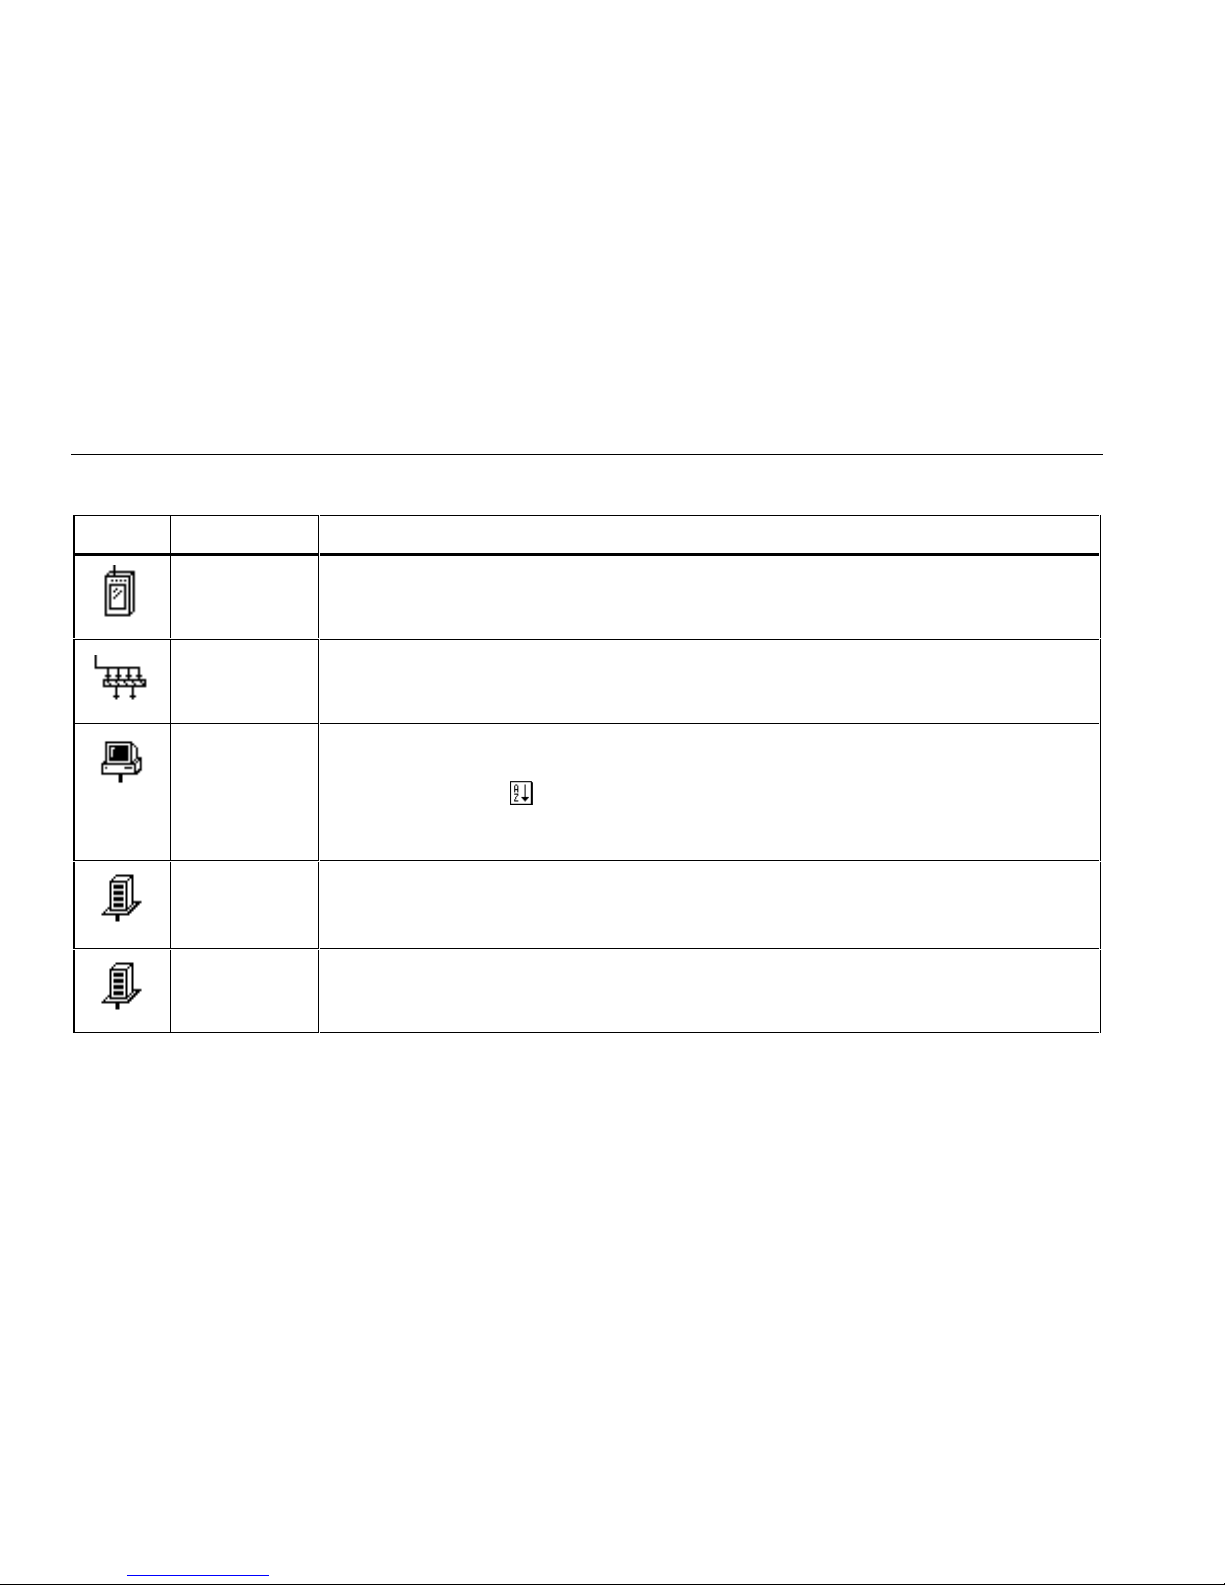
Table 2-1. Device Icons
Icon Meaning Operations
Network
Assistant
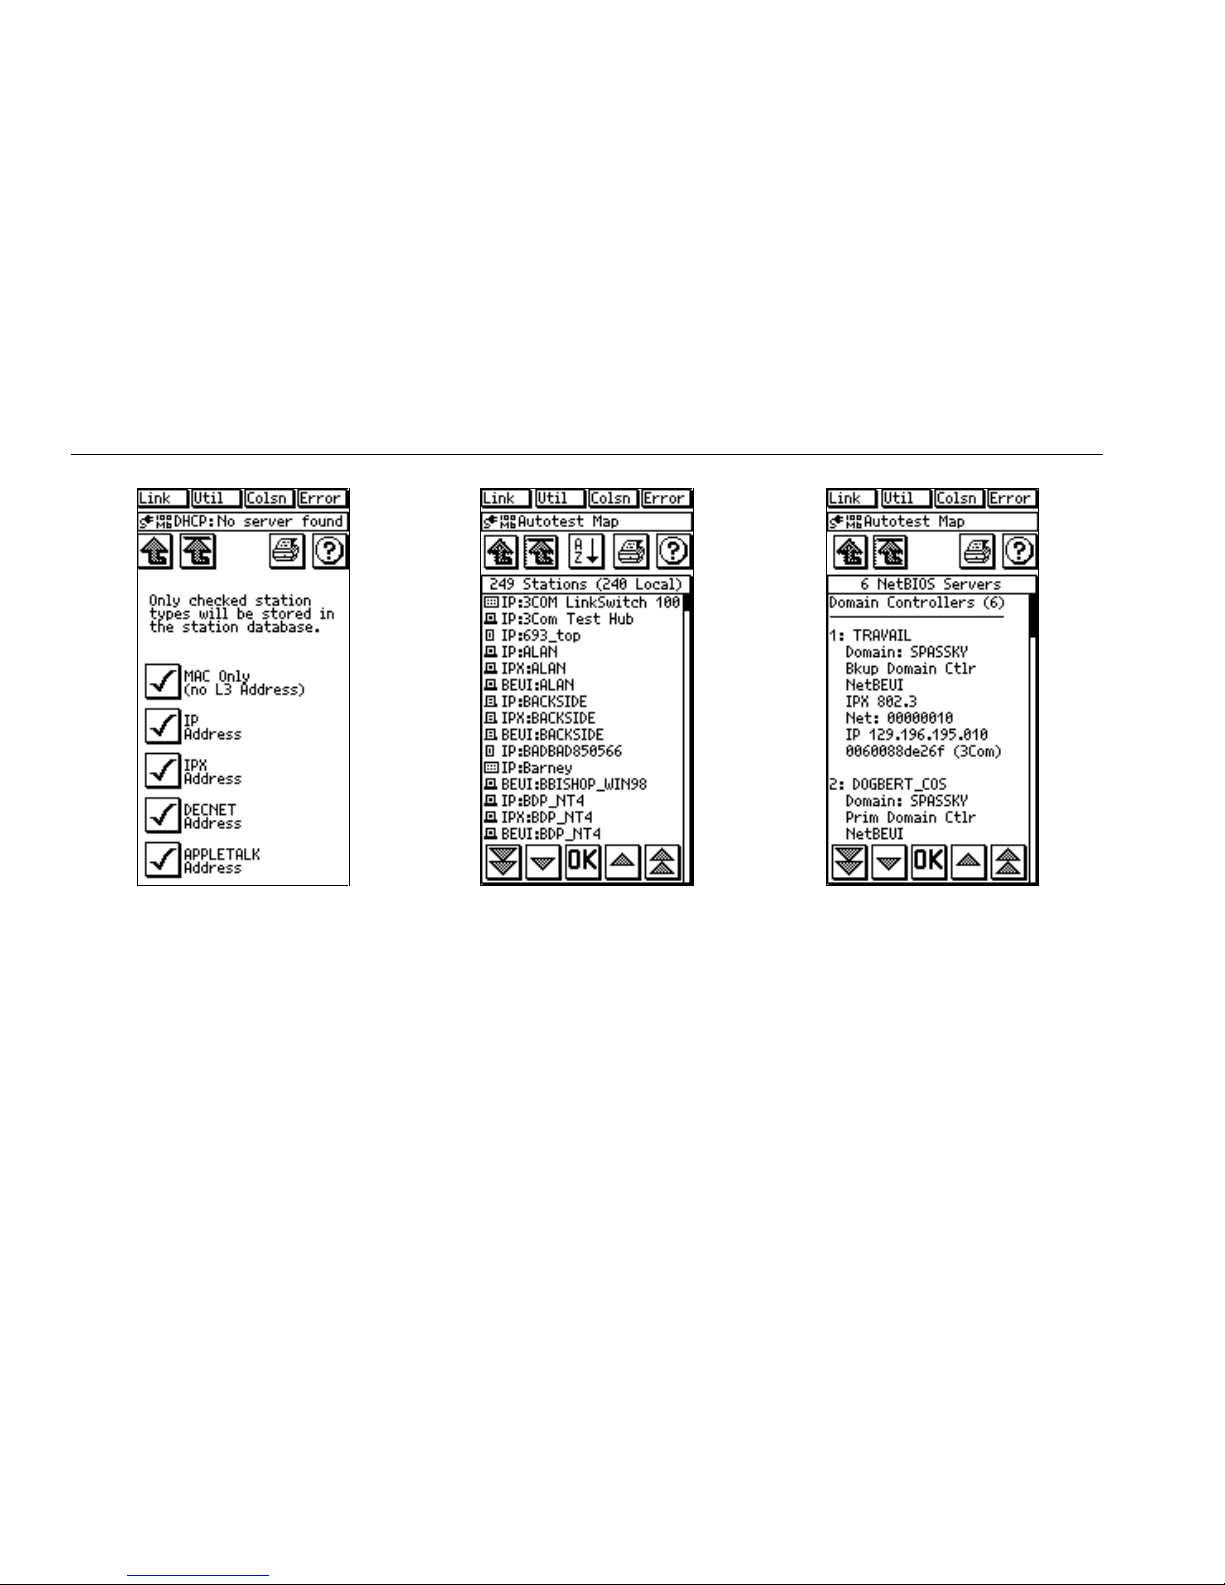
Station Filter Press to filter out station types of low or no interest to you (Figure 2-2). You can unselect the
Stations Press to display a list of stations on the network (Figure 2-3). Stations are listed by name by
NetWare Press to display a list of NetWare servers (Figure 2-5). Read “NetWare Devices List” for
NetBIOS Press to display a scrollable list of all NetBIOS servers with their network addresses and
Press to display the MAC address and software/hardware versions for your instrument.
following: MAC Only (no L3 Address), IP Address, IPX, DECNET, and APPLETALK
default. You can also sort other ways (Frame Count, Protocol, Device Type, and MAC
address) by pressing
"Local versus Remote Stations" in Chapter 3. Press a line in the station list to see a Station
Detail display (Figure 2-6). For more information, read "Station Detail Display."
more information. If there are more devices than will fit on the display, you can scroll through
the list.
protocols detected on the segment (Figure 2-4).
(Station List Sort). For more details, see "Tracking Addresses" and
2-4

Table 2-1. Device Icons (Cont.)
Icon Meaning Operation
Autotest and Central Setup
Introduction
2
TCP/IP
Devices
Hub
Cable
Press to display IP routers, servers, stations and other devices detected on the network that are
running TCP/IP (Figure 2-11). Pressing an icon on the TCP/IP Devices display generates a list
of devices of that type. For more information, read “TCP/IP Devices."
Press to display general information about the status of the Hub. This information includes
whether the link is active and its activity level. The following fields within the Hub popup window
indicate the Hub’s status.
Capability
Speed
Duplex Mode
RX Level (receive pair)
Normal:
Marginal:
attenuation in the cable or a defective Hub port.)
Press to display cable length and fault information (when the Network Assistant is not connected
to an active device). The Network Assistant displays the length to the first fault it detects. For
more details, see "Cable Autotest" in Chapter 4.
Hub signal level is within specification.
Hub signal level is not within specification. (The problem is either excessive
Link Pulse Status
Duplex
Polarity
2-5
OneTouch Series II
Users Manual
2-6
Figure 2-2. Station Filter
ace216s.bmp
Figure 2-3. Station List Information
ace202s.bmp
Figure 2-4. NetBIOS Information
ace205s.bmp
Autotest and Central Setup
Introduction
2
Figure 2-5. Novell Server
Information
ace206s.bmp
Figure 2-6. Station Detail
ace207s.bmp
2-7

OneTouch Series II
Users Manual
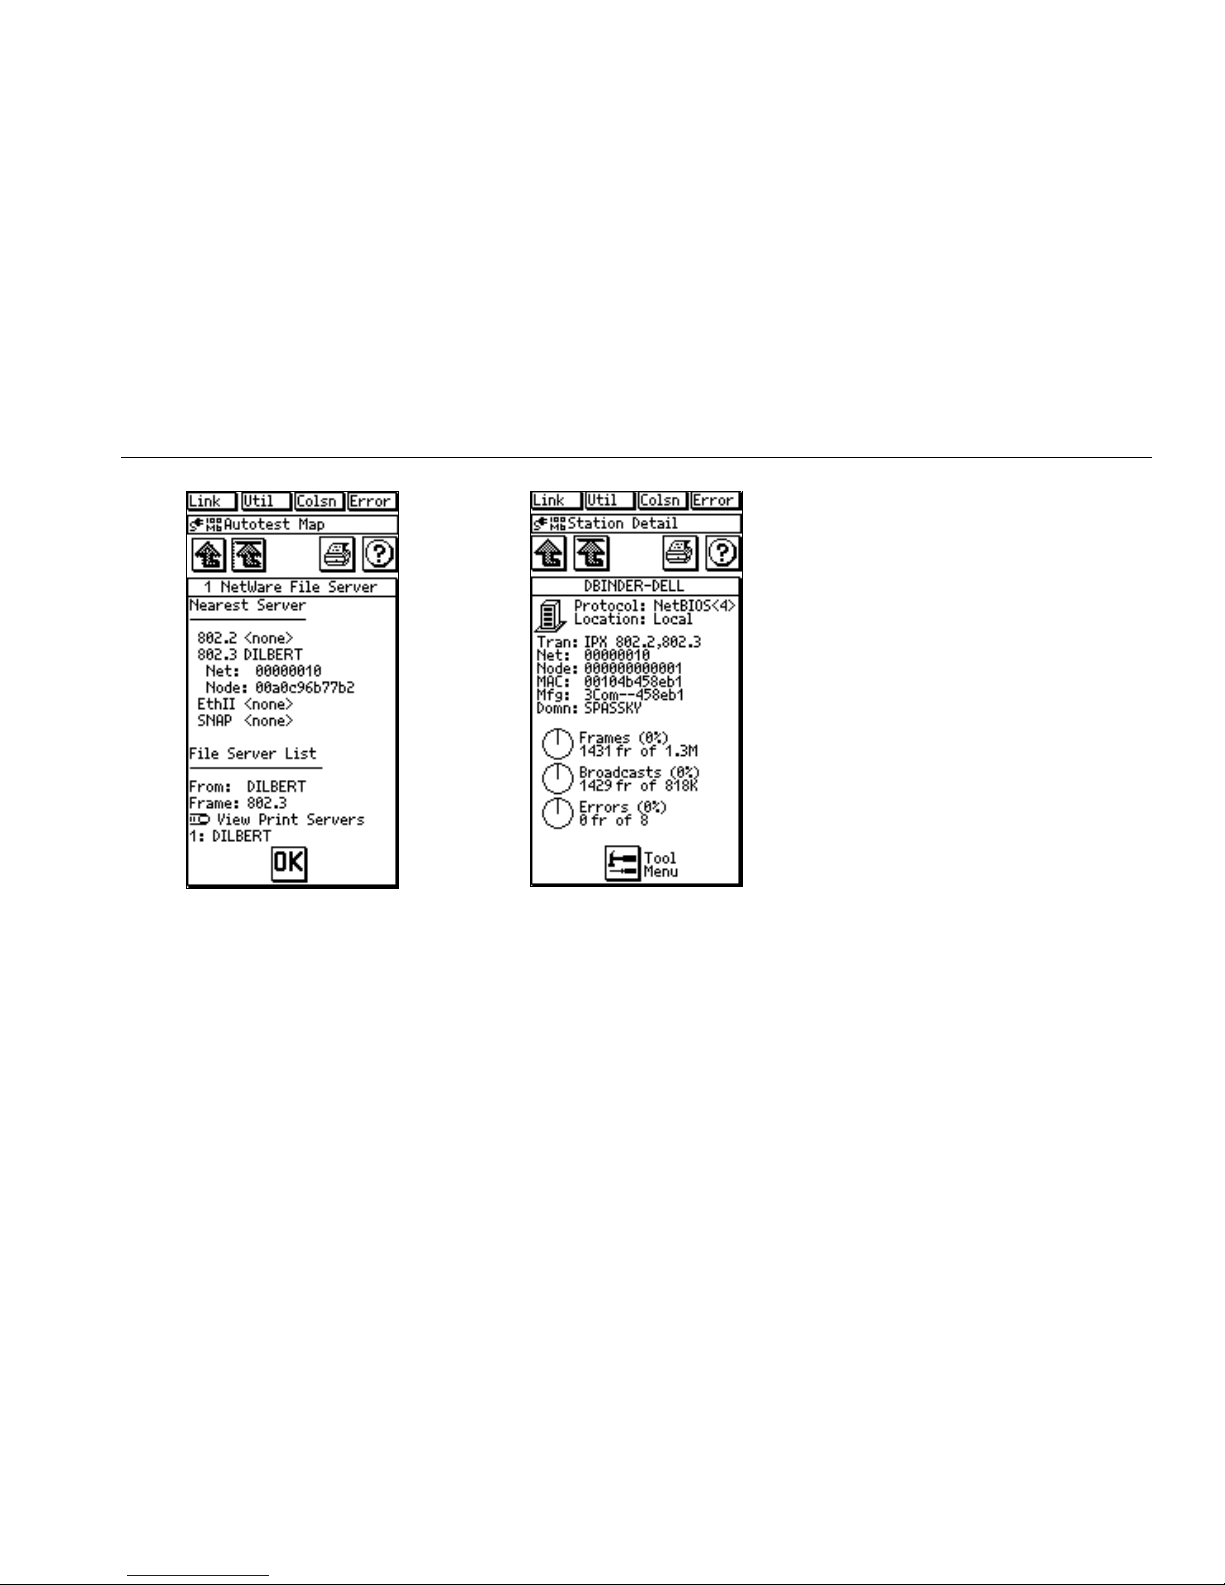
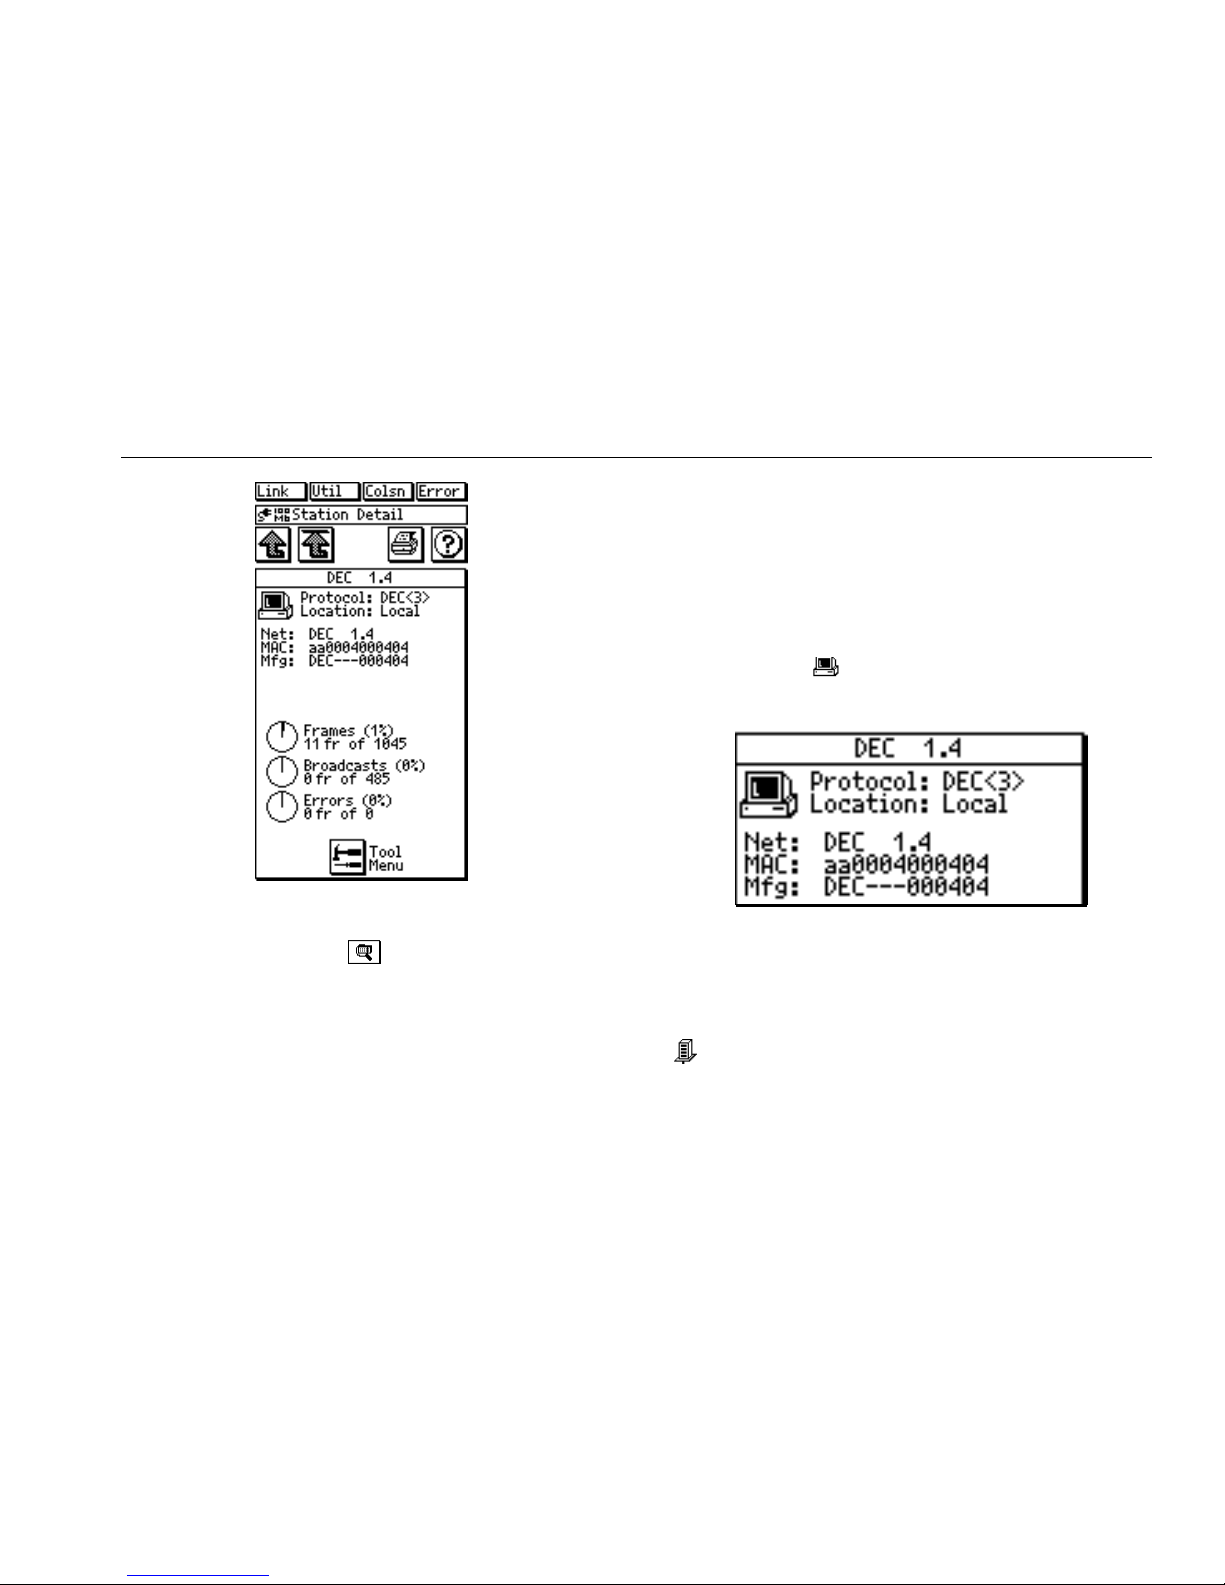
Station Detail Display
Pressing on a line in a station or server list brings up a
Station Detail display (Figure 2-6). This display shows
information pertaining to the resource. The information
may include the frame type used, the network, node, and
MAC addresses, the equipment manufacturer, and the
types of router protocols or algorithms available.
From the Station Detail Display menu, press
Menu) to access the following:
q
IP Trace Route
q
Ping + SNMP
q
Ping
q
Ping Key Device
q
Add to Key Devices
q
Find Node
Press
(Ping + SNMP) to ping the station or resource
and get any SNMP information available. For an IP ping,
the Network Assistant uses the source and router IP
addresses currently entered in the IP configuration screen
under Connectivity Tests. These addresses must be valid
to get a ping response. For an IPX ping, the Network
Assistant automatically determines a source address.
(Tool
To access the SNMP agent, the Network Assistant uses
the "public" community string (password). If the agent has
a different community string, access the SNMP Config
menu from the Central Setup screen (read “SNMP” in
Chapter 6).
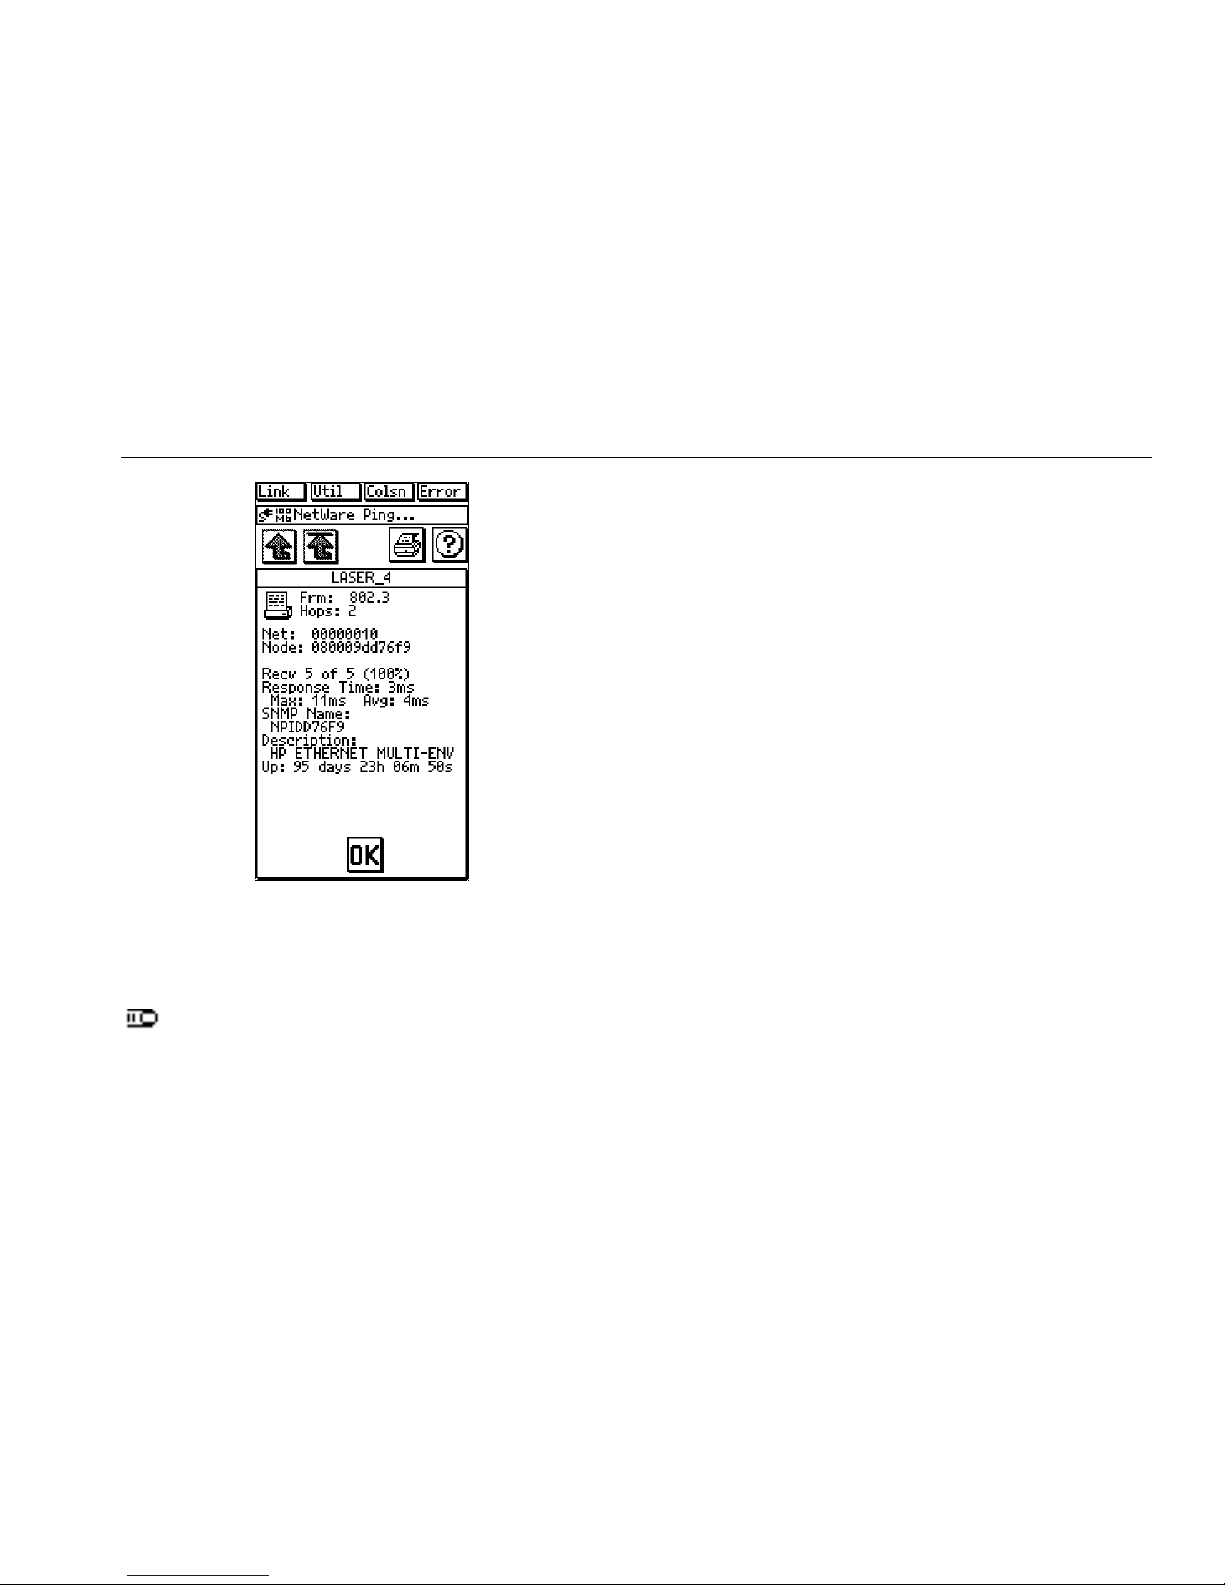
After you press
(Ping+SNMP), the station's ping
results, SNMP name, description, and uptime (in days,
hours, minutes, and seconds) are displayed (Figure 2-7).
Note that the SNMP name is cut off at 22 characters to fit
on the display.
2-8
Autotest and Central Setup
Introduction
2
Viewing Multiple Protocols on Station Detail
Displays
The Station Detail display tells you if the station is running
multiple protocols. If multiple protocols are discovered,
the protocol name on the Station Detail display is followed
by a number. For example, Figure 2-8 shows part of the
Station Detail information for a station running three
protocols. Press
protocols.
(Station) to cycle through the
Figure 2-7. Ping SNMP Results
ace208s.bmp
From the Tool menu press (Find Node) to activate
the Station Locator feature, which details switch
information. Read “Station Locator” in Chapter 6 for more
information.
ace209s.bmp
Figure 2-8. Station Running Multiple Protocols
NetWare Devices List
To see a NetWare file server list, run AutoTest then press
(NetWare Server) on the AutoTest display.
The NetWare File Server display (Figure 2-9) shows the
nearest server for each of the four Ethernet frame types
2-9

OneTouch Series II
Users Manual
(IEEE 802.2 and 802.3, Ethernet II, and SNAP). If more
than one server responds for a given file type, the
Network Assistant reports the first server that responded.
The File Server List shows the nearest 50 file servers,
based on hop count. This list is derived from SAP
responses from the first server in the Nearest Server list.
If the list takes up more than one screen, use the arrow
keys to scroll through the list. Press on a server name to
see its frame type, hop count, network address, ping
results, SNMP information, and uptime (Figure 2-10).
2-10
.
ace210s.bmp
Figure 2-9. NetWare File Server List
Autotest and Central Setup
NetWare Print Server List
configured in the SNMP Config menu (see “Central
Setup”).
2
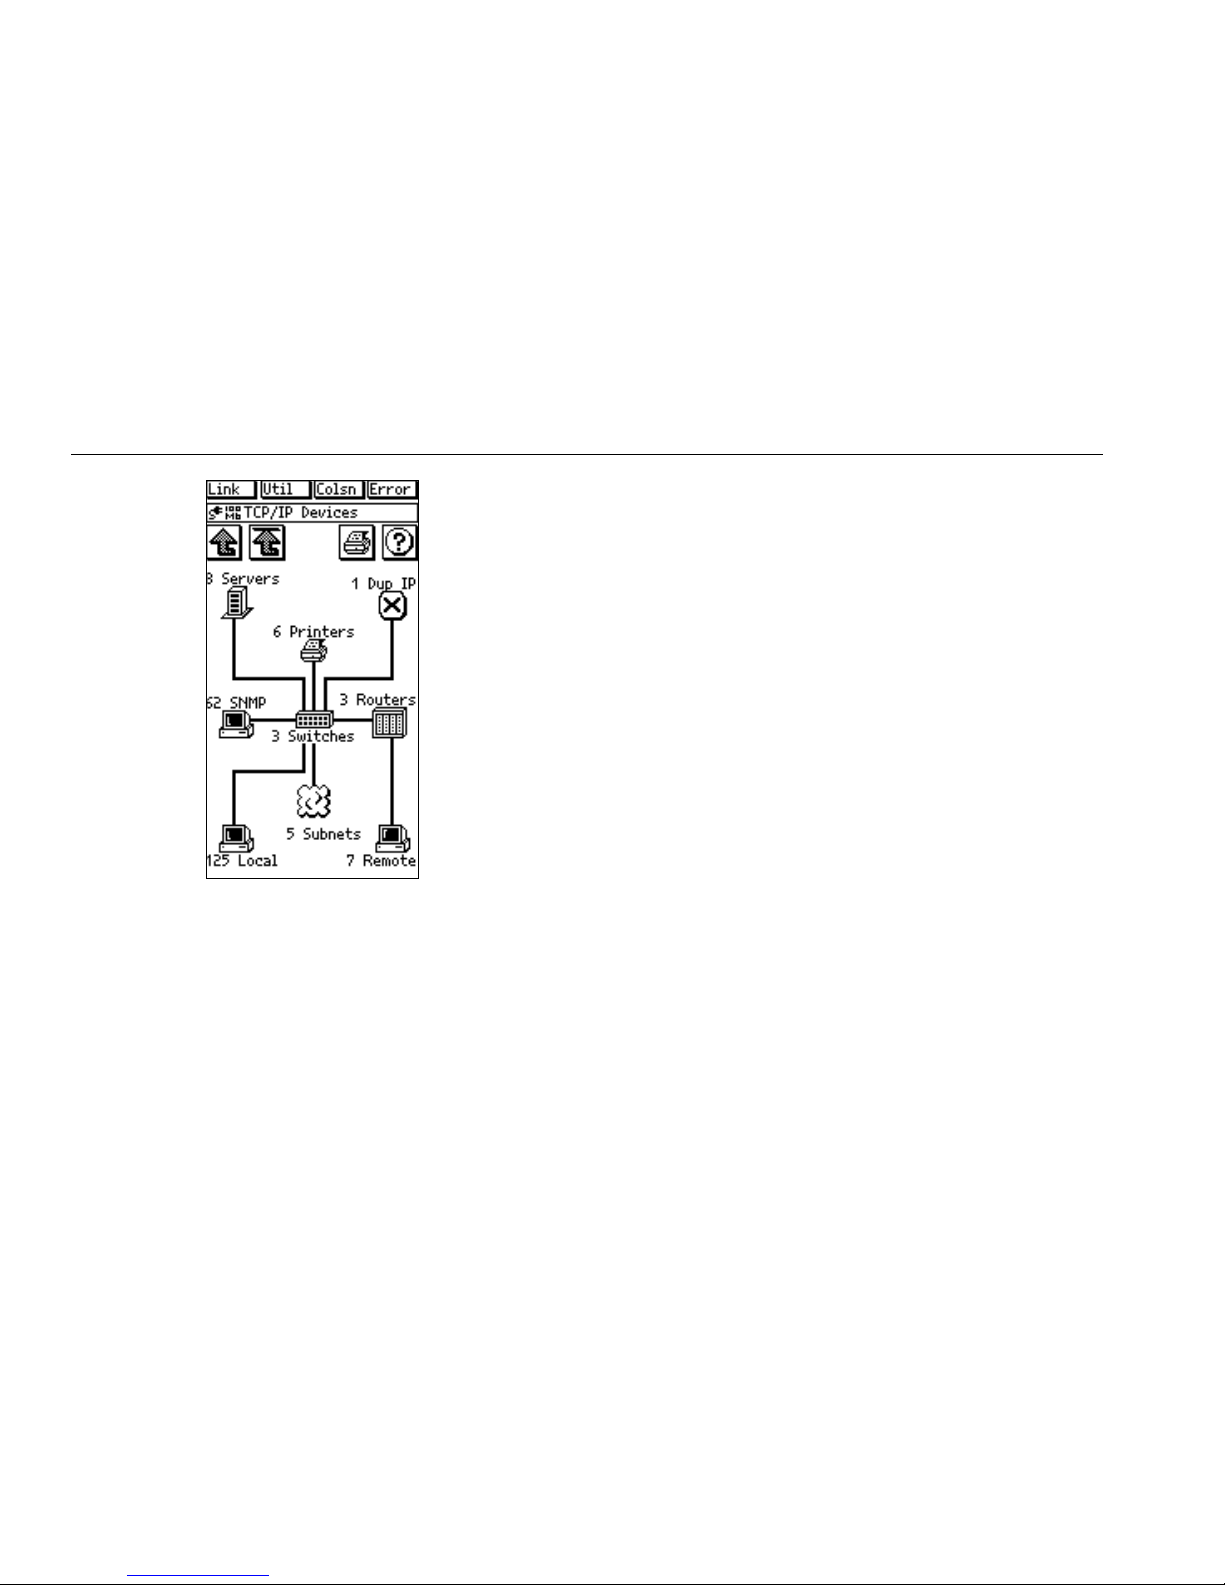
TCP/IP Devices Display
Pressing the TCP/IP icon from the Autotest display brings
up the TCP/IP Devices display (Figure 2-11). This display
may include such items as servers, printers, SNMP
devices, switches, routers, stations (local and remote), or
subnets that are running TCP/IP. The device icons are
described in Table 2-2.
Figure 2-10. NetWare File Server Information
ace211.bmp
NetWare Print Server List
From the NetWare File Server display (Figure 2-9), press
(View Print Servers) to see a list of the nearest 50
print servers based on hop count. Pressing a print server
name sends an SNMP query to the server and displays
the results (Figure 2-10). The SNMP query uses the
"public" community string in addition to the SNMP strings
2-11
OneTouch Series II
Users Manual
2-12
Figure 2-11. TCP/IP Devices Display
ace204s.bmp
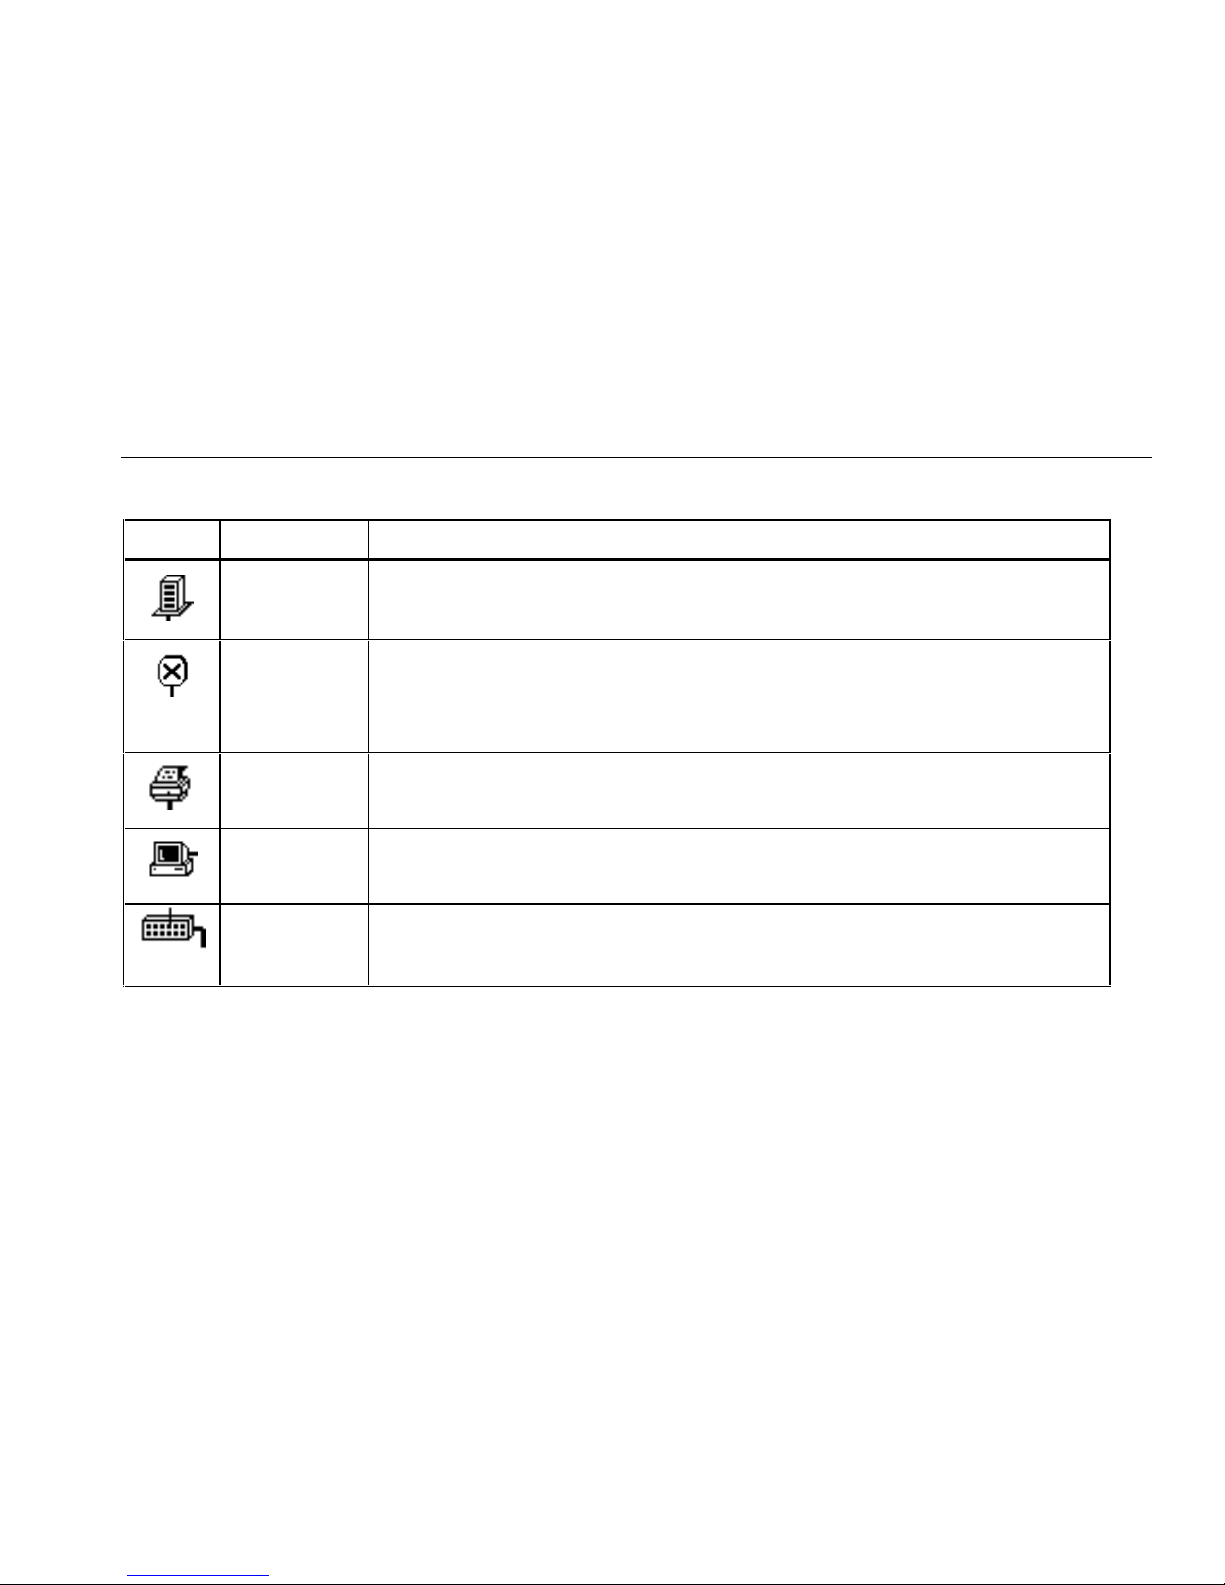
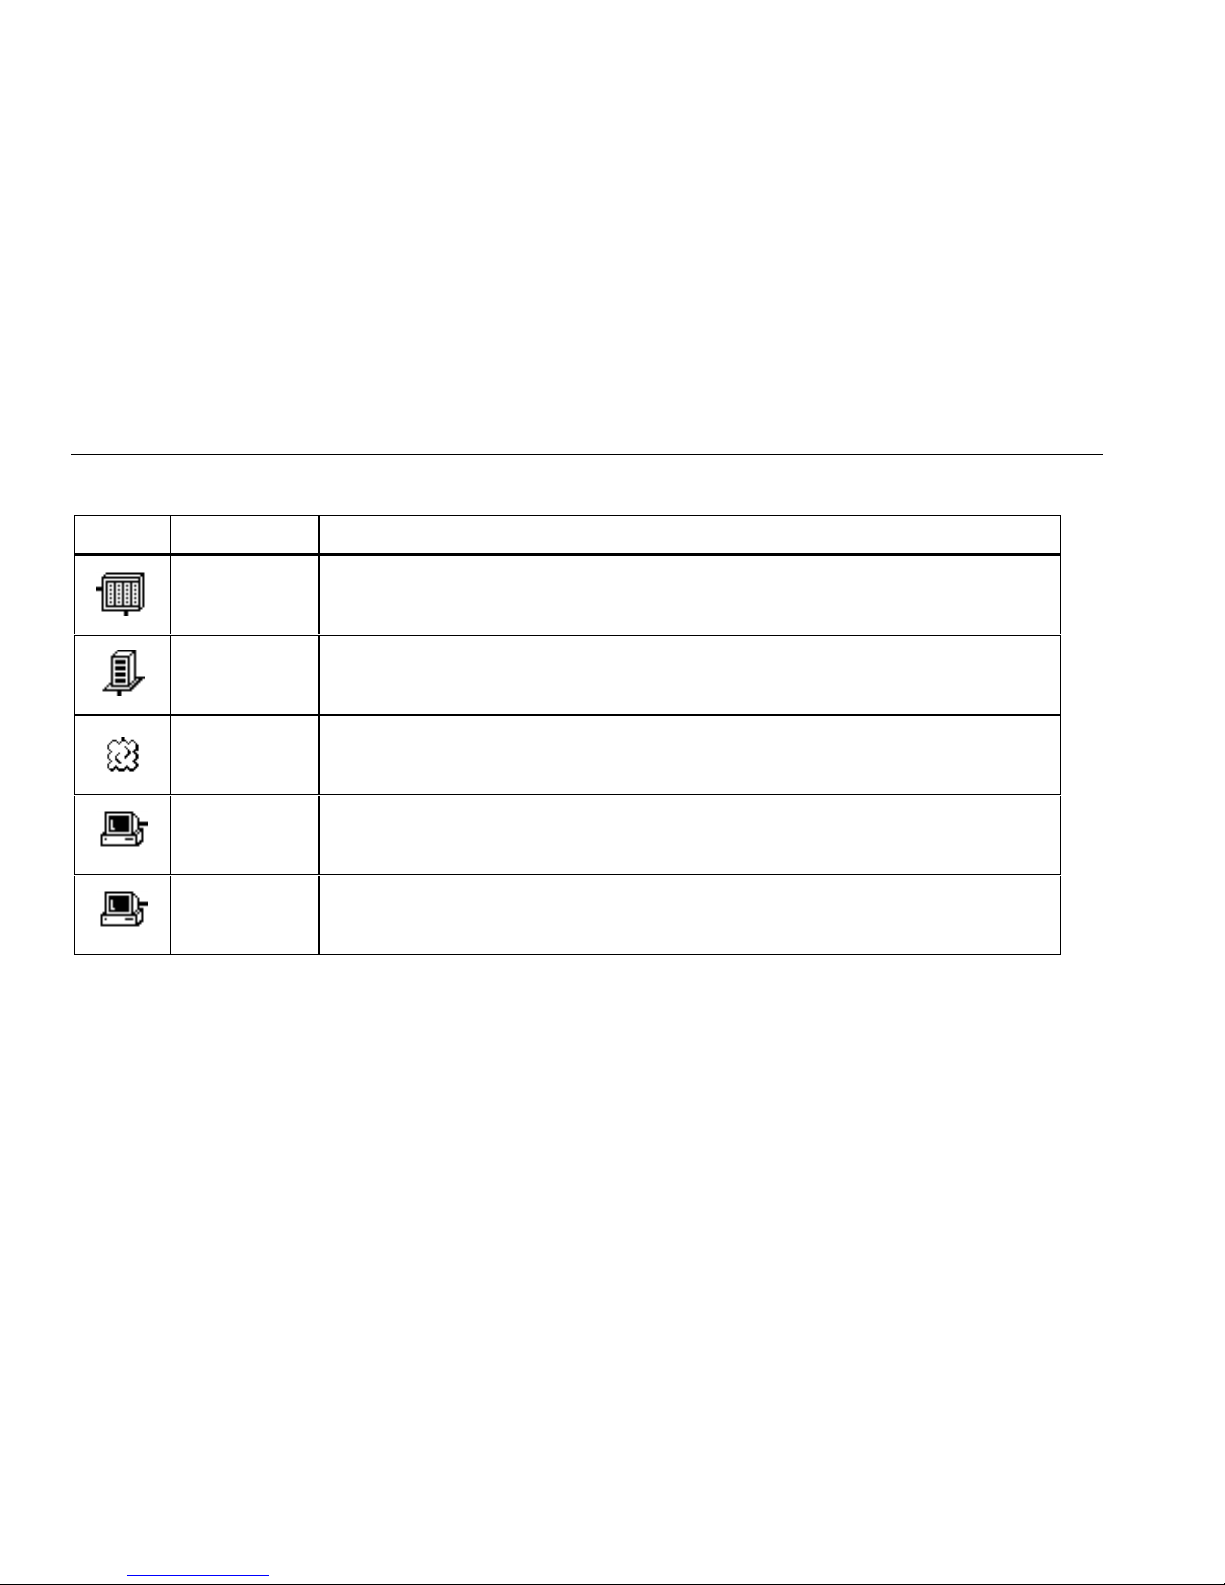
Table 2-2. TCP/IP Device Icons
Icon Meaning Operation
Servers TCP/IP Servers OneTouch has discovered. The Network Assistant will discover DNS,
WINS, POP2, POP3, SMTP, HTTP, DHCP, and BOOTP servers.
Duplicate IPs IP addresses that are in use by more than one device on the network. The Network
Assistant actively discovers devices using the same IP address and lists them in the
TCP/IP menu in Autotest. From that point, you can see all known information for each
device using duplicate IP addresses.
Printers Discovers printers running TCP/IP.
SNMP TCP/IP stations running SNMP.
Switches Automatically queries a switch and displays basic information (port summary and some
SNMP information).
Autotest and Central Setup
NetWare Print Server List
2
2-13
OneTouch Series II
Users Manual
Table 2-2. Device Icons (Cont.)
Icon Meaning Operation
Routers Local Routers and routing protocols on each router. The following routing protocols are
identified: RIP, RIP2, OSPF, IGRP, EIRGP, IRDP.
Servers TCP/IP Servers the Network Assista nt has discovered. It will discover DNS, WINS,
POP2, POP3, SMTP, HTTP, DHCP, and BOOTP servers.
Subnets Subnets discovered on the local segment. The valid range of IP addresses that are legal
for the subnet, the broadcast address, and the mask are listed for each subnet.
Remote Stations not physically located on the local segment but which have transmitted packets
onto the network.
Local Stations physically located on the local segment.
2-14

Sorting
Figure 2-12 shows a sample TCP/IP device list. Sorting
for devices running TCP/IP functions the same way as
Station Detail Display discussed in Table 2-1. Pressing
(Station List Sort) enables you to list devices based
on Name, Protocol, Device Type, Frame Count (Local
Stations), or MAC Address on the Sort Options screen
(Figure 2-13). You can also choose ascending or
descending sort order. Sorting does not apply for
Subnets and Routers.
Autotest and Central Setup
NetWare Print Server List
2
Figure 2-12. Local Station List
ace212s.bmp
2-15

OneTouch Series II
Users Manual
Figure 2-13. Sort Options
ace214s.bmp
Address Entry Keypad
The Address Entry Keypad (Figure 2-14) is a decimal
keypad for entering addresses. Press the Left-Arrow and
Right-Arrow keys to select digits to change (or touch the
entry box directly at the desired position), the period (.) to
move between IP address octets, the OK button to exit
the display, and X to exit without saving changes.
2-16
Figure 2-14. Address Entry Keypad
ace213.bmp

Central Setup
This section covers the elements of the Central Setup
screen (Figure 2-15) that are not covered in the
Started Manual:
(IP Config) and
(SNMP Config).
Getting
IP Config
From the Central Setup screen (Figure 2-15), press
(IP Config) to access the IP Address screen (Figure 2-
16).
Autotest and Central Setup
NetWare Print Server List
2
Figure 2-15. Central Setup
ace219s.bmp
2-17

OneTouch Series II
Users Manual
ace217s.bmp
Figure 2-16. IP Address Configuration
You can enter the Source IP manually or by using DHCP.
The Source IP Address is the address you assign to the
Network Assista nt. The Network Assistant responds to
pings received from a network station. To return a
response, the Network Assistant must have a valid IP
source address.
The address must be:
Correct for the particular subnet to which the Network
Assistant is attached (to determine what range of
addresses is valid for a particular subnet you must
know the subnet mask).
Unique (there must not be a duplicate address on the
network).
The Network A ssistant checks for duplicate IP addresses
before using a source address. Therefore, you can
choose just about any address. It is still best, however, to
check with your local IP address administrator to find out
the Source IP Address to use for the Network Assistant. If
the source IP address is not valid for the local subnet, you
probably will not get any ping responses.
Manually Entering Addresses
To display the Address Entry Keypad (Figure 2-17) for
manual entry, press a boxed IP address. Use the keypad
to input digits for the desired IP address.
2-18

Figure 2-17. Address Entry Keypad
To move the cursor, use the arrow keys or press the
desired octet within the IP address box.
ace218s.bmp
Autotest and Central Setup
NetWare Print Server List
2
Using DHCP to Get an IP Source Address
The DHCP feature lets you use Dynamic Host
Configuration Protocol to automatically get an IP source
address for your Network Assistant.
To activate DHCP, press
Setup screen; then select DCHP. When you press
(Get Address), the Network Assistant requests to lease
an IP address from a DHCP server (Figure 2-18). The
DHCP address request also occurs automatically if DHCP
is already selected when the Network Assistant detects a
link pulse.
If a DHCP server is found, the display shows th e
accepted source IP address, DHCP se rver information,
and lease time. Pressing
restarts the DHCP process.
(IP Config) from the Central
(Get DHCP Address) again
To quickly move between address octets, press the “.”
key, then press the octet you want to modify.
After entering the address, press OK.
2-19

OneTouch Series II
Users Manual
ace220s.bmp
Figure 2-18. DHCP Display
The Network Assistant determines if an assigned address
is already used by another device, and requests another
address if necessary. This cycle can occur up to five
times before the DHCP process fails.
OneTouch will renew its lease according the RFC2131,
which is the RFC that defines DHCP, or by using the
renew and rebind values received from the server.
The time at which OneTouch will renew its lease depends
on whether the DHCP server issued a renew time period.
If the DHCP server issued a renew time period,
OneTouch will attempt to renew its lease at the specified
time. Otherwise, OneTouch will attempt to renew the
lease at 50% of the lease period. If OneTouch is unable
to contact the DHCP server, it will try again to renew the
lease at 87.5% of the lease period or the time specified
by the server. This is called the rebind time.
If OneTouch is still unable to contact the DCHP server to
renew the lease, it continues to use the IP address it was
given, but it continues to try to renew the lease at the
renew and rebind times.
If at any time, the DHCP server explicitly notifies
OneTouch that its lease is no longer valid, OneTouch will
discontinue its use of the IP address it was given.
Pressing
(View Log) shows the details of the DHCP
process, including the DHCP offers, any addresses
declined because they were in use, and the address of
the server providing the accepted IP address.
If no DHCP server is found, the message No Server
Found displays. In this case, you can enter the IP source
address manually as described earlier.
Enter a known router address or press
(Find Router)
to automatically fill in the Router’s IP Address. Pressing
2-20

(Find Router) again cycles through a li s t of the
detected routers. This lets you see more routers than just
the first one detected. If the Network Assistant has
discovered more than one router, it assumes you want to
ping the busiest router, and so uses that router’s address.
Autotest and Central Setup
NetWare Print Server List
2
Press
address is duplicated on the local subnet. If a duplicate is
found, its MAC address is displayed. Select Apply
Changes on Exit and this process will occur when you
exit the screen.
(Apply Address) to see if the Source IP
SNMP
Press (SNMP Config) from the Central Setup to
access the Security Setup screen (Figure 2-19).
Figure 2-19. Security Setup
ace223s.bmp
2-21

OneTouch Series II
Users Manual
Press SNMP Communities on the Security Setup
screen to access the SNMP Community String List
(Figure 2-20). The Network Assistant uses the “public”
community string (password) as the first default and also
provides the capability to enter four additional community
strings different than “public” for any given device or set
of devices.
You can also password-protect strings so they are not
visible on the Network Assistant screen. Press
(Password Protection) to password-protect the
community strings, an entry box displays enabling you to
enter and enable the password. Thereafter, you will be
prompted to enter that password in order to see and
access the Community String screen.
2-22
Figure 2-20. SNMP
ace221s.bmp
Press one of the address boxes to display a special
keypad to enter community strings (Figure 2-21). Refer
to the Help on the Network Assistant for an explanation of
the keypad.

Autotest and Central Setup
NetWare Print Server List
2
Figure 2-21. Community String Editor
ace222s.bmp
2-23

OneTouch Series II
Users Manual
2-24

Introduction
Network Health displays utilization (Util), errors (Error),
collisions (Colsn), broadcasts (Bcast), protocols (IPX),
and stations (Stations), as shown in Figure 3-1. To enter
the Network Health menu, press
the top-level display. The Network Health menu displays
six meter icons that indicate the overall health of the
network.
Press a meter icon to get more information about the
network indicator shown on that meter.
(Network Health) on
Chapter 3
Network Health
Figure 3-1. Network Health
ace301s.bmp
3-1

OneTouch Series II
Users Manual
For example, pressing Util displays the Top Senders
display (Figure 3-2).
To get more detail about a particular station, press the
boxed address of that station. Details about that station
will be displayed as shown Figure 3-3. Press ( Tool
Menu) to access the following (as applicable):
q
IP Trace Route
q
Ping + SNMP
q
Ping
q
Ping Key Device
q
Add to Key Devices
q
Find Node
3-2
Figure 3-2. Top Senders Display
ace303s.bmp

Network Health
Introduction
Each meter icon (except where indicated) has a
logarithmic scale with 0 at the minimum, 10 at the midpoint, and 100 at the maximum.
Tic marks identify the average and maximum data points.
Average
Maximum
3
Figure 3-3. Station Detail
ace304s.bmp
The Network Health test display has six meter icons, each
of which indicates the current, average, and maximum
values. A representative meter icon is shown in Figure 3-
4.
Current
Figure 3-4. Network Health Test Meter Icon
Table 3-1 summarizes tests performed from the Network
Health test display.
3-3

OneTouch Series II
Users Manual
Icon Description
Table 3-1. Network Health Meters
Press to display network utilization.
Percent Display – Displays the utilization percentage for the last one-second sample period.
Count Display – Displays the frame count, for the last one-second sample period.
The meter’s scale switches to high range when the frame rate exceeds 10,000/second.
Press to display the types of errors received.
Percent Display – Displays the number of errors as a percentage of the number of frames
received for the last one-second sample period.
Errors counted are: bad FCS, short frames, late collisions, and jabbers.
Count Display – Displays the error count for the last one-second sample period.
The meter has a logarithmic scale.
3-4

Table 3-1. Network Health Test Icons (Cont.)
Icon Operation
Press to display collision details (% collisions and collisions/second).
Percent Display – Displays the number of collisions as a percentage of the number of frames
received for the last one-second sample period.
The Network Assistant identifies preamble collisions.
Count Display – Displays the collision count for the last one-second sample period.
The meter’s scale switches to high range when the collision rate exceeds 1,000/ second.
Press to display stations sourcing the most broadcasts.
Percent Display – Displays the number of MAC broadcasts presented as a percentage of the
number of frames received for the last one-second sample period.
Count Display – Displays the MAC broadcast count for the last one-second sample period.
Displays the percent of frames on the network that are the top protocol since the beginning of the
test .
Press to display top protocols detected on the attached segment.
Network Health
Introduction
3
3-5

OneTouch Series II
Users Manual
Icon Operation
Table 3-1. Network Health Test Icons (Cont.)
Displays the number of unique source addresses monitored since the beginning of this test.
Some of the source addresses may be off-segment, which are sourced from stations on the
other side of a router.
The meter has a logarithmic scale with 0 at the minimum, 25 at the mid-point and 250 at the
maximum.
Press to display the Station List. This information is the same for the Percent Display and
Count Display.
Rerun - Press to clear all of the Network Health test information and reset the elapsed time.
The Erase Health function does not change the display mode.
Press these tabs to view network statistics in terms of percent, frames per second, or a tabular
view. You can also display the Autotest Map by pressing (Map).
3-6

Network Health
Introduction
3
Interpreting Error Results
Collisions
A collision is the result of two or more nodes transmitting
at the same time on the segment. Collisions are not
necessarily bad. They are a normal part of Ethernet’s
operation. In general you need not worry about collisions
unless the AVERAGE collision rate is greater than 20%.
Excessive collisions are more often associated with too
much network traffic and less often a physical problem
with the network. Usually the best way to fix a “collision
problem” is to understand why there is excessive traffic.
You may find that the Network Assistant collision count
does not agree with that of some protocol analyzers that
under report collisions. Just like a Hub, the Network
Assistant identifies collisions that occur in the frame’s
preamble. These are the most common types of collisions
in a 10BASE-T network.
Late Collisions
A late collision is one that occurs after the first 64 bytes in
a frame. Consider late collisions a serious network error
to be resolved quickly. Late collisions may manifest
themselves as frames with a bad Frame Check Sequence
(FCS). Late collisions are caused by either a faulty NIC
or a network that is too long (i.e., end-to-end signal
propagation time is greater than the minimum legal frame
size of ~57.6 microseconds for 10BASE-T).
Short Frames
A short frame is a frame that is less than the minimum
legal size (less than 64 bytes) with a good frame check
sequence. In general, you should not see short frames.
The most likely cause of a short frame is a faulty card or
an improperly configured or corrupt NIC driver file.
Jabbers
A jabber is a frame greater than the maximum legal size
(greater than 1518 bytes) with a good or bad frame
sequence.
Consider jabbers a serious network error to be resolved
quickly. The most likely causes of Jabbers are a faulty
NIC or driver or perhaps a cabling problem.
Bad Frame Check Sequence (FCS)
A legal sized frame with a bad frame check sequence
(FCS) has been corrupted in some way. Bad FCSs can
be caused by late collisions, a faulty NIC/driver, cabling,
hub or induced noise.
3-7

OneTouch Series II
Users Manual
If the percentage of frames with a bad FCS is greater
than 1%, then it should be considered a serious problem
that is affecting network throughput.
A given rate of bad FCS frames has a much more serious
effect on network throughput than a similar collision rate.
This is because the retransmission time is so much
longer. When a collision occurs, the frame is
retransmitted within a few milliseconds because the
sending station knows that there was a problem acquiring
the media for transmission. Conversely, when a frame is
corrupted (resulting in a bad FCS) the receiving station
ignores the frame. The sending station does not know the
frame was corrupted and therefore it is up to the upper
protocol layer timeouts to cause a retransmission to
occur. This process can take several seconds to
retransmit a single frame.
Tracking Addresses
The Network A ssistant tracks addresses by their layer-3
address when possible. It displays layer-3 addresses for
IPX, IP, NetBIOS, AppleTalk, and DECnet.
A station can appear in the station list more than once if it
is configured to run more than one protocol or has more
than one layer-3 address. (Figure 3-5.)
3-8
Figure 3-5. Station Addresses
ace306s.bmp
Local vs. Remote Stations
The Network Assistant initially classifies the location of all
stations as
that the station is either remote or local.
A local station is one that is connected to the same
Ethernet segment as the Network Assistant. In a switched
Unknown
until it observes traffic that proves

environment, a local station is one that is in the same
broadcast domain as the Network Assistant.
A remote station is one that is not on the same Ethernet
segment or broadcast domain as the Network Assistant.
Network Health
Introduction
3
3-9

OneTouch Series II
Users Manual
3-10
Introduction
The Network Assistant quickly identifies the most
common cable and wiring faults on twisted pair cabling
systems and automatically tests all four pairs. It also
detects fiber optic cable and enables you to begin fiber
tests if a fiber optic module is detected.
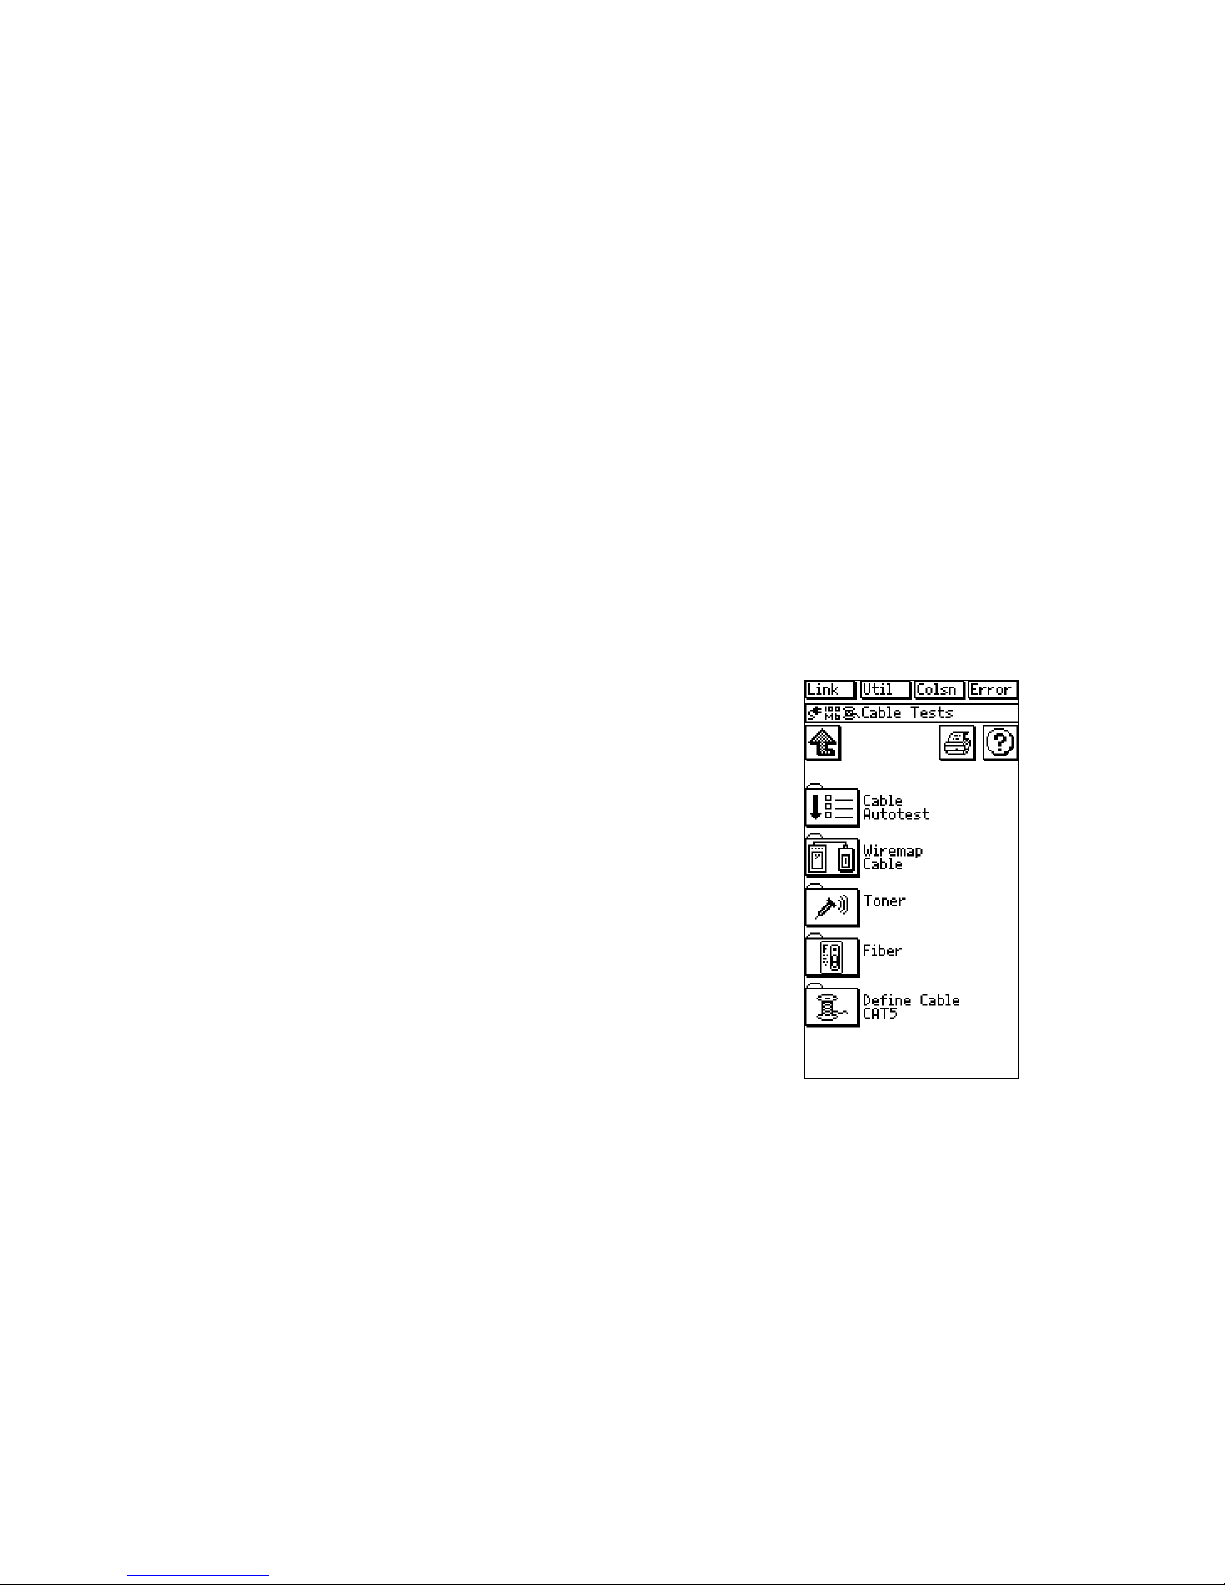
You can perform the following tests and operations from
the Cable Tests display (Figure 4-1).
Run Cable Autotest
Verify pin-to-pin continuity (wiremap)
Transmit toner
Fiber tests
Set units (feet or meters) and define category of
cable under test
Read the “Basic Cable Concepts” section for more
information.
Chapter 4
Cable Tests
ace401s.bmp
Figure 4-1. Cable Tests
4-1

OneTouch Series II
Users Manual
Cable Autotest
Press (Cable Autotest) to measure cable length,
detect split pairs, and/or perform a wiremap test. The
Network Assistant does not measure cable length when it
detects a link pulse (i.e., when connected to an active
device such as a Hub).
The Network Assistant also starts the fiber tests
automatically if a DSP-FOM is connected and turned on
when you press (Autotest). Read “Test Fiber Optic
Cable” later in this chapter.
Split Pairs
The Network Assistant aut omatically checks for split pairs
whenever Autotest or Cable Autotest is run. It will not
check for split pairs if the end of the cable is attached to a
Hub, a cable identifier, or the internal Wiremap
connection. Disconnect it to obtain a complete test.
Note
The cable under test must be longer than 20 feet.
The Network Assistant can identify split pairs that occur
either at the connector or at an intermediate point, such as
a punchdown block.
Cable Length Results
When displaying cable length, the Network Assistant
always reports the length to the first fault (e.g., opens,
shorts, or split pairs). It shows the distance to the fault
and to the end of the cable on the same pair as illustrated
in the following example test results table.
Pair
1,2 135 ft Open
3,6 91 ft Split Pair
4,5 135 ft Open
7,8 91 ft Split Pair
In the case of pairs 3,6 and 7,8 there is a split pair at 91
feet and it is most likely that both pairs continue for the
entire cable length of 135 feet.
A split pair at the connector is represented as Split/Open?
with a length of less than 5 feet (1.5 m). A Split/Open?
indication could also be an open at the indicated distance.
Length Status
Wiremap Cable
The Wiremap Cable test verifies pin-to-pin continuity from
the near to the far end of the cable, making it easy to
identify miswires (the most common installation problem)
and other wiring errors.
4-2

The Wiremap Cable test can be run as a standalone test
or automatically when you run Cable Autotest or AutoTest.
The standalone test and Cable Autotest are run under
Cable Tests.
To run a standalone test Wiremap Cable test, attach the
cable to the Network Assistant and a remote unit to the far
end of the cable under test, then press
Cable). Figure 4-2 shows an example of the Wiremap
Cable test r esults.
(Wiremap
Cable Tests
Introduction
4
Figure 4-2. Wiremap Results
If the Wiremap Cable test is conducted as part of the
Cable Autotest or AutoTest, and if the Wiremap Cable test
cannot run completely due to poor cable termination or
quality, the Network Assistant displays a message
recommending that you run the standalone version of the
test to obtain additional error information.
ace402s.bmp
4-3

OneTouch Series II
Users Manual
If you explicitly run the Wiremap Cable test while the far
end of the cable is attached to a Hub, you may see
unexpected results like wires shorted together. This is a
normal side effect of forcing a wiremap to be done on a
remote device other than a Cable Identifier.
Identifying Cables
Use the Cable Identifiers in mapping a cable. (Cable
Identifier #1 is standard equipment and comes with the
Network Assistant; Cable Identifiers #2 through #6 are
optional. See "Optional Equipment" in Chapter 1.)
In mapping cables to individual offices from the wiring
closet, the Network Assistant identifies unique Cable
Identifiers and displays the wiremap and adapter number.
To map a cable, connect a Cable Identifier to the far end
of the cable that you wish to identify (in the wiring closet,
for example) and connect the near-end of the cable to the
Network Assistant’s RJ-45 network connector.
You can also connect the optional RJ-45-to-Punchdown
block adapter to the RJ-45 network connector (with an RJto-RJ cable) and quickly map cables to individual offices
by running either the
AutoTest).
(Wiremap Cable) or (Cable
Toner
Press (Toner) to transmit a low (185 Hz to 200 Hz) or
high (350 Hz to 375 Hz) tone on the cable for use with a
user supplied receiver, such as the Fluke 140 Tone Probe.
Using the tone is a way to trace a cable on the network.
Define Cable
Press (Define Cable) to select units (meters or feet)
and the cable category for the cable you are ready to test.
This Define Cable operation is the same as the one that
can be accessed through the Setup screen.
Basic Cable Concepts
The remainder of this chapter provides some general
information about cabling.
4-4

Twisted Pair Cables
Twisted pair cable is currently the most popular cable in
LAN systems. The 10BASE-T standard for twisted pair
cabling systems is much more popular than coaxial based
Ethernet networks because it is easier to work with and is
inherently more reliable. The 10BASE-T standard is valid
for Unshielded Twisted Pair (UTP) and Shielded Twisted
Pair (ScTP).
UTP cable typically consists of four pairs of 24 AWG
(American Wire Gauge) solid or stranded wire surrounded
by an insulating jacket. ScTP cable adds a foil shield
around the four pairs to improve its noise immunity. The
wires in each pair are twisted around each other, and the
four pairs, in turn, are twisted together inside the cable
sheath. Most UTP and ScTP cables have characteristic
impedance of 100Ω. However, in some countries UTP is
also available in 120Ω. The Cable Tests described in this
chapter are designed to work with 100Ω cabling systems.
Cable Tests
Introduction
4
4-5

OneTouch Series II
Users Manual
Reversed Pair
A cable pair is reversed when two individual wires of a pair
are reversed from end-to-end, as shown in Figure 4-3.
A reversed pair is not necessarily a catastrophic failure.
Some 10BASE-T adapter cards and Hubs can sense the
reversed polarity and continue to operate. It is always a
good idea, however, to fix this problem when found.
1
2
2
1
ace404f.eps
Figure 4-3. Reversed Pair
Crossed Pair
A pair is crossed when a wire pair is mapped to a different
set of connector pins on the other end of the cable. Figure
4-4 shows an example of a crossed pair.
Sometimes pairs are crossed intentionally. A cable with a
1-2 to 3-6 cross is commonly known as a crossover cable,
which is used for cascading Hubs together that do not
have uplink ports.
Special crossed-pair patch cords are useful when working
with non-standard cabling systems.
1
2
3
6
3
6
1
2
ace405f.eps
Figure 4-4. Crossed Pair
Split Pair
A split pair is different from a crossed pair in that the pinto-pin wiring is correct but the wire pairing is incorrect.
That is, a “connector” pair is made up of two wires from a
“cable” pair. Figure 4-5 shows an example of a split pair.
A split pair is much more susceptible to noise because the
two wires in the “pair” are not twisted around each other.
Split pairs can be especially difficult to find because the
symptoms depend upon the particular wires involved, the
cable length, and ambient noise.
4-6

Cable Tests
Introduction
4
The symptoms of a split pair range from non-existent to a
complete lack of communication. In so me cases a spli t
pair cable may work just fine for 10BASE-T but not at all
for 100BASE-TX.
3
6
4
5
Figure 4-5. Split Pair
A split pair cannot be identified with a conventional
wiremap test because it is the wire pairing that is incorrect
rather than the physical connection. Another technique
must be used.
The most common method of identifying a split pair is by
measuring the Near End Crosstalk (NEXT). This is a very
reliable method but, unfortunately, it requires the use of a
remote unit at the far end. The Network Assistant uses
another equally reliable method that does not require a
remote unit at the far end (except in the case of short
cable lengths). The Network Assistant identifies split pairs
by measuring the characteristic impedance of each wire
3
6
4
5
ace406f.eps
pair. A split pair’s characteristic impedance is much
greater than the impedance of correctly paired wires.
Cable Length
The 10BASE-T and 100BASE-TX cabling specifications
limit the maximum device-to-device cable length to 100
meters. There are many ways to measure a cable length;
the Network Assistant uses a very accurate method called
Time Domain Reflectometry (TDR).
The TDR method works much like a radar system that
emits a pulse of electrical energy and then interprets the
reflected electrical energy. To measure the length of a
cable using the TDR method, a pulse of electrical energy
is sent down a wire pair, the reflected electrical energy is
interpreted to get the time delay between the transmitted
and reflected pulse, and the length of the cable is
computed using the cable’s Nominal Velocity of
Propagation (NVP).
The NVP is a value for how fast a pulse travels down a
given cable. Cable manufacturers specify how fast
electricity travels down a cable as a percentage of the
speed of light (186,000 miles/second or 300,000,000
meters/second). A cable with an NVP of 72, for example,
means that electricity travels at 72% of the speed of light
along the cable.
4-7

OneTouch Series II
Users Manual
The Network Assistant is preprogrammed with typical NVP
values for CAT 3, 4, and 5 UTP cable. In addition, there
are two user-definable Cable Types for you to enter your
own NVP values.
Cable Termination
In addition to determining cable length, the TDR technique
provides information on the kind of termination at the far
end of the cable and the cable’s characteristic impedance.
The Network Assistant examines the polarity of the
reflected pulse to determine if the cable end is an open or
short, as shown in Figure 4-6. If the wire pair is perfectly
terminated there is no reflection.
4-8

Cable Tests
Introduction
4
Cable
Transmitted Pulse
Transmitted Pulse
Transmitted Pulse
Non Reflected Pulse
Figure 4-6. Cable Termination
End Of Fault
Open
Reflected Pulse
Short
Reflected Pulse
Remote
Adapter
ace407f.eps
4-9

OneTouch Series II
Users Manual
Test Fiber Optic Cable
This section describes how to use the Network Assistant
with a Fluke Fiber Optic Meter (FOM) to test fiber optic
cable. You can measure optical loss and output power on
multimode or singlemode cable.
The fiber tests require the following:
A Fluke DSP-FOM (Fiber Optic Meter; See "Placing
Orders and Getting Assistance" in Chapter 1 for
ordering information.)
A multimode fiber optic source, such as is included
with the Fluke DSP-FTK (Fiber Test Kit)
Two fiber optic patch cables (provided with the DSP-
FOM and DSP-FTK)
Network Assistant software version 2.XX, or later
(Read "Updating Software" in the
Manual
Never look directly into the fiber optic source
connector or attempt to adjust or modify the
source. Doing so might expose you to
hazardous LED radiation.
for information on software updates.)
W Warning
Getting Started
See the instruction sheet provided with the DSPFOM/FTK for specifications and maintenance information
for the fiber optic meter and source.
Ensuring Accurate Measurements
To help ensure accurate fiber measurements, do the
following:
Clean all fiber connectors before testing.
Before using the optical source, turn it on and let it
stabilize for 2 minutes.
Setting a Reference
Before measuring a cable’s optical loss, set a reference
level by measuring the loss in the fiber patch cables and
connectors, as follows:
1. Make the connections shown in Figure 4-8. Use the
same type of cable as the cable to be tested.
2. From the Network Assistant’s top level display, press
(AutoTest). The Network Assistant detects the
active fiber optic meter and the meter’s wavelength
setting and displays the fiber test results (Figure 4-7).
Press (Set Ref) from the Network Assistant’s fiber
test display.
4-10

Cable Tests
Test Fiber Optic Cable
4
Measuring Optical Loss
After setting the reference, do not disturb the source
connection as you make connections to measure optical
loss (Figure 4-9). If the fiber test is not already running,
press
the test.
(AutoTest) from the top level display to start
Measuring Output Power
Make the connections shown in Figure 4-10. If the fiber
test is not already running, press (Autotest) from the
top-level display to start the test.
Output power, optical power loss, and the current
reference level are shown in microwatts (µW) and
decibels (dBm or dB) (Figure 4-7). The power and loss
measurements are updated continuously. Table 4-1
defines the terms used during the Fiber Test.
Table 4-1. Fiber Test Terminology
Term Definition
Reference Power measured on a known reference
cable.
Power Measured power in milliwatts and dBm.
dBm is the ratio of the measured power to
one miliWatt. The formula the Network
Assistant uses for calculating dBm is:
Power (dBm) = 10 × log × Power (mW)
Loss The amount of power loss on the
measured cable.
Loss = Reference - Measured Power
Loss Limit Acceptable power loss. If the Loss is
greater than this value, the test reports
FAIL. Otherwise, it reports PASS.
4-11

OneTouch Series II
Users Manual
4-12
Figure 4-7. Fiber Test Results
ace403s.bmp

Cable Tests
Test Fiber Optic Cable
4
FOS 850/1300
FIBER
OPTIC
SOURCE
1300
850
Do not
disturb source
connection.
FOM
FIBER
OPTIC
METER
1550
1300
850
OFF
1300
850
OFF
1300
850
ace408f.eps
Figure 4-8. Connections for Setting a Reference Level
4-13

OneTouch Series II
Users Manual
FOM
FIBER
OPTIC
METER
1300
850
1550
1300
850
OFF
Figure 4-9. Connections for Measuring Optical Loss
1300
850
FOS 850/1300
FIBER
OPTIC
SOURCE
1300
850
OFF
Do not
disturb source
connection.
ace409f.eps
4-14

Cable Tests
Test Fiber Optic Cable
4
FOM
FIBER
OPTIC
METER
1550
1300
1550
1300
850
OFF
850
Figure 4-10. Connections for Measuring Output Power
TX
ace410f.eps
4-15

OneTouch Series II
Users Manual
4-16

Introduction
The (NIC/Hub Tests) display provides access to the
following tests:
NIC Autotest
Hub Autotest
NIC Detector
Flash Hub Port
If the Network Assistant has a valid network connection, it
continues to monitor the network until one of these tests
is executed.
From the Network Assistant top level display, press
(NIC/Hub Tests) to access the NIC/Hub Tests display
(Figure 5-1).
Chapter 5
NIC/Hub Tests
Figure 5-1. NIC/Hub Test
ace501s.bmp
5-1

OneTouch Series II
Users Manual
NIC Autotest
In order for the NIC Autotest to complete, the NIC needs
to be set up (power on, drivers running, etc.).
Press
an Ethernet (10 or 100 Mbps) adapter card.
The NIC Autotest determines as much as possible about
the physical connection to the network adapter card by:
Verifying the cabling from the desktop to the NIC.
Checking for a 100 Mbps or 10 Mbps link pulse and
q
The NIC Autotest displays the network address used by
the device. It will also display packet errors if any are
detected. For example, it will tell you if a packet with a bad
CRC is transmitted by the NIC.
The NIC Autotest display is shown in Figure 5-2.
The following fields on the NIC Autotest screen indicate
the results of the NIC test:
RX Level (Normal/Marginal)
(NIC Autotest) to verify the correct operation of
configuring the Network Assistant accordingly.
Confirming network connectivity by pinging the NIC.
Marginal
: The NIC signal level is not within specification.
The problem is either excessive attenuation in the cable or
a defective NIC card.
Figure 5-2. NIC Autotest
ace502s.bmp
Normal
: The NIC signal level is within specification.
5-2

Hub Autotest
Press (Hub Autotest) to verify the connectivity
between the desktop and the Hub.
Hub Autotest checks the link pulse signal level and
queries the NetWare and NetBIOS servers to determine
the Hub’s ability to send and receive frames. If
successful, the Networ k Assistant displays the map that is
identical to AutoTest (Figure 5-3).
NIC/Hub Tests
Introduction
5
Figure 5-3. Hub Autotest Display
ace505s.bmp
Viewing Hub Capabilities
When the Network Assistant is connected to a hub and
has an active link state, press the Link label at the top of
the display to see the polarity of the received data. If your
Network Assistant has hardware revision 2.2 or later, you
5-3

OneTouch Series II
Users Manual
can also see the hub’s transmission speed and its ability
to perform half or full-duplex communication or autonegotiation. To determine your hardware revision, press
from the top-level display.
If the polarity of the data on the cable’s receive pair is
reversed, the cable on the Autotest display flashes.
NIC Detector
This test assists you in reclaiming unused hub ports. By
looking at the LED status indicators on the hub you cannot
determine whether a device is connected to the port or
merely turned off. NIC Detector works by determining
where there is any termination on the other end of the
cable. If the Network Assistant detects an open cable, it
will report that and the length of the cable.
Note
The device at the far end does not have to be
powered up.
Locate a Hub port that you suspect is unused but that has
a cable attached. Remove the cable from the Hub and
connect the Network Assistant to it. Then run the NIC
Detector test.
Press (NIC Detector) to determine if the device is
attached at the far end of the cable. The NIC Detector
display is shown in Figure 5-4.
5-4
Figure 5-4. NIC Detector
ace504s.bmp
Flash Hub Port
Press (Flash Hub Port) to locate where a particular
link connects to a hub. Connect the Network Assistant to
the link you want to locate. Press
then select a flash rate (Figure 5-5). The Network
Assistant sends either 1-second or 4-second link pulses
(Flash Hub Port),

that flash the LED on the hub, indicating the port that the
Assistant is connected to.
Note that some hub port link lights have a very slow
response time. The Flash Hub Port feature may not work
with these devices.
Note
The Network Assistant will not automatically
power off during Flash Hub Port.
NIC/Hub Tests
Introduction
5
Figure 5-5. Flash Hub Port Display
ace503.bmp
5-5

OneTouch Series II
Users Manual
5-6

Introduction
Connectivity Tests verify the IP or IPX connectivity
between a specific resource or station and the Network
Assistant. From the Network Assistant top-level display,
press
screen displays (Figure 6-1).
OneTouch Series II Pro features are provided on a trial
basis. Read the online help in the OneTouch Link
program for more information on enabling options. The
following features are discussed in this chapter:
IP Trace Route
IP & NetWare Ping
Key Device Ping (Pro)
ConfigMaster (Pro)
Station Locator (Pro)
Internetwork Throughput Option (Chapter 7)
(Connectivity Tests). The Connectivity Tests
Chapter 6
Connectivity Tests
ace060s.bmp
Figure 6-1. Connectivity Tests Display
6-1

OneTouch Series II
Users Manual
IP Trace Route
From the Connectivity Tests display, press (IP Trace
Route) to access the Trace Route screen (Figure 6-2).
Enter a target address by pressing the Target IP Address
box and using the Keypad (see “Manually Entering
Addresses” in Chapter 2). Press
Route and view the results.
to perform the Trace
IP & NetWare Ping
From the Connectivity Tests display, press (IP &
NetWare Ping) to access the IP Ping Tests or NetWare
Ping display (Figure 6-3). If you haven’t done so already,
press
addresses. You can enter addresses manually or use
DHCP (read “Central Setup” in Chapter 2).
(IP Config) to configure the Network Assistant
Figure 6-2. IP Trace Route
6-2
ace619s.bmp
Figure 6-3. IP & NetWare Ping Display
ace620s.bmp

Connectivity Tests
Introduction
6
Press IP Ping or NetWare Ping as appropriate.
Entering IPX Addresses
From the Connectivity Tests display, press (IP &
NetWare Ping), then press the (NetWare Ping) tab to
access the NetWare Ping Configuration display (Figure 6-
4).
ace605s.bmp
Figure 6-4. NetWare Ping
The NetWare ping test requires only the IPX node
address of the station you want to ping. If you want the
Network Assistant to find the station’s network address,
enter 00000000 as the network address. Press an
address box to access the keypad for entering IPX
addresses.
ace604s.bmp
Figure 6-5. IP Ping
6-3

OneTouch Series II
Users Manual
Conducting a Ping Station Test
After you have configured the appropriate IP address, you
can set the frame length from the by pressing
(Figure 6-5).
This sets the frame length of the ping packet between 64
and 1518 bytes. This is the total frame length.
or
Press
Ping display (Figure 6-7) to start the test.
Figure 6-7 shows a sample IP Ping test results screen.
Figure 6-8 shows an example of NetWare ping test
results.
(Begin Pinging) from the IP Ping or NetWare
6-4

Connectivity Tests
Introduction
6
Figure 6-6. IP and NetWare Ping
Ace620s.bmp
Figure 6-7. IP Ping Results
ace606s.bmp
Figure 6-8. NetWare Ping Results
ace607s.bmp
6-5

OneTouch Series II
Users Manual
If you have trouble making the IP Ping test work, verify
that:
The Source IP Address is correct for this subnet.
The Target station is active.
The Router IP Address is correct.
If you have trouble making the NetWare Ping test work,
verify that:
The station you are pinging has the Diagnostic
Responder loaded.
The node address you entered is correct.
The network address you entered (if used) is correct.
Key Device Ping
As part of your turn-on or repair procedures, you will need
to verify connectivity to key network resources. Key
Device Ping is a OneTouch Series II Pro option that
enables you to rapidly verify the availability of important
network devices. You can organize testing by business
function (e.g., accounting, manufacturing, etc.),
geographic locations (building 1, 2, etc.), device types
(routers, servers, etc.), or other ways that fit your needs.
From the Connectivity Tests display, press
Device Ping) to access the Key Devices display (Figure
6-9). After being added to the list, each device may be
(Key
activated or deactivated quickly using the selection box
on the right side of the list.
ace615s.bmp
Figure 6-9. Ping Key Devices
Press
(Add IP) to add an IP Address or
(Add
IPX) to add an IPX address. The IP or NetWare
Configuration (Figure 6-10) screen displays.
6-6

Connectivity Tests
Introduction
6
Figure 6-10. IP Configuration
ace617s.bmp
When you press a address box the Edit Key Devices
screen displays (Figure 6-11) and enables you to edit
address information.
Figure 6-11. Edit Key Devices
ace616s.bmp
For IP, enter the IP address of the device. For IPX, you
must enter the Node and Network addresses. After you
enter the address, the Device Name box displays the
name assigned to the device (if available from the Station
List).
To edit an existing name or address of a device, press
the box that contains the item you wish to edit and make
6-7

OneTouch Series II
Users Manual
the changes using the alphanumeric keypad (read
“Central Setup” in Chapter 2). The device name you
assign is for the purposes of the Key Device Ping
function. You can also modify the name of a list by
pressing the List Name box.
Note
Renaming a device while using Key Device Ping
does not modify the original name assigned to
the device on the network (i.e., when the device
is listed again under Station List, the original
name will remain).
To begin pinging the addresses in Key Devices List,
press (Begin Pinging). A series of bo xes displays
showing the status of the ping for each Key List. Press a
Key List box to see another series of boxes displaying
ping status of each device in the list. Press
(Stop
Pinging) to stop this function.
Interpreting Ping Test Results
In general, Packets recv (packets received) should be at
about 100%.
Be aware that some devices, including routers, prioritize
ICMP ping packets lower than other traffic, so some
packet loss can be expected.
When evaluating the ping results it is important to
consider the path taken by the packets. Sometimes the
problem may be with an intermediate link.
ConfigMaster
ConfigMaster is a OneTouch Series II Pro feature that
provides network information you can use to properly
configure a device. It lists NetBIOS, TCP/IP, and
NetWare parameters (DNS, WINS, IP address range,
subnet mask, default gateway, POP3 server, frame type,
etc.). These parameters correspond to the Network
Properties in Microsoft Windows and to certain e-mail
settings. One or more of the following will be listed:
q
IP subnet(s)
q
IP address range for
each subnet
q
Subnet mask
q
Default gateway
q
DNS server
q
WINS server
From the Connectivity Tests display, press
(ConfigMaster) to access the ConfigMaster tabular
display (F igure 6-12). Each Active Key List box can
contain five device addresses. Press one of the tabs
(NetBIOS, TCP/IP, or NetWare) to display the
appropriate parameters as described below.
q
POP3 server
q
SMTP server
q
HTTP server
q
NetBIOS domain
q
Frame type
q
IPX network number
6-8

NetBIOS – The top two domains or workgroups, based
on the number of stations, are listed along with the
transport protocol used by the stations in that domain.
NetWare – The nearest file server is listed. This is a
server that responded to the “Get Nearest Server”
request. The network number and frame type are also
listed.
TCP/IP – Up to two devices in each category are listed.
For subnets, the two most predominant are listed.
Connectivity Tests
Introduction
6
Figure 6-12. ConfigMaster
ace608s.bmp
6-9

OneTouch Series II
Users Manual
Station Locator
Station Locator is a OneTouch Series II Pro feature that
determines the switch and switch port where a station is
connected. It does this by searching for the MAC address
of the station in the forwarding tables contained in the
switch. Station Locator then displays pertinent switch
status and configuration information with port
identification and the location of a suspect station.
From the Connectivity Tests display, press
(Station
Locator) to access the Station Locator tabular display
(Figure 6-13) then the Find MAC or Find IP tab.
If you haven’t done so already, press (IP Config) to
configure the Network Assistant addresses. You can
enter addresses manually or use DHCP (read “Central
Setup” in Chapter 2).
6-10
Figure 6-13. Station Locator
ace609s.bmp
Find MAC
Enter the Target MAC address by pressing the address
box and using the keypad. The lookup is then performed
using the MAC address after you press (Find).

Connectivity Tests
Introduction
6
Find IP
Enter the Target IP by pressing the address box and
using the keypad. Press
address, the Network Assistant first tries to determine the
MAC address of that station before performing the
search. The actual search is performed using the MAC
address. Although the IP address does not have to be on
the same subnet as the Network Assistant, it does need
to be on the local segment. It can determine the MAC
address of the IP station only if it is on the local segment.
(Find). If you enter an IP
Mode of Operation
Before Station Locator can search for a MAC address, it
must first find all the switches on the network. Switch
Discovery is performed automatically during the discovery
process. When you run Station Locator, the Network
Assistant searches the forwarding tables of each switch
that it has discovered. It searches the Bridge MIB and
some switches’ private MIBs to get the port information.
In order for switch discovery to work properly, the
Network Assistant needs to know the community string of
the switches. You can configure the community strings in
the SNMP Config menu (read “SNMP” earlier in this
chapter). If you change or add community strings, you
can rerun Autotest or Network Health so the Network
Assistant will use the new community strings.
Results
The Network Assistant reports all switches that have the
target MAC address in their forwarding tables. The target
MAC address may appear in more than one switch. This
can happen in a switch hierarchy environment. When a
station on one switch communicates with a station on
another switch, the MAC address of each station will
appear in the forwarding tables of each switch.
The Network Assistant does not attempt to determine the
switch to which the station is directly connected. To
determine the switch to which the station is directly
connected, you need to be familiar with switch hierarchy.
If you can recognize the description or port number as an
uplink port, then you can deduce that the station is not
directly connected to that switch.
For each switch discovered, the following information is
presented:
q
Name – SNMP name of the switch
q
IP – IP address of the switch
q
MAC – MAC address of the switch
q
Mfr - Manufacturer and model
q
Port – The port number on which the MAC address
was found. Some switches encode the slot and port
number into the port number. For example, a switch
may represent slot 10/port 3 with a port value of
6-11

OneTouch Series II
Users Manual
1003. Typically, if a switch does not have slots but
looks like a hub, the port number will represent the
actual port on the unit.
q
Port Info – The interface description for the given
port. Port Information is the textual description of the
port on which the MAC address was found. This
description is either the interface description of the
port or a string constructed from the port information
collected from the private MIB of the switch.
Figure 6-14 is a sample of the information provided by
Station Locator.
6-12
Figure 6-14. Station Locator Information
ace610s.bmp

Chapter 7
ITO – Internetwork Throughput Option
Introduction
The Internetwork Throughput Option (ITO) is a Fluke
OneTouch Series II Network Assistant software option
that is used to test enterprise-wide throughput or to
evaluate line capacity. ITO’s counterpart, xDSL, verifies
the operation of digital subscriber lines.
ITO and xDSL throughput tests are identical in theory of
operation and will be described in tandem in this chapter.
The two options have different Fluke OneTouch hardware
revision and software version requirements and use
different terminology to reference their technology. Table
7-1 shows common terminology for ITO with its xDSL
equivalent.
ITO/xDSL consists of two components:
Throughput Test – double ended test of network
bandwidth which requires two OneTouch Series II
Network Assista nts.
Traffic Generator - tests traffic load capacity.
Table 7-1. ITO and xDSL Terminology
ITO Term xDSL Equivalent
Local Unit ATU-R Unit
Subscriber-end Unit
Remote Unit ATU-C Unit
Central Office Unit
7-1

OneTouch Series II
Users Manual
ITO/xDSL Throughput Test
The following functions are covered in the Throughput
section
Theory of Operation
Configuring the Remote Unit
Local Unit Connections
Configuring the Local Unit
Results Displayed During the Test
Final Test Results
ITO/xDSL Theory of Operation
The ITO Throughput test refers to these two units as the
local and remote units and the xDSL Throughput test
refers to these two units as the subscriber-end unit (ATUR) and the central office unit (ATU-C), respectively. Both
options are double-ended tests of bandwidth which
require two Fluke OneTouch Series II units to execute the
test. Figure 7-1 shows the relationship between the local
unit (ATU-R unit, for xDSL) and the remote unit (ATU-C
unit, for xDSL).
For the ITO Throughput test both units must have
software version 4.50, or later. Only the local unit must
have the ITO option enabled.
xDSL option is not required. The subscriber-end unit
(ATU-R unit) must have software version 4.50, or later
and must have the xDSL option enabled.
Read the
Started Manual
program online help for more information on enabling
options.
OneTouch Series II Network Assistant Getting
(P/N 1595893) and the OneTouch Link
Note
For the best operation, it is recommended that
you update all of your Network Assistants’ xDSL
software version 4.50, or later.
For the ITO Throughput test, a second, unattended
Network Assistant (the remote unit) is used as a remote
traffic source. For the xDSL Throughput test, a second,
unattended Network Assistant (the ATU-C unit) is used as
a remote traffic source. The subscriber-end unit (ATU-R
for xDSL) is used to configure the test, execute the test,
and display the test results.
For the xDSL Throughput test, the central office unit
(ATU-C) must have software version 4.50 or later but the
7-2

ITO – Internetwork Throughput Option
Introduction
7
Remote
(ATU-C)
Unattended
Network
Assistant
Ethernet
Network
Ethernet
Network
WAN
Local
(ATU-R)
Network
Assistant
ace702f.eps
Figure 7-1. Local and Remote Units
7-3

OneTouch Series II
Users Manual
Basic Operation
For the ITO and xDSL Throughput Tests, starting the test
causes the following actions:
1. The local unit (ATU-R for xDSL) sends an ARP
request to the remote unit (ATU-C for xDSL)
specified in its Remote IP Address (Target
ATU-C IP in xDSL) and waits for a response to that
request.
2. After the ARP response is received, the local unit
(ATU-R for xDSL) requests the remote unit (ATU-C
for xDSL) to generate traffic using the local unit’s
(ATU-R for xDSL) user-configured duration, data
pattern, rate, and frame length. The local unit (ATU-R
for xDSL) waits for the remote unit (ATU-C for xDSL)
to acknowledge the receipt of the traffic generation
request.
The number of frames per second for the upstream
and downstream bit rates is also calculated and
displayed. The Ethernet preamble and
inter-frame gap are used in this calculation and the
number of frames per second is rounded up.
3. After the remote unit (ATU-C for xDSL)
acknowledges the receipt of the traffic generation
request, both units zero their counters and setup for
tracking the number of packets received from the
other unit. Then, both units generate the userconfigured traffic for the specified duration. The traffic
generated is IP level data-grams, which allows
routing. Both units transmit traffic simultaneously.
4. After the user-configured duration, the local unit
(ATU-R for xDSL) requests the remote unit (ATU-C
for xDSL) to send the number of packets counted
from the local unit (ATU-R for xDSL). Knowing the
number of packets sent and received from the
remote (ATU-C for xDSL) and itself, the local unit
(ATU-R for xDSL) calculates and displays the results.
Conducting a Throughput Test
The Throughput Test is part of the Internetwork
Throughput Option (ITO) or xDSL. The Throughput Test
is a double-ended test of line or network bandwidth that
requires two Network Assistants. After configuring each
unit, you connect the remote and local units to your
network in locations that allow you to test between the
two units. Figure 7-2 shows the relationship between the
local unit (ATU-R unit, for xDSL) and remote (A, B, C, or
D) units (ATU-C unit, for xDSL). Figure 7-3 shows the
equivalent connections for xDSL.
7-4

ITO – Internetwork Throughput Option
Introduction
7
Router
A
Switch or Router
Hub
D
B
Network
WAN
Assistant
C
Switch or Router
Figure 7-2. ITO Local Unit and Possible Remote Unit Locations (A, B, C, or D)
703f.eps
7-5

OneTouch Series II
Users Manual
External Network/
Internet Service
Providers
Existing Telephone Line
7-6
Enet
Router
Enet
Switch
Central Office Network
Installation
Assistant
Central Office
xDSL
Modem
Figure 7-3. xDSL Test Connections
xDSL
Modem
Subscribers
Computer
Network
Installation
Assistant
Subscriber's Location
ace710f.eps

ITO – Internetwork Throughput Option
Introduction
7
The test allows Ethernet to Ethernet testing of any link. A
link can be wireless, routed, transparent LAN service, or
asymmetric service (such as xDSL or cable modems).
The ITO Throughput test requires both units to have
software version 4.50, or later. Only the local unit must
have the ITO option enabled. Read “Determining and
Installing Software” in the
Started Manual
The following are some of the possible ways to use the
Throughput Test:
q
Test end-to-end WAN/LAN throughput
q
Test pattern, frame size, or rate sensitivity for
network devices such as modems, FRADS, hubs,
switches, or routers.
q
Compare your current WAN capacity to a Service
Level Agreement (SLA).
q
Test or evaluate equipment on the bench
for more information.
OneTouch Series II Getting
Connecting and configuring the Remote Unit
All you have to do with the remote (ATU-C Central Office
unit for xDSL) Network Assistant is to connect its AC
adapter, connect it to the network, and enter and set its IP
address as described in Chapter 6. Figure 7-5 shows the
connections for xDSL.
Once a valid IP address is set, manually or through
DHCP, the remote unit is designed to remain unattended
and to respond to any local unit’s request to participate in
the testing. The Remote IP Address parameter on the
local unit must be configured with the remote unit’s
source IP address.
Connecting and configuring the Local Unit
At the local (subscriber-end for xDSL) end, connect a
Network Assistant to the desired segment. Figure 7-5
shows a sample connection. For xDSL, connect the
Network Assistant to the Ethernet port on the xDSL
modem. Figure 7-6 shows a sample connection for xDSL.
To configure Network Assistant at the local end,
press
display then press
Option). If you are using the xDSL option, press
(xDSL Test) from the top-level display then press the
Throughput tab. Enter in the Remote IP field the IP
address of the Local (Subscriber) end in the
Throughput Test Configuration display (Figure 7-4).
(Connectivity Tests) from the top-level
(Internetwork Throughput
7-7

OneTouch Series II
Users Manual
1
2
Note
For xDSL, the central office unit only requires you to
enter an IP address. If the Network Assistant’s
Source IP Address is not set correctly for the network
segment that it will be attached to, you must set it
prior to performing any tests.
3
5
7
Figure 7-4. Local Unit Configuration Display for
Throughput Test
7-8
4
6
ace704f.eps

Internet Service Provider
ITO – Internetwork Throughput Option
Introduction
7
External Corporate Network
Router
Installation
Ethernet
Switches
Assistant
CO Unit
Figure 7-5. xDSL Central Office (Remote) Connections
xDSL ATU-C
Modem Bank
Alternate CO
Connection
Subscriber
Lines
POTS
Splitters
Public Switched
Telephone Network
ace712f.eps
7-9

OneTouch Series II
Users Manual
7-10
Subscriber
Lines
POTS
Telephone
Splitter
Computer or Network Connection
Figure 7-6. xDSL Subscriber-end Connections
xDSL Modem
Ethernet Port
Personal Computer
or
Business Network
Installation Assistant
ace711f.eps

ITO – Internetwork Throughput Option
Introduction
7
1.
Remote IP
Address
2.
IP Config
3.
Duration
4.
Data PRBS
Enter the source IP address of the
Network Assistant at the remote end
by pressing the Remote IP Address
box. For xDSL, enter the Target IP
ATU-C Address. Enter the address
with the keypad then press
Enables you to enter the IP address for
the local (this) unit. Select the method
for configuring the IP Address (Manual
or DHCP). See Chapters 2 and 6 for
more information.
Select 2, 10, 30, 60, 120 or 300
seconds, 1 hr, 12 hrs, or 18hrs as the
duration of the test.
Select to send all zeros (All 0s), all
ones (All 1s), alternating ones and
zeros (Alt 1/0), or a Pseudo-Random
Bit Sequence (PRBS). The PRBS
pattern simulates normal data traffic.
.
5.
Speed
Select from the following upstream (to
remote unit or central office for xDSL)
and downstream (from remote unit)
speeds to be tested:
ITO Speed Parameters
q
ISDN 128 Kbps, T1 1.544 Mbps,
E1 2.048 Mbps, and 1 Mbps/1
Mbps
XDSL Speed Parameters
ANSI Asymmetrical Rates: 64
Kbps/1.5 Mbps, 160 Kbps/3 Mbps,
384 Kbps/4.6 Mbps,
640 Kbps/6 Mbps, 1 Mbps/1
Mbps.
q
Auto: Tests a range of speeds to
determine the operating speed of
RADSL modems. The following
additional icons are displayed:
Select the lowest speed
Start at
for the range of
downstream rates to be
tested.
7-11

OneTouch Series II
Users Manual
Stop at
Upstream
Incr by
Select the highest speed
for the range of
downstream rates to be
tested.
Select the speed of the
upstream traffic
generated during the
test.
Select the increment size
of the downstream
speeds within the range
you defined with the
Start at and Stop at
selections. The test
increments the
downstream speed and
continues testing only if
the channel passes 95%
of the transmitted data at
the current speed.
q
User 1 and User 2: Allows you to
define your own upstream and
downstream rates.
The total upstream and
downstream rates must not exceed
the values listed below:
10 Mb
Frame Size Max Bps
64 37Mbps
128 64Mbps
256 78Mbps
512 87Mbps
768 87Mbps
1024 91Mbps
1280 93Mbps
1518 85Mbps
7-12

100 Mb
Frame Size Max Bps
64 32.8Mbps
128 65.5Mbps
256 75.8Mbps
512 86.0Mbps
768 86.0Mbps
1024 90.1Mbps
1280 92.2Mbps
1518 85.0Mbps
ITO – Internetwork Throughput Option
Introduction
7
6.
Frm Len
7.
Run Test
Select from the following RFC 1242
frame sizes: 64, 128, 256, 512, 768,
1024, 1280, and 1518 bytes.
After entering the above parameters,
press Run Test to start the test.
Results Displayed During the Throughput Test
While the Throughput Test is running, the display (Figure
7-7) shows the elapsed test time, current network
utilization (the meter), and the test parameters that were
selected on the Throughput Test configuration display.
The needle indicator on the Utilization meter shows total
network utilization, which includes both the generated
traffic and any other traffic present on the network.
Figure 7-7. ITO Results Shown During the Test
ace705s.bmp
Final Test Results
When Throughput Test is complete, the Network
Assistant displays the final results. Figure 7-8 shows an
example of final Throughput Test results screen, which
includes the following information:
7-13

OneTouch Series II
Users Manual
1. The first four items show the upstream and
downstream test speeds (Speed), the durat ion of the
test (Duration), the frame length (Frm Len), and the
data pattern (Pattern) as selected on the Throughput
Test configuration display.
2. The Upstream and Downstream rates show the
actual data upstream and downstream transmission
rates used during this Throughput Test excluding the
Ethernet overhead of preamble and inter-frame gap.
The number of frames (# Frms) shows the number of
frames successfully transmitted and the percentage
of successful transmissions. The number of frames
lost (# Lost) shows the number of frames lost during
transmission.
3. The bottom of the display shows the addresses used
for the local unit (This IP or ATU-R IP for xDSL), the
unit at the remote end (Rmt IP or ATU-C IP for
xDSL), and the router (Routr IP -- if any).
4. Hops are the number of routers (hops) between the
remote unit and the local unit.
1
2
3
4
7-14
Figure 7-8. Final ITO Throughput Test Results
ace706f.eps

ITO – Internetwork Throughput Option
Introduction
7
ITO/xDSL Traffic Generator
Traffic Generator lets you generate network traffic to see
how your network responds to varying traffic loads. Traffic
Generator is available in trial mode. Read the
Network Assistant Getting Started Manual
and the OneTouch Link program online help for more
information on enabling options.
The following Traffic Generator modes are available and
are covered in this section:
q
MAC Mode
IP Mode
Ping Mode
The following are some of the possible ways to use
Traffic Generator in MAC or IP mode:
Test for errors on a segment by loading it to a
predetermined level of traffic
Test network error reporting by generating bad
frames (such as short or jabber frames)
Test single ended throughput by monitoring with a
remote device
Verify router/switch/probe RMON and SNMP
interface statistics
Simulate additional users on a LAN
OneTouch
(P/N 1279870)
The following are some of the possible ways to use
Traffic Generator in Ping mode:
Verify that a drop-to-network connection can pass a
high rate of traffic without having to do a cable test
Identify bottlenecks by successively pinging devices
along the suspect path
Stress a targeted PC with network activity
Test WAN/LAN’s two way throughput using a single
Network Assista nt
Test symmetrical throughput of WAN links
XCaution
Traffic Generator can generate enough traffic to
saturate a 10 MB or 100 Mb Ethernet network.
Take care when using Traffic Generator.
Figure 7-9 shows the Traffic Generator setup display.
7-15

OneTouch Series II
Users Manual
1
1. Rate indicates the current Traffic Generator bit rate
excluding the Ethernet overhead of preamble and
inter-frame gap.
2. Use the arrow icons to set the number of frames
transmitted per second.
3. Use the arrow icons to set the frame length.
2
3
4
5
6
Figure 7-9. Traffic Generator Setup Display
7-16
ce707f.eps
4. Select the Frame Type as MAC (Media Access
Control), IP, or PING. Refer to the following sections
on Traffic Generator modes for more information.
5. Select Broadcast (only available for a Frame Type
of MAC) to transmit traffic as broadcast or do not
select it to transmit traffic as unicast.
If you selected a Frame Type of IP or PING, the
Broadcast selection changes to Target IP Address
allowing you to specify an IP address by pressing the
box and then entering the address from the displayed
keypad.
6. Press
(Start Traffic) to start generating traffic.
Press (Stop Traffic) to stop the Traffic
Generator.

ITO – Internetwork Throughput Option
Introduction
7
MAC Mode
Traffic Generator’s MAC mode allows you to transmit
traffic on the local segment. You can transmit unicast or
broadcast packets.
To run Traffic Generator in the MAC mode, do the
following:
1. Connect the Network Assistant to your network.
2. Press
display. For xDSL, press
top-level display then press the Traffic Generator
tab.
3. Press
4. Press or to configure Frames/second.
5. Press
64, 128, 256, 512, 768, 1024, 1280, 1518, or 1520
bytes.
6. Select MAC as the frame type.
7. Select Broadcast if you want Traffic Generator to
transmit broadcast traffic. Otherwise the transmitted
traffic is unicast to 00c017310000 (Fluke - 310000),
which is an unused MAC address.
( Connectivity Tests) from the top-level
(xDSL Test) from the
(Traffic Generator).
or to configure Frame Length as 60,
8. Press
Press
Generator.
(Start Traffic) to start generating traffic.
(Stop Traffic) to stop the Traffic
IP Mode
Traffic Generator’s IP mode allows you to transmit traffic
to a specific device or network. The target device can be
on the other side of a router.
To run Traffic Generator in the IP mode, do the following:
1. Connect the Network Assistant to your network.
2. Press
display.
3. Press (Internetwork Throughput Option)
4. Press the (Traffic Gen) tab. For xDSL, press
(xDSL Test) from the top-level display then press the
Traffic Generator tab. The Traffic Generator screen
displays.
5. Press
6. Press
64, 128, 256, 512, 768, 1024, 1280, 1518, or 1520
bytes.
(Connectivity Tests) from the top-level
or to configure Frames/second.
or to configure Frame Length as 60,
7-17
 Loading...