

Page 1

OER NetWatch
User’s Guide Version 1.6
August 2007
Copyright 2001, 2005, 2007 Fluke Corporation. All rights reserved.
All product names are trademarks of their respective companies.
w.flukenetworks.com
Page 2

User’s Guide – version 1.6 NetWatch
Software License Agreement
This is a legal agreement between you (“You”/ “the End User””), and Fluke Corporation, a Washington
corporation, its subsidiaries and affiliates, including Fluke Networks (“Fluke”), with offices at 6920 Seaway
Boulevard, Everett, Washington, 98203, USA.
BY DOWNLOADING OR OTHERWISE ELECTRONICALLY RECEIVING THIS SOFTWARE PRODUCT
(“PRODUCT”) IN ACCORDANCE WITH OUR SOFTWARE DELIVERY PROCEDURES OR BY OPENING
THE SEALED DISK PACKAGE WHICH CONTAINS THE PRODUCT, YOU ARE AGREEING TO BE
BOUND BY THE TERMS OF THIS AGREEMENT. IF YOU DO NOT AGREE TO THE TERMS OF THIS
AGREEMENT, PROMPTLY DELETE THE DOWNLOADED OR ELECTRONICALLY RECEIVED
SOFTWARE FROM YOUR COMPUTER SYSTEM AND NOTIFY US OF SAME IN ORDER TO CLAIM
AND, IF YOU HAVE RECEIVED A SEALED CD-ROM PACKAGE, RETURN THE UNOPENED DISK
PACKAGE AND THE ACCOMPANYING ITEMS (INCLUDING MANUALS) TO A FLUKE
REPRESENTATIVE, FOR REFUND OF THE PRICE PAID.
1. GRANT OF LICENSE AND PAYMENT OF FEES
Provided that You have paid the applicable License fee, Fluke grants You a non-exclusive and non-transferable,
revocable License to use one copy of the Product on the maximum number of servers and the maximum number of
devices specified in your purchase order, or if not so specified, on a single server and a single device by a single
user, and only for the purpose of carrying out your business in the country specified in your order. This Product is
licensed for internal use by You, the end user only. The Product is not licensed for provision of a public service by
You or for the provision of any fee generating service by You to a third party.
In the event that at any time You wish to extend the permitted number of servers or devices above the permitted
amount, You must contact Fluke or the reseller from whom you purchased the Product (“the Reseller”) and an
additional License fee may be agreed and a new License issued for the requested additional number of
servers/devices.
Fluke or your Reseller may require that You provide written certification showing the geographical locations, type
and serial number of all computer hardware on which the Software is being used, together with confirmation that
the Product is being used in accordance with the conditions of this Agreement. You shall permit Fluke or your
Reseller, and/or their respective agents to inspect and have access to any premises, and to the computer equipment
located there, at or on which the Software is being kept or used, and any records kept pursuant to this Agreement,
for the purposes of ensuring that the Customer is complying with the terms of this License, provided that
Fluke/your Reseller provides reasonable advance notice to the Customer of such inspections, which shall take
place at reasonable times.
2. EVALUATION, UPDATES, UPGRADES AND SUPPORT AND
MAINTENANCE
EVALUATION. If a provided license key is labelled “Evaluation”, Fluke grants You the right to use the Product
enabled by that key solely for the purpose of evaluation, and the Product will cease to function seven (7) days from
enabling (or after such longer period as may be agreed by Fluke and confirmed by Fluke or your Reseller in
writing), at which time the License grant for that Product also ends. After the evaluation period, You may either
purchase a full License to use the Product from your Reseller or directly from Fluke, or You must promptly return
to Fluke or cease to use the Evaluation Product and all associated documentation. The warranty set out in Clause 5
shall not apply in respect of Product downloaded for evaluation purposes.
UPDATES. Please refer to the release notes accompanying any new versions, updates or upgrades (“Updates”)
prior to installation. Fluke will inform You or your Reseller of any Updates which it may develop from time to
time and may License any such Updates to You for a reasonable charge. To the extent that Fluke issues any
Updates to You under the terms of this Agreement, any reference to the Product herein shall be deemed to include
such Updates.
If You have purchased the maintenance and support services from Fluke then subject to payment of the support
fees, Fluke shall provide such services in respect of the Product in accordance with the provisions of the Support
and Maintenance Agreement contained in Appendix 1.
3. INTELLECTUAL PROPERTY RIGHTS
All intellectual property rights in the Product belong to Fluke and its Supplier(s) and Licensors(s) and You
acknowledge that the Product contains valuable Trade Secrets of Fluke, its Supplier(s) and Licensor(s) and You
have no ownership claims or rights whatsoever in the Product. You may (a) make one copy of the Product solely
for backup or archival purposes and keep this securely, or (b) transfer the software to a secure single hard disk
provided that You keep the original solely and securely for backup or archival purpose. You may not copy the
2
Page 3

User’s Guide – version 1.6 NetWatch
written materials accompanying the Product. You shall not remove or alter Fluke’s copyright or other intellectual
property rights notices included in the Product or in and any associated documentation. You must notify Fluke
forthwith if You become aware of any unauthorized use of the Product by any third party.
Fluke’s Supplier(s) and Licensor(s) are third party beneficiaries of this Agreement as it pertains to relevant
intellectual property rights associated with the Product, and provisions of this Agreement related to intellectual
property rights are enforceable by Fluke, its Supplier(s) and Licensor(s).
4. OTHER RESTRICTIONS
You shall not sub-License, distribute, market, lease, sell, commercially exploit, loan or give away the Product or
any associated documentation. For the avoidance of doubt, this License does not grant any rights in the Product to,
and may not be assigned, sub-Licensed or otherwise transferred to, any connected person, where the term
connected person includes but is not limited to the End User’s subsidiaries, affiliates or any other persons in any
way connected with the End User, whether present or future. The Product and accompanying written materials
may not be used on more than the permitted number of servers at any one time or for in excess of the permitted
number of devices. Subject always to any rights which You may enjoy under applicable law (provided that such
rights are exercised strictly in accordance with applicable law) and except as expressly provided in this Agreement,
You may not reproduce, modify, adapt, translate, decompile, disassemble or reverse engineer the Product in any
manner. You shall not merge or integrate the Product into any other computer program or work, and You shall not
create derivative works of the Product. Fluke reserves all rights not expressly granted under this Agreement.
5. LIMITED WARRANTY
Fluke warrants that during the warranty period (a) the Product will perform substantially in accordance with its
accompanying written materials, and (b) the media on which the Product is furnished shall be free from defects in
materials and workmanship. The warranty period applicable to the Product shall be ninety (90) days from the date
of delivery of the Product or, if longer, the shortest warranty period permitted in respect of the Product under
applicable law (“Warranty Period”). The warranty for any hardware accompanying the Product shall be as stated
on the warranty card shipped with the hardware.
If, within the Warranty Period, You notify Fluke of any defect or fault in the Product in consequence of which the
Product fails to perform substantially in accordance with its accompanying written materials, and such defect or
fault does not result from You, or anyone acting with your authority, having amended, modified or used the
Product for a purpose or in a context other than the purpose or context for which it was designed or licensed
according to this Agreement, or as a result of accident, power failure or surge or other hazards, Fluke shall, at
Fluke’s sole option and absolute discretion, do one of the following:
(i) repair the Product; or
(ii) replace the Product; or
(iii) repay to You all license fees which You have paid to Fluke under this Agreement.
Fluke does not warrant that the operation of the Product will be uninterrupted or error or interruption free.
6. CUSTOMER REMEDIES
You must call your Fluke representative for an authorization to return any item during the 90 day warranty period
referred to in clause 5 above, and You will be supplied with a return authorisation number and an address for
returning the item together with a copy of your receipt. You acknowledge that your sole remedy for any defect in
the Product will be Your rights under clause 5.
7. NO OTHER WARRANTIES
FLUKE AND/OR ITS SUPPLIERS, DISCLAIM ALL OTHER WARRANTIES, EITHER EXPRESS OR
IMPLIED, INCLUDING BUT NOT LIMITED TO IMPLIED WARRANTIES OF MERCHANTABILITY AND
FITNESS FOR A PARTICULAR PURPOSE, WITH RESPECT TO THE PRODUCT, THE ACCOMPANYING
WRITTEN MATERIALS AND ANY ACCOMPANYING HARDWARE AND YOU AGREE THAT THIS IS
FAIR AND REASONABLE. THE EXPRESS TERMS OF THIS AGREEMENT ARE IN LIEU OF ALL
WARRANTIES, CONDITIONS, UNDERTAKINGS, TERMS OF OBLIGATIONS IMPLIED BY STATUTE,
COMMON LAW, TRADE USAGE, COURSE OF DEALING OR OTHERWISE, ALL OF WHICH ARE
HEREBY EXCLUDED TO THE FULLEST EXTENT PERMITTED BY LAW.
8. NO LIABILITY FOR CONSEQUENTIAL DAMAGES
IN NO EVENT SHALL FLUKE AND/OR ITS SUPPLIERS BE LIABLE FOR ANY INDIRECT,
CONSEQUENTIAL OR ECONOMIC LOSS OR DAMAGES WHATSOEVER OR FOR ANY LOSS OF
PROFITS, REVENUE, BUSINESS, SAVINGS, GOODWILL, CAPITAL, ADDITIONAL ADMINISTRATIVE
TIME OR DATA ARISING OUT A DEFECT IN THE PRODUCT OR THE USE OF OR INABILITY TO USE
THE PRODUCT, EVEN IF FLUKE HAS BEEN ADVISED OF THE POSSIBILITY OF SUCH DAMAGES.
3
Page 4

User’s Guide – version 1.6 NetWatch
9. TERMINATION
Either party shall be entitled forthwith to terminate this Agreement by written notice if the other Party commits
any material breach of any of the provisions of this Agreement and, fails to remedy the same within sixty (60) days
after receipt of a written notice from the non-breaching Party giving full particulars of the breach and requiring it
to be remedied.
You shall be obliged to notify Fluke in writing of any change in the control or ownership of the End User and
Fluke shall be entitled forthwith to terminate this Agreement by written notice.
This Agreement shall automatically terminate if replaced at any time with a new License agreement.
The right to terminate this Agreement given by this clause 9 will be without prejudice to any other accrued right or
remedy of either Party including accrued rights or remedies in respect of the breach concerned (if any) or any other
breach, or which the Parties have accrued prior to termination.
10. INDEMNIFICATION
You shall indemnify Fluke in full and hold Fluke harmless in respect of any loss, damages, proceedings, suits,
third party claims, judgements, awards, expenses and costs (including legal costs) incurred by or taken against
Fluke as a result of the negligence, fault, error, omission, act or breach of You or of your employees, staff,
contractors, agents or representatives or for any breach of this Agreement whatsoever by You.
Notwithstanding any other provision of this Agreement, the aggregate liability of Fluke for or in respect of all
breaches of its contractual obligations under this Agreement and for all representations, statements and tortious
acts or omissions (including negligence but excluding negligence causing loss of life or personal injury) arising
under or in connection with this Agreement shall in no event exceed the License fee paid by You pursuant to this
Agreement prior to the date of the breach.
11. CONFIDENTIAL INFORMATION AND SECURITY
During and after this Agreement, the Parties will keep in confidence and use only for the purposes of this
Agreement all Confidential Information. Confidential Information means information belonging or relating to the
Parties, their business or affairs, including without limitation, information relating to research, development,
Product, processes, analyses, data, algorithms, diagrams, graphs, methods of manufacture, trade secrets, business
plans, customers, finances, personnel data, and other material or information considered confidential and
proprietary by the Parties or which either Party is otherwise informed is confidential or might or ought reasonably
expect that the other Party would regard as confidential or which is marked "Confidential". For the avoidance of
doubt, You shall treat the Product and any accompanying documentation as Confidential Information.
Confidential Information does not include any information (i) which one Party lawfully knew before the other
Party disclosed it to that Party; (ii) which has become publicly known through no wrongful act of either Party, or
either Parties’ employees or agents; or (iii) which either Party developed independently, as evidenced by
appropriate documentation; or (iv) which is required to be disclosed by law.
The Parties will procure and ensure that each of its employees, agents, servants, sub-contractors and advisers will
comply with the provisions contained in this clause. If either Party becomes aware of any breach of confidence by
any of its employees, officers, representatives, servants, agents or sub-contractors it shall promptly notify the other
Party and give the other Party all reasonable assistance in connection with any proceedings which the other Party
may institute against any such person. This clause 11 shall survive the termination of this Agreement.
notwithstanding the above confidentiality provisions, in accepting this License agreement, You agree that, subject
to any applicable data protection laws, Fluke may use your business name and logo for the purposes of marketing
and promotion of the product and its business and You hereby grant Fluke a limited License to use your business
name and logo for these purposes.
12. EXPORT CONTROL
You shall be responsible for and agree to comply with all laws and regulations of the United States and other
countries (“Export Laws”) to ensure that the Product is not exported directly, or indirectly in violation of Export
Laws or used for any purpose prohibited by Export laws.
13. GOVERNING LAW AND JURISDICTION
13.1 This Agreement and all relationships created hereby will in all respects be governed by and construed in
accordance with the laws of the state of Washington, United States of America, in respect of all matters arising out
of or in connection with this agreement. The Parties hereby submit to the exclusive jurisdiction of the Washington
Courts. NOTHING IN THIS CLAUSE SHALL PREVENT FLUKE FROM TAKING AN ACTION FOR
PROTECTIVE OR PROVISIONAL RELIEF IN THE COURTS OF ANY OTHER STATE.
14. MISCELLANEOUS
14.1 The provisions of clauses 3, 7, 8, 10, 11, 12, 13 and 14 and the obligation on you to pay the License fee shall
survive the termination or expiry of this Agreement.
4
Page 5

User’s Guide – version 1.6 NetWatch
14.2 This Agreement is personal to You and You shall not assign, sub-License or otherwise transfer this
Agreement or any part of your rights or obligations hereunder whether in whole or in part save in accordance with
this Agreement and with the prior written consent of Fluke and You shall not allow the Product to become the
subject of any charge, lien or encumbrance of whatever nature. Nothing in this Agreement shall preclude the
Licensor from assigning the Product or any related documentation or its rights and obligations under this
Agreement to a third party and You hereby consent to any such future assignment.
14.3 This Agreement and the Support and Maintenance Agreement supersede all prior representations,
arrangements, understandings and agreements between the Parties herein relating to the subject matter hereof, and
sets out the entire and complete agreement and understanding between the Parties relating to the subject matter
hereof.
14.4 If any provisions of the Agreement are held to be unenforceable, illegal or void in whole or in part the
remaining portions of the Agreement shall remain in full force and effect.
14.5 No party shall be liable to the other for any delay or non-performance of its obligations under this Agreement
(save for your obligation to pay the fees in accordance with clause 1) arising from any cause or causes beyond its
reasonable control including, without limitation, any of the following: act of God, governmental act, tempest, war,
fire, flood, explosion, civil commotion, industrial unrest of whatever nature or lack of or inability to obtain power,
supplies or resources.
14.6 A waiver by either party to this Agreement of any breach by the other party of any of the terms of this
Agreement or the acquiescence of such party in any act which but for such acquiescence would be a breach as
aforesaid, will not operate as a waiver of any rights or the exercise thereof.
14.7 No alterations to these terms and conditions shall be effective unless contained in a written document made
subsequent to the date of the terms and conditions signed by the parties which are expressly stated to amend the
terms and conditions of this Agreement.
5
Page 6

User’s Guide – version 1.6 NetWatch
Appendix 1 to End User License
Terms and Conditions for Fluke Support and Maintenance Service
1. Definitions
1.1 In this Agreement and in the Schedules hereto, save where the context so admits or requires, the
following definitions shall have the following meanings:
“Intellectual Property Rights” includes, without limitation, copyrights, discoveries, concepts, domain names,
patents, secret processes, database rights, technologies, know how, inventions, ideas, improvements, information,
trade secrets, all copyright works, business methods, logos, designs, trademarks, service marks, topography and
semi-conductor chip rights, business names, literary, dramatic, musical and artistic works anywhere in the world
(whether any of the foregoing is registered or unregistered and including any application in relation to any of the
aforesaid).
“License Agreement” means the product License agreement under the terms of which the Product is licensed to
You and which is entered into simultaneously with this Agreement.
“Retail Prices Index” means that the Consumer Price Index as published monthly by the Central Statistics
Office or Ireland or any of its successors.
“Support Charges” shall mean the applicable annual support fee as published in Fluke’s price list.
“Support Hours” means those hours specified in the Schedule during which Fluke shall provide the Support
Services described in this Agreement.
“Support Services” shall mean the maintenance and support services provided by Fluke under the terms of this
Agreement as detailed in the Schedule.
"Working Day" means any day other than Saturday or Sunday or a bank or a public holiday in Ireland.
Capitalized terms which are not defined herein shall have same meaning as under the License Agreement.
1.2 In the event of any inconsistency between the Schedule and any terms or provisions of any clause
contained in this Agreement, the terms or provisions in the clause of the Agreement shall prevail.
1.3 Words in the singular shall include the plural and vice versa where the context so admits or requires and
words importing one gender include every other gender.
1.4 The headings in this Agreement are for ease of reference only and do not form part of the contents of this
Agreement and shall not affect its interpretation.
1.5 Save as provided for elsewhere in this Agreement, this Agreement including the Schedule represents the
entire of the understanding of the parties concerning the subject matter hereof, viz, the provision of support and
maintenance services by Fluke to You, and overrides and supersedes all prior promises, representations,
understandings, arrangements, agreements, letters of intent or heads of agreement concerning the same which are
hereby revoked by mutual consent of the parties.
1.6 No alterations to these terms and conditions shall be effective unless contained in a written document
made subsequent to the date of the terms and conditions signed by the parties which are expressly stated to amend
the terms and conditions of this Agreement.
1.7 The contents of the Schedule form an integral part of this Agreement and shall have as full effect as if it
were incorporated in the body of this Agreement and the expressions “this Agreement” and “the Agreement” used
in the Schedule shall mean this Agreement and any reference to “this Agreement” shall be deemed to include the
Schedule.
2. Support Services
2.1 In consideration of the payment by You of the Support Charges, Fluke agrees to provide the Support
Services.
3. Support Charges
3.1 You shall pay the Support Charges to Fluke annually in advance. The Support Charges shall be paid
within 30 days after receipt of Fluke’s invoice thereof. No Support Services will be provided until payment in full
has been received by Fluke. In the event of late payment, interest shall be charged at the rate of interest referred to
in the European Communities (Late Payment in Commercial Transactions) Regulations 2002, from the date of
invoice until the date of actual payment, such interest to accrue daily and both before and after judgement.
3.2 The Support Charges (including the charges for support outside of the Support Hours) may at Fluke’s
sole discretion be increased annually in accordance with the annual increase in the Retail Prices Index.
3.3 The Support Charges payable under the terms of this Agreement are related to the Support Services
specified in Schedule 2. Additional support is subject to Fluke’s then standard rates.
3.4 All Support Charges referred to in this Agreement are exclusive and net of any taxes, duties or such
other additional sums which shall be paid by You including, but without prejudice to the generality of the
6
Page 7

User’s Guide – version 1.6 NetWatch
foregoing, VAT, excise tax, tax on sales, property or use, import or other duties whether levied in respect of this
Agreement, the Support Services or otherwise.
4. Undertakings by You
You undertake:
4.1 To maintain accurate and up to date records of the number and location of all copies of the Product
supplied to You under the terms of the License Agreement and in relation to the numbers of users of such.
4.2 To co-operate with Fluke’s personnel in the diagnosis of any error or defect in the Product or Updates
reported by You.
4.3 To make available to Fluke, all reasonable information, facilities, services and access required by Fluke
in order to perform the Support Services.
5. Supplier’s Undertakings
5.1 Fluke shall use its reasonable commercial endeavours to ensure that the Support Services will be
performed in such a way as to cause only minimal interruptions to your business processes (other than any preagreed unavoidable interruption which in Fluke’s sole discretion is required in order to perform the Support
Services in a proper and efficient manner).
5.2 Fluke shall use its reasonable commercial endeavours to ensure that the Support Services are performed
with reasonable skill and care.
5.3 The express terms of this Agreement are in lieu of all warranties, conditions, undertakings, terms of
obligations implied by statute, common law, trade usage, course of dealing or otherwise, all of which are hereby
excluded to the fullest extent permitted by law.
5.4 Without prejudice to the generality of clause 5.3 and for the avoidance of doubt, to the fullest extent
permitted by law all terms implied by Sections 13, 14 and 15 of the Sale of Goods Act, 1893 are hereby excluded
and all terms implied by the Sale of Goods and Supply of Service Act, 1980 including, without prejudice to the
generality of the foregoing, Section 39, are hereby excluded and the parties agree that this is fair and reasonable.
6. Limitation of Liability and indemnity
6.1 You shall indemnify Fluke in full and hold Fluke harmless in respect of any loss, damages, proceedings,
suits, third party claims, judgements, awards, expenses and costs (including legal costs) incurred by or taken
against Fluke as a result of the negligence, fault, error, omission, act or breach of You or of your employees, staff,
contractors, agents or representatives or for any breach of this Agreement whatsoever by You.
6.2 In no event will Fluke be liable to You for any special, incidental, indirect, punitive or consequential loss
or damages, any loss of business, revenue or profits, loss of use, loss of data, loss of savings or anticipated savings,
loss of investments, loss of goodwill, capital costs or loss of extra administrative cost, whether occasioned by the
negligence, fault, error, omission, act or breach of the Fluke, its employees, contractors or sub-contractors whether
or not foreseeable, arising out of or in connection with this Agreement, whether in an action based on contract,
equity or tort including negligence or other legal theory.
6.3 Notwithstanding any other provision of this Agreement, the aggregate liability of Fluke for or in respect
of all breaches of its contractual obligations under this Agreement and for all representations, statements and
tortious acts or omissions (including negligence but excluding negligence causing loss of life or personal injury)
arising under or in connection with this Agreement shall in no event exceed the Support Charges paid by You
pursuant to this Agreement prior to the date of the breach.
7. Intellectual Property Rights
7.1 Ownership of all Intellectual Property Rights in the Product and any accompanying documentation is
governed by the provisions of the License Agreement.
8. Termination
8.1 You can terminate this Agreement at any time after the first anniversary of this Agreement by giving to
Fluke not less than 90 days’ written notice.
8.2 Either Party may terminate this Agreement by written notice to the other Party where:
8.2.1 the other party has committed a material breach of the terms or conditions of this Agreement including
the terms, conditions and provisions of the Schedule and where the breaching party has failed to remedy such
breach within sixty (60) days after receiving written notice from the non-breaching party requiring it so to do; and
8.2.2 the other party makes any arrangement or composition with its creditors or pass a resolution or where a
Court shall make an order that the defaulting party shall be wound up (save and excepting only a member's
winding up for the purposes of reconstruction or amalgamation to which the other party has been approved in
writing prior to such) or where an examiner or a receiver or a liquidator is appointed over the other a Party’s
business.
8.3 On termination of this Support Agreement all rights and obligations of the parties under this Support
Agreement shall automatically terminate except for any rights of action which may have accrued prior to
7
Page 8

User’s Guide – version 1.6 NetWatch
termination and any obligations which expressly or by implication are intended to commence or continue in effect
on or after termination.
9. Confidential Information and Security
9.1 During and after this Agreement, the Parties will keep in confidence and use only for the purposes of this
Agreement all Confidential Information. Confidential Information means information belonging or relating to the
Parties, their business or affairs, including without limitation, information relating to research, development,
Product, processes, analyses, data, algorithms, diagrams, graphs, methods of manufacture, trade secrets, business
plans, customers, finances, personnel data, and other material or information considered confidential and
proprietary by the parties or which either party is otherwise informed is confidential or might or ought reasonably
expect that the other party would regard as confidential or which is marked "Confidential". Confidential
Information does not include any information (i) which one party knew before the other party disclosed it to that
party; (ii) which has become publicly known through no wrongful act of either party, or either parties’ employees
or agents; or (iii) which either party developed independently, as evidenced by appropriate documentation; or (iv)
which is required to be disclosed by law.
9.2 The Parties will procure and ensure that each of its employees, agents, servants, sub-contractors and
advisers will comply with the provisions contained in this clause.
9.3 If either Party becomes aware of any breach of confidence by any of its employees, officers,
representatives, servants, agents or sub-contractors it shall promptly notify the other Party and give the other Party
all reasonable assistance in connection with any proceedings which the other Party may institute against any such
person.
9.4 This clause shall survive the termination of this Agreement.
10 Miscellaneous
10.1 This Agreement is personal to You and You shall not assign, sub-License or otherwise transfer this
Agreement or any part of its right or obligations hereunder whether in whole or in part without the prior written
consent of Fluke. Nothing in this Agreement shall preclude Fluke from assigning or sublicensing its rights and
obligations under this Agreement.
10.2 If any provisions of the Agreement are held to be unenforceable, illegal or void in whole or in part the
remaining portions of the Agreement shall remain in full force and effect.
10.3 No Party shall be liable to the other for any delay or non-performance of its obligations under this
Agreement (save for the obligation of You to pay the Support Charges in accordance with clause 3) arising from
any cause or causes beyond its reasonable control including, without limitation, any of the following: act of God,
governmental act, tempest, war, fire, flood, explosion, civil commotion, industrial unrest of whatever nature or
lack of or inability to obtain power, supplies or resources.
10.4 A waiver by either party to this Agreement of any breach by the other party of any of the terms of this
Agreement or the acquiescence of such party in any act which but for such acquiescence would be a breach as
aforesaid, will not operate as a waiver of any rights or the exercise thereof.
10.5 No alterations to these terms and conditions shall be effective unless contained in a written document
made subsequent to the date of the terms and conditions signed by the parties which are expressly stated to amend
the terms and conditions of this Agreement.
10.6 This Agreement and all relationships created hereby will in all respects be governed by and construed in
accordance with the laws of Ireland in respect of all matters arising out of or in connection with this agreement.
The Parties hereby submit to the exclusive jurisdiction of the Irish Courts. NOTHING IN THIS CLAUSE SHALL
PREVENT FLUKE FROM TAKING AN ACTION FOR PROTECTIVE OR PROVISIONAL RELIEF IN THE
COURTS OF ANY OTHER STATE.
8
Page 9

User’s Guide – version 1.6 NetWatch
Schedule
Support Services
1. Support Hours
The Support Hours during which Fluke shall supply the Support Services shall be between 9.30am and 5pm on
Working Days.
2. Support Services
Fluke shall provide You during the Support Hours with:
2.1. technical advice and assistance by telephone, facsimile, e-mail or other electronic means as shall be
necessary to resolve your difficulties and queries in relation to the Product and the Updates which You may
require;
2.2. an error correction and problem solving service as follows:
if You shall discover that the then current supported version of Product fails to conform with any part of the
description of the Product provided to you by Fluke then Fluke, on receiving notification of the error, shall use its
reasonable endeavours to:
2.2.1 diagnose and resolve the reported error or problem; and
provide the required solution to remedy or correct the error or problem; and
2.2.3 provide You with all assistance reasonably required by You to enable You to implement the error
correction supplied as soon as possible; and
2.2.4 correct errors by “fix” where Fluke, in its sole discretion, considers such to be appropriate.
2.3 Response times to technical advice and assistance queries and reported errors and problems are set out in
clause 3 below.
2.4 Remote connection support shall only be provided by Fluke in the event that telephone, fax or
email support does not resolve a problem.
3. Response Times
3.1 In the event of any problem arising in relation to the Product’s installation and functioning, Fluke shall
respond within 8 Support Hours after the logging of such an incident by You provided that the incident was logged
by You during normal Support Hours. Fluke shall in turn endeavour to resolve the problem as soon as possible.
4. Exceptions to Support Services
4.1 The Support Services described in clause 2 of this shall not include service in respect of:
4.1.1 defects or errors resulting from any modifications of the Product or Updates made by any person other
than Fluke;
4.1.2 incorrect use of the Product or Updates or operator error;
4.1.3 any fault in Your hardware, computer equipment or in any programs used in conjunction with the
Product or Updates; or
4.1.4 defects or errors caused by the use of the Product or Updates on or with equipment or programs not
approved by Fluke.
9
Page 10

User’s Guide – version 1.6 NetWatch
Contents
SOFTWARE LICENSE AGREEMENT 2
CONTENTS 10
CHAPTER 1 – INTRODUCTION 13
Overview 13
Key Product Features 13
Minimum System Requirements 13
Installing NetWatch 13
Accessing the User Interface 14
Service 14
Details 14
Architecture Overview. 14
NetWatch Monitoring System 15
NetWatch Database 16
Alerting System 16
Web Front-end 16
CHAPTER 2 – NETWATCH CONFIGURATION 17
Global System Settings 17
Setting up a Device 18
Step 1. Specifying Devices. 18
Step 2. Select Service Types 19
Ping 19
TCP Port Test 19
SNMP Interface Test 19
SNMP Trap Reception 19
Step 3. Alarms. 20
Step 4. Discovery 20
Step 5. Editing Devices 21
Editing Services. 21
Data Archiving. 22
Enabling Data Archiving. 22
Disabling Data Archiving. 22
CHAPTER 3 – NETWATCH VISUALISATION 23
Managing Visual Backgrounds 23
Visual Backgrounds Supplied with NetWatch 23
To Create a New NetWatch Visual 23
To Rename a Visual 23
To Delete a Visual 23
To Create a Visual with an Existing Background 23
To Change the Background image of a Visual 24
Drawing the Visual 24
Enter Administration Section. 24
Add and Position Network Nodes 24
Add links between two nodes. 24
Define actions for Node and Links 24
Set the default action taken on clicking a Node\Link. 25
Align Node Descriptions. 25
Set Node Description Colour 25
10
Page 11

User’s Guide – version 1.6 NetWatch
Saving Configuration Set-up 25
Using a NetWatch Visual 25
View Node Alarms 25
View Node Reports 25
Using Node Tools Submenu 25
View Traffic between 2 Nodes 26
Node Colour Code System 26
Link Colour Code System 26
CHAPTER 4- THE ALERTING SYSTEM 27
How NetWatch Alerting Works 27
What Can Trigger an Alert? 27
Device Alerts 27
Service Alerts 27
Receiving Alerts 28
Web Based Reports 28
Email 28
SMS 28
Syslog 28
Setting up Alert Controllers 29
Email Recipient 29
Syslog Recipient 29
CHAPTER 5: THE REPORTING SYSTEM 30
Alerts 30
Devices 30
Services 30
Utilisation 30
Configuration Reports 30
Syslog Messages 31
CHAPTER 6: SYSLOGS 32
Syslogs and NetWatch 32
Enabling Syslog Reception 32
Syslog Severity/Priorities and Reporting 32
Configuring Devices to Send Syslogs to NetWatch 32
CHAPTER 7: UTILITIES 33
Backing up the database from the web interface 33
Manual backup of maps and database 33
Restoring from a backup 33
NetWatch Security 33
Search visuals for specific IP addresses 33
Setting up a licence 34
Logs 34
Manual 34
Status 34
CHAPTER 8: SERVICES, DISCOVERY AND POLLING 35
How NetWatch services work 35
Discovery 35
The SNMP Interface Test service 35
The TCP Port Status service 37
The Ping Response Test service 38
Response Time Graphing 38
11
Page 12

User’s Guide – version 1.6 NetWatch
The Receive SNMP Notifications service 38
Configuring services 38
CHAPTER 9: SECURITY 39
Levels of Security 39
Enabling Security 39
APPENDIX A: SNMP 40
MIBs 40
OIDs 40
Communities 40
Notifications 41
The Windows snmptrap.exe service 41
Windows 2000 41
Windows NT 41
Configuring SNMP on a Cisco Router 42
Further Information 42
APPENDIX B: NETWATCH AND IIS 44
APPENDIX C: INTEGRATING NETWATCH AND NETFLOW TRACKER 46
APPENDIX D: AUTO DISCOVERY 47
Discovery Methods 47
CDP Discovery 47
Route Table Discovery 47
Discovery Filters 47
Network Filters 47
IP Address Range Filters 48
APPENDIX E: THIRD PARTY SOFTWARE 49
jspSmartUpload 49
MySQL 49
Jakarta Tomcat 49
12
Page 13

User’s Guide – version 1.6 NetWatch
Chapter 1 – Introduction
Overview
NetWatch is a web based management product that provides a very detailed amount
of network information through an intuitive, easy to understand graphical interface.
Key Product Features
Monitors Network devices reporting on status, alerts and utilisation.
Provides a graphical representation of the network where devices are
represented as nodes connected by lines on a user definable background.
Generates status change and response time alerts via email, SMS, network
popup etc.
Allows multiple backgrounds/ maps and easy positioning of devices.
Includes user definable Bandwidth monitor
Ships with internal Syslog server and SNMP trap receiver.
Can be supplied as a hardware solution or installed direct from CD.
Minimum System Requirements
IBM Compatible PC Pentium III
256 MB RAM
10 GB Hard Disk Space
MS Windows NT 4.0 SP6, Win2K, Win XP
800X600 256 colour adaptor and monitor
IE 6.0 or greater.
LAN Adapter
Installing NetWatch
Open the CDROM drive from windows explorer.
If the CD does not auto-run then: Click on the icon named ‘setup.exe’ to start
installing NetWatch.
The install shield wizard allows you to choose which port the netwatch web server
runs on. The standard and default web server port is port 80. However if another
application is running on port 80 (E.g. IIS) you should install the netwatch web
server on a different port.
13
Page 14

User’s Guide – version 1.6 NetWatch
NetWatch uses the MySQL database to store configuration and historical
information. This is the largest part of NetWatch, so you may wish to install it on
a drive other then your system drive. To do this select "custom" from the set-up
type screen. Then choose "MySQL" and change the destination drive/directory.
When the installation completes NetWatch will be successfully installed and can
be used by accessing the User Interface.
Accessing the User Interface
After NetWatch is installed and running you can access the user interface of
NetWatch by pointing a web browser to the machine running NetWatch. If you chose
a port other than port 80 during installation you must specify it in the URL, e.g. to
access NetWatch running on port 8080 on the local machine, go to:
http://127.0.0.1:8080/
Once NetWatch is successfully installed, NetWatch and all its related components are
installed as services. These services can be stopped and started accordingly using the
NetWatch Service Manager. The details of the services are below:
Service Details
NetWatch System service can be Stopped / Started
MySQL Database service can be Stopped / Started
Tomcat Web Server service can be Stopped / Started
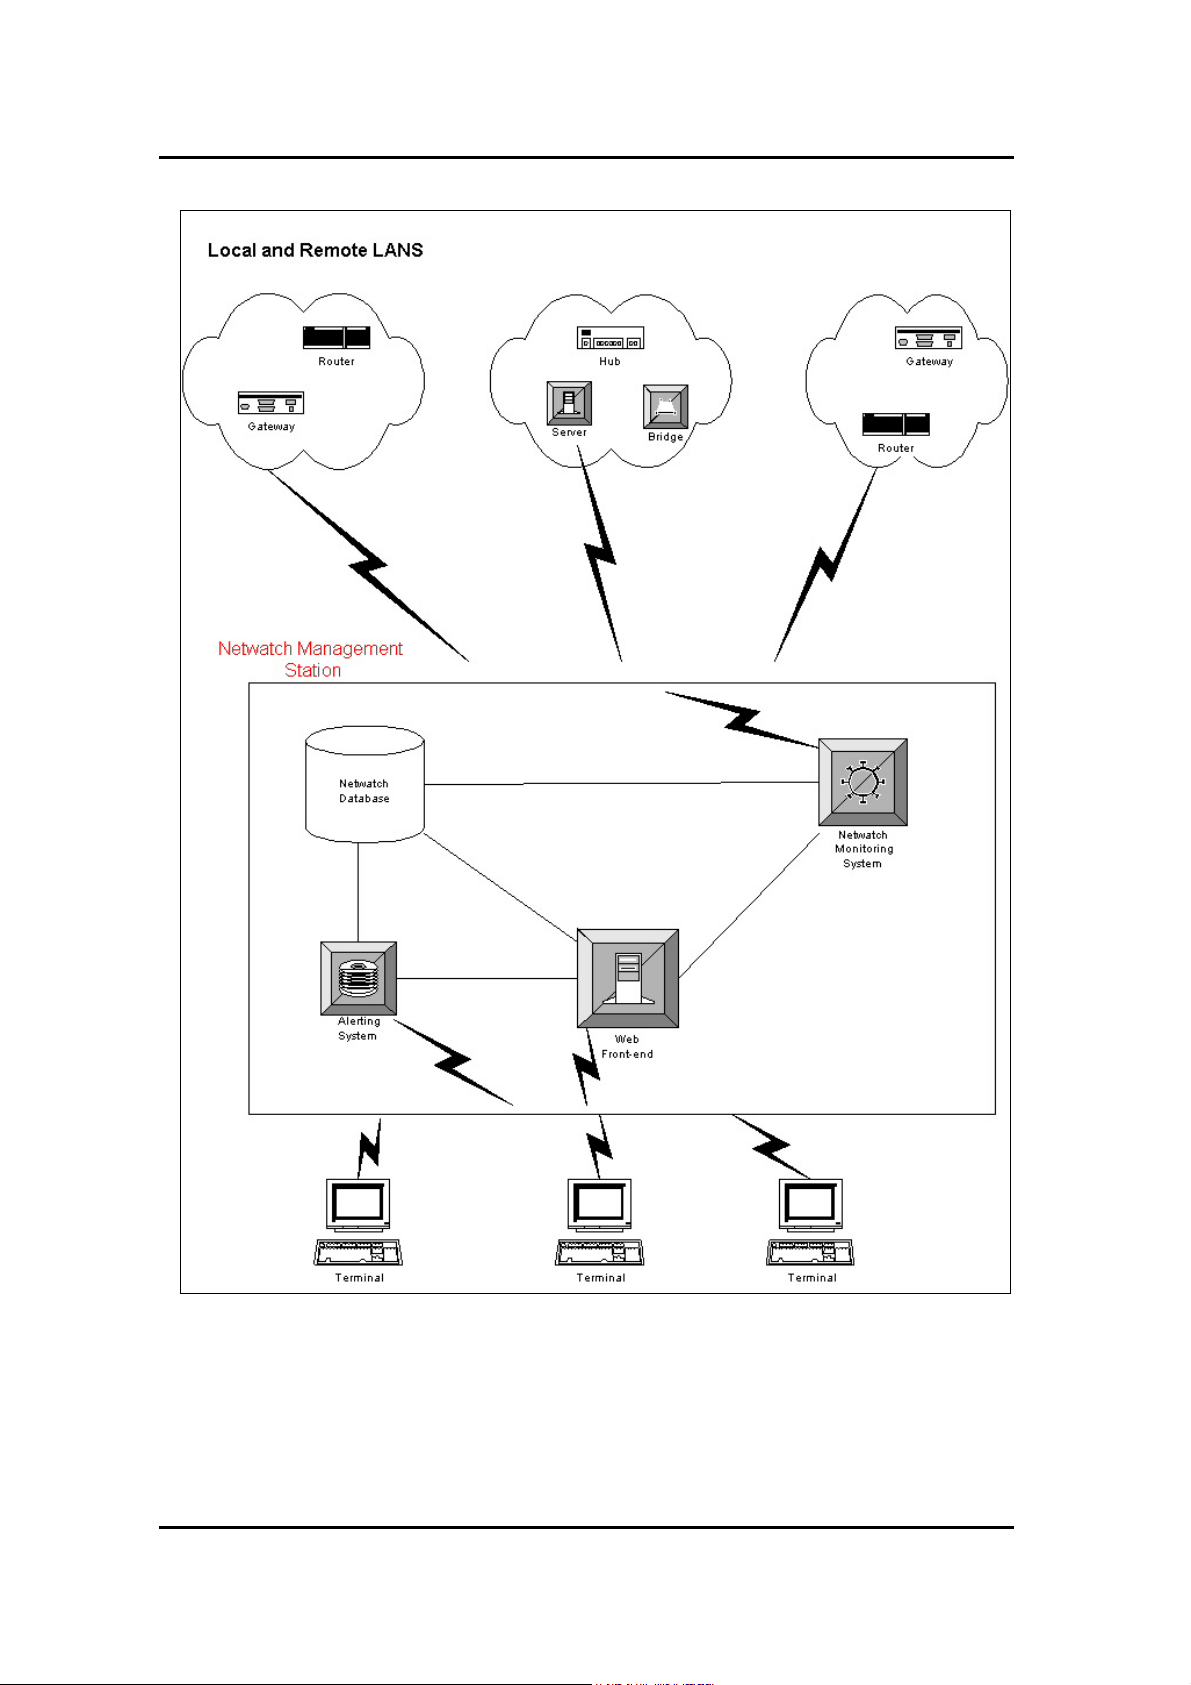
Architecture Overview.
NetWatch is a completely web based network management tool. Using its
unique web front-end, services on network devices can be configured and monitored
from anywhere on a local LAN or on the Internet.
14
Page 15
User’s Guide – version 1.6 NetWatch
NetWatch Monitoring System
The monitoring system is the core element within NetWatch. It performs the work of
monitoring the status of the services provided by a device and keeps track of the
amount of traffic going in and out of various channels on that device. It also acts as a
receiver to SNMP traps and syslog messages, which are generated by various network
devices.
15
Page 16

User’s Guide – version 1.6 NetWatch
NetWatch Database
MySQL was strategically chosen as the database for NetWatch because of the speed
with which it performs SQL queries.
It also handles connections very efficiently, thus making it ideal for a web based
product like NetWatch. The database stores all NetWatch configuration data and
logs.
Alerting System
NetWatch contains a complex alerting system, which alerts the user to certain
situations on a device. When an alert occurs this is immediately seen from the web
front-end. Alerts can be also sent through E-mail, SMS, syslog and various or media.
For detailed information on the alerting system refer to Chapter 4.
Web Front-end
The web front-end plays a very important role with in NetWatch in that it provides the
user interface of NetWatch. NetWatch uses a technology called Java Server Page
(JSP) in conjunction with our database for controlling the content and appearance of
our web front-end. Using this technology NetWatch is able to provide complex
reporting to the user.
The JSP pages are served to the user by using a specific web server (which runs on
configurable port e.g. 8080) that is installed with NetWatch.
16
Page 17

User’s Guide – version 1.6 NetWatch
Chapter 2 – NetWatch Configuration
To configure NetWatch click the “Administration” button on the welcome screen.
Global System Settings
These are settings that affect the operation of the whole NetWatch system. If
you installed NetWatch into a folder other than the default, please ensure these
settings are correct.
To access the System Settings page click on the “System Settings” button. The
various options are explained below:
Parameter Description
Company name The name of the company using NetWatch
System name A general name given to your NetWatch system
Administrator The name of the person who maintains the NetWatch
system
Email “from” address The source address on any email alarm sent by
NetWatch, e.g. administrator@companyname.com
Email subject line The subject on any email alarm sent by NetWatch
SMTP server The address of the default SMTP server used for
sending email alarms
NetWatch install directory The directory where NetWatch is installed
Default backup directory The default directory where NetWatch backups will be
stored
Default visual background The map that is loaded by default when you choose
“View your Network” from the welcome screen
Keep records for… The period after which records are deleted from the
NetWatch database
Use a maximum of… The maximum number of Sockets that will be used for
TCP port scans. As sockets are a limited resource it is
recommended that this does not exceed 500 sockets.
Maximum DB connections The Maximum Number of database connections that
can be opened at any one time. See MySQL
Appendix.
MySQL install directory The folder where MySQL is installed
Use Syslog Server Set to Yes if you want to receive Syslog messages.
Note that you need to restart the NetWatch service to
apply changes to this setting.
Use SNMP Notification
Receiver
Set to Yes if you want to receive SNMP Traps. Note
that you need to restart the NetWatch service to apply
changes to this setting.
17
Page 18

User’s Guide – version 1.6 NetWatch
Setting up a Device
The process of setting of a network device for monitoring is done in a very intuitive
and easy to use ‘Configuration Wizard’ with five simple steps. ‘Next’ and ‘Previous’
buttons are provided for navigation within the wizard.
Step 1. Specifying Devices.
This step involves specifying the devices you wish to monitor. Devices that are set up
together will all contain the same configuration. If you want devices with different
configurations they should be set up through the wizard separately.
You can add devices in one of three ways:
A. Enter the Name and IP Address of each device you want to monitor and
click ‘add’. To add a number of devices this can be done repeatedly.
B. You can create a text file containing all the devices and their IP addresses.
You can then ‘browse’ to this file in the wizard and click ‘Upload’ to load
all the devices. Each line of the import file should have the device name
followed by a space and an IP address, followed by a carriage return.
Make especially sure that the last line ends with a carriage return.
Sample Import File Format
Router1600 192.168.34.9
Router3200 192.168.34.2
Router3202 192.168.34.5
C. Auto Discovery: Given a starting IP address and appropriate community
strings NetWatch will automatically discover your network and allow you
to add devices found as NetWatch devices. You can choose either CDP or
route table discovery or use both together. The discovery can be filtered by
using multiple IP range or Network filters.
18
Page 19

User’s Guide – version 1.6 NetWatch
If you are unhappy with the devices you have added, clicking on the ‘Reset Device
List’ button will clear the list. Once you have loaded your device(s) you may proceed
to step 2 by clicking the ‘Next’ button.
Step 2. Select Service Types
This step involves selecting the types of NetWatch service that you wish to use to
monitor the device(s). There are four individual service types:
Ping
A simple ping operation to test whether or not the device is responding. Response
time for the operation can also be recorded. An alert can be triggered when the ping
status changes or if response time exceeds a threshold.
TCP Port Test
Selected TCP ports are tested for status. For example, you may wish to monitor the
status of the SMTP port on your mail server. This test makes sure that connections
can be made to that port and records when it changes status. Configuration allows you
to set up multiple profiles for monitoring commonly used groups of ports. Alerts can
be triggered when ports change status, or if response time exceeds the configured
threshold.
SNMP Interface Test
Interfaces on the device are polled for status, utilisation and response time. Status
changes are recorded as well as, optionally, detailed utilisation statistics and SNMP
request response time, both of which can be graphed. Alerting occurs on status
change, response time and on utilisation levels. Note that an SNMP community string
is required.
SNMP Trap Reception
Generic SNMP Traps are received and recorded. Note that only traps and notifications
from devices configured with this service type will be recorded. An alert can be
triggered when a trap is received. At the current version, only the six generic traps are
received: Cold Start, Warm Start, Link Up, Link Down, Authentication Failure and
EGP Neighbour Loss.
19
Page 20

User’s Guide – version 1.6 NetWatch
For more information on SNMP for the Interface Test or Trap Reception, see
Appendix B: SNMP. Further details of each service type can be found be clicking its
related ‘info’ link. To change the default values for timeouts and expected response
times, click the ‘configure’ link beside the service type. For more detailed information
on service types see Chapter 8: Services, Discovery and Polling
Step 3. Alarms.
.
In this step you can choose to have an alarm raised when the list of individual services
is detected for each device. This may occur, for example, if interfaces are added to or
removed from a device that is being monitored using the SNMP Interface Test. To
have this alarm raised, select the checkbox before clicking ‘Next’. For more
information see Chapter 4.
Step 4. Discovery
Once you reach this step the devices have been added to NetWatch and are in the
process of discovering individual services of the types you selected. The ‘Discovery
Status’ column shows whether this is complete for each device. The page will refresh
every minute, or you can click the ‘Refresh Status’ to refresh manually. The time
taken for discovery to finish depends on the the service types selected and the scale of
the device. For example, the TCP port service can take a long time for discovery to
complete, while the Ping and SNMP Trap services will take a negligible amount of
time.
When the status of a device reads ‘ready’ the device can be edited. To edit a device
select it and click ‘Edit Selected Devices’. You can edit more than one device at a
time, and you can come back and edit more devices as they complete their discovery.
20
Page 21

User’s Guide – version 1.6 NetWatch
At any time before you finish the wizard, the Configured? Column on Step 4 keeps
track of what devices have been edited in this session. The Editing Device window,
described below, will pop up when you edit a device or devices; if you edit any
devices you must click on ‘Finish’ on this screen when you are finally finished in
order to save the changes you have made.
Step 5. Editing Devices
This step shows a listing of all the services discovered for a set of devices. Services
can be configured individually or in groups. To edit a service select it and click ‘Edit
selected services’.
Editing Services.
There are a number of settings that can be configured for each service. Each of these
settings has a default.
21
Page 22

User’s Guide – version 1.6 NetWatch
A service can be managed or unmanaged using the provided checkbox. If a service is
unmanaged this means it will not be polled for status information.
The polling interval is the amount of time between polls. You can increase this to
reduce the amount of network traffic created by NetWatch.
The Average and Maximum response times of services can also be set. These
response times are set in milliseconds. (1000 milliseconds=1 Second).
You can choose to raise an alarm when the service changes status or when it is slow
to respond.
For more information on configuring services refer to Chapter 4.
Data Archiving.
Data archiving is used to store historical bandwidth usage figures for Daily,
Weekly, Monthly and Yearly graphs. Data Archiving is turned off by default. When
data archiving is turned on the amount of Hard disk space required is considerably
increased. For example, an average Access Router for 10 days requires approximately
17 megabytes of space.
Enabling Data Archiving.
Archiving is enabled through the ‘Administration’ section of Netwatch. The
‘Archiving’ configuration page allows you to specify how long you wish to store
Daily, Weekly, Monthly and Yearly usage figures. This page also gives you on idea
of how much space archiving will require on your hard disk based on your current
configuration. Note that these are just estimates and you will need to monitor your
disk usage to prevent the disk from filling up. A full disk in NetWatch will prevent
monitoring from taking place.
Disabling Data Archiving.
To disable archiving simply set the Daily, Weekly, Monthly and Yearly
archive periods to ‘0’ and save the changes.
22
Page 23

User’s Guide – version 1.6 NetWatch
Chapter 3 – NetWatch Visualisation
NetWatch provides a unique way to visualise your network, by creating a network
visual over a background image. The background can be any image in the form of a
gif, jpg or jpeg file.
Managing Visual Backgrounds
A visual can use any graphic image as a background. These background
images can be uploaded into the visualisation section and used for a new visual setup. The background image for a visual can be changed at any time without otherwise
affecting the visual in any way – i.e. the nodes and links on the visual are not affected.
Visual Backgrounds Supplied with NetWatch
NetWatch supplies you with a number of built in images for building your
visuals. When you install NetWatch, they are automatically available in the Edit
Visuals page. Additional graphics are also available on your NetWatch CD, in the
MapImages directory, or from the NetWatch page on the Fluke Networks website.
For more information, contact support@flukenetworks.com. Visual backgrounds can
be geographical maps, blank images or even conceptual drawings of your network or
system.
To Create a New NetWatch Visual
- In the Admin section, navigate to the Background Admin page.
- Select the graphic file you wish to use for the background using the
Browse button.
- In the Description field give the Visual a recognisable name.
- Click ‘Upload’ to create the visual.
To Rename a Visual
- Navigate to the Background Admin section.
- Changes the Name field next the file.
- Click ‘Update’.
To Delete a Visual
- Navigate to the Background Admin section.
- Click the ‘delete’ button next the graphic you wish to delete.
To Create a Visual with an Existing Background
- Navigate to the Background Admin section.
- Click the ‘clone’ button next the graphic you wish to delete.
- Enter a unique name for the new visual.
- Click ‘Update’.
23
Page 24

User’s Guide – version 1.6 NetWatch
To Change the Background image of a Visual
- Navigate to the Background Admin section
- Click the Change Map button next the visual whose background you wish
to change.
- Select the desired background image and click OK.
Drawing the Visual
A NetWatch visual allows your Network to be viewed in a unique way where each
configured device is considered a network node. Nodes are placed on the map to
represent devices on your network, with links drawn between them to represent the
network paths.
Enter Administration Section.
- Click on the Edit Visuals button.
Add and Position Network Nodes
- Right-click on the network visual
- Click Add Node
- Select the node from the list provided
- If required, left-click on the node and drag the node to the desired position.
Add links between two nodes.
The link represents the network interface the 2 nodes use for communication.
- Right click on a node this is called the ‘Connected from’ node. All link
information (i.e. status and utilisation) will come from this device.
- Select Add Link.
- Select the interface corresponding to the link.
- Drag the provided line from the ‘connected from’ node to the ‘Connected
to, node and left click.
- Select to interface on the ‘Connected to’ node then the link is complete.
Define actions for Node and Links
In the User view, the nodes and links provide possible actions on the rightclick context menu. By default, a link provides the option to show utilisation
on that interface and a node lets you view a list of services or a list of alarms
for that device. You can also add other actions that correspond to URLs that
are opened in a browser window. These actions, where configured, will appear
on the context menu.
To add an action to a Node\Link: -
- In Edit Visuals right-click the Node\Link and select Define Actions.
- In the popup Dialog, enter an Action Label and URL in the spaces
provided.
- Click Add and, when all actions are added, OK.
24
Page 25

User’s Guide – version 1.6 NetWatch
Set the default action taken on clicking a Node\Link.
The default action taken when left-clicking a node\link in viewer mode can be
defined here in edit mode. This can be a built-in or user defined action.
- Right-click the node and select Set Default Action.
- Select the action to be executed when a user right clicks that node.
- If you select Display Map then select a map from the list that appears.
Align Node Descriptions.
The node description can be above, below or to the right or left of the node.
This feature is useful when nodes become cluttered on the network Visual or if
the text colour clashes with a background item.
- Right-click on the desired node.
- Select Description Alignment.
- Choose the required alignment.
Set Node Description Colour
The node descriptions are white by default. This colour can be changed to
either green or black using the ‘Description colour’ menu item.
Saving Configuration Set-up
Once you are finished creating your visual set-up, save your configuration by
clicking save in the Admin panel on the map.
Using a NetWatch Visual
When you click on ‘View your Network’ on the welcome screen you enter a
visualisation mode where nodes or links cannot be modified and the status of each
node is updated automatically. You can select the visual you wish to monitor from the
list in the top left. The legend shows you what the various colours mean. If you wish
to find out more about a node or link, you can try one of the following:
View Node Alarms
- Right click on the desired node
- Select ‘Show alarms’ from the menu.
View Node Reports
- Right click on the desired node
- Select ‘Show Services’ from the menu.
Using Node Tools Submenu
The tools submenu allows you to:
1. View the Node Configuration
2. Ping the Device
3. Perform a simple SNMP Get.
25
Page 26

User’s Guide – version 1.6 NetWatch
View Traffic between 2 Nodes
- Right click on the desired link
- Select ‘Show Utilisation’ from the menu.
Node Colour Code System
Green: No alarms Present and all managed services are currently up.
Yellow: Alarms are Present. (View Node Alarms.)
Red: One or more of the managed services of this device are down.
Link Colour Code System
Grey: The Link is not being managed.
Dark Green: Utilisation is less than 10%.
Light Green: Utilisation is less than 30% and greater than 10%.
Yellow: Utilisation is less than 50% and greater than 30
Light Orange: Utilisation is less than 80% and greater than 50%.
Dark Orange: Utilisation is less than 80% and greater than 50%.
Red: The link is down.
For quick reference on these colour codes, see the panel at the bottom of the map.
26
Page 27

User’s Guide – version 1.6 NetWatch
Chapter 4- The Alerting System
How NetWatch Alerting Works
NetWatch can throw alerts when certain events occur or if thresholds are
exceeded on the network. When an alert is thrown, it is logged to the database and
displayed on the http reports and indicated on the NetWatch visuals. It can also be
forwarded to various recipients.
What Can Trigger an Alert?
There are various different types of alert, all caused by different events or
conditions:
Device Alerts
These are alerts that occur on a device as a whole. Currently there is one type of
device alert:
- Service List Alert
This alert is triggered whenever services are added to or removed from a
device. This can happen, either during manual discovery of a device in the
Edit Devices or Add Devices sections, or automatically, if NetWatch
detects that SNMP interfaces have been added or removed from a router.
To add or edit the Service List Alert, go to Add Devices or Edit Devices in the
Admin section and proceed through the wizard to Step 3. Select the option to
“Record an alarm if services are added to or removed from any of these devices”.
Service Alerts
These alerts can be triggered on one or more services within the devices:
- Status Change Alert
Triggered when a service changes state. This is relevant to all services that
have the concept of state, i.e. Ping Test, TCP Port Test and SNMP
Interface test
- Response Time Alert
Each of the services mentioned above involves a poll of some sort,
whether it be a Ping operation, TCP port connection or an SNMP poll.
These services are configured with an expected response time for the
operation. NetWatch can trigger an alert when the response time exceeds a
set multiple of that expected response time.
- Utilisation Alert
You can set network traffic thresholds for the purpose of alerting. The
utilisation alert will trigger when traffic rises above a set percentage
utilisation, either immediately or after the traffic level is sustained over a
specified time period.
27
Page 28

User’s Guide – version 1.6 NetWatch
To add or edit a service alert for a new device, when you get to the Discovery stage
with discovery complete, edit the required devices and select the services on which
you want to configure the alerts. Click Edit Services to show the Configure Services
window. The bottom section of this window deals with alerts. The type of alert shown
depends on the type of services that you are editing. Note that not all alerts apply to
all services so if, for example, you have selected a ping service and an interface
service, the utilisation alert will only apply to the interface service. Click OK when
finished and make sure you click Finish on the device wizard to apply the changes.
To add or edit a service alert for an existing device, go to Edit Devices in the Admin
section. Select the required device and proceed to the final stage where the Available
Services are listed. Select the required services and click Edit Selected Services and
proceed as described above. Once again, when you are finished, make sure to click
Finish on the device wizard to apply the changes.
Receiving Alerts
Once an alert has been triggered, it is recorded in the database. This makes it
immediately available to the alert reports and the NetWatch visuals that include the
device. Alert controllers can then forward the alert to recipients using either Email or
Syslog.
Web Based Reports
Every alert raised is displayed in a report, from where you can acknowledge
the alert. This report is described in further detail in chapter 5. This report is also
available from a visual. If a node is yellow on a visual it has unacknowledged alerts.
Email
These are alerts that are sent to specific users or groups, which are set up for
the specific device or service. Email alerts are sent when an alert is thrown, however
you can set up delays for most alerts and you can also set up alerts only to be thrown
if a number of alerts are generated in a certain time period (throttling).
SMS
These are an extension of email alerts in that you can use an SMTP to SMS
gateway to forward an alert by text message to a GSM mobile phone.
Syslog
The alert message, just as in the email, is forwarded to a specified address as a
syslog message. This is useful for integrating with other enterprise management
software.
28
Page 29

User’s Guide – version 1.6 NetWatch
Setting up Alert Controllers
To set up Alert Controllers go to the Configure Alarms page in the Admin section.
This will give you the following options
SNMP Notification Alerts
Service List Alerts
Response Time Alerts
Status Change Alerts
Utilisation Alerts
The options within each alert controller are always the same. An alert will be handled
by one alert controller, depending on the type of alert indicated by its name. Within
the alert controller configuration, you can set one or both of the two options:
Email Recipient
This allows you to set up a number of email recipients, specifying the SMTP server to
use. If you only have one SMTP server, it makes sense to set the default server in the
System Settings page in the Admin section. If you don’t specify an SMTP server in
the alert controller configuration, this default server will be used. Enter as many email
addresses as required.
Syslog Recipient
This sends the alert to a specified address using the Syslog protocol. You can specify
one or more IP addresses to which the messages will be sent.
29
Page 30

User’s Guide – version 1.6 NetWatch
nd
Chapter 5: The Reporting System
NetWatch prides itself on its ability to report on network status anywhere at anytime.
All NetWatch reports can be viewed through an Internet browser and are 100% web
based. This enables the user to view reports on the move instead of being tied down to
a centralized monitoring machine based in head office or the computer department.
Alerts
NetWatch alert reports show the current alerts triggered by the system. These
are shown when you first open up the reports section. In this section a user can
acknowledge alerts to tell the system they have been viewed and to not send out an
email or SMS alert if not already sent. In this section the user can view
unacknowledged alerts, view acknowledged alerts and view all alerts. You can also
pick a device in the list of devices and choose to view alerts just for this device.
Devices
NetWatch device reports show the status of the devices since last poll by the
NetWatch backend. Here you can see if the device is online or if it is unresponsive.
You can also click on the quick links to try to telnet to the device or to ping it. If you
click on the device name link you will be shown the services for this device.
Services
NetWatch service reports show the status of the services on the device. These
can be interface tests, bandwidth graphs and ping response test results. By default
only managed interfaces or services are shown here, click the show unmanaged to
view all services. For interfaces that are managed and support bandwidth collection
you can click on the link in the tools section to see the bandwidth graph for that
interface.
Utilisation
There are two specific utilisation report types:
1. This utilisation report shows in a tabular format the Current, Average a
Max percentage utilisation values for each device within the last 24 hours.
2. This utilisation report shows the amount of bandwidth each interface of a
certain device used for a certain, month along with the device total for that
month.
Configuration Reports
NetWatch configuration reports show the current, up to the minute
configuration details for a particular device. Simply click on a device name in the list
30
Page 31

User’s Guide – version 1.6 NetWatch
and press the show configuration button. This will show all the managed –
unmanaged interfaces and services on the device in a report format along with its
configured elements, such as alerting options.
Syslog Messages
NetWatch syslog reports show a list of syslog messages received by the
system. The All Syslogs button shows a report on all syslogs received by the system.
You can also click on a device in the list of devices to view a report on Syslogs
received from that device only.
31
Page 32

User’s Guide – version 1.6 NetWatch
Chapter 6: Syslogs
The Syslog protocol is an event notification protocol that allows a machine be it a
Server, Hub, Switch or Router to send event notification messages to ‘event message
collectors’ -also known as ‘Syslog servers’.
Syslogs and NetWatch
NetWatch has its own built in fully featured Syslog server. Any Syslog messages sent
to the NetWatch Server will be stored in a Syslog message event database.
Enabling Syslog Reception
To allow NetWatch to receive syslog messages, turn on the “Use Syslog Receiver”
option on the Admin | System Settings page. The NetWatch service requires a restart
after changing this setting.
Syslog Severity/Priorities and Reporting
Each syslog sent from a device has an encoded severity. These are described in the
following table.
Emergency: System is unusable.
Alert: Action must be taken immediately.
Critical: Critical Conditions.
Error: Error Conditions.
Warning: Warning Conditions.
Notice: Normal but significant condition.
Informational: Informational messages.
Debug: Debug-level messages.
Each one of these severity levels is assigned to a NetWatch priority level as decided
by the administrator in the ‘Syslog Configuration Section’.
Only messages of a certain priority will be viewed and processed by the reporting
system. The ‘Syslog Configuration Section’ can also configure this.
For details of viewing and processing syslog messages refer to Chapter 5 ‘The Reporting System’.
Configuring Devices to Send Syslogs to NetWatch
For Syslogs to be viewed and processed by NetWatch devices must be configured to
send its Syslog messages to the NetWatch Server. Using the CISCO IOS for example
syslogs are sent to the NetWatch Server with the following command:
Logging Hostname or A.B.C.D (IP address of the NetWatch Server)
32
Page 33

User’s Guide – version 1.6 NetWatch
Chapter 7: Utilities
Backing up the database from the web interface
To back up your database from the web front end you need to open the backup control
from the utilities section. This brings up Netwatch Backup screen. Enter in a folder
on the server to backup to, or you can leave this blank and the default folder will be
used. The default folder is set-up in the system settings section and defaults to
“c:\NetWatchbackup”. Once you have either entered a folder or you are happy to use
the default, then you can press the backup button, which will copy the current
database and visuals folder to the backup directory.
This may take some time, as the database can be quite large depending on the amount
of devices in the system. Also make sure you have enough space on the NetWatch
machine to copy the volume of information – ideally, the free space should be much
greater than the side of the MySQL directory and its contents, as the bulk of this will
be backed up in this operation.
Manual backup of maps and database
Optionally you can do a manual backup of the maps and the database. This can be
done by copying the maps folder from the NetWatch\tomcat\webapps folder to a
backup folder. Next, open the MySql\data folder and copy the penknife directory in
the data section to a backup folder.
Restoring from a backup
To restore backed up files, shut down all three services from the NetWatch Service
Manager and copy back over the files. If the backup was a manual one, simply
reverse the process described above. If it was a backup from the NetWatch Backup
page, copy the contents of the database directory to the mysql\data\penknife
directory and copy the entire netwatch backup directory into the live netwatch
directory. Restart the three services and check the NetWatch output log and NetWatch
error log to make sure that the system started up successfully.
NetWatch Security
NetWatch provides the option to apply password protection on the user, operator and
administrator sections of NetWatch. For information on enabling NetWatch
Security see Chapter 9.
Search visuals for specific IP addresses
NetWatch allows you to search for a device by IP address on the system. Go to the
Search page in the Utilities section and specify the IP address and press Enter. A list
33
Page 34

User’s Guide – version 1.6 NetWatch
of maps containing a device with this address will be displayed. The device name
corresponding to that IP address will also be shown.
Setting up a licence
A NetWatch licence is required to run NetWatch continuously. You will receive the
licence, either in a binary file or in ASCII hex code format. To load the licence, go to
the Licensing page in the Utilities section. Depending on the format of the licence:
- Paste in the hex format if that is how you received the licence
and click Decode, or
- Browse to the binary licence file (extension .lic) and click
Load.
The licence details will be displayed on the screen along with an expiry
date, if any. To save this license to the system, click Update to complete
the operation.
Logs
The NetWatch logs provide system administration information and are mainly used
for system maintenance and debugging. These logs can also be found in file form on
the NetWatch server: the NetWatch service logs will be in the \Netwatch directory.
Manual
This is an online PDF version of the NetWatch manual.
Status
The NetWatch Server Status page provides details, which are important to keep track
of for the smooth running of NetWatch. The information supplied includes:
- The time the system was started
- Free Disk Space
- Free Memory
- Total System Memory
- The number of device managed by NetWatch
- The total number of managed services.
Note that, if memory or disk usage runs low, these items will be highlighted in red.
34
Page 35

User’s Guide – version 1.6 NetWatch
Chapter 8: Services, Discovery and Polling
If you are new to configuring NetWatch, please refer to Chapter 2, “Configuration”
for a step-by-step guide to setting up devices before reading this chapter. This chapter
describes in detail the operation and advanced configuration of the various types of
monitoring NetWatch can carry out on a device.
How NetWatch services work
Most of the information gathered by NetWatch about a network is gathered on
a device-by-device basis. Each device on a network, be it a router, switch or
application server offers a number of different services to its users, including network
management stations like NetWatch. These services are things like basic network
connectivity, connections to other networks and applications like web or telnet
servers. Since the services offered by a device are of several different types,
NetWatch handles them differently.
Discovery
Whenever you change the types of service you wish to monitor on a device,
you must discover services on the device. What this does is contact the device to
determine what individual services of each type the device supports. For example,
when a device with an SNMP Interface Test service type is discovered, a service is
created for each interface the device contains.
Each service type can be configured with default properties that are applied to each of
the services it creates. These properties set things like the average and maximum
response times NetWatch should experience when it checks the status of a service on
the device. You can change these properties for some or all of the services after they
have been discovered if you find the defaults are producing too many alerts.
The SNMP Interface Test service
The SNMP Interface Test service type can be added to any device that
supports SNMP. See Appendix B for more information about SNMP. On discovery, a
service is created for each interface the device supports. You may find that many
more services are created than the device has physical interfaces. This can happen for
many reasons; some WAN interfaces are divided into many lower-capacity sub
interfaces; ISDN interfaces are usually reported by a router as separate bearer
channels; virtual dialler interfaces are often detected; and sometimes an interface is
listed by a device more than once on order to provide special management features.
35
Page 36

User’s Guide – version 1.6 NetWatch
This service type is one of the most powerful supported by NetWatch. Along with
testing the status of an interface, a service can be configured to read usage
information for the interface. This allows you to create graphs of bandwidth
utilisation for an interface, and allows the map applet to colour links according to
their percentage utilisation.
When you add the SNMP Interface Test service type there are several options you can
configure to control how the discovered services will work.
Average Response Time: This is the average time in milliseconds you would
expect a successful check of the status and utilisation of a single interface to
take. This is used to decide when to raise an alert that a device is responding
slowly. If you are unsure of this, leave the default value of 200 milliseconds. If
you are monitoring a device across a slow WAN link, or if you experience a
lot of slow response time alerts on the device it may be a good idea to raise
this value.
Maximum Response Time: This is the maximum number of milliseconds
NetWatch will wait for a response from the device before retrying a check or
giving up. After the third timeout NetWatch will stop trying to check the status
of an interface and report a timeout as the status of that interface. You may
find that some interfaces are reporting timeouts and some report a proper
status; this can happen when a device is very busy and is ignoring a lot of the
SNMP requests it receives. You may wish to change this value if you find this
is the case; a shorter maximum response time with a higher number of retries
would be more likely to get a status for each interface (at the expense of
slightly more network traffic).
SNMP Community String: This is the read-only community set up on your
device. Usually a device supporting SNMP will have two communities, which
are rather like passwords, one of which only allows the reading of values and
the other that allows reading and writing of some values. In a great many cases
the community that supports reading only is the default value, “public”. If you
find that the SNMP Interface Test is not working you may need to check this
value. Note that this value belongs to the service type on the device; you can’t
change it for an individual service.
Use Netwatch Server Clock By Default, Netwatch uses the time on the
device being managed to record various time related statistics. This is the ideal
solution in most situations. However on some highly utilised devices the time
reported can be incorrect. In this situation it is advised that you use the time
on the Netwatch server.
36
Page 37

User’s Guide – version 1.6 NetWatch
Test Community: This performs a simple ‘SNMP Get’ to ensure the correct
SNMP community string has been configured for this particular device.
Management Policy: This allows you to decide what tasks will be carried out
by each service created by the agent. You can choose which services are
managed and whether utilisation statistics are gathered. You can easily change
these settings for each service at a later date. The options are:
Use default management settings for new services: The default, this allows
NetWatch to decide how to deal with each newly created service. If this is
selected most services will be managed when created, but some (for example,
ISDN, virtual and dialler interfaces) will be unmanaged. If NetWatch does not
have specific support for the type of device you are setting up then all services
will be managed when created. If this option is selected no newly created
service will collect utilisation information until you choose to collect it.
Manage all new services, but no bandwidth collection: All newly created
services will be managed, but none will collect utilisation statistics. You can
choose which interfaces to collect utilisation statistics for later.
Manage all new services, with bandwidth collection: All newly created
services are managed and those that offer utilisation information will collect it.
Note that choosing this option could cause your database to become enormous
as utilisation information takes up a lot of space.
Don't manage new services: No new service is managed.
The TCP Port Status service
The TCP Port Status service type can be added to any device. On discovery it
scans the device for listening TCP ports within the default “Common Ports” set and
creates a service for each one found. A web server, for example, will have port 80
open for HTTP. Once services are created they are polled regularly to ensure they are
still active. The options for the TCP Port Status Service type are quite straightforward.
The ‘Port Set’ and the contents of a particular ‘Port Set’ that is scanned are
configurable. You can also configure a ‘Range Port Scan’, which scans all ports
within a predefined range.
Average Response Time: As with the SNMP Interface Test, this is the
number of milliseconds a successful check of a port should take. The default is
60 milliseconds since TCP connections can be made or refused very quickly.
If you find that you receive a lot of slow response time alerts you may
consider raising this value.
Maximum Response Time: As with the SNMP Interface Test, this is the
longest NetWatch will wait before giving up on a check and either retrying or
reporting the port as timed out. Note that timed out is different to unavailable;
if a device is working but the server listening to a port has crashed the device
should refuse any request to open a connection to the port rather than ignore it.
37
Page 38

User’s Guide – version 1.6 NetWatch
The Ping Response Test service
This is one of the simplest service types NetWatch supports. On discovery a
single service is created that checks the device is responding to an ICMP echo
request. This is the same test carried out when you use the “ping” command line tool
present in virtually every operating system. The service type allows you to set the
average and maximum response time that will be set in the service when it is created;
if you change these default values at a later date they will have no effect. To change
the average or default response time for the Ping Response Test you must configure
the Ping Response Test service, not the service type.
Response Time Graphing
This can be enabled for both the Ping Response Test and the SNMP Interface
test. It is configured using the configuration screen for the Ping Response Test and
the SNMP Interface test. Once Response time graphing is selected the Response time
graph for each service can be viewed in the Reports section. It is important to note
that response time graphing does use up a lot of extra database space.
The Receive SNMP Notifications service
If a device is configured to send SNMP Notifications, or “Traps” to NetWatch, you
can choose to handle them by adding this service type to the device’s configuration.
See Appendix B for more information about SNMP notifications.
When you add the Receive SNMP Notifications service type to a device you must
specify which of the traps the device sends you wish to record. NetWatch at the
moment supports only the six standard SNMP traps. Every time a trap is received
from a device with the Receive SNMP Notifications service type selected it is
checked against the list of traps selected in the service type. If the trap is selected, it is
recorded.
When services are discovered on a device with the SNMP Notification service type
selected a service is created for each selected trap type. This allows you to alert on
some of the recorded traps. For example you may wish to record link up and link
down traps but alert on a cold start trap.
Configuring services
When you have discovered services on a device it is easy to change their settings from
the defaults provided by the service type. When you select a service or a group of
services to configure you can set most of the values you can set defaults for in the
service type. In addition you can set how often NetWatch polls each service to check
its status, and you can manage or unmanage a service.
38
Page 39

User’s Guide – version 1.6 NetWatch
Chapter 9: Security
Three levels of security are available in NetWatch. Each level allows access to
different NetWatch functions.
Levels of Security
The levels of security are Administrator, Operator and Viewer. The Administrator has
access to all NetWatch functions, including security administration. The Operator can
view network visuals and has full access to all reports. The Viewer can view network
visuals and reports.
Enabling Security
From the Admin menu, select Utilities and then Security. NetWatch comes with
default passwords for each security level, which can be changed as required. Select
the ‘Protect level’ you require the press ‘Ok’.
39
Page 40

User’s Guide – version 1.6 NetWatch
Appendix A: SNMP
SNMP, or Simple Network Management Protocol, is a widely used standard that
allows network management software to query network devices for status and
information regardless of the type of device and the software it runs. The original
SNMP developed in 1988 is defined in RFC 1157, and the current version 3 is fully
backwards compatible. NetWatch uses SNMP version 2c when available; otherwise it
reverts to version 1.
MIBs
The SNMP standard defines a large number of properties organised into a hierarchy
that describes virtually everything about a device that a network manager might want
to know. This hierarchy is called a MIB or Management Information Base. The
SNMP standard defines a large MIB called MIB2; this describes system properties,
routing information, interface status and statistics and a lot more. A large number of
standard extension MIBs exist; the Interface MIB is used by NetWatch when
supported, since it offers better support for high capacity interfaces than the standard
MIB.
SNMP offers a way for hardware and software vendors to supply their own devicespecific information in the form of Enterprise MIBs; most vendors have their own
MIBs in addition to supporting some of the standard MIB.
OIDs
Each value defined in a MIB is referenced by its OID or Object Identifier. This is a
long sequence of numbers separated by dots. Each number in an OID describes a sub
level of the MIB hierarchy, thus the OID for the sysDescr object is 1.3.6.1.2.1.1.1,
which means
iso.org.dod.internet.mgmt.mib-2.system.sysDescr. Most of the standard MIBs you
will come across will be in the mib-2 group, and all of the enterprise MIBs are
underneath iso.org.dod.internet.private.enterprises.
Communities
The original version of SNMP used a very simple secret word scheme to protect the
information available from a device. Most SNMP-compliant devices support two
“communities”, one of which can read the value of any variable in the MIB and one
that also allows setting the values that can be configured. The community is passed to
40
Page 41

User’s Guide – version 1.6 NetWatch
the device with each SNMP request. If you are not sure of the communities on a
particular device a good guess for the read-only community is “public”.
Notifications
A notification or trap is a small message sent by an SNMP agent to a management
station to inform the management station of an event that has just happened. Traps
can be used to reduce the network traffic and load on the device caused by rapidly
polling values. SNMP defines six standard traps that tell when the device is powered
on or soft booted, when a link goes up or down, when an SNMP request has been
received with an invalid community and when a router loses connectivity with a
neighbour. In addition, there are thousands of enterprise-specific traps defined by
equipment and software vendors.
Traps are not reliable; a trap may be lost somewhere between an SNMP agent and a
management station. There is a much less used message called an inform that aims to
solve this problem.
The Windows snmptrap.exe service
Windows NT and 2000 have the ability to receive SNMP traps by using a service
called “SNMP Trap Service”. Older versions of NetWatch made use of this service,
but due to compatibility problems version 1.1.3 and above use a different means of
receiving traps.
If you find that NetWatch does not receive SNMP traps, you may need to disable this
service.
Windows 2000
Ensure you are logged in as an administrator of the machine running NetWatch. Open
My Computer and then Control Panel. In the Control Panel, open “Administrative
Tools” and then “Services”. Find “SNMP Trap Service” in the list, right click it and
choose “Properties”. Choose “Manual” from the list beside “Startup type:”. If the
“Stop” button is not greyed out, click it then click “Ok”.
Windows NT
Ensure you are logged in as an administrator of the machine running NetWatch. Open
My Computer and then Control Panel. In the Control Panel open “Services”. Find
“SNMP Trap Service” in the list and select it. Click the “Startup…” button and select
“Manual” from the set of radio buttons at the top. Click “Ok”. If the “Stop” button is
not greyed out, click it then click “Yes”. Finally, click “Close”.
41
Page 42

User’s Guide – version 1.6 NetWatch
Configuring SNMP on a Cisco Router
The following instructions describe how to configure SNMP on a Cisco router
running IOS.
Care must always be taken when editing router configuration. If in doubt, consult
your network engineer.
1. Telnet to the router:
C:\> telnet <router address>
User Access Verification
Password:<password>
2. Enter enable mode (note that the password may be different to the login
password):
Router>enable
Password:<password>
3. Start configuring from the keyboard:
Router#conf t
Enter configuration commands, one per line. End with CNTL/Z.
4. Add a read only community “public”:
Router(config)#snmp-server community public RO
5. Enable standard SNMP traps:
Router(config)#snmp-server enable traps snmp
6. Add NetWatch as a trap receiver (to send traps with the community “public”):
Router(config)#snmp-server host <address of NetWatch> public
7. Quit config mode:
Router(config)#<CTRL-Z>
8. Store the configuration to flash:
Router(config)#wr mem
Further Information
For further information on SNMP, refer to the following:
42
Page 43

User’s Guide – version 1.6 NetWatch
Cisco Information on SNMP - www.cisco.com/warp/public/535/3.html
43
Page 44

User’s Guide – version 1.6 NetWatch
Appendix B: NetWatch And IIS
NetWatch can be configured to use IIS as its default web server. To achieve
this the following instructions must be completed. We strongly recommend that, if
the IIS server is to be accessible from the internet, that all service packs and
security patches are applied before
information see http://support.microsoft.com
1. Install IIS.
2. Stop Tomcat Service
3. Change the tomcat port to 8080 if it’s running on port 80.
Open /tomcat/conf/server.xml and look for the ‘Normal HTTP’ section a change the
port parameter from 80 to 8080.
4. Double-click isapi_redirect_nt.reg(if you are running NT) or isapi_redirect_200.reg
( if you are running W2K) to import the extra configuration information into your
registry. These files can be found in the following folder: - c:\NetWatch\tomcat.
making the server available. For more
5. Open IIS management console and create a new virtual directory called "jakarta"
and make the physical path "C:\Tomcat\bin". Make sure that this virtual directory has
"Execute" permissions.
6. In the IIS Management Console right-click on your machine name (not the root
web) and select properties. Click the Edit button next to the "Master Properties" for
the WWW Service. Select the "ISAPI Filters" tab and click "Add” Name the filter
"jakarta" and for the executable, browse to C:\NetWatch\Tomcat\bin\isapi_redirect.dll
file.
7. Now go to the control panel, select Services and restart the IIS Admin service
(make sure Word Wide Web Publishing Service restarts as well). After you have
restarted, go back to the ISAPI filters screen and make sure that the jakarta filter has a
green arrow next to it. If it does, then everything is working.
8. In the IIS Management Console right-click on your web root and select properties.
Now go to the Home Directory tab. Set the local path to
c:\NetWatch\tomcat\webapps.
9. In the IIS Management Console right-click on your web root and select properties.
Now go to the Directory Security tab. Click the edit button. Now uncheck the
‘Integrated windows authentication’ checkbox.
10. Restart the tomcat service.
44
Page 45

User’s Guide – version 1.6 NetWatch
11. Due to the security considerations with IIS, we strongly recommend that you
install all of the available IIS security patches available from Microsoft. More
information on this can be found from http://support.microsoft.com
45
Page 46

User’s Guide – version 1.6 NetWatch
Appendix C: Integrating Netwatch and Netflow Tracker
Firstly it is important to note that Netwatch and Netflow Tracker must be
installed on two separate server machines. The integration of the two products is
done thru the use of Netwatch Visuals. Once both Netflow Tracker and Netwatch are
fully configured and your Netwatch visual is complete integration can begin.
The following example will guide you through the process:
1. Two Cisco Router are being monitored by Netwatch and Netflow Tracker.
2. In the Netwatch ‘Edit Visuals’ section each router is plotted on a Visual and the
Serial0 interface is drawn between each node.
3. You now have to find the URL that is used to view the Netflow Tracker Graph for
the Serial0 interface in Netflow.
4. Now that you know the URL for the required Netflow Tracker graph you can use
the ‘Define Actions’ feature in Netwatch to associate the Netflow Tracker graph with
the Correct Netwatch Link. (Define Actions is explained in further detail in Chapter
3).
46
Page 47

User’s Guide – version 1.6 NetWatch
Appendix D: Auto Discovery
Given a starting IP address and appropriate community strings NetWatch will
automatically discover your network and allow you to add devices found as NetWatch
devices.
Netwatch uses 2 different methods to discover your network. One can use one of the
methods individually or you can use both together. These two methods are described
below:
Discovery Methods
CDP Discovery
CDP is a Cisco proprietary protocol. It is used by Cisco routers and switches to
ascertain information about neighbouring routers and switches. CDP is enabled in the
configuration by default.
Route Table Discovery
This method of discovery scans a devices route table to ascertain information about
your network. This method should be used if you have a non-Cisco network.
Discovery Filters
Netwatch Auto discovery can uses filters to limit the scope of the discovery.
These filters let you define the network(s) or address ranges(s) that you are interested
in. Only devices that match the filter(s) will be discovered.
There are two types filters that can be applied:
Network Filters
With this type of filter you specify a Network Address and Network Mask. With this
type of filter only device with this network subnet will be discovered.
E.g.
Network Address: 192.168.34.2
Subnet Mask: 255.255.255.0
With this type of filter only device with the IP address with 192.168.34.X will be
discovered.
47
Page 48

User’s Guide – version 1.6 NetWatch
IP Address Range Filters
With this type of filter only devices within a specified IP address range will be
discovered.
48
Page 49

User’s Guide – version 1.6 NetWatch
Appendix E: Third Party Software
NetWatch makes use of some third party libraries, distributed under various licenses.
jspSmartUpload
This product includes software developed by Advantys (http://www.advantys.com),
distributed under the Advantys Freeware license contract, a copy of which is available
at http://www.jspsmart.com/liblocal/docs/legal.htm#free.
MySQL
NetWatch uses MM.MySQL v2.0.13 for database access, available at
http://sourceforge.net/projects/mmmysql/ . This is distribute under the lesser GNU
public license, a copy of which is available at http://www.gnu.org/licenses/lgpl.html.
Jakarta Tomcat
NetWatch includes software developed by the Apache Software Foundation:
http://www.apache.org.
Jakarta Tomcat v3.2.3 is available at http://jakarta.apache.org/tomcat and is
distributed under the Apache Software License, a copy of which can be found at
http://www.apache.org/LICENSE.
49
 Loading...