

Page 1

ii900/ii910
Acoustic Imager
Users Manual
April 2019 Rev. 1, 9/20
©2019-2020 Fluke Corporation. All rights reserved.
All product names are trademarks of their respective companies.
Page 2

LIMITED WARRANTY AND LIMITATION OF LIABILITY
This Fluke product will be free from defects in material and workmanship for two years from the date of purchase. This warranty does not cover
fuses, disposable batteries, or damage from accident, neglect, misuse, alteration, contamination, or abnormal conditions of operation or handling.
Resellers are not authorized to extend any other warranty on Fluke’s behalf. To obtain service during the warranty period, contact your nearest
Fluke authorized service center to obtain return authorization information, then send the product to that Service Center with a description of the
problem.
THIS WARRANTY IS YOUR ONLY REMEDY. NO OTHER WARRANTIES, SUCH AS FITNESS FOR A PARTICULAR PURPOSE, ARE
EXPRESSED OR IMPLIED. FLUKE IS NOT LIABLE FOR ANY SPECIAL, INDIRECT, INCIDENTAL OR CONSEQUENTIAL DAMAGES OR
LOSSES, ARISING FROM ANY CAUSE OR THEORY. Since some states or countries do not allow the exclusion or limitation of an implied
warranty or of incidental or consequential damages, this limitation of liability may not apply to you.
Fluke Corporation
P.O. Box 9090
Everett, WA 98206-9090
U.S.A.
11/99
THIS PRODUCT IS LICENSED UNDER THE AVC PATENT PORTFOLIO LICENSE FOR THE PERSONAL USE OF A CONSUMER OR OTHER
USES IN WHICH IT DOES NOT RECEIVE REMUNERATION TO (i) ENCODE VIDEO IN COMPLIANCE WITH THE AVC STANDARD (“AVC
VIDEO”) AND/OR (ii) DECODE AVC VIDEO THAT WAS ENCODED BY A CONSUMER ENGAGED IN A PERSONAL ACTIVITY AND/OR WAS
OBTAINED FROM A VIDEO PROVIDER LICENSED TO PROVIDE AVC VIDEO. NO LICENSE IS GRANTED OR SHALL BE IMPLIED FOR ANY
OTHER USE. ADDITIONAL INFORMATION MAY BE OBTAINED FROM MPEG LA, L.L.C. SEE HTTP://WWW.MPEGLA.COM
Fluke Europe B. V.
P.O. Box 1186
5602 BD Eindhoven
The Netherlands
.
Page 3

Table of Contents
Title Page
Introduction . . . . . . . . . . . . . . . . . . . . . . . . . . . . . . . . . . . . . . . . . . . . . . . . . . . . . . . . . . . . . . . . . . . . . . . . . . . . . . . . . . . . . . 1
Contact Fluke . . . . . . . . . . . . . . . . . . . . . . . . . . . . . . . . . . . . . . . . . . . . . . . . . . . . . . . . . . . . . . . . . . . . . . . . . . . . . . . . . . . . 1
Safety Information. . . . . . . . . . . . . . . . . . . . . . . . . . . . . . . . . . . . . . . . . . . . . . . . . . . . . . . . . . . . . . . . . . . . . . . . . . . . . . . . . 1
Before You Start . . . . . . . . . . . . . . . . . . . . . . . . . . . . . . . . . . . . . . . . . . . . . . . . . . . . . . . . . . . . . . . . . . . . . . . . . . . . . . . . . . 2
Terms to Know. . . . . . . . . . . . . . . . . . . . . . . . . . . . . . . . . . . . . . . . . . . . . . . . . . . . . . . . . . . . . . . . . . . . . . . . . . . . . . . . 3
Power On/Off . . . . . . . . . . . . . . . . . . . . . . . . . . . . . . . . . . . . . . . . . . . . . . . . . . . . . . . . . . . . . . . . . . . . . . . . . . . . . . . . . 4
Battery . . . . . . . . . . . . . . . . . . . . . . . . . . . . . . . . . . . . . . . . . . . . . . . . . . . . . . . . . . . . . . . . . . . . . . . . . . . . . . . . . . . . . . 4
Features/Buttons . . . . . . . . . . . . . . . . . . . . . . . . . . . . . . . . . . . . . . . . . . . . . . . . . . . . . . . . . . . . . . . . . . . . . . . . . . . . . . 6
Hand Strap/Neck Strap . . . . . . . . . . . . . . . . . . . . . . . . . . . . . . . . . . . . . . . . . . . . . . . . . . . . . . . . . . . . . . . . . . . . . . . . . . . . . 7
Display . . . . . . . . . . . . . . . . . . . . . . . . . . . . . . . . . . . . . . . . . . . . . . . . . . . . . . . . . . . . . . . . . . . . . . . . . . . . . . . . . . . . . . . . . 7
Menus . . . . . . . . . . . . . . . . . . . . . . . . . . . . . . . . . . . . . . . . . . . . . . . . . . . . . . . . . . . . . . . . . . . . . . . . . . . . . . . . . . . . . . . . . . 8
Capture Mode . . . . . . . . . . . . . . . . . . . . . . . . . . . . . . . . . . . . . . . . . . . . . . . . . . . . . . . . . . . . . . . . . . . . . . . . . . . . . . . . 8
Image . . . . . . . . . . . . . . . . . . . . . . . . . . . . . . . . . . . . . . . . . . . . . . . . . . . . . . . . . . . . . . . . . . . . . . . . . . . . . . . . . . 8
Video . . . . . . . . . . . . . . . . . . . . . . . . . . . . . . . . . . . . . . . . . . . . . . . . . . . . . . . . . . . . . . . . . . . . . . . . . . . . . . . . . . . 8
Capture Analysis Mode . . . . . . . . . . . . . . . . . . . . . . . . . . . . . . . . . . . . . . . . . . . . . . . . . . . . . . . . . . . . . . . . . . . . . . . . . 9
LeakQ™ . . . . . . . . . . . . . . . . . . . . . . . . . . . . . . . . . . . . . . . . . . . . . . . . . . . . . . . . . . . . . . . . . . . . . . . . . . . . . . . . 9
PDQ Mode™ (ii910) . . . . . . . . . . . . . . . . . . . . . . . . . . . . . . . . . . . . . . . . . . . . . . . . . . . . . . . . . . . . . . . . . . . . . . 10
Memory . . . . . . . . . . . . . . . . . . . . . . . . . . . . . . . . . . . . . . . . . . . . . . . . . . . . . . . . . . . . . . . . . . . . . . . . . . . . . . . . . . . . 11
Annotations . . . . . . . . . . . . . . . . . . . . . . . . . . . . . . . . . . . . . . . . . . . . . . . . . . . . . . . . . . . . . . . . . . . . . . . . . . . . . . . . . 11
Text Note . . . . . . . . . . . . . . . . . . . . . . . . . . . . . . . . . . . . . . . . . . . . . . . . . . . . . . . . . . . . . . . . . . . . . . . . . . . . . . . 11
Photo Note. . . . . . . . . . . . . . . . . . . . . . . . . . . . . . . . . . . . . . . . . . . . . . . . . . . . . . . . . . . . . . . . . . . . . . . . . . . . . . 12
Tag Note. . . . . . . . . . . . . . . . . . . . . . . . . . . . . . . . . . . . . . . . . . . . . . . . . . . . . . . . . . . . . . . . . . . . . . . . . . . . . . . . 12
i
Page 4

ii900/ii910
Users Manual
Acoustics . . . . . . . . . . . . . . . . . . . . . . . . . . . . . . . . . . . . . . . . . . . . . . . . . . . . . . . . . . . . . . . . . . . . . . . . . . . . . . . . . . . 13
Show dB Scale: On or Off. . . . . . . . . . . . . . . . . . . . . . . . . . . . . . . . . . . . . . . . . . . . . . . . . . . . . . . . . . . . . . . . . . . 13
Min / Max dB . . . . . . . . . . . . . . . . . . . . . . . . . . . . . . . . . . . . . . . . . . . . . . . . . . . . . . . . . . . . . . . . . . . . . . . . . . . . . 13
High Frequency (ii910) . . . . . . . . . . . . . . . . . . . . . . . . . . . . . . . . . . . . . . . . . . . . . . . . . . . . . . . . . . . . . . . . . . . . . 13
Single Source/Multiple Sources . . . . . . . . . . . . . . . . . . . . . . . . . . . . . . . . . . . . . . . . . . . . . . . . . . . . . . . . . . . . . . 13
Profiles . . . . . . . . . . . . . . . . . . . . . . . . . . . . . . . . . . . . . . . . . . . . . . . . . . . . . . . . . . . . . . . . . . . . . . . . . . . . . . . . . 13
Palette . . . . . . . . . . . . . . . . . . . . . . . . . . . . . . . . . . . . . . . . . . . . . . . . . . . . . . . . . . . . . . . . . . . . . . . . . . . . . . . . . . . . . 14
Markers . . . . . . . . . . . . . . . . . . . . . . . . . . . . . . . . . . . . . . . . . . . . . . . . . . . . . . . . . . . . . . . . . . . . . . . . . . . . . . . . . . . . 14
Settings . . . . . . . . . . . . . . . . . . . . . . . . . . . . . . . . . . . . . . . . . . . . . . . . . . . . . . . . . . . . . . . . . . . . . . . . . . . . . . . . . . . . 14
File format . . . . . . . . . . . . . . . . . . . . . . . . . . . . . . . . . . . . . . . . . . . . . . . . . . . . . . . . . . . . . . . . . . . . . . . . . . . . . . . 14
Date & Time . . . . . . . . . . . . . . . . . . . . . . . . . . . . . . . . . . . . . . . . . . . . . . . . . . . . . . . . . . . . . . . . . . . . . . . . . . . . . 14
Display . . . . . . . . . . . . . . . . . . . . . . . . . . . . . . . . . . . . . . . . . . . . . . . . . . . . . . . . . . . . . . . . . . . . . . . . . . . . . . . . . 14
Localization . . . . . . . . . . . . . . . . . . . . . . . . . . . . . . . . . . . . . . . . . . . . . . . . . . . . . . . . . . . . . . . . . . . . . . . . . . . . . . 14
Factory settings. . . . . . . . . . . . . . . . . . . . . . . . . . . . . . . . . . . . . . . . . . . . . . . . . . . . . . . . . . . . . . . . . . . . . . . . . . . 14
Clear User Data . . . . . . . . . . . . . . . . . . . . . . . . . . . . . . . . . . . . . . . . . . . . . . . . . . . . . . . . . . . . . . . . . . . . . . . . . . 14
Imager Info . . . . . . . . . . . . . . . . . . . . . . . . . . . . . . . . . . . . . . . . . . . . . . . . . . . . . . . . . . . . . . . . . . . . . . . . . . . . . . 14
Test Microphones . . . . . . . . . . . . . . . . . . . . . . . . . . . . . . . . . . . . . . . . . . . . . . . . . . . . . . . . . . . . . . . . . . . . . . . . . 14
Save Diagnostic Information . . . . . . . . . . . . . . . . . . . . . . . . . . . . . . . . . . . . . . . . . . . . . . . . . . . . . . . . . . . . . . . . . 14
Basic Operation. . . . . . . . . . . . . . . . . . . . . . . . . . . . . . . . . . . . . . . . . . . . . . . . . . . . . . . . . . . . . . . . . . . . . . . . . . . . . . . . . . 15
File Transfer . . . . . . . . . . . . . . . . . . . . . . . . . . . . . . . . . . . . . . . . . . . . . . . . . . . . . . . . . . . . . . . . . . . . . . . . . . . . . . . . . . . . 16
Firmware Update. . . . . . . . . . . . . . . . . . . . . . . . . . . . . . . . . . . . . . . . . . . . . . . . . . . . . . . . . . . . . . . . . . . . . . . . . . . . . . . . . 16
Maintenance . . . . . . . . . . . . . . . . . . . . . . . . . . . . . . . . . . . . . . . . . . . . . . . . . . . . . . . . . . . . . . . . . . . . . . . . . . . . . . . . . . . . 17
How to Clean the Case . . . . . . . . . . . . . . . . . . . . . . . . . . . . . . . . . . . . . . . . . . . . . . . . . . . . . . . . . . . . . . . . . . . . . . . . 17
Acoustic Sensor Care . . . . . . . . . . . . . . . . . . . . . . . . . . . . . . . . . . . . . . . . . . . . . . . . . . . . . . . . . . . . . . . . . . . . . . . . . 17
Environmental . . . . . . . . . . . . . . . . . . . . . . . . . . . . . . . . . . . . . . . . . . . . . . . . . . . . . . . . . . . . . . . . . . . . . . . . . . . . . . . 18
Service . . . . . . . . . . . . . . . . . . . . . . . . . . . . . . . . . . . . . . . . . . . . . . . . . . . . . . . . . . . . . . . . . . . . . . . . . . . . . . . . . . . . . 18
Specifications . . . . . . . . . . . . . . . . . . . . . . . . . . . . . . . . . . . . . . . . . . . . . . . . . . . . . . . . . . . . . . . . . . . . . . . . . . . . . . . . . . . 18
ii
Page 5

Introduction
The Fluke ii900/ii910 is an Acoustic Imager (the Product or
Imager) that detects and locates an acoustic signature. These
signatures can indicate leaks in compressed air, compressed gas,
and vacuum systems.
The ii910 also detects electrical discharges as well as leaks.
Examples of these electrical discharges include partial discharge
such as corona, surface tracking, and arcing.
The Imager has an acoustic sensor-array that aligns a soundsource heatmap with the image. The visible-light camera provides
a live-view image of the inspection area. Capture and save still
image files and video files from the inspection for documentation
and reports.
A rechargeable battery powers the Imager. The Imager includes
an external battery charger with power adapter and
country-specific cables.
The Imager has a USB-C port that connects to a PC for file
download and firmware updates.
Contact Fluke
Fluke Corporation operates worldwide. For local contact
information, go to our website: www.fluke.com.
To register your product, view, print, or download the latest manual
or manual supplement, go to our website.
Fluke Corporation
P.O. Box 9090
Everett, WA 98206-9090
+1-425-446-5500
Safety Information
General Safety Information is in the printed Safety Information
document that ships with the Product and at www.fluke.com. More
specific safety information is listed where applicable.
A Warning identifies hazardous conditions and procedures that
are dangerous to the user. A Caution identifies conditions and
procedures that can cause damage to the Product or the
equipment under test.
1
Page 6

ii900/ii910
1
2
6
7
8
9
5
4
3
Users Manual
Before You Start
Table 1 is a list of items included with the Imager. Use the part
numbers to order additional accessories.
Table 1. Standard Equipment
Item Model Number Description Part Number
/
ii900 or ii910 Acoustic Imager NA
BP291 Rechargeable Lithium-ion Battery Pack (x2) 3894688
EDBC290 External Battery Charger/Power Supply with Country-Specific Adapters 5077735
TiX5XX-NECK Neck Strap 4574715
ii900 Hand Strap Hand Strap 5075994
NA USB-C Cable, 1 m (3.3 ft) NA
ii900 Array Covers Acoustic Sensor Covers (includes 1 spare cover) 5075982
CXT1000 Protective/Carry Case 4628917
2
Page 7

Acoustic Imager
Before You Start
Terms to Know
Use this section to familiarize yourself with these terms that are
unique to this Imager and sound pressure measurements.
Decibel (dB) Sound Pressure Level (SPL). The unit of
measurement for changes in sound pressure. Decibel indicates
the level of the sound (against the reference level of sound in air)
and is expressed in terms of dB SPL.
Distance to target. The distance between the leak source and the
acoustic sensor is critical. The decibel level that the Imager can
measure decreases with the square of this distance.
Sound Frequency / Acoustic Frequency / Frequency Band.
The frequency corresponds to the number of sound vibrations/
second and is expressed as Hertz (Hz) or thousands of Hertz
(kHz).
Frequency Range
Audible (up to 20 kHz). The range that human ear can
perceive sounds.
Ultrasonic (above 20 kHz). Certain issues (leaks, electrical
discharges, mechanical failures) generate sound signatures in
ultrasonic ranges. The human ear cannot perceive the
ultrasonic range that the Imager can detect.
Frequency Selection / Frequency Filtering / Selected
Frequency Band. Select a frequency band for measurement and
visualization of sound. When a frequency band is selected, any
sound outside of that range is filtered and not shown or
considered.
Background Noise. The noise that exists in the surroundings that
the microphone sensors detect along with the sound sources of
possible leaks. Generally, background noise is higher in lower
frequencies. In noisy environments, select higher frequencies to
help discriminate the leak sounds.
Frequency / Spectrum Graph. A graphic chart on the display
shows the level of sound detected in all frequency ranges.
Frequency Spike. Spike in the frequency / spectrum graph that
indicates a significant source of sound in this specific frequency. If
this spike is within the frequency selection, the Imager visualizes
the source on the display.
Field-of-View (FOV). What is detected by the Imager at a
particular position and orientation in space.
Sound Reflections. Sound signals reflect, particularly on smooth
and flat surfaces. In certain conditions, the Imager shows on the
display a hot spot from the source of noise and one or more hot
spots from reflections.
LeakQ™. LeakQ is a capture mode that estimates the size of a
leak. LeakQ Scale is a scale from 0 to 10 that is an indication of
the leak size. The Imager calculates a value based on the
measured dB SPL level and the distance value. The distance
value is automatically determined or you input a value with the
display keyboard.
PDQ Mode™. PDQ is a capture mode that evaluates the type and
severity of an electrical discharge. The PD count value is an
indication of the number of pulses that the Imager can detect.
Partial Discharge (PD). PD is a localized dielectric breakdown
that does not completely bridge the electrical insulation between
two conductors under high voltage.
Corona Discharge (CD). CD is a subtype of PD that results from
the ionization of a fluid, gas, or air surrounding a conductor that is
electrically charged at high voltage.
3
Page 8

ii900/ii910
Users Manual
Power On/Off
To turn on the Imager, push and hold >2 s.
To turn off the Imager, push
. Tap OK to continue.
Battery
XW Warning
To prevent personal injury and for safe operation
of the Product:
• Do not put battery cells and battery packs near
heat or fire.
• Do not put in sunlight.
• Do not disassemble or crush battery cells and
battery packs.
• Remove batteries to prevent battery leakage and
damage to the Product if it is not used for an
extended period.
• Connect the battery charger to the mains power
outlet before the charger.
• Use only Fluke approved power adapters to
charge the battery.
• Keep cells and battery packs clean and dry.
Clean dirty connectors with a dry, clean cloth.
W Caution
To prevent damage to the battery:
• Do not expose battery to heat sources or hightemperature environments such as an
unattended vehicle in the sun.
• Do not store the battery on the charger for more
than 24 hours as reduced battery life may result.
• Charge the battery for a two-hour minimum at
six-month intervals for maximum battery life.
Without use, the battery will self-discharge in
approximately six months.
• Always operate in the specified temperature
range.
• Do not incinerate the Product and/or battery.
A Li-ion battery powers the Imager. The Imager includes two
batteries for a quick-change during operation.
The battery charges on the 2-bay charging base. The power
supply powers the charging base. Country-specific adapters are
included.
The battery is tested in accordance with and complies to:
• UN Manual of Tests and Criteria Part III Subsection 38.3
(ST/SG/AC.10/11/Rev.5) – also known as the
UN T19.T8 tests
• EN55022 and EN55024
•FCC part 15B
• UL2054/cUL60950-1
• IEC62133
•ROHS
4
Page 9
Acoustic Imager
A
BC
Before You Start
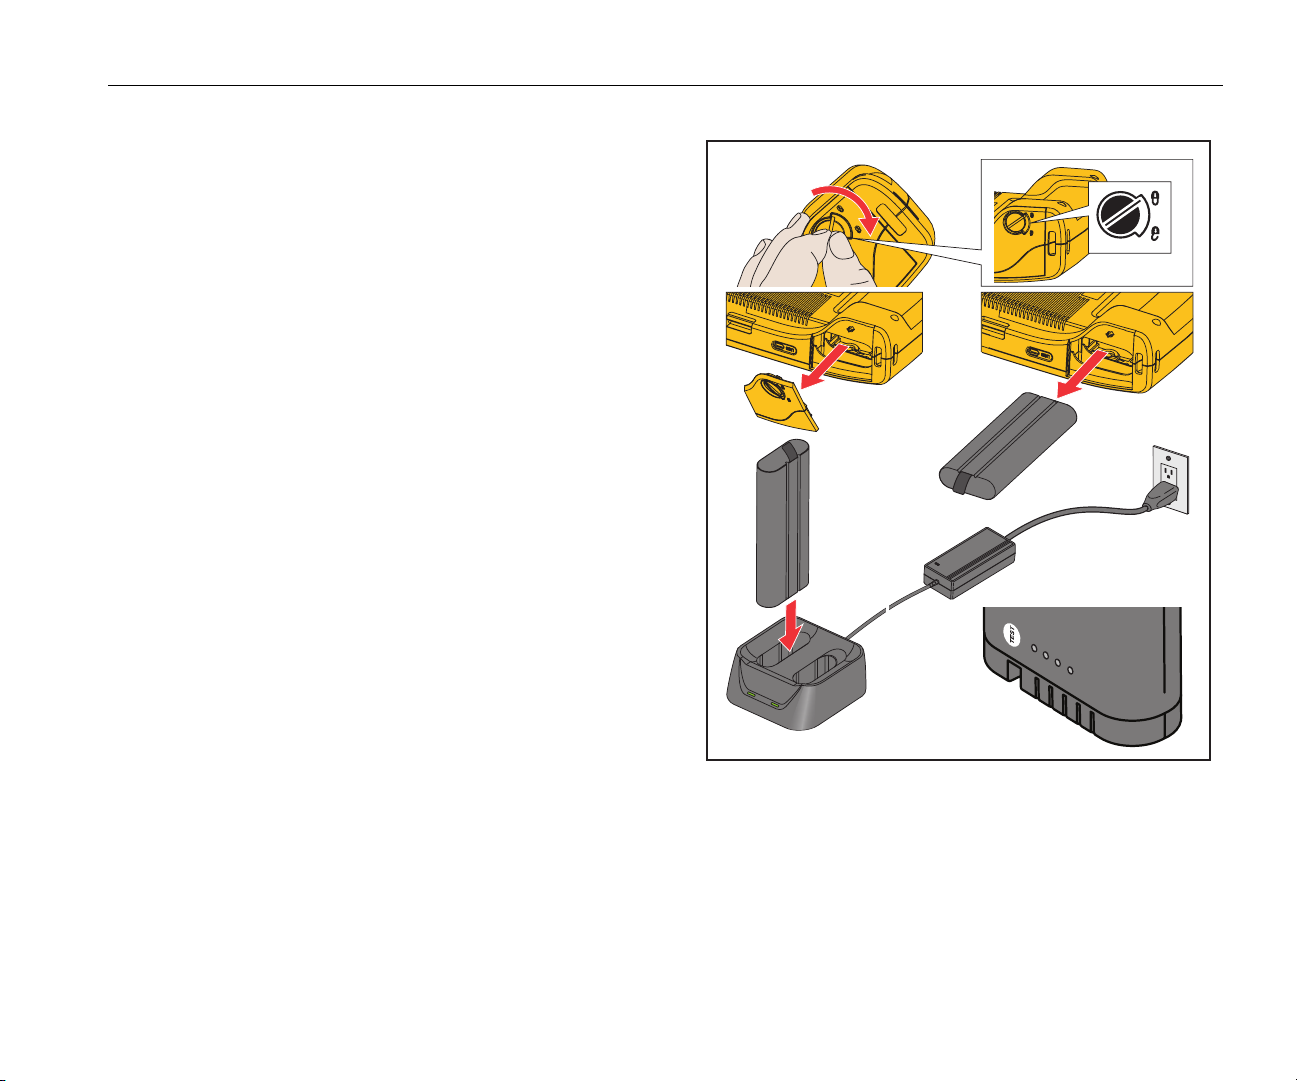
The battery has an indicator with four LEDs (25 %, 50 %, 75 %,
and 100 % charge) and a test button. To check the battery charge,
push
. The LEDs light to show the battery charge level. If all four
LEDs are on, the battery charge is at 100 % of available capacity.
To charge the battery:
1. Connect the ac power supply to the ac wall outlet and connect
the dc output to the charger base. See Figure 1.
2. Put one or two batteries into bay of charger base.
3. Charge battery.
4. Remove battery and push
to check the status.
Note
The charger base automatically charges one battery at
a time.
To install the battery:
1. Open the battery door. See Figure 1.
2. Insert the battery with the contact side first.
3. Replace the battery door. Make sure that the battery tab does
not interfere with the lock and the door is firmly closed.
Figure 1. Battery
5%
%
2
0
%
5
%
75
0
+
10
C
D
T
-
5
Page 10
ii900/ii910
1
2 3 4
5
8 7 6
Users Manual
Features/Buttons
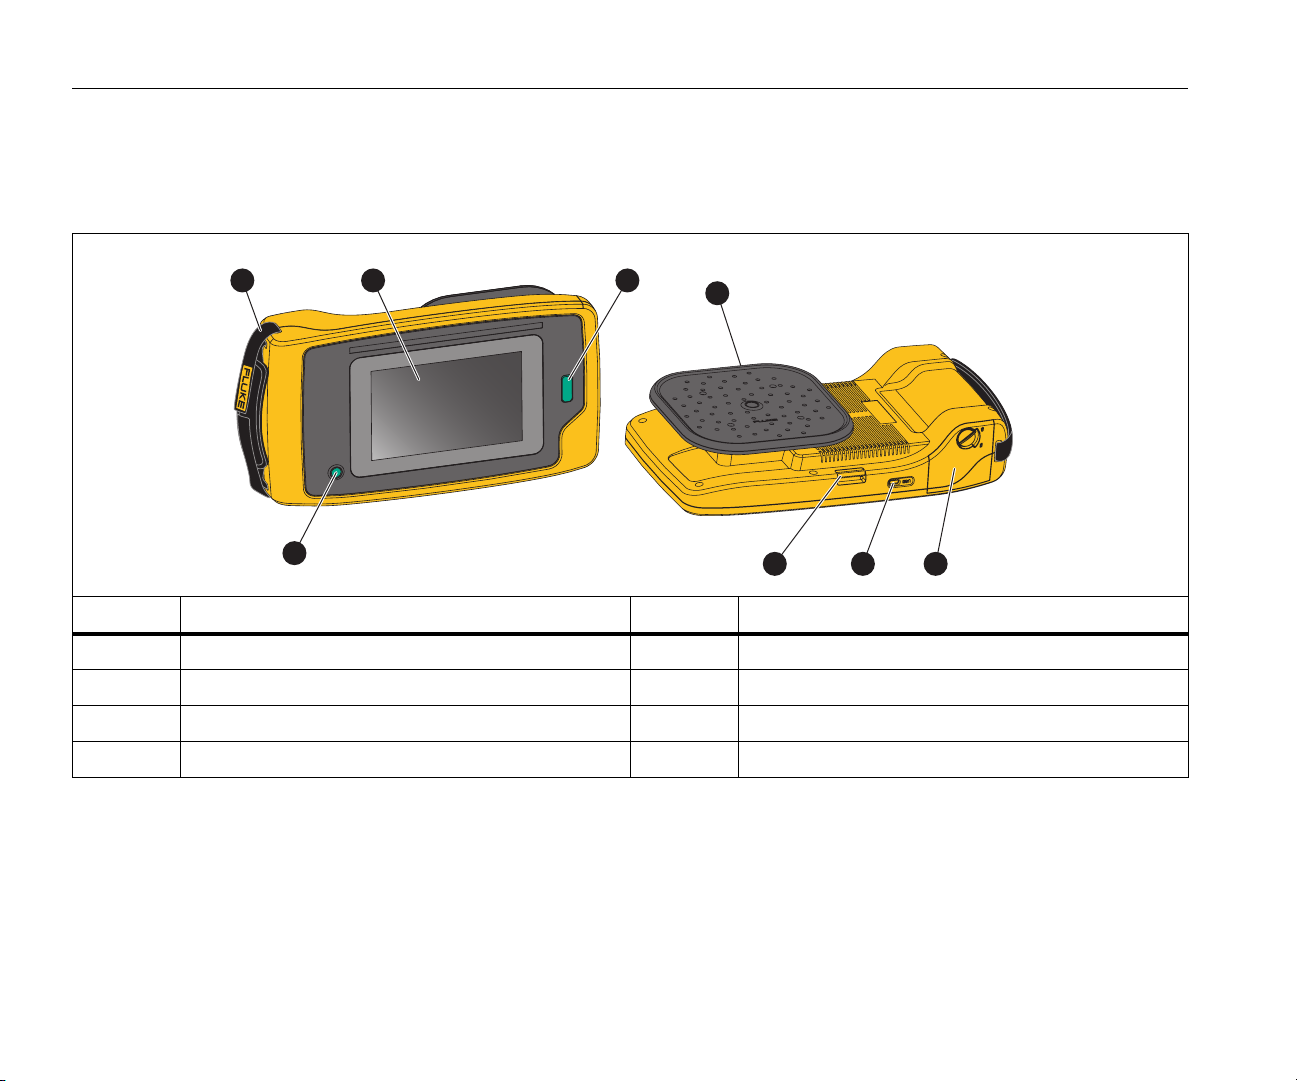
Table 2 is a list of the Imager features.
Table 2. Feature/Control Descriptions
Button Function Button Function
Power On/Off
Hand Strap
Touchscreen Display
Capture Button for Image or Start/Stop Video
6
Acoustic Sensor
Battery Compartment
USB-C Connector
Neck Strap Anchor
Page 11
Acoustic Imager
1
2
3
4
5
6
7
8
Hand Strap/Neck Strap
Hand Strap/Neck Strap
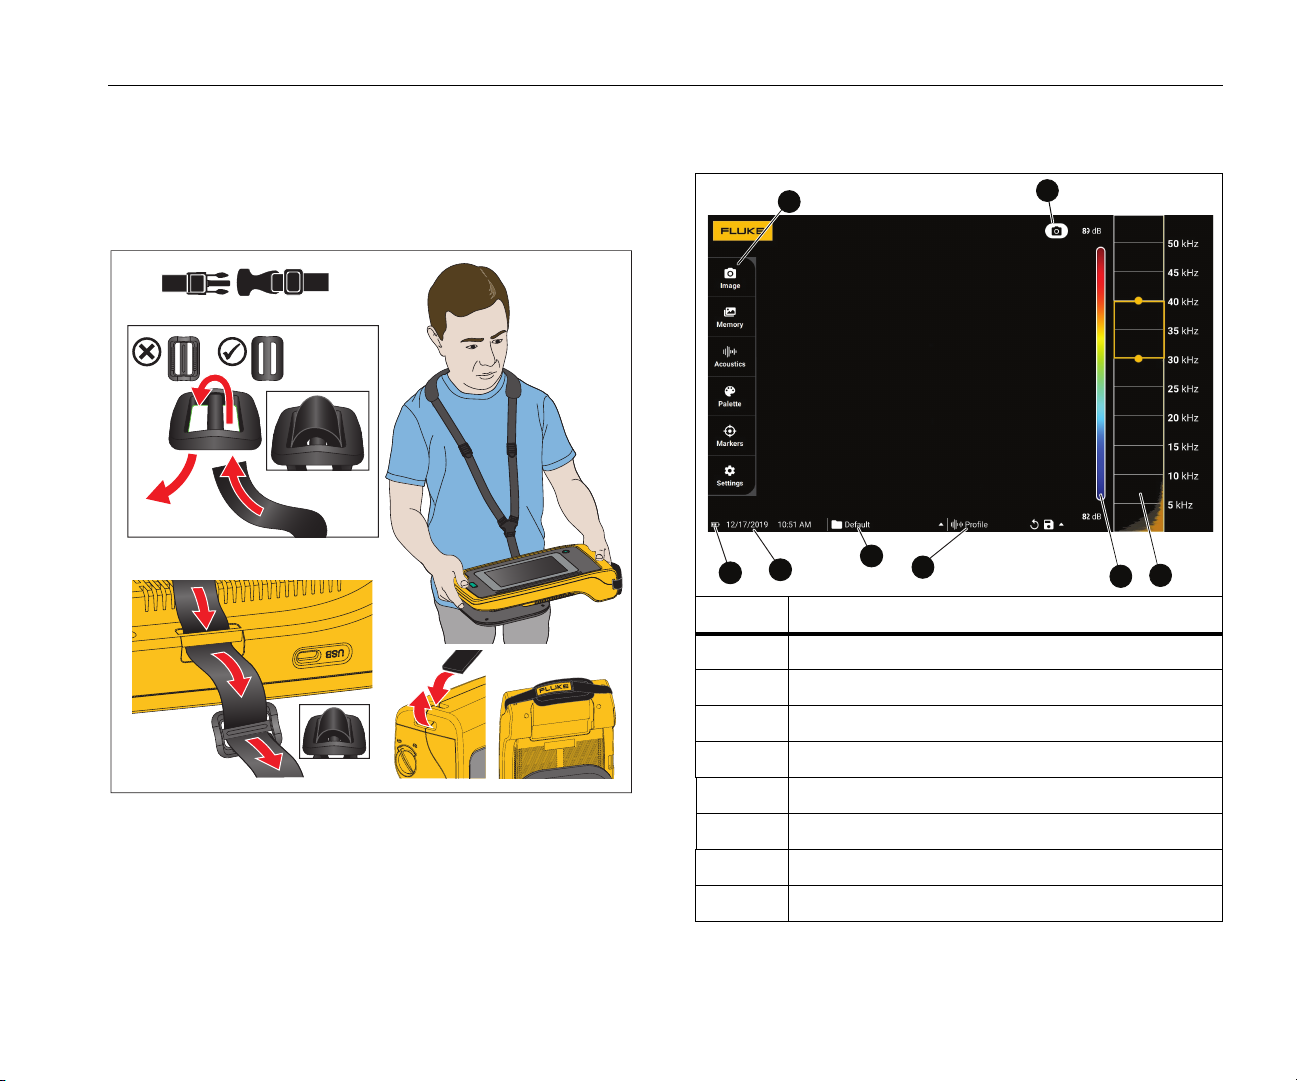
The Imager includes a hand strap and a neck strap that makes it
easy to hold and operate as you take measurements. See Figure 2
for information about setup.
Figure 2. Hand Strap/Neck Strap
Table 3. Touchscreen
Item Description
Tool Menu
Capture Mode
Frequency Range of Spectrum
Palette of dB SPL Scale
Profile Selection (when enabled)
Folder Selection
Time/Date Stamp
Battery Status
Display
The color display is a touchscreen that shows the test area as a
visual image combined with a sound image. See Table 3.
With the touchscreen you are able to set up and adjust all the test
parameters. For more information, see Basic Operation.
7
Page 12

ii900/ii910
Users Manual
Menus
To view the tool menu, tap your finger on the display. This action
reveals the menu for parameter settings. Tap anywhere on the
display outside the menu to hide the menu.
Capture Mode
When you push the Capture button, you save an image of the
scene in the selected mode.
To select the capture mode:
1. Open the tool menu.
2. Tap the Capture Mode icon to open the Capture Mode menu.
3. Tap on the option to select.
The icon on the tool menu and the display change to show the
selected mode.
4. Tap anywhere on the display outside the tool menu to hide the
menu.
Image
Image mode captures a still photo of the scene with overlapping
sound image and saves it in a .PNG or .JPG format.
1. Press the Capture button to save the still photo.
After the image is saved, a small image (thumbnail) shows on
the screen.
2. Tap
Video mode captures a video of the scene with overlapping sound
image and saves it in an .MP4 format.
1. Press the Capture button to start recording.
2. Press the Capture button again to stop recording and save
3. Tap to add notes, photo notes, or tags to the image. See
to add notes, photo notes, or tags to the image. See
Memory for more information.
Video
The elapsed time shows as the Imager records.
the video.
After the video is saved, a small image (thumbnail) shows on
the screen.
Memory for more information.
8
Page 13
Acoustic Imager
Menus
Capture Analysis Mode
When you select the LeakQ™ capture mode, the Imager is able to
capture the leak data for later use to evaluate the type of leak
(quick-disconnect, threaded coupling, hose, open end) and
estimate the size of the leak.
The ii910 also includes the PDQ Mode™ that can capture and
store partial discharge data to estimate the type of partial
discharge (corona, surface/tracking, arcing, and void). The data
includes information for later use to create pulse phase diagrams.
To select the capture analysis mode:
1. Open the tool menu.
2. Tap the Capture Mode icon to open the Capture Mode menu.
3. Tap for the LeakQ mode.
The icon on the tool menu and the display change to show the
selected mode.
ii910 only:
4. Tap for the PDQ-MODE.
Online tools and calculators are available to create reports with
data captures that use the LeakQ and PDQ modes. For more
information, go to:
https://www.fluke.com/en-us/learn/tools-calculators
.
LeakQ™
LeakQ mode automatically determines the distance to the
target (a leak that shows inside the circle on the display).
When a leak is detected and the Imager can determine the
distance, the LeakQ value on the display gives an indication
of the size of the leak. The value is based on the measured dB
SPL value and the distance.
If a leak shows inside the circle on the display:
• Values for DISTANCE and LeakQ Scale show on the
display.
or
• NO TARGET FOUND shows on the display when no leak
is detected inside the circle.
If the Imager cannot automatically determine the distance, this
pop-up message shows on the display:
UNABLE TO ESTIMATE DISTANCE
If the Imager is unable to determine the distance, or you want
to override the estimated distance, you can input the distance
manually.
To input the distance manually:
1. Tap on the message to open a numeric screen and enter
the distance.
The Imager uses the entered distance to calculate the
LeakQ values.
Note
Stabilize the Imager for a few moments as it calculates
the values.
2. Press the Capture button to make a more precise
calculation.
3. If the measured distance requires additional adjustment,
tap the Distance box to update.
9
Page 14

ii900/ii910
Users Manual
4. Press Capture button or Save in the menu.
The Imager saves the still photo of the scene with
overlapping sound image and values in .PNG or .JPG
format. You can add notes, photo notes, or tags to the
image. See Memory for more information.
Note
For best results:
• Move the Imager around the leak to find the
highest LeakQ value. This will best reflect the
actual leak size.
• Obstacles within the circle may influence the
calculated distance and LeakQ value.
• High background noise will influence the calculated
distance and LeakQ value.
PDQ Mode™ (ii910)
PDQ Mode™ captures data from a Partial Discharge (PD) that
enables further analysis such as type of discharge and
severity. The PD must be inside the circle on the display.
When a PD is detected, the PD Count value on the display
gives an indication of the pulses generated by that partial
discharge.
The value is based on the pulses of the acoustic interference
generated by the PD:
• Values for estimated DISTANCE show on the display.
or
• NO TARGET FOUND shows on the display when no PD
is detected inside the circle.
If the Imager cannot automatically determine the distance, this
pop-up message shows on the display:
UNABLE TO ESTIMATE DISTANCE
If the Imager is unable to determine the distance, or you want
to override the estimated distance, you can input the distance
manually. See LeakQ™.
Note
PD Count value is not directly related to the distance.
10
The Imager saves the still photo of the scene with overlapping
sound image and values in .PNG or .JPG format. You can add
notes, photo notes, or tags to the image. See Memory for
more information.
Page 15
Acoustic Imager
Menus
Memory
The Memory menu shows an overview of all saved files with a
thumbnail image. Each thumbnail includes an icon to indicate the
file type:
Image
Video
LeakQ
PDQ Mode
To view a file, tap on the thumbnail once to open the file on the
display.
To delete a single image file:
1. Tap on the image once to open the file on the display.
2. Tap to delete the file.
To delete multiple image files:
1. Tap and hold an image file.
The mode changes to multi-file selection.
2. Tap all files to delete.
3. Tap
An icon also identifies the annotation type. When the file includes
an annotation, the icon changes to include a yellow dot.
(see top right of the display) to delete multiple files.
Annotations
You have 2 methods to access the annotation menu:
• after a capture (image or video), tap on the small thumbnail
that shows on the bottom left corner
• tap on any capture (image or video) to go to the Memory
Menu
The annotation menu on the left side of the screen shows the
types of notes. Each note is identified with an icon. These icons
include a yellow dot when annotation data is available.
Text Note
You can add additional information to files with Text Note.
To add a text note:
1. Tap on the image thumbnail to open the file on the display.
2. Tap
3. Tap
To Delete a text note:
1. Tap on the image file to open the file on the display.
2. Tap
3. Tap to delete the note.
to edit a note.
x or the Close Keyboard icon.
to edit a note.
11
Page 16

ii900/ii910
Users Manual
Photo Note
A Photo Note is an additional photo attached to the file. Examples
include a photo of a label or location that adds additional
information about the file.
To add a Photo Note:
1. Tap on the image file to open the file on the display.
2. Tap
3. Tap
4. Push the Capture button to take the Photo.
5. Tap
To Delete a Photo Note:
1. Tap on the image file to open the file on the display.
2. Tap
3. Tap on the Photo Note icon you want to delete.
4. Tap
to open the Photo Note Menu.
+ to open the Camera view.
The Imager adds the photo as a note.
< to close the Photo Note menu.
to open the Photo Note Menu.
to delete the Photo Note.
Tag Note
A Tag Note is a set of predefined fields attached to a file. These
fields store data about the file that is useful for comparison and
evaluation.
To add a Tag Note:
1. Tap on the image thumbnail to open the file on the display.
2. Tap
3. Tap on one or multiple tags you want to add.
Tags are useful to identify categories such as general, leak,
and electrical.
4. Tap to close the Tag Note menu.
to open the Tag Note Menu.
12
Page 17

Acoustic Imager
Menus
Acoustics
The Acoustics menu shows all the available settings for
adjustment.
Show dB Scale: On or Off
You can choose to show or hide the dB scale. Turn off the dB
scale to see a larger visual area on the display.
Min / Max dB
The minimum/maximum decibel (dB) settings determine the sound
level (intensity) that shows on the SoundMap. Decibel level
thresholds help you to visualize leaks in challenging conditions, for
example, very small leaks or a lot of background noise in the same
frequency range as a leak. For more information, see Profiles.
Auto: Automatically adjusts the Color Palette Scale to the
minimum/maximum decibel value for the received sound pressure.
Manual: The Color Palette Scale is a user-defined minimum/
maximum decibel value. Levels above the maximum value show
on the display with the same color as the maximum value. Levels
below the minimum value do not show on the display.
When Manual is selected, use the +/- to adjust. Or, tap on the
dB SPL scale and use the slider to manually adjust the minimum
and maximum in decibel values of the Color Palette Scale.
High Frequency (ii910)
Toggle between the standard frequency range up to 52 kHz and
the expanded frequency range up to 100 kHz.
Single Source/Multiple Sources
The Single Source mode shows less noise and reflection on the
display. Smaller leaks or partial discharges do not show when they
are close together with larger leaks or PD in the same field of view.
The Multiple Sources mode will not mask smaller leaks or partial
discharges when they are in presence of larger leaks or PD. When
in Multiple Sources mode, several markers show on the display to
indicate the peak dB level of any detected source of sound.
Note
The central marker does not show on the display in the
Multiple Sources mode.
Profiles
Profiles allow you to reuse the manual settings such as Frequency
band, Max dB scale and Min dB scale, and Palette.
On: A preset profile is active. The icon in the center bottom of the
display allows you to select a profile or save the current settings as
a profile.
Off: Turn off the preset profile.
Note
When you turn on and turn off the Imager, the settings
for Frequency Band, Max dB, Min dB, and Palette
reset to the values in the selected profile, not the
current settings when the unit is turned off. If no profile
is selected when the Imager is turned off, the Imager
uses the factory-default profile.
13
Page 18

ii900/ii910
Users Manual
Palette
Select the palette for the acoustic image. The color palettes offer
an equal, linear presentation of colors for the best presentation of
data detail. Or you can switch the live visual camera to greyscale
mode.
Markers
When the Centerpoint Marker is On, the dB level of the
Centerpoint shows on the display as value on the center of the
display.
Note
The display shows the dB value of the selected
frequencies as received in the center of the Field-ofView. This is not the dB value of the sound source.
Settings
The Settings menu shows all the available settings for adjustment.
File format
• set image format (JPEG or PNG)
• set video format (MP4 format)
Date & Time
• set date and format
• set time and format
Display
• turn on or turn off the display logo
Localization
• select language
• set decimal separator to point or comma
• set units of measurement
Factory settings
• reset the unit to factory settings
• clear all images, videos, and user data
Clear User Data
• delete all saved images, videos, and profiles
Imager Info
• firmware version
• hardware version
Test Microphones
• verify the correct operation of the microphones
Save Diagnostic Information
• use at request of Fluke Customer Service to save diagnostic
information
Note
The diagnostic info file is saved in the Imager memory
at /User Data/DiagnosticInfo/.
14
Page 19
Acoustic Imager
1
2
3
4
Basic Operation
Basic Operation
Table 4. Frequency Band Adjustment
The Imager works much like a point-and-shoot camera.
W Caution
Do not place hand on or obstruct the acoustic
sensor. Always use the sensor cover when the
Product is not in use.
1. Remove the sensor cover before use.
2. Push and hold
>2 s.
3. Aim the Imager at the test area.
Ideal distance is 1 m to 8 m (3 ft to 26 ft). With good
line-of-sight, >8 m to ≤21 m (>26 ft to ≤70 ft).
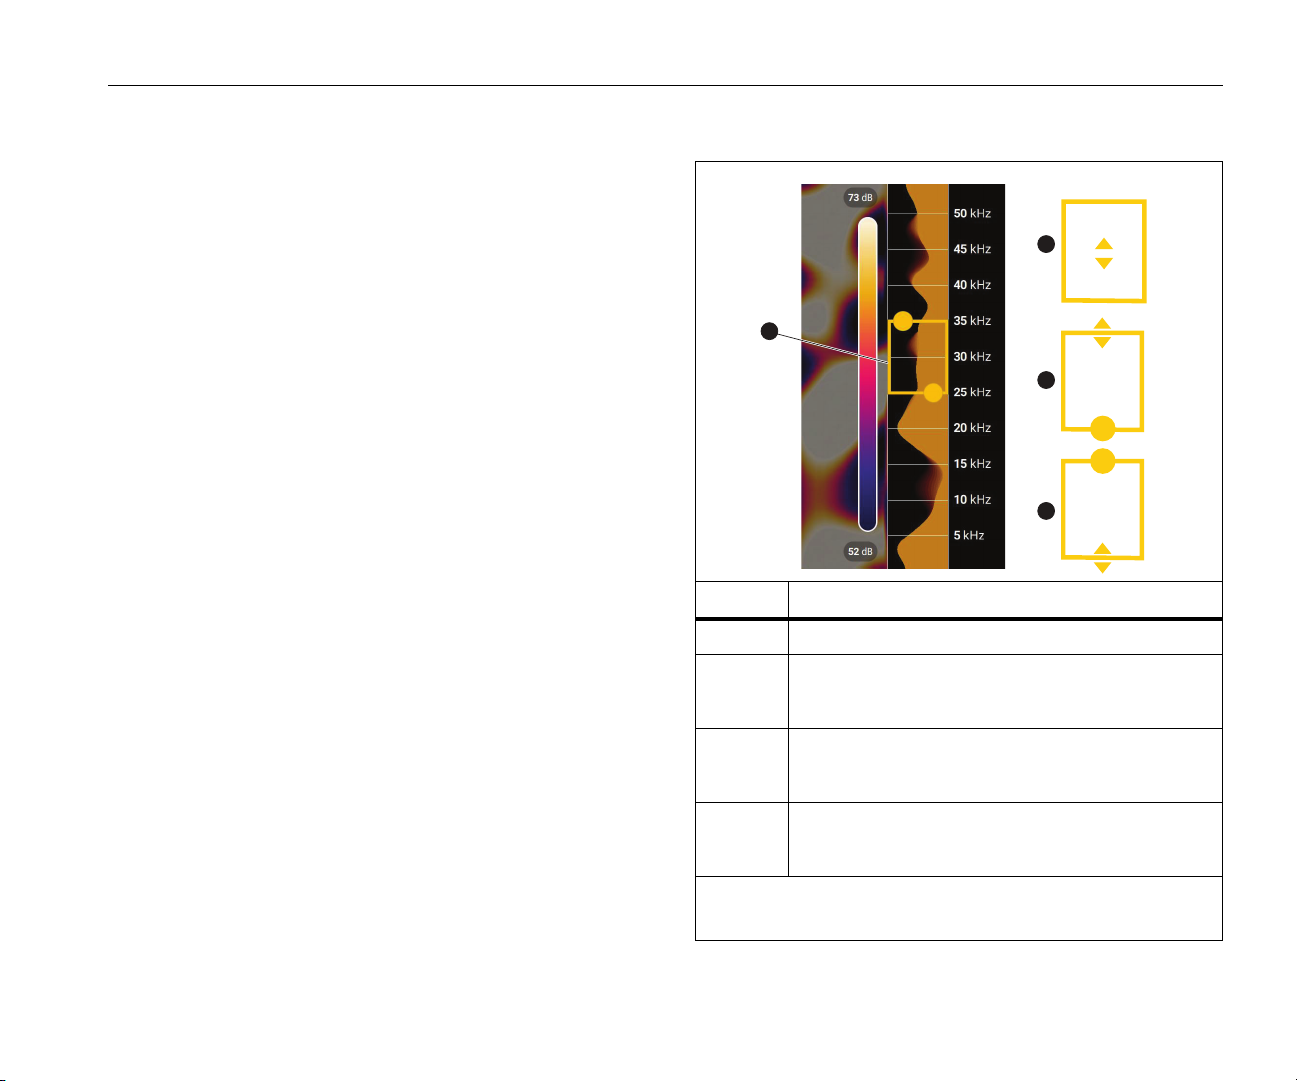
4. Select a band on the frequency spectrum on the right side of
the display. See Table 4.
5. Change the width of the band by sliding the edges or move by
sliding the middle of the band.
6. The optimum band depends on the environment and
application. As an example for finding air or gas leaks, start
with a band at 35 kHz and width that spans 5 kHz.
Item Description
Note
High frequency peaks within the selected band may be
caused by sources other than a leak or partial
discharge. In this case, move the band to another
frequency range.
If a strong source of sound is off the field-of-view, the display
shows a circular pattern (flower) of hot spots on the
SoundMap. In this case, scan around for the source of
sound.
Frequency Band
Move within the Spectrum: Touch center of box until
arrows show. Slide the box up and down to move
the frequency range.
Adjust high end: Touch upper edge of box until
arrows show. Slide edge up to change high end of
the frequency range.
Adjust low end: Touch lower edge of box until
arrows show. Slide edge down to change low end of
the frequency range.
Maximum Frequency Range:
ii900 ...........52 kHz
ii910 ........... 100 kHz
15
Page 20

ii900/ii910
Users Manual
7. When the area of interest clearly shows, push the Capture
button. The Imager saves the image to memory.
Tip: Sound signals reflect, particularly on smooth and flat
surfaces. In certain conditions, the Imager shows a steady spot on
the source of noise and one or more steady spots from the
reflections. Move the Imager around to help discriminate the sound
source from the reflections. The sound source remains in the same
location, while reflections will move.
Use folders to organize your files. New file captures save to the
folder name that shows on the display. You have the option to
review files by folder name or timestamp.
To select a folder or create a new folder name:
1. Tap on the folder name that shows at the bottom of the
display.
A list of folder names pops up with the option, Create Folder.
2. When you select Create Folder, use the keyboard to input a
new file name.
For more information about how to view the images in memory,
see Memory.
File Transfer
To transfer saved files from the Imager to a PC:
1. Use the provided USB cable to connect the Imager to the PC.
A USB drive is added to the list of drives on your PC.
2. Open the added USB drive to view the saved images or video
files.
3. Copy the files you want to the local PC drive.
4. When transfer is complete, remove the USB drive from your
PC.
Firmware Update
Firmware updates are available for the Imager. Connect the
Imager to Fluke Connect Desktop or go to www.fluke.com
the most current firmware version.
To update with Fluke Connect Desktop:
1. Use the provided USB cable to connect the Imager to a PC
with the current version of Fluke Connect Desktop software
installed.
Fluke Connect Desktop software detects the connected
Imager, checks the firmware version, and updates the Imager
if a newer firmware version is available.
Fluke Connect Desktop requires an Internet connection to
download a new firmware version.
The Imager shows a popup message to confirm the update.
2. Tap YES to confirm and start the firmware update.
The Imager shows a popup message to restart the Imager.
3. Tap YES to restart the Imager.
to find
16
Page 21

Acoustic Imager
Maintenance
To update with a .swu file:
1. Download the firmware update (.swu file) from the Fluke
website to a PC.
2. Use the provided USB cable to connect the Imager to the PC
with the new firmware update file.
A USB drive is added to the list of drives on your PC.
3. Copy the firmware update file (.swu) from the PC to the root
folder (/User Data/) of the added USB drive.
4. When the file copy is complete, safely remove the USB cable
from your PC.
The Imager shows a popup message to inform you that a
firmware update is found.
5. Tap YES to confirm and start the firmware update.
The Imager shows a popup message to restart the Imager.
6. Tap YES to restart the Imager.
Maintenance
The Imager does not require routine maintenance.
W Caution
The optical surfaces of the lens are equipped with
high-quality optical layers. Avoid any contact with
these surfaces and protect these surfaces against
dirt and damage.
How to Clean the Case
Clean the case with a clean, damp cloth. Do not use abrasives,
isopropyl alcohol, or solvents to clean the case or lens/window.
Acoustic Sensor Care
W Caution
The Imager has highly-sensitive acoustic
sensors. Do not expose the sensors to water or
fluids, dust, and other contaminates.
Accumulation of these in the sensor will affect the
performance.
Always keep the Acoustic Sensor protected with the provided
cover when the Imager is not in use. Avoid grease or liquids on the
microphones. If the microphones are dirty or clogged, carefully
clean with low air pressure from a compressed air duster at 25 cm
to 30 cm (10 in to 12 in) distance. Avoid too much air pressure.
To check the microphones:
1. Go to Settings menu.
2. Select Test Microphones.
If you see a warning message for service:
1. Clean the microphones with an air duster.
2. Test the microphones again. If the message continues,
contact a Fluke Service Center. See Contact Fluke for more
information.
17
Page 22

ii900/ii910
Users Manual
Environmental
This Imager has electronic printed circuit boards. These
components must be disposed of specifically when the device is at
the end of its use.
The manufacturer offers to take back the Imager from the
customer to ensure that the device is disposed of in an
environmentally-friendly manner when it is at the end of its use.
See Contact Fluke for more information.
Service
An authorized Fluke Calibration service center should service the
Imager at two-year intervals to maintain optimum performance.
Contact your equipment distributor or authorized Fluke Calibration
Service Center for any equipment performance failure or to
schedule regular maintenance service. See Contact Fluke for
more information.
Specifications
Complete specifications are at www.fluke.com. See the ii900/ii910
Product Specifications.
18
 Loading...