

Page 1

Fluke 192/196/199
ScopeMeter
Users Manual
4822 872 00983
October 2000, Rev.2, 2/ 01
© 2000 Fluke Corporation. All rights reserved. Printed in the Netherlands.
All product names are trademarks of their respective companies.
Page 2
Page 3

LIM ITED WARRANTY & LIM ITATION OF LIABILITY
Each Fluke product is warranted to be free from defects in material and workmanship under normal use and service. The warranty period is three years
and begins on the date of shipment. Parts, product repairs and services are warranted for 90 days. This warranty extends only to the original buyer or end-user
customer of a Fluke authorized reseller, and does not apply to fuses, disposable batteries or to any product which, in Fluke’s opinion, has been misused, altered,
neglected or damaged by accident or abnormal conditions of operation or handling. Fluke warrants that software will operate substantially in accordance with its
functional specifications for 90 days and that it has been properly recorded on non-defective media. Fluke does not warrant that software will be error free or
operate without interruption.
Fluke authorized resellers shall extend this warranty on new and unused products to end-user customers only but have no authority to extend a greater or
different warranty on behalf of Fluke. Warranty support is available if product is purchased through a Fluke authorized sales outlet or Buyer has paid the
applicable international price. Fluke reserves the right to invoice Buyer for importation costs of repair/replacement parts when product purchased in one country
is submitted for repair in another country.
Fluke’s warranty obligation is limited, at Fluke’s option, to refund of the purchase price, free of charge repair, or replacement of a defective product which is
returned to a Fluke authorized service center within the warranty period.
To obtain warranty service, contact your nearest Fluke authorized service center or send the product, with a description of the difficulty, postage and insurance
prepaid (FOB Destination), to the nearest Fluke authorized service center. Fluke assumes no risk for damage in transit. Following warranty repair, the product
will be re turned to Buyer, transportation prepaid (FOB Destination). If Fluke determines that the failure was caused by misuse, alteration, accident or abnormal
condition of operation or handling, Fluke will provide an estimate of repair costs and obtain authorization before commencing the work. Following repair, the
product will be returned to the B uyer transportation prepaid and the Buyer will be billed for the repair and return transportation charges (FOB Shipping Point).
THIS WARRANTY IS BUYER’S SOLE AND EXCLUSIVE REMEDY AND IS IN LIEU OF ALL OTHER WARRANTIES, EXPRESS OR IMPLIED, INCLUDING BUT
NOT LIMITED TO ANY IMP LIED WARRANTY OF MERCHANTABILITY OR FITNESS FOR A PARTICULAR PURPOSE. FLUKE SHALL NOT BE LIABLE FOR
ANY SPECIAL, INDIRECT, INCIDENTAL OR CONSEQUENTIAL DAMAGES OR LOSSES, INCLUDING LOSS OF DATA, WHETHER ARISING FROM BREACH
OF WARRANTY OR BASED ON CONTRACT, TORT, RELIANCE OR ANY OTHER THEORY.
Since some countries or states do not allow limitation of the term of an implied warranty, or exclusion or limitation of incidental or consequential damages, the
limitations and exclusions of this warranty may not apply to every buyer. If any provision of this Warranty is held invalid or unenforceable by a court of competent
jurisdiction, such holding will not affect the validity or enforceability of any other provision.
Fluke Corporation, P.O. Box 9090, Everett, WA 98206-9090 USA, or
Fluke Industrial B.V., P.O. Box 90, 7600 AB, Almelo, The Netherlands
Page 4

SERVICE CENTERS
To locate an authoriz ed s ervice center, visit us on the W or ld Wide Web:
http://www.fluke.com
or call Fluke using any of the phone numbers list ed below:
+1-888-993-5853 in U.S .A. and Canada
+31-40-2675200 in Europe
+1-425-356-5500 fr om other countries
Page 5

Table of Contents
Chapter Title Page
Unpacking the Test Tool Kit...................................................................................... 2
Safety Infor m at ion: Read First .................................................................................. 4
1 Using The Scope.................................................................................................... 7
Powering the Test Tool............................................................................................. 7
Resetting the Test Tool............................................................................................ 8
Navigating a Menu ................................................................................................... 9
Hiding Key Labels and Menus .................................................................................. 10
Input Connections .................................................................................................... 10
Making Scope Connections...................................................................................... 11
Displaying an Unknown Signal with Connect-and-View™.......................................... 12
Making Automatic Scope Measurements .................................................................. 13
Freezing the Screen................................................................................................. 14
Using Average, Persistence and Glitch Capture........................................................ 15
Acquiring Waveforms............................................................................................... 18
Analyzing Waveforms............................................................................................... 20
i
Page 6

Fluke 192/196/199
Users Manual
2 Using The Multimeter.............................................................................................. 21
Making Meter Connections........................................................................................ 21
Making Multimeter Measurements............................................................................. 22
Freezing the Readings .............................................................................................. 25
Selecting Auto/Manual Ranges.................................................................................. 25
Making Relative Measurements................................................................................. 26
3 Using The Recorder Functions............................................................................... 27
Opening the Recorder Main Menu............................................................................. 27
Plotting Measurements Ov er Time ( Tr endPlot™)....................................................... 28
Recording Scope Waveforms In Deep Memory ( Scope Record™)............................. 31
Analyzing a TrendPlot or Scope Record .................................................................... 34
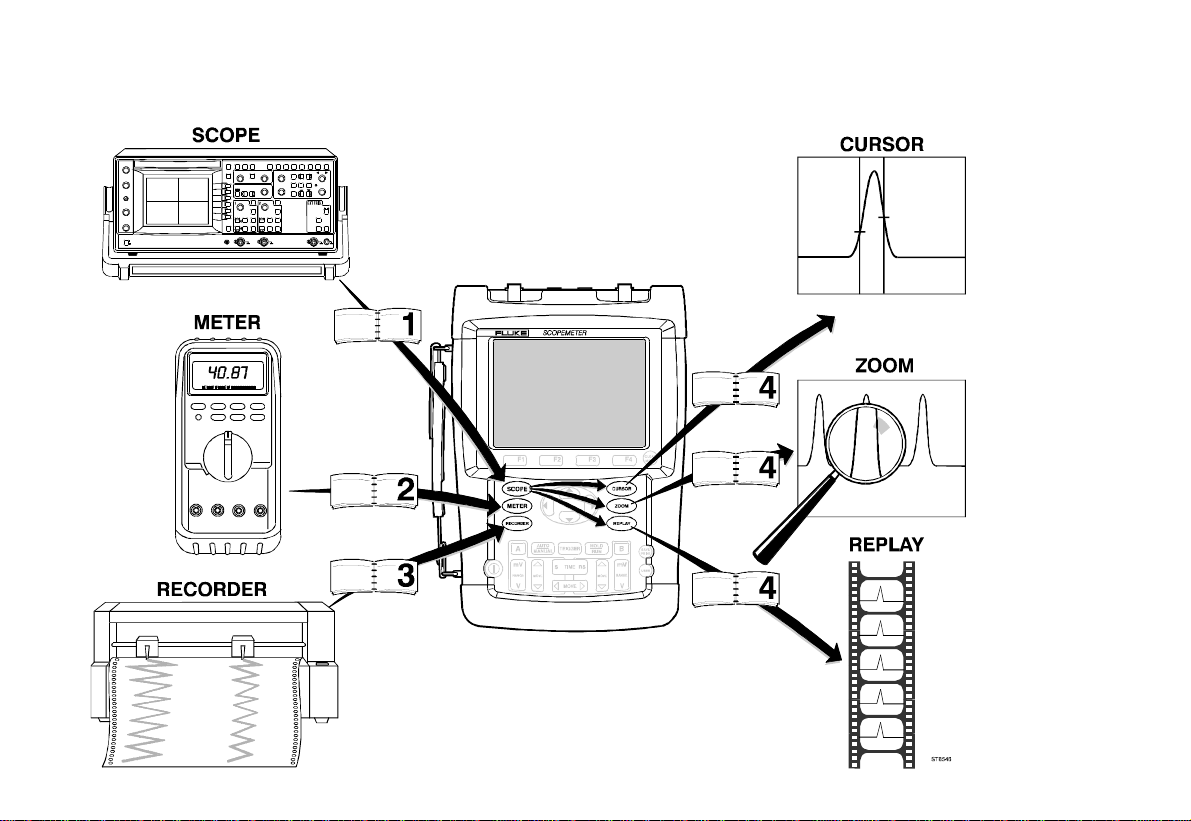
4 Using Replay, Zoom and Cursor s .......................................................................... 35
Replaying the 100 Most Recent Scope Screens ........................................................ 35
Zooming in on a Waveform....................................................................................... 38
Making Cursor Measurements................................................................................... 40
5 Triggering on W avef or m s ....................................................................................... 43
Setting Trigger Level and Slope................................................................................. 44
Using Trigger Delay or Pre-trigger............................................................................. 45
Automatic Trigger Options......................................................................................... 46
Triggering on Edges.................................................................................................. 47
Triggering on External Waveform s ............................................................................ 50
Triggering on Video Signals....................................................................................... 51
Triggering on Pulses ................................................................................................. 53
ii
Page 7

Contents (continued)
6 Using Memory, PC and Printer .............................................................................. 57
Saving and Recalling................................................................................................ 57
Documenting Screens .............................................................................................. 61
7 Tips......................................................................................................................... 65
Using the Standard Accessories............................................................................... 65
Using the Independently Floating Isolated Input s ...................................................... 68
Using the Tilt Stand.................................................................................................. 70
Resetting the Test Tool............................................................................................ 70
Suppressing Key Labels and Menu’s........................................................................ 70
Changing the Information Language ......................................................................... 71
Adjusting the Contrast and Brightness ...................................................................... 71
Changing Date and Time.......................................................................................... 72
Saving Battery Life................................................................................................... 73
Changing the Auto Set Options................................................................................. 74
8 Maintai ni ng t he Test Tool ...................................................................................... 75
Cleaning the Test Tool.............................................................................................. 75
Storing the Test Tool................................................................................................ 75
Charging the Batteries.............................................................................................. 76
Extending Battery Oper at ion Time ............................................................................ 77
Replacing the NiMH Battery Pack BP190.................................................................. 78
Calibrating the Voltage Probes ................................................................................. 78
Displaying Calibration Information............................................................................. 80
Parts and Accessories.............................................................................................. 80
Troubleshooting........................................................................................................ 85
iii
Page 8

Fluke 192/196/199
Users Manual
9 Specifications ......................................................................................................... 87
Introduction............................................................................................................... 87
Dual Input Oscillosc ope............................................................................................. 88
Automatic Scope Measurements............................................................................... 90
Meter........................................................................................................................ 94
DMM Measurements on M et er I nput s........................................................................ 94
Recorder................................................................................................................... 96
Zoom, Replay and Cursors........................................................................................ 97
Miscellaneous........................................................................................................... 97
Environmental........................................................................................................... 99
Safety....................................................................................................................... 100
10:1 Probe................................................................................................................ 101
Electromagnetic Immunit y ......................................................................................... 103
Index
iv
Page 9

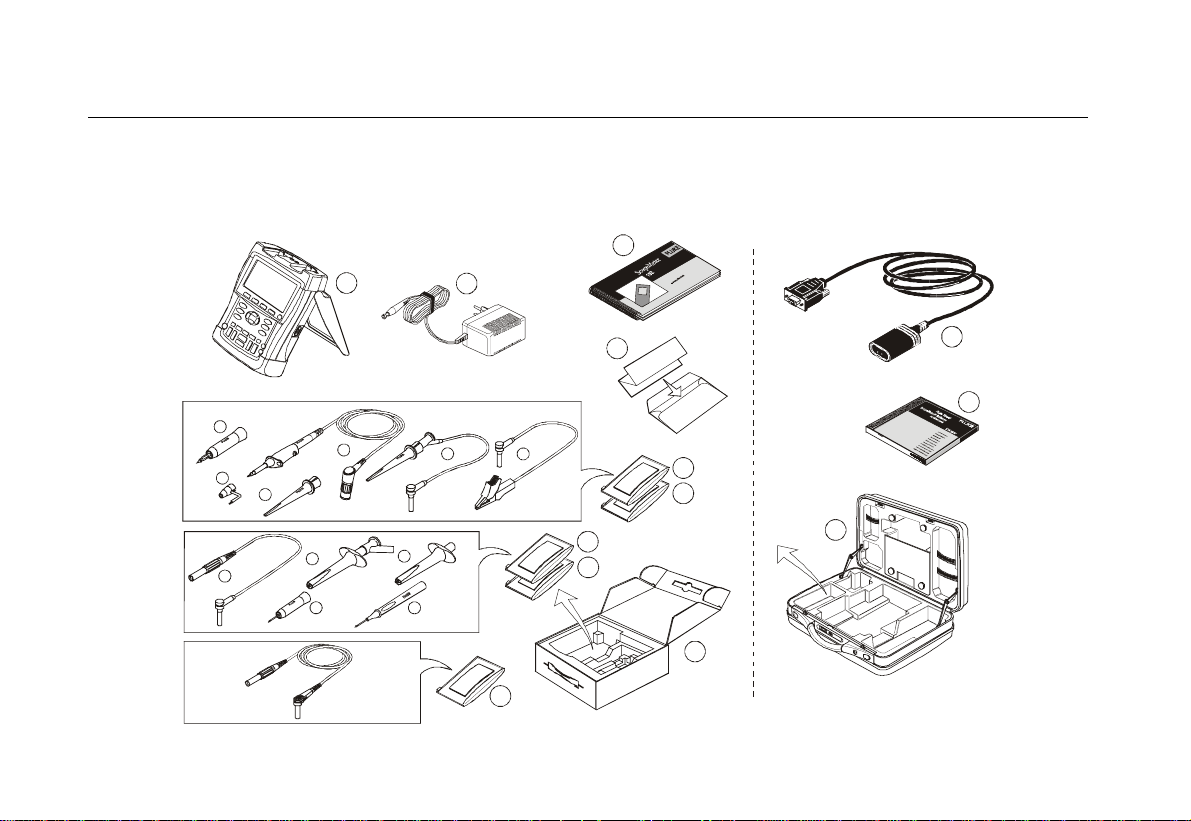
Unpacking the Test Tool Kit
Declaration of Conformity
for
Fluke 192/196/199
®
ScopeMeter
Manufacturer
Fluke Industrial B.V.
7602 EA Almelo
The Netherlands
Statement of Confor m i ty
Based on test results using appropriate standar ds,
the product is in conformity with
Electromagnet ic Compatibility Directive 89/336/EEC
Low Voltage Directive 73/23/EEC
test tools
Lelyweg 1
Sample tests
Standards used:
EN 61010.1 (1993)
Safety Requirements for Electr ical Equipment f or
Measurement, Contr ol, and Labor at or y Use
EN-IEC61326-1 (1997)
Electrical equipment for
measurements and laborator y
use -EMC requirements-
The tests have been perform ed in a
typical configuration.
This Conformity is indicated by the symbol
i.e. “Conformité Europ éenne”.
,
1
Page 10
Fluke 192/196/199
13
Users Manual
Unpacking the Test Tool Kit
The following items are included in your test tool kit:
1
(2x)
e
(1x)
f
(2x)
b
(2x)
e
(2x)
a
(2x)
d
(2x)
a
(2x)
b
2
(2x)
c
(2x)
(2x)
c
Note
When new, the rechargeable NiMH batter y is not
fully charged. See Chapter 8.
8
T
C
U
D
O
R
P
9
R
E
T
E
D
M
R
E
A
P
C
O
N
C
O
S
I
T
E
A
K
R
U
T
L
F
S
I
G
E
R
(2x)
d
3
4
6
7
10
5
11
12
Figure 1. ScopeMet er Test Tool Ki t
2
Page 11

Unpacking the Test Tool Kit
# Description
1 ScopeMeter Test Tool
2 Battery Charger (country dependent)
3 10:1 Voltage Probe Set (red)
10: 1 Voltage Pr obe ( r ed)
a)
Hook Clip for Probe Tip (r ed)
b)
Ground Lead with Hook Clip (red)
c)
G r ound Lead with M ini Alligator Clip (black)
d)
4- m m Test Pr obe f or Pr obe Tip (r ed)
e)
Ground Spring for Probe Tip (black)
f)
4 10:1 Voltage Probe Set (gray)
10: 1 Voltage Probe ( gr ay)
a)
Hook Clip for Probe Tip (gr ay)
b)
Ground Lead with Hook Clip (gray)
c)
G r ound Lead with M ini Alligator Clip (black)
d)
4- m m Test Pr obe f or Probe Tip ( gr ay)
e)
5 Test Leads (red and black)
6 Accessory Set (only for Fluke 196 and 199)
2- m m Test Pr obe f or Pr obe Tip (r ed)
a)
I ndus t r ial Alligator for Pr obe Tip ( r ed)
b)
2-mm Test Probe for Banana Jack (red)
c)
I ndus t r ial Alligator for Banana Jack ( r ed)
d)
G r ound Lead with 4- m m Banana Jack
e)
(black)
# Description
7 Accessory Set (only for Fluke 196 and 199)
2- m m Test Pr obe f or Probe Tip ( gr ay)
a)
I ndust r ial Alligator for Probe Tip (gr ay)
b)
2-mm Test Probe for Banana Jack (gray)
c)
I ndust r ial Alligator for Banana Jack (gr ay)
d)
G r ound Lead with 4- m m Banana Jack
e)
(black)
8 Users Manual (this book)
9 Product Registration Card with Envelope
10 Shipment box (basic version only)
Fluke 192-S, 196-S and 199-S versions include also the
following items:
# Description
11 Optically Isolated RS-232 Adapter/Cable
12 FlukeView® ScopeMeter® Software for
Windows
®
13 Hard Case
3
Page 12
Fluke 192/196/199
Users Manual
Safety Information: Read First
Carefully read the following safety inform at ion befor e
using the test tool.
Specific warning and caution statements, where t hey
apply, appear throughout t he m anual.
A “Warning” identi fies conditions and
actions that pose hazard(s ) t o t he user.
A “Caution” identifies conditions and act ions
that may damage the test t ool.
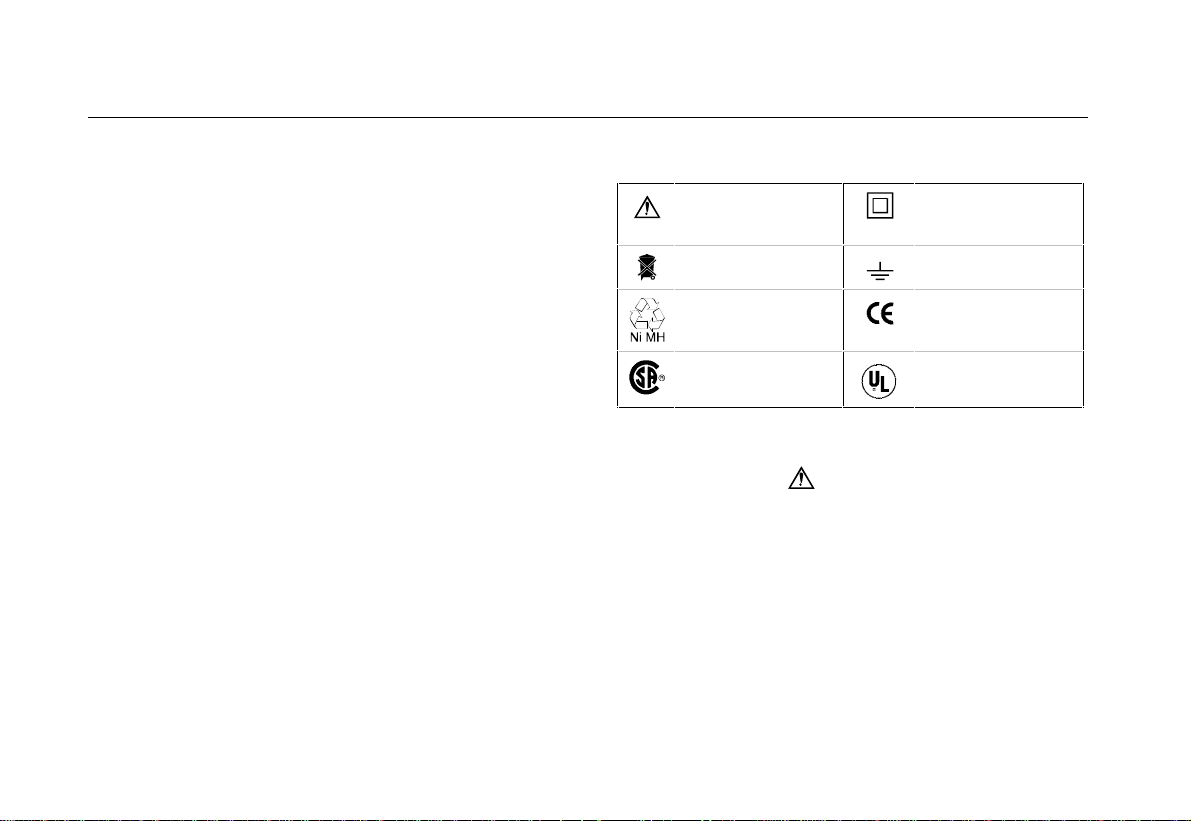
The following international symbols are used on the test
tool and in this manual:
See explanation in
manual
Disposal information Earth
Recycling
information
Safety Approval Safety Approval
Double Insulation
(Protectio n Class)
Conformité
Européenne
Warning
To avoid electrical shock or fire, use only t he
Fluke power supply, M odel BC190 (Bat t er y
Charger / Power Adapter).
4
Page 13

Safety Infor m at ion: Read First
Warning
To avoid electrical shock or fire if a test tool
input is connected t o m ore than 42 V peak (30
Vrms) or on circuits of more than 4800 VA:
• Use only insulated voltage pr obes and t est
leads (and adapters) supplied with t he t est
tool, or equivalents as specified i n t he
accessory list, see Chapter 8.
• Before use, inspect voltage pr obes, test
leads and accessories for mechanical
damage and replace when damaged.
• Remove all probes, test l eads and
accessories that are not in use.
• Always connect the battery char ger f i r st t o
the ac outlet befor e connect ing it to the test
tool.
• Do not connect the ground spring to
voltages higher than 42 V peak ( 30 Vrm s)
from earth ground.
• Do not apply voltages that di f f er m or e t han
600 V from earth ground t o any input when
measuring in a CAT III environment.
Do not apply voltages that di f f e r m or e t han
1000 V from earth ground t o any input when
measuring in a CAT II envi r onm ent .
• Do not apply voltages that di f f er m or e t han
600 V from each other t o t he i solated inputs
when measuring in a CAT III environment.
Do not apply voltages that di f f e r m or e t han
1000 V from each other t o t he i solated inputs
when measuring in a CAT II environment.
• Do not apply input voltages above t he r at i ng
of the instrume nt . Use caut i on w hen using
1:1 test leads because the pr obe t i p voltage
will be directly transmitted to the test tool.
• Do not use expos e d metal BNC or banana
plug connectors.
• Do not insert metal obj ects into connectors.
• Always use the test tool only in the manner
specified.
Voltage ratings that are mentioned in the warnings, are
given as limits for “working voltage”. They repr esent
V ac rms (50-60 Hz) for ac sinewave applications and as
V dc for dc applications.
Overvoltage Category III refers to distribution level and
fixed installation circuits inside a building.
Overvoltage Category II r ef er s t o local level, which is
applicable for appliances and portable equipment.
5
Page 14

Fluke 192/196/199
Users Manual
The terms ‘Isolated’ or ‘Electrically floating’ are used in
this manual to indicate a measurement in which the t est
tool input BNC or banana jack is connected to a voltage
different fr om ear t h gr ound.
The isolated input connectors have no exposed metal and
are fully insulated to protect against electr ical shock.
The red and gray BNC jacks, and the red and black
4-mm banana jacks can independently be connected to a
voltage above earth ground for isolated ( elect r ically
floating) measurement s and ar e r at ed up t o 1000 Vr m s
CAT II and 600 Vrms CAT III above earth ground.
If Safety F eat ures are Impaired
Use of the test tool i n a m anner not speci f ied may
impair the pr ot ect ion provided by the equipment .
Before use, inspect the test leads for m echanical damage
and replace damaged test leads!
Whenever it is likely that safety has been impaired, t he
test tool must be tur ned off and disconnected from t he
line power. The matter should then be r ef er r ed to
qualified personnel. Safety is likely to be impaired if, for
example, the test t ool fails to per f or m the intended
measurements or shows visible damage.
6
Page 15
About this Chapter
This chapter provides a step-by-st ep intr oduction to the
scope functions of the test t ool. The int r oduct ion does not
cover all of the capabilit ies of the scope functions but
gives basic examples to show how to use the menus and
perform basic operations.
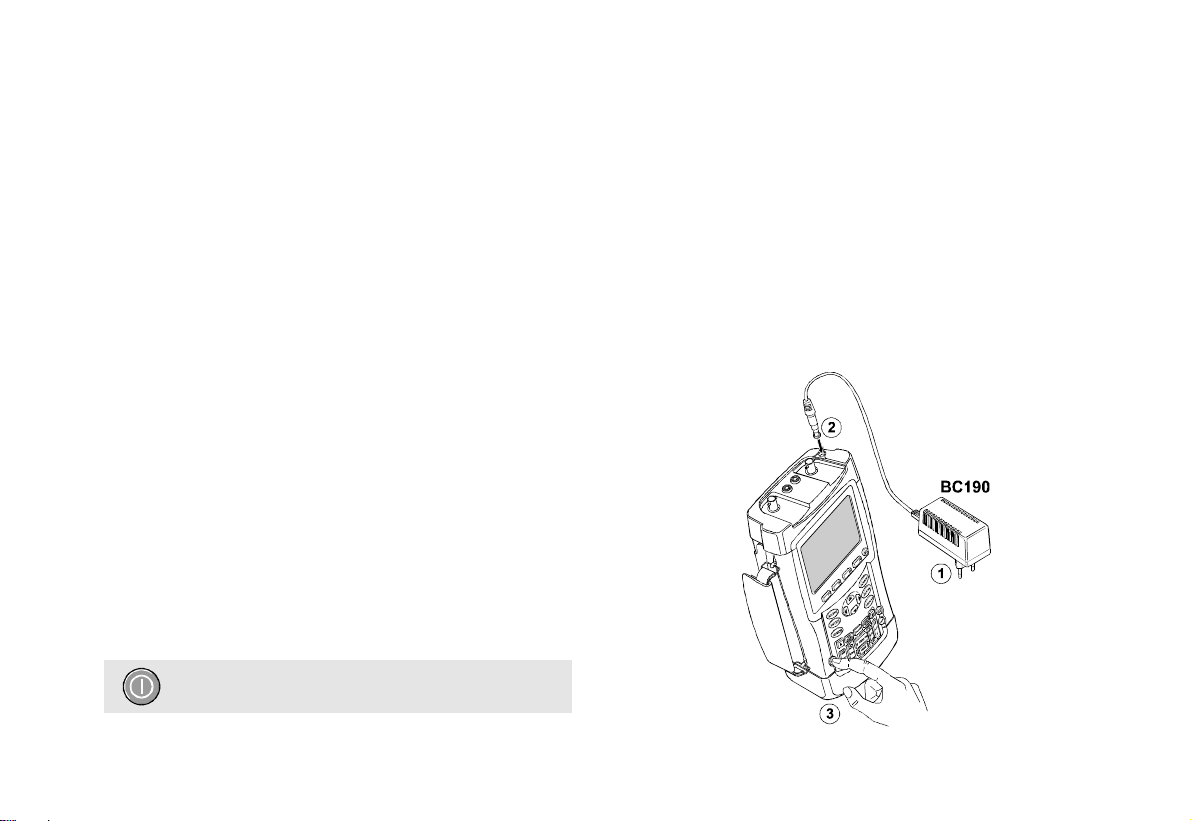
Powering the Test Tool
Follow the procedure (steps 1 through 3) in Figure 2 to
power the test tool fr om a st andar d ac out let .
See Chapter 8 for instructions on using batt er y power.
Turn the test tool on with the on/ off key.
Chapter 1
Using The Scope
The test tool powers up in its last setup configurat ion.
Figure 2. Powering the Test Tool
7
Page 16
Fluke 192/196/199
Users Manual
Resetting the Test Tool
If you want to reset the test tool to the factory settings, do
the following:
1 Turn the test tool off.
2 Press and hold.
3 Press and release.
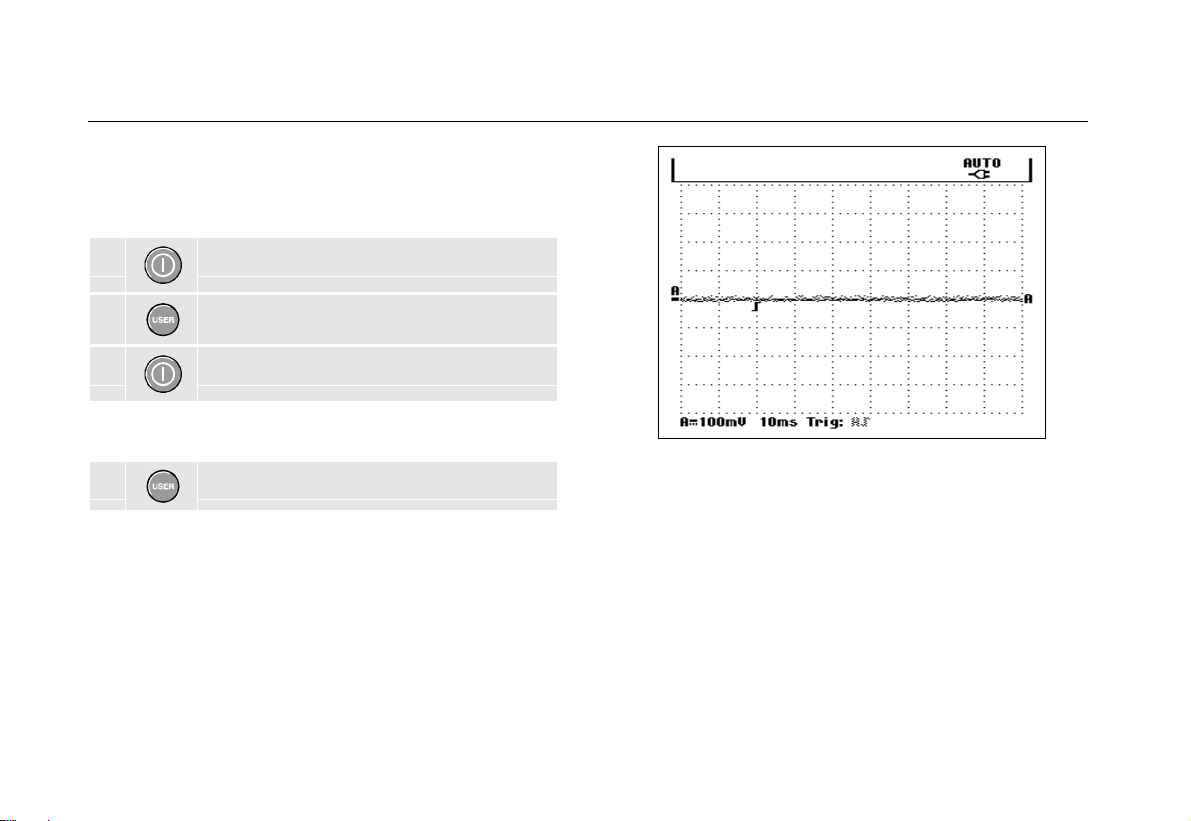
The test tool turns on, and you should hear a double
beep, indicating the reset was successful.
4 Release.
Now look at the display; you will see a screen that looks
like Figure 3.
Figure 3. The Screen After Reset
8
Page 17
Navigating a Menu
The following example shows how to use the test tool’s
menus to select a function. Subsequently f ollow steps
1 through 4 to open the scope menu and t o choose an
item.
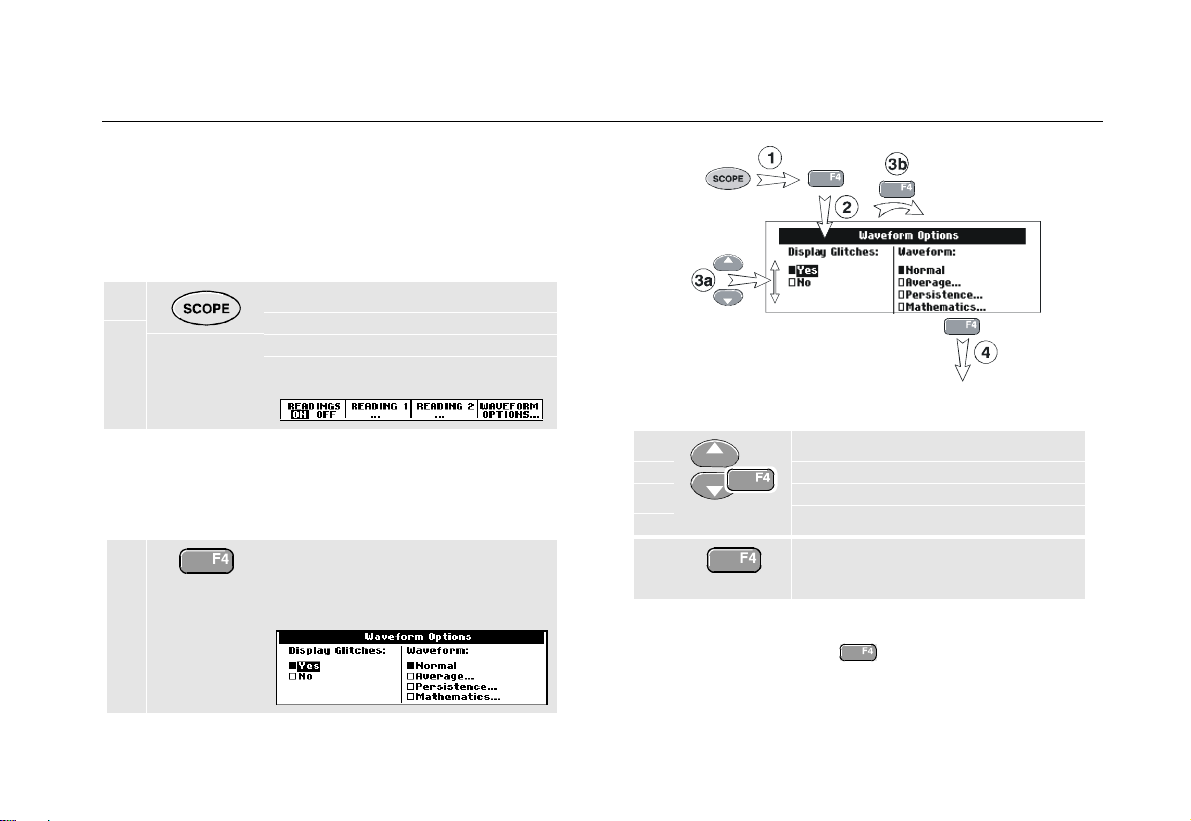
1 Press the SCOPE key to display
the labels that define the present
use for the four blue f unct ion
keys at the bottom of t he scr een.
Using The Scope
Navigating a Menu
Figure 4. Basic Navigation
1
Note
To hide the labels for full screen view, press the
SCOPE key again. This toggling enables you to
check the labels without affecting your sett ings.
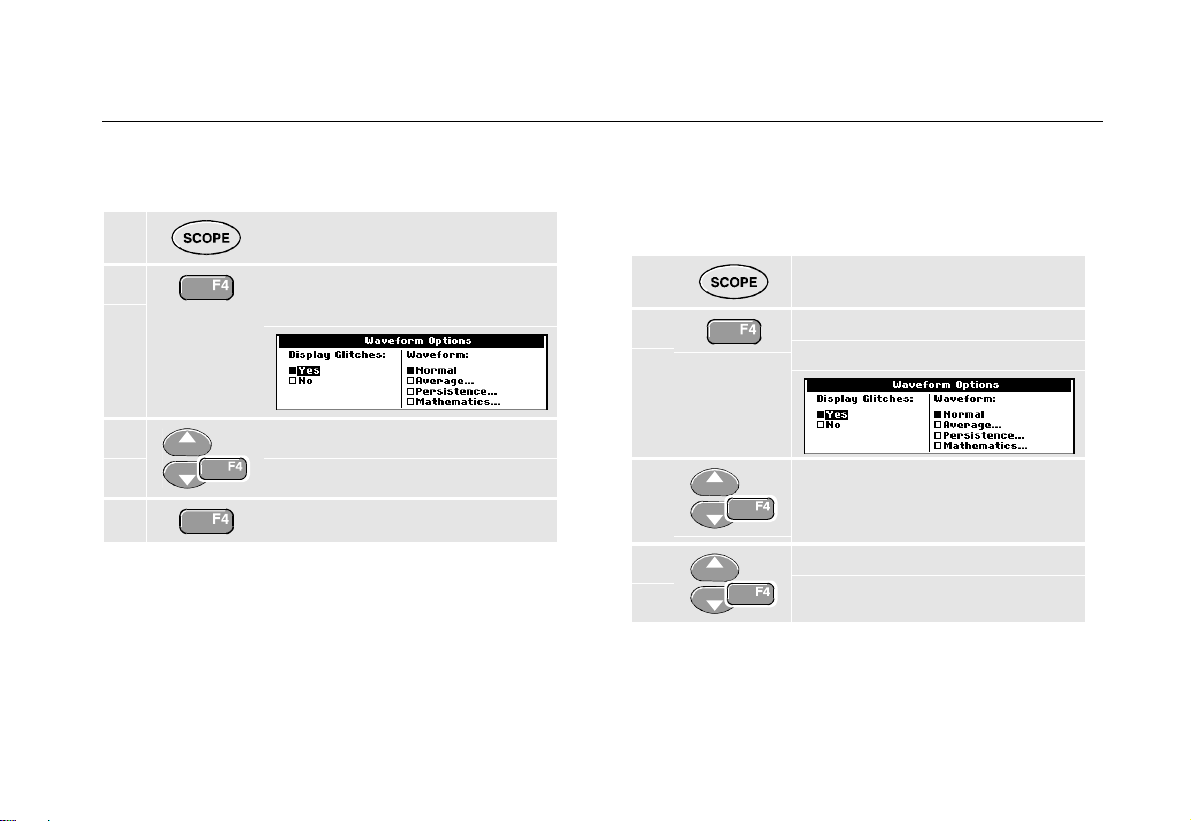
2 Open the Waveform Options
menu. This menu is displayed at
the bottom of t he scr een.
3a
3b
4 Press the ENTER key until you exit
Repeatedly pressing
through a menu without changing the settings.
Use the blue arrow keys to
highlight the item.
Press the blue ENTER key to
accept the selection.
the menu.
Note
lets you to step
9
Page 18
Fluke 192/196/199
Users Manual
Hiding Key Labels and Menus
You can hide a menu or key label at any time:
Hide any key label or menu.
To display menus or key labels, press one of the yellow
menu keys, e.g. the
SCOPE key.
Input Connections
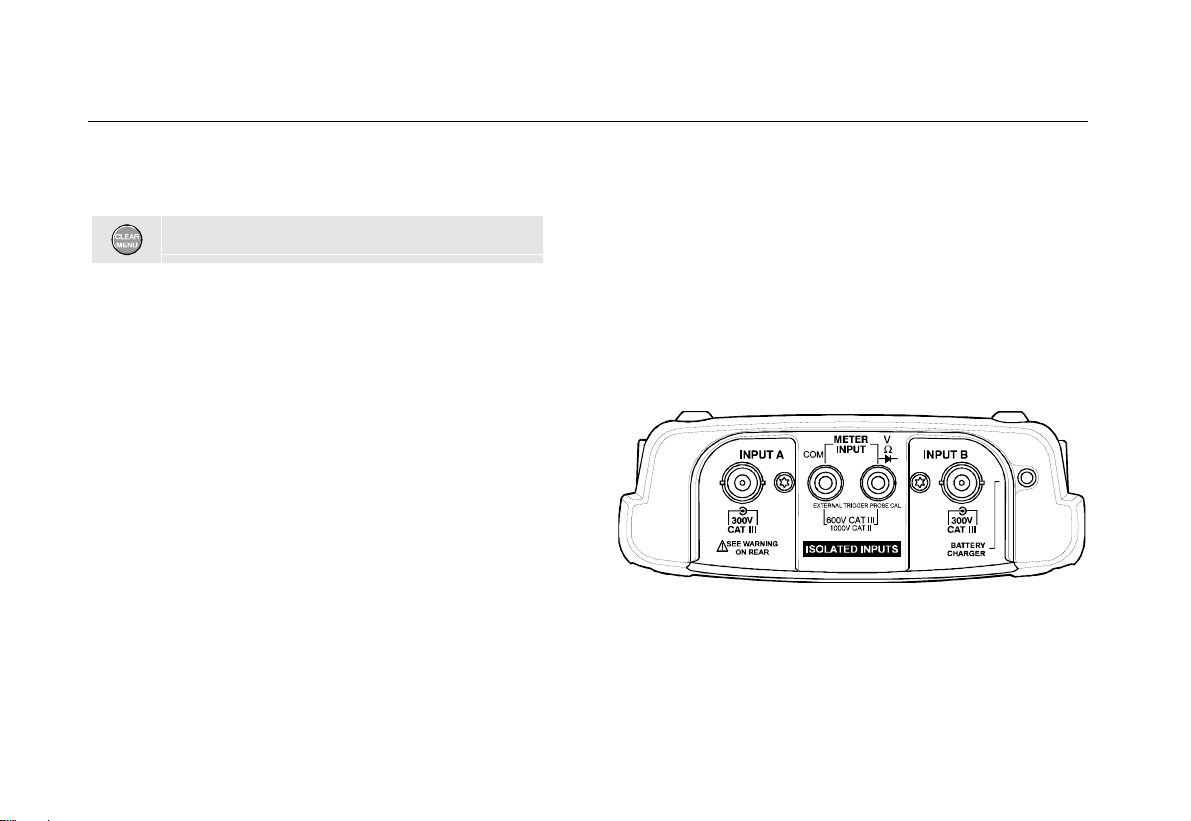
Look at the top of the test tool. The test t ool has f our
signal inputs: two safety BNC jack inputs (red input A and
gray input B) and two safety 4-m m banana jack inputs
(red and black). Use the two BNC jack inputs for scope
measurements, and t he t wo banana jack inputs for m et er
measurements.
Isolated input architectur e allows independent floating
measurements with each input.
Figure 5. Measurem ent Connect i ons
10
Page 19

Making Scope Connections
To make dual input scope measurements, connect the
red voltage probe to input A, and t he gr ay voltage pr obe
to input B. Connect the short gr ound leads of each
voltage probe to its own ref er ence pot ential. (See Figure
6.)
Using The Scope
Making Scope Connections
1
Note
To maximally benefit from having independently
isolated floating inputs and to avoid problems
caused by improper use, read Chapter 7: “ Tips”.
Figure 6. Scope Connections
11
Page 20
Fluke 192/196/199
Users Manual
Displaying an Unknown Signal with
Connect-and-View™
The Connect-and-View feature lets the test tool display
complex, unknown signals automatically. This function
optimizes the position, range, t ime base, and triggering
and assures a stable display of virtually any waveform. If
the signal changes, the setup is automat ically adjusted to
maintain the best display result. This featur e is especially
useful for quickly checking several signals.
To enable the Connect-and-View feature, do the
following:
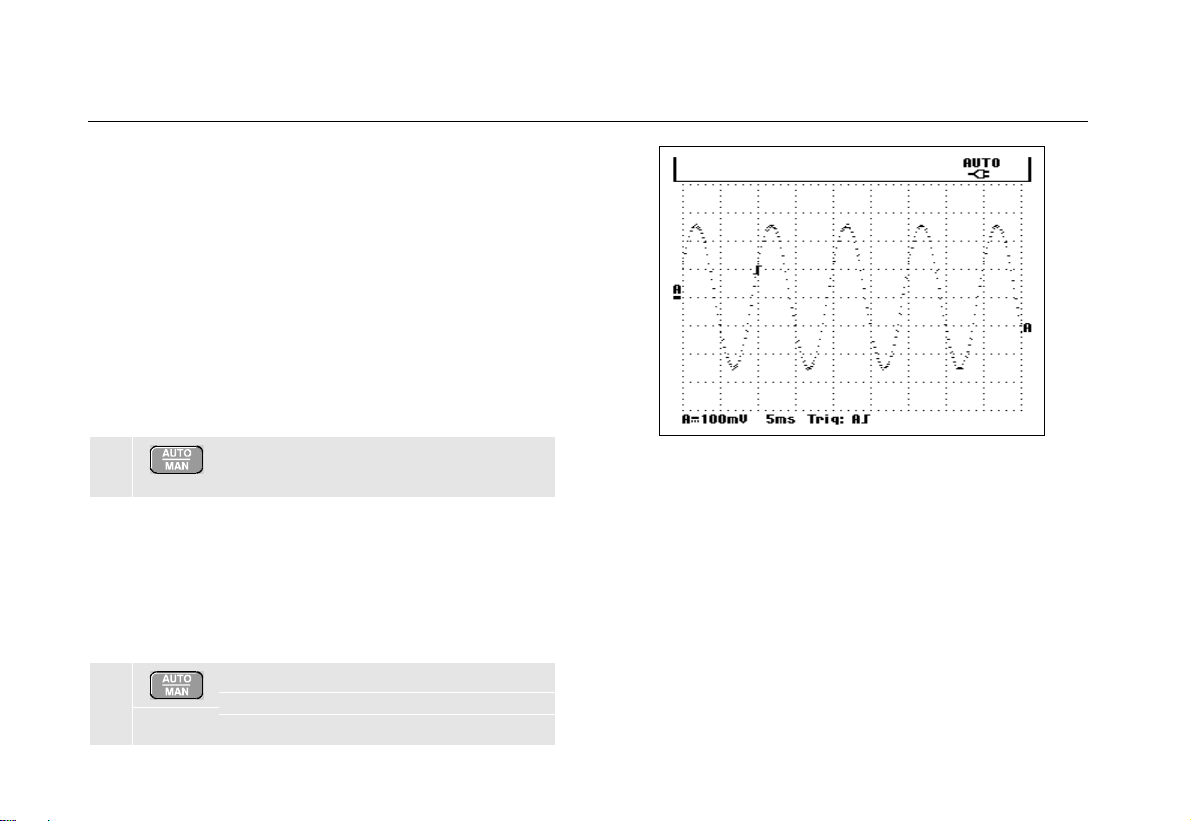
1 Perform an Auto Set . AUTO appears at
the top right of t he scr een.
The bottom line shows the range, the time base, and the
trigger informat ion.
The waveform identifier (A) is visible on the bottom r ight
side of the screen, as shown in Figure 7. The input A zero
) at the left side of t he scr een ident ifies the gr ound
icon (
-
level of the waveform.
Figure 7. The Screen After an Aut o Set
Use the light-gray
bottom of the keypad t o change t he view of t he wavef or m
manually.
RANGE, TIME and MOVE keys at the
2 Press a second time to select the
manual range again. MANUAL appears
at the top right of t he scr een.
12
Page 21
Using The Scope
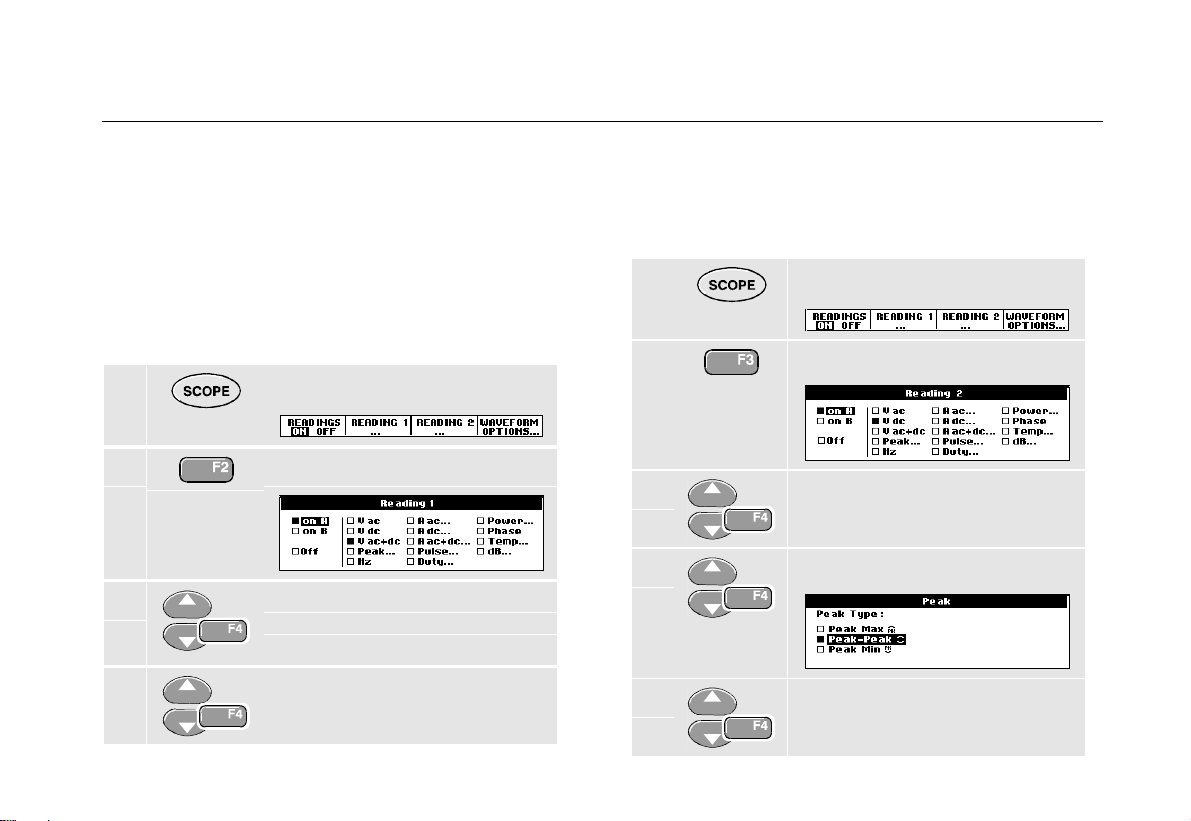
Making Automatic Scope Measurements
1
Making Automatic Scope Measurements
The test tool offer s a wide range of aut om at ic scope
measurements. You can display two numeric readings:
EADING 1 and READING 2. These readings are selectable
R
independently, and the measurement s can be done on
the input A or input B waveform
To choose a frequency measurement f or input A, do t he
following:
1 Display the SCOPE key labels.
2 Open the Reading 1 menu.
3 Select on A. Observe that the
highlight jumps to the present
measurement.
4 Select the Hz measurement.
Observe that the t op lef t of the screen displays the Hz
measurement. ( See Figure 8. )
To choose also a Peak-Peak measurement for Input B as
second reading, do the following:
1 Display the SCOPE key labels.
2
3
4
5
Open the Reading 2 menu.
Select on B. The highlight jumps
to the measurement s f ield.
Open the PEAK menu.
Select the Peak-Peak
measurement.
13
Page 22
Fluke 192/196/199
Users Manual
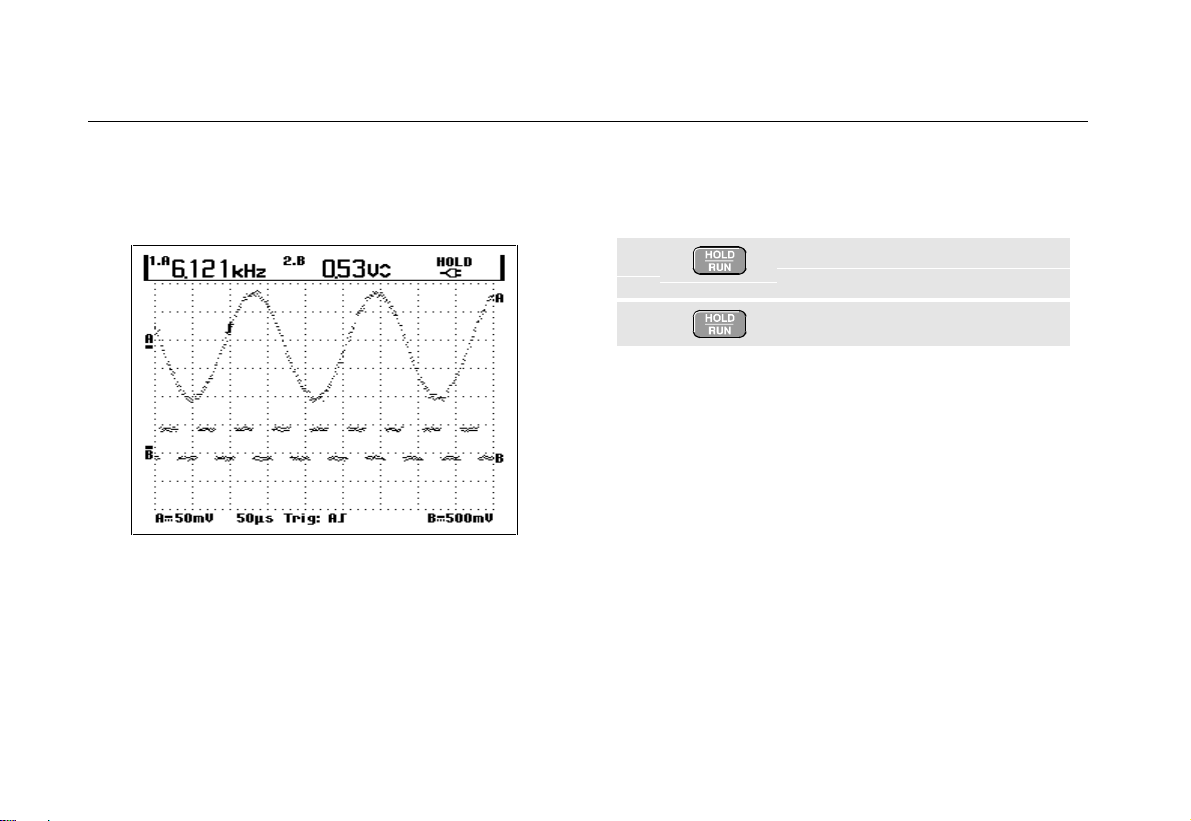
Figure 8 shows an example of the screen. Note that the
Peak-Peak reading for input B appears next to t he input A
frequency reading at the top of the screen.
Figure 8. Hz and V peak-peak as Scope Readings
Freezing the Screen
You can freeze the screen (all readings and waveforms)
at any time.
1 Freeze the screen. HOLD appears
at the right of t he r eading area.
2 Resume your measurement.
14
Page 23
Using The Scope
Using Average, Persistence and Glitch Capture
1
Using Average, Persistence and Glitch
Capture
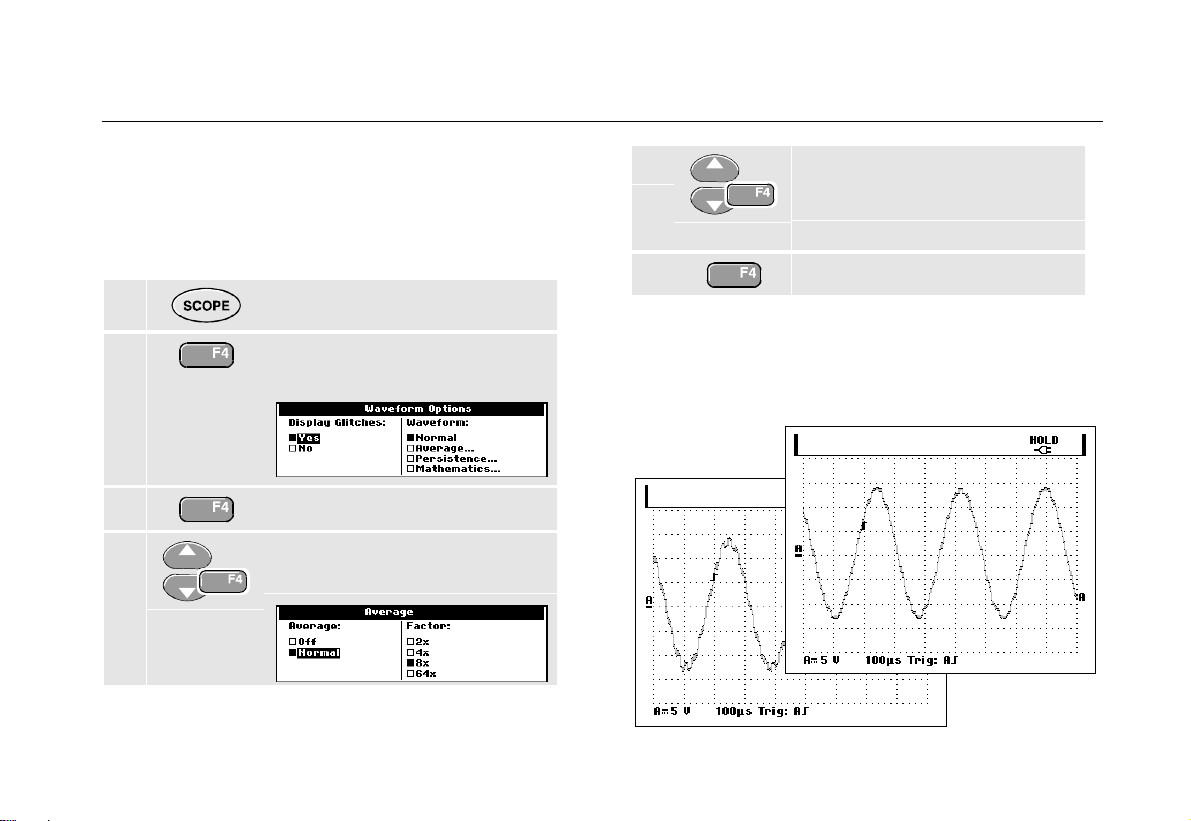
Using Average f or Smooth ing Waveforms
To smooth the waveform, do the following:
1 Display the SCOPE key labels.
2 Open the Waveform Options
menu.
3 Jump to Waveform:
4 Select Average... to open the
Average menu
5 Select Normal, jump to Factor:
and select Average 8x.This
averages the outcomes of 8
acquisitions.
6 Exit the menu.
You can use the average functions to suppress r andom
or uncorrelated noise in the waveform without loss of
bandwidth. Waveform samples with and without
smoothing are shown in Figure 9.
Figure 9. Smoothi ng a W avef or m
15
Page 24
Fluke 192/196/199
Users Manual
Using Persi st ence to Display Waveforms
When persistence is selected, the test t ool displays the
upper and lower boundaries of dynamic waveforms.
1 Display the SCOPE key labels.
2 Open the Waveform Options
menu.
3 Jump to Waveform: and Select
Persistence , t hen select Infinite.
4 Start monitoring the wavef or m .
16
Figure 10. Using Persi st ence t o Di spl ay W avef or m
Variations
Observe that the fluctuating portion of the wavefor m
appears in gray on the screen. See Figure 10.
You can use persistence to observe variations in time or
amplitude of input waveforms over t im e.
Page 25
Using The Scope
Using Average, Persistence and Glitch Capture
1
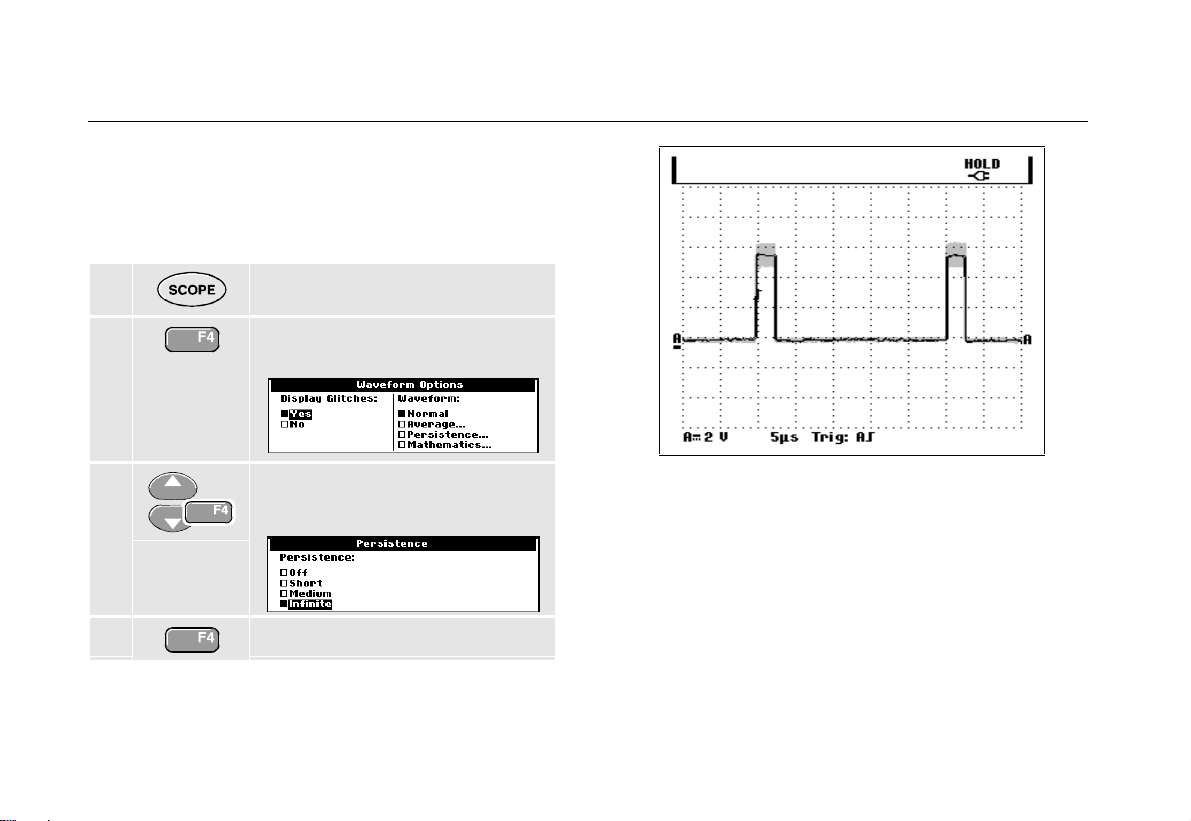
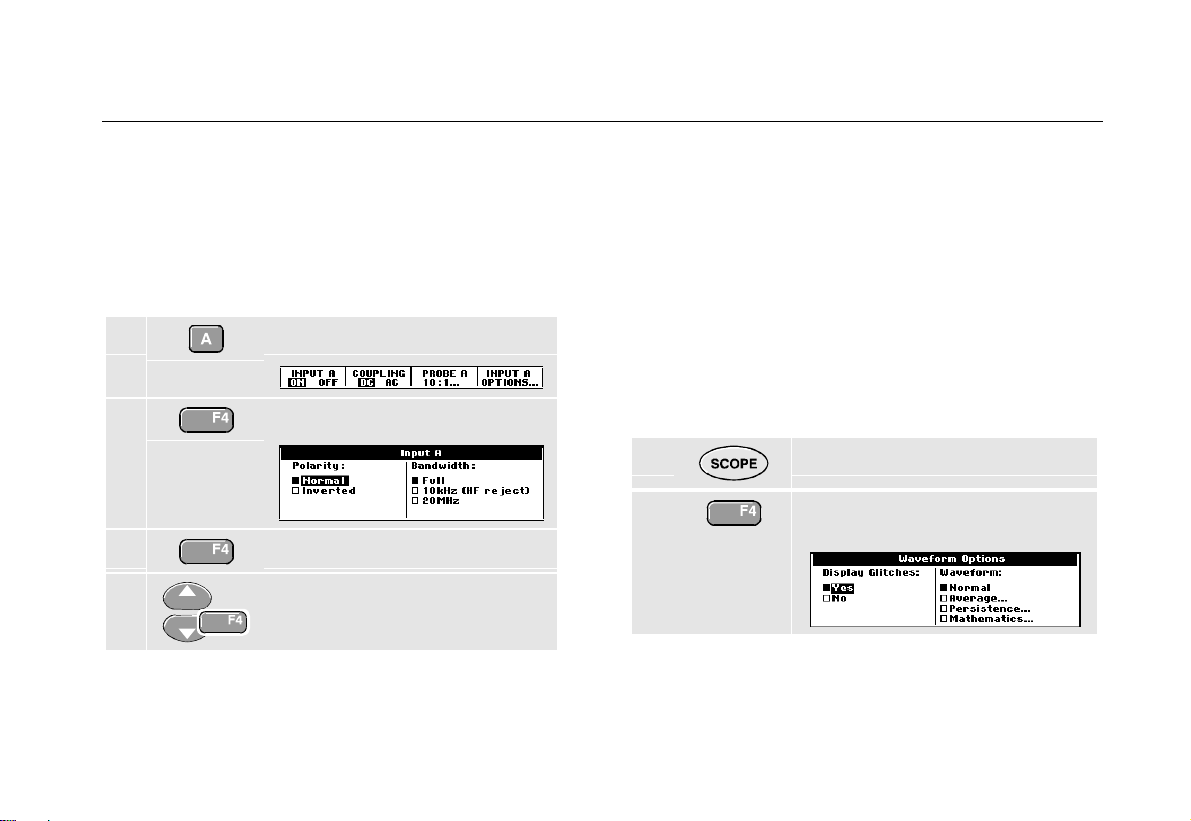
Displaying Gli t ches
To capture glitches on a waveform, do t he following:
1 Display the SCOPE key labels.
2 Open the Waveform Options
menu.
3 Select Di spl ay G litches: Yes
4 Exit the menu.
You can use this function to display events (glitches or
other asynchronous waveforms) of 50 ns ( nanoseconds)
or wider, or you can display HF modulated waveforms.
Suppressing High Frequency No ise
Switching Display Glit ches to No will suppress the high
frequency noise on a wavef or m . Averaging will suppress
the noise even more.
1 Display the SCOPE key labels.
2 Open the Waveform Options
menu.
3 Select Display G litches: No,
then select Average: to open t he
Average menu
4 Select Average: Normal, and
Factor : 8x
Tip
Glitch capture and average do not af f ect
bandwidth. Further noise suppression is possible
with bandwidth limiting filters. See Chapter 1:
“Working with Noisy Wav e forms”.
17
Page 26
Fluke 192/196/199
Users Manual
Acquiring Waveforms
Selecting AC-Coupling
After a reset, the test tool is dc-coupled so that ac and dc
voltages appear on the screen.
Use ac-coupling when you wish to observe a small ac
signal that rides on a dc signal. To select ac-coupling, do
the following:
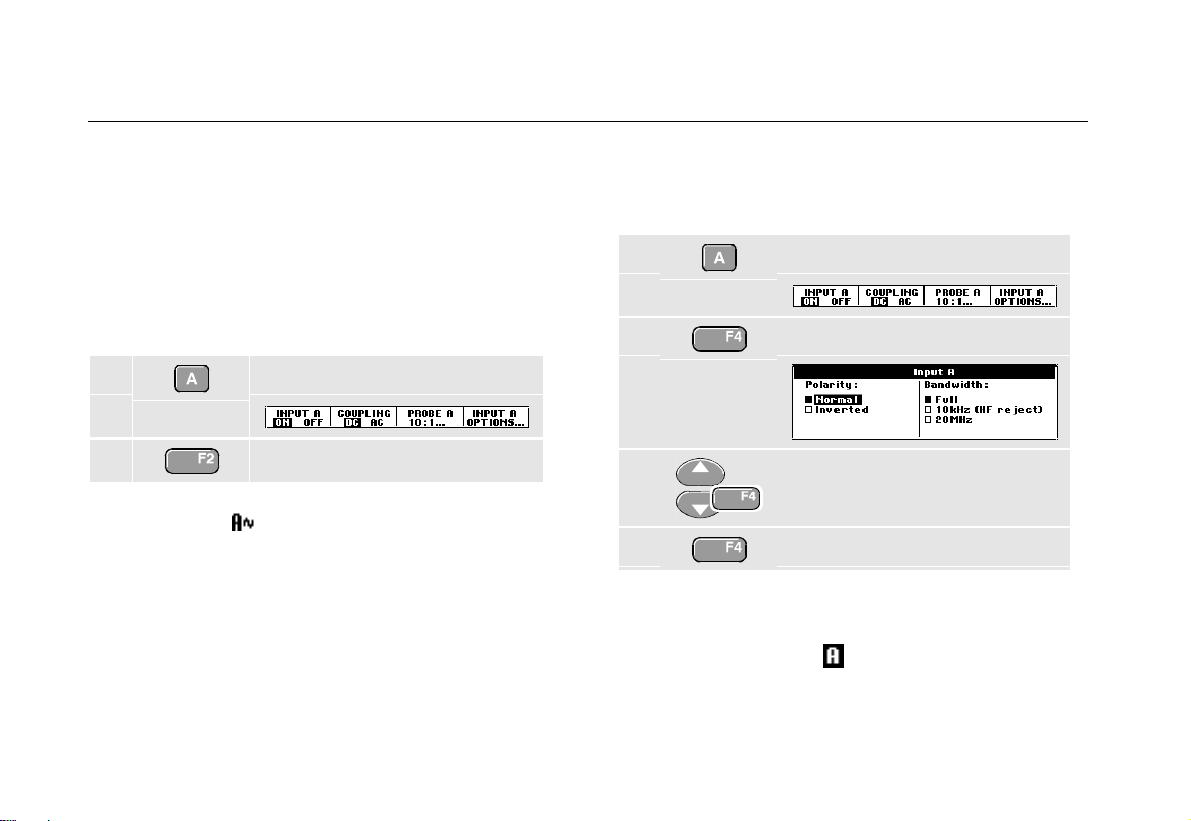
1 Display the INPUT A key labels.
2 Highlight AC.
Observe that the bot tom left of the screen displays the
ac-coupling icon:
.
Reversing th e P olarity of the Displayed
Waveform
To invert the input A waveform, do t he f ollowing:
1 Display the INPUT A key labels.
2 Open the Input A menu.
3 Select Inverted and accept
inverted waveform display.
4 Exit the menu.
For example, a negative-going waveform is displayed as
positive-going waveform which may provide a more
meaningful view. An inverted display is identified by an
inversed trace identifier (
) at the right of t he wavefor m.
18
Page 27
Using The Scope
Acquiring Waveforms
1
Working with Noisy Waveforms
To suppress high frequency noise on waveforms, you can
limit the working bandwidth to 10 kHz or 20 MHz. This
function smoothes the displayed waveform. For the same
reason, it improves tr iggering on the wavef or m .
To choose HF reject, do the following:
1 Display the INPUT A key labels.
2 Open the Input A menu.
3 Jump to Bandwidth.
4 Select 10kHz (HF reject) to
accept the bandwidth limitation.
Tip
To suppress noise without loss of bandwidth,
use the average function or turn off Display
Glitches.
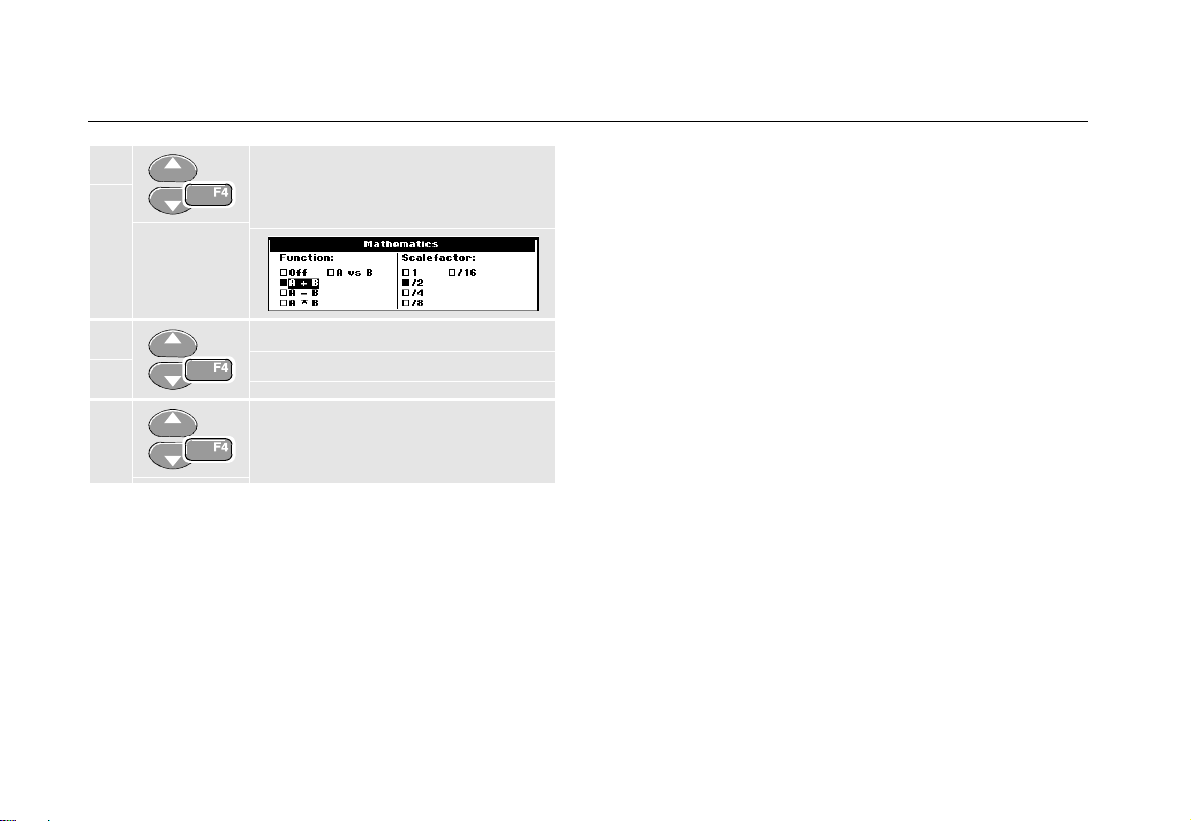
Using Wavef orm Mathemati cs Functions
When adding (A+B), subtracting (A- B), or multiplying
(A*B) the input A and input B waveform, t he t est tool will
display the mathematical result waveform and t he input A
and input B waveforms.
A versus B provides a plot with input A on the vertical
axis and input B on the horizontal axis.
The Mathematics funct ions perf or m a point - t o- point
operation on waveforms A and B.
To use a Mathematics function, do t he following:
1 Display the SCOPE key labels.
2 Open the Waveform Options
menu.
19
Page 28
Fluke 192/196/199
Users Manual
3 Jump to Waveform: and Select
Mathematics... to open the
Mathematics menu.
4 Select Function: A+B, A-B, A*B
or A vs B.
5 Select a scale factor to fit the
mathematical result waveform onto
the display, and return.
The sensitivity range of the mathematical result is equal
to the sensitivity range of the least sensitive input divided
by the scale factor.
Analyzing Waveforms
You can use the analysis functions CURSOR, ZOOM and
REPLAY to perform detailed waveform analysis. These
functions are described in Chapter 4: “Us in g Cursors,
Zoom and Replay”.
20
Page 29

About this Chapter
This chapter provides a step-by-st ep intr oduction to the
multimeter funct ions of t he test tool (hereaft er called
“meter”). The introduction gives basic examples to show
how to use the menus and perform basic oper at ions.
Making Meter Connections
Use the two 4-mm safet y r ed ( ) and black (COM)
banana jack inputs for the Meter f unct ions.
(See Figure 11.)
Note
Typical use of the Meter test leads and
accessories is shown in Chapter 7.
Chapter 2
Using The Multimeter
Figure 11. Mete r Connect i ons
21
Page 30
Fluke 192/196/199
Users Manual
Making Multimeter Measurements
The screen displays the numeric readings of the
measurements on the m et er input.
Measuring Resistance Valu es
To measure a resistance, do the f ollowing:
1 Connect the red and black test leads from t he
4-mm banana jack inputs to the resistor .
The resistor value is displayed in ohms. Observe also
that the bargraph is displayed. ( See Figure 12. )
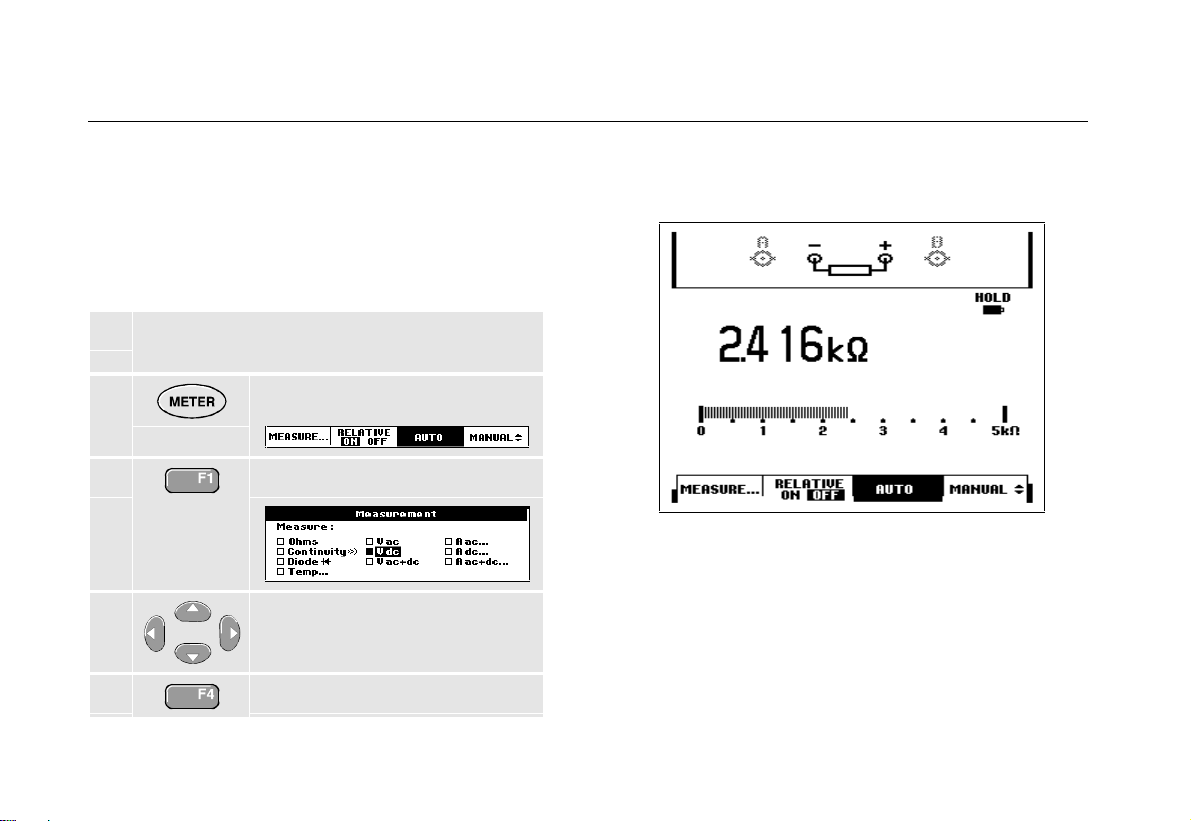
22
2
Display the METER key labels.
3
Open the Measurement menu.
Figure 12. Resistor Val ue Readings
4
Highlight Ohms.
5
Select Ohms measurement .
Page 31

Making a Cu rrent Measurement
You can measure current in both Scope mode and M eter
mode. Scope mode has the advantage of t wo wavefor m s
being displayed while you perform measurements.
Meter mode has the advant age of high m easur em ent
resolution.
The next example explains a typical current
measurement in Meter m ode.
Using The Multim et er
Making Multimeter Measur em ent s
Figure 13. Measurem ent Set up
2
Warning
Carefully read the instructions about t he
current probe you are usi ng.
To set up the test tool, do t he f ollowing:
1 Connect a current probe (e. g. i400, optional)
from the 4-m m banana jack output s to the
conductor to be measured.
Ensure that the red and black probe connect or s
correspond to the red and black banana jack
inputs. (See Figure 13.)
2
Display the METER key labels.
3 Open the Measurement menu.
4
5
Highlight A ac....
Open the Current Pr obe
submenu.
23
Page 32

Fluke 192/196/199
Users Manual
6
7
Now, you will see a screen like in Figur e 14.
Observe the sensitivity of the
current probe. Highlight the
corresponding sensitivity in the
menu, e.g. 10 mV/ A.
Accept the current measur em ent.
Figure 14. Ampere Measur em ent Readings
24
Page 33

Using The Multim et er
Freezing the Readings
2
Freezing the Readings
You can freeze the displayed readings at any time.
1 Freeze the screen. HOLD appears
at the top right of t he r eading
area.
2 Resume your measurement.
You can use this function to hold accurate readings for
later examination.
Note
For saving screens into memory, see Chapter 6.
Selecting Auto/Manual Ranges
To activate manual ranging, do the f ollowing during any
Meter measurem ent :
1 Activate manual ranging.
2 Increase or decrease the r ange.
Observe how the bargraph sensitivity changes.
Use manual ranging to set a fixed bargraph sensitivity
and decimal point.
3 Choose auto ranging again.
When in auto ranging, the bargraph sensit ivity and
decimal point are automatically adjusted while checking
different signals.
25
Page 34

Fluke 192/196/199
Users Manual
Making Relative Measurements
A relative measurement displays the present
measurement result r elative t o a def ined reference value.
The following example shows how to perform a relative
voltage measurement. Fir st obtain a reference value:
1 Display the METER key labels.
2 Measure a voltage to be used as
reference value.
3 Set RELATIVE to ON. (ON is
highlighted.)
This stores the reference value as ref er ence for
subsequent measurements. The st or ed r ef er ence value is
displayed in small digits at the bottom right side of the
screen after the word
4 Measure the voltage to be
REFERENCE.
compared to the ref er ence.
Observe that the m ain r eading is displayed as variations
from the ref er ence value. The act ual reading with its
bargraph is displayed beneath these readings. (See
Figure 15.)
Figure 15. Making a Rel at ive Measurement
You can use this feature when, for exam ple, you need to
monitor input activity (voltage, r esistance, temperature) in
relation to a known good value.
26
Page 35

About this Chapter
This chapter provides a step-by-st ep intr oduction to the
recorder functions of t he test tool. The introduction gives
examples to show how to use the menus and perfor m
basic operations.
Opening the Recorder Main Menu
First choose a measurement in scope or m et er m ode.
Now you can choose the recorder functions fr om t he
recorder main menu. To open t he m ain m enu, do t he
following:
Chapter 3
Using The Recorder Functions
1 Open the RECORDER main menu.
(See Figure 16.)
Figure 16. Recorder Main Menu
27
Page 36

Fluke 192/196/199
Users Manual
Plotting Measurements Over Time
(TrendPlot™)
Use the TrendPlot function to plot a gr aph of Scope or
Meter measurements as function of time.
Note
Because the navigations for the dual input
TrendPlot (Scope) and the single input TrendPlot
(Meter) ar e identical, only Tr endPlot ( Scope) is
explained in the next sections.
Starting a TrendPlot Function
To start plotting a graph of t he r eading over t ime, do the
following:
1 Apply a signal to the red BNC input A and turn
on Reading 1 in scope mode
2 Open the RECORDER main menu.
3 Highlight Trend Plot (Scope).
4 Start the TrendPlot r ecor ding.
The test tool continuously records the digital readings of
the input A measurements and displays these as a graph.
The TrendPlot graph rolls from right t o lef t like a paper
chart recorder.
Observe that the r ecor ded time from start appears at the
bottom of the scr een. The present reading appears on
top of the screen. ( See Figure 17. )
Note
When simultaneously TrendPlotting two
readings, the screen area is split into two
sections of four divisions each.
28
Page 37

Using The Recorder Functions
Plotting Measurements Ov er Time ( Tr endPlot™)
Displaying Recorded Dat a
When in normal view (NORMAL), only the nine most
recently recorded divisions are displayed on screen. All
previous recordings are stored in memor y.
VIEW ALL shows all data in memory:
7 Display an overview of the full
waveform.
Press repeatedly to toggle between normal view
NORMAL) and overview (VIEW ALL)
(
3
Figure 17. TrendPlot Readi ng
When the Scope is in automatic mode, aut omatic vertical
scaling is used to fit the TrendPlot graph on the scr een.
5 Set RECORDER to STOP to freeze
the recorder funct ion.
6 Set RECORDER to RUN to continue.
When the recorder mem or y is full, an aut omatic
compression algorithm is used to compress all samples
into half of the memory without loss of t r ansient s. The
other half of the r ecor der m em or y is f r ee again t o
continue recording.
29
Page 38

Fluke 192/196/199
Users Manual
Changing the Recorder Options
At the right bottom of t he display you can choose to
display the time elapsed from start and the actual time of
the day.
To change the time reference, pr oceed from step 6 as
follows:
7 Open the Recorder Options
menu.
8 Select Time of Day and jump to
the next field.
Now the recorded time and the curr ent time appear at the
bottom of the scr een.
The options Reading 1 and Reading 2 allow you to
select the scope readings to be recorded. ( Or one meter
measurement when in TrendPlot met er m ode. )
To continue without making further changes:
9 Close.
Turning Off the TrendPlot Display
10 Exit the recorder funct ion.
30
Page 39

Recording Scope Waveforms In Deep Memory ( Scope Record™)
Recording Scope Waveforms In Deep
Memory (Scope Record™)
The SCOPE RECORD function is a roll mode that logs one or
two long waveforms. This function can be used to m onit or
waveforms like motion control signals or the power-on
event of an Uninterruptable Power Supply (UPS). During
recording, fast tr ansients ar e captured. Because of the
deep memory, recor ding can be done for more than one
day. This function is similar to the roll mode in many
DSO’s but has deeper memory and bett er f unctionality.
Starting a Scope Record Function
1 Apply a signal to the red BNC input A.
Using The Recorder Functions
3
Figure 18. Recording Wavef or m s
2 From the Recorder main m enu,
highlight Scope Record.
3 Start the recor ding.
The waveform moves across the screen f r om r ight t o left
like a normal chart recorder. ( See Figure 18. )
Observe that the top of the screen displays the following:
• Time from start at the top of the scr een.
• The status at the bottom of the screen which
includes the time/div setting as well as the total
timespan that fits the memory.
Note
For accurate recordings it is advised to let the
instrument first warm up for five minutes.
31
Page 40

Fluke 192/196/199
Users Manual
Displaying Recorded Dat a
In Normal view, the samples that roll off t he scr een ar e
stored in deep memory. W hen t he m em or y is f ull,
recording continues by shifting the data in mem or y and
deleting the first samples out of m em or y.
In View All mode, the complete memory cont ent s ar e
displayed on the screen.
4 Press to toggle between VIEW ALL
(overview of all recorded
samples) and NORMAL view.
You can analyze the recorded waveforms using the
Cursors and Zoom functions. See Chapter 4: “Using
Replay, Zoom and Cursors”.
Using ScopeRecord in Single Sweep Mode
Use the recorder Single Sw eep function to automatically
stop recording when the deep memory is f ull.
Continue from step 3 of t he pr evious section:
4 Open the Recorder opti ons
menu.
5
6 Select Si ngl e Sw eep and accept
Jump to the Mode field.
(2x)
the recorder options.
32
Page 41

Recording Scope Waveforms In Deep Memory ( Scope Record™)
Using Scope Record in Triggered Single Sweep
Mode
To record, for exam ple, the power-on event of an
Uninterruptable Power Supply (UPS) it might be useful to
start recording on an exter nal t r igger signal. The next
example explains a typical triggered Single Sweep
recording.
To set up the test tool, cont inue f r om st ep 3 of t he
previous section:
4 Apply an Uninterruptable Power Supply signal
to the red BNC input A. Apply a start signal to
the red and black external trigger banana
inputs. (See Figure 19.)
5 Open the Recorder Options
menu.
6 Jump to Display Glitches.
7 Select Yes, then jump to Mode.
Using The Recorder Functions
3
Figure 19. Scope Record Single Sw eep
8 Select on EXT to open the
Start Single Sweep on Ext.
menu.
9 Select positive slope and jump to
Level.
10 Select 1. 2 V and accept all
recorder options.
33
Page 42

Fluke 192/196/199
Users Manual
The test tool starts r ecor ding aft er r eceiving the st ar t
signal. All samples are continuously saved in deep
memory until the mem or y is f ull. The last nine recor ded
divisions are displayed on the screen. Use View All to
display the full memory contents.
Note
To learn more about the Single Shot tr igger
function, see Chapter 5 “Tr iggering on
Waveforms”.
Figure 20. Trigger e d Si ngl e Sweep Recording
Analyzing a TrendPlot or Scope Record
From a Scope TrendPlot or Scope Record you can use
the analysis funct ions CURSO RS and ZO OM to perfo r m
detailed waveform analysis. These functions are
described in Chapter 4: “Using Replay, Zoom and
Cursors”.
34
Page 43

Chapter 4
Using Replay, Zoom and Cursors
About this Chapter
This chapter covers t he c apabilit ies of the analysis
functions Cursor, Zoom, and Replay. These functions
can be used with one or more of the prim ar y f unct ions
Scope, TrendPlot or Scope Record.
It is possible to combine two or three analysis functions.
A typical application using these functions follows:
• First replay the last screens to find t he scr een of
special int e rest.
• Then zoom in on the signal event.
• Finally, make measurements using the cursors.
Replaying the 100 Most Recent Scope
Screens
When you are in scope mode, the test t ool aut om at ically
stores the 100 most r ecent scr eens. When you pr ess the
HOLD key or the REPLAY key, the memory cont ent s ar e
frozen. Use the funct ions in the
in time” by stepping through the st or ed scr eens t o f ind t he
screen of your interest. This f eat ur e let s you capt ur e and
view signals even if you did not press
REPLAY menu to “ go back
HOLD.
35
Page 44

Fluke 192/196/199
Users Manual
Replaying Step-by-Step
To step through the last scope screens, do the following:
1 From scope mode, open the
REPLAY menu.
Observe that the trace is frozen
and that REPLAY appear s at t he
top of the screen (see Figur e 21) .
2 Step through the previous
screens.
Figure 21. Replaying a W avef or m
3 Step through the next screens.
Observe that the bottom of the wavefor m ar ea displays
the replay bar with a screen number and r elated t im e
stamp:
36
The replay bar represents all 100 stored screens in
memory. The
displayed on the screen (in this example:
icon represents the picture being
SCREEN -84). If
the bar is partly white, the m em or y is not com pletely f illed
with 100 screens.
From this point you can use the zoom and cur sor
functions to study the signal in more detail.
Page 45

Using Replay, Zoom and Cursors
Replaying the 100 Most Recent Scope Screens
4
Replaying Continuously
You can also replay the stored screens continuously, like
playing a video tape.
To replay continuously, do the following:
1 From Scope mode, open the
REPLAY menu.
Observe that the trace is frozen
and REPLAY appears at t he t op of
the screen.
2 Continuously replay the stored
screens in ascending order.
Wait until the screen with the signal event of interest
appears.
3 Stop the continuous replay.
Turning Off the Replay Function
4 Turn off REPLAY.
Capturin g 100 Intermit tents Auto mat ically
When you use the test tool in trigger ed m ode, 100
triggered screens are captur ed. This way you could use
Pulse Triggering to trigger and capture 100 int er m it t ent
glitches or you could use External Triggering to capture
100 UPS startups.
By combining the trigger possibilities with the capability of
capturing 100 screens for later r eplay, you can leave t he
test tool unattended t o capt ur e inter mittent signal
anomalies.
For triggering, see Chapter 5: “Tr igger ing on Wavef or m s ”.
37
Page 46

Fluke 192/196/199
Users Manual
Zooming in on a Waveform
To obtain a more detailed view of a waveform, you can
zoom in on a waveform using the
To zoom in on a waveform, do the f ollowing:
1 Display the ZOOM key labels.
Observe that the trace is frozen,
HOLD appears at the top of the
screen, and the waveform is
magnified.
ZOOM function.
Figure 22. Zooming in a Waveform
2 Enlarge (decrease the time/div)
or shrink (increase the time/div)
the waveform.
3 Scroll. A position bar displays the
position of the zoomed part in
relation to the total waveform.
Tip
Even when the key labels are not displayed at
the bottom of t he scr een, you can still use the
arrow keys to zoom in and out.
38
Observe that the bottom of the wavefor m ar ea displays
the zoom ratio, position bar, and time/div (see Figure 22).
The zoom range depends on the amount of dat a sam ples
stored in memory.
From this point you can use the cursor f unction for further
measurements on the wavefor m .
Page 47

Using Replay, Zoom and Cursors
Zooming in on a Waveform
4
Displaying the Zoomed Waveform
The VIEW ALL f eat ur e is usef ul when you quickly need to
see the complete waveform and t hen r et ur n t o t he
zoomed part.
4 Display the complete waveform.
Press repeatedly to toggle between the zoomed
part of the waveform and the complete waveform.
Turning Off the Zoom Function
5 Turn off the ZOOM function.
39
Page 48

Fluke 192/196/199
Users Manual
Making Cursor Measurements
Cursors allow you to make precise digital measurements
on waveforms. This can be done on live waveforms,
recorded waveforms, and on saved wavefor m s.
Using Horizontal Cursors on a W avef orm
To use the cursors for a voltage m easurement, do the
following:
1 From scope mode, display the
cursor key labels.
2 Press to highlight . Observe
that two horizontal cursors are
displayed.
3 Highlight the upper cursor.
4 Move the upper cursor t o t he
desired position on the screen.
5 Highlight the lower cursor.
6 Move the lower cursor to the
desired position on the screen.
Note
Even when the key labels are not displayed at
the bottom of t he s cr een, you still can use the
arrow keys. This allows full control of both
cursors while having full screen view.
Figure 23. Voltage M easur em ent with Cursors
The screen shows the voltage difference between t he t wo
cursors and the voltage at t he cur sor s. ( See Figure 23. )
Use horizontal cursors to measure the amplitude, high or
low value, or overshoot of a waveform.
40
Page 49

Using Vertical Cursors o n a Waveform
To use the cursors for a t ime m easurement, do the
following:
1 From scope mode, display the
cursor key labels.
2 Press to highlight . Observe
that two vertical cursors are
displayed. Markers (—) identify
the point where the cursors cross
the waveform.
Using Replay, Zoom and Cursors
Making Cursor Measurements
Figure 24. Time Measurement wi t h Cursor s
4
3 If necessary, choose the t r ace:
TRACE A ,B, or M (Mathem at ics).
4 Highlight the left cursor.
5 Move the left cursor to the
desired position on the
waveform.
6 Highlight the right cursor.
7 Move the right cursor to the
desired position on the
waveform.
The screen shows the time difference bet ween t he
cursors and the voltage differ ence bet ween t he t wo
markers. (See Figure 24. )
8 Turn off the cursor s.
41
Page 50

Fluke 192/196/199
Users Manual
Using Cursors on a A+B, A-B or A*B Waveform
Cursor measurements on a A*B wavefor m give a reading
in Watts if input A measures (m illi)Volts and input B
measur es (milli)Amp eres.
For other cursor m easur em ent s on a A+B, A- B or A*B
waveform no r eading will be available if the input A and
input B measurement unit are dif f er ent .
Making Ri se Time Measurements
To measure rise time, do t he f ollowing:
1 From scope mode, display the
cursor key labels.
2 Press to highlight (rise time).
Observe that two horizontal
cursors are displayed.
3 If only one trace is displayed,
select MANUAL or AUTO (this
automatically does steps 4 to 6).
For multiple traces select the
required trace A, B, or M ( if a
math function is active).
4 Move the upper cursor t o 100%
of the trace height. A mar k er is
shown at 90%.
5 Highlight the other cursor.
6 Move the lower cursor to 0% of
the trace height. A mar ker is
shown at 10%.
The reading shows the risetime from 10% - 90% of t he
trace amplitude.
Figure 25. Riseti m e M easur em ent
42
Page 51

Chapter 5
Triggering on Waveforms
About this Chapter
This chapter provides an introduction to t he t r igger
functions of the test t ool. Tr igger ing tells the t est tool
when to begin displaying the waveform. You can use
fully automatic triggering, t ake cont r ol of one or m or e
main trigger functions (sem i- aut om at ic t r iggering) , or you
can use dedicated trigger functions to capt ur e special
waveforms.
Following are some typical trigger applications:
• Use the Connect-and-View™ function to have full
automatic triggering and instant display of virt ually
any waveform.
• If the signal is unstable or has a very low frequency,
you can control the trigger level, slope, and t r igger
delay for a better view of the signal. ( See next
section.)
• For dedicated applications, use one of the four
manual trigger functions:
• Edge triggering
• External triggering
• Video triggering
• Pulse Width triggering
43
Page 52

Fluke 192/196/199
Users Manual
Setting Trigger Level and Slope
The Connect-and-View™ function enables hands-off
triggering to display complex unknown signals.
When your test tool is in manual range, do t he following:
Perform an auto set . AUTO appears
at the top right of t he scr een.
Automatic triggering assures a stable display of virtually
any signal.
From this point, you can take over t he basic t r igger
controls such as level, slope and delay. To optimize
trigger level and slope manually, do the following:
Figure 26. Screen with all Tri gger I nf or m ation
1 Display the TRIGGER key labels.
2 Trigger on either positive slope or
negative slope of the chosen
waveform.
3 Enable the arrow keys for manual
trigger level adjustment.
44
4 Adjust the trigger level.
Observe the trigger icon that indicates the trigger
position, trigger level, and slope.
At the bottom of t he scr een t he trigger parameters ar e
displayed. (See Figure 26.) For example,
means that input A is used as the tr igger sour ce with a
positive slope.
When no trigger is found, t he t r igger par ameters appear
in gray.
Page 53

Using Trigger Delay or Pre-trigger
You can begin to display the waveform some time befor e
or after the t r igger point has been det ected. Initially, you
have 2 divisions of pre-trigger view (negative delay).
To set the trigger delay, do t he f ollowing:
5 Hold down to adjust the trigger
delay.
Triggering on Wavef or m s
Using Trigger Delay or Pre-trigger
5
Observe that t he t r igger icon on the screen moves to
show the new trigger position. When the t r igger posit ion
moves left off of the screen, the trigger icon changes into
to indicate that you have selected a trigger delay.
Moving the trigger icon to the r ight on t he display gives
you a pre-trigger view.
In case of a trigger delay, t he st at us at the bottom of t he
screen will change. For exam ple:
This means that input A is used as the trigger sour ce with
a positive slope. The 500.0 ms indicates the (positive)
delay between trigger point and waveform display.
When no trigger is found, t he t r igger par ameters appear
in gray.
Figure 27. Trigger Del ay or Pr e- trigger View
Figure 27 shows an example of a trigger delay of 500 ms
(top) and an example of pre- t r igger view of 8 divisions
(bottom).
45
Page 54

Fluke 192/196/199
Users Manual
Automatic Trigger Options
In the trigger menu, settings for autom at ic t r iggering can
be changed as follows. (See also Chapter 1: “Displaying
an Unknown Signal with Connect-and-View”)
1 Display the TRIGGER key labels.
Note
The
TRIGGER key labels can differ depending on
the latest trigger f unct ion used.
2 Open the Trigger Options menu.
3 Open the Automati c Tr i gger
menu.
If the frequency r ange of the automatic triggering is set to
> 15 Hz, the Connect-and-View™ function responds
more quickly. The response is quicker because the test
tool is instructed not to analyze low frequency signal
components. However, when you measure f r equencies
lower than 15 Hz, the test tool must be inst r uct ed t o
analyze low frequency components for autom at ic
triggering:
4 Select > 1 HZ and r et ur n to the
measurement screen.
46
Page 55

Triggering on Wavef or m s
Triggering on Edges
5
Triggering on Edges
If the signal is instable or has a very low frequency, use
edge triggering to obtain full manual trigger cont r ol.
To trigger on rising edges of the input A waveform , do the
following:
1 Display the TRIGGER key labels.
2 Open the Trigger Options menu.
3 Open the Trigger on Edge menu.
When Free Run is selected, the test t ool updates t he
screen even if there are no tr iggers. A t r ace always
appears on the screen.
When On Trigger is selected, t he t est t ool needs a
trigger to display a waveform. Use t his mode if you want
to update the screen only when valid triggers occur.
When Single Shot is selected, the test tool waits for a
trigger. After r eceiving a tr igger, the waveform is
displayed and the instruments is set to HOLD.
In most cases it is advised to use the Free Run m ode:
4 Select Fr ee Run, jump to Noise
reject Filter.
5 Set Noise rej ect Fi lter to Off.
Observe that the key labels at t he bot tom of the screen
have adapted to allow further selection of specific edge
trigger settings:
47
Page 56

Fluke 192/196/199
Users Manual
Triggering on Noisy Waveforms
To reduce jitter on the screen when tr iggering on noisy
waveforms, you can use a noise rejection filter. Continue
from step 3 of t he pr evious example as f ollows:
4 Select On Trigger, jump to Noise
reject Filter.
5 Set Noise rej ect Fi lter to On.
Observe that the trigger gap has increased. This is
indicated by a taller trigger icon
.
Making a Single Acquisition
To catch single events, you can perform a si ngle shot
acquisition (one-time screen update). To set up t he test
tool for a single shot of the input A waveform, continue
from step 3 again:
4 Select Single Shot.
5 Accept the settings.
The word WAITING appears at the t op of t he scr een
indicating that the test t ool is waiting for a t r igger. As
soon as the test tool receives a tr igger, t he wavef or m is
displayed and the instrument is set to hold. This is
indicated by the word
HOLD at top of the scr een.
48
Page 57

The test tool will now have a sc r een lik e Figur e 28.
6 Arm the test tool f or a new single
shot.
Tip
The test tool stores all single shots in the replay
memory. Use the Replay funct ion to look at all
the stored single shots.
Triggering on Wavef or m s
Triggering on Edges
Figure 28. Making a Si ngle Shot Measurement
5
49
Page 58

Fluke 192/196/199
Users Manual
Triggering on External Waveforms
Use external triggering when you want to display
waveforms on inputs A and B while triggering on a third
signal. You can choose external triggering with automatic
triggering or with edge triggering.
1 Supply a signal to the red and black 4-mm
banana jack inputs. See Figure 29.
In this example you continue from t he Tr igger on Edges
example. To choose the external signal as trigger source,
continue as follows:
2 Display the TRIGGER (On Edges)
key labels.
3 Select Ext (external) edge tr igger.
Observe that the key labels at t he bot t om of the screen
have been adapted to allow selection of two different
external trigger levels: 0.12 V and 1.2 V:
50
Figure 29. External Tr iggering
4 Select 1.2V under the Ext LEVEL
label.
From this point the tr igger level is fixed and is compatible
with logic signals.
Page 59

Triggering on Video Signals
To trigger on a video signal, first select the st andar d of
the video signal you are going to measure:
1 Apply a video signal to the red input A.
2 Display the TRIGGER key labels.
3 Open the Trigger Options menu.
Triggering on Wavef or m s
Triggering on Video Signals
Figure 30. Measuri ng Interlaced Video Signals
5
4 Select Video on A to open the
Trigger on Video menu.
5 Select positive signal polarity for
video signals with negative going
sync pulses.
6
Trigger level and slope are now fixed.
Observe that the key labels at t he bot tom of the screen
have been changed to allow further selection of specific
video trigger settings:
Select the video standard and
return.
51
Page 60

Fluke 192/196/199
Users Manual
Triggering on Video Frames
Use FIELD 1 or FIELD 2 to trigger either on the first half
of the frame ( odd) or on the second half of the fram e
(even).
To trigger on the second half of t he frame, do the
following:
7 Choose FIELD 2.
The signal part of the even field is displayed on the
screen.
Triggering on Video Lines
Use ALL LINES to trigger on all line synchronization pulses
(horizontal synchronization).
7 Choose ALL LINES.
The signal of one line is displayed on the screen. The
screen is updated with the signal of the next line
immediately after the t est tool triggers on the horizontal
synchronization pulse.
To view a specific video line in more detail, you can select
the line number. For example, t o m easur e on video line
123, continue from step 5 as follows:
7 Enable video line selection.
8 Select number 123.
The signal of line 123 is displayed on the screen.
Observe that the st atus line now also shows the selected
line number. The screen is continuously updated with the
signal of line 123.
52
Page 61

Triggering on Pulses
Use pulse width triggering to isolate and display specific
pulses that you can qualify by time, such as glitches,
missing pulses, bursts or signal dropouts.
Detecting Narrow Pulses
To set the test tool t o t r igger on nar r ow positive pulses
shorter than 5 ms, do the following:
1 Apply a video signal to the red input A.
2 Display the TRIGGER key labels.
3 Open the Trigger Options menu.
Triggering on Wavef or m s
Triggering on Pulses
4 Select Pul se W idth on A... to
open the Trigger on Puls e
Width menu.
5 Select the positive pulse icon,
then jump to Condition.
6 Select <t, then jump to Update.
7 Select O n Tr igger.
The test tool is now prepared to t r igger on nar r ow pulses
only. Observe that t he t r igger key labels at t he bot tom of
the screen have been adapted to set t he pulse
conditions:
5
53
Page 62

Fluke 192/196/199
Users Manual
To set the pulse width to 5 ms, do t he f ollowing:
7 Enable the arrow keys to adjust
the pulse width.
8 Select 5 ms .
All narrow positive pulses shorter than 5 ms are now
displayed on the screen. (See Figure 31.)
Tip
The test tool stores all triggered scr eens in the
replay memory. For exam ple, if you set up your
triggering for glitches, you can captur e 100
glitches with time stamps. Use the
look at all the stored glitches.
REPLAY key to
Figure 31. Trigger ing on Narrow Glitches
54
Page 63

Triggering on Wavef or m s
Triggering on Pulses
5
Finding Missing Pulses
The next example covers finding missing pulses in a train
of positive pulses. In this example it is assumed that t he
pulses have a 100 ms distance between the rising edges.
If the time accidently increases to 200 m s, a pulse is
missing. To set the test t ool to t r igger on such m issing
pulses, let it trigger on gaps bigger than about 150 m s.
Do the following:
1 Display the TRIGGER key labels.
2 Open the Trigger Options menu.
3 Select Pulse Width on A... to
open the Trigger on Puls e
Width menu.
4 Select the positive pulse icon to
trigger on the gap between the
positive pulses, then jump to
Condition.
5 Select >t, then jump to Update.
6 Select O n Tr igger.
The test tool is now prepared to t r igger on pulse gaps.
Observe that t he t r igger m enu at the bottom of t he
screen has been adapted to set the pulse condition:
55
Page 64

Fluke 192/196/199
Users Manual
To set the pulse width to 150 ms, cont inue as follows:
7 Enable the arrow keys to adjust
the pulse width.
8 Select 150 ms.
Figure 32. Trigger ing on Missing Pulses
56
Page 65

Chapter 6
Using Memory, PC and Printer
About this Chapter
This chapter provides a step-by-st ep intr oduction to the
general functions of the test t ool t hat can be used in the
three main modes: Scope, M et er , or Recorder. You will
find information on printer and com puter communication
at the end of this chapter .
Saving and Recalling
You can:
• Save screens and setups to memory, and r ecall
them again from mem or y. The test tool has 10
screen and setup memories and 2 recor d and set up
memories.
• Recall screens and recordings to analyze or print the
screen image at a later date.
• Recall a setup to continue a measurement with the
recalled operating configuration.
57
Page 66

Fluke 192/196/199
Users Manual
Saving Screens with Associated Setups
To save a screen in memory location 10, do the f ollowing:
1 Display the SAVE/PRINT key labels.
From this point the screen is f r ozen unt il you hide the
SAVE/PRINT key labels again.
2 Open the Save menu.
Observe that free memory
locations are indicated by an open
square (p). Filled memory
locations are indicated by a solid
square (n).
3 Highlight SCREEN+SETUP location 10.
4 Save the actual screen.
Note
The two record+setup memor y locations st or e
more than what is just visible on the screen.
In TrendPlot or scope record m ode t he f ull
recording is saved. In scope mode you can save
all 100 replay screens in a single record+setup
memory location.
58
Page 67

Using Memory, PC and Pr inter
Saving and Recalling
6
Deleting S creens with Associated Setups
To delete all screens and associated setups, continue
from step 2 of t he pr evious example as f ollows:
3 Delete all saved screens and
setups.
To delete only one screen and setup, continue from st ep
2 of the previous example as follows:
3 Highlight SCREEN+SETUP location 5.
4 Delete the saved screen+setup of
memory location 5.
Recalling Screens wit h Associated S et ups
To recall screen+setup 2, do the following:
1 Display the SAVE/PRINT key labels.
2 Open the Recall menu.
3 Highlight SCREEN+SETUP location 2.
4 Use RECALL to recall the saved
screen.
Observe that the r ecalled waveform is displayed and that
HOLD appears on the screen. Fr om t his point you can use
cursors and zoom for analysis or you can print t he
recalled screen.
59
Page 68

Fluke 192/196/199
Users Manual
Recalling a Setup Configuration
To recall the setup configuration fr om m em or y 2, do the
following:
1 Display the SAVE/PRINT key labels.
2 Open the Recall menu.
3 Highlight SCREEN+SETUP location 2.
4 Use RECALL SETUP to recall the
saved setup.
Observe that RUN appears at the top right of the scr een.
From this point you continue in the new operating
configuration.
Viewin g Stored Screens
To scroll through the memories while looking at the
stored screens, do the f ollowing:
1 Display the SAVE/PRINT key labels.
2 Open the viewer.
3 Scroll through all stored screens.
Use this function to quickly find a stored screen.
60
Page 69

Using Memory, PC and Pr inter
Documenting Screens
6
Documenting Screens
With the FlukeView® software you can upload waveform
data and screen bitmaps to your PC or not ebook
computer for f ur t her pr ocessing. Pr inting can also be
done by connecting the test tool directly t o a pr inter .
Connecting to a Computer
To connect the test tool t o a PC or not ebook com put er
and use the FlukeView software for Windows
do the following:
l
Use the Optically Isolated RS-232 Adapter/Cable
(PM9080) to connect a computer to the OPTICAL
PORT of the test tool. ( See Figure 33. )
Figure 33. Connecting a Comput er
®
(SW90W),
Note
For information about installing and using the
FlukeView ScopeMeter software, see the
SW90W Users Manual.
A Software & Cable Carrying Case Kit is optionally
available as model number SCC190.
61
Page 70

Fluke 192/196/199
Users Manual
Connecting to a Printer
To print a screen directly to a printer , use one of the
following adapters:
l
The Optically Isolated RS-232 Adapter / Cable
(PM9080) to connect a serial print er t o t he O PTI CAL
PORT of the test tool. ( See Figure 34. )
l
The Print Adapter Cable (PAC91, optional) t o
connect a parallel printer to the O PTI CAL PORT of
the test tool. ( See Figure 35. )
Before printing, you must set up t he t est t ool f or a specific
printer.
Figure 34. Connecting a Serial Printer
62
Figure 35. Connecting a Par allel Print er
Page 71

Using Memory, PC and Pr inter
Documenting Screens
6
Setting up the Printing Configuration
This example demonstrates how to set up t he test tool for
printing on a postscript printer with a 9600 baud r at e:
1 Display the USER OPTIONS key
labels.
2 Open the User Opti ons m enu.
3 Open the Printer Setup submenu.
4 Select Postscript and jump to
Baud Rate.
5 Select a baud rate of 9600 and
return to norm al mode.
Whenever possible, choose the option Postscript when
printing screens. This option gives the best printing
results. Consult the manual that cam e with your pr inter to
find out whether it has Postscript pr inting possibilities.
Printing a Screen
To print the currently displayed screen, do the following:
1 Clear the menu if you do not want
to print it.
2 Display the SAVE/PRINT key labels.
3 Start printing.
A message appears at the bottom of the screen
indicating that the test tool is busy printing.
63
Page 72

Fluke 192/196/199
Users Manual
64
Page 73

Chapter 7
Tips
About this Chapter
This chapter gives you information and tips on how you
can make the best use of the t est tool.
Using the Standard Accessories
The following illustrations s how t he us e of t he s t andard
accessories such as voltage probes, test leads, and t he
various clips.
65
Page 74

Fluke 192/196/199
Users Manual
Figure 36. Probing Usi ng 2- m m Heavy Duty
Test Probes
Warning
To avoid electrical shock or fire, do not
connect the ground spring t o vol t ages higher
than 30 Vrms from ear th ground.
Figure 38. Heavy Duty Fixed Connecti ons f or Scope
Measurements Using I ndust r i a l Alligator Clips
Figure 37. HF Voltage Pr obe Connect i on Usi ng
Ground Spring
66
Figure 39. Elect ronic Connections for Scope
Measurements Using Hook Cli ps and Hook Clip
Grounding
Page 75

Tips
Using the Standard Accessories
7
Figure 40. Elect ronic Connections for Scope
Measurements Using Hook Cli ps and Alligator Clip
Grounding
Figure 41. Fixed El ect r oni c Connect i ons for Scope
Measurements wi th Fixed External Tri gger ing
Figure 42. Manual Probing for Meter M easur e me nt s
using 2-mm Test Pr obes
Figure 43. Heavy Duty Fixed Connecti ons f or M et e r
Measurements Using I ndust r i a l Alligator Clips
67
Page 76

Fluke 192/196/199
Users Manual
Using the Independently Floating
Isolated Inputs
You can use the independently floating isolated inputs to
measure signals that are independently floating f r om
each other.
Independently floating isolated inputs offer additional
safety and measur em ent c apabilit ies com pared to inputs
with common references or gr ounds.
Measuring Using In dependen t ly Floating
Isolated Inputs
The test tool has independently floating isolated inputs.
Each input section (A, B, External Trigger / DMM ) has it s
own signal input and its own reference input. The
reference input of each input sect ion is electrically
isolated from the ref er ence input s of t he ot her input
sections. The isolated input architecture m akes t he t est
tool about as versatile as having three independent
instruments. The advantages of having independently
floating isolated inputs are:
• It allows simultaneous measurement of
independently floating signals.
• Additional safety. Since the commons are not direct ly
connected, the chance of causing short cir cuit when
measuring multiple signals is greatly reduced.
• Additional safety. When measuring in systems with
multiple grounds, the ground curr ent s induced are
kept to a minimum.
Because the references are not connected together
inside the test tool, each refer ence of the used inputs
must be connected to a ref er ence voltage.
Independently floating isolated inputs are still coupled by
parasitic capacitance. This can occur between the input
references and the environment , and between the input
references mutually (see Figure 44) . For this reason, you
should connect the references to a syst em gr ound or
another stable voltage. If t he reference of an input is
connected to a high speed and / or high voltage signal,
you should be aware of parasitic capacitance.
(See Figures 45, 46, 47 and 48.)
68
Page 77

Tips
ANALOG INPUT
ANALOG INPUT
Using the Independently Floating Isolated Input s
DIGITAL CONTROLLER
DIGITAL
ANALOG
GROUND
GROUND
7
Figure 44. Parasit i c capaci tance between probes,
instrument and envi r onm ent
MOTION/MOTOR CONTROLLER
DIGITAL
GROUND
DC BUS
DC BUS
+
M
-
Figure 45. Parasit i c capacitance between analog and
digital r ef e re nce
Figure 46. Correct connect ion of reference leads
DIGITAL CONTROLLER
DIGITAL
ANALOG
GROUND
GROUND
Figure 47. Wrong connect i on of r eference leads
Noise that is picked up by reference lead B can be
transmitted by parasit ic capacitance t o t he analog input
amplifier.
69
Page 78

Fluke 192/196/199
Users Manual
Using the Tilt Stand
The test tool is equipped with a tilt stand, allowing viewing
from an angle while placed on a table. From this position
you can access the OPTICAL PORT at the side of the
test tool. The typical position is shown in Figure 48.
Figure 48. Using the Tilt Stand
Resetting the Test Tool
If you want to reset the test tool to the factory settings, do
the following:
1 Turn the test tool off.
2 Press and hold.
3 Press and release.
The test tool turns on, and you should hear a double
beep, indicating the reset was successful.
4 Release.
Suppressing Key Labels and Menu’s
You can hide a menu or key label at any time:
Hide any key label or menu.
To display menus or key labels, press one of the yellow
menu keys, e.g. the
SCOPE key.
70
Page 79

Tips
Changing the Information Language
7
Changing the Information Language
During operation of the test t ool, m essages m ay appear
at the bottom of the screen. You can select the language
in which these messages are displayed. The combination
of selectable languages (one or more) depends on t he
version ordered.
In this example you can select English or French . To
change the language from English to French, do t he
following:
1 Display the USER key labels.
2
3
4
Open the Language Select
menu.
Highlight FRENCH.
Accept French as the language.
Adjusting the Contrast and Brightness
After power-up, t he scr een has a br ight display. To adjust
the contrast and backlight brightness, do t he following:
1 Display the USER key labels.
2 Enable the arrow keys for manual
contrast and backlight
adjustment.
3 Adjust the contrast of t he scr een.
4 Change the backlight.
Note
The new contrast and brightness are st or ed unt il
a new adjustment is made.
To save battery power, t he t est t ool is in economic
brightness mode when operated on the bat t er y . The high
brightness intensity increases when you connect the
power adapter.
Note
Using dimmed light lengthens maximum battery
power operation by about one hour.
71
Page 80

Fluke 192/196/199
Users Manual
Changing Date and Time
The test tool has a date and time clock. For exam ple, t o
change the date to 19 April, 1999, do t he f ollowing:
1 Display the USER key labels.
2 Open the User Opti ons m enu.
3 Open Date Adjust menu.
4 Choose 1999, jump to Month.
5 Choose 04, jump to Day.
6 Choose 19, jump to Format.
7 Choose DD/MM/YY, accept the
new date.
You can change the time in a similar way by opening the
Time Adjust menu (steps 2 and 3.)
72
Page 81

Tips
Saving Battery Life
7
Saving Battery Life
When operated on the batt er y ( no battery charger
connected), the test t ool conserves power by shut t ing
itself down. If you have not pressed a key f or at least 30
minutes, the test tool turns itself off autom atically.
Note
If the power adapter is connected, there is no
automatic power shutdown.
Automatic power shutdown will not occur if TrendPlot or
Scope Record is on, but the backlight will dim. Recording
will continue even if the battery is low, and retention of
memories is not jeopardized.
Setting the Power Down Timer
Initially the power shutdown time is 30 minutes. You can
set the power shutdown time to 5 m inut es as f ollowing:
1 Display the USER key labels.
2 Open the User Opti ons m enu.
3 Open the Battery Save O pt i ons
menu.
4 Select 5 M inutes.
73
Page 82

Fluke 192/196/199
Users Manual
Changing the Auto Set Options
With the next procedure you can choose how auto set
behaves when you press the
AUTO (auto set) key.
4 Select Signal > 1 Hz, then jump
to Coupling.
1 Display the USER key labels.
2 Open the User Opti ons m enu.
3 Open the Auto Set Adjust
menu.
If the frequency r ange is set t o > 15 Hz, t he Connect - andView function responds more quickly. The response is
quicker because the test tool is instructed not t o analyze
low frequency signal components. However, when you
measure frequencies lower than 15 Hz, the t est tool must
be instructed to analyze low frequency components for
automatic triggering:
74
With the coupling option you can choose how auto set
behaves. When you press the
AUTO (auto set) key, t he
coupling can either be set to dc or left unchanged:
5 Select Unchanged.
Note
The auto set option for t he signal frequency is
similar to the automatic t r igger option for the
signal frequency. (See Chapter 5: “Aut om at ic
Trigger Options”). However, t he aut o set option
determines the behavior of t he aut o set function
and shows only effect when you press the auto
set key.
Page 83

Chapter 8
Maintaining the Test Tool
About this Chapter
This chapter covers basic maintenance procedures t hat
can be performed by the user . For com plete ser v ice,
disassembly, repair, and calibration informat ion, see t he
Service Manual. You will f ind t he par t number of the
Service Manual in the section “Parts and Accessories” in
this chapter.
Cleaning the Test Tool
Clean the test tool with a damp cloth and a mild soap. Do
not use abrasives, solvents, or alcohol. These m ay
damage the text on the t est tool.
Storing the Test Tool
If you are storing the test tool for an extended per iod of
time, charge the NiMH (Nickel-Metal Hydride) bat t er ies
before storing.
75
Page 84

Fluke 192/196/199
Users Manual
Charging the Batteries
At delivery, the NiMH batteries may be empt y and m ust
be charged for 4 hours (with the test tool turned off ) t o
reach full charge. When fully charged, t he batteries
provide 4 hours of use.
When battery power is used, t he bat tery indicator at the
top of the screen inform s you about the condition of the
batteries. The batter y sym bols are:
symbol
of operating time left .
To charge the batteries and power t he instr um ent,
connect the battery char ger as shown in Figure 49. To
charge the batteries mor e quickly, tur n of f the test tool.
To avoid overheating of t he bat teries during
charging, do not exceed the allowable
ambient temperature given in the
specifications.
No damage will occur if t he c har ger is connec t ed
for long periods, e.g., dur ing t he weekend. The
instrument then autom at ically switches to tr ickle
charging.
indicates that there are t ypically five minutes
Caution
Note
. The
Figure 49. Charging t he Batt er ies
76
Page 85

Maintaini ng t he Test Tool
Extending Battery Oper at ion Time
8
Extending Battery Operation Time
Typically, NiMH batteries always meet the specified
operating time. However, if t he bat t er ies have been
extremely discharged (for exam ple, when empt y bat teries
were stored for a long period) it is possible that the
battery condition has deteriorated.
To keep the batteries in optimal condition, observe t he
following guidelines:
• Operate the test tool on batteries until the
symbol appears at the bottom of the screen. This
indicates that the batter y level is low and that the
NiMH batteries need to be recharged.
• To obtain optimal battery condition again, you can
refresh the batteries. During a battery ref r esh, t he
batteries will be fully discharged and charged again.
A complete refresh cycle takes about 12 hours and
should be done about four times a year. You can
check the latest battery r ef r esh dat e. See sect ion
“Displaying Calibration Information”.
To refresh the battery, make sure that the test tool is line
powered and proceed as follows:
1 Display the USER key labels.
2 Open the User Opti ons m enu.
A message appears asking whether you want to start t he
refresh cycle now.
3 Start the refr esh cycle.
Do not disconnect the batt er y char ger dur i ng t he
refresh cycle. Thi s w ill interrupt the refresh cycle.
Note
After starting t he r ef r esh cycle, t he scr een will be
black.
77
Page 86

Fluke 192/196/199
Users Manual
Replacing the NiMH Battery Pack BP190
Usually it should not be necessary to replace the batter y
pack. However, if replacement is needed, t his should be
done by qualified personnel only. Contact your nearest
Fluke center for more inf or m at ion.
Calibrating the Voltage Probes
To meet full user specifications, you need to adjust the
red and gray voltage probes for optimal response. The
calibration consists of a high frequency adjustment and a
dc calibration for 10:1 probes. The dc calibrat ion is not
possible for 100:1 probes.
This example shows how to calibrate the 10:1 voltage
probes:
1 Display the input A key labels.
2 Open the Probe on A menu.
3 Select Voltage, then jump t o
Attenuation.
78
Figure 50. Adjusti ng Vol t age Pr obes
If the 10:1 option is already selected, pr oceed with st ep 5.
4 Select 10:1, then return.
Page 87

Maintaini ng t he Test Tool
Calibrating the Voltage Probes
8
Repeat steps 2 and 3 and proceed as follows:
5 Select Pr obe Cal with the arrow
keys, then accept.
A message appears asking you whether to start t he 10: 1
probe calibration.
6 Start the probe calibration.
A message appears telling you how to connect the probe.
Connect the red 10:1 voltage probe f r om the red input A
jack to the red banana jack. Connect the ref er ence lead
to the black banana jack. (See Figure 50.)
7 Adjust the trimmer screw in the
probe housing until a pure square
wave is displayed.
8 Continue with DC calibration.
Automatic DC calibration is only
possible for 10:1 voltage probes.
The test tool automat ically calibrates itself t o t he pr obe.
During calibration you should not touch the probe. A
message indicates when the DC calibration has
completed successfully.
9 Return.
Repeat the procedure for the gray 10:1 voltage probe.
Connect the grey 10:1 voltage probe f r om t he grey input
B jack to the red banana jack. Connect the refer ence lead
to the black banana jack.
Note
When using 100:1 voltage probes, choose 100:1
attenuation to perf or m a HF adjustm ent .
Automatic dc calibration is not possible with this
probe type.
79
Page 88

Fluke 192/196/199
Users Manual
Displaying Calibration Information
You can display version number and calibration date:
1 Display the USER key labels.
2 Open the Version & Calibration
menu.
The screen gives you information about the m odel
number with software version, t he calibrat ion number with
latest calibration date, and the latest bat t er y r ef r esh dat e.
3 Return.
Recalibration must be carried out by qualified personnel.
Contact your local Fluke representative for r ecalibrat ion.
Parts and Accessories
Standard Accessories
The following tables list the user-replaceable parts for t he
various test tool models. For additional optional
accessories, see the ScopeMeter Accessories booklet.
To order replacement part s or addit ional accessories,
contact your nearest ser vice cent er .
80
Page 89

Maintaini ng t he Test Tool
Parts and Accessories
Table 1. Standard Accessories
Item Ordering Code
Battery Charger, available models:
Universal Europe 230 V, 50 and 60 Hz
North America 120 V, 50 and 60 Hz
United Kingdom 240 V, 50 and 60 Hz
Japan 100 V, 50 and 60 Hz
Australia 240 V, 50 and 60 Hz
Universal 115 V/230 V, 50 and 60 Hz
*
The 230V rating of the BC190/808 is not for use in Nort h Am er ica.
A line plug adapter complying with the applicable National
Requirements may be provided to alter t he blade conf igurat ions f or
a specific country. The universal adapter is st andar d equipped with
a North American line cord.
Voltage Probe Set (Red), designed for use with t he Fluke ScopeMet er
190 series test tool.
The set includes the following items (not available separately):
• 10:1 Voltage Probe (red)
• 4-mm Test Probe f or Probe Tip ( r ed)
• Hook Clip for Probe Tip (red)
• Ground Lead with Hook Clip (red)
• Ground Lead with Mini Alligator Clip (black)
• Ground Spring for Probe Tip (black)
*
BC190/801
BC190/803
BC190/804
BC190/806
BC190/807
BC190/808
VPS200-R
8
81
Page 90

Fluke 192/196/199
Users Manual
Item Ordering Code
Voltage Probe Set (Gray), designed f or use with t he Fluke ScopeMet er
190 series test tool.
The set includes the following items (not available separately):
• 10:1 Voltage Probe (gray)
• 4-mm Test Probe for Pr obe Tip (gr ay)
• Hook Clip for Probe Tip (gray)
• Ground Lead with Hook Clip (gray)
• Ground Lead with Mini Alligator Clip (black)
Flexible Test Leads (red and black)
Accessory Set (Red)
The set includes the following items (not available separately):
• Industrial Alligat or f o r Pr obe Tip ( red)
• 2-mm Test Probe f or Probe Tip ( r ed)
• Industrial Alligator for Banana Jack (red)
• 2-mm Test Probe for Banana Jack ( r ed)
• Ground Lead with 4-mm Banana Jack (black)
Accessory Set (Gray)
The set includes the following items (not available separately):
• Industrial Alligat or f o r Pr obe Tip (gray)
• 2-mm Test Probe for Pr obe Tip (gr ay)
• Industrial Alligator for Banana Jack ( gr a y)
• 2-mm Test Probe for Banana Jack (gr ay)
• Ground Lead with 4-mm Banana Jack (black)
VPS200-G
TL24 (General Purpose Leads)
AS200-R
AS200-G
82
Page 91

Maintaini ng t he Test Tool
Parts and Accessories
Item Ordering Code
Replacement Set for Voltage Probe
The set includes the following items (not available separately):
• 2x 4-mm Test Probe for Pr obe Tip (r ed and gr ay)
• 3x Hook Clip for Probe Tip (2 red, 1 gray)
• 2x Ground Lead with Hook Clip (red and gray)
• 2x Ground Lead with Mini Alligator Clip (black)
• 5x Ground Spring for Probe Tip (black)
Table 2. Users Manuals
Item Ordering Code
Users Manual (English)
Users Manual (German)
Users Manual (French)
Users Manual (Spanish)
Users Manual (Portuguese)
Users Manual (Italian)
Users Manual (Chinese)
Users Manual (Japanese)
Users Manual (Korean)
RS200
4822 872 00983
4822 872 00984
4822 872 00985
4822 872 00986
4822 872 00987
4822 872 00988
4822 872 00989
4822 872 00991
4822 872 00992
8
83
Page 92

Fluke 192/196/199
Users Manual
Optio nal Accessories
Item Ordering Code
Software & Cable Carrying Case Kit
SCC190
Set contains the following parts:
Optically Isolated RS-232 Adapter/Cable
Hard Carrying Case
®
FlukeView
2000
ScopeMeter® Software for Windows 95® , 98® , Me® ,
®
and NT4
®
PM9080
C190
SW90W
Optically Isolated RS-232 Adapter/Cable PM9080
Hard Case C190
Soft Case C195
Current Shunt 4-20 mA CS20MA
Print Adapter Cable for Parallel Printers PAC91
Optional Service Manual
Item Ordering Code
Service Manual (English) 4822 872 05376
84
Page 93

Maintaini ng t he Test Tool
Troubleshooting
8
Troubleshooting
The Test Tool Does Not Start Up
• The batteries may be completely empty. In this case
the test tool will not start up, even if it is powered by
the battery charger . Charge the batteries fir st : power
the test tool with the bat t er y char ger without turning it
on. Wait about 15 minutes and tr y turning on the test
tool again.
The Test Tool Shuts Down After A Few Seconds
• The batteries may be empty. Check the battery
symbol at the top right of t he scr een. A
indicates that the batter ies are em pt y and m ust be
charged.
The Screen Remai ns Black
• Make sure that the t est t ool is on.
• You might have a problem with the screen contrast.
Press
arrow keys to adjust the contrast .
, then press
. Now you can use the
symbol
The Operation Time Of Fully Charged Batteries
Is Too Short
• The batteries may be in poor condition. Refr esh t he
batteries to optimize t he condition of t he bat teries
again. It is advised to refr esh t he bat teries about four
times a year.
The Printer Does Not Print
• Make sure that the inter face cable is properly
connected between the test t ool and the pr int er .
• Make sure that you have selected the cor r ect pr inter
type. (See Chapter 6. )
• Make sure that the baud r at e m at c hes with t he
printer. If not, select another baud rat e.
(See Chapter 6.)
• If you are using the PAC91 (Print Adapter Cable),
make sure that it is tur ned on.
85
Page 94

Fluke 192/196/199
Users Manual
FlukeView Does Not Recognize The Test Tool
• Make sure that the t est t ool is tur ned on.
• Make sure that the inter face cable is properly
connected between the test t ool and the PC.
• Make sure that the cor r ect COM por t has been
selected in FlukeView. If not, change the COM por t
setting or connect the inter f ace cable t o anot her
COM port.
Battery Operated Fluke Accessori es Do Not
Function
• When using battery operated Fluke accessories,
always first check the battery condition of t he
accessory with a Fluke multimeter.
86
Page 95

Chapter 9
Specifications
Introduction
Performance Characteristics
FLUKE guarantees the properties expressed in numer ical
values with the stated tolerance. Specified non-t olerance
numerical values indicate those that could be nominally
expected from the m ean of a r ange of identical
ScopeMeter test t ools.
Environmental Data
The environmental data mentioned in this manual ar e
based on the results of the manuf acturer’s verification
procedures.
Safety Characteristi cs
The test tool has been designed and tested in
accordance with Standards ANSI/ISA S82.01-1994, EN
61010.1 (1993) (IEC 1010-1) , CAN/CSA-C22.2
No.1010.1-92 (including approval), UL3111-1 (including
approval) Safety Requirements f or Electr ical Equipment
for Measurement , Cont r ol, and Labor atory Use.
This manual contains information and warnings that must
be followed by the user to ensure safe operat ion and t o
keep the instrument in a safe condition. Use of t his
equipment in a manner not specified by the manufacturer
may impair protection provided by the equipment.
87
Page 96

Fluke 192/196/199
Users Manual
Dual Input Oscilloscope
Isolated Inputs A and B (Vertical)
Bandwidth, DC Coupled
FLUKE 199....................................... 200 MHz (- 3 dB)
FLUKE 196....................................... 100 MHz (- 3 dB)
FLUKE 192......................................... 60 MHz (-3 dB)
Lower Frequency Limit, AC Coupled
with 10:1 probe...................................... <2 Hz (-3 dB)
direct (1:1).............................................<5 Hz (-3 dB)
Rise Time
FLUKE 199....................................................... 1.7 ns
FLUKE 196....................................................... 3.5 ns
FLUKE 192....................................................... 5.8 ns
Analog Bandwidth Limiters.............. 20 MHz and 10 kHz
Input Coupling ................................................... AC, DC
Polarity................................................Normal, Inverted
Sensitivity Ranges
with 10:1 probe............................ 50 mV to 1000 V/div
direct (1:1)...................................... 5 mV to 100 V/div
Trace Positioning Range..............................
Input Impedance on BNC
DC Coupled.....................1 M
Ω (±1 %)// 15 pF ( ±2 pF)
±4 divisions
Max. Input Voltage
with 10:1 probe......................................600 V CAT III
1000 V CAT II
direct (1:1) .............................................300 V CAT III
(For detailed specifications, see “Safety”)
Vertical Accuracy....................
Digitizer Resolution...................8 bits, separate digitizer
±(1.5 % + 0.04 range/ div)
for each input
Horizontal
Maximum Time Base Speed:
FLUKE 199..................................................... 5 ns/div
FLUKE 196..................................................... 5 ns/div
FLUKE 192...................................................10 ns/div
Minimum Time Base Speed (Scope Record) ....2 min/div
Real Time Sampling Rate (for both inputs simultaneously)
FLUKE199:
5 ns to 2
µs to 120 s/div..........................................20 MS/s
5
FLUKE 196:
5 ns to 2
5
µs to 120 s/div..........................................20 MS/s
FLUKE 192
10 ns to 2
µs to 120 s/div..........................................20 MS/s
5
µs /div................................. up to 2.5 GS/s
µs /div.................................... up to 1 GS/s
µs /div .............................. up to 500 MS/s
88
Page 97

Specifications
Dual Input Oscilloscope
9
Record Length
Scope Record Mode.......... 27500 points on each input
Scope Normal Mode............1000 points on each input
Scope Glitch Capture Mode...500 points on each input
Glitch De tection
µs to 120 s/div.......displays glitches as fast as 50 ns
5
Waveform Display...............A, B, A+B, A-B, A*B, A vs B
Normal, Average (2,4,8, 64 x) , Per sist ence
Time Base Accuracy......................................±100 ppm
Trigger and Delay
Trigger Modes..................................... Automatic, Edge,
External, Video, Pulse Width
Trigger Delay ............................... up to +1000 divisions
Pre Trigger View ...........................one full screen length
Max. Delay...................................................10 seconds
Automatic Connect-and-View Trigger
Source........................................................... A, B, EXT
Slope.................................................Positive, Negative
Edge Trigger
Screen Update..........Free Run, On Trigger, Single Shot
Source........................................................... A, B, EXT
Slope.................................................Positive, Negative
Trigger Level Control Range.........................
Trigger Sensitivity A and B
DC to 5 MHz at >5 mV/div........................0.5 divisions
DC to 5 MHz at 5 mV/div.............................. 1 division
200 MHz (FLUKE 199) .................................1 division
250 MHz (FLUKE 199) ............................... 2 divisions
100 MHz (FLUKE 196) .................................1 division
150 MHz (FLUKE 196) ............................... 2 divisions
60 MHz (FLUKE 192) ................................... 1 division
100 MHz (FLUKE 192) ............................... 2 divisions
±4 divisions
Isolated External Trigger
Bandwidth...........................................................10 kHz
Modes..................................................Automatic, Edge
Trigger Levels (DC to 10 kHz) ................. 120 mV, 1.2 V
Video Trigger
Standards ...........................PAL, PAL+, NTSC, SECAM
Modes.....................Lines, Line Select, Field 1 or Field 2
Source ........................................................................ A
Polarity...............................................Positive, Negative
Sensitivity.....................................0.7 division sync level
89
Page 98

Fluke 192/196/199
Users Manual
Pulse Width Trigger
Screen Update...........................On Trigger, Single Shot
Trigger Conditions..........<T, >T,
Source.........................................................................A
Polarity...................................Positive or negative pulse
Pulse Time Adjustment Range.......1/100 div. to 250 div.
with a maximum resolution of 50 ns.
≈T (±10 %), ≠T( ±10 %)
Continuous Auto Set
Autoranging attenuators and t im e base, aut om at ic
Connect-and-View™ triggering with automatic source
selection.
Modes
Normal..................................15 Hz to max. bandwidth
Low Frequency .......................1 Hz to max. bandwidth
Minimum Amplitude A and B
DC to 1 MHz.....................................................10 mV
1 MHz to max. bandwidth..................................20 mV
Automatic Capturing Scope Screens
Capacity.......................... 100 dual input scope Screens
For viewing screens, see Replay function.
Automatic Scope Measurements
The accuracy of all readings is within ± (% of reading +
number of counts) f r om 18
accuracy) for each
voltage measurements with 10:1 pr obe, add probe
accuracy unless the probe has been calibrated on the
test tool. At least 1.5 wavef or m period m ust be visible on
the screen.
°C below 18 °C or above 28 °C. For
General
Inputs ..................................................................A and B
DC Common Mode Rejection (CMRR) ................ >100 dB
AC Common Mode Rejection at 50, 60, or 400 Hz ......>60 dB
DC Voltage ( V DC)
Maximum Voltage
with 10:1 probe..................................................1000 V
direct (1:1) ...........................................................300 V
Maximum Resolution
with 10:1 probe.....................................................1 mV
direct (1:1) ......................................................... 100 µV
Full Scale Reading........................................1100 counts
Accuracy at 5 s to 5
Normal Mode AC Rejection at 50 or 60 Hz ...........>60 dB
°C to 28 °C. Add 0.1x (specific
µs/div..................±(1.5 % +5 counts)
90
Page 99

AC Voltage ( V AC)
Maximum Voltage
with 10:1 probe................................................1000 V
direct (1:1).........................................................300 V
Maximum Resolution
with 10:1 probe...................................................1 mV
direct (1:1).......................................................100 µV
Full Scale Reading..................................... 1100 counts
Accuracy
DC coupled:
DC to 60 Hz..............................
AC coupled, low frequencies:
50 Hz direct (1:1).....................
60 Hz direct (1:1).....................
With the 10:1 probe the low fr equency r oll off point will
be lowered to 2 Hz, which improves the AC accuracy
for low frequencies. When possible use DC coupling
for maximum accuracy.
AC or DC coupled, high frequencies:
60 Hz to 20 kHz.......................
20 kHz to 1 MHz.........................
1 MHz to 25 MHz......................
For higher frequencies the instrum ent ’s fr equency r oll
off starts af f ect ing accuracy.
Normal Mode DC Rejection...........................>50 dB
±(1.5 % +10 counts)
±(2.1 % + 10 counts)
±(1.9 % + 10 counts)
±(2.5 % + 15 counts)
±(5 % + 20 counts)
±(10 % + 20 counts)
Specifications
Automatic Scope Measurements
All accuracies are valid if:
• The waveform amplitude is larger than one division
• At least 1.5 waveform period is on the scr een
AC+DC Volt age (True RMS)
Maximum Voltage
with 10:1 probe................................................1000 V
direct (1:1).........................................................300 V
Maximum Resolution
with 10:1 probe...................................................1 mV
direct (1:1).......................................................100 µV
Full Scale Reading.....................................1100 counts
Accuracy
DC to 60 Hz ...............................
60 Hz to 20 kHz..........................
20 kHz to 1 MHz............................
1 MHz to 25 MHz ........................
For higher frequencies the instrum ent ’s fr equency r oll
off starts affecting accuracy.
±(1.5 % + 10 counts)
±(2.5 % + 15 counts)
±(5 % + 20 counts)
±(10 % + 20 counts)
9
91
Page 100

Fluke 192/196/199
Users Manual
Amperes (AMP)
With Optional Current Probe or Curr ent Shunt
Ranges...........................same as VDC, VAC, VAC+DC
Probe Sensitivity................100 µV/A, 1 m V/ A, 10 m V/A,
100 mV/A, 1 V/A, 10 V/A, and 100 V/ A
Accuracy ........................same as VDC, VAC, VAC+DC
(add current probe or cur r ent shunt accuracy)
Peak
Modes .........................Max peak, Min peak, or pk-to-pk
Maximum Voltage
with 10:1 probe............................................... 1000 V
direct (1:1)........................................................ 300 V
Maximum Resolution
with 10:1 probe................................................ 10 mV
direct (1:1)......................................................... 1 mV
Full Scale Reading....................................... 800 counts
Accuracy
Max peak or Min peak.............................
Peak-to-peak ..........................................
±0.2 division
±0.4 division
Frequency (Hz)
Range....................................1.000 Hz to full bandwidth
Full Scale Reading.................................... 9 999 counts
with at least 10 waveform periods on screen.
Accuracy
1 Hz to full bandwidth....................
±(0.5 % +2 counts)
Duty Cycle (DUTY )
Range...................................................4.0 % to 98.0 %
Pulse Width (PULSE)
Resolution ( with GLITCH off)....................... 1/100 division
Full Scale Reading....................................... 999 counts
Accuracy
1 Hz to full bandwidth....................
±(0.5 % +2 counts)
92
 Loading...