

Page 1

1760
®
Power Quality Recorder
Users Manual
June 2006 Rev. 2, 5/10
© 2006-2010 Fluke Corporation, All rights reserved. Specifications are subject to change without notice.
All product names are trademarks of their respective companies.
Find Quality Products Online at: sales@GlobalTestSupply.com
www.GlobalTestSupply.com
Page 2

LIMITED WARRANTY AND LIMITATION OF LIABILITY
Each Fluke product is warranted to be free from defects in material and workmanship under normal use and
service. The warranty period is two years and begins on the date of shipment. Parts, product repairs, and
services are warranted for 90 days. This warranty extends only to the original buyer or end-user customer of
a Fluke authorized reseller, and does not apply to fuses, disposable batteries, or to any product which, in
Fluke's opinion, has been misused, altered, neglected, contaminated, or damaged by accident or abnormal
conditions of operation or handling. Fluke warrants that software will operate substantially in accordance
with its functional specifications for 90 days and that it has been properly recorded on non-defective media.
Fluke does not warrant that software will be error free or operate without interruption.
Fluke authorized resellers shall extend this warranty on new and unused products to end-user customers
only but have no authority to extend a greater or different warranty on behalf of Fluke. Warranty support is
available only if product is purchased through a Fluke authorized sales outlet or Buyer has paid the
applicable international price. Fluke reserves the right to invoice Buyer for importation costs of
repair/replacement parts when product purchased in one country is submitted for repair in another country.
Fluke's warranty obligation is limited, at Fluke's option, to refund of the purchase price, free of charge repair,
or replacement of a defective product which is returned to a Fluke authorized service center within the
warranty period.
To obtain warranty service, contact your nearest Fluke authorized service center to obtain return
authorization information, then send the product to that service center, with a description of the difficulty,
postage and insurance prepaid (FOB Destination). Fluke assumes no risk for damage in transit. Following
warranty repair, the product will be returned to Buyer, transportation prepaid (FOB Destination). If Fluke
determines that failure was caused by neglect, misuse, contamination, alteration, accident, or abnormal
condition of operation or handling, including overvoltage failures caused by use outside the product’s
specified rating, or normal wear and tear of mechanical components, Fluke will provide an estimate of repair
costs and obtain authorization before commencing the work. Following repair, the product will be returned to
the Buyer transportation prepaid and the Buyer will be billed for the repair and return transportation charges
(FOB Shipping Point).
THIS WARRANTY IS BUYER'S SOLE AND EXCLUSIVE REMEDY AND IS IN LIEU OF ALL OTHER
WARRANTIES, EXPRESS OR IMPLIED, INCLUDING BUT NOT LIMITED TO ANY IMPLIED WARRANTY
OF MERCHANTABILITY OR FITNESS FOR A PARTICULAR PURPOSE. FLUKE SHALL NOT BE LIABLE
FOR ANY SPECIAL, INDIRECT, INCIDENTAL OR CONSEQUENTIAL DAMAGES OR LOSSES,
INCLUDING LOSS OF DATA, ARISING FROM ANY CAUSE OR THEORY.
Since some countries or states do not allow limitation of the term of an implied warranty, or exclusion or
limitation of incidental or consequential damages, the limitations and exclusions of this warranty may not
apply to every buyer. If any provision of this Warranty is held invalid or unenforceable by a court or other
decision-maker of competent jurisdiction, such holding will not affect the validity or enforceability of any other
provision.
11/99
Find Quality Products Online at: sales@GlobalTestSupply.com
www.GlobalTestSupply.com
Page 3

Table of Contents
Chapter Title Page
1 Introduction ......................................................................................... 1-1
About this Manual.................................................................................. 1-3
Symbols................................................................................................. 1-3
CAT Identification .................................................................................. 1-4
Safety Instructions................................................................................. 1-4
Safety Instructions on Device Housing.................................................. 1-7
Mains Connection.............................................................................. 1-7
Input Voltage – Measuring Inputs...................................................... 1-8
Servicing and Maintenance ............................................................... 1-8
Design and Functions............................................................................ 1-8
Mains Connection and Interfaces ...................................................... 1-8
Functional Description ....................................................................... 1-10
Basic Measurements............................................................................. 1-18
Measurement Types.......................................................................... 1-18
Measurements................................................................................... 1-19
2 Getting Started .................................................................................... 2-1
Delivered Items ..................................................................................... 2-3
Setup ..................................................................................................... 2-4
Installation ......................................................................................... 2-4
Switching the Device On ................................................................... 2-4
Switching the Device Off ................................................................... 2-4
Simple Measurement - Function Check ................................................ 2-4
Transport and Storage .......................................................................... 2-9
Transport ........................................................................................... 2-9
Storage .............................................................................................. 2-9
3 Operation ............................................................................................. 3-1
Connections to Measuring Circuits........................................................ 3-3
Connecting Sequence ....................................................................... 3-3
Connection Diagrams ........................................................................ 3-4
1-Phase Measurement .................................................................. 3-4
3-Wire Network with Two Current Sensors (ARON2 Method)....... 3-5
3-Wire Network with Two Current Sensors (ARON2 Method,
Open Delta Method) ...................................................................... 3-7
i
Find Quality Products Online at: sales@GlobalTestSupply.com
www.GlobalTestSupply.com
Page 4

1760
Users Manual
4-Wire Network: 3-Wattmeter Method ........................................... 3-8
Four-Wire Network: Three-Wattmeter Method with N Conductor
Voltage and N Conductor Current ................................................. 3-9
Two Star-Connected Voltage Systems.......................................... 3-11
Two Voltage Systems in Delta Configuration ................................ 3-12
Methods of Measurement/Formulas...................................................... 3-13
Parameter Aggregation ..................................................................... 3-13
Calculation of Power Parameters ...................................................... 3-14
Aggregations 200 ms and higher................................................... 3-14
Real power .................................................................................... 3-14
Apparent power ............................................................................. 3-15
Reactive power.............................................................................. 3-15
Power factor .................................................................................. 3-16
Displacement power factor cos φ .................................................. 3-16
Half and full cycle aggregations......................................................... 3-17
Real power .................................................................................... 3-17
Apparent power ............................................................................. 3-18
Reactive power.............................................................................. 3-18
Power factor .................................................................................. 3-18
Events and Flicker ............................................................................. 3-18
Harmonics and Interharmonics Parameters ...................................... 3-19
Signaling Voltage............................................................................... 3-22
Unbalance, Overdeviation, Underdeviation ....................................... 3-22
Current Unbalance ........................................................................ 3-23
Overdeviation and Underdeviation ................................................ 3-24
4 Maintenance......................................................................................... 4-1
Introduction............................................................................................ 4-3
Maintenance of Battery Package........................................................... 4-3
Cleaning ................................................................................................ 4-3
Replacement of Battery Pack................................................................ 4-4
Decommissioning and Disposal ............................................................ 4-4
Shutting Down ................................................................................... 4-4
Recycling and Disposal ..................................................................... 4-5
Warranty................................................................................................ 4-5
Recalibration ......................................................................................... 4-5
5 Specifications ...................................................................................... 5-1
General Specifications .......................................................................... 5-3
6 Options and Accessories ................................................................... 6-1
Instruments............................................................................................ 6-3
Accessories ........................................................................................... 6-3
Standard Voltage Probes for AC and DC .......................................... 6-4
Flexible Current Probes for AC.......................................................... 6-5
Current Probes for AC Currents ........................................................ 6-5
Shunt Resistors for AC and DC Currents .......................................... 6-6
Other Accessories ............................................................................. 6-6
Current Clamp 1 A/10 A AC .............................................................. 6-6
Current Clamp 5 A/50 A AC .............................................................. 6-10
Current Clamp 20 A/200 A AC .......................................................... 6-14
Flexi Current Sensor 100 A/500 A..................................................... 6-17
Flexi Current Sensor 200 A/1000 A................................................... 6-21
ii
Find Quality Products Online at: sales@GlobalTestSupply.com
www.GlobalTestSupply.com
Page 5

Flexi Current Sensor 3000 A/6000 A................................................. 6-24
GPS-Time Synchronization Module Option........................................... 6-27
Contents (continued)
iii
Find Quality Products Online at: sales@GlobalTestSupply.com
www.GlobalTestSupply.com
Page 6

List of Tables
Table Title Page
1-1. Symbols..................................................................................................... 1-3
1-2. Controls and Indicators ............................................................................. 1-9
3-1. Symbols in the Connection Diagrams ....................................................... 3-4
3-2. Parameter Aggregation Matrix .................................................................. 3-25
v
Find Quality Products Online at: sales@GlobalTestSupply.com
www.GlobalTestSupply.com
Page 7

List of Figures
Figure Title Page
1-1. CAT ........................................................................................................... 1-4
1-2. Instrument Labels...................................................................................... 1-7
1-3. Top View ................................................................................................... 1-8
1-4. Front View ................................................................................................. 1-9
2-1. Communication Cables ............................................................................. 2-3
3-1. Circuit Diagram: 1-Phase Measurement ................................................... 3-4
3-2. Circuit Diagram: 3-Wire Network (Aron 2)................................................. 3-6
3-3. Circuit Diagram: Aron 2 Method/Open Delta Method................................ 3-7
3-4. Circuit Diagram: 4-Wire Network (Wye Connection) ................................. 3-8
3-5. Circuit Diagram: 4-Wire ............................................................................. 3-10
3-6. Circuit Diagram: 2 Voltage System with Neutral ....................................... 3-11
3-7. Circuit Diagram: 2 Voltage System in Delta Connection ........................... 3-12
vii
Find Quality Products Online at: sales@GlobalTestSupply.com
www.GlobalTestSupply.com
Page 8

Chapter 1
Introduction
Title Page
About this Manual ............................................................................................... 1-3
Symbols ............................................................................................................... 1-3
CAT Identification............................................................................................... 1-4
Safety Instructions ............................................................................................... 1-4
Safety Instructions on Device Housing................................................................ 1-7
Mains Connection............................................................................................ 1-7
Input Voltage – Measuring Inputs................................................................... 1-8
Servicing and Maintenance ............................................................................. 1-8
Design and Functions........................................................................................... 1-8
Mains Connection and Interfaces .................................................................... 1-8
Functional Description .................................................................................... 1-10
Basic Measurements ............................................................................................ 1-18
Measurement Types......................................................................................... 1-18
Measurements.................................................................................................. 1-19
1-1
Find Quality Products Online at: sales@GlobalTestSupply.com
www.GlobalTestSupply.com
Page 9

Introduction
About this Manual 1
About this Manual
This manual consists of several chapters.
• Introduction
• Getting Started
• Operation
• Maintenance
• Specifications
• Options and Accessories
Symbols
Table 1-1 shows the symbols used on the instrument and/or in this manual.
Table 1-1. Symbols
Symbol Description
X Hazardous voltage. Risk of electric shock.
W Important information. See manual.
- Do not apply around or remove from HAZARDOUS LIVE conductors.
J Earth ground.
T Double insulation.
B AC (Alternating Current)
F DC (Direct Current).
P Conforms to requirements of European Union.
)
~
Canadian Standards Association is the certified body used for testing
compliance to safety standards.
Do not dispose of this product as unsorted municipal waste. Go to Fluke’s
website for recycling information.
; Conforms to relevant Australian Standards.
CAT II
CAT III
IEC Overvoltage Category/Measurement Category II equipment is designed
to be protected against transients from socket outlets and similar points.
IEC Overvoltage Category III equipment is designed to protect against
transients in installations, such as distribution panels, feeders and short
branch circuits, and lighting systems in large buildings.
IEC Overvoltage Category IV equipment is designed to protect against
CAT IV
transients from the primary supply level, such as an electricity meter or an
overhead or underground utility service.
1-3
Find Quality Products Online at: sales@GlobalTestSupply.com
www.GlobalTestSupply.com
Page 10

1760
Users Manual
CAT Identification
Figure 1-1 shows an example to identify the locations of different measurement
categories (CAT).
Safety Instructions
The design and manufacture of the device conform to the latest state of technology and
the safety standards laid down in EN/IEC 61010-1:2001 (2
there is a risk of injury to persons and damage of property.
Please read this section carefully. It will familiarize you with important safety
instructions for handling your 1760 Power Quality Recorder. In this manual a
identifies conditions and actions that pose hazard(s) to the user. A Caution identifies
conditions and actions that may damage the Recorder.
The 1760 Power Quality Recorder is referred to as ‘Recorder’ throughout
the manual.
To avoid electric shock or personal injury:
• The Power Quality Recorder must only be used and
handled by qualified personnel.
Figure 1-1. CAT
Note
XW Warnings
nd
ed.). If used improperly,
Warning
1_1.bmp
• Maintenance work must be done only by qualified service
personnel.
• Use only specified voltage and current probes. If you use
flexible current probes, wear suitable protective gloves or
work on de-energized conductors.
• Protect the Recorder against wetness and humidity.
• Do not hold the Current Clamp anywhere beyond the tactile
barrier.
• To prevent electrical shock, always connect current probe
test leads to the Recorder before connecting to the load.
1-4
Find Quality Products Online at: sales@GlobalTestSupply.com
www.GlobalTestSupply.com
Page 11

Introduction
• To avoid electrical shock, do not connect the voltage
measuring or power supply input to systems with higher
voltages to ground (earth) than is marked on the Recorder.
• To avoid damage to the Recorder, never connect the
voltage measuring inputs to phase-to-phase voltages
higher than defined on the voltage sensors.
• To avoid damage to the Recorder, never connect the power
supply voltage inputs to phase-to-phase voltages.
• Use only the provided original or specified accessories.
• Use these accessories only in the specified overvoltage
category areas.
• Current transformers should not be applied or removed
from HAZARDOUS LIVE conductors without using highvoltage gloves.
• Flexi-probes should not be applied to or removed from
hazardous live conductors.
• Use the clamps only on insulated conductors, max. 600 V
rms or dc to ground.
Safety Instructions 1
• The power company side of the revenue power meter is
considered a CAT IV area. To avoid electrical shock or
damage to the equipment, never supply the Recorder from
the power in this area.
• Additional personal protective measures as required by
local government agencies must be taken if the measuring
sensors are installed on live conductors.
• Avoid connection from multiple channels to the same
phase.
Protection Class
This device is assigned to protection class I according to IEC 61140 and is equipped with
a protective earth connector.
Qualified Personnel
The device may only be operated by suitably qualified personnel. The adequate
qualifications required are:
• Trained and authorized to switch on/off, ground (earth) and mark the power
distribution circuits and devices in accordance with the safety standards of
electrical engineering
• Training or instruction in accordance with the standards of the safety engineering
in maintenance and use of appropriate safety equipment
• Training in first aid
Safe Operation
For safe operation of the Recorder:
• Ensure that all persons using the device have read and fully understood the
operating manual and safety instructions.
1-5
Find Quality Products Online at: sales@GlobalTestSupply.com
www.GlobalTestSupply.com
Page 12

1760
Users Manual
• The device may only be used under certain ambient conditions. Ensure that the
actual ambient conditions conform to the admissible conditions laid down in
Chapter 5, General Specifications.
• During the operation, ensure that the circulation of air around the instrument is
possible in order to prevent the accumulation of heat inside the housing.
• Always comply with the instructions in Chapter 2, Transport and Storage.
Proper Usage
Do not use the device for any other purpose other than measuring of voltages and
currents that are within the measuring ranges and categories, including voltage to earth as
laid down in Chapter 5, General Specifications.
Improper use shall void all warranty.
Electrical Connections
• Ensure that the power and connecting cables used with the device are in proper
working order.
• Ensure that the protective earth connector of the power lead and the housing
earth connector are connected according to the instructions to the low-resistance
unit earth cable.
• Ensure that the power and connecting cables as well as all accessories used in
conjunction with the device are in proper working order and clean.
• Install the device in such a way that its power cable is accessible at all times and
can easily be disconnected. If this is not applicable a two pole circuit breaker
with a nominal current must be installed in the power supply lines.
Risks During Operation
For connection work, do not work on your own but in teams of at least two persons.
Do not use the device if the housing or an operating element is damaged.
Ensure that the connected devices work properly.
Measurement sensors must not be connected to unfused circuits.
Connectors with locking mechanism have to be locked firmly.
Maintenance and Repairs
Do not open the housing.
Do not carry out any repairs and replace any component parts of the device other than the
replaceable battery.
Damaged connecting and power leads must be repaired or replaced by an authorized
service technician.
Authorized, specialized technicians may only repair damaged or defective devices.
Accessories
Only use the accessories supplied with the device or specifically available as optional
equipment for your model.
Ensure that any third-party accessories used in conjunction with the device conform to
IEC 61010-031/-2-032 standard and are suitable for respective measuring voltage range.
1-6
Find Quality Products Online at: sales@GlobalTestSupply.com
www.GlobalTestSupply.com
Page 13
Introduction
Safety Instructions on Device Housing 1
Device Shutdown
If you detect any damage to the housing, controls, power cable, connecting leads or
connected devices, immediately disconnect the measuring inputs of the unit and then
from the power supply.
If you are in doubt as regards the safe operation of the device, immediately shutdown the
unit and the respective accessories, secure them against inadvertent switching on and
bring them to an authorized service agent.
Safety Instructions on Device Housing
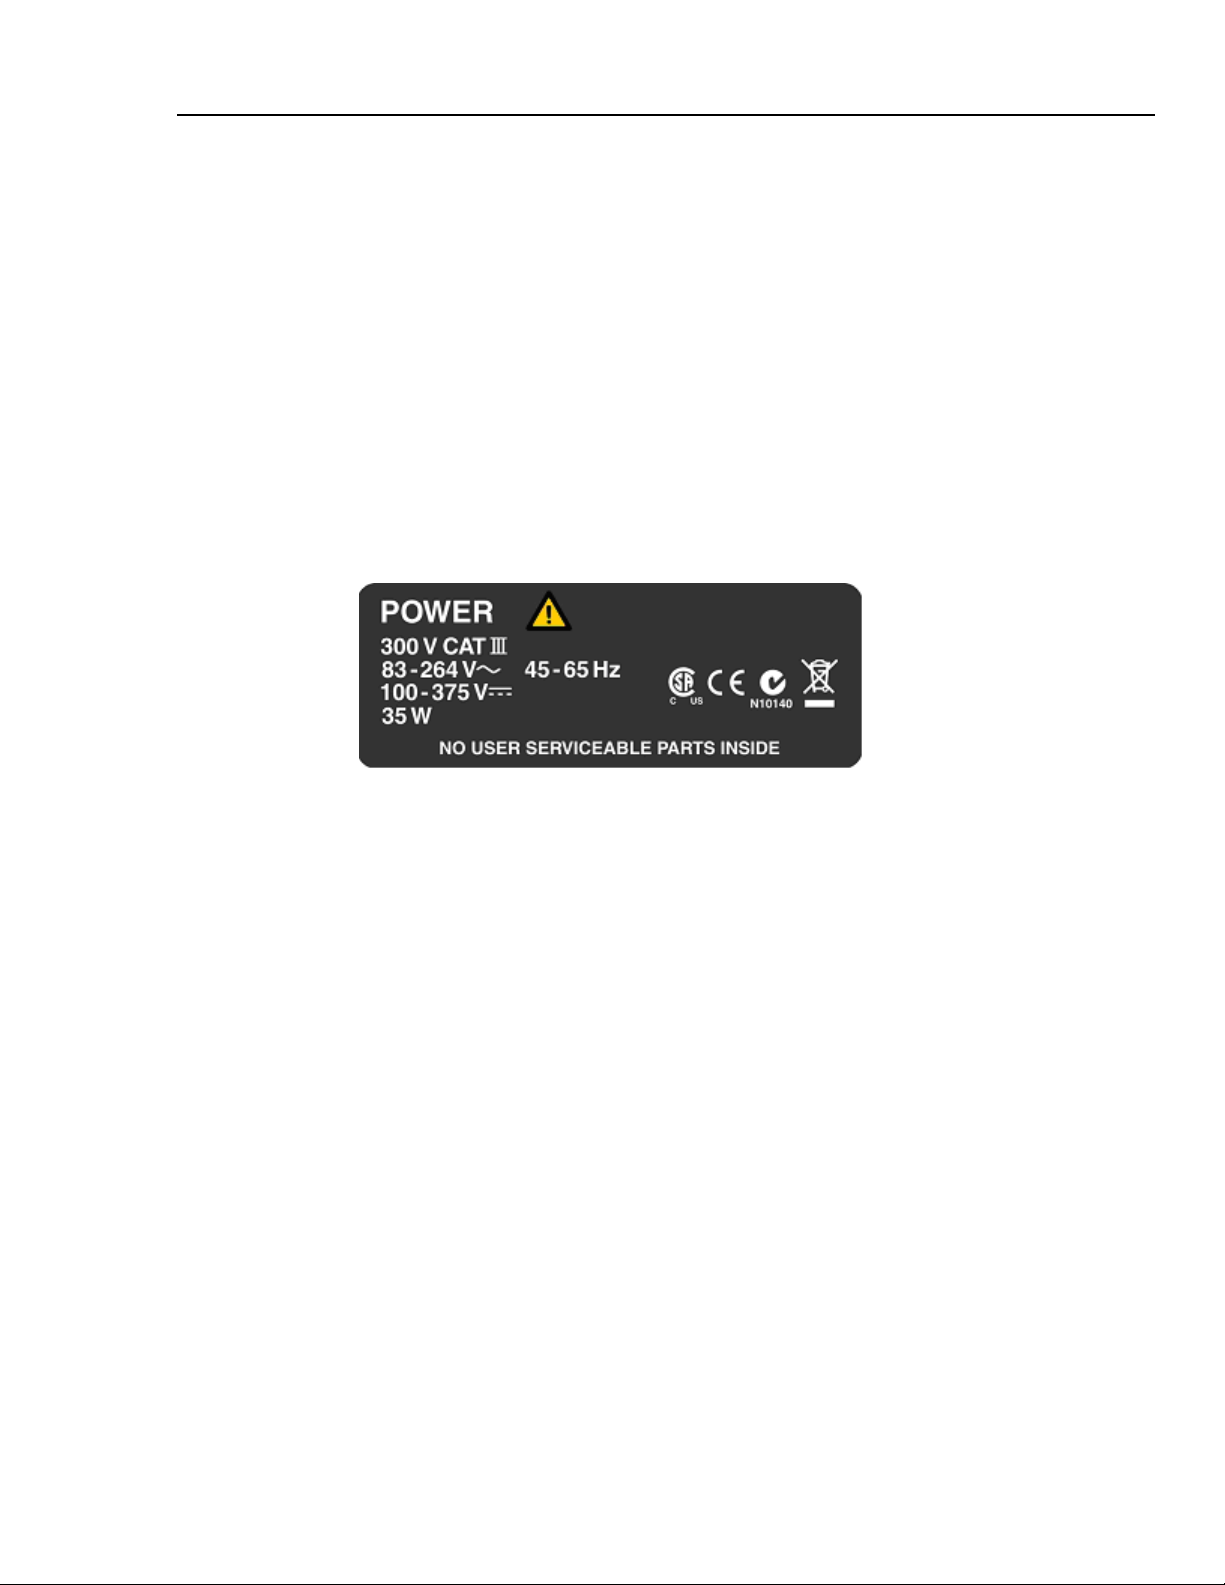
Mains Connection
The mains connection must conform to the ranges/values as inscribed on the instrument
labels.
Figure 1-2 shows the instrument labels.
Figure 1-2. Instrument Labels
schild-mains.wmf
schild-akku.wmf
1-7
Find Quality Products Online at: sales@GlobalTestSupply.com
www.GlobalTestSupply.com
Page 14

1760
J
Users Manual
Risk of voltage peaks in higher categories. Connect the supply
cable of the device only to sections CAT I, II or III of the supply
system (Refer to the ‘Functional Description’ section) the
voltage to earth may not exceed 300 V.
Input Voltage – Measuring Inputs
The measurement category (refer to Functional Description section) and the max. voltage
to earth of the sensors has to conform to the power supply system (See the inscription and
the technical specifications of the accessories).
Servicing and Maintenance
• Do not remove the cover
• Refer servicing to qualified personnel
• The user can replace the accumulator package (Refer to Chapter 4, Maintenance)
Design and Functions
This section provides an overview of the terminals, ports and interfaces of the Recorder,
as well as a list of displays and operating devices and a brief introduction to the basic
functions of the unit.
XW
Warning
Mains Connection and Interfaces
Figure 1-3 and Figure 1-4 show the top view and front view of the Recorder respectively.
11
Figure 1-3. Top View
grafikview.eps
1-8
Find Quality Products Online at: sales@GlobalTestSupply.com
www.GlobalTestSupply.com
Page 15

Introduction
Design and Functions 1
Figure 1-4. Front View
grafikview2.eps
Table 1-2 shows the controls and indicators of the Recorder.
Table 1-2. Controls and Indicators
Sl No. Description
A
B
C
D
E
F
G
H
I
J
K
1-9
Mains connection.
Mains switch.
LED indicators.
Ethernet connector
USB connectors type A.
COM1 – serial port (RS232).
Feature connector (GPS, DCF 77, COM2, alarms, etc).
Measurement input connectors.
Compact Flash card slot.
Compact Flash eject button and LED
Reset button.
Find Quality Products Online at: sales@GlobalTestSupply.com
www.GlobalTestSupply.com
Page 16

1760
Users Manual
Note
Channels ‘CH1’ to ‘CH4’ are labeled:
The text TRANSIENT indicates that these channels can be equipped with a
fast transient option.
Channels ‘CH5’ to ‘CH8’ cannot be used for fast transient recordings and
are labeled like this:
Functional Description
A Mains Connector
Connect the device to 83 V – 264 V AC-47 Hz – 65 Hz or 100 V – 375 V DC, power
consumption approx. 30 W.
Connect the supply cable of the device only to sections CAT I, II or III of
the supply system the voltage to earth may not exceed 300 V.
B Mains Switch
Activate the mains switch to switch the device on or off.
Note
Schild CH1.wmf
schild ch5.wmf
1-10
Note
The switch is secured by a mechanical feature against inadvertent
activation. Lift the knob slightly before moving it to the other position.
Instrument can be turned on only if the mains power supply is connected
and the supply voltage is within the specified range.
If the mains switch is in position I the instrument is turned on automatically
as soon as an appropriate supply voltage is applied to the mains connector.
If there is no mains supply and the battery pack capacity is too low the
instrument is turned off automatically.
Rebooting the Instrument
To reboot the instrument:
1. Set the mains switch to the 0-position.
2. Wait until all LEDs are off.
3. Connect instrument to mains and set the mains switch to the I-Position.
Find Quality Products Online at: sales@GlobalTestSupply.com
www.GlobalTestSupply.com
Page 17

Introduction
Design and Functions 1
Note
If the Reset button is held down while rebooting the instrument, the
Recorder’s stored data will be erased. This may be useful when the
Recorder memory is full and may help to resolve connection problems.
C LED Indicators
LEDs in the field Power:
Overview
Condition LED POWER LED UPS
Instrument boot Green OFF
Mains is on, battery is not charged
Mains is on, battery is charged
Battery operation
Green
Green
OFF
Green, yellow, or red according to
capacity
Slowly Flashing Green, yellow, or
red according to capacity
Green, yellow, or red according to
capacity
led-schild gesamt.wmf
led-power.wmf
Battery discharge mode
Instrument shutdown
OFF
Green, flashing
Flashing alternately
Flashing Green, yellow, or red,
Memory LEDs show “decreasing”
yellow flashlight
Flashing Green, yellow, or red
according to capacity
1-11
Find Quality Products Online at: sales@GlobalTestSupply.com
www.GlobalTestSupply.com
Page 18

1760
Users Manual
Details
These LEDs provide information about the power supply:
LED POWER:
• Continuously green: Instrument is supplied from mains
• OFF: Supply from battery package
LED UPS:
Indicates charging state of the UPS battery package:
• Green: Battery is charged with 80 % to 100 % of nominal capacity
• Yellow: Capacity is between 30 % and 80 %, mains independent operation is
possible for more than 3 minutes
• Red: Capacity is between 25 % and 30 % of nominal capacity. Mains
independent operation is possible for less than 3 minutes
• Flashing: During charging the LED is flashing red, yellow, or green
corresponding to charging state and turns to continuous green light when
charging is complete
LED RECORDING STATUS:
This indicator gives information about the recording status of the measurement campaign.
Condition LED RECORDING STATUS
Instrument is not yet initialized for a measurement
campaign
Measurement initialization is in progress, Instrument is
not yet ready for recording data
Measurement campaign has been initialized, but not yet
started
Measurement campaign is active, data are recorded Green, flashing slowly
Measurement campaign is active, data are recorded, but
some memory portions are full, i. e. some virtual
instruments do not record any more
Measurement campaign finished, no further campaign is
programmed, data ready for upload to the PC, Instrument
does not record data any more
In case of error Red
OFF
green, flashing rapidly
Green
Yellow, flashing slowly
Yellow
LEDs Time Sync:
led-timesync.wmf
1-12
Find Quality Products Online at: sales@GlobalTestSupply.com
www.GlobalTestSupply.com
Page 19

Introduction
Design and Functions 1
These indicators provide information about the time synchronization of the Instrument.
LED PULSE:
This LED indicates the reception of sync pulses. If Instrument is synchronized correctly
the LED is green and flashes yellow for each pulse detected.
If external pulses are used without GPS time information the LED is off and flashes red
for each detected sync pulse (to enable this, the “Pulse” protocol must be selected in the
“Time Synchronization Configuration” in the PQ Analyze software).
LED DATA:
• Green: The Recorder is configured for time synchronization (Service menu), a
time synchronization adaptor (GPS or DCF77) is connected, and the received
time information is valid.
• Yellow: The Recorder is configured for time synchronization; a time
synchronization adaptor is connected, but the received time information is not
correct. Possible reasons: No satellites or time source found or adaptor still
synchronizing after power on.
• Red: The Recorder is configured for time synchronization, but no time
synchronization adaptor is connected or it is not working properly.
• Off: The recorder is not configured for time synchronization.
LEDs for Data Transfer and Storage:
LED DATA TRANSFER:
The DATA TRANSFER LED indicates data transfer via external interfaces or to the
Compact Flash card.
• Off: No connection between PQ Analyze software and Recorder exists.
• Green: Connection between PQ Analyze software and Recorder established.
• Flashing yellow: data are written to the internal CF-card, external CF-card, USB
memory stick or data transfer via any of the interfaces (USB, RS232, or Ethernet)
LEDs MEMORY LEVEL:
The row of MEMORY LEVEL LEDs indicates the amount of free/occupied
measurement data memory on the Compact Flash card.
led-data.wmf
Occupied blocks are indicated by lit LEDs, 5 on the left side are green, 3 on the right side
are red to indicate that the memory is soon full.
During a forced battery discharge these LEDs are flashing yellow, the number of LEDs
lit represents the remaining capacity in minutes.
1-13
Find Quality Products Online at: sales@GlobalTestSupply.com
www.GlobalTestSupply.com
Page 20
1760
Users Manual
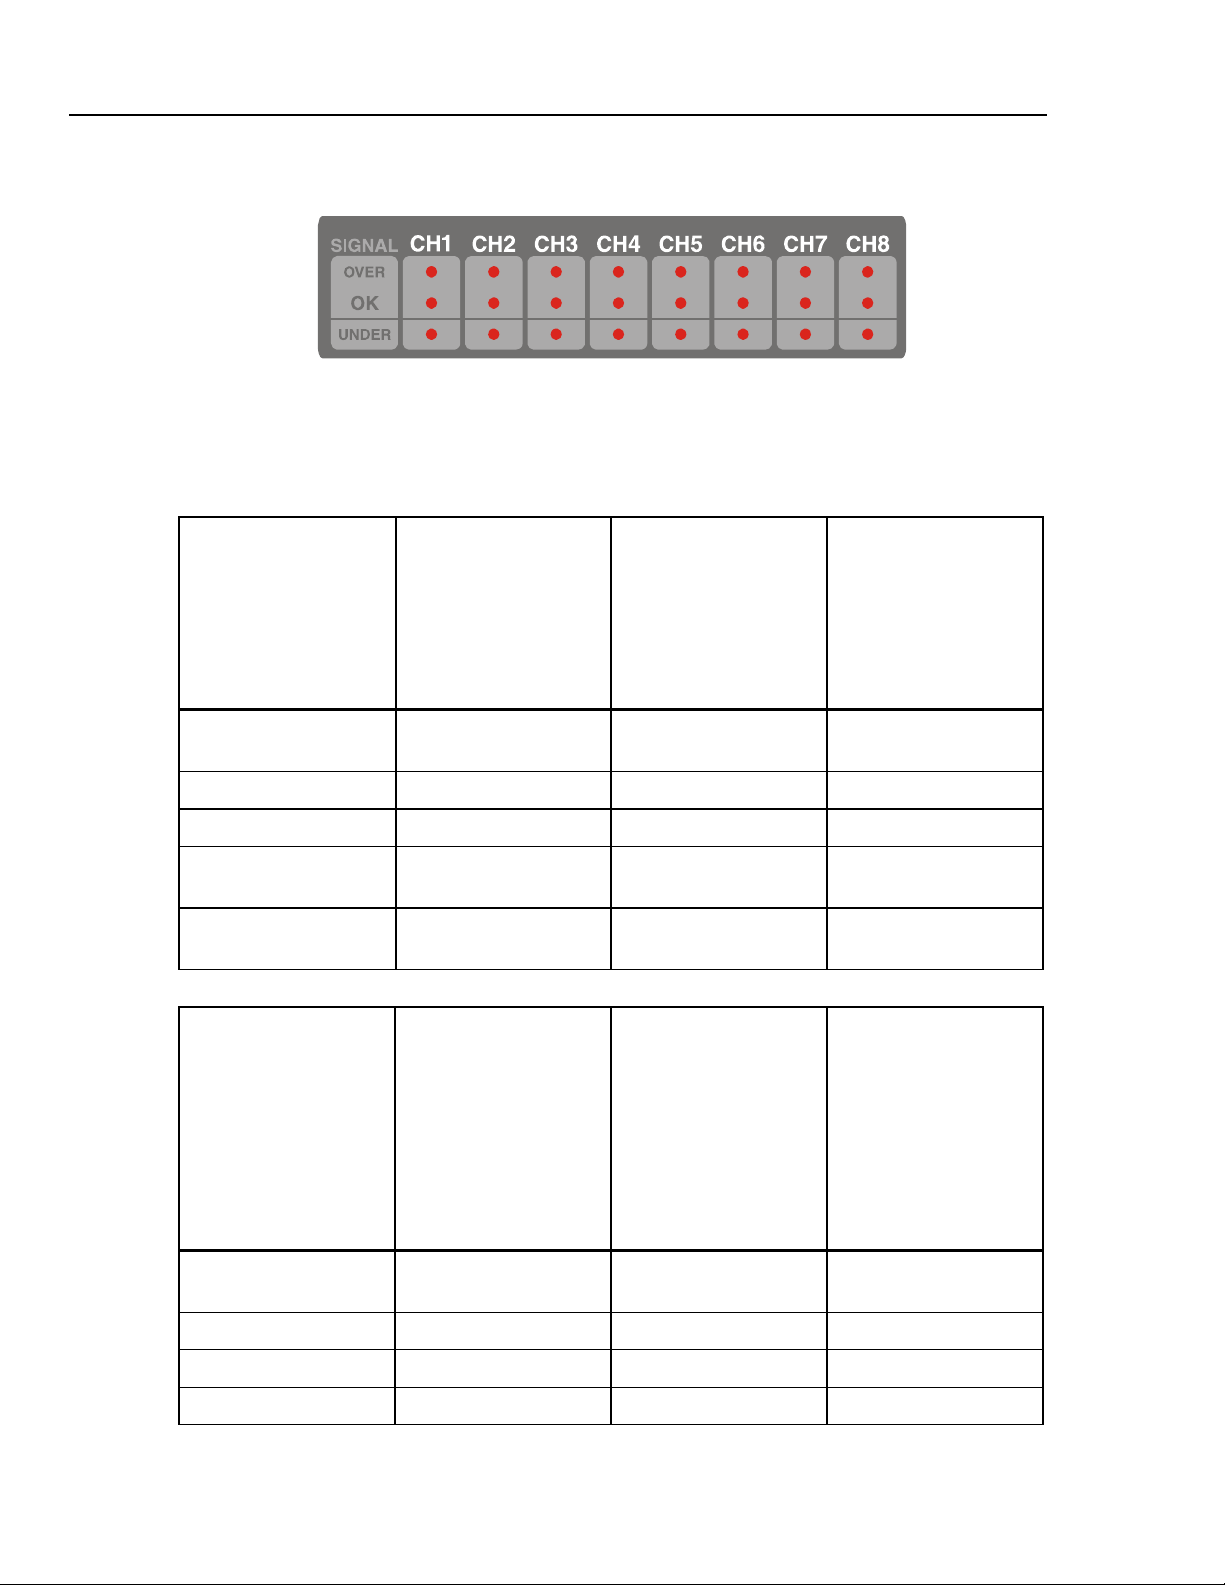
LEDs CH1 to CH8:
led-kanäle.wmf
Three LEDs are assigned to each of the eight input channels of the Recorder. The
indicators refer to half cycle or full circle rms values of the input signal (depending on the
configuration).
The following information is provided in case a valid sensor is detected.
Condition
Signal within nominal
range
Signal too low (dip) Yellow Off Off
Signal too high (swell) Off Off Yellow
Over range (ADCoverflow
Phase sequence wrong Off
LED UNDER
Off Green Off
Off Off Flashing red
LED OK
LEDs blinking in
sequence L3-L2-L1
LED OVER
Off
The following information is provided in case no valid sensor is detected:
Condition
LED UNDER
LED OK
LED OVER
Signal within nominal
range
Signal too low Yellow Red Off
Signal too high Off Red Yellow
Over range Off Red Flashing red
Off Red Off
1-14
Find Quality Products Online at: sales@GlobalTestSupply.com
www.GlobalTestSupply.com
Page 21

Introduction
Note
The LED OK is red if no valid sensor can be detected.
The limits for ‘Signal too low’ and ‘Signal too high’ are equal to the
thresholds for voltage dips and voltage swells (e.g.
For current inputs ‘Signal too low’ is indicated for half cycle or full cycle
rms values below 10 % of the sensor range as configured in the “Hardware
Settings” panel (if sensor is set to “Auto” the “Signal too low” indication
is deactivated).
‘Over range’ is indicated if the input signal is outside the valid
measurement range.
The phase voltages UL1, UL2, and UL3 of a three-phase system are monitored with the
symmetrical components (zero, positive and negative system). If the negative system
exceeds an upper threshold a wrong phase sequence condition is indicated (e.g. two lines
interchanged); the associated LEDs are flashing in sequence L3-L2-L1.
±
10 % of Un).
Design and Functions 1
XW Warning
The LEDs do not indicate whether there is voltage. Do not rely
on the LEDs to find out whether the device under test is live or
not.
D Ethernet port
Used for connection of the Recorder to an Ethernet port of a PC, or to an Ethernet
network (LAN). For a connection to an Ethernet network use the supplied Ethernet cable.
For direct connection of the instrument to a PC use the cross-linked Ethernet cable (with
the red plug).
E 2 USB connectors
The USB type A connectors for connection of a USB memory device, USB version V2.0
is supported.
USB connectors have the following function:
• USB stick support for storing of measurement data (same as external CF card).
CF card LED behaviour during USB copy process:
• copy process started --> flashing LED
• copy process finished and all data copied --> LED goes off
• copy process finished but not all data could be copied --> LED is turned on statically
• on error --> fast flashing LED for approx. 3 seconds then statically on
USB stick must not be pulled out while CF card LED is flashing. This can
cause permanent damage to the storage media. Only remove CF card /
USB stick while CF card LED is OFF or statically ON. Do not use CF card
or data connection at the same time.
Note
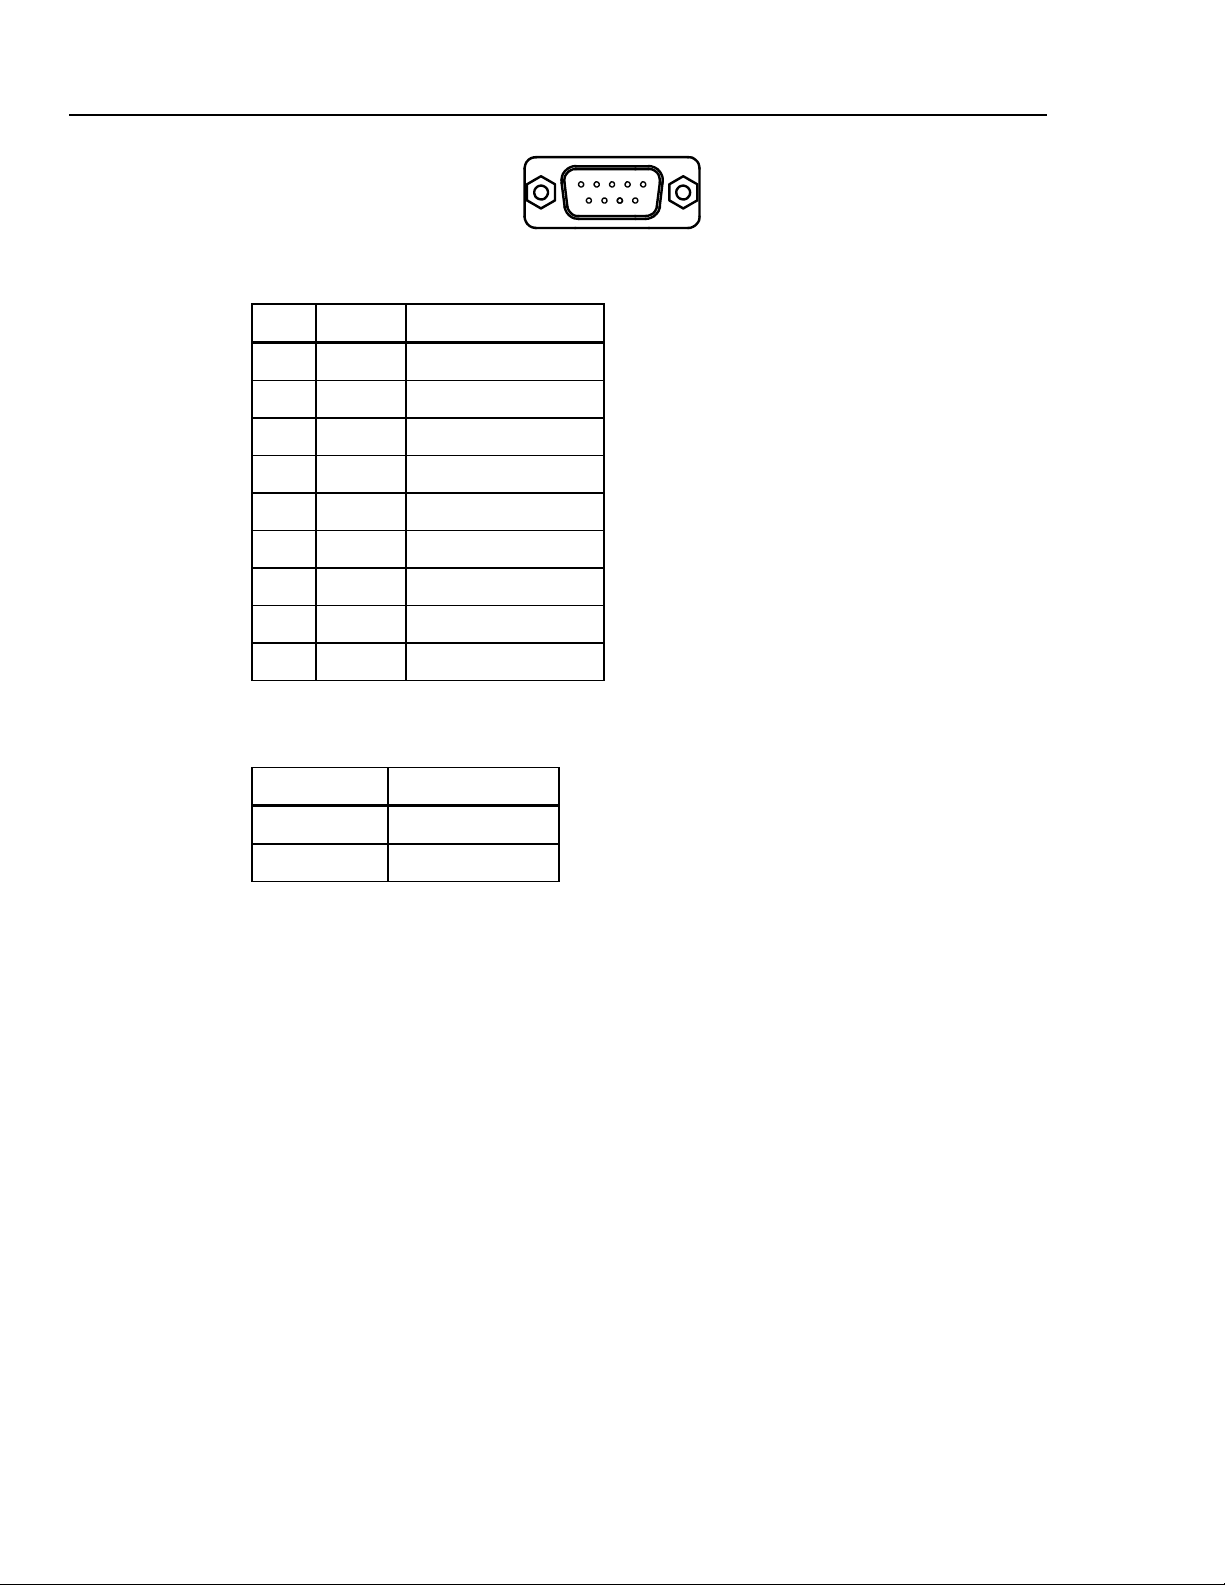
F Serial port COM1 (RS232)
Serial port for connection of the device to the serial port of a PC.
The default settings are 57.600 Baud, 8 data bits, 1 stop bit, no parity.
1-15
Find Quality Products Online at: sales@GlobalTestSupply.com
www.GlobalTestSupply.com
Page 22
1760
Users Manual
Pin assignment:
Pin Signal Description
1 DCD Data Carrier Detect
2 RxD Receive Data
3 TxD Transmit Data
4 DTR Data Terminal Ready
5 GND Ground
6 DSR Data Set Ready
7 RTS Request To Send
8 CTS Clear To Send
9 RI Ring Indicator
G Feature connector
Specification of outputs / inputs:
1
69
5
com_stecker.wmf
Condition Voltage level
Low (inactive) 0 - 0.8 V
High (active) 2.5 - 5 V
Maximum load current: 5 mA.
1-16
Find Quality Products Online at: sales@GlobalTestSupply.com
www.GlobalTestSupply.com
Page 23

Introduction
Design and Functions 1
stecker lpt.wmf
Pin assignment:
Pin Signal Description
1 +15 V Power supply voltage, max. 300 mA
2 TxD Output, Transmit Data COM2
3 RxD Input, Receive Data COM2
4 RTS Output, Request to send COM2
5 CTS Input, Clear to Send COM2
6 Service Output, internal use
7 GND Signal ground
8 Service Output, internal use
9 Watchdog Pulse Output, CPU watch dog signal
10 O1 Alarm output, reset with input RES 1
11 O2 Alarm output, reset with input RES 1
12 O3 Alarm output, reset with input RES 2
13 O4 Alarm output, reset with input RES 2
14 +5 V Power supply voltage
15 GPS PPS+ Input for GPS time synchronization
16 GPS PPS − Input for GPS time synchronization
17 GPS Transmit+ Input for GPS time synchronization
18 GPS Transmit- Input for GPS time synchronization
19-23 Service Output, internal use
24 RES1 Reset input for alarm outputs O1, O2
25 RES2 Reset input for alarm outputs O3, O4
H Measurement Channels
Plugs for 8 isolated measurement channels. Connect only original accessories such as
voltage and current sensors (clamps, Flexi Set, shunt resistors, etc.). The plug is secured
by means of a bayonet mechanism.
Note
Inputs that are not in use must be covered with the supplied protective caps
to prevent pollution.
When analyzing transients with 500 kHz transient option or 10 MHz
transient option, the potential to earth/ground is measured.
1-17
Find Quality Products Online at: sales@GlobalTestSupply.com
www.GlobalTestSupply.com
Page 24

1760
Users Manual
I J Compact Flash Card
Replaceable Compact Flash card for storage of measurement data. J Compact Flash
eject button and LED. Do not operate when data transfer is active (LED indicates
activity).
CF card LED behaviour during CF copy process:
• CF card inserted and detected --> short flashing (double pulses)
• copy process started --> flashing LED
• copy process finished and all data copied --> LED goes off
• copy process finished but not all data could be copied --> LED is turned on
statically
• on error --> fast flashing LED for approx. 3 seconds then statically on
Notes
• CF card must not be pulled out while CF card LED is flashing.
This can cause permanent damage to the storage media. Only
remove CF card / USB stick while CF card LED is OFF or
statically ON. Do not use USB stick or data connection at the same
time.
• Stored data can be erased by holding down the Reset Button K
while switching on (booting) the instrument. This may be useful
when the memory is full and may also resolve connectivity issues.
Basic Measurements
The Instrument offers all functions necessary to perform network analysis, quality
assurance evaluations and location of disturbance sources. A large compact flash data
memory provides a method of effecting long-term recordings. All data is saved even
without connection of the instrument to an evaluation computer. No information will be
lost. The recordings are the basis for detailed evaluations and analyze to assess
disturbances and the mains voltage quality. The instrument records and provides
historical event data, which protective relays or protective switches have induced and
how the resources have performed.
Measurement Types
The instrument combines many different measurement types, also referred to as “virtual
instruments”:
• Digital recording of measured data (data logger)
• Power measuring device (recording of load profiles)
• Recording of power frequency
• Power Quality Analyzer (including statistical evaluation)
• Fast transient recorder (optional)
• Ripple control signal analyzer
• Harmonics analyzer
• Voltage disturbances analyzer (events)
1-18
Find Quality Products Online at: sales@GlobalTestSupply.com
www.GlobalTestSupply.com
Page 25

Introduction
Measurements
The following measurements can be made:
• rms values of voltage and current as well as power values with programmable
averaging time
• Oscilloscope data (instantaneous value, sensing value)
• Powerful and versatile triggering engine
• Load and energy measurements
• Analysis of voltage and current harmonics
• Analysis of voltage and current interharmonics
• Fast transient analysis
• Signaling voltage, ripple control signal analysis
• Mains voltage quality analysis as per EN 50160
Basic Measurements 1
1-19
Find Quality Products Online at: sales@GlobalTestSupply.com
www.GlobalTestSupply.com
Page 26

Chapter 2
Getting Started
Title Page
Delivered Items.................................................................................................... 2-3
Setup .................................................................................................................... 2-4
Installation ....................................................................................................... 2-4
Switching the Device On................................................................................. 2-4
Switching the Device Off ................................................................................ 2-4
Simple Measurement - Function Check............................................................... 2-4
Transport and Storage.......................................................................................... 2-9
Transport ......................................................................................................... 2-9
Storage............................................................................................................. 2-9
2-1
Find Quality Products Online at: sales@GlobalTestSupply.com
www.GlobalTestSupply.com
Page 27

Getting Started
Delivered Items 2
Delivered Items
Before commencing work with the device, check the delivery to ensure that it is complete,
using the following list and the delivery specifications.
• 1 Power Quality Recorder Instrument
• 1 Getting Started manual
• CD-ROM with PQ Analyze application software, manuals, data sheets, and demo
data
• 1 power cord for mains connection
• 1 main connection adapter set
• 1 crosslink RS232 connection cable
• 1 Ethernet cable for direct PC connection
• 1 Ethernet cable for network connection
Optional:
• 4 voltage sensors
• 4 Flexi current sensors
• Carrying bag
• GPS receiver module
Figure 2-1 shows the communication cables.
Figure 2-1. Communication Cables
2-3
Find Quality Products Online at: sales@GlobalTestSupply.com
www.GlobalTestSupply.com
ph_interfacecables.bmp
Page 28

1760
Users Manual
Setup
Installation
Follow the safety instructions regarding the ambient conditions and location of the
installation.
XW Warning
First connect the device with the mains cable and compatible
adapter to the power supply network. Observe the
specifications on the device type plate.
The device is connected to mains power, and a number of
internal components are live with dangerous voltage levels. To
remain safe during the operation, the device must be equipped
with a low-resistance connection to the earth. Therefore, check
the mains socket and its wiring.
Connect the supply cable of the device only to the sections
CAT I, II or III of the supply system. The voltage to earth may
not exceed 300 V.
Switching the Device On
Switch on the power supply to the device (lift switching knob B slightly and move to
position ‘I’). The LED POWER is lit. After approx. 40 seconds of booting, the device is
ready for the operation.
Switching the Device Off
Lift switching knob B slightly and move to position ‘0’. The LED POWER goes off
after closing all the internal data files.
Note
The instrument can be only switched off after the boot process is finished
(duration is approx. 40 seconds).
Simple Measurement - Function Check
The procedure below allows users to familiarize themselves with the measuring functions
of the instrument, while testing all basic device functions.
Installation: Install the instruments SW PQ Analyze, see Reference Manual PQ
Analyze.
Connect device: Connect instrument to mains and switch on.
Connect your computer and the recorder via the red Ethernet cable
for direct connection. Wait for a short time (see the 1760 Reference
Manual, “Direct Peer to Peer Communication over Crossover
Ethernet Cable”.
Connect the device channels as described in the “Connections to
Measuring Circuits”.
2-4
Find Quality Products Online at: sales@GlobalTestSupply.com
www.GlobalTestSupply.com
Page 29

Getting Started
Simple Measurement - Function Check 2
Communication: Start PQ Analyze
2_1.bmp
2_2.bmp
2-5
Find Quality Products Online at: sales@GlobalTestSupply.com
www.GlobalTestSupply.com
Page 30

1760
Users Manual
In the “Live Modes” section press “Setup”.
2_3.bmp
In the “Search Devices” dialog press “Search”.
Select your instrument in the list and press “Connect”.
2_4.bmp
After successful connection, you see a green light in the lower right corner next to status
information about the instrument.
2_5.bmp
2-6
Find Quality Products Online at: sales@GlobalTestSupply.com
www.GlobalTestSupply.com
Page 31

Getting Started
Simple Measurement - Function Check 2
Initialization: The “Settings” window is the starting point for all measurement
configurations. For now accept the default settings and press “Initialize”
2_6.bmp
Choose a name or accept the default one. Press OK.
2_7.bmp
Wait while measurement is initialized.
2_8.bmp
2_9.bmp
Press “OK” and watch the “RECORDING STATUS” LED on the instrument. It should
start flashing slowly indicating the active measurement.
Close the “Settings” window.
2-7
Find Quality Products Online at: sales@GlobalTestSupply.com
www.GlobalTestSupply.com
Page 32

1760
Users Manual
Measure: Select menu “Transfer > Live Mode”.
Press “Oscilloscope”
2_10.bmp
Select all channels that you want to have displayed and press the “Timeplot” icon.
2_11.bmp
2_12.bmp
If everything works correctly you will see an oscilloscope like recording of the signals
supplied to the input channels. All connections and sensors are working properly.
2_13.bmp
For detailed instructions, refer to the Reference Manual PQ Analyze.
2-8
Find Quality Products Online at: sales@GlobalTestSupply.com
www.GlobalTestSupply.com
Page 33

Getting Started
Next steps: For transferring the measured data from the device to the PC and for
evaluating the data according to your requirements see Reference Manual PQ
Analyze.
Transport and Storage 2
Transport and Storage
Transport
• Transport the device only in its original packaging
• Keep the operating manual supplied with the device for future reference
• Protect the device during the transport against heat and moisture. Do not exceed
the temperature range of −20 °C to +60 °C and a maximum humidity of 85 %
• Protect the device against impacts and loads
Storage
• Keep the original packaging, as it might be required at a later stage for transport
purposes or to return the device for repairs. Only the original packaging
guarantees the proper protection against mechanical impacts
• Store the device in a dry room; the temperature range of −20 °C to +60 °C and a
maximum humidity of 85 % may not be exceeded
Keep the operating manual supplied with the device for future reference
• Protect the device against direct sunlight, heat, moisture and mechanical impacts.
2-9
Find Quality Products Online at: sales@GlobalTestSupply.com
www.GlobalTestSupply.com
Page 34

Chapter 3
Operation
Title Page
Connections to Measuring Circuits...................................................................... 3-3
Connecting Sequence ...................................................................................... 3-3
Connection Diagrams ...................................................................................... 3-4
1-Phase Measurement ................................................................................. 3-4
3-Wire Network with Two Current Sensors (ARON2 Method) ................. 3-5
3-Wire Network with Two Current Sensors (ARON2 Method,
Open Delta Method).................................................................................... 3-7
4-Wire Network: 3-Wattmeter Method....................................................... 3-8
Four-Wire Network: Three-Wattmeter Method with N Conductor
Voltage and N Conductor Current .............................................................. 3-9
Two Star-Connected Voltage Systems........................................................ 3-11
Two Voltage Systems in Delta Configuration ............................................ 3-12
Methods of Measurement/Formulas .................................................................... 3-13
Parameter Aggregation.................................................................................... 3-13
Calculation of Power Parameters .................................................................... 3-14
Aggregations 200 ms and higher................................................................. 3-14
Real power .................................................................................................. 3-14
Apparent power........................................................................................... 3-15
Reactive power............................................................................................ 3-15
Power factor ................................................................................................ 3-16
Displacement power factor cos φ................................................................ 3-16
Half and full cycle aggregations...................................................................... 3-17
Real power .................................................................................................. 3-17
Apparent power........................................................................................... 3-18
Reactive power............................................................................................ 3-18
Power factor ................................................................................................ 3-18
Events and Flicker ........................................................................................... 3-18
Harmonics and Interharmonics Parameters..................................................... 3-19
Signaling Voltage ............................................................................................ 3-22
Unbalance, Overdeviation, Underdeviation .................................................... 3-22
Current Unbalance ...................................................................................... 3-23
Overdeviation and Underdeviation ............................................................. 3-24
3-1
Find Quality Products Online at: sales@GlobalTestSupply.com
www.GlobalTestSupply.com
Page 35

Operation
Connections to Measuring Circuits 3
Connections to Measuring Circuits
XW Warning
By connecting the unit to circuits, the terminals and certain
parts inside the device are live. Utilization of leads and
accessories that do not fulfill the relevant safety standards
could lead to serious injury or death from electric shock.
In order to ensure safe operation:
First connect the device to protective earth and to the power
supply.
Open the circuit before establishing a connection to the device.
Prior to connecting the circuits, ensure that the maximum
measuring voltage and the max. voltage to earth do not exceed
and the category of distribution system corresponds with the
inscription of the sensor ‘or’ meet the country specific standard.
Connecting Sequence
When connecting a circuit to Instrument, for safety reasons, proceed in the sequence
outlined below:
1. Check the standard mains socket for a proper protective earth connection.
Connect the instrument to the power supply socket. The PQ Recorder is now
connected to the protective earth (Safety Class 1 equipment).
2. Connect the measuring circuit as shown in the connection diagrams.
3. Switch on the Recorder.
4. Ensure that the direction of the energy flow is correct (load flow direction).
3-3
Find Quality Products Online at: sales@GlobalTestSupply.com
www.GlobalTestSupply.com
Page 36

1760
Users Manual
Connection Diagrams
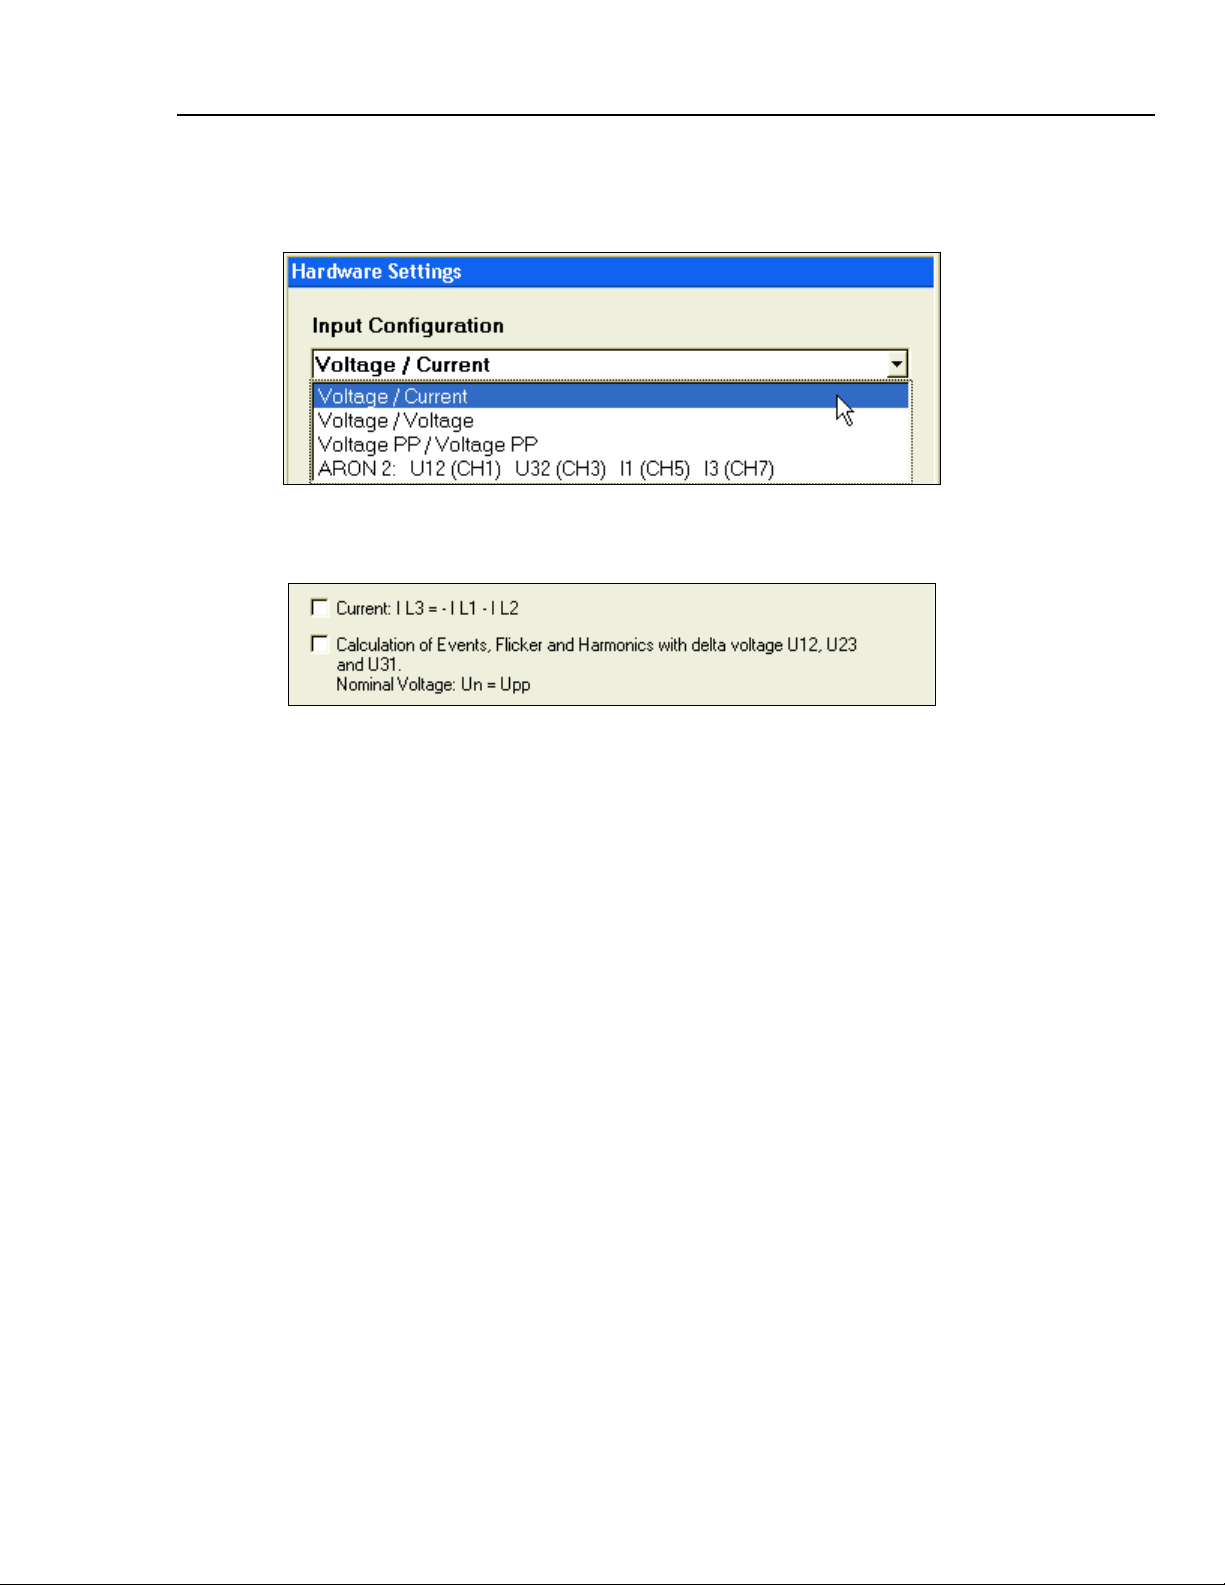
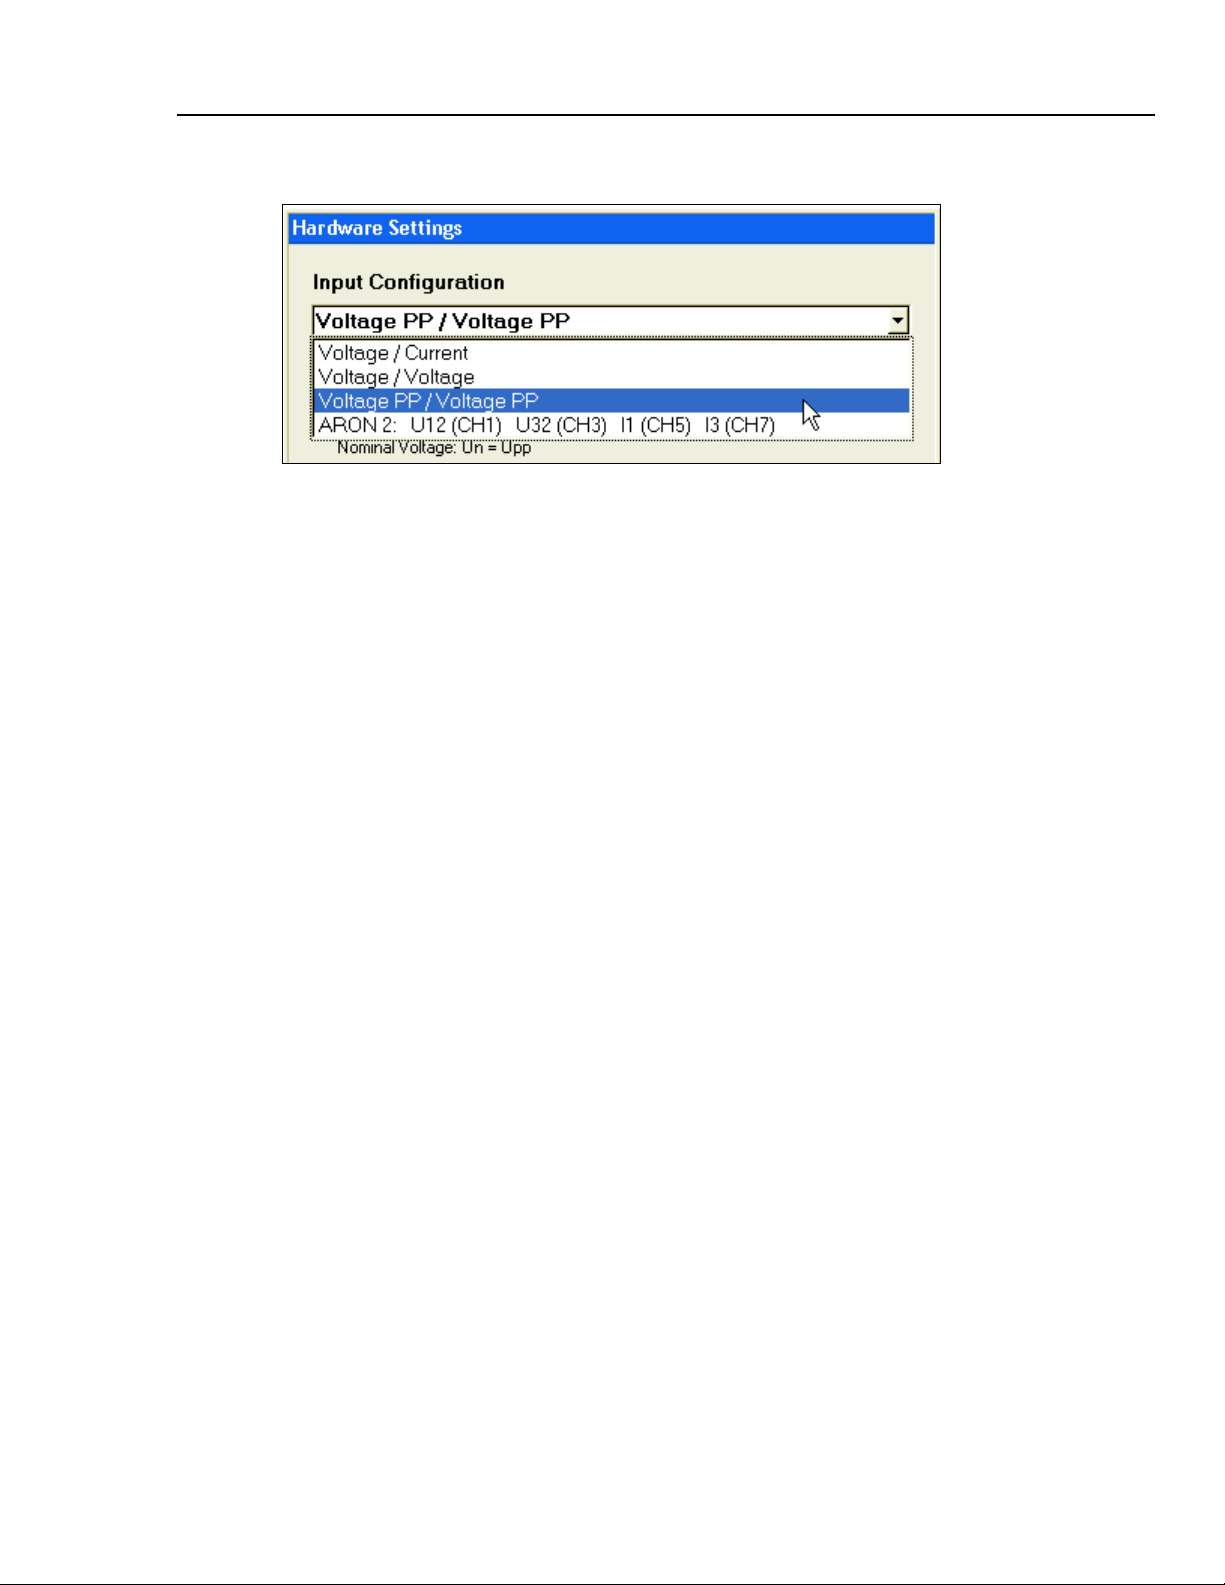
The measuring circuit is selected by means of the File > New / Hardware Settings menu
of the PQ Analyze software. Connect the sensors in load flow direction (observe arrows).
Table 3-1. Symbols in the Connection Diagrams
Symbol Meaning
Connect the Flexi current sensors in the right
direction.
The arrow on the Flexi must show from the network
to the load.
Red connector.
Black connector.
Use channel ‘CH4’ as control channel for triggering on external signals.
Fast voltage transients are always measured between the red plug of the
voltage sensor and the device ground (earth, protective conductor).
Please, note that the voltage sensors with a rated range of
equipped with the fast transient function (if the transient option is installed).
1-Phase Measurement
Figure 3-1 shows the circuit diagram for 1-phase measurement.
L1
Mains
L2
Note
Note
>
100 V are
L1
L3
PEN
Load
Fluke 1760
Figure 3-1. Circuit Diagram: 1-Phase Measurement
1wattm1.eps
3-4
Find Quality Products Online at: sales@GlobalTestSupply.com
www.GlobalTestSupply.com
Page 37
Operation
Connections to Measuring Circuits 3
Associated PC software settings:
Connection to Single-Phase 2-Wire Network:
messsystem1 u-i.bmp
and
The option Calculation of Events, Flicker, and Harmonics with delta voltage U12, U23
and U31 for the phase-to-phase voltages is not of relevance here.
Note
All 8 channels are measured. Please keep this in mind when assessing the
power quality according to EN 50160.
To avoid false triggering, please switch channels that are not connected to
“OFF” in the “Hardware Settings” configuration panel.
3-Wire Network with Two Current Sensors (ARON2 Method)
Conventional two-wattmeter method with current sensors on phases L1 and L3.
The device calculates IL2 = -IL1 – IL3. Two phase-to-phase voltages (U12 U32) are
measured. The third phase-to-phase voltage (U23) is calculated. The recorder then
transforms this delta system into a virtual Wye system by calculating virtual phase
voltages. This virtual Wye system is in turn used to calculate the power values of all three
phases as well as the total power. This method is applicable only if I1 + I2 + I3 =0, i.e. if
there is no neutral conductor.
Figure 3-2 shows the circuit diagram for 3-wire network (Aron 2).
messsystem1 u-i-1.bmp
3-5
Find Quality Products Online at: sales@GlobalTestSupply.com
www.GlobalTestSupply.com
Page 38

1760
Users Manual
Load Transformer
CH5 = I1
CH1 = U12
CH2 = U23
CH3 = U32
CH7 = I3
Fluke 1760
Figure 3-2. Circuit Diagram: 3-Wire Network (Aron 2)
Note
The voltage sensor at channel CH2 denoted with dotted lines is only
required for transient measurements; for current, voltage power
measurements, no sensor is required at CH2.
2wattm1-aron2.eps
Associated Device Software Settings:
messsystem5 aron2.bmp
Check the respective option.
messsystem5 aron2-1.bmp
If the option IL2 = -IL1 - IL3 is checked, the current IL2 is calculated. If this option is not
checked, the current IL2 is measured by means of a sensor at phase L2 (Instrument
channel CH6).
Note
The nominal voltage has to be entered as a phase-phase voltage in the
dialogue Nominal-Limit values (i.e. 400 V in a 230 V P-N-system).
3-6
Find Quality Products Online at: sales@GlobalTestSupply.com
www.GlobalTestSupply.com
Page 39

Operation
Connections to Measuring Circuits 3
3-Wire Network with Two Current Sensors (ARON2 Method, Open Delta Method)
The conventional two-wattmeter method with current sensors at phases L1 and L3 is
frequently used in the medium voltage networks with built-in current and voltage
converters.
The device calculates IL2 = -IL1 - IL3. Two phase-to-phase voltages (U12, U32) are
measured. The third phase-to-phase voltage (U23) is calculated. The recorder then
transforms this delta system into a virtual Wye system by calculating virtual phase
voltages. This virtual Wye system is in turn used to calculate the power values of all three
phases as well as the total power. This method is only applicable, if I1+I2+I3 = 0, i.e. if
there is no neutral conductor.
Figure 3-3 shows the circuit diagram for 3-wire network with 2 current sensors (Aron
method), open delta method.
L1
L1
L2
L2
L3
CH1 = U12
CH3 = U32
L3
Figure 3-3. Circuit Diagram: Aron 2 Method/Open Delta Method
Fluke 1760
CH5 = I1
CH7 = I3
v-schaltung-3.eps
Associated PC Software Settings:
messsystem5 aron2.bmp
3-7
Find Quality Products Online at: sales@GlobalTestSupply.com
www.GlobalTestSupply.com
Page 40
1760
Users Manual
Check the respective option.
messsystem5 aron2-1.bmp
If option IL2 = -IL1 - IL3 is checked, the current IL2 is calculated. If this option is not
checked, the current IL2 is measured by means of a sensor connected to phase L2
(Instrument channel CH6).
The option Calculation of Events, Flicker, and Harmonics with delta voltage U12, U23
and U31 is automatically on and cannot be deactivated.
Note
The nominal voltage has to be entered as a phase-phase voltage in the
dialogue Nominal-Limit values (i.e. 400 V in a 230 V P-N-system).
Enter the applicable transformation ratios for the current and voltage
converters in the ‘Hardware Settings’ dialog.
As conventional current converters have an output current of 1 A or 5 A AC
respectively at rated current, we recommend using current probes rather
than flexible current sensors, as they provide better resolution and linearity
at low currents.
4-Wire Network: 3-Wattmeter Method
This is the standard measurement configuration for three-phase networks with 3 voltage
and 3 current sensors.
Figure 3-4 shows the circuit diagram for 4-wire network (Wye connection).
Network
L1
L2
L3
PEN
LoadTransformer
Fluke 1760
Figure 3-4. Circuit Diagram: 4-Wire Network (Wye Connection)
3-8
Find Quality Products Online at: sales@GlobalTestSupply.com
www.GlobalTestSupply.com
3wattm1.eps
Page 41

Operation
Connections to Measuring Circuits 3
Associated PC Software Settings:
messsystem1 u-i.bmp
If required, you have the option to determine events, Flicker and Harmonics, of the
phase-to-phase voltages.
Check the respective option.
Note
If this option (calculation) is checked, you must enter the phase-to-phase
voltage as the rated voltage V
in ‘Settings – Nominal / Limit values’ (e.g.
N
400 V in the 230 V P-N network).
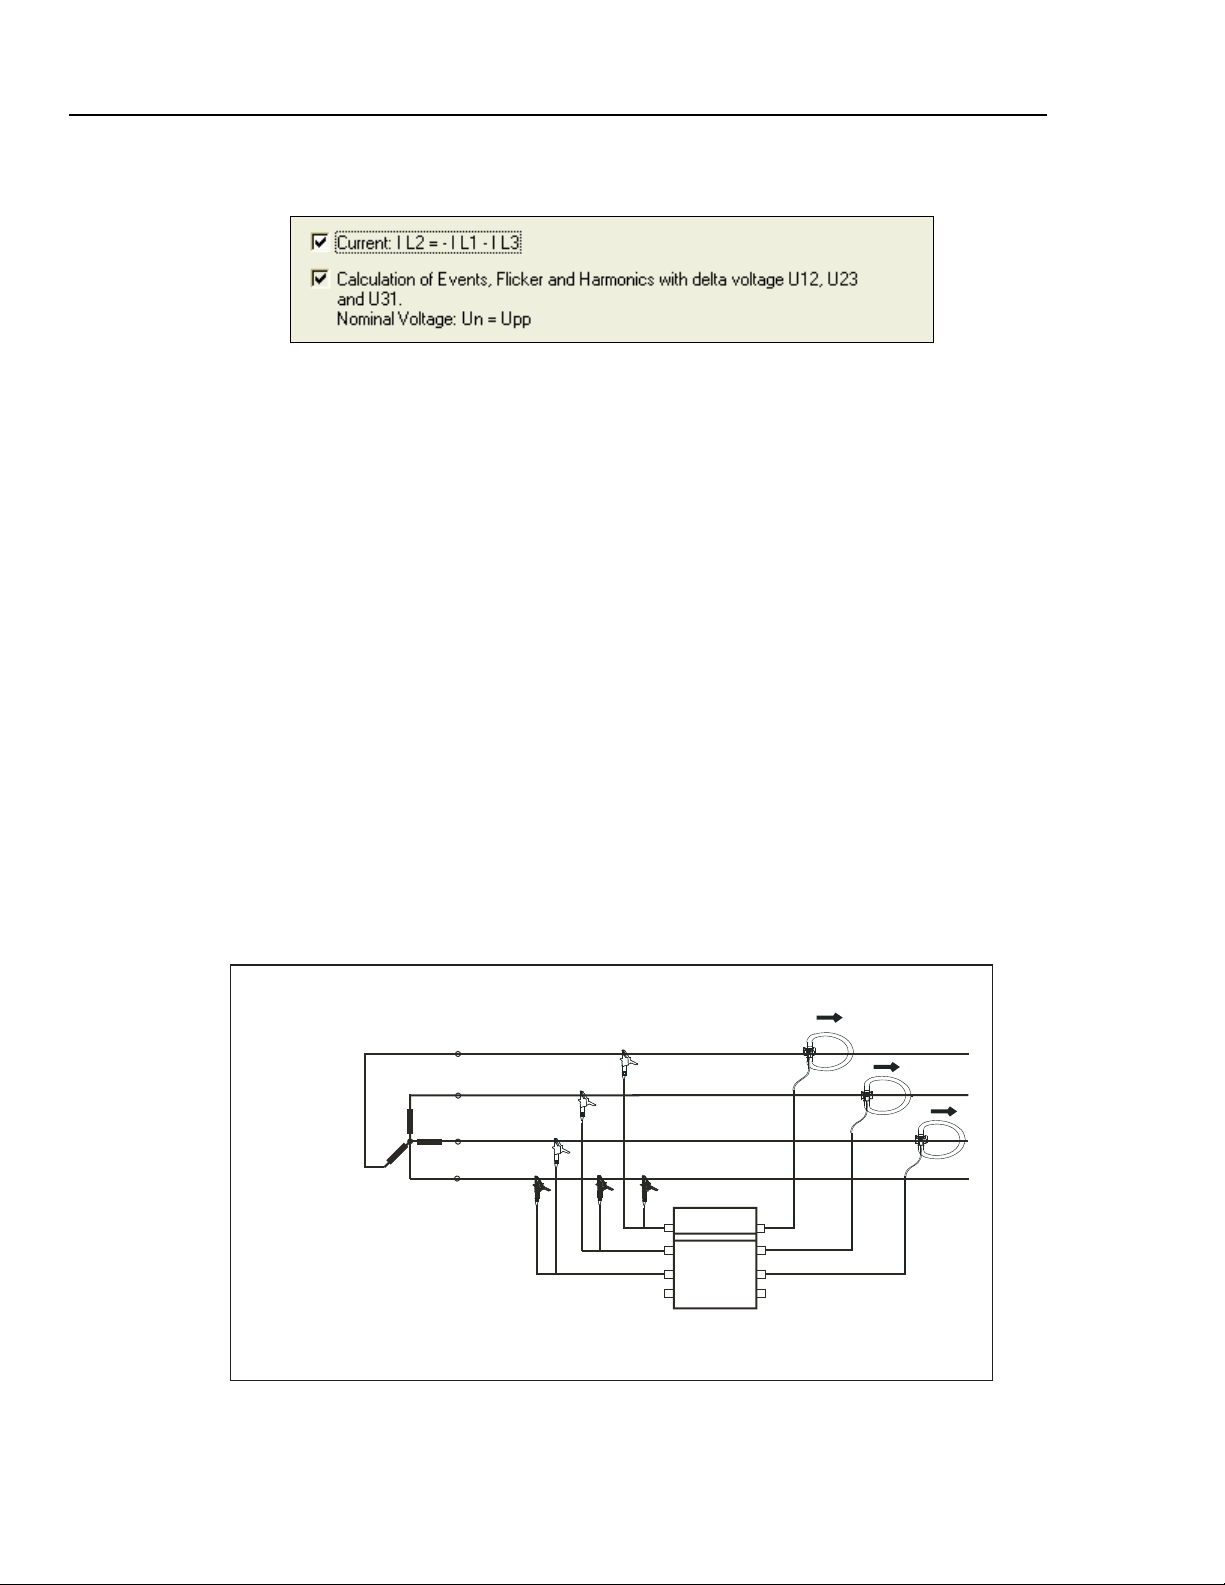
Four-Wire Network: Three-Wattmeter Method with N Conductor Voltage and N Conductor Current
This is the standard measurement configuration for three-phase networks with 4 voltage
and 4 current sensors.
Figure 3-5 shows the circuit diagram for 4-wire network (3-wattmeter method) with Nconductor voltage and N-conductor current.
messsystem1 u-i-1.bmp
messsystem1 u-i-2.bmp
3-9
Find Quality Products Online at: sales@GlobalTestSupply.com
www.GlobalTestSupply.com
Page 42

1760
Users Manual
Transformer
Associated PC Software Settings:
PEN
L1
L2
L3
Fluke 1760
Figure 3-5. Circuit Diagram: 4-Wire
PE
L1
L2
L3
N
Load
3wattm2.eps
messsystem1 u-i-0.bmp
If required, you have the option to determine events, Flicker and Harmonics, of the
phase-to-phase voltages.
Check the respective option.
messsystem1 u-i-2.bmp
3-10
Find Quality Products Online at: sales@GlobalTestSupply.com
www.GlobalTestSupply.com
Page 43

Operation
Connections to Measuring Circuits 3
Note
If this option (Calculation) is checked, you have to enter the phase-to-phase
voltage as the rated voltage V
in ‘Settings – Nominal / Limit Values’ (e.g.
N
400 V in the 230 V P-N network).
Two Star-Connected Voltage Systems
With this method, you can determine two phase voltages and the respective N conductor
voltages in two star connected three-phase systems.
Figure 3-6 shows the circuit diagram for 2-voltage system with neutral.
Mains
L1
L1
L2
L3
PEN
Figure 3-6. Circuit Diagram: 2 Voltage System with Neutral
Associated PC Software Settings:
Fluke 1760
L2
L3
N
PE
System-U-U-Stern.eps
messsystem2.bmp
Note
The power quality assessment according to EN50160 can be performed for
the phase voltages of system 1 and system 2 respectively; the preset limit
values apply to both evaluations.
3-11
Find Quality Products Online at: sales@GlobalTestSupply.com
www.GlobalTestSupply.com
Page 44
1760
Users Manual
If required, you have the option to determine events, Flicker and Harmonics, of the
phase-to-phase voltages.
Check the respective option.
Note
If this option (Calculation) is checked, you have to enter the phase-to-phase
voltage as the rated voltage V
in ‘Settings – Nominal / Limit Values’ (e.g.
N
400 V in the 230 V P-N network).
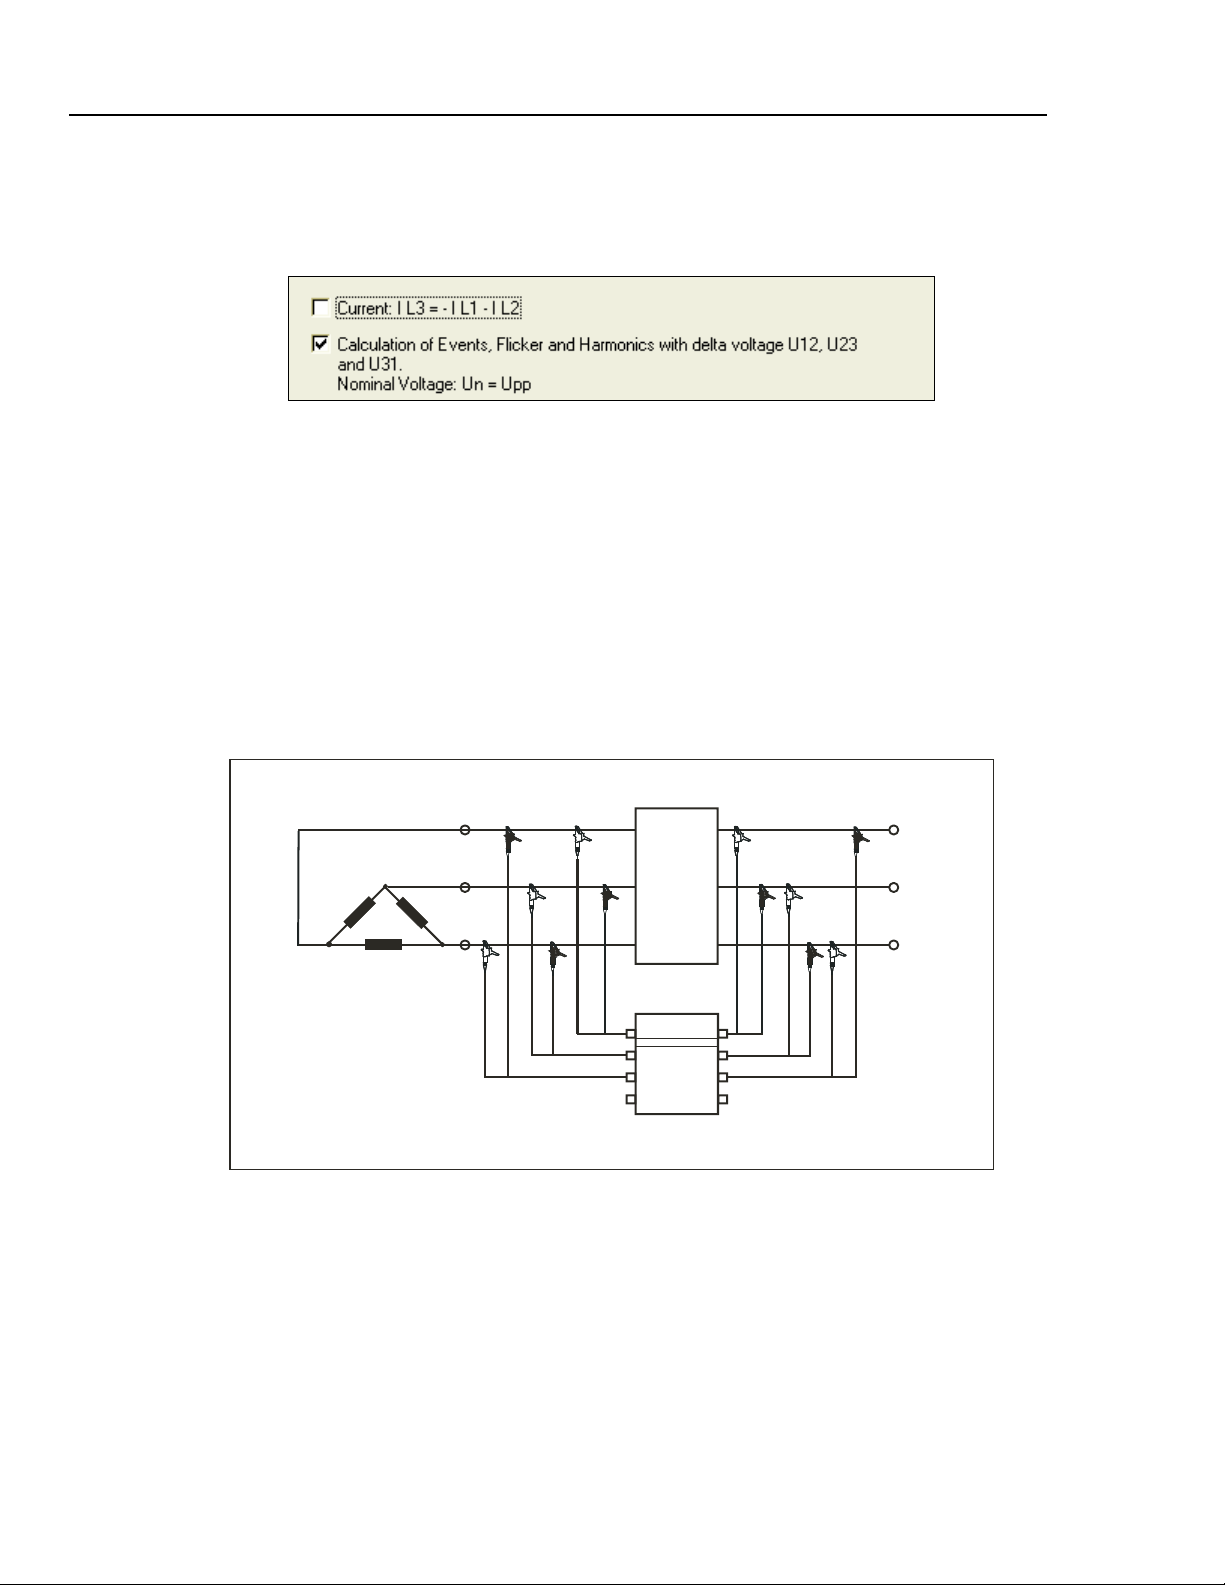
Two Voltage Systems in Delta Configuration
This method is used to measure 3 phase-to-phase voltages in two delta-configured threephase systems. Channels CH4 and CH8 can be used for other parameters.
messsystem1 u-i-2.bmp
Figure 3-7 shows the circuit diagram for 2-voltage system in Delta connection.
Mains
L1
L2
L3
Fluke 1760
Figure 3-7. Circuit Diagram: 2 Voltage System in Delta Connection
Load
L1
L2
L3
system u-u dreieck.eps
3-12
Find Quality Products Online at: sales@GlobalTestSupply.com
www.GlobalTestSupply.com
Page 45
Operation
Methods of Measurement/Formulas 3
Associated PC Software Settings:
messsystem4.bmp
Note
The power quality assessment according to EN50160 can be performed for
the phase-to-phase voltages of system 1 and system 2 respectively; the
preset limit values apply to both evaluations.
We have to enter the phase-to-phase voltage as the rated voltage V
‘Settings – Nominal/Limit Values’ (e.g. 400 V in the 230 V P-N network).
Methods of Measurement/Formulas
Parameter Aggregation
Signal Sampling
The device samples measurement signals at a nominal frequency of 10.24 kHz at nominal
power frequencies of 50 Hz and 60 Hz respectively.
The sampling frequency is synchronized to the power frequency on the reference channel
CH1, the signal level has to be at least 10 % of the input range. The required PLL (Phase
Locked Loop) is realized in the firmware of the instrument.
The synchronization range is according to IEC 61000-4-30 class A:
• Range for 50 Hz systems: 50 Hz ±15 % (42.5 Hz - 57.5 Hz)
• Range for 60 Hz systems: 60 Hz ±15 % (51 Hz - 69 Hz)
• Resolution: 16 ppm
Aggregations
The time aggregation2:02:05 PM of the measurement values is according to IEC 610004-30 class A, section 4.5 based on 10/12 cycle values (10 cycles for 50 Hz and 12 cycles
for 60 Hz nominal frequency).
N
in
The following time aggregations are available:
• Half cycle, full cycle updated every half cycle, 200 ms (precisely: 10/12 cycle
values), 3 s (precisely: 150/180 cycles), 10 minutes, 2 hours, Free interval ( ≥ 10
seconds)
• Half cycle and full cycle values are based on the zero crossings of the
fundamental
3-13
Find Quality Products Online at: sales@GlobalTestSupply.com
www.GlobalTestSupply.com
Page 46

1760
Users Manual
• The 10/12 cycle values are aggregated from 2.048 samples synchronized to the
power frequency
• The 3s (150/180 cycles)-intervals are derived from 15 consecutive 10/12 cycle
intervals
• The 10 minute and free interval values are based on the synchronized 10/12 cycle
values
• 2 hours interval is aggregated from 12 – ten minute intervals
• The 10 minute values are synchronized to the absolute time (e.g. via GPS time
sync option)
Power Frequency
For 10 s frequency values, the sample data are filtered by a 2
cut-off frequency is 50 Hz for 50 Hz nominal frequency and 60 Hz for 60 Hz nominal
frequency). Based on the filtered signal whole periods within 10 s intervals (taken from
the internal real time clock) are counted by detecting the zero crossings. The frequency is
calculated by dividing the number of whole periods by the duration of this number of
whole periods. The time interval is derived from the timestamps generated by the
hardware of the first and the last sample within the block of whole periods. A special
calculation method is used for the frequency measurement related to the 10 ms and 20 ms
(half/full cycle) rms values. The measured frequency is the sync frequency of the PLL
which is refreshed every 200 ms (based on the FFT evaluation).
nd
order IIR filter (the 3 dB
Voltage, Current rms Values, Min-/Max-Values
Half cycle rms is synchronized with the zero crossings of the fundamental component.
The fundamental component zero crossing is calculated from 200 ms FFT. Half cycle rms
is available as real half cycle rms and/or as full cycle rms, updated every half cycle.
The extreme values (Min-, Max-values) are derived from the half cycle rms values or full
cycle rms values updated every half cycle (whatever is configured in the “Nominal and
Limit Values” settings panel in PQ Analyze.
The interval values are averaged squared over the respective time interval.
FFT – Fast Fourier Transformation
FFT is calculated using an algorithm which is optimized for real input and complex
output with 2.048 points. As long as the PLL controlling the sampling frequency is
locked, no window function is applied. If locking cannot be established, a Hanning
window is used. The FFT is caclulated over 200 ms intervals and therefore results in a
frequency spectrum of 1024 5 Hz bins (DC to 5115 Hz).
Calculation of Power Parameters
Two different sets of power parameter calculations are used. One for aggregations of
200ms and higher the other one for half and full cycle aggregations.
Aggregations 200 ms and higher
Real power
Real power
1023
∑
3-14
Find Quality Products Online at: sales@GlobalTestSupply.com
i
P is derived from the results of the FFT calculations of voltage and current.
⋅⋅=
cos
IUP
=
0
ϕ
iii
www.GlobalTestSupply.com
Page 47

Operation
ϕ
Methods of Measurement/Formulas 3
where
U rms value of the voltage bin with the frequency i⋅5 Hz
i
I rms value of the current bin with the frequency i⋅5 Hz
i
phase angle difference between voltage and current of the frequency i⋅5 Hz
i
The 3-phase real power sum is calculated as
PPPP ++=
321 LLLsum
Apparent power
Apparent power
S is calculated by multiplying rms values of voltage and current of the
given aggregation.
IUS ⋅=
The 3-phase apparent power sum is calculated as
Reactive power
The harmonic reactive power
of voltage and current. The index h in
component is derived from the harmonics (FFT) calculation.
1023
∑
=
i
Because every frequency component of the calculation has a sign,
other reactive power components are unsigned (always positive) by definition.
The 3-phase harmonic reactive power sum is calculated as
The total reactive power
tot
0
⋅⋅=
sin
IUQ
22
PSQ
−=
SSSS ++=
321 LLLsum
Q is also derived from the results of the FFT calculations
h
ϕ
iiih
QQQQ ++=
321 LhLhLhsumh
Q is calculated by
tot
Q indicates that the calculated reactive power
h
Q is also signed. All
h
The 3-phase total reactive power sum is calculated as
QQQQ ++=
321 LtotLtotLtotsumtot
The remaining reactive power component
Q (d stands for distortion) contains the rest of
d
the reactive power phenomena (mainly distortion reactive power and modulation reactive
power, the first originating e.g. from power converters with highly non sinusoidal current
waveforms, the latter from pulsating loads).
3-15
Find Quality Products Online at: sales@GlobalTestSupply.com
www.GlobalTestSupply.com
Page 48

1760
Users Manual
The 3-phase distortion reactive power sum is calculated as
Please note that the quadratic terms in the
Power factor
For the power factor one of two different formulas can be selected by the user through the
“Options > Power Factor” menu in PQ Analyze.
Formula 1: The sign is taken from the reactive harmonic power therefore giving an
indication about inductive or capacitive characteristic of the load.
PF ⋅=
22
QQQ −=
htotd
QQQQ ++=
321 LdLdLdsumd
Q calculation means that
d
22
QQQ −≠
sumhsumtotsumd
P
Q
h
Q
S
h
Formula 2: The sign is taken from the real power therefore giving the power flow
direction (motor / generator characteristic of the load).
P
PF =
S
The 3-phase power factor sum is calculated as
PF ⋅=
sum
Displacement power factor cos φ
The cos φ is most commonly referred to as the power factor of the fundamental
component. More general there is a cos φ for every harmonic frequency component.
When you select the harmonics analysis in the main analysis window in PQ Analyze you
can display the cos φ for all harmonics including the fundamental.
Harmonics analysis parameter group:
The formula used for calculating the cos φ is:
ϕ
Q
P
sum
S
sum
=
i
Q
sumh
or
sumh
⎛
⎜
arctancoscos
⎜
⎝
⎛
Q
⎜
⎜
P
⎝
PF =
sum
⎞
⎞
i
⎟
⎟
⎟
⎟
i
⎠
⎠
P
sum
S
sum
3-16
Find Quality Products Online at: sales@GlobalTestSupply.com
www.GlobalTestSupply.com
Page 49

Operation
P
where
P Real power of harmonic order i
i
Q Reactive power of harmonic order i
i
For historic reasons the cos φ parameter is also included in the V-I-P parameter group:
Calculation formula:
Methods of Measurement/Formulas 3
ϕ
where
⎛
⎜
=
⎜
⎝
⎛
Q
h
⎜
arctancoscos
⎜
P
⎝
P Real power
Q Harmonic reactive power
h
If you want to display the displacement power factor of the fundamental
component select the harmonics analysis parameter group and choose the
fundamental component in the drop-down list of available parameters.
Half and full cycle aggregations
Real power
Real power
the time domain.
n
∑
i
=
1
P
=
is calculated by directly multiplying the samples of voltage and current in
iiiu
⋅
)()(
n
⎞
⎞
⎟
⎟
⎟
⎟
⎠
⎠
Note
where
)(iu the i-th voltage sample of the cycle or half cycle
)(ii the i-th current sample of the cycle or half cycle
n
the number of samples per cycle or half cycle
Note
There is no integer number of samples per cycle or half cycle (neither for
50 Hz nor for 60 Hz systems). A 50 Hz cycle consists of 204.8 samples a 60
Hz cycle of 170.67 samples. Therefore the calculation uses sample
interpolation.
The 3-phase real power sum is calculated as
PPPP ++=
321 LLLsum
3-17
Find Quality Products Online at: sales@GlobalTestSupply.com
www.GlobalTestSupply.com
Page 50

1760
Users Manual
Apparent power
Apparent power
given aggregation.
The 3-phase apparent power sum is calculated as
Reactive power
The reactive power
tot
Q always has a positive sign.
tot
IUS ⋅=
S is calculated by multiplying rms values of voltage and current of the
SSSS ++=
321 LLLsum
Q is calculated by
tot
22
PSQ
−=
The 3-phase total reactive power sum is calculated as
QQQQ ++=
321 LtotLtotLtotsumtot
Note
The reactive power components
Q and dQ are not calculated with these
h
aggregations.
Power factor
The power factor is calculated as
P
PF =
S
The sign of the power factor is an indication of the power flow direction (motor /
generator characteristic of the load).
Events and Flicker
Voltage Events as per EN 50160 or as per IEC 61000-4-30
Voltage events are detected based on half cycle rms values (as per EN 50160) or on full
cycle rms values updated every half cycle (as per IEC 61000-4-30). As a default, the
phase-neutral voltages are monitored. If the opton Events, Flicker, and Harmonics of
U12.... is activated in the “Hardware Settings” dialog in PQ Analyze, the voltage events
of the phase-to-phase voltages U12, U23, U31 are recorded.
Flicker
Flicker is measured according to the methods described by the standard IEC 61000-415:2003-02 edition 1.1. As a default Flicker is calculated on the basis of the phase
voltages. For 50 Hz or 60 Hz power systems the appropriate filter coefficients are applied.
The classifier consists of 1130 logarithmic classes.
If the option Events, Flicker, and Harmonics of U12…. in the device settings is activated,
the Flicker of the phase-to-phase voltages U12, U23, U31 is recorded.
3-18
Find Quality Products Online at: sales@GlobalTestSupply.com
www.GlobalTestSupply.com
Page 51

Operation
Methods of Measurement/Formulas 3
Harmonics and Interharmonics Parameters
Voltage and Current Harmonics and Interharmonics
Voltage and current harmonics are calculated based on a 10/12 cycle (200ms) averaging
interval. This interval contains exactly 2048 sample values. From these samples 1024
FFT bins (5Hz) are calculated.
The harmonics are then calculated using a gapless harmonic subgroup assessment.
The interharmonics are calculated using a gapless interharmonic centered subgroup
assessment.
Harmonics and interharmonics calculation as per IEC 61000-4-7:2002 section 5.6 (no
smoothing).
THD – (Total Harmonic Distortion)
The calculation utilizes the following formula: Voltage or current respectively.
40
2
V
∑
n
2
n
THD
=
=
V
1
n: order of the harmonic.
: rms value of the voltage fundamental.
V
1
Vn: rms value of the voltage harmonic with order n.
THD
TID
THD ind
40
2
I
∑
n
2
n
=
=
I
1
n: order of the harmonic.
: rms value of the current fundamental.
I
1
In: rms value of the current harmonic with order n.
TID is the complete interharmonics contents of the signal. It is calculated as per EN
61000-4-7:1993 from all interharmonics spectral bins (absolute values) up to the
harmonic with order 40.
THD ind is calculated according to the formula in the norm EN61000-4-7:1993. This
formula is no more part of the actual version of EN 61000-4-7 but has still importance for
applications in networks with inductive loads.
2
40
THD
ind
1
=
V
1
∑
n
V
n
n
=
2
n: Order of the harmonic.
: rms value of the voltage fundamental.
V
1
Vn: rms value of the voltage harmonic with order n.
3-19
Find Quality Products Online at: sales@GlobalTestSupply.com
www.GlobalTestSupply.com
Page 52

1760
Users Manual
THD cap
THD cap is calculated according to the formula in the norm EN61000-4-7:1993. This
formula is no longer part of the most recent version of EN 61000-4-7 but has still
importance for applications regarding reactive power compensation equipment.
40
∑
n
THD
cap
K-Factor and Factor K
The two parameters are meant to assess transformer losses.
Harmonic currents are generated whenever a non-linear load is connected to the mains
supply. The problems caused by harmonic currents include overheating of cables,
especially the neutral conductor, overheating and vibration in induction motors and
increased losses in transformers. Where power factor capacitors are fitted, harmonic
currents can damage them and care must be taken to avoid resonance with the supply
inductance.
Losses in transformers are due to stray magnetic losses in the core, and eddy current and
resistive losses in the windings. Of these, eddy current losses are of most concern when
harmonics are present, because they increase approximately with the square of the
frequency.
There are two distinct approaches to accounting for this increased eddy current loss in
selecting a transformer. The first, devised by transformer manufacturers in conjunction
with Underwriters Laboratories in the United States, is to calculate the factor increase in
eddy current loss and specify a transformer designed to cope; this is known as ‘K-Factor’.
The second method, used in Europe, is to estimate by how much a standard transformer
should be de-rated so that the total loss on harmonic load does not exceed the
fundamental design loss; this is known as ‘Factor K’. The figures produced by each
method are numerically different; ‘Factor K’ is a total rating factor while ‘K-Factor’ is a
multiplier (although a de-rating factor can be derived from it). The fact that both methods
use K as a designation can lead to confusion when talking to suppliers.
=
=
2
2
*VVn
2
n
1
n: Order of the harmonic.
V
: rms value of the voltage fundamental.
1
Vn: rms value of the voltage harmonic with order n.
3-20
Find Quality Products Online at: sales@GlobalTestSupply.com
www.GlobalTestSupply.com
Page 53

Operation
I
Methods of Measurement/Formulas 3
K-Factor formula:
=
50
h
P
t
K
==
∑
P
f
22
hI
h
=
1
h
where
P total eddy current loss
t
P eddy current loss at fundamental frequency
f
I relative harmonic current component at order h (relative to fundamental)
h
h harmonic order
Factor K formula:
2
⎞
⎞
⎛
I
q
n
⎟
⎟
⎜
⎜
⎝
⎟
⎟
I
1
⎠
⎠
K
2
=
50
n
∑
⎛
⎜
n
⎜
+=
2,1
nn
⎝
I
e
+=
1
+
1
⎞
⎛
1
⎟
⎜
I
e
⎠
⎝
where
e eddy current loss at the fundamental frequency divided by the loss due to a dc current
equal to the RMS value of the sinusoidal current (constant factor to be entered by the
user – see dialog below)
q exponential constant that is dependent on the type of winding and frequency. Typical
values are 1.7 for transformers with round or rectangular cross section conductors in both
windings and 1.5 for those with foil low voltage windings (to be entered by the user – see
dialog below)
rms value of the sinusoidal current including all harmonics
I magnitude of the harmonic current of order n
n
I magnitude of the fundamental current component
1
h harmonic order
3-21
Find Quality Products Online at: sales@GlobalTestSupply.com
www.GlobalTestSupply.com
3_1.bmp
Page 54

1760
Users Manual
PQ Analyze supports both formulas, the user can select the formula he wants to use.
K-Factor (US) and Factor K (EU) are only available via the Measurement menu.
Signaling Voltage
Ripple Control Signals
The frequency of the ripple control signal of the local utility can be defined in the PQ
Analyze software in the trigger settings dialogue. These signals are calculated from the
FFT results. The FFT bin related to the signaling voltage is calculated from the rated
signaling frequency and the nominal power frequency (derived from the 50 Hz or 60 Hz
setting in the PQ Analyze software) using 2.048 samples per 10/12 cycle interval with
10.24 kHz sample rate. If the signaling voltage corresponds to the frequency of a FFT bin
within 1 % (referred to the bin spacing), only this bin is used. Otherwise, the rms values
of four neighboring FFT bins are added, giving the rms value of the signaling frequency.
200 ms and 3 s aggregations are available.
Unbalance, Overdeviation, Underdeviation
Unbalance
The unbalance (imbalance) is derived from the symmetrical components as per IEC
61000-4-30 class A section 5.7.1. based on the 10/12 cycle values of the voltage
fundamentals. The symmetrical components are calculated as:
1
Z
1
P
3
1
N
3
()()
3
()() ()()
()() ()()
2
1331221
2
1331221
1321221
VZ, VP, VN rms values of zero, positive, and negative system
V
, V2, V3 rms values of the fundamentals of the phase voltages
1
ϕ
, ϕ
phase angles between phases 1 and 2, phases 1 and 3
12
13
(nominal: -120° and -240°)
sin*sin*cos*cos*
VVVVVV
++++=
2
2
ϕϕϕϕ
133122
2
οοοο
240sin*120sin*240cos*120cos*
++++++++=
VVVVVV
VVVVVV
ϕϕϕϕ
133122
2
οοοο
120sin*240sin*120cos*240cos*
++++++++=
ϕϕϕϕ
133122
3-22
Find Quality Products Online at: sales@GlobalTestSupply.com
www.GlobalTestSupply.com
Page 55

Operation
Methods of Measurement/Formulas 3
Calculation of unbalance as per IEC 61000-4-30:
V
V
V =
V
V
V
N
=
2
V
P
V
Z
0
V
P
: zero system
Z
: positive system
P
: negative system
N
%100*
%100*
The calculation of V
system the following formulas with phase-phase voltages (same results):
=
V
2
4
β
=
1,12
2
()
1,12
For a 3-wire network the zero system component V
The voltage values are averaged squared versus time, afterwards the
unbalance is calculated for the time interval.
For more information, see Table 3-2.
Current Unbalance
In addition to the system component parameters that are available for voltage
measurement (zero system, positive system, negative system) for current there is the
special current unbalance calculation.
In some applications when you want to check if the current load of the power system is
distributed equally over the three phases this simpler calculation of current unbalance is
preferred.
, V2 utilizes the above formulas for VZ, VP, VN or for a 3-wire
0
−−
631
β
%100*
631
β
−+
4
2
4
VVV
++
1,23
1,23
1,31
kkk
2
2
VVV
++
1,31
kkk
Note
is 0 per definition.
z
Calculation:
Calculate average current I
= (I1 + I2 + I3)/3
avg
Find the maximum deviation from this average current.
Maximum value of max(|I
Current unbalance is 100 * max(|I
1
– I
|,|I2 – I
avg
1
– I
avg
avg
|,|I3 – I
|,|I2 – I
avg
|,|I3 – I
avg
|)
avg
|) / I
avg
The purpose is to have a simple indicator of detecting an unbalanced current load in a 3phase system based on the RMS values only. The phase angles do not matter in this
calculation.
3-23
Find Quality Products Online at: sales@GlobalTestSupply.com
www.GlobalTestSupply.com
Page 56

1760
Users Manual
Overdeviation and Underdeviation
The Over- and Underdeviation parameters give an indication if the signal in a given
aggregation was higher or lower than the nominal voltage.
The formulas according to IEC 61000-4-30 are:
Underdeviation
U if
under
0=
UU >
...
otherwise
U
under
⎛
⎜
=
⎜
⎝
U
−
nom
UU
...
smrnom
Overdeviation:
over
0=
UU <
nomsmr
...
U if
otherwise
U
over
⎛
⎜
=
⎜
⎝
U
...
−
nom
⎞
UU
nomsmr
⎟
⎟
⎠
nomsmr
⎞
⎟
⋅
⎟
⎠
⋅
%100
%100
3_2.bmp
These parameters give additional information for assessing the stability of the voltage.
3-24
Find Quality Products Online at: sales@GlobalTestSupply.com
www.GlobalTestSupply.com
Page 57

Operation
ADC data
F
F,max
F,min
rms
rms,max
rms,min
over deviation
under deviation
P
P,max
P,min
Q
Q,max
Q,min
S
S,max
S,min
PF
cosphi
cos,phi
Pst
Plt
instantaneous flicker
THD
THD,max
THD,ind
THD,ind,max
THD,cap
THD,cap,max
TID
TID,max
TDD
k-factor
factor K
rms harmonics 0 .. 50
rms harmonics,max 0 .. 50
power harmonics real 0 .. 50
power harmonics reactive 0 .. 50
interharmonics 0 .. 50
real energy W
reactive energy Wq
apparent energy Ws
unbalance
unbalance simple
sample data
RMS
half/full cycle,
200ms, 3s
V1
V
Vn
I
In
Vp
V
Vp
V
Vp
PPPPPP(P)(P)(P)(P)(P) V (P) (P) (P)
DAY
V1 V1 V1
V
Vn
I
In
Vp
V
Vn
I
In
Vp
V
Vn
I
In
Vp
PPPPPP(P)(P)(P)(P)(P)(P) V
V
I
V
I
V
I
V
I
V
I
V
I
V
I
V
I
V
I
Vn
In
V
I
Vn
In
P P (P) (P) (P)
V
I
I
Free interval
10s, 20s, 30s
multiples of 1min
max: 1440 min(1d)
V1 V1 V1
V
Vn
I
In
Vp
V
Vn
I
In
Vp
V
Vn
I
In
Vp
V
Vp
V
Vp
PPPPPP(P)(P)(P)(P)(P)(P)V
V
I
V
I
V
I
V
I
V
I
V
I
V
I
V
I
I
II
V
I
Vn
In
V
I
Vn
In
PP
V
I
Vn
In
(P) (P) (P)
V
I
I
10 min
V1 V1 V1
V
Vn
I
In
Vp
V
Vn
I
In
Vp
V
Vn
I
In
Vp
V
Vp
V
Vp
PPPPPP(P)(P)(P)(P)(P)(P)V (V)
V
I
V
I
V
I
V
I
V
I
V
I
V
I
V
I
I
II
V
I
Vn
In
V
I
Vn
In
PP
V
I
Vn
In
(P) (P) (P)
V
I
I
Harmonics
200ms, 3s
(P)
V
I
V
I
V
I
V
I
V
I
V
I
V
I
V
I
V
I
Vn
In
V
I
Vn
In
PP
V
I
Vn
In
V
I
I
ripple control
200ms, 3s
V
I
Vn
In
P(P)
transient
100kHz..10MHz
V
I
oscilloscope
10,24kHz
V
I
harmonics
parameters
energy parameters
symmetry
parameters
frequency
power parameters
flicker parameters
rms parameters
Table 3-2. Parameter Aggregation Matrix
Methods of Measurement/Formulas 3
I ... applies to current inputs Interpolation for the RMS cycle values with 10,24kHz = 176,4 samples/cycle for 60Hz
Vn ... applies to neutral line voltage (ch4, ch8)
In ... applies to neutral line current (ch8)
P ... applies only to voltage/current systems
V1 ... applies to reference channel (ch1)
Vp ... applies to phase- voltages
Symbols: V ... applies to voltage inputs Interpolation for the RMS cycle values with 10,24kHz = 204,8 samples/cycle for 50Hz
( ) ... calculated in PC SW (not available in the instrument)
table.eps
3-25
Find Quality Products Online at: sales@GlobalTestSupply.com
www.GlobalTestSupply.com
Page 58

Chapter 4
Maintenance
Title Page
Introduction.......................................................................................................... 4-3
Maintenance of Battery Package ......................................................................... 4-3
Cleaning............................................................................................................... 4-3
Replacement of Battery Pack............................................................................... 4-4
Decommissioning and Disposal........................................................................... 4-4
Shutting Down................................................................................................. 4-4
Recycling and Disposal ................................................................................... 4-5
Warranty .............................................................................................................. 4-5
Recalibration........................................................................................................ 4-5
4-1
Find Quality Products Online at: sales@GlobalTestSupply.com
www.GlobalTestSupply.com
Page 59

Maintenance
Introduction 4
Introduction
The instrument itself is maintenance-free.
Maintenance of Battery Package
Note
We recommend carrying out a forced battery discharge at regular time
intervals (no longer than 3 months) to maintain the battery capacity as long
as possible. It is recommended to replace the battery every 2 years to
ensure full operational readiness for UPS.
Procedure:
1. Connect the instrument to mains.
2. Set the mains switch to the I-position.
3. Wait until the POWER LED is on.
4. Disconnect the power supply.
5. Wait until the POWER LED goes off.
6. Set the mains switch to the 0-position.
7. Wait until the LEDs POWER and UPS are flashing rapidly.
8. Within 3 second set the mains switch to I-position again.
The battery package will be discharged completely when:
• LED POWER is OFF
• LED UPS is flashing slowly
• LEDs MEMORY LEVEL show flashing light, the number of LEDs lighting up
• Afterwards the instrument is turned off automatically
For terminating the forced discharge mode at any time, connect instrument
to mains or set the mains switch to the 0-position.
Cleaning
The device can be cleaned with an Isopropanol impregnated cloth.
Do not use abrasives or other solvents.
indicates the remaining time period for discharging in minutes (e.g. 5 LEDs
means that the discharging will last for appr. 5 minutes)
Note
W Caution
4-3
Find Quality Products Online at: sales@GlobalTestSupply.com
www.GlobalTestSupply.com
Page 60

1760
Users Manual
Replacement of Battery Pack
XW Warning
• Disconnect all the sensors from the instrument’s input
connectors.
• Disconnect the instrument from the power supply.
• Do not short circuit the terminals of the battery pack.
• For replacement of the battery pack, use the original
spare parts only (PN 2540406).
‰ Note
Always adhere to the applicable statutory regulations for recycling and
waste disposal.
Procedure:
1. Locate the battery compartment on the backside of the instrument.
2. Remove the screw of the lid with a screwdriver (Pozi-drive).
3. Unlock and remove the connector cable.
4. Replace the battery pack by an original spare part (PN 2540406) using the
attached strip.
5. Connect the cable to the plug of the instrument.
Note
Note the polarity of the plug and the locking mechanism.
Decommissioning and Disposal
Shutting Down
1. Ensure that all the devices connected to measuring circuits are disconnected from
the measuring circuits.
2. Switch off the Power Quality Recorder.
3. Disconnect the plug from the mains socket.
4. Remove all the connected devices.
5. Secure the unit against inadvertent switching on.
6. Ensure that the operating manual is kept near the device.
4-4
Find Quality Products Online at: sales@GlobalTestSupply.com
www.GlobalTestSupply.com
Page 61

Maintenance
Recycling and Disposal
Warranty 4
‰ Note
Always adhere to the applicable statutory regulations for recycling and
waste disposal. Do not dispose in domestic household waste.
Packaging: Packaging consists solely of recycleable material.
For any packaging disposal licenses for your country, contact
your distributor or retailer.
Housing: The housing is made of insulating plastics material.
Weight, Volume: The instrument has a weight of approx. 4.900 g (10.8 lbs) and a
Warranty
The warranty period for the instrument is limited to 2 years, the specified uncertainty of
measurement is limited to 1 year from the date of purchase.
The warranty is not valid for batteries.
The warranty is only valid if accompanied with the respective invoice or receipt of
payment.
Damages due to improper use, overload or operation under conditions that are outside the
range of permitted ambient conditions are not covered by the warranty.
Warranty covers only technical data that is specified with a tolerance range. Values or
limits for which there are no tolerances specified are intended for information purposes
only.
Recalibration
Fluke recommends recalibrating the device every year if the instrument is operated over
the full operating temperature range. For operation between +15 °C and +35 °C the
calibration period can be extended to 2 years. For an accuracy of 0.5 % for voltages and
1 % for currents, 5 years calibration period is recommended.
volume of approx. 4.700 cm
3
(287 cubic in).
The device can be calibrated by the Fluke service department or any other calibration
specialist.
4-5
Find Quality Products Online at: sales@GlobalTestSupply.com
www.GlobalTestSupply.com
Page 62

Chapter 5
Specifications
Title Page
General Specifications ......................................................................................... 5-3
5-1
Find Quality Products Online at: sales@GlobalTestSupply.com
www.GlobalTestSupply.com
Page 63

Specifications
General Specifications 5
General Specifications
Intrinsic uncertainty refers to reference conditions and is guaranteed for one year
Quality system developed, manufactured as per ISO 9001: 2000
Ambient conditions
Operating temp. range
Working temp. range
Storage temp. range
Reference temperature
Climatic class
Max. Voltage to earth/ Overvoltage
category
Reference conditions
0 °C... +50 °C; 32 °F... +122 °F
-20 °C... +50 °C; -4 °F... +122 °F
-20 °C... +60 °C; -4 °F... 140 °F
23 °C ± 2 K; 74 °F ± 2 K
B2 (IEC 654-1), -20 °C... +50 °C; -4 °F +122 °F
Altitude: 2000 m: max. 600 V CAT IV*
Basic unit and mains supply: 300 V CAT III
Altitude: 5000 m: max 600 V CAT III*
Basic unit and mains supply: 300 V CAT II
* depending on the connected sensor
Environment temp.: 23 °C ± 2 K < 60 % rH; 74 °F ± 2 K < 60
% RH
Power frequency: 50 Hz / 60 Hz
Signal: declared input voltage Udin
Averaging: 10 minute intervals
Warmed up instrument > 3 h
Power supply: 120 V/60 Hz or 230 V/50 Hz, ± 10 %
Housing
Protection
Electrical safety
Power supply
Environmental Pollution Degree 2, Protection class I
Emissions/Immunity IEC 61326-1:2006
Display
Power LED
insulated, robust plastics housing
IP40
EN 61010-1 2nd edition, basic unit 300 V CAT III
entire measuring system depending on the used sensors
from 300V CATII up to 600V CATIV (1000V CATIII)
83 to 264 V ac, 35 W, < 70 V A 45 to 65 Hz
dc: 100 to 375 V
Fluke 1760 features LED indicators for the status of the 8
channels, phase sequence, power supply (mains or
accumulator), memory usage, time synchronization, and data
transfer.
• Permanent light: normal power supply from mains.
• OFF: supply via internal accumulator in case of a
power failure.
5-3
Find Quality Products Online at: sales@GlobalTestSupply.com
www.GlobalTestSupply.com
Page 64

1760
Users Manual
Channel LEDs 3-color LEDs per channel for:
• overload condition
• OK and signal level too low condition
signal level in nominal range
Data memory 2 GB Flash memory
Memory model Selectable : Linear or circular
Recording mode Continuous, gapless recording
Measurement system
Interfaces
Baud rate for RS 232 9600 Baud … 115 kBaud
Dimensions (H x W x D) 325 mm x 300 m x 65 mm (13 x 12 x 2.6 inch)
Weight (without accessories) approximately 4.9 kg (10.8 lbs)
Warranty 2 years
Calibration interval 1 year recommended for Class-A, otherwise 2 years
Signal conditioning Specification
Range for 50 Hz systems 50 Hz ± 15 % (42.5 Hz to 57.5 Hz)
Range for 60 Hz systems 60 Hz ± 15 % (51 Hz to 69 Hz)
Frequency Resolution 16 ppm
Sampling frequency for 50 Hz and 60 Hz
nominal power frequency
Uncertainty for frequency measurements < 20 ppm
Uncertainty of internal clock < 1s / day
4 voltages + 4 currents for 3 phases + N conductor or 8
voltages
Ethernet (100 MB/s), compatible to Windows® 2000/XP
SP3/Vista, RS 232 and USB 2.0
10.24 kHz, The sampling rate is synchronized to mains
frequency.
Measurement intervals
Min-Max-values
Transients
Aggregation of the interval values as per IEC 61000-4-30
Class-A
Half cycle
Sample rate 100 kHz to10 MHz per channel
5-4
Find Quality Products Online at: sales@GlobalTestSupply.com
www.GlobalTestSupply.com
Page 65

Specifications
Harmonics Range
Intrinsic uncertainty
basic aggregation interval 200 ms
Interharmonics Range
Intrinsic uncertainty
basic aggregation interval 200 ms
<25 % of VRMS fundamental up to a THD of 50 %
≥1 % Vnom: ±5 % of reading
< 1 % of Vnom: ±0.05 % of Vnom
as per IEC 61000-4-7:2002 and amendment 1:2008, IEC
61000-2-4 Class 3
<25 % of VRMS fundamental up to a TID of 50 %
≥1 % Vnom: ±5 % of reading
< 1 % of Vnom: ±0.05 % of Vnom
as per IEC 61000-4-7:2002 and amendment 1:2008
General Specifications 5
Conditions for Harmonics and
Interharmonics Specifications
Temperature
Humidity
Supply voltage
Common mode interference voltage
Static electricity discharge
Radiated electric fields
Voltage unbalance – Range
Intrinsic uncertainty
Flicker
All PQ parameters are evaluated in accordance with IEC 61000-4-30 Class A, 2008 Edition 2
In regulations the standard expression for V
within operating temperature range
10%-60% r.H.
83 - 264 V ac, 45 - 65 Hz, 100 - 375 V dc
≤ Vnom
IEC 61326-1 / industrial environment
IEC 61326-1 / industrial environment
0 to 100 %
±0.15 % absolute deviation
as per EN 61000-4-15:2003:
10 min (Pst), 2 h (Plt)
is U
nom
nom
Measurement inputs
Number of inputs 8 galvanically isolated inputs for voltage and current
measurements.
Sensor safety up to 600 V CAT IV depending on sensor
Basic unit safety rating 300 V CAT III
Nominal voltage (rms) 100 mV
Range (peak value) 280 mV
Overload capacity (rms) 1000 V, continuously
Voltage rise rate max. 15 kV / μs
Input resistance 1 M Ω for instrument, 1000 V sensor 10 MΩ
Input capacitance < 50 pF
Input filter
Each channel is equipped with a passive low-pass filter, an antialiasing filter and a 16-bit A/D converter. All channels are sampled
synchronously with a common quartz-controlled clock pulse.
The filters protect against voltage transients and limit the signal rise
rate, reduce high frequency components and especially the noise
voltage above half the sampling rate of the A/D converter by 80 dB,
thus achieving very small measuring errors in an exceptionally large
amplitude range. This is also valid under extreme operating
conditions like transient voltages at the output of converters.
5-5
Find Quality Products Online at: sales@GlobalTestSupply.com
www.GlobalTestSupply.com
Page 66

1760
Users Manual
Uncertainties Instrument with 600V/1000V Sensor
Uncertainty including the voltage sensors is in compliance with IEC
61000-4-30 Class-A. All voltage sensors are suitable for DC to 5 kHz
Sensor 1000 V
Sensor 600 V
Intrinsic uncertainty for Harmonics Class I as per EN 61000-4-7:2002 and amendment 1:2008
Temperature drift: < 65 ppm / K
Aging < 0.04 % / year
Common mode rejection
Noise
Udin = 600 V P-N:
Range: 0 to 1200 V rms Peak 1700 V rms
0.1 % of Udin according to IEC 61000-4-30 Class A 2008 Edition 2
Udin = 480 V P-N:
Range: 0 to 960 V, Peak 1700 V rms
0.1 % of Udin according to IEC 61000-4-30 Class A 2008 Edition 2
Udin = 230 V P-N:
Range: 0 to 460 V, Peak 900 V rms
0.1 % of Udin according to IEC 61000-4-30 Class A 2008 Edition 2
Instrument > 100 dB at 50Hz (e.g. shunt)
With voltage sensor 600 V/1000 V > 65 dB at 50 Hz
Noise voltage for instrument, input short-circuited:< 40 μV rms
HzV /8,0
μ
With sensor 1000 V: < 0.8V rms
5-6
With sensor 600 V: < 0.5 V rms
DC ± (0.2 % rdg + 0.1 % sensor range)
Find Quality Products Online at: sales@GlobalTestSupply.com
www.GlobalTestSupply.com
Page 67

Chapter 6
Options and Accessories
Title Page
Instruments........................................................................................................... 6-3
Accessories .......................................................................................................... 6-3
Standard Voltage Probes for AC and DC........................................................ 6-4
Flexible Current Probes for AC....................................................................... 6-5
Current Probes for AC Currents ...................................................................... 6-5
Shunt Resistors for AC and DC Currents........................................................ 6-6
Other Accessories............................................................................................ 6-6
Current Clamp 1 A/10 A AC........................................................................... 6-6
Current Clamp 5 A/50 A AC........................................................................... 6-10
Current Clamp 20 A/200 A AC....................................................................... 6-14
Flexi Current Sensor 100 A/500 A.................................................................. 6-17
Flexi Current Sensor 200 A/1000 A................................................................ 6-21
Flexi Current Sensor 3000 A/6000 A.............................................................. 6-24
GPS-Time Synchronization Module Option........................................................ 6-27
6-1
Find Quality Products Online at: sales@GlobalTestSupply.com
www.GlobalTestSupply.com
Page 68

Options and Accessories
Instruments 6
Instruments
Product Description/technical specifications
Fluke 1760 Basic
without fast transient
without voltage and current
sensors
Fluke 1760TR Basic
with fast transient, without voltage
and current sensors
Fluke-1760 INTL
Fluke-1760 US
Power Quality Recorder/Analyzer
8 channels
(4 voltages/4 currents or 8 voltages)
Interfaces: 1 RS 232 interface cable
Ethernet
1 Ethernet cable for network connection
1 crosslink Ethernet cable for direct PC connection
Memory: 2 GB Flash memory
CDROM: PQ Analyze software and SW manual, operators guide on
CDROM
1 mains cable, mains adapter set, for country specific connection
1 Getting Started Manual
1 carrying bag
The Fluke 1760 TR Basic includes all of the items in the Fluke 1760
Basic unit, plus.
Fast transient analysis up to 10 MHz
The Fluke 1760 includes all of the items in the Fluke 1760 Basic unit,
plus.
without fast transient, with voltage
and current sensors
Fluke-1760TR INTL
Fluke-1760TR US
with fast transient, with voltage
and current sensors
Accessories
The voltage probes for various ranges between 0.1 V and 1000 V are available for the
instrument.
The current sensor for direct current measurement (shunt) is available for 20 mA, 1 A,
and 5 A.
The passive current clamps (ac only) are available in ranges with 1 A up to 200 A,
2 ranges can be selected in the PQ Analyze software.
The flexible current sensors (TPS Flex) are available for ranges between 100 A and
6000 A ac; 2 ranges can be selected in the PQ Analyze software.
INTL: 4 voltage probes 600 V + two Dolphin clips for each probe
US: 4 voltage probes 1000 V + two Dolphin clips for each probe
4 flexible current probes 1000 A/200 A
GPS time sync receiver
The Fluke 1760 TR includes all of the items in the Fluke 1760 unit,
plus.
Fast transient analysis up to 10 MHz
6-3
Find Quality Products Online at: sales@GlobalTestSupply.com
www.GlobalTestSupply.com
Page 69

1760
Users Manual
All probes contain a memory for calibration factors, sensor identity, and serial number
which is read automatically by the instrument. Ranges can be selected in the PQ Analyze
software.
Other measuring transducers can be connected to the inputs of these sensors, such as mV
output temperature sensors.
Standard Voltage Probes for AC and DC
Temperature coefficient: 100 ppm/K
Aging: <0.05 %/year
All voltage sensors are suitable for DC for DC and AC up to 5 kHz
Voltage Probe PN
TPS VOLTPROBE
0.1 V
TPS VOLTPROBE
10 V
TPS VOLTPROBE
100 V
TPS VOLTPROBE
400 V
TPS VOLTPROBE
600 V
TPS VOLTPROBE
1000 V
1
between red and black connector
2
sensor + basic unit 0.1 % of Udin = 230 V P-N in accordance with IEC61000-4-30 Class A
3
sensor + basic unit 0.1 % of Udin = 480 V and 600 V P-N in accordance with IEC61000-4-30 Class A
2540613 0.1 V 10 mV -
2540636 10 V 0.1-17 V 100 V 16 kΩ 0.15 % of rdg
2540624 100 V 1-170 V 1000 V 8.5 MΩ 0.15 % of rdg
2540660 400 V 4-680 V 1000 V 8.5 MΩ 0.15 % of rdg
2540697 600 V 10-1000 1000 V 8.5 MΩ 0.1 %2
2540649 1000 V 10-1700 2000 V 13 MΩ 0.1 %3
V
nom
Range
V rms
0.2 V
max.
overload
continuous
100 V 1 MΩ 0.15 % of rdg
Input
resistance1
Voltage Probe PN
Transient
Range
1
Transient
uncertainty
Max. Voltage to earth
Overvoltage category
Intrinsic
Uncertainty
± 0.8 mV
± 8 mV
± 80 mV
± 0.32 V
TPS VOLTPROBE
0.1 V
TPS VOLTPROBE
10 V
TPS VOLTPROBE
100 V
TPS VOLTPROBE
400 V
TPS VOLTPROBE
600 V
TPS VOLTPROBE
1000 V
1
signal duration <1ms
2540613 --- --- 300V CATII
2540636 --- --- 300V CATII
2540624 50-6000V 5 % 600V CATIV
2540660 50-6000V 5 % 600V CATIV
2540697 50-6000V 5 % 600V CATIV
2540649 50-6000V 5 % 1000V CATIII / 600 V CAT IV
6-4
Find Quality Products Online at: sales@GlobalTestSupply.com
www.GlobalTestSupply.com
Page 70

Options and Accessories
Accessories 6
Flexible Current Probes for AC
Intrinsic
Uncer-
tainty
(>1 % of
range)
1 %
1 %
1 %
Frequency
Range
45 Hz –
3.0 kHz
45 Hz –
3.0 kHz
45 Hz –
3.0 kHz
Operating
Voltage
600 V
CAT IV
600 V
CAT IV
600 V
CAT IV
Phase
Error
0.5 °
0.5 °
0.5 °
Diameter
45 cm
(18 inch)
length
2 m cable
61 cm
(24 inch)
length
2 m cable
91 cm
(36 inch)
length
4 m cable
Model No.
Product No
TPS Flex 18
PN 2540477
TPS Flex 24
PN 2540489
TPS Flex 36
PN 2540492
Type
Flexible
Current
Probe
Flexible
Current
Probe
Flexible
Current
Probe
Range
Selectable Per
Software
1 A – 100 A
5 A – 500 A
2 A – 200 A
10 A – 1000 A
30 A – 3000 A
60 A – 6000 A
Peak Current
for
Sinusoidal
Currents
240 A
1350 A
480 A
2700 A
10 kA
19 kA
Current Probes for AC Currents
Model No.
Product No
TPS CLAMP
10 A/1 A
PN 2540445
TPS CLAMP
50 A/5 A
PN 2540461
TPS CLAMP
200 A/20 A
PN 2540450
Type
Clip-on
Current
Trans-
former
Clip-on
Current
Trans-
former
Clip-on
Current
Trans-
former
Range
Selectable
0.01 A – 1 A
0.1 A – 10 A
0.05 A – 5 A
0.5 A – 50 A
0.2 A – 20 A
2 A – 200 A
Peak Current
for
Sinusoidal
Currents
3.7 A
37 A
18 A
180 A
74 A
300 A
Intrinsic
Uncertainty
(>1 % of
range)
0.5 %
0.5 %
0.5 %
Frequency
Range
40 Hz –
10 kHz
40 Hz –
10 kHz
40 Hz –
10 kHz
Operating
voltage
300 V
CAT IV
300 V
CAT IV
300 V
CAT IV
Phase
error
0.5 °
0.5 °
0.5 °
Jaw
Opening
conductor
cross-
section
15 mm,
(0.6 inch)
2 m cable
conductor
cross-
section
15 mm,
(0.6 inch)
2 m cable
conductor
cross-
section
15 mm,
(0.6 inch)
2 m cable
6-5
Find Quality Products Online at: sales@GlobalTestSupply.com
www.GlobalTestSupply.com
Page 71

1760
Users Manual
Shunt Resistors for AC and DC Currents
Peak
Model No.
Product No.
TPS SHUNT
20 MA
PN 2540553
TPS SHUNT
1 A
PN 2540548
TPS SHUNT
5 A
PN 2540566
Type Range
SHUNT
20 mA
SHUNT
1 A
SHUNT
5 A
0 – 55 mA 77.8 mA
0 – 2.8 A 4 A
0 – 10 A 21.9 A
Current
for
Sinusoidal
Currents
Imax=1.5 A
Imax=5.5 A
Imax=10 A
Errors in % of measuring range at 23 °C ± 2 K, for 48 – 65 Hz.
Phase angle error at nominal current.
I
maximum current without time limit.
max
Intrinsic
Uncertainty
(>1 % of
range)
0.2 % DC 3.0 kHz 300 V CAT II 0.1 °
0.2 % DC 3.0 kHz 300 V CAT II 0.1 °
0.2 % DC 3.0 kHz 300 V CAT II 0.1 °
Frequency
Range
Operating
Voltage
Phase
Error
Other Accessories
Product Description/technical specifications Product- No.
Transport case For Instrument and accessories 2540414
Safety adapter With quick-break fuse of 100 kA circuit-breaking capacity 2540530
2 A quick-break fuse With 100 kA circuit-breaking capacity 2540509
Battery pack Replacement battery pack 2540406
Current Clamp 1 A/10 A AC
This current probe has been designed for non intrusive, accurate measurements of small
AC currents. Using latest technologies (internal memory for calibration data) provides
current ranges from 0.01 A up to 10 A. The measurement range can be selected in the PQ
Analyze software: IAC1 or IAC10.
XW Warning
To protect against electrical shock:
• Use personal protective equipment measures as required
by local government agencies, when attaching clamps to
live circuits.
• Utilize the clamps only on insulated conductors, max.
600 V r.m.s. or dc to ground.
6-6
Find Quality Products Online at: sales@GlobalTestSupply.com
www.GlobalTestSupply.com
Page 72

Options and Accessories
Accessories 6
Electrical Characteristics
Nominal current In: 1 A/10 A AC rms
Measuring ranges: 0.01 A – 1 A or 0.1 A – 10 A
Crest factor: < 3
Peak current: 3.7 A/37 A
Max. non destructive current: Up to 100 A rms
Conductor position influence: < 0.5 % of range for 50/60 Hz
Error due to adjacent conductor: ≤ 15 mA/A for 50 Hz
Phase error (to reference conditions): < ±0.5 degrees
Frequency range (clamp without the
instrument):
Temperature coefficient: 0.015 % of range/ °C
Safety: 300 V CAT IV, type C sensor, pollution
General Characteristics
Maximum conductor size: Diameter: 15 mm.
Cable length: 2 m
Operating temperature range: −10 °C - +55 °C
Storage temperature range: −20 - +70 °C
Operating humidity: 15 % - 85 % (non-condensing)
Weight (per clamp): 220 g
Order-number: 2540445
Reference Conditions
Environment temperature range: +18 °C to +26 °C
40 Hz – 10 kHz (−3 dB)
degree 2
Bus bar: 15 x 17 mm
Humidity: 20 to 75 % rh
Current: Sinusoidal waveform with 48 to 65 Hz
Distortion factor: <1 %, no DC component, stray field <40 A/m,
conductor centered within the clamp jaws
Safety Standards
• IEC/EN 61010-1 2
nd
edition
• IEC/EN 61010-2-032
• IEC/EN 61010-031
EMC Standards
EN61326 –1:2006
6-7
Find Quality Products Online at: sales@GlobalTestSupply.com
www.GlobalTestSupply.com
Page 73
1760
Users Manual
Accuracy (Typical, for 50/60 Hz)
Linearity, error in % of measured value, primary current in A:
a680501049-linearity-1a.bmp
a680501049-linearity-10a.bmp
6-8
Find Quality Products Online at: sales@GlobalTestSupply.com
www.GlobalTestSupply.com
Page 74

Options and Accessories
Accessories 6
Phase angle in degrees, primary current in A:
a680501049-phase-1a.bmp
a680501049-phase-10a.bmp
6-9
Find Quality Products Online at: sales@GlobalTestSupply.com
www.GlobalTestSupply.com
Page 75

1760
Users Manual
Dimensions (in mm):
6-10
Current Clamp 5 A/50 A AC
This current probe has been designed for non intrusive, accurate measurements of small
AC currents. Using the latest technologies (internal memory for calibration data) provides
reliable current ranges from 0.05 A up to 50 A. The measurement range can be selected
in the PQ Analyze software: IAC5 or IAC50.
To protect against electrical shock:
• Utilize the clamps only on insulated conductors, max.
600 V rms or dc to ground.
• Use personal protective equipment measures as required
by local government agencies, when attaching clamps to
live circuits.
Electrical Characteristics
Nominal current In: 5 A/50 A AC rms
Measuring ranges: 0.05 A – 5 A or 0.5 A – 50 A
XW Warning
small clamp-dimensions.bmp
Find Quality Products Online at: sales@GlobalTestSupply.com
www.GlobalTestSupply.com
Page 76

Options and Accessories
Accessories 6
Crest factor: < 3
Peak current: 18 A, 180 A
Max. non destructive current: Up to 200 A rms
Conductor position influence: < 0.5 % of range at 50/60 Hz
Error due to adjacent conductor: ≤ 15 mA/A at 50 Hz
Phase error (to reference conditions): < ±0.5 degrees
Frequency range (clamp without the
instrument):
Temperature coefficient: 0.015 % of range/ °C
Safety: 300 V AC CAT IV, type C sensor, pollution
General Characteristics
Maximum conductor size: Diameter: 15 mm.
Cable length: 2 m
Operating temperature range: −10 °C - +55 °C
Storage temperature range: −20 - +70 °C
Operating humidity: 15 % - 85 % (non-condensing)
Weight (per clamp): Approx. 220 g
Order-number: 2540461
Reference Conditions
Environment temperature range: +18 °C to +26 °C
Humidity: 20 to 75 % rh
40 Hz – 10 kHz (−3 dB)
degree 2
Bus bar: 15 x 17 mm
Current: Sinusoidal waveform, with 48 to 65 Hz
Distortion factor: < 1 %, no DC component, stray field < 40 A/m,
conductor centered within the clamp jaws
Safety Standards
• IEC/EN 61010-1 2
nd
edition
• IEC/EN 61010-2-032
• IEC/EN 61010-031
EMC Standards
EN61326 –1:2006
Accuracy (Typical, for 50/60 Hz)
Linearity, error in % of measured value, primary current in A:
6-11
Find Quality Products Online at: sales@GlobalTestSupply.com
www.GlobalTestSupply.com
Page 77

1760
Users Manual
a680501048-linearity-5a.bmp
a680501048-linearity-50a.bmp
6-12
Find Quality Products Online at: sales@GlobalTestSupply.com
www.GlobalTestSupply.com
Page 78

Options and Accessories
Accessories 6
Phase angle in degrees, primary current in A:
a680501048-phase-5a.bmp
a680501048-phase-50a.bmp
Dimensions: See 2540445 (1 A/10 A Current Clamp).
6-13
Find Quality Products Online at: sales@GlobalTestSupply.com
www.GlobalTestSupply.com
Page 79

1760
Users Manual
Current Clamp 20 A/200 A AC
This current probe has been designed for non intrusive, accurate measurements of small
AC currents. Using the latest technologies (internal memory for calibration data) provides
current ranges from 0.2 A up to 200 A. The measurement range can be selected in the PQ
Analyze software: IAC20 or IAC200.
XW Warning
To protect against electrical shock:
• Utilize the clamps only on insulated conductors, max.
600 V rms or dc to ground.
• Use personal protective equipment measures as required
by local government agencies, when attaching clamps to
live circuits.
Electrical Characteristics
Nominal current In: 20 A, 200 A AC rms
Measuring ranges: 0.2 A – 20 A or 2 A – 200 A
Crest factor: < 3
Peak current: 74 A, 300 A
Max. non destructive current: Up to 300 A rms
Conductor position influence: < 0.5 % of range for 50/60 Hz
Error due to adjacent conductor: ≤15 mA/A for 50 Hz
Phase error (to reference conditions): < ±0.5 degrees
Frequency (clamp without the
instrument):
Temperature coefficient: 0.015 % of range/ °C
Safety: 300 V CAT IV, type C sensor, pollution
General Characteristics
Maximum conductor size: Diameter: 15 mm
Cable length: 2 m
Operating temperature range: −10 °C - +55 °C
Storage temperature range: −20 - +70 °C
Operating humidity: 15 % - 85 % (non-condensing)
40 Hz – 10 kHz (−3 dB)
degree 2
Bus bar: 15 x 17 mm
Weight (per clamp): Approx. 220 g
Order-number: 2540450
Reference Conditions
Environment temperature range: +18 °C to +26 °C.
Humidity: 20 up to 75 % r.h.
6-14
Find Quality Products Online at: sales@GlobalTestSupply.com
www.GlobalTestSupply.com
Page 80

Options and Accessories
Accessories 6
Current: Sinusoidal waveform with 48 to 65 Hz.
Distortion factor: < 1 %, no DC component, stray field < 40 A/m,
conductor centered within the clamp jaws
Safety Standards
• IEC/EN 61010-1 2
nd
edition
• IEC/EN 61010-2-032
• IEC/EN 61010-031
EMC Standards
EN61326 –1:2006
Accuracy (Typical, for 50/60 Hz)
Linearity, error in % of measured value, primary current in A:
a680501050-linearity-20a.bmp
6-15
Find Quality Products Online at: sales@GlobalTestSupply.com
www.GlobalTestSupply.com
Page 81

1760
Users Manual
Phase angle in degrees, primary current in A:
a680501050-linearity-200a.bm p
a680501050-phase-20a.bmp
6-16
Find Quality Products Online at: sales@GlobalTestSupply.com
www.GlobalTestSupply.com
Page 82

Options and Accessories
Accessories 6
Dimensions: See 2540445.
Flexi Current Sensor 100 A/500 A
This current probe has been designed for non intrusive, accurate AC current
measurements. Using the latest technologies (internal memory for calibration data)
provides current measurements between 1 A and 500 A. The measurement range can be
selected in the PQ Analyze software: IAC100 or IAC500.
To protect against electrical shock:
• Utilize the clamps only on insulated conductors, max.
600 V rms or dc to ground.
• Use personal protective equipment measures as required
by local government agencies, when attaching clamps to
live circuits.
Electrical Characteristics
Nominal current In: 100 A, 500 A AC rms
Measuring ranges: 1 A – 100 A or 5 A – 500 A AC
Peak current: 240 A, 1350 A
XW Warning
a680501050-phase-200a.bmp
Overload capacity: Up to 2000 A rms
Intrinsic error: < ±1 % of mv
Linearity (10 % - 100 % of In): ±0.2 % of In.
Conductor position influence: < ±2 % of mv, distance to measuring head
>30 mm
Error due to adjacent conductor: ≤ ±2 A (Iext = 500 A, distance to head
>200 mm)
6-17
Find Quality Products Online at: sales@GlobalTestSupply.com
www.GlobalTestSupply.com
Page 83

1760
Users Manual
Phase error (to reference conditions): < ± 0.5 degrees
Temperature coefficient: 0.005 % of range/ °C
Safety: 600 V CAT IV, type B sensor, pollution
degree 2
General Specification
Cable length: 2 m
Length of measuring head: 45 cm (18 inch)
Operating temperature range: −10 °C - +70 °C
Storage temperature range: −20 °C - +90 °C
Operating humidity: 10 % - 80 % (non-condensing)
Weight: Approx. 220 g
Order-number: 2540477
Reference Conditions
Environment temperature range: +18 °C to +26 °C
Humidity: 20 – 75 % rh
Current: Nominal value In, sinusoidal waveform, 48 –
Distortion factor: < 1 %. No DC component, stray field <
Safety Standards
• IEC/EN 61010-1 2
• IEC/EN 61010-2-032
• IEC/EN 61010-031
EMC Standards
EN61326 –1:2006
Accuracy (Typical, for 50/60 Hz)
Linearity, error in % of measured value, primary current in A:
nd
edition
65 Hz
40 A/m, conductor centered within the Flexi
current sensor
6-18
Find Quality Products Online at: sales@GlobalTestSupply.com
www.GlobalTestSupply.com
Page 84

Options and Accessories
Accessories 6
ep1205-linearity-100a.bmp
ep1205-linearity-500a.bmp
6-19
Find Quality Products Online at: sales@GlobalTestSupply.com
www.GlobalTestSupply.com
Page 85

1760
Users Manual
Phase angle in degrees, primary current in A:
ep1205-phase-100a.bmp
ep1205-phase-500a.bmp
6-20
Find Quality Products Online at: sales@GlobalTestSupply.com
www.GlobalTestSupply.com
Page 86

Options and Accessories
Flexi Current Sensor 200 A/1000 A
This current probe has been designed for non intrusive, accurate ac current measurements.
Using the latest technologies (internal memory for calibration data) provides current
measurements between 2 A and 1000 A. The measurement range can be selected in the
PQ Analyze software: IAC200 or IAC1000.
Accessories 6
XW Warning
To protect against electrical shock:
• Utilize the clamps only on insulated conductors, max.
600 V rms or dc to ground.
• Use personal protective equipment measures as required
by local government agencies, when attaching clamps to
live circuits.
Electrical Characteristics
Nominal current In: 200 A, 1000 A AC rms
Measuring ranges: 2 A – 200 A or 10 A – 1000 A ac
Peak current: 480 A, 2700 A
Max. non destructive current: Up to 2000 A rms
Intrinsic error: < ±1 % of mv
Linearity (10 % - 100 % of In): ±0.2 % of In
Conductor position influence: < ±2 % of mv, distance to measuring head
Error due to adjacent conductor: ≤ ±2 A (Iext = 500 A, distance to head
Phase error (to reference conditions): < ± 0.5 degrees
Temperature coefficient: 0.005 % of range/ °C
Safety: 600 V CAT IV, type B sensor, pollution
General Specifications
Cable length: 2 m
Length of measuring head: 61 cm (24 inch)
Operating temperature range: −10 °C - +70 °C
Storage temperature range: −20 °C - +90 °C
Operating humidity: 10 % - 80 % (non condensing)
Weight: Approx. 220 g
Order-number: 2540489
>30 mm
>200 mm)
degree 2
Reference Conditions
Environment temperature range: +18 °C to +26 °C
Humidity: 20 – 75 %
6-21
Find Quality Products Online at: sales@GlobalTestSupply.com
www.GlobalTestSupply.com
Page 87
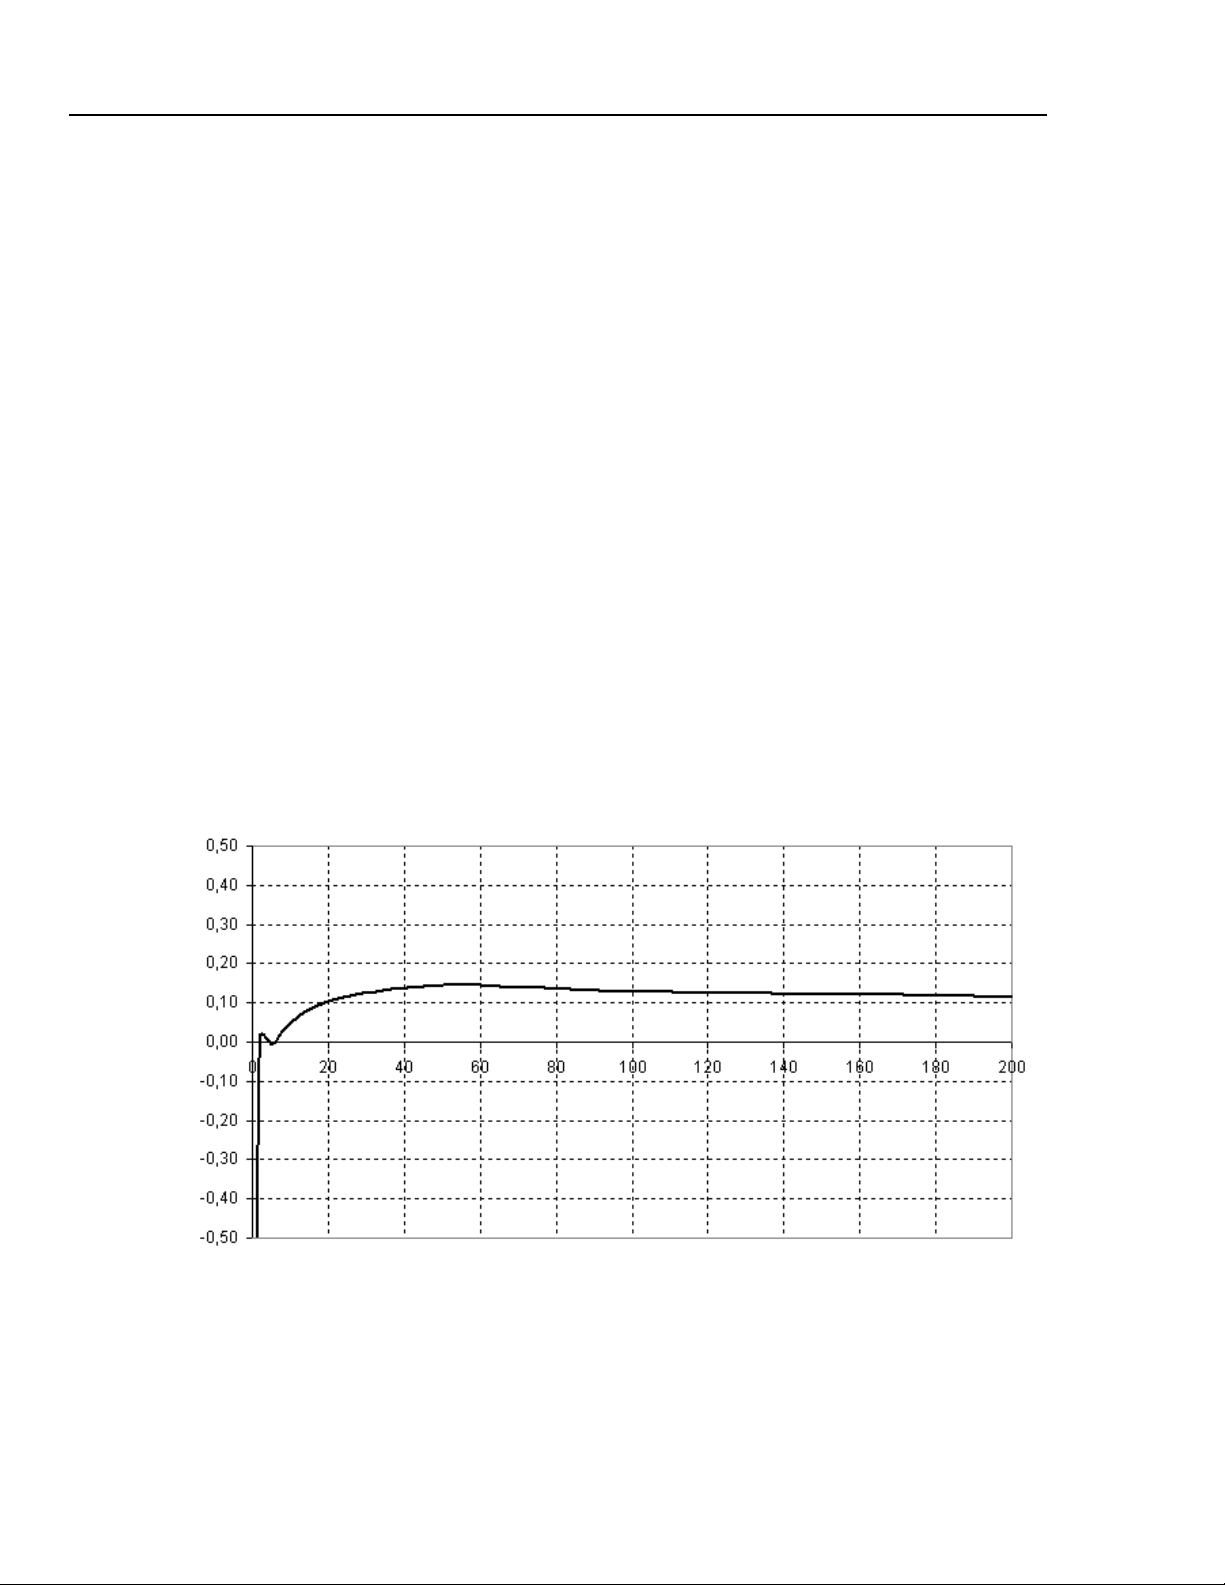
1760
Users Manual
Current: Nominal value In, sinusoidal waveform, 48 –
Distortion factor: < 1 %. No DC stray field <40 A/m, conductor
Safety Standards
• IEC/EN 61010-1 2
• IEC/EN 61010-2-032
• IEC/EN 61010-2-031
EMC Standards
EN61326 –1:2006
To protect against electrical shock:
• Utilize the clamps only on insulated conductors, max.
600 V rms or dc to ground.
• Use personal protective equipment measures as required
by local government agencies, when attaching clamps to
live circuits.
65 Hz
centered within the Flexi current sensor
nd
edition
XW Warning
Accuracy (Typical, for 50/60 Hz)
Linearity, error in % of measured value, primary current in A:
ep1210a-linearity-200a.bmp
6-22
Find Quality Products Online at: sales@GlobalTestSupply.com
www.GlobalTestSupply.com
Page 88
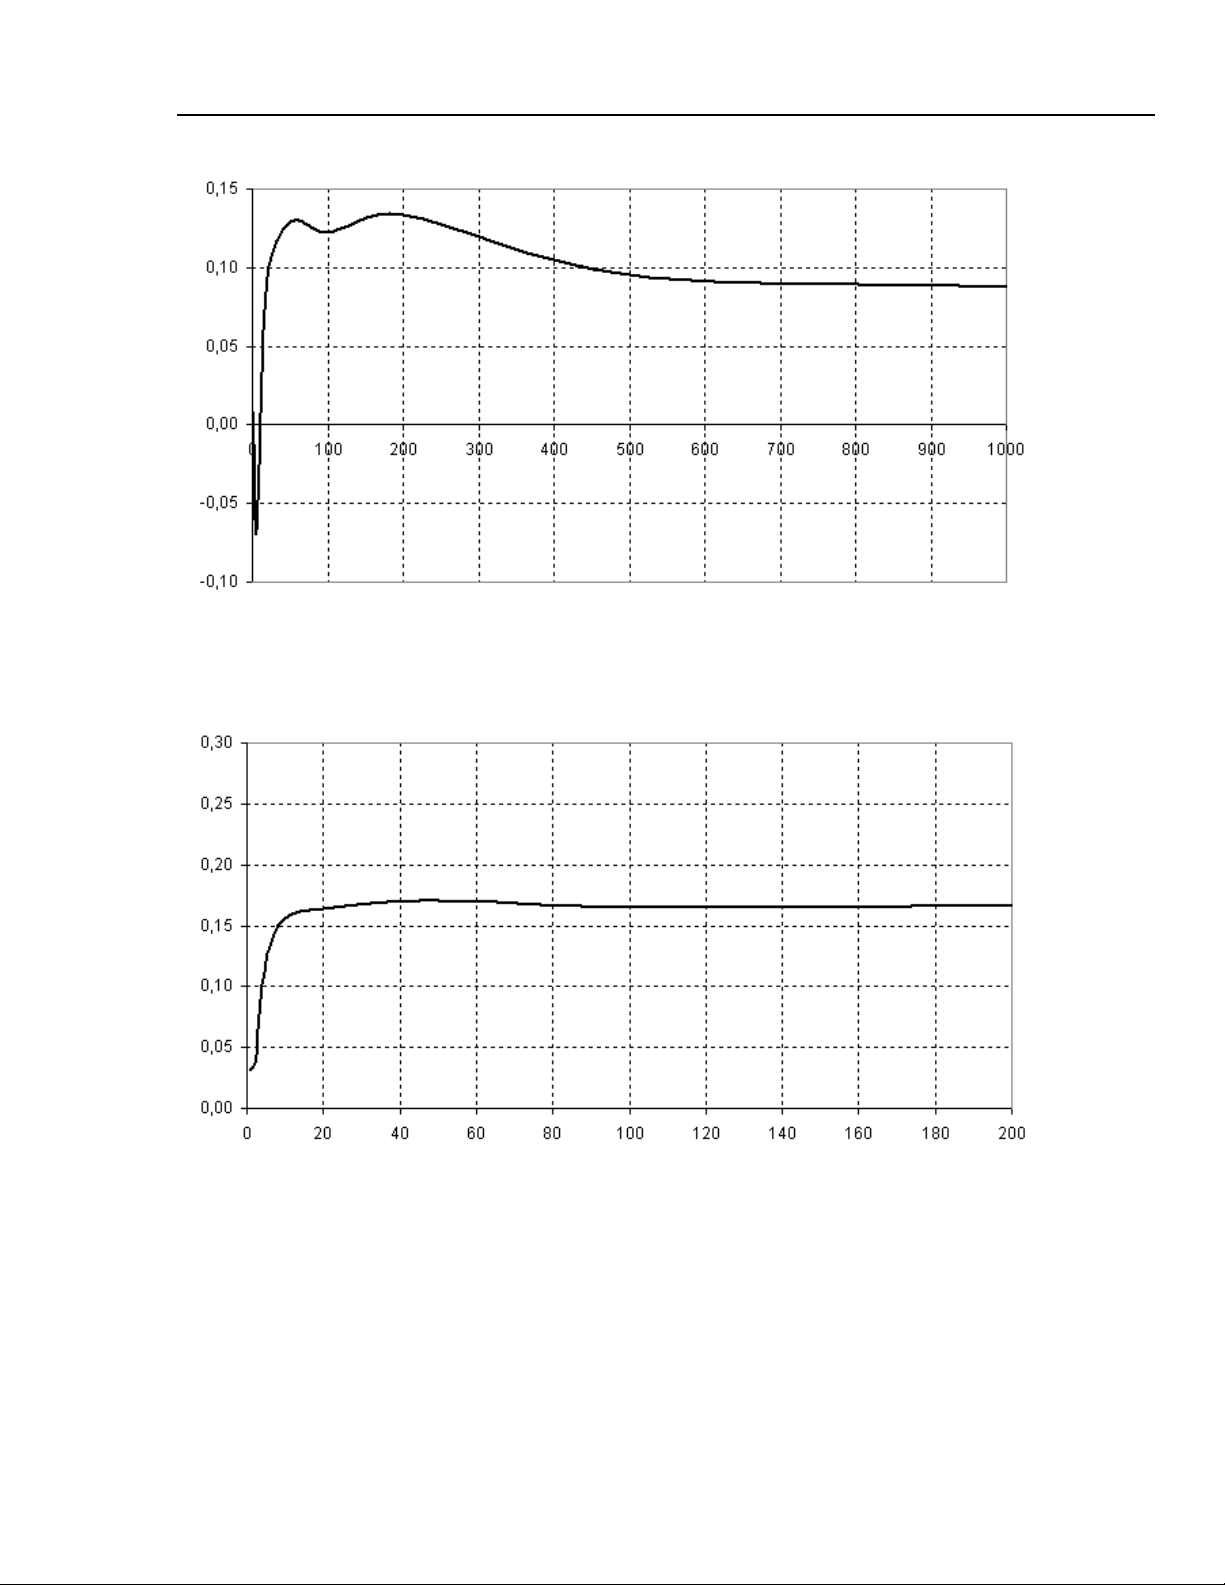
Options and Accessories
Accessories 6
Phase angle in degrees, primary current in A:
ep1210a-linearity-1000a.bmp
ep1210a-phase-200a.bmp
6-23
Find Quality Products Online at: sales@GlobalTestSupply.com
www.GlobalTestSupply.com
Page 89
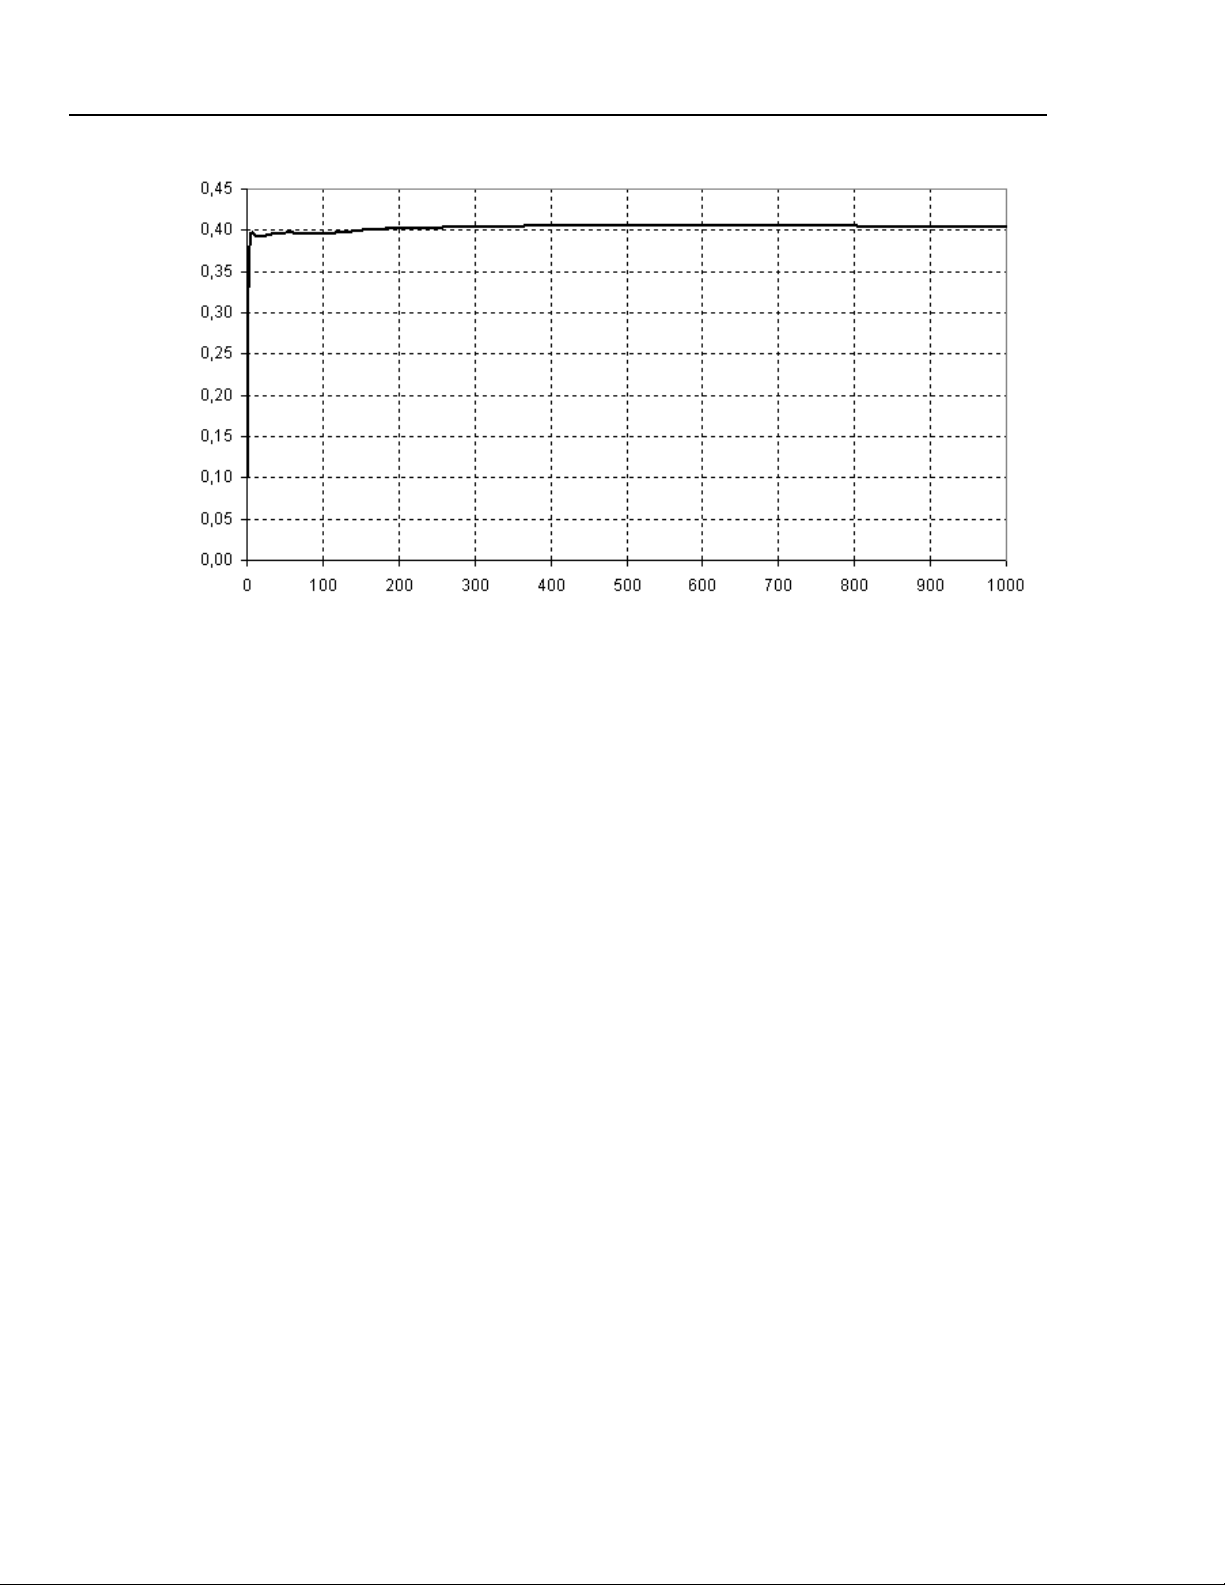
1760
Users Manual
Flexi Current Sensor 3000 A/6000 A
This current probe has been designed for non intrusive, accurate ac current measurements.
Using the latest technologies (internal memory for calibration data) provides current
measurements between 30 A and 6000 A. The measurement range can be selected in the
PQ Analyze software: IAC3000 or IAC6000.
XW Warning
To protect against electrical shock:
• Utilize the clamps only on insulated conductors, max.
600 V rms or dc to ground.
• Use personal protective equipment measures as required
by local government agencies, when attaching clamps to
live circuits.
Electrical Characteristics
Nominal current In: 3000 A, 6000 A AC rms
Measuring ranges: 30 A … 3000 A or 60 A … 6000 A AC
Peak current: 10 kA, 19 kA
ep1210a-phase-1000a.bmp
Max. non destructive current: up to 19 kA rms
Intrinsic error: < ±2 % of mv
Linearity (10 % - 100 % of In): ±0.2 % of In
Conductor position influence: < ±2 % of m.v, distance to measuring head
>30 mm
Error due to adjacent conductor: ≤ ±2 A (Iext = 500 A, distance to head
>200 mm)
Phase error (to reference conditions): < ± 0.5 degrees
6-24
Find Quality Products Online at: sales@GlobalTestSupply.com
www.GlobalTestSupply.com
Page 90

Options and Accessories
Accessories 6
Temperature coefficient: 0.005 % of range/ °C
Safety: 600 V CAT IV, type B sensor, pollution
degree 2
General Characteristics
Cable length: 4 m (156 inches)
Length of measuring head: 91 cm (36 inches)
Operating temperature range: −10 °C - +70 °C
Storage temperature range: −20 °C - +90 °C
Operating humidity: 10 % - 80 % (non condensing)
Weight: Approx. 400 g
Order-number: 2540492
Reference Conditions
Environment temperature range: +18 °C to +26 °C
Humidity: 20 – 75 %
Current: Nominal value In, sinusoidal waveform, 48 –
Distortion factor: <1 %. Stray field <40 A/m, conductor centered
Safety Standards
• IEC/EN 61010-1 2
• IEC/EN 61010-2-032
• IEC/EN 61010-031
EMC Standards
EN61326 –1:2006
Accuracy (Typical, for 50/60 Hz)
Linearity, error in % of measured value, primary current in A:
nd
edition
65 Hz
within the Flexi current sensor
6-25
Find Quality Products Online at: sales@GlobalTestSupply.com
www.GlobalTestSupply.com
Page 91

1760
Users Manual
Phase angle in degrees, primary current in A:
ep1360a-linearity.bmp
ep1360a-phase.bmp
6-26
Find Quality Products Online at: sales@GlobalTestSupply.com
www.GlobalTestSupply.com
Page 92

Options and Accessories
GPS-Time Synchronization Module Option 6
GPS-Time Synchronization Module Option
This option consists of a GPS-receiver module including GPS antenna, and a 5 m
connection cable for the Instrument 25-pole feature connector (on top of the instrument).
Note
For optimal performance the GPS receiver should be placed in a location
where at least 4 satellites are within the receiving are; concrete, metal
construction elements and roofs may interfere with, and reduce the GPS
signal level. An extension cable with 10 m length is available to enable
positioning of the receiver in clear sight.
Technical Specification
Dimensions: Diameter 61 mm (2.4 inch).
Height: 19.5 mm (0.77 inch).
Weight: Appr. 200 g. (0.4 lbs)
Cable length: 5 m. (16.5 ft)
Mounting: Integrated magnetic base.
Case: Polycarbonate thermoplastic.
Protection: IPX7 as per IEC 60529.
Operating temp. range: −30 °C - +80 °C.
Storage temp. range: −40 °C - +90 °C.
Power consumption: 0.3 W typ.
Sensitivity: −165 dBW.
Acquisition time: Cold start: 45 s.
Warm start: 15 s.
Re-acquisition: 2 s.
Protocol: NMEA 0183 V2.0, or V2.30.
UTC (Coordinated Universal Time).
PPS (pulse per second), rising edge.
Satellites: Tracking of up to 12 satellites continuously.
Time accuracy: Better than ±1 μs at rising edge of pulse.
Memory: Non volatile memory for storage of configuration data.
Part Number: 2539223
Procedure:
1. Run the PQ Analyze software and open menu Service – GPS Configuration.
6-27
Find Quality Products Online at: sales@GlobalTestSupply.com
www.GlobalTestSupply.com
Page 93

1760
Users Manual
garmin-settiings.bmp
2. Put the GPS receiver in a location with clear view to the sky.
3. Connect the GPS-receiver to the Instrument 25-pole feature connector on top.
4. Power on the Instrument. The instrument checks if there are NMEA data
available. If yes it corrects the internal time. The internal time is taken for
measurements.
5. The Pulse LED on the Instrument will start to blink at the reception of
synchronization pulses. For LED functions see LEDs Time Sync.
Handling of Date/Time in the Instrument
There are two ways for changing date/time:
• Hard change: Date/time (used for timestamps of measurement values) are set to
the actual time immediately.
• Soft change: Measurement date/time are accelerated or decelerated by a small
amount until the real-time is reached.
Changing Date/Time: No Measurement is Active
When no measurement is running, then time changes by GPS or software are always
performed immediately.
Changing Date/Time during a Measurement
During a measurement only soft time changes can be done.
When the GPS signal becomes available during a measurement, then the system time is
set immediately and the measurement time adapts slowly (±0.01 %) to the new system
time. This provides a correction of max. 8.64 seconds per day. The error for the power
frequency measurement is <0.005 Hz at 50 Hz and <0.006 Hz at 60 Hz (IEC61000-4-30
5.1.2 requires that the measurement uncertainty never exceeds ±0.01 Hz).
If you need to carry out a “hard” date/time change of the instrument via the software then
proceed as follows:
1. Download measurement data
2. Adjust date/time
3. Load current measurement settings: select Measurement-> Settings
4. Initialize a new measurement by pressing the Initialize button
6-28
Find Quality Products Online at: sales@GlobalTestSupply.com
www.GlobalTestSupply.com
 Loading...