


 Loading...
Operations Manual
for the
FILMETRICS F50
Thin-Film Mapper
Revision 7.1.8.1
Copyright © 2013 by Filmetrics, Inc.
All Rights Reserved
Welcome
What is the F50 used for?
The Filmetrics F50 is used to measure the thickness of dielectrics, semiconductors, and thin metal films. Measured films must be optically smooth and between 100Å and 450 microns thick (depending upon F50 model). Optical constants (n and k) can also be measured on a variety of dielectric films. Commonly measured films include semiconductor process films such as oxides, nitrides, resists, and polysilicon, optical coatings such as hardness and anti-reflection coatings, flat panel display films such as polyimides, resist, and cell gaps, and the various coatings used in CD and DVD manufacture. Films that can not be measured include very rough films and opaque dielectric films.
Warning:Accurate measurements require suitable recipe settings and a valid baseline. Improper system setup or an aged lamp may also lead to errors. It is the user’s responsibility to ensure that this instrument is being used properly for its intended purpose. Please contact Filmetrics support for assistance with any questions.

Safety, Maintenance, and Care
This symbol indicates information or instructions that must be read and carefully followed to prevent hazards, injury to the operator, or damage to the instrument.
This symbol indicates a potential shock hazard. Areas marked with this symbol should be serviced by a trained service technician.
This symbol indicates that the product conforms to the WEEE (Waste in Electrical and Electronic Equipment) Directive 2002/96/EC.
This symbol indicates that the product meets the applicable EU safety, health and environmental protection directive requirements.
This label indicates the Model Number and Serial Number of the instrument. This information may be necessary when contacting Filmetrics for assistance.

Disclaimer:Use of this instrument in a manner inconsistent with the information and directions included in this manual may impair the protections designed into the product resulting in danger to the operator or damage to the instrument
Installation Location: When deciding on a location for the instrument, ensure that the instrument in installed in a well-ventilated location. Enclosing the unit, or blocking the vent holes, may impair the performance of the instrument of damage the internal components.
Cleaning:The need for periodic cleaning of the system is based on the cleanliness of the environment in which the system is installed. Only the external surfaces are to be cleaned. Cleaning and maintenance of all internal components is to be performed by a trained service technician. Do not use aerosol, or spray, cleaners as they may contaminate the sensitive optical surfaces on the instrument.
Before performing any service on the instrument ensure that the main power is disconnected.
Cleanroom, or low lint, wipes should be used to wipe down the system. A mixture of Isopropyl Alcohol (IPA) and De-ionized Water (DI H2O) at 70% DI H2O: 30% IPA is to be used for cleaning. Undiluted IPA may be used, if the 70:30 DI and IPA mixture is not available, but extra care must be taken. Avoid using stronger solvents, such as acetone, as these may compromise the surface finish.
Avoid excessive pressure on any surface when cleaning. Excessive force may bend a component, which would damage the system, or cause the system to be out of alignment.
Start with the top of the system and work down. Use slow motions, in a straight line, from the back to the front of the surface being cleaned. Change the cleaning wipe periodically to avoid re-depos- iting material back onto the surface being cleaned. Allow all cleaned surfaces to dry completely before restoring power to the system.

CE Mandated Warnings
Please read the following instructions carefully to prevent potential shock or fire hazards. This manual should be retained for future use
Bitte lesen Sie die nachstehende Anleitung sorgfältig durch um Stromschlag und Feuergefahr zu vermeiden. Diese Betriebsanleitung sollte für späteren Gebrauch sorgfältig aufbewahrt werden.
Preghiamo di leggere accuratamente, le sequenti Instruzioni, per evitare Prossiomi Incendi e Correnti.
Shock Hazard - Do Not Enter
Achtung Hochspannung - Nicht Berühren
Attenzione Corrent-Forte - Prego non toccare
The front panel’s switch is not the power disconnect device. The power cord should be removed after use.
Der Kippschalter an der Vorderseite unterbricht nicht die Stromzuführung. Das Stromkabel sollte nach Gebrauch aus dem Gerät herausgezogen werden.
L’interutore nella parete frontale non blocca le Corrente. La Corrente viene.
Never expose the unit to water or liquids. Avoid direct sun.
Bringe das Gerät nicht mit Wasser oder einer anderen Flüssigkeiten in Berührung. Vermeide direkte Sonneneinstrahlung.
Evitare contatto con acqua oppure liquidi Infiammabili al Macchineggio. Auche entrate di Sole.
Do not insert any objects into the unit.
Keinen Gegenstand in das Gerät einbringen. Do non inseriamo any obietta into gli unità. Non mettere ogetti dentro la Macchina.
Do not use near open flame or heat.
Das Gerät nicht in der Nähe einer offenen Flamme oder Hitze benutzen.
Non mettere la Macchina vicino a fuochi oppure Riscaldamenti.
The unit should never be enclosed or blocked.
Das Gerät darf nicht eingeschlossen oder blockiert werden.
La Macchina non chinderla per nessun motivo.
Connect unit only to a properly measured supply. Use only the three wire cordtwo wire cord which is provided with the unit.
Schließen Sie das Gerät nur an eine ordnungsgemäss vermessene Stromsversorgung an. Verwende nur ein dreiadriges KabelZweidraht Kabel, wie es auch mit dem Gerät ausgeliefert wird. Montare solo con misura normata. Adoperando solo 3 cavi elettrici2 cavi elettrici cosi come e fornita la
Macchina.
Software Overview
The way that light reflects off of a thin film is determined by the characteristics of the film, such as its thickness, optical constants, and roughness. The F50 is able to determine thin-film characteristics by first carefully measuring the amount of light reflected from the thin film over a range of wavelengths (i.e., by measuring the reflectance spectrum), and then analyzing this data by comparing it to a series of calculated reflectance spectra. Most of the features of the FILMapperFILMeasure software that runs the F50 can be divided into reflectance acquisition and reflectance analysis functions. The following pages outline the main features of the FILMapperFILMeasure software.
The basic steps for any F50 measurement are selecting and editing the film structure, taking a baseline measurement, and then making and evaluating the measurement. The details of each of these steps are explained below, followed by descriptions of other FILMapperFILMeasure functions.
The Wafer Map Tab is used to initiate mapping and to display measurement results. The map configuration and the film properties to be mapped are specified in the Edit Recipe > Wafer Map dialog box.
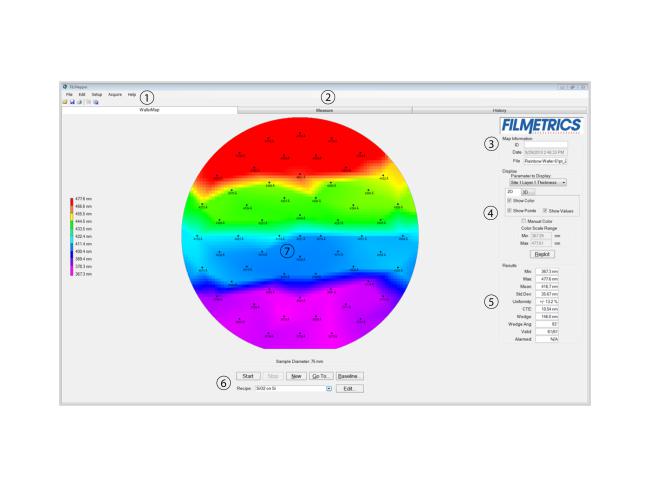
Wafer Map Tab
1.Standard Windows Menus, including; File, Edit, Setup, Acquire, and Help.
2.These tabs are used to select between the Wafer Map, Measure, and History windows.
3.Information about the Operator can be entered here for tracking purposes. Sample information is automatically determined when the wafer map is saved.
4.This section is used to determine how the map is displayed. The Replot button must be clicked to enact any changes selected.
i.Parameters to Display: Allows the user to select which parameter (thickness, index, rough-
ness, etc.) to display on the map.
ii.2D/3D: Allows the user to select between two dimensional and three dimensional maps.
iii.Show Color: Enables or disables the color bar on the left hand side of the map.
iv.Show Points: Enables or disables displaying the measured points on the map.
v.Show Values: Enables or disables displaying the
vi.Manual Color: Allows the user to input a manually selected color scale.
5.Statistical analysis for the set of measurements taken.
i.Minimum parameter value recorded for selected wafer, xmin.
ii.Maximum parameter value recorded for selected wafer, xmax.
iii.Mean (average) parameter value of all measurement locations, .
iv.Std.Dev. (Standard Deviation), or 1σ, is calculated using the following equation: , where is the mean and N is the number of measurements.
v.Uniformity in percentage = (xmax – xmin)/2 * .
vi.CTE is the center to edge thickness variation calculated using a least squares linear fit of
the average thickness of 10 radial regions. If the CTE is positive (> 0), then the thickness is greater around the wafer edge. If the CTE is negative (< 0), then the thickness is greater near the center of the wafer.
vii.Wedge is a value given by the slope of a plane that best fits the variation in the parameter measured.
viii.Wedge Ang is the direction of increasing measured value where x=1, y=0 is 0o (3 o’c-
lock) and x=0, y=1 is 90o (12 o’clock).
ix.Valid indicates how many locations have valid results out of the total number of measurement locations.
6.These options control the wafer map process.
i.Start or Restart the mapping cycle.
ii.Stop the mapping cycle.
iii.New clears the measurement results and displays the points to be measured as determined
by the settings in Edit Recipe > Wafer Map tab.
iv.Go To to a specified location on the wafer.
v.Baseline begins the baselining sequence.
vi.Used to select saved recipes.
vii.Opens the Edit Recipe window.
7.Graphical display of the wafer with points of measurement as well as a color scale for thickness summary. The top of the image is the edge closest to the stage mirrors.

Measure Tab
1.Standard Windows Menus, including; File, Edit, Setup, Acquire, and Help.
2.These tabs are used to select between the Wafer Map, Measure, and History windows.
3.Information about the Operator and Sample can be entered here for tracking purposes.
4.Displays the thickness of the film being solved for, as well as whether a sample is good or bad based on the settings in the Alarms Tab.
5.Allows the user to Measure a sample, Go To a point on the wafer,Baseline the system, or Analyze an open spectrum.
6.Users may select saved recipes from the drop down list, or enter into the Edit Recipe dialog box.
7.This box provides more details about the calculated thickness, as well as any additional parameters that were solved for, including Roughness, n and k, and Non-Uniformity as well as the
Goodness of Fit (GOF).
8.Graphical display for spectra. A click of the right mouse button while the cursor is within the graphical display activates a blue line (one click for measured curve) for easy reading of cursor values in the main FILMeasureFILMapper window. Keyboard up/down and right/left arrows move the line to a desired location.
The graph limits can be changed by double-clicking on the graph display. The Horizontal Axis Minimum and Maximum fields are used to control the wavelength range displayed on the screen. Use the Vertical Axis Minimum and Maximum fields to control the vertical-axis display. Check the Auto box to activate y-axis autoscaling. The lower value is always 0 for autoscaling; the maximum y-axis upper limit is 5000. Changing the Vertical Axis will change the reflectance axis, the Vertical Axis 2 will change the transmittance axis. The axes can be set to display in percent or as a decimal value (100% = 1).
Graph Options can be accessed and edited by double-clicking on the main graph window.
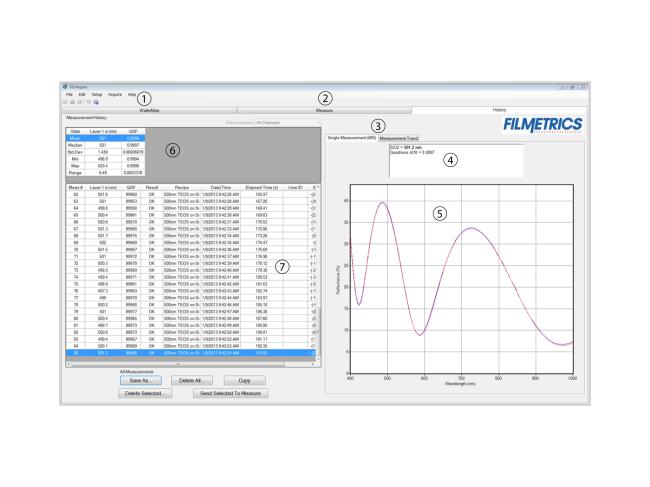
History Tab
1.Standard Windows Menus, including; File, Edit, Setup, Acquire, and Help.
2.These tabs are used to select between the Wafer Map, Measure, and History windows.
3.Used to alternate between the Single Measurement and Measurement Trend tab. Selecting the Measurement Trend tab will allow the user to see a plot of the measurement results versus measurement number.

When the Measurement Trend tab is selected in the History window, the right side of the screens graphs the results.
4.Shows the measurement results for the selected spectrum.
5.Displays the selected spectrum.
6.Displays the statistics of all measurements included in the history file.
7.This list contains all spectra currently included in the history file.
Edit Recipe Window
The Edit Recipe Window is used to define the film stack and to set analysis and acquisition parameters.

A recipe defines the film to be measured and its approximate thickness, any other films present, and the quantities to be measured:
1.These buttons allow you to, in order from left to right:
i.Open a saved recipe.
ii.Start a new recipe.
iii.Save the current settings.
iv.Save the current settings as new recipe
v.Delete the current recipe.
2.Opens a drop-down list for quick access to saved recipes.
3.Author, as defined by user login name and recipe modification date are indicated here.
4.Allows the user to select between the Film Stack, Analysis Options, Alarms,Wafer Map, and
Acquisition Settings tabs.
5.The desired thickness units are chosen here. The choices include angstroms (Å, 10e-10 m), nanometers (nm, 10e-9 m), kilo-angstroms (kÅ, 10e-7 m), microns (µm, 10e-6 m), microinches, mils, millimeters (mm, 10e-3 m), and Custom Units.
6.This is where the materials and parameters to be solved are defined.
Editing Film Structures
The description of the nominal film structure, as well as the measurement parameters, is specified in the Edit Recipe dialog box. Dozens of different film structures and their measurement specifications may be saved using the Edit Recipe dialog box.
The Edit Recipe dialog box is accessed with the Edit Recipe button on the Measure Tab, or the Set Up… button on the Wafer Map Tab. The Edit Recipe dialog box lists an initial guess at the specifications of the film structure to be measured. These specifications include the name of the film structure (which identifies it in the Recipe: list), the number of films in the structure, the specifications of individual films, and the quantities to be measured.
Adding, Changing, or Deleting a Structure
When the Edit Recipe dialog box is opened, it shows the stored specifications of the structure selected from the Recipe: list, along with any changes made since the program was started. Changes to the structure selected can be permanently stored by making the desired changes and then clicking on Save Changes. New structures may be added to the Recipe: list by opening the Edit Recipe dialog box, setting the desired specifications, and then clicking on Save As. Similarly, a structure may be deleted (removed from the Recipe: list) by clicking on the Delete Recipe button.

Edit Recipe>Film Stack window.

Film Stack
The Film Stack tab is used to define the film structure and desired measurement units, as well as the starting guesses and constraints for thickness, n and k. This is also where you determine your analysis method, Grid, FFT , or None, as well as any Non-Uniformity that may be present in the sample. Additional options for Composition, Thickness and Non-Uniformity can be selected or hidden by using the + and - buttons.
Setting Up a Film Stack
When measuring a layer, the specifications (d, n, k, and roughness) of the known films (including the incident medium and substrate) must be entered into the proper fields in the Edit Recipe dialog box, as well as initial guesses for the values to be measured. The refractive index (n) and extinction coefficient (k) values for common materials can be selected automatically with the pull-down menus on the left-hand side of the Edit Recipe dialog box, or by clicking on the box and using the Search function.
If a material is being measured which is not present in the material library there are three possible approaches:
a)choose a material in the library that is similar.
b)if the material is transparent (an insulator), select “Enter Refractive Index Value” from
the material list and enter a value for the refractive index (n will automatically be varied by FILMapperFILMeasure to account for dispersion effects, with the entered value being n at 632 nm).
c) in the Edit>Material Library… dialog box, enter the refractive index values for n and k as a function of wavelength and save the files so that they may be selected as in a). See Creating and Editing n and k Files for more information.
Choosing the Films to be Measured
To measure a film's thickness, check the Vary box on the right-hand side of the Film Stack field in the Edit Recipe dialog box. When no boxes are checked, the theoretical spectrum for the specified layer stack and thicknesses will be displayed.
As with most measurements, the uncertainty of the measured data increases as the number of simultaneously measured values increases. Thus it is best to provide as much information about the film structure as possible.
Constraints
By setting constraints, the user can limit the possible values of the measured film properties. The constraints are set in conjunction with the values entered in the Range dialog box for thickness. For example, if the initial guess of the measured thickness of a film is 100 nm and the thickness constraint is set at 50%, FILMapperFILMeasure will only consider possible thicknesses in the range 50 nm to 150 nm. The constraints for n and k are set using the n and k dialog boxes under Composition. These boxes are only visible when the Composition option is expanded. You can select between constraining by a percent of the thickness guess, or by a selected thickness by clicking on the % or measurement unit above the constraints dialog box. Constraining the measurement range can speed up the measurements and can also help exclude non-physical solutions.
Custom Units
The Custom Unit function allows you to create your own custom unit for measurements if the metric you'd like isn't already available in the dropdown list.

The Edit Custom Units dialog box.
To determine the correct coeffecient to use, you must first know the relationship between your unit and nanonmeters. For example, if your units are mg/ft2 and it's been determined that 1 mg/ft2 works out to a film thickness of 150 nm, then you would calculate your coefficient as follows, where X is the coeffecient.
1 mg/ft2 * X nm/(mg/ft2) = 150 nm X nm = 150 nm / 1 nm
X = 150
nk Model
When measuring n and k for a film, the general dependence of these values upon wavelength must be specified. This dependence is determined by the type of material to be measured. For example, insulators, semiconductors, and metals all have a unique type of n and k wavelength dependence. Dozens of models for these different dependencies have been proposed and used over the years.
FILMapper uses a few of the most versatile and accepted of these models. For insulators, the Cauchy model is used, for semiconductors, either the Amorphous or Bridge-Lorentzian model, and for metals, the Drude model. There are also a number of special-purpose models for specific applications. These models, and starting coefficients values, are selected automatically when a material is chosen from the Material lists in the Edit Recipe dialog box. Other models may also be specified by selecting them from the nk Model pulldown menu under the Composition tab which is accessed by right clicking on the Vary checkbox.
Fourier search for thickness
The FFT option in the thickness dropdown is an alternative option to let FILMapperFILMeasure choose an initial thickness for analysis. The Fourier Transform method analyzes the oscillations present in the spectrum and determines the film thicknesses based on the periodicity of those oscillations. It is somewhat less robust than the Grid method, but is better at finding the correct thickness in cases where the shape of the initial theoretical spectrum is different than the measured data (i.e., the reflectance spectrum is non-ideal in some way) or in cases where there is more than one film thickness is being measured.
Grid search for thickness
There are a number of methods that FILMapperFILMeasure can use to determine thickness. None is perfect – each is a different trade-off between speed, accuracy, and robustness (i.e., the ability to find the best solution among many that are nearly as good). Because thickness can vary over many orders of magnitude and many near-solutions exist, it is often best to use a very robust method to get close to the best solution, and then let a more accurate method take over. One very robust method is the Grid method, which can be activated by selecting the Grid option in the thickness dropdown. The Grid method searches the entire allowed thickness range (as defined by the initial guess and the constraints) to find the best initial thickness. However, on some very complex multilayer spectra, it is possible for the Grid method to become confused and give the wrong answer. In such cases it is best to use the Fourier Transform method to determine initial thicknesses, or to provide them manually.
Non-Uniformity
The Edit Recipe > Film Stack tab with the Non-Uniformity option expanded.
Selecting this option enables modeling of thickness non-uniformity within the measurement spot. An initial guess for Non-Uniformity must first be made, and then solving can be enabled or disabled by toggling the check box.
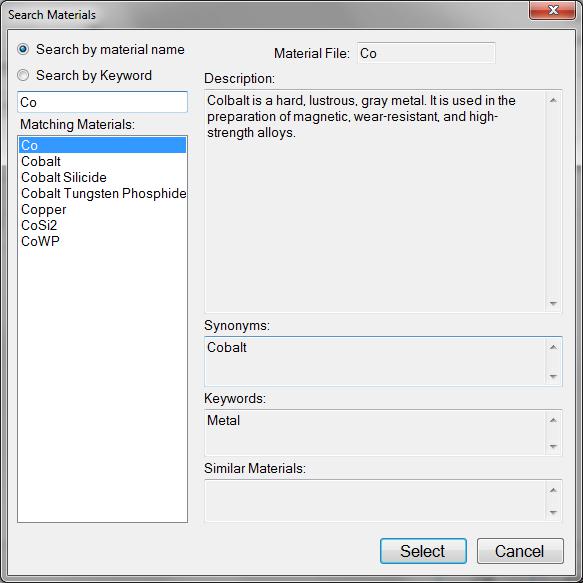
Search
The Search Materials dialog box is accessible by left clicking on a material name in the Edit Recipe > Film Stack tab. This feature allows the user to search for materials by using either the materials name, or a keyword for a certain class of materials. The search function will also show a brief Description of the material selected, as well as any Synonyms or Keywords related to the material file. The Similar Materials box will list any materials that may have similar optical properties.
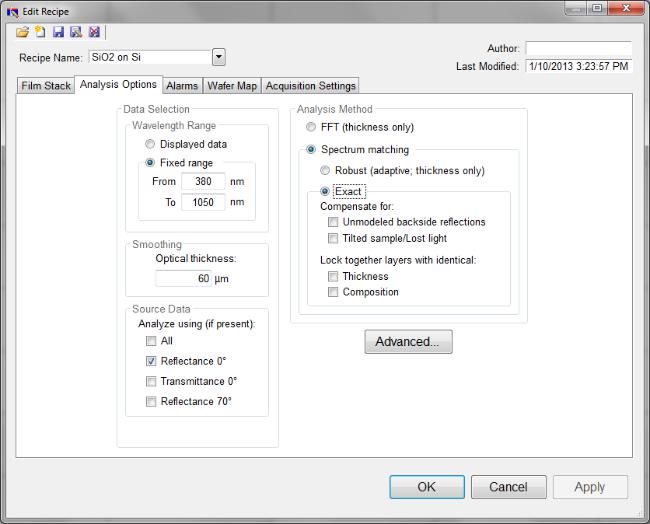
Analysis Options
Correct setting of the following options will help ensure accurate measurements. Many of the options are set automatically when film information is supplied in the Edit Recipe dialog box, and all of them can be saved so that subsequent measurements can be made as quickly and easily as possible. If Robust (Adaptive; Thickness Only) or FFT (Thickness Only) is checked, only the
Data Selection settings will be accessible.
Data Selection
Wavelength Range
This sets the wavelength range of data that is to be analyzed. It may be either the range displayed on the current graph or a fixed range. Wavelength range may also be changed by dragging the ends of the gray bar near the bottom of the graph area.

Smoothing
This function performs wavelength-dependent boxcar averaging on the measured spectra. This can improve signal-to-noise levels and can filter out oscillations that correspond to optical thicknesses (defined as index multiplied by thickness) equal or greater than the specified value. This value should be lowered to increase smoothing, and raised to decrease smoothing. To eliminate smoothing, a very high value (for example, 1000 um) should be entered.
Source Data
If more than one data set is present, this optiontells the software whether to analyze the reflection, transmission data, 70 degree reflection data, or some combination of the three. Only possible on spectra from the F10-VC, F10-RT, and F10-RTA.
Analysis Options: Advanced
Advanced Analysis Options for Spectrum Matching.
Convergence Criteria
This sets the minimum GOF between the measured and calculated spectra that is attained before the measurement routines consider the solution final. In most cases a value of 0.999 is sufficient. For cases where the desired GOF is not attainable, the value in the Maximum Iterations field limits the number of iterations performed by the analysis routine.
Solver Cycles
This option will enable multiple solver cycles, with the number of cycles being defined by the number included in the box. When using this option, the software will run through the model for a

solution once, and then try again starting from the solution previously found. A greater number of cycles will lead to a slower analysis.
Display Details
This feature controls the wavelength at which n and k are displayed in the Measurement Details portion of the main screen. These values are only displayed if solving for n or k is enabled in the Film Stack window.
Advanced Analysis Options for FFT Analysis.
FFT Analysis Window
When the FFT solver is enabled, the advanced options gives you options to help Optimize the performance of the analysis. When optimize position is enabled, The solver with check for the best possible GOF value in different areas across the spectrum as defined by the window size. For example, if a window size of 200 nm is selected, the solver will look at six different 200nm sections of the spectrum, and then select the range the provides the best GOF.
If Optimize Size is enabled, the solver will instead begin with a minimum window size as defined by the user. It will then start at the center of the analysis range, and then extend equally in both directions six times to find the best GOF. When Optimize Position and Size is selected, the software does both functions, resulting in measuring thirty-one different combinations of location and analysis range.
Exact Spectrum Matching
Unmodelled Back-Side Reflections
When measuring films in transparent substrates, reflectance off of the backside of the substrate may occur. Selecting compensate for Unmodelled Back-Side Reflections allows the software to shift the intensity of the reflectance curve to account for the additional light. This feature should not be used when measuring very thin films (< 100 nm).
Tilted Sample/Lost Light
Samples with nonplanar surfaces scatter some of the light away from the collection optics. This option automatically compensates for the light lost due to nonplanarity.
Lock Identical Layers
Samples comprised of repeating layers can be more accurately measured by activating this option. By activating these options, all properties of any layers that initially have the same material or thickness are locked together.
Display Details
When solving for n and k, the values displayed in the Results Summary box of the Measure Tab will be the values determined for the wavelength entered here.
Enable Robust (Adaptive; Thickness Only)
If thickness of a single-layer film is the only property to be measured and the film is greater than 150 nm, then the Robust (Adaptive;Thickness Only) mode is often recommended. This mode can oftentimes result in successful measurements when the reflectance data is affected by non-ideal film properties, such as thickness and composition non-uniformities and birefringence. The range of thicknesses tested is constrained by the limits set in the Constraints field in the Film Stack tab. Selecting this feature will limit the Analysis Options tab settings available.
Enable FFT (Thickness Only)
If thickness is the only property to be measured and the film is greater than about 250 nm, then the FFT (Thickness Only) mode can be used. This mode is usually the most effective technique when the sample has multiple film thicknesses to be measured. Selecting this feature will limit the Anal- ysis Options tab settings available.

Wafer Map
This allows the user to specify the size and type of wafer to be analyzed, the configuration of the measurement spots, and data saving protocols.
Measurement Configuration
Wafer Diameter: Diameter of wafer to be measured – choose from list
Coordinate System: Polar, Rectangular, Linear, or Custom
Number of Points or Custom Name: Choose from the list the number of points to be measured or select the name of the custom pattern file.
Edge Exclusion: Distance from outermost points to the edge of the wafer
Indexing: Changes plot on screen to show appropriate index mark. Wafer should be oriented on the stage with the index mark on the edge opposite the mirrors (i.e the top of the wafer in the map results is near the mirror).
Automatic Data Saving
If a File name is entered in the upper right corner of the Wafer Map View>Map Information field, then a new folder with that name will appear in the FILMapper\Map Results folder. If no name is specified, all saved data will appear in the MapResults folder.
Save Results to Disk: Automatically saves the map after completion of measurement. This comma delimited text file contains measurement coordinates and results.
Save Spectra: Saves the spectrum acquired at each point as a separate file. Each file is saved in measurement order, "0" being the first measurement. File extension is .fmspe. Each spectrum may be opened in the FILMapperMeasure Tab.
Pattern Avoidance
The pattern avoidance feature enables the F50 to target areas on a patterned wafer that do not scatter light (i.e. avoid trench areas). If a measurement shows low reflectance, the stage will move to a nearby location where a pad is expected (as defined by the settings described below). This feature should not be selected when measuring blanket wafers.
Spot Size: The size of the measured spot.
Pattern Size: The size of the features to be avoided.
Rectangular, Radial: The pattern layout geometry.
Spacing: The center-to-center separation of elements making up the pattern.
Invalid Measurement Retry
Activating this feature allows the software to try up to 4 additional measurement locations, within the Spot Size specified from the designated location until a valid measurement is made. “Invalid” measurements are defined in the Constraints tab. This function is especially helpful when measuring non-uniform samples.
Additional Parameters To Be Mapped
Average Reflectance Ratio: This maps the average reflectance ratio, which is defined as the average reflectance between the Starting Wavelength and the Ending Wavelength, divided by the reflectance at the specified Reference Wavelength.
GOF (Solve for Goodness of Fit)
Enabling this feature saves GOF results with the map.
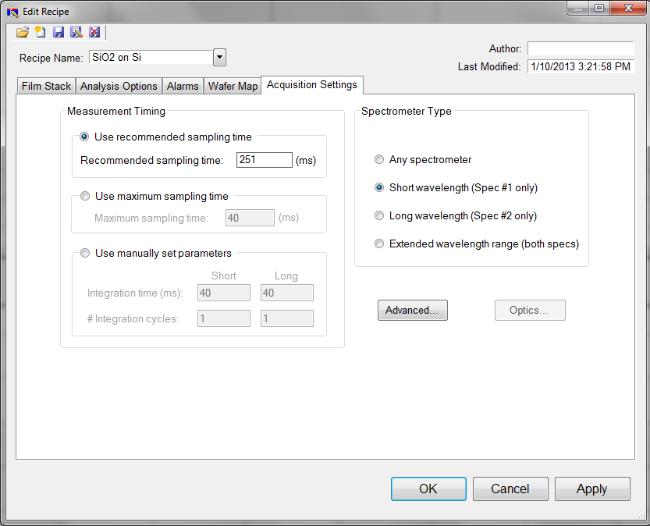
Acquisition Settings
This menu lets the user control Measurement Timing, Spectrometer Type (on EXR and UVX systems), Optics Configuration, and required baseline reference.
Measurement Timing
Use Recommended Sampling Time
Selecting this option uses the sampling time that has been automatically calculated by the software during the baseline procedure. This value is the total sampling time and not necessarily the integration time. To see the integration time and number of integration cycles go to the Help > Diag- nostics menu.
Use Maximum Sampling Time
Users can set a maximum sampling time by selecting this option. This option allows the user to tradeoff between measurement speed and improved signal-to-noise.
Use Manually Set Parameters
Users can set the integration time per acquisition cycle and set a number of integration cycles over which to average. When using this option, the total sampling time is equal to the integration time multiplied by the number of integration cycles.
To set the integration time manually, set the sample on the stage and select Setup>Raw Signal… If the proper integration time is unknown, an initial value of 40ms is a good starting guess. The vertical scale of the spectrum extends from zero to 4095. Thus, a good working level is when the peak height of the sample being measured, or the reflectance standard, whichever is greater, is 30003500 counts. (Note: if the reference measurement saturates – Detector Saturation error – then spurious final measurements will result.) If the maximum signal is too low, increase the integration time. Too large an integration time will result in excessive dark current, so it is sometimes necessary to accept a smaller signal level to limit the dark current.
* * Note * * If the integration time is changed, it will be necessary to perform the baseline procedure, or re-acquire the background and reference scans.
Loading...