

Page 1
User Manual
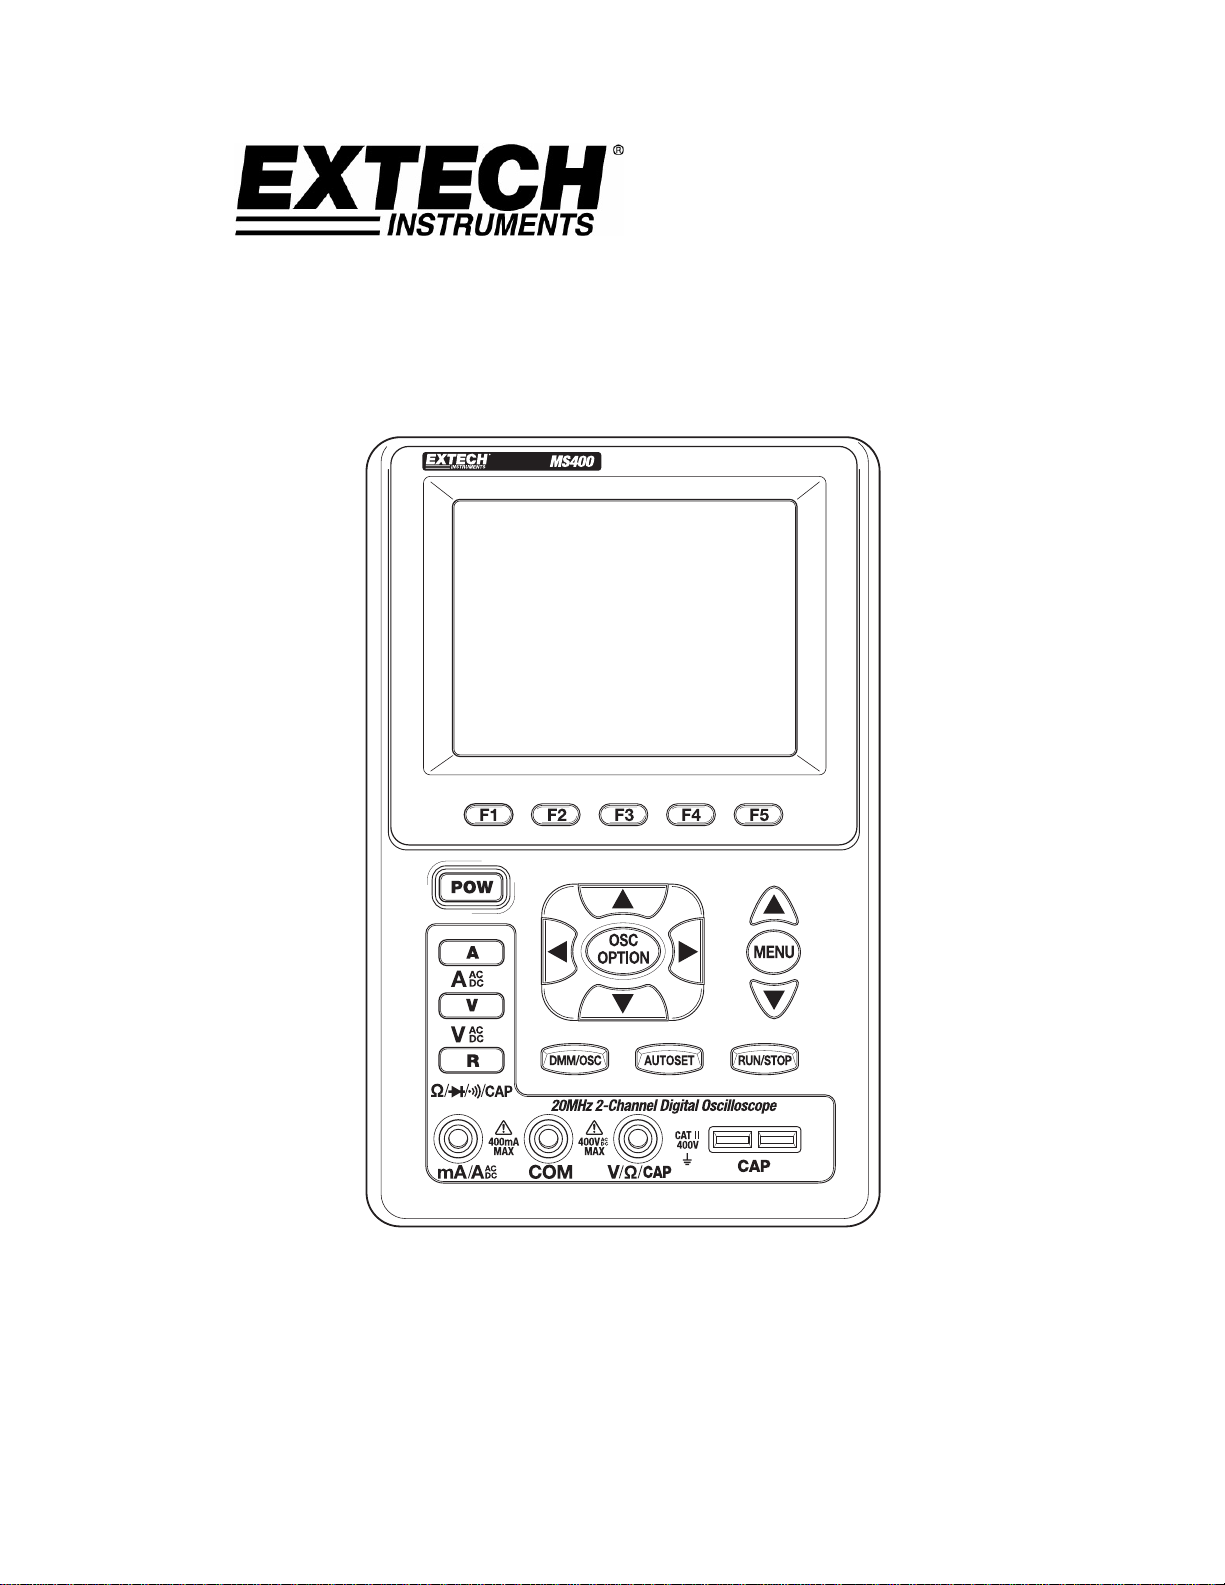
Handheld Digital Storage
Oscilloscope & Multimeter
Model MS400
Figure 1 – Meter Faceplate
Page 2

Warranty
p
EXTECH INSTRUMENTS CORPORATION warrants this instrument to be free of
defects in parts and workmanship for one year from date of shipment (a six month
limited warr ant y a ppli es to s ens ors and cabl es ). I f it sho uld bec ome n ec ess ary to re tur n
the instrument for service during or beyond the warranty period, contact the Customer
Service Department at (781) 890-7440 ext. 210 for authorization or visit our website
www.extech.com for contact information. A Return Authorization (RA) number must be
issued before any product is returned to Extech. The sender is responsible for shipping
charges, freight, insurance and proper packaging to prevent damage in transit. This
warranty does not apply to defects resulting from action of the user such as misuse,
improper wiring, operation outside of specification, improper maintenance or repair, or
unauthorized modification. Extech specifically disclaims any implied warranties or
merchantability or fitness for a specific purpose and will not be liable for any direct,
indirect, incidental or consequential damages. Extech's total liability is limited to repair
or replacement of the product. The warranty set forth above is inclusive and no other
warranty, whether written or oral, i s expressed or implied.
Calibration and Repair Services
Extech offers repair and calibration services for the products we sell. Extech also
provides NIST certification for most products. Call the Customer Care Department for
information on calibration services available for this product. Extech recommends that
annual calibrations be performed to verify meter performance and accuracy.
Support line (781) 890-7440
Technical Support: Extension 200; E-mail: support@extech.com
Repair & Returns: Extension 210; E-mail: repair@extech.com
Product specifications subject to change without not ice
For the latest version of this User’s Guide, Software updates, and other
up-to-the-minute product information, visit our website: www.extech.com
Extech Instruments Cor
oration, 285 Bear Hill Rd., Waltham, MA 02451
2
MS400 Version 2.0 – December 2007
Page 3

Table of Contents
Chapter Page
Safety Information 5
Safety Terms and Symbols 5
Specific Warning and Caution Terms 5
Terms Used With This Product 5
Symbols Used With This Product 5
General Safety Information 5
General Inspection 7
Performing a General Inspection 7
Checking for Shipping Damage 7
Checking Accessories 7
Complete Instrument Check 7
Contents of the Meter Kit 7
Input Connections 8
Input Connections 8
Description of the Front Panel and Keys 8
Using the Scope 11
About this Chapter 11
Powering-Up the Oscilloscope 11
Oscilloscope Operation Window 11
Navigating a Menu 13
Manually Setting the Vertical System, Horizontal System and Trigger Position 14
Resetting the Oscilloscope 17
Input Connections 17
Displaying an Unknown Signal with Auto Set 18
Automatic Zero-ing of Trigger Horizontal Position and Trigger Level Position 18
Automatic Measurements 18
Freezing the Screen 19
Using Average for Smoothing Waveforms 19
Using ‘Persistence’ to Display Waveforms 20
Using Peak Detection to Display Glitches 20
Selecting AC-coupling 21
Reversing the Polarity of the Displayed Waveform 22
Using Waveform Math Functions 23
Using the Multimeter 24
About this Chapter 24
Meter Connections 24
Multimeter Operation Window 24
Multimeter Measurements 26
Measuring Resistance Values 26
Diode Measurement 26
Continuity Tests 26
Capacitance Measurement 27
DC Voltage Measurement 27
AC Voltage Measurement 27
DC Current Measurement 28
AC Current Measurement 28
Freezing the Readings 29
Taking a Relative Measurement 29
Selecting Automatic/Manual Range Adjustment 30
3
MS400 Version 2.0 – December 2007
Page 4

Advanced Oscilloscope FUNCTIONS 31
About this Chapter 31
Setting the Vertical CH1 and CH2 31
Setting the Channel Coupling 32
Enabling the Scope Channels 33
Adjusting the Probe Scale 33
Inverting a Waveform 33
Math Function Menu Settings 33
Setting the Trigger System 34
Triggering Control 35
Edge Triggering 35
Video Triggering 36
‘Acquire Mode’ Setting 37
Display Settings 37
Display Style 38
Persistence Mode 38
XY Mode 39
Saving Waveforms 39
Function Setting Menu 40
Automatic Measurements 40
Cursor Measurements 41
System State Menu 43
Setting Time Base Mode 44
Data Transmission – PC Interface 45
Trouble Shooting 46
Appendix 47
Appendix and Specifications 47
Oscilloscope 47
Meter 49
General Specifications 50
Appendix B: Maintenance and Cleaning 51
Common Maintenance 51
Storage of Oscilloscope 51
Replacing the Lithium Battery Unit 51
4
MS400 Version 2.0 – December 2007
Page 5
Safety Information
Note: Please read this user manual prior to operating the unit.
Safety Terms and Symbols
Specific Warning and Caution terms that appear throughout the manual
Warning: “Warning” identifies conditions and actions that pose hazards to users.
Caution: “Caution” identifies conditions and actions that may damage the product.
Terms printed on the meter and contained in this manual
The following terms may appear on the product or anywhere throughout the associated
manuals:
Danger: The term “Danger” is used in this manual to indicate that serious injury or
death may result if the safety instructions are not followed.
Warning: The term “Warning” is used in this manual to indicate that personal injury may
result if instructions are not followed.
Notice: The term “Notice” is used in this manual to indicate that damages to product,
other properties, or accessories may result if instructions are not followed.
Symbols Used on this Product and in the documentation
The following symbols may be found on the meter and in associated documentation:
High Voltage Refer to
User Manual
Protective
Ground
Measurement
Ground
Casing
Ground
General Safety Information
Carefully read the following safety information in order to avoid any personal injury and
damage to this product or to any products associated with its use. In order to lessen the
chances of any possible dangers that may occur in connection with the use of this
product, the product should only be used in the specified applications the product was
designed and intended for.
Warning:
To avoid fire or electrical shock please use the proper power adapter. Use only
the power adapter recommended by the manufacturer.
Warning:
If test tool inputs are connected to more than 42V peak (30Vrms) or used in
circuits of more than 4800VA, adhere to the following guidelines in order to
avoid fire or electrical shock:
● Use only insulated voltage probes, test leads and the adapter supplied with
the test tool, or indicated by Extech as suitable for the Oscilloscope &
Multimeter.
● Before use inspect voltage probes, test leads and accessories for
mechanical damage and replace when required.
● Remove all probes, test leads and accessories that are not in use.
5
MS400 Version 2.0 – December 2007
Page 6

● Always connect the power adapter first to the AC outlet before connecting
it to the Oscilloscope & Multimeter.
● Do not apply voltages that differ more than 400V from earth ground to any
input when measuring in a CAT III environment.
● Do not apply voltages that differ more than 400V from earth ground to any
input when measuring in a CAT II environment.
● Do not apply voltages that differ more than 400V from each other to the
isolated input when measuring in a CAT III environment.
● Do not apply voltages that differ more than 400V from each other to the
isolated inputs when measuring in a CAT II environment.
● Do not apply input voltages above the rating of the instrument. Use caution
when using 1:1 test leads because the probe tip voltage will be directly
transmitted to the Oscilloscope & Multimeter.
● Do not use exposed metal BNC or banana plug connectors. Do not insert
metal objects into connectors.
● Always use the Oscilloscope & Multimeter only in the manner specified.
● Voltage ratings that are mentioned in the warning are provided as limits for
“working voltage”. The representative Vac rms (50-60Hz) indicates AC sine
wave applications and as Vdc for DC applications. Overvoltage Category III
refers to distribution level and fixed installation circuits inside a building.
Overvoltage Category II refers to local levels, which are applicable for
appliances and portable equipment.
Only qualified technical personnel should perform maintenance.
Pay attention to the nominal values of all terminals: To avoid fire or electric
shock, please keep a watchful eye on all nominal values and marks specified on
this product. Before any connections are made, carefully read the user’s manual
of the product for further information of nominal values.
DO NOT operate this product without the instrument cover plate in place: If the
cover plate or panel has been removed, do not perform any operations with this
product.
DO NOT come into contact with bare conductors: When the product is powered
on, do not touch any bare joints or parts of the meter.
DO NOT operate this product in case of any undetermined failure: When in
doubt of the cause of any damage to this product, consult qualified technical
personnel.
Keep the product well ventilated: Refer to the user manual for detailed installation
instructions. Make sure the product is operated in a well ventilated area.
DO NOT operate this product in humid conditions.
DO NOT operate this product where explosives are handled or used.
Keep the product surface clean and dry.
6
MS400 Version 2.0 – December 2007
Page 7

General Inspection
After purchasing a new MS400 oscilloscope, it is suggested that a general inspection of
the instrument be performed according to the following steps:
Check whether there is any damage to the product caused by shipping
If the packing material, boxes or foam cushions are found in a damaged condition, keep
them in a proper place until the complete instrument and accessories have passed
electrical and mechanical tests.
Check the Accessori es
Double check the accessory list and pictures of the parts and accessories included with
your instrument. Check whether there is any accessory loss by referencing the Appendix.
In case of any accessory loss, damage or variation in specifications, contact the
organization where the product was purchased.
Check the Ins tru m e nt
If the instrument is apparently damaged, fails in normal operation or in a performance
test, consult the place of purchase.
If the instrument is damaged due to shipping, keep the packing material in a proper place
and contact the place of purchase.
Contents of the meter kit
Description Standard Optional
Meter ●
Adapter ●
Two (2) Oscilloscope Probes (grey) ●
Pair of Test Leads for Multimeter (black and red) ●
Measuring Extension Module for Low Current ●
Measuring Module for low range Capacitance ●
Adjustment Probe Tool ●
One (1) USB Data Transmission cable ●
User Manual ●
One (1) disk that includes the PC interface
software
Carrying Case ●
●
7
MS400 Version 2.0 – December 2007
Page 8
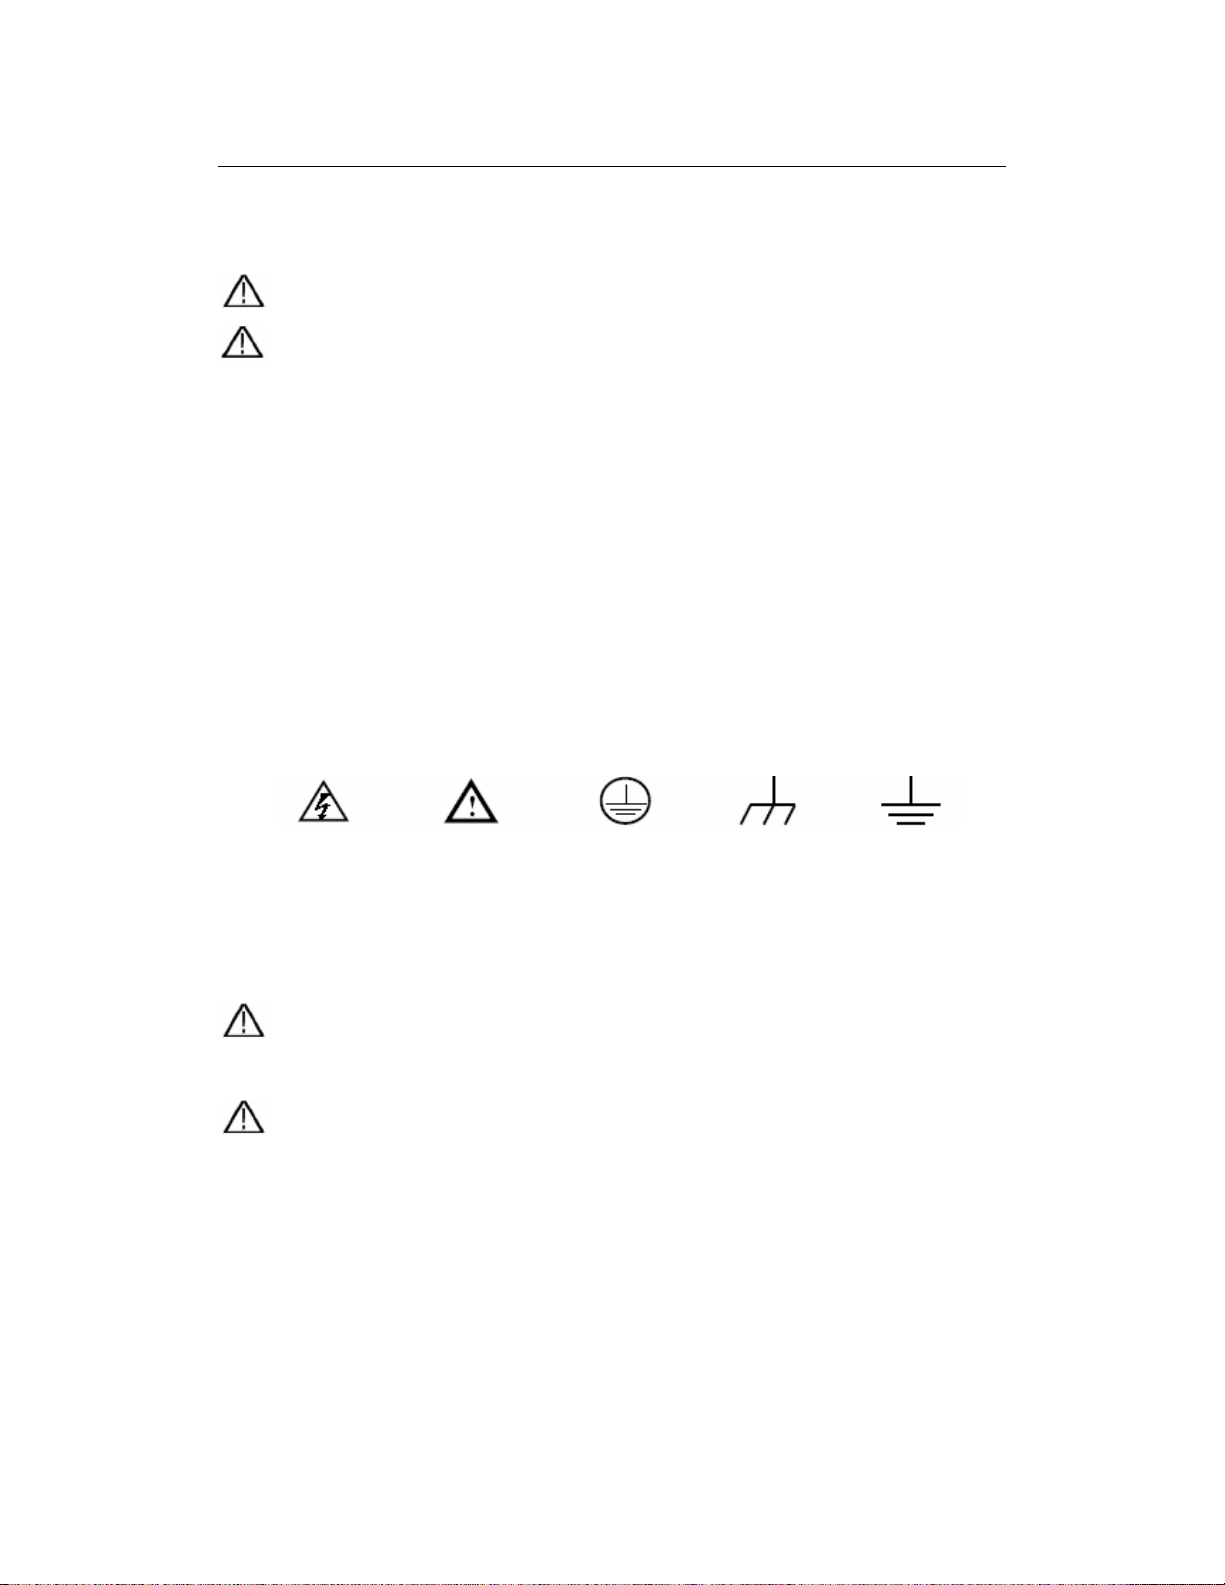
Input Connections
Figure 2
Description:
1. AC power adapter for AC power supply and battery recharging
2. Multimeter test leads
3. Multimeter input jacks, including three circular banana jacks and two square jacks.
The three circular jacks are used for voltage, current and resistance inputs, while the
two square jacks are used for capacitance inputs
4. Oscilloscope probes
5. Oscilloscope channel inputs: The upper one is for Channel 1 (CH1) while the lower
one is for Channel 2 (CH2)
8
MS400 Version 2.0 – December 2007
Page 9
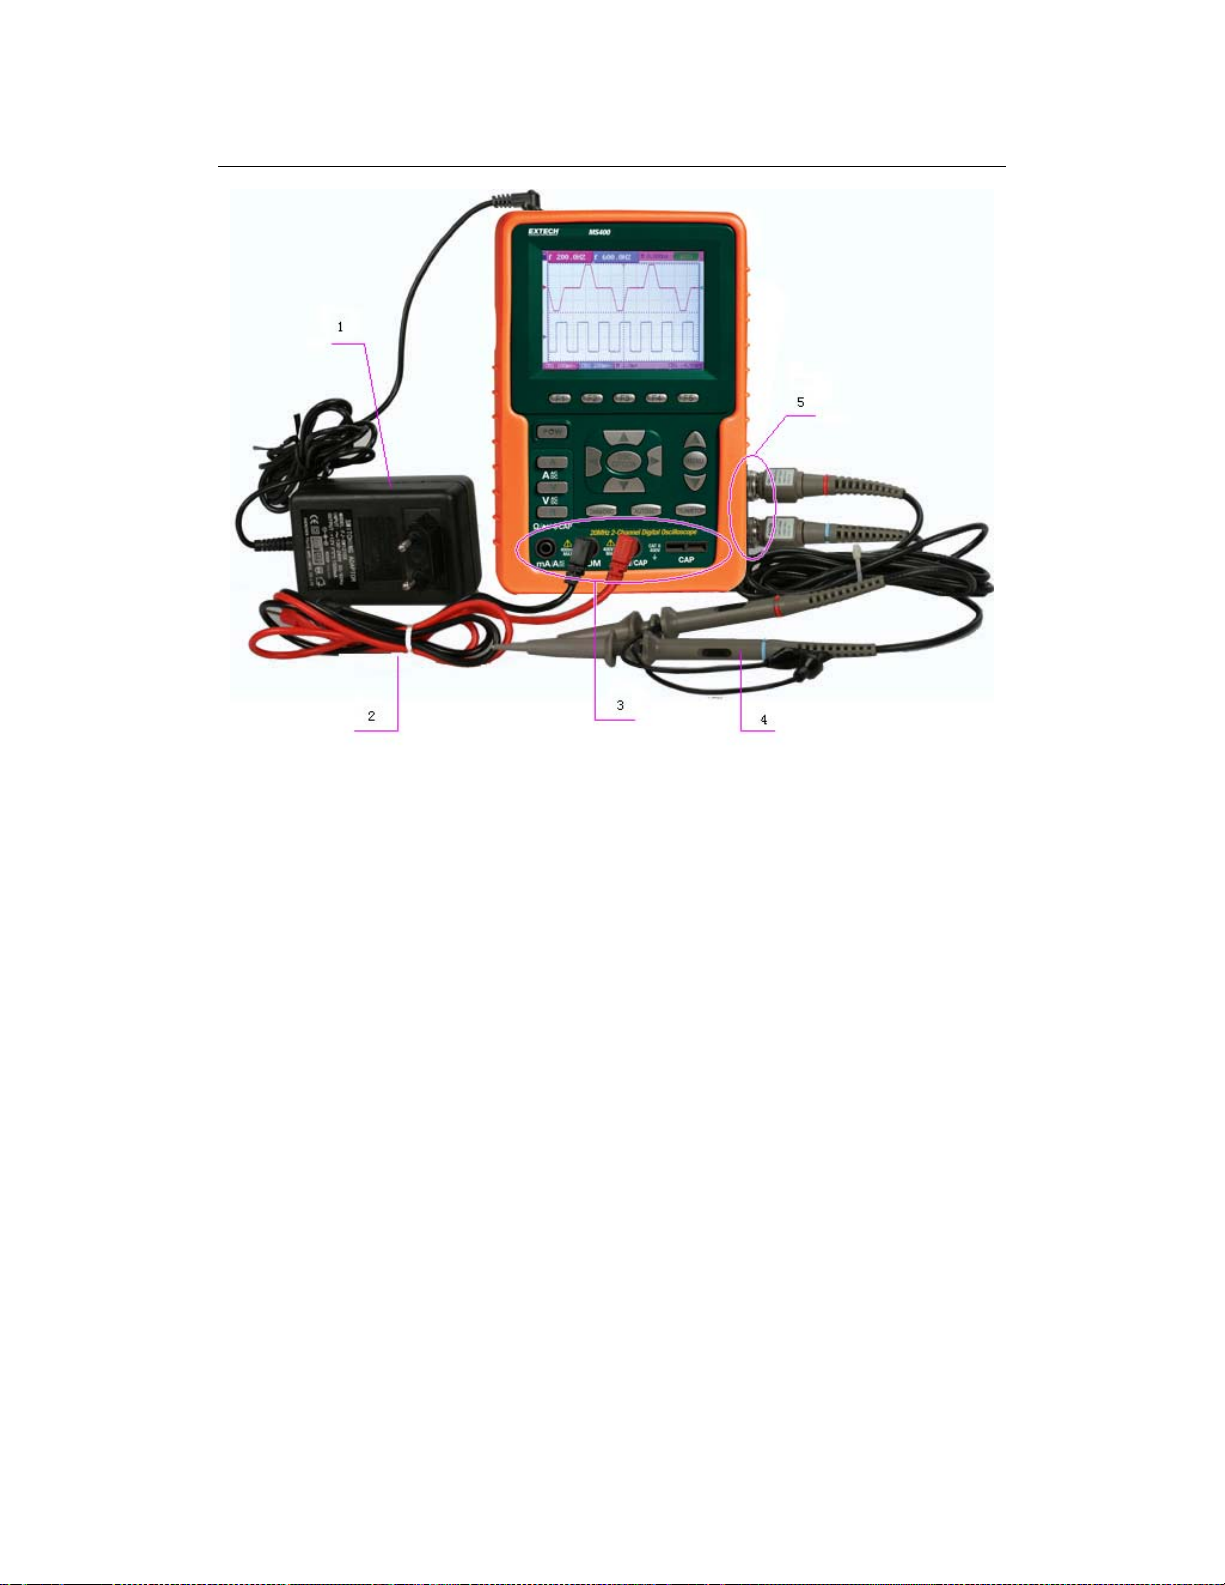
Description of the Front Panel and the Keypad
132
4
20
5
9
6
7
8
Description:
1. Power adapter jack
2. Serial port
3. USB jack
4. Backlight switch
5. POWER: Power switch
14 12 15
11
13
19
18
17
10
16
Figure 3
6. A: Multimeter current measurement key
7. V: Multimeter voltage measurement key
8. R: Multimeter resistance, diode, On/Off and capacitance measurement key
9. OSC LEFT: Oscilloscope left-direction adjustment key
10. OSC RIGHT: Oscilloscope right-direction adjustment key
11. OSC OPTION: Oscilloscope setting key
9
MS400 Version 2.0 – December 2007
Page 10

Using the four keys OSC LEFT, OSC RIGHT, OSC UP and OSC DOWN, users
can make the following settings by pressing OSC OPTION. The settings include:
Voltage Unit Scale for Channel 1 (CH1 VOL); Voltage Unit Scale for Channel 2
(CH2 VOL); Primary Time base (TIME BASE), zero point position for Channel 1
(CH1 ZERO), zero point position for Channel 2 (CH2 ZERO), trigger horizontal
position (TIME) and trigger level position (TRIG).
When performing Waveform Calculations, users can also adjust and calculate the
Display Multiplying Factor of a Waveform (CHM VOL) and the vertical display
position (CHM ZERO).
In cursor measurement mode, users can adjust the positions of Cursor 1 (V1 or
T1) and Cursor 2 (V2 or T2).
12. OSC DOWN: Oscilloscope display downward adjustment key.
13. OSC UP: Oscilloscope display upward adjustment key.
14. OSC/DMM: Press to switch between oscilloscope and multimeter.
15. AUTO SET:
In the Multimeter Mode, when performing a current or voltage measurement, the
user can switch between AC and DC with this key; when performing a resistance
measurement, the user can select resistance, diode, On/Off or a capacitance
measurement with this key.
This key is used for auto setting in the oscilloscope operation mode.
16. RUN/STOP: key for starting or stopping an operation.
17. MENU DOWN: Move down the menu list.
18. MENU: Show / Hide the menu.
19. MENU UP: Move up the menu list.
20. F1~F5: Switch or Adjustment options for each menu
10
MS400 Version 2.0 – December 2007
Page 11
Using the Scope
About this Chapter
This chapter provides a step-by-step introduction to the oscilloscope’s functionality. The
introduction does not cover all of the capabilities of the scope functions but gives basic
examples to show how to use the menus and perform basic operations.
Power-Up the Oscilloscope
Connect the oscilloscope to AC power via the power adapter as shown in Figure 2
Turn the oscilloscope on by pressing the power on/off key POW.
The instrument then performs a self-check. A greeting window with “press any key to
continue.” displays after the self-check.
The user can press any key to enter the measurement functions.
The oscilloscope powers up in the last setup configuration.
Oscilloscope Operation Window
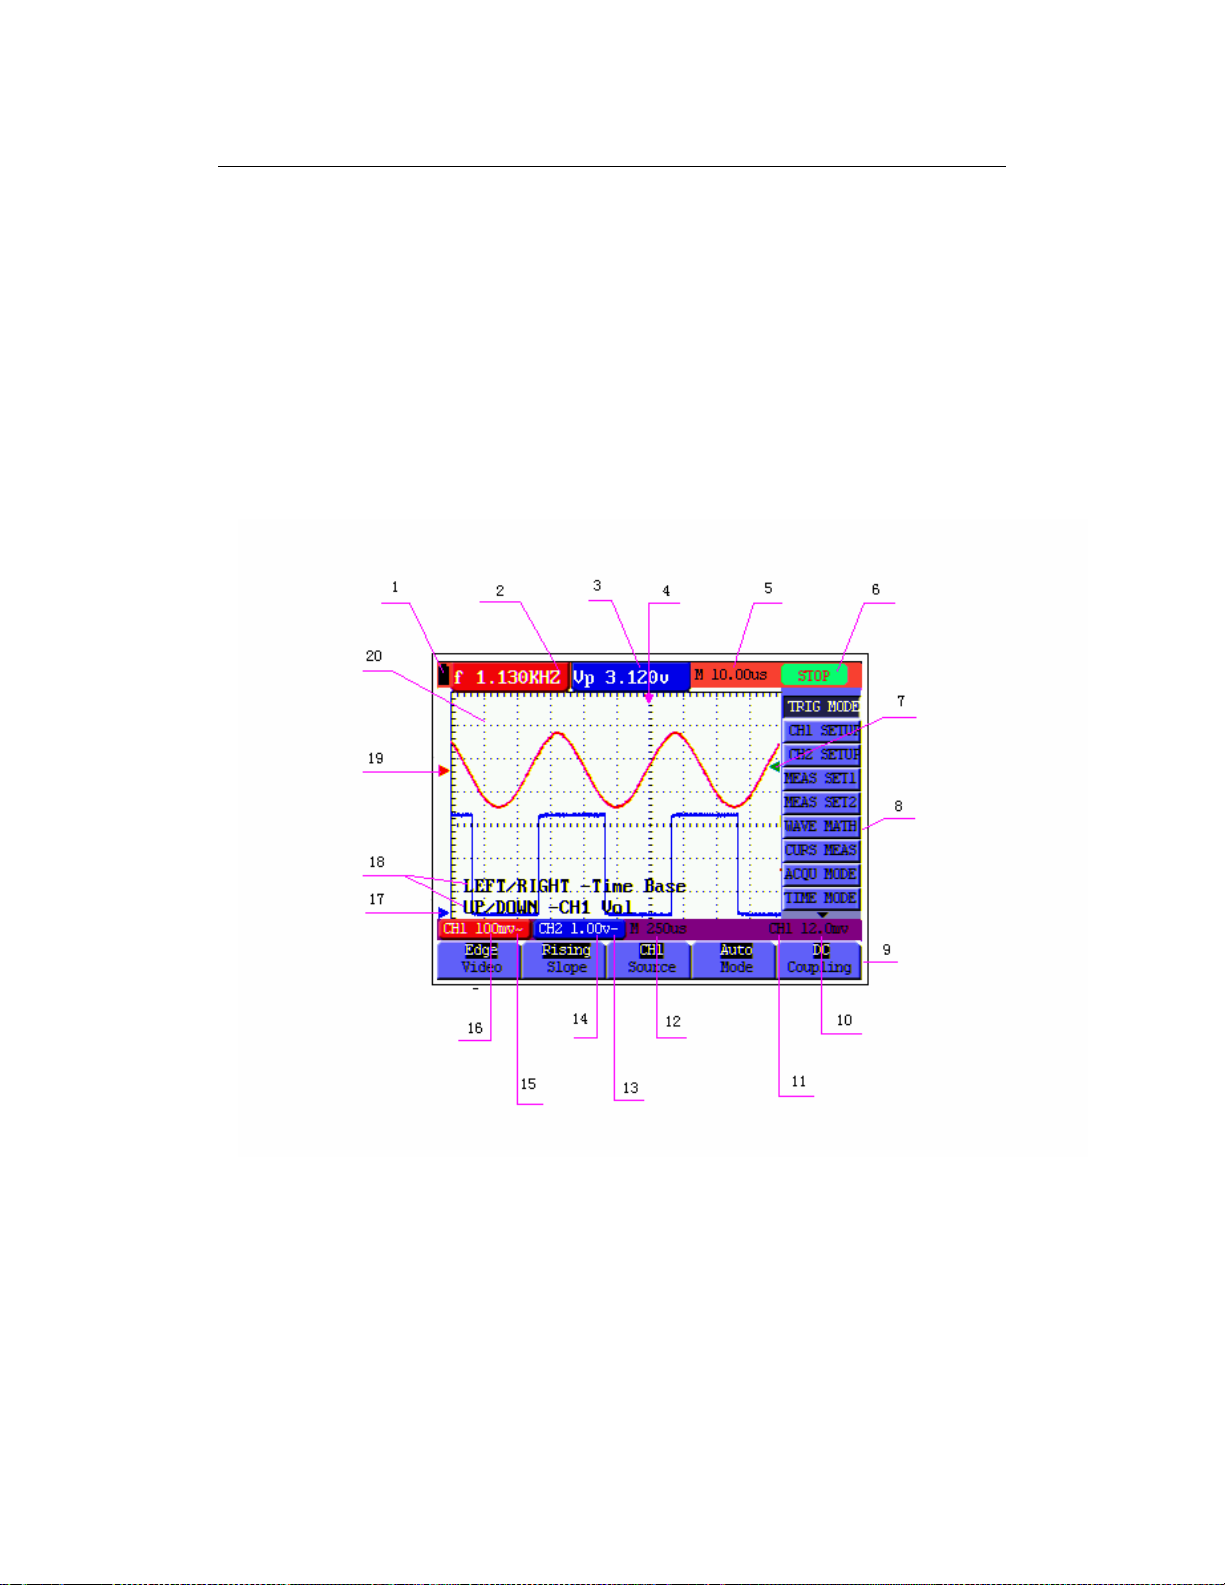
Figure 4: Oscilloscope Operation Window
11
MS400 Version 2.0 – December 2007
Page 12

1. Battery power level indicator symbols, including , , and .
2. Auto measurement window No. 1 where “f” is frequency, “T” is cycle, “V” is the
average value, “Vp” the peak-peak value and “Vk” the root-mean-square value.
3. Auto measurement window No. 2.
4. The pointer indicates the horizontal triggering position.
5. This reading gives the time difference between the horizontal triggering position and
the screen centerline. It reads zero when the pointer is in the center of the screen.
6. The trigger state indicates the following information:
Auto: The oscilloscope is in the automatic mode and displaying the waveform in the
non-trigger mode.
Trig’d: The oscilloscope has detected a trigger and is collecting the information
generated after the trigger.
Ready: All pre-triggered data have been captured and the oscilloscope is ready to
receive trigger signals.
Scan: The oscilloscope can gather/display the waveform data continuously in scan
mode.
Stop: The oscilloscope has stopped collecting the waveform data.
7. The green pointer shows the trigger voltage level.
8. A hidden-style menu: With the MENU key pressed, the user can view or hide the
menu.
9. Menu setting options: Various setting options for available menus.
10. The value of the trigger voltage level.
11. The display shows the trigger signal source.
12. The reading gives the value of the primary time base.
13. These graphics present the coupling modes of channel 2 (CH2). The graphic “~”
indicates AC, the graphic “-” indicates DC.
14. This reading shows the vertical Voltage Unit Scale of CH2.
15. These graphics show the coupling mode of CH1, the graphic “~” expresses and
indicates AC, the graphic “-” indicates DC.
16. This reading shows the vertical Voltage Unit Scale of CH1.
17. The blue pointer gives the grounding data point for the waveform on CH2, which is
the zero position of CH2. If this pointer does not display then the channel has not
been opened.
18. OSC OPTION operation prompt: There are various prompts for the available OSC
OPTION operations.
19. The red pointer gives the grounding data point for the waveform on CH1, which is the
zero position of CH1. No display of this pointer indicates that the channel has not
been opened.
20. Waveform display area. Red waveform represents CH1, blue waveform represents
CH2.
12
MS400 Version 2.0 – December 2007
Page 13
Navigating a Menu
The following example shows how to use the tool’s menus to select a function, as shown
in figure 5:
1. Press the MENU key to display the Function Menu on the right of the screen and the
corresponding optional settings on the bottom. Press MENU again to hide the
Function Menu.
2. Press the MENU UP or MENU DOWN key to select various function menus.
3. Choose a key from F1 to F5 to change the function setting.
Figure 5: the Tool’s Menus
13
MS400 Version 2.0 – December 2007
Page 14
Manually Setting the Vertical System, Horizontal System and
Trigger Position
Using the four keys OSC LEFT, OSC RIGHT, OSC UP and OSC DOWN, the user can
make the following settings by pressing OSC OPTION. The settings include: Voltage Unit
Scale for Channel 1 (CH1 VOL), Voltage Unit Scale for Channel 2 (CH2 VOL), Primary
Time base (TIME BASE), zero point position for Channel 1 (CH1 ZERO), zero point
position of channel 2 (CH2 ZERO), trigger horizontal position (TIME) and trigger level
position (TRIG).
The following example shows how to use the OSC OPTION key:
1. Press the OSC OPTION key once; the following is displayed at the bottom left side of
the screen, as shown in figure 6:
LEFT/RIGHT – Time Base
UP/DOWN – CH1 Volts/Div
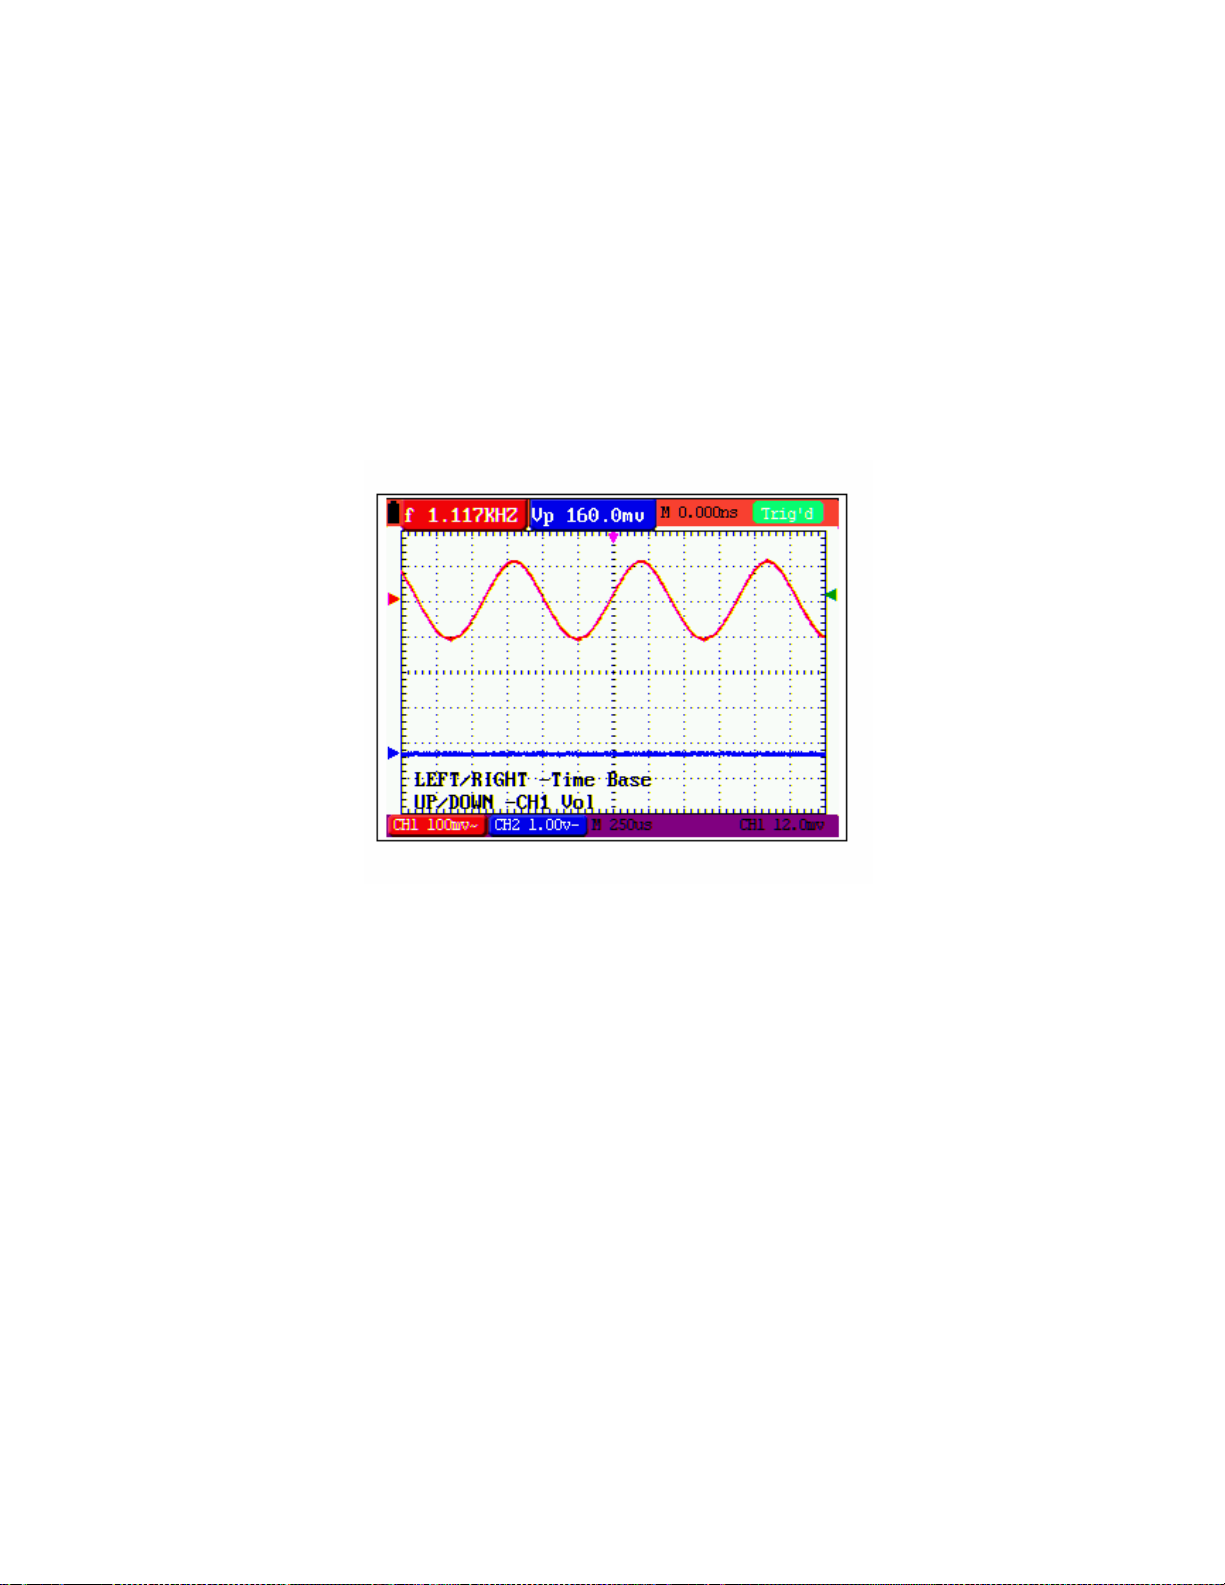
Figure 6: Voltage Unit Scale of Channel 1
2. Press the key OSC UP or OSC DOWN to adjust the vertical scale of Channel 1 and
press OSC LIFT or OSC RIGHT to adjust the horizontal time scale.
3. Press OSC OPTION once again, the following display is visible at bottom left side of
the screen as shown in figure 7:
LEFT/RIGHT – Time Base
UP/DOWN – CH2 Volts/Div
14
MS400 Version 2.0 – December 2007
Page 15
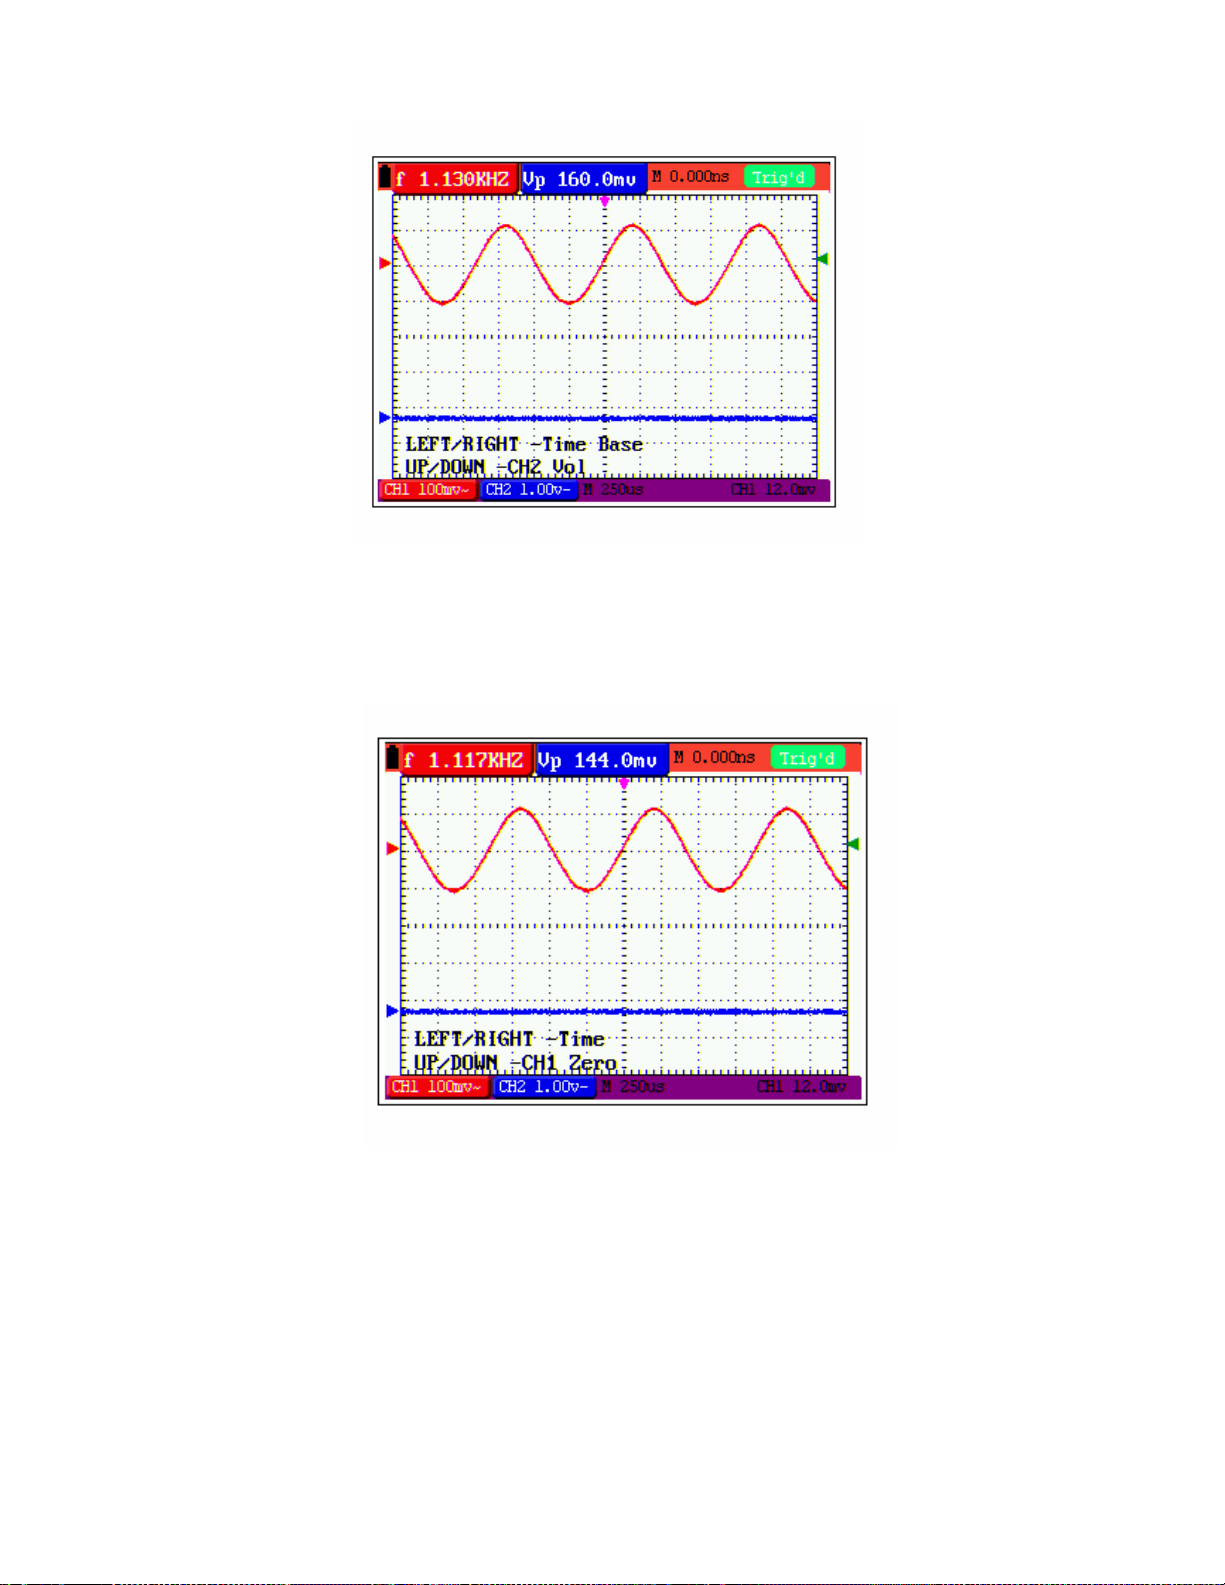
Figure 7: Voltage Unit Scale of Channel 2
4. Press the OSC UP or OSC DOWN key to adjust the vertical scale of Channel 2 and
press the OSC LIFT or OSC RIGHT key to adjust the horizontal time scale.
5. Press the OSC OPTION key one more time, and the following display is visible at the
bottom left side of the screen, shown in figure 8.
LEFT/RIGHT – Time
UP/DOWN – CH1 Zero
Figure 8: Zero Point Position of Channel 1
6. Press OSC UP or OS C DOWN key to adjust the zero position of Channel 1 in the
vertical direction and press OSC LIFT or OSC RIGHT key to adjust the horizontal
position.
15
MS400 Version 2.0 – December 2007
Page 16
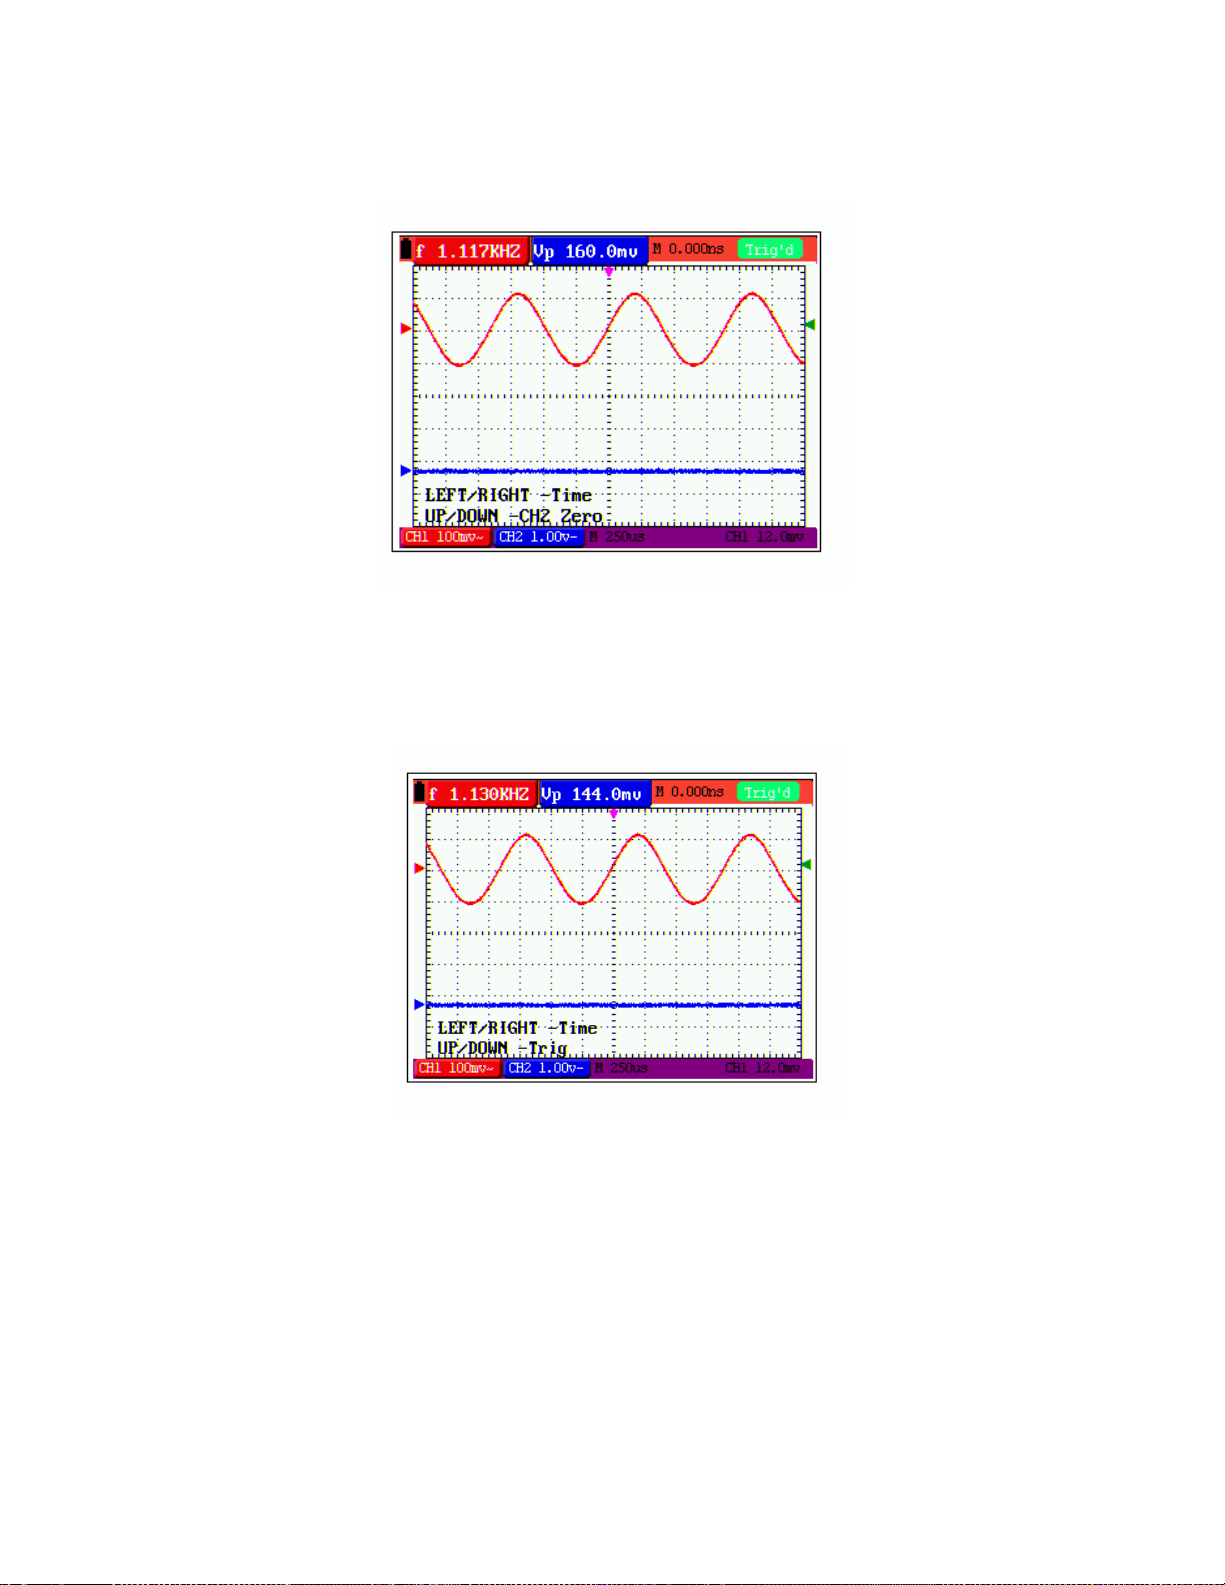
7. Again, press O SC OPTION key and the following appears at the bottom left side of
the screen, shown as the following figure 9:
LEFT/RIGHT – Time
UP/DOWN – CH2 Zero
Figure 9: Zero Point Position of Channel 2
8. Press the OSC UP or OSC DOWN key to adjust the zero position of Channel 2 in the
vertical direction and press OSC LEFT or OSC RIGHT key to adjust the horizontal
position.
9. Press OSC OPTION key once more and the following appears at the bottom left of
the screen, shown as the following figure 10:
LEFT/RIGHT – Time
UP/DOWN – Trig
Figure 10: Trigger Level Position
10. Press the OSC UP or OSC DOWN key to adjust the trigger position of Channel 2 and
press OSC LIFT or OSC RIGHT key to adjust the horizontal position.
11. Press the OSC OPTION key again and return back to step 1.
16
MS400 Version 2.0 – December 2007
Page 17

Term Glossary
Vertical scale factor is the voltage amplitude represented by a division in the vertical
direction of the display area. The user can amplify or attenuate the signal with this
scale factor and thus regulate the signal amplitude for the expected range.
Vertical zero position is referred to as the grounding data point through the
adjustment of which one can regulate the display position of the waveform on the
screen.
Primary time base refers to the time values represented by a division in the
horizontal direction of the display area.
Trigger horizontal position is the time deviation between the actual trigger point
and the screen central line which will be displayed as 0 at the center point of the
screen.
Trigger level position represents the voltage deviation between the actual trigger
level and the zero position of the triggering signal source channel.
Resetting the Oscilloscope
To reset the Oscilloscope to the factory default settings:
1. Press the MENU key. The function menu appears on the right side of the screen
2. Press the MENU UP or MENU DOWN key to select FUNCTION. Three options
will be visible at the bottom of the screen.
3. Press F1 to select Factory Settings. The oscilloscope will revert to the factory
settings.
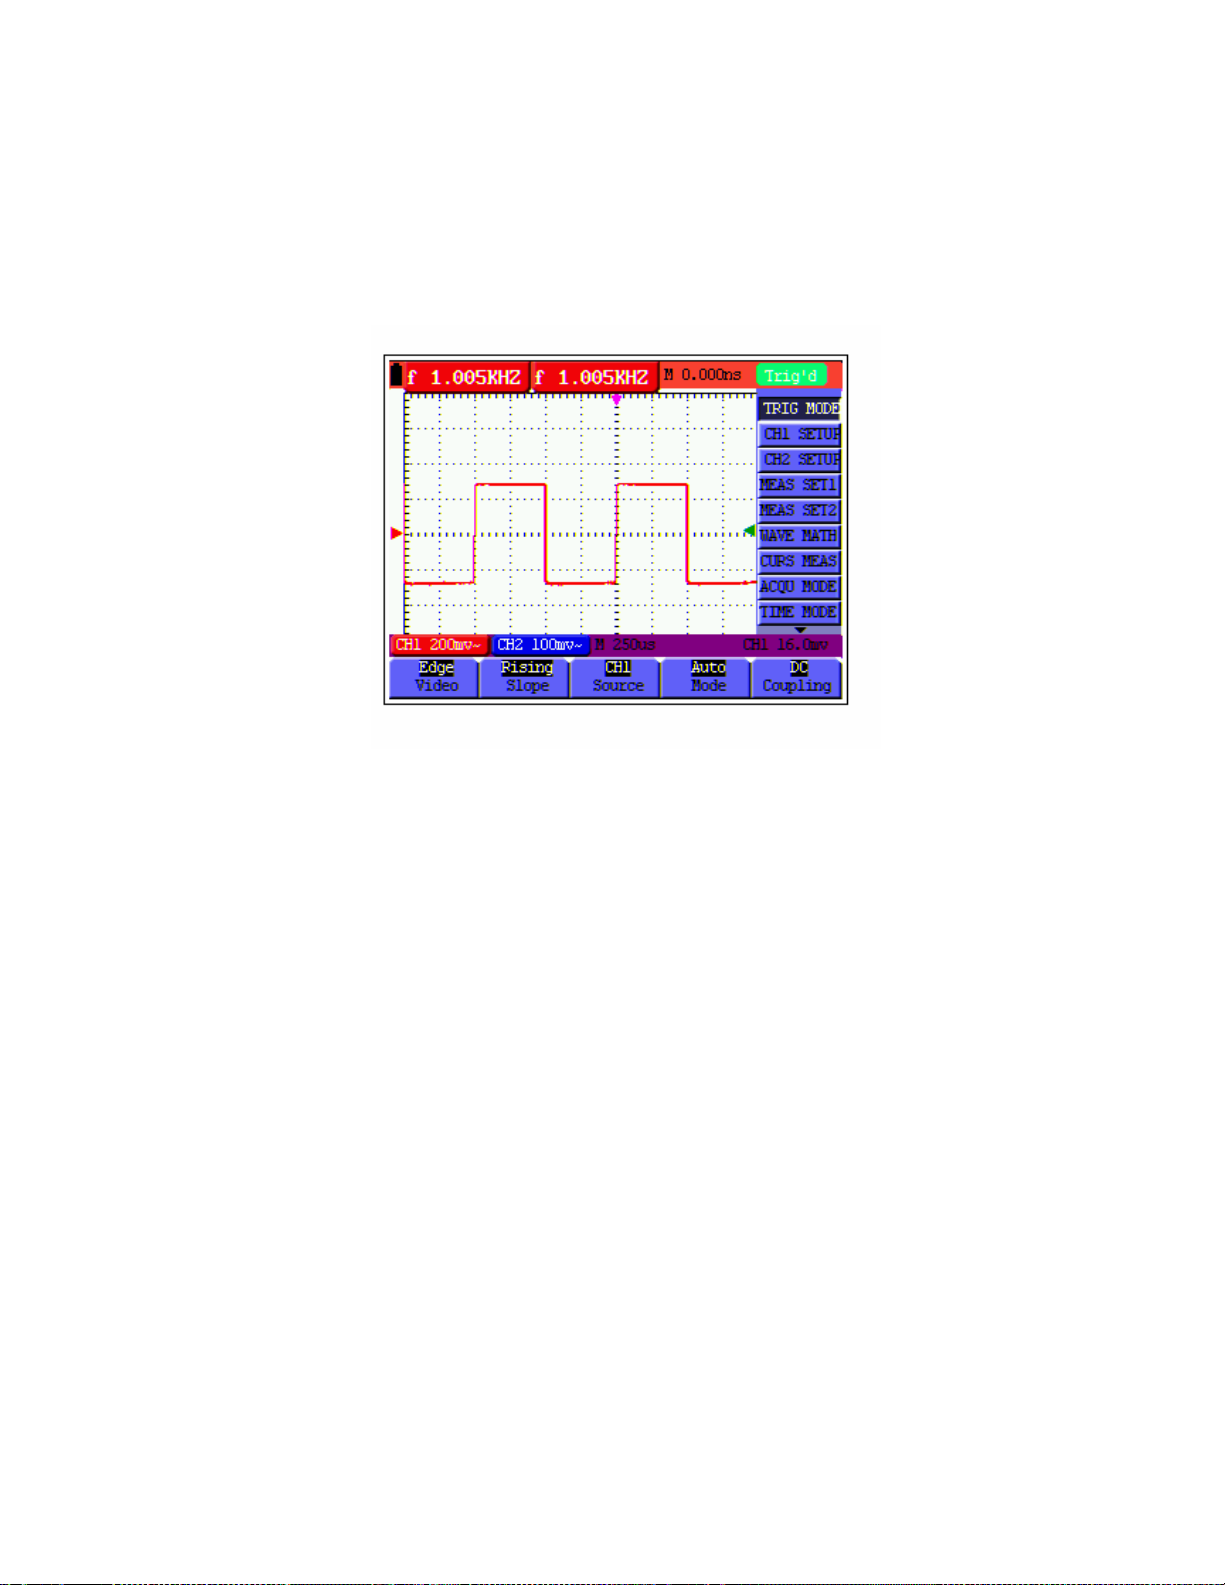
Figure 11: Reset the Oscilloscope
Input Connections
Examine the bottom and the right side of the Oscilloscope. The Oscilloscope has seven
signal inputs: two safety BNC jack inputs (CH1 and CH2) for scope measurements, three
safety 4-mm banana jack inputs for Multimeter R, V and A measurements, and two
square jack inputs for Multimeter capacitance measurements.
Isolated inputs allow independent floating measurements between Multimeter and Scope.
(fig. 2)
17
MS400 Version 2.0 – December 2007
Page 18

Displaying an Unknown Signal with Auto Set
The Auto-Set feature allows the Oscilloscope to display and measure unknown signals
automatically. This function optimizes the position, range, time-base, and triggering and
assures a stable display of virtually any waveform. This feature is especially useful for
quickly checking multiple signals.
To enable the Auto-Set feature:
1. Connect the test probe to the signals under test.
2. Press the AUTOSET key. The Oscilloscope is now in the automatic measurement
mode. The tested signals appear on the screen.
Automatic Zero-Returning of Trigger Horizontal Position and
Trigger Level Position
When the trigger horizontal position and trigger level position are adjusted to maximum,
they will become positioned off-screen. The following steps will allow the trigger horizontal
position and trigger level position to return to zero automatically:
1. Press the OSC LEFT key and the OSC RIGHT key simultaneously, the trigger
horizontal position automatically returns to zero.
2. Press the OSC UP and the OSC DOWN buttons simultaneously, the trigger level
position automatically returns to zero.
Automatic Measurements
The Oscilloscope offers 5 ranges of automatic scope measurements. Two numeric
readings can be displayed: measurement 1 and measurement 2. These readings are
selectable independently and the measurements can be performed on the input CH1 or
input CH2 waveform.
To choose a frequency for CHI1:
1. Press the MENU key. The function menu appears on the right side of the screen.
2. Press the MENU UP or the MENU DO WN key to select MEAS SET1. Five selectable
items are visible at the bottom of the screen.
3. Press the F1 key and select Freq CH1 from the mean square root value item. The
measuremen t 1 window turns red in color and shows the frequency for input CH1.
To choose a Peak-Peak measurement for Input CH2:
1. Press the MENU key. The function menu is displayed on the right side of the screen.
2. Press the MENU UP or the MENU DO WN key and select MEAS SET2, with 5
selectable items displayed at the bottom of the screen.
3. Press the F4 key to select PK-PK CH2 from Peak-Peak item. The measurement 2
window turns blue in color and shows the peak-peak value for input CH2.
Figure 12: Automatic Scope Measurements
18
MS400 Version 2.0 – December 2007
Page 19

Freezing the Screen
1. Press the RUN/STOP key to freeze the screen. STOP appears at top right side of the
screen.
2. Press the RUN/STOP key once more to resume measurement.
Figure 13: Freezing the Screen
Using Average for Smoothing Waveforms
To smooth the Waveform:
1. Press the MENU key and the function menu will appear on the right side of the
screen.
2. Press the MENU UP or the MENU DO WN key to select ACQU mode, with four
selectable items displayed at the bottom of the screen.
3. Press the F3 key to select Average Factors, then, press F4 to jump to Averages. This
averages the outcomes of 4, 16, 64, or 128 acquisitions and shows the final
averaging result on the screen, shown as in the following figures.
Figure 14: Average Factor Sampling Mode
19
MS400 Version 2.0 – December 2007
Page 20

Using Persistence to Display Waveforms
You can use Persistence to observe dynamic signals:
1. Press the MENU key and the function menu will appear on the right side of the
screen.
2. Press the MENU UP or the MENU DO WN key to select DISP SET. Four selectable
items are displayed at the bottom of the screen.
3. Press the F2 key to select Persist 1 sec, 2 sec, and 5 sec, Infinite or OFF. In this
case, jump to Infinite and the observed dynamic is kept on the screen continuously.
When the item OFF is selected, the Persistence function is switched off.
Figure 15: Using ‘Persistence’ to Observe Dynamic Signals
Using Peak Detection to Display Glitches
The user can use this function to display events (glitches or other asynchronous
waveforms) of 50 ns or wider:
1. Press the MENU key and the function menu will appear at the right side of the
screen.
2. Press the MENU UP or the MENU DOWN key to select the ACQU MODE. Four
selectable items are displayed at the bottom of the screen.
3. Press the F2 key and jump to Peak Detect.
Figure 16: Peak Detection
20
MS400 Version 2.0 – December 2007
Page 21

Term Glossary
Collecting mode: The oscilloscope transforms the collected analog data into a digital
form after it is gathered in the following three modes: sampling, peak value detection
and averaging values.
Sampling: The oscilloscope takes samples from the signal at equal time intervals to
reconstruct the waveform. In this mode, the analog signal can be expressed correctly
in most cases. However, rapid changes cannot be detected between two sampling
time intervals.
Peak value detection: The oscilloscope takes samples from the maximum and
minimum of signals in each sampling interval and shows the Waveform with the
sampled data. Thus, the oscilloscope may capture narrow pulses that could not be
detected in sampling mode.
Averaging values: The oscilloscope collects several Waveforms, averages them,
and displays the averaged Waveform. In this mode random noise can be reduced.
Duration time: When a new Waveform is displayed, the previous Waveform shown
on the screen does not disappear immediately but will continue to be displayed for a
period of time. This period of time is referred to as the duration time. Thus, a display
similar to that shown by an analog oscilloscope can be achieved.
Roll scan mode: The oscilloscope updates the Waveform sampling points by
scrolling through the screen from left to right (only applicable to the primary time base
setting above 50ms).
Selecting AC-Coupling
After a reset, the Oscilloscope is dc-coupled so that ac and dc voltages appear on the
screen. Use ac-coupling to observe small ac signals that ride on a dc signal. To select
ac-coupling:
1. Press the MENU key and the function menu will appear at the right side of the
screen.
2. Press the MENU UP or the MENU DO WN key to select the CH1 SETUP. Four
selectable items are visible at the bottom of the screen.
3. Press the F1 key and jump to AC. The bottom left side of the screen displays the ac-
coupling icon.
The user can view a screen that looks similar to the following Figure 17.
Figure 17: AC-Coupling
21
MS400 Version 2.0 – December 2007
Page 22

Reversing the Polarity of the Displayed Waveform
To invert the input CH1 waveform, do the following:
1. Press the MENU key and the function menu will appear at the right side of the
screen.
2. Press the MENU UP or MENU DOWN key to select CH1 SETUP. Four selectable
items are displayed at the bottom of the screen.
3. Press the F4 key to jump to Inverted. The inverted waveform of CH1 is displayed on
the screen.
Figure 18: Inverted
22
MS400 Version 2.0 – December 2007
Page 23

Using Waveform Mathematical Functions
When adding (CH1 + CH2), subtracting (CH1 – CH2, CH2 – CH1), multiplying (CH1 * CH2)
or dividing(CH1 / CH2 ) the input Waveforms of CHI and CH2, the Oscilloscope will
display the mathematical result Waveform M and the input Waveforms of CH1 and CH2 on
the screen. The Mathematical functions perform a point-to-point calculation on Waveforms
for CH1 and CH2.
To use a Mathematical function:
1. Press the MENU key and the function menu will display at the right side of the
screen.
2. Press the MENU UP or MENU DOWN key to select the WAVE MATH. Five
selectable items appear at the bottom of the screen.
3. Press F3 to select CH1+CH2 and the calculated waveform M (green) appears on the
screen. Press the F3 key to close the Waveform Calculation.
4. Press the OSC OPTION key and the following will be visible at the bottom left side of
the screen.
LEFT/RIGHT Time
UP/DOWN CHM Zero
Then press the OSC UP or the OSC DOWN key to adjust the vertical position of the
calculated waveform M displayed on the screen.
5. Press the OSC OPTION key and the following will appear at the bottom left side of
the screen.
LEFT/RIGHT Time Base
UP/DOWN CHM Vol
Press the OSC UP or OSC DOWN key to adjust the displayed amplitude of the
calculated waveform M.
Figure 19: Waveform Mathematics
23
MS400 Version 2.0 – December 2007
Page 24

Using the Multimeter
About this Chapter
This chapter provides step-by-step introductions for the multi-meter functions. The
introduction gives basic examples on how to use the menus and perform basic operations.
Meter Connections
Use the three 4-mm safety banana jack inputs for the Meter functions: COM, V/Ω, mA.
Two square capacitance jacks: CX
See Figure 2 for the proper connections.
Multimeter Operation Window
Figure 20: Multimeter Operation Window
Description:
1. Battery power level indictor.
2. Manual/Auto range indictors: Manual refers to the measuring range in manual
operation mode and Auto refers to the measuring range in automatic operation
mode.
3. Measurement mode indicators:
DCV: Direct voltage measurement
ACV: Alternating voltage measurement
DCA: Direct current measurement
ACA: Alternating current measurement
R: Resistance measurement
: Diode measurement
: Audible Continuity measurement
C: Capacitance measurement
24
MS400 Version 2.0 – December 2007
Page 25

4. The relative magnitude measurement indicator
5. Running state indicators, among which RUN expresses continuous update and
STOP represents the screen lock
6. The reference value of the relative magnitude measurement
7. The multiplying power of the dial indication. Multiplying the reading of the dial
pointer by the power will yield the measurement result
8. The measurement reading
9. Automatic control measuring range
10. Absolute / Relative magnitude measuring control: The sign “||” expresses the
absolute magnitude measuring control and “” represents the relative magnitude
measuring control
11. Manual measurement range control
12. Test lead indicates the scale of a reading; different test modes use various colors
25
MS400 Version 2.0 – December 2007
Page 26

Multimeter Measurements
By pressing the DMM/OSC key the oscilloscope will switch to the Multimeter mode.
The screen will display the multimeter windows, and, at the same time, prompt to
correctly insert the test leads. At this time press any key to enter the multimeter
measurement mode.
Measuring Resistance Values
To measure a resistance, do the following:
1. Press the R key and R appears at the top
of the screen.
2. Insert the black lead into the COM banana
jack input and the red lead into the V/Ω
banana jack input.
3. Connect the red and black test leads to the
resistor. The resistor value is displayed on
the screen in Ohms.
Figure 21: Resistance Measurement
Making a Diode Measurement
To make a diode measurement:
1. Press the R key and R appears at the top
of the screen.
2. Press the AUTO SET key until the
following is displayed
.
3. Insert the black lead into the COM banana
jack input and the red lead into the V/Ω
banana jack input.
4. Connect the red and black leads to the
diode and the reading is displayed on the
screen in V.
Figure 22: Diode measurement.
Making Continuity Tests
To perform a Continuity Test, do the following:
Press the R key and R appears on the top of
1.
the screen.
2. Press the AUTO SET key until the following is
shown on the screen.
3. Insert the black lead into the COM banana
jack input and the red lead into the V/Ω
banana jack input.
4. Connect the red and black test leads to the
test points. If the resistance value of the tested
point is less than 50Ω an audible beep will
sound.
Figure 23: Continuity.
26
MS400 Version 2.0 – December 2007
Page 27

Making a Capacitan ce Measurement
To measure a capacitance:
1. Press the R key and R appears on the top of
the screen
2. Press the AUTO SET key till C appears at the
top of the screen.
3. Insert the capacitor into the square jack and the
screen will show the capacitance reading.
Note: When the measured value is less than 5nF,
use the low capacitance mode of the multimeter
and the relative value measuring mode to
improve measurement precision. If the
capacitance measurement is larger than 40uF
the calculation will take about thirty seconds.
Making a DC Voltage Measurement
To measure a DC voltage, do the following:
1.
Press the V key and DCV appears at the top of
the screen.
2. Insert the black lead into the COM banana jack
input and the red lead into the V/Ω banana jack
input.
3. Connect the red and black test leads to the
measurement points and the measured voltage
value will display on the screen.
Making a AC Voltage Measurement
To measure AC voltage:
1. Press the V key and DCV appears at the top
of the screen.
2. Press the AUTO SET key and ACV appears at
the top of the screen.
3. Insert the black lead into the COM banana
jack input and the red lead into the V/Ω
banana jack input.
4. Connect the red and black test leads to the
measurement points and the AC voltage value
will be displayed on the screen.
Figure 24: Capacitance Measurement
Figure 25: DC Voltage Measurement
Figure 26: AC Voltage Measurement.
27
MS400 Version 2.0 – December 2007
Page 28

Making a DC Current Measurement
To measure DC current less than 400 mA:
1. Press the A key and DCA appears at the top
of the screen. The units on the main reading
screen are mA and 20A, press F4 or F5 to
switch the measurement between mA and
20A.
2. Insert the black lead into the COM banana
jack input and the red lead into the mA
banana jack input.
3. Connect the red and black test leads in
series to the measurement points and the
DC current value will be displayed on the
screen.
To measure DC current larger than 400mA:
1. Press the A key and DCA appears at the
top of the screen. The units on the main
reading screen will be mA.
2. Press F5 to change to the 20A
measurement mode, the units on the main
reading screen will be A.
3. Plug the 20A current shunt into the current
measure jack, and then plug the probe in
the module.
4. Connect the red and black test leads in
series to the measurement points and the
DC current value will be displayed on the
screen.
5. Press F4 to return to the 400mA
measurement mode.
Making an AC Current Measurement
To measure AC current less than 400mA:
1. Press the A key and DCA appears at the top
of the screen. The units on the main reading
screen are mA and 20A, press F4 or F5 to
switch the measurement between mA and
20A.
2. Press the AUTO SET key once and ACA will
be visible at the top of the screen.
3. Insert the black lead into the COM banana
jack input and the red lead into the mA
banana jack input.
4. Connect the red and black test leads to the
measurement point and the AC current value
will be displayed on the screen.
Figure 27: DC Current Measurement.
Figure 28: DC Current Measurement.
Figure 29: AC Current Measurement
28
MS400 Version 2.0 – December 2007
Page 29

To measure AC current larger than 400mA:
1. Press the AUTO SET key once and ACA
will be visible at the top of the screen.
2. Press F5 to select 20A, the units for the
main reading window will be A.
3. Press the AUTO SET key once and ACA
will be visible at the top of the screen.
4. Plug the current extended module into the
current measurement jack, and plug the test
leads into the shunt.
5. Connect the red and black test leads in
series to the measurement points and the
AC current value will be displayed on the
screen.
6. Press F4 to return to the 400mA
measurement mode.
Figure 30: AC Current Measurement for 20A
Freezing a Displayed Reading
Freeze the displayed readings at any time:
1. Press the RUN /STOP key to freeze the
screen, STOP will be displayed at the top right
of the screen.
2. Press the RUN /STOP key again to resume
measurements.
Figure 31: Freezing the Readings
Taking a Relative Measurement
A reading, relative to a reference value, is displayed in the relative measurement mode. The
following example shows how to take a relative measurement. First, the user must define a
reference value:
1. Press the R key and R will be displayed on the
top of the screen.
2. Press the AUTO SET key untill C appears at
the top of the screen.
3. Plug the capacitance extended module into the
capacitance measurement jack.
4. When the reading stabilizes, press F2 and the
triangle icon will be displayed on the top of the
screen. The saved reference value is
displayed below the triangle
5. All subsequent readings will be displayed
relative to the stored reference reading.
Figure 32: Relative Measurement.
29
MS400 Version 2.0 – December 2007
Page 30

Selecting Automatic/Manual Range
The default range mode is the automatic range mode. To switch to the manual range,
perform the following steps:
1. Press the F1 key and MANUAL is displayed
on the top left side of the screen.
2. In manual range mode, the measuring range is
increased each time F1 is pressed. After the
highest range is reached, the meter will return
to the lowest range. To return to automatic
mode, Press the F3 key and AUTO is
displayed on the top left side of the screen.
Figure 33: Automatic/Manual Range Adjustment
30
MS400 Version 2.0 – December 2007
Page 31

Advanced Oscilloscope Functions
About this Chapter
This chapter details the advanced oscilloscope functions.
Setting the Vertical CH1 and CH2
Each channel can be set independently.
To change vertical CH1 and CH2 settings:
1. Press the MENU key and the function menu will appear at the right of the screen.
2. Press the MENU UP or MENU DOWN key to jump to CH1 SETUP and four options
appear at the bottom of the screen.
3. Press any key from the F1 key through F4 to adjust the available settings.
The user can view a screen that looks similar to the following Figure 34.
Figure 34: Setting the Vertical
The following Table describes the Vertical Channel menu:
Function
menu
Coupling
Channel
Probe
Invert
Setting
AC
DC
Close
Open
1X
10X
100X
1000X
Close
Open
Description
The dc component in the input signal is blocked.
The ac and dc components of the input signal are
allowed
Close a channel
Open a channel
Select one setting according to the probe attenuation
factor to ensure a correct vertical scale reading.
Waveform is displayed normally.
Open the Invert function of the Waveform setting.
31
MS400 Version 2.0 – December 2007
Page 32

Setting the Channel Coupling
Example (CH1): Sine wave signal containing a dc offset.
Press F1 Coupling first and then press AC for an ac coupling setting. The dc component
contained in the tested signal is blocked.
Press F1 Coupling first and then press DC for a dc coupling setting. Both dc and ac
components contained in the tested signal are permitted.
The waveform is displayed as in Figures 35 and 36.
Figure 35: AC Coupling
Figure 36: DC Coupling
32
MS400 Version 2.0 – December 2007
Page 33

Enabling the Scope Channels
Example for CH1:
Set the F2 Channel key to OFF and CH1 will be turned off.
Set the F2 Channel key to ON and CH1 will be displayed.
Adjusting the Probe Scale
If a 10:1 probe is connected, the scale of the input channel on the oscilloscope should be
set to 10X to avoid any error occurring in the displayed scale factor information and tested
data.
Press F3 Probe to set the correct probe attenuation.
Table: Probe attenuation factors and the corresponding menu setting.
Probe Attenuation
Corresponding Menu Setting
Factor
1:1 1X
10:1 10X
100:1 100X
1000:1 1000X
Inverting a Waveform
The displayed signal reverses 180 degrees relative to ground.
Press F4 Invert to invert the waveform. Press F4 Invert once again to cancel the
Inversion.
Math Function Menu Settings
The MATH function provides the results for addition, subtraction, multiplication or division
calculations on CH1 and CH2 channel waveforms. The result can be shown in grid or
cursor modes. The amplitude of the calculated waveform can be adjusted with CHM VOL,
which is displayed in the scale factor form. The amplitude ranges are 0.001X, 0.002X,
0.005X and 10X. The position of the calculated waveform can be adjusted up and down
with the CHM Zero key.
Math Function Table
Setting Description
CH1-CH2 CH1 waveform minus CH2 waveform.
CH2-CH1 CH1 waveform minus CH2 waveform
CH1+CH2 Add CH1 waveform to CH2 waveform
CH1*CH2 Multiply CH1 waveform and CH2 waveform
CH1/CH2 Divide CH1 waveform by CH2 waveform
33
MS400 Version 2.0 – December 2007
Page 34

To perform a CH1+CH2 waveform calculation:
1. Press the MENU key and the function menu will appear at the right of the screen.
2. Press the MENU UP or MENU DOWN key to select WAVE MATH. Five options are
displayed at the bottom of the screen.
3. Press the F3 CH1+CH2 key and the obtained waveform M appears on the screen.
Press the F3 key again to close the waveform M.
4. Press the OSC OPTION key and the following will be displayed on the screen:
LEFT/RIGHT – Time Base
UP/DOWN – CH1 Volts/Div
5. Press the OSC UP or OSC DOWN key to adjust the amplitude of the waveform M.
6. Press the OSC OPTION key twice and the following will appear:
LEFT/RIGHT – Time
UP/DOWN – CHM Zero
7. Press the OSC UP or OSC DOWN key to adjust the position of waveform M.
Figure 37: Waveform Mathematics
Setting the Trigger
The trigger defines the start time for data acquisition and waveform display. When
beginning to acquire data, the oscilloscope collects sufficient data to draw the waveform at
the left side of the triggering point. After a trigger is detected, the oscilloscope gathers
enough data to draw the waveform at the right side of the triggering point.
To configure a trigger mode setting:
1. Press the MENU key and the function menu will appear at the right of the screen.
2. Press the MENU UP or MENU DOWN key to select TRIG MODE and five selectable
items will be displayed at the bottom of the screen.
3. Use the F1 through F5 keys to make selections.
4. Press the OSC OPTION key and the following will be shown on the screen:
LEFT/RIGHT – Time
UP/DOWN – Trig
5. Press the OSC UP or OSC DOWN key to adjust the trigger level positions.
34
MS400 Version 2.0 – December 2007
Page 35

Figure 38: Edge Trigger
Triggering Control
There are two triggering modes: Edge and Video. Each trigger mode is set by menu
functions:
Edge triggering occurs when the trigger input passes through a given level in the
specified direction.
Video triggering: Perform video field trigger or line trigger on standard video signals.
The following describes the Edge and Video triggering menus respectively.
Edge Triggering
With Edge triggering selected, the trigger occurs on the rising or falling edge of the
input signal, if the triggering threshold is met.
The Edge triggering menu:
Function
menu
Slope Rise
Signal
source
Trigger
mode
Coupling AC
Settings Description
Triggering on the rising edge of the signal.
Fall
CH1
CH2
Auto
Normal
Single Shot
Triggering on the falling edge of the signal.
CH1 is used as the trigger source.
CH2 is used as the trigger source.
Acquisition of waveforms is possible even if there is
no triggering condition detected.
Acquisition of waveforms can only be performed
when the triggering condition is satisfied.
The sampling is performed on a waveform when one
trigger is detected, then sampling ceases.
With this mode selected, the DC component is
DC
HF
suppression
LF
suppression
prevented from passing-through.
All dc components are allowed to pass.
The HF part of the signal is prohibited and only the LF
component is allowed.
The LF part of the signal is prohibited and only the HF
component is allowed to pass
35
MS400 Version 2.0 – December 2007
Page 36

Video Triggering
With Video triggering selected, the oscilloscope performs NTSC, PAL or SECAM
standard video signal field and line triggering.
The user can view a screen that looks similar to the following Figures 39 & 40.
Figure 39: Video Field Trigger
Figure 40: Video Line trigger
The Video triggering menu is described in the following table.
Function
Settings Description
menu
Polarity Normal
Invert
Applicable to the video signal in which the black level
is low level.
Applicable to the video signal of which the black level
is high level.
Signal source CH1
CH2
SYNC Line
Field
Select CH1 as the trigger source.
Select CH2 as the trigger source.
Make a video line trigger synchronization setting
Make a video field trigger synchronization setting.
36
MS400 Version 2.0 – December 2007
Page 37

Term Glossary
Trigger modes: There are three kinds of trigger modes available for this oscilloscope-
auto, normal and single shot.
Automatic trigger mode: In this mode, the oscilloscope can acquire a Waveform
without any triggering condition detected. It will be triggered automatically after waiting a
specified period of time. When an invalid trigger is sensed the oscilloscope cannot keep
the Waveform in phase.
Normal trigger mode: In this mode the oscilloscope cannot acquire the Waveform until it
is triggered. If there is no trigger, the oscilloscope will display the original Waveform
without new Waveforms being captured and/or displayed.
Single shot mode: In this mode the oscilloscope will detect a trigger and capture a
Waveform each time the operator presses the RUN/STOP key.
Acquiring Mode Settings
The Acquiring Mode menu is described in the table shown below:
Function
menu
Sampling Normal sampling mode.
Peak Detection Used to detect a glitch.
Average Value Used to reduce random and unrelated noise.
Average Factor 4, 16, 64
Settings Description
Several average factors are available.
Select the average factor.
or 128
Display Settings
The Display Setting menu is described in the following table:
Function
menu
Type Vector
Persistence Close
Display format YT
Communication Bitmap
Settings Description
The vector fills the spaces between neighboring
Dot
1s
2s
5s
Infinite
XY
Vector
sampling points to form a line on the display.
Only the sample points are displayed.
Set ‘Persistence’ time for each sampling point.
Displays the relative relationship between vertical
voltage and horizontal time.
Display CH1 on the horizontal axis and CH2 on the
vertical axis.
The data is transmitted as a bitmap
The data is transmitted as a vector
37
MS400 Version 2.0 – December 2007
Page 38

Display Style
The display styles include Vector and Dot as shown in Figures 41 & 42.
Figure 41: Dot Style
Figure 42: Vector Style
Persistence Mode
With the Persistence function selected, the displayed data gradually decays in color
and the new data is shown bright in color. In the infinite persistence mode, the recorded
points will be kept on the screen until the controlled value is changed.
38
MS400 Version 2.0 – December 2007
Page 39

XY Mode
With the XY mode selected, CH1 is displayed on the horizontal axis and CH2
displayed on the vertical axis. When the oscilloscope is in a sampling mode in which
no trigger is found, the data appear as light spots.
Operation of various control keys:
■ CH1 Volts and CH1 Zero for CH1 are used to set the horizontal scale and
position.
■ CH2 Volts and CH2 Zer o for CH2 are used to set the vertical scale and position.
The following functions do not work in the XY display mode:
■ Reference or digital value waveform
■ Cursor
■ Auto Setting
■ Time base control
■ Trigger control
Waveform Saving Setup
The oscilloscope can save four (4) Waveforms all of which can be displayed on the
screen with the present Waveform. The recalled Waveform saved in the memory
cannot be adjusted.
The waveform saving /recalling menu is described in the following list.
Function
Setups Description
menu
Signal
source
CH1
CH2
Select the displayed Waveform to save.
MATH
Address A, B, C and D Select the address for saving or recalling a
Waveform.
Saving Store the Waveform of a selected signal source into
the selected address.
Addresses
A, B, C
Close
Start
Close or start displaying the Waveforms stored in
address A, B, C or D.
and D
To save a waveform on CH1 in address A:
1. Press the MENU key; the function menu will appear at the right of the screen.
2. Press the MENU UP or MENU DOWN key to select Wave Save. Four selectable
items are displayed at the bottom of the screen.
3. Press the F1 key to select the signal source CH1.
4. Press the F2 key to select the Address A.
5. Press the F3 key to save the CH1 Waveform in Address A.
To display the saved Waveform:
Press the F4 key to select Start for address A. The Waveform saved in address A will
be displayed on the screen in green and the zero point of Waveform k, voltage and
time, will be purple
39
MS400 Version 2.0 – December 2007
Page 40

The user can view a screen that looks similar to the following Figure 43.
Figure 43: Saving a Waveform
Function Setting Menu
The Function Setting Menu is described in the following list:
Function
Menu
Factory setting Return the instrument to its factory settings.
Self-correcting Perform a self-correcting procedure.
Language Chinese
Self-correcting:
The self-correcting program can improve the accuracy of the oscilloscope if the
ambient temperature variation is equal to or larger than 5 degrees Celsius.
Before the self-correcting program is performed, the probe or leads should be
disconnected; Press F2 “Self-correcting” to enter the self-correcting program.
Setting Description
Select the display language
English
Automatic Measurements
The oscilloscope can perform five (5) types of automatic measurements: Frequency,
Cycle, Average value, Peak-to-peak value and Root mean square. Two types of
measurements can be displayed on the screen simultaneously.
The function menu for automatic measurements is described in the following table:
Function
menu
Frequency CH1
Cycle CH1
Average value CH1
Peak-to-Peak
value
RMS value CH1
Settings Description
Measures the frequency of CH1
CH2
CH2
CH2
CH1
CH2
CH2
Measures the frequency of CH2
Measures the cycle of CH1
Measures the cycle of CH1
Measures the average value of CH1
Measures the average value of CH2
Measures the peak-to-peak value of CH1
Measures the peak-to-peak value of CH2
Measures root mean square (RMS) value of CH1
Measures root mean square (RMS) value of CH2
40
MS400 Version 2.0 – December 2007
Page 41

To measure the frequency of CH1 with Measurement 1 and the frequency of CH2 with
Measurement 2, perform the following:
1. Press the MENU key; the function menu will be shown at the right of the screen.
2. Press the MENU UP or MENU DOWN key to select MEAS SET1. Five options
appear at the bottom of the screen.
3. Press the F1 key to select the frequency measurement as CH1. The
measurement window 1 on the screen turns red in color and shows the frequency
of CH1.
4. Press the MENU UP or MENU DOWN key to select MEAS SET2 . Five options
appear at the bottom of the screen.
5. Press the F4 key to jump to the peak-to-peak measurement symbolized as CH2.
The measurement window on the screen turns blue in color and shows the peakto-peak value of CH2.
The user can view a screen that looks similar to the following Figure 44.
Figure 44: Automatic Measurements
Cursor Measurements
This oscilloscope allows the user to make manual cursor measurements of time and
voltage. The signal sources include Channel 1 (CH1), Channel 2 (CH2), MATH,
storage Address A and storage Address B.
The cursor measurement menus are listed and described in the following table:
Function
Settings Description
menus
Type Close
Voltage
Time
Signal
sources
CH1, CH2, ATH,
address A and
Closes the cursor measurement
Displays the voltage cursor and menu
Displays the time cursor and menu
Selects the Waveform channel on which the
cursor measurement will be performed
address B.
41
MS400 Version 2.0 – December 2007
Page 42

To make a voltage measurement on CH1, perform the following:
1. Press the MENU key: the function menu will appear at the right of the screen.
2. Press the MENU UP or MENU DOWN key to select CURS MEAS. Two options
are shown at the bottom of the screen.
3. Press the F1 key to select the measurement type Voltage. Two purple crossing
dashed lines V1 and V2 are shown on the screen.
4. Press the F2 key to select the measured channel CH1.
5. Press and hold the OSC OPTION key till the UP/DOWN CURSOR 1 is visible on
the screen. At this time, adjust OSC UP or OSC DOWN and the dashed line V1 is
shown moving up and down while the measured voltage value of V1 relative to
the zero position of CH1 appears on the screen.
6. Press and hold the OSC OPTION key until the UP/DOWN CURSOR 2 appears
on the screen. Now, adjust OSC UP or OSC DOWN and the dashed line V2 will
appear moving up and down while the measured voltage value of V2 relative to
the zero position of CH1 is displayed on the screen. Also, the absolute values of
V1 and V2 can be shown on the screen.
The user can view a screen that looks similar to the following Figure 45.
Figure 45: Use the Cursor for a Voltage Measurement
To use the cursor for a time measurement on CH1, perform the following:
1. Press the MENU key; the function menu will appear at the right of the screen.
2. Press the MENU UP or MENU DOWN key to select Cursor Measurement. Two
key labels are shown at the bottom of the screen.
3. Press the F1 key for measurement type Time. Two vertical dashed lines T1 and
T2 appear on the screen.
4. Press the F2 key to jump to the measured channel CH1.
5. Press and hold the OSC OPTION key until the UP/DOWN CURSOR 1 appears
on the screen. Then adjust OSC UP or OSC DOWN to observe the dashed line
moving left and right. At the same time, the time value of T1 relative to the
screen middle point position will be displayed on the screen.
6. Keep pressing the OSC OPTION key until UP/DOWN CURSOR 2 is displayed on
the screen. Then adjust OSC UP or OSC DOWN so that the dashed line T2 is
moving right and left while the time value of T1, relative to the screen middle
point position, appears on the screen. Observe the absolute time values and
frequencies for T1 and T2.
42
MS400 Version 2.0 – December 2007
Page 43

The user can view a screen that looks similar to the following Figure 46.
Figure 46: Use the Cursor for Time Measurement
System State Menu
The system state menu is used to display information about the present horizontal
system, vertical system, trigger system and others. The operational steps are listed
below:
1. Press the MENU key; the function menu will appear at the right side of the
screen.
2. Press the MENU UP or MENU DOWN key to select SYS STAT. Four options
appear at the bottom of the screen.
3. Sequentially press F1 through F4 and the corresponding status information will
display.
The following Figure 47 will be displayed.
Figure 47: System State
43
MS400 Version 2.0 – December 2007
Page 44

Setting the Time Base Mode
The time base mode menu is detailed in the following table:
Function menu Explanation
Main time base Horizontal main time base is used for waveform
display
Window setting Use two cursors to define a window area
Window extension Expand the defined window to full-screen display
For a Window Extension, use the following steps:
1. Press the MENU key; the function menu will appear on the right side of the
screen.
2. Press the MENU UP or MENU DOWN key to select TIME MODE (three options
appear at the bottom of the display).
3. Press the F2 key to select the window setting.
4. Press the OSC OPTION key to view TIME BASE, then use the OSC LEFT and
OSC RIGHT keys to adjust the time base window area defined by two cursors,
the window size will vary.
5. Press the OSC OPTION key to view the TIME, use the OSC LEFT and OSC
RIGHT keys to adjust the window position defined by two cursors, the window
position is the time difference of the window center to the main time base’s
horizontal pointer.
6. Press F3, select window extension, the defined window extends to a full-screen
display.
Figure 48: Window Setting
44
MS400 Version 2.0 – December 2007
Page 45

Figure 49: Window Extension
Data Transmission
1. Press the MENU key to display the function menu on the right side of the screen.
2. Press the MENU UP or the MENU DOWN key to select the DISP SET mode; four
options appear at the bottom of the display.
3. Press the F4 key and select Bitmap or Vectors for data transmission.
4. Use the supplied cable to connect the meter to the PC.
5. Open the supplied software program on the PC.
6. Set the parameters according to the Software User Guide or from the Help Utility
available inside the software program to start data transmission.
45
MS400 Version 2.0 – December 2007
Page 46

Troubleshooting
1. The oscilloscope will not Power ON
The battery may need recharging. The oscilloscope will not start even if it is powered
by the battery charger. First, charge the battery completely and then supply the
oscilloscope with power through the battery charger. However, do not switch on the
oscilloscope’s power for fifteen minutes. If the oscilloscope still will not start, please
contact Extech Instruments.
2. The oscilloscope shuts OFF after operating for only several seconds
The battery may need recharging. Check the battery symbol at the upper right of the
screen. The
charged.
3. The measurement displays ERR when in the multimeter mode
Make sure the instrument is switched to the measuring mode. Depress any of the
three keys V, A or R. The relative measuring mode will then be shown on the screen.
If ERR is still displayed, restart the meter.
4. The measured voltage amplitude value is 10 times larger or smaller
while in the oscilloscope mode
Check whether the channel attenuation factor matches the actual probe ratio.
5. In the Oscilloscope mode, the Waveform is displayed but is not
stable
symbol indicates that the battery has run out of power and must be
Check whether the setting in the trigger mode menu matches the signal channel
indicated.
Check the trigger mode: The edge trigger mode is applicable to normal
waveforms and the video trigger mode is applicable to video signals. Only when
the proper trigger mode is applied can the Waveform stabilize.
Change the trigger coupling to HF repression and LF repression in order to filter
the HF or LF noise.
6. There is no display on the screen when the RUN/STOP key is pressed
while in the oscilloscope mode
Check whether the trigger mode in the trigger mode menu is in the Normal or the
Single-Shot mode and whether the trigger level is out of the Waveform range. In
such a condition, adjust the middle trigger level or select the non-auto trigger mode.
Additionally, press the AUTO SET key.
7. The display speed is unusually slow when attempting to select the
average sampling in the sampling mode or while selecting a longer
display time in the display mode for the oscilloscope
This is normal.
46
MS400 Version 2.0 – December 2007
Page 47

Appendix
Appendix A: Specifications
Oscilloscope
All technical specifications are applicable with the probe set to the 10X attenuation switch
setting (unless otherwise noted). In order for the instrument to maintain these specifications
the oscilloscope should meet the following requirements:
■ The instrument should operate continuously for more than 30 minutes under specified
operating environmental temperatures.
■ If the variation in ambient temperature is equal to or greater than 5 degrees Celsius,
open the system function menu and perform a “self- calibration”
Sampling:
Sampling modes Normal sampling
Peak detection
Average value
Sampling rate 100 MS/s
Input:
Input coupling DC, AC
Input impedance 1MΩ ±2% connected in parallel with 20pF ±3pF
Probe attenuation coefficient 1X, 10X, 100X, 1000X
Max. Input voltage 400V (peak)
Channel delay time (typical) 150ps
Horizontal:
Sampling rate range 10S/s 100MS/s
Waveform interpolation (sin x)/x
Record length 6K points on each channel
Scanning speed range (S/div) 5ns/div 5s/div, stepping in the “1-2.5-5” mode
Sampling rate and relay time
accuracy
Time interval
(T)measurement
accuracy(full bandwidth)
±100ppm(any time interval which is equal to or larger
than 1ms)
Single: ±(1 sampling interval
time+100ppm×reading+0.6ns)
>average 16 : ±(1 sampling interval time
+100ppm×reading+0.4ns)
47
MS400 Version 2.0 – December 2007
Page 48

Vertical:
Analog digital converter(A/D)
With a resolution of 8 bits, sampling is performed on
both channels synchronously.
Sensitivity range (V/div) 5mV/div~5V/div(at the input BNC)
Displacement range ±50V(500mV~5V),±1V(5mV~200mV)
Analog bandwidth 20M
Single bandwidth Full bandwidth
Low frequency response (AD
≥5Hz (at the BNC)
coupling, -3dB)
Rise time (typical one at the
≤17.5ns
BNC)
DC gain accuracy ±5%
DC measurement accuracy
(average value sampling mode)
The voltage difference (V) between any two points
on the Waveform after averaging the captured
waveforms more than16: ±(5% reading + 0.05
divisions).
Trigger:
Trigger sensitivity (Edge
triggering)
DC
coupling
AC
coupling
CH1 and CH2: 1div(DC~full bandwidth)
Same as the DC coupling when it is equal to
or larger than 50Hz.
Triggering level range ±6 divisions from the screen center
Triggering level accuracy
(typical) which is applicable
to the signal with rise and
fall time equal to or longer
than 20ns
Trigger displacement
Make a 50% level setting
(Typical).
Trigger sensitivity (Video
triggering and typical mode)
Signal system and line/field
frequency (Video triggering
mode)
Measurement:
Cursor
Voltage difference (V) and time difference (T) between cursors
measurement
Auto
measurement
Peak-to-peak value, average value, root mean square value,
frequency and cycle.
±0.3 divisions
655 divisions for pre-triggering and 4 divisions for posttriggering
Operation with the input signal frequency equal to or
larger than 50Hz.
2 divisions of peak-to-peak value
Supports the NTSC, PAL and SECAM broadcasting
systems of any field or line frequency.
48
MS400 Version 2.0 – December 2007
Page 49

Probe:
1X position 10X position
Bandwidth Up to 6 MHz (DC) Up to full bandwidth (DC)
Attenuation rate 1: 1 10: 1
Compensation
10pf~35pf
range
Input resistance 1MΩ±2% 10MΩ±2%
Input impendence 85pf~115pf 14.5pf~17.5pf
Input voltage 150 V DC 300 V DC
Meter
Voltage (VDC)
Input Impedance: 10MΩ.
Max. Input Voltage: 1000V (DC or AC peak-to-peak value)
Range Accuracy Resolution
400.0mv 100uV
±1%±1 digit
4.000V 1mV
40.00V 10mV
400.0V
100mV
Voltage (VAC)
Input Impedance: 10MΩ.
Max. Input Voltage: 750V (AC, virtual value)
Frequency range: from 40Hz to 400Hz.
Display: Virtual value of the sine wave
Range Accuracy Resolution
4.000V 1mV
±1%±3 digits
40.00V 10mV
400.0V
100mV
Direct Current (DC):
Range Accuracy Resolution
40.00mA ±1%±1 digit 10uA
300.0mA ±1.5%±1 digit 100uA
20A (with adaptor) ±3%±3 digits 10mA
Alternating Current (AC):
Range
Accuracy Resolution
40.00mA ±1.5%±3 digits 10uA
300.0mA ±2%±1 digit 100uA
20A (with adaptor) ±5%±3 digits 10mA
49
MS400 Version 2.0 – December 2007
Page 50

Resistance
Range Accuracy Resolution
400.0 Ω ±1%±3 digits 0.1Ω
4.000KΩ 1Ω
±1%±1 digit
40.00KΩ 10Ω
400.0KΩ 100Ω
4.000MΩ
1KΩ
40.00MΩ ±1.5%±1 digit 10KΩ
Capacitance
Range Accuracy Resolution
51.20nF 10pF
±3%±3 digits
512.0nF 100pF
5.120uF 1nF
51.20uF 10nF
100uF
100nF
Diode
Voltage reading: 0 V ~1.5 V.
Continuity Test
A beep will sound when the resistance is less than 30Ω
General Specifications
Mechanical dimension 18 cm×11.5cm×4cm
Weight 645 g
Power consumption <6 W
Display type 3.8" color liquid crystal display
Display resolution 320 (horizontal) ×240 (vertical) pixels
Display color 4096 colors
Power Adapter:
Power supply 100-240 V AC (50/60Hz)
Power output 8.5 VDC
Current output 1500 mA
Ambient Temperature and Relative Humidity:
Temperature (Operational) and Relative Humidity %:
0 to 10°C (32 to 50°F) no condensation
10 to 30°C (50 to 86°F) 95 %
30 to 40°C (86 to 104°F) 75 %
40 to 50 °C (104 to 122°F) 45 %
Temperature (storage) and Relative Humidity %:
-20 to +60°C (-4 to +140°F) no condensation
50
MS400 Version 2.0 – December 2007
Page 51

Appendix B: Maintenance and Cleaning
Common Maintenance
Do not store or place the instrument in locations where the liquid crystal display (LCD)
may be exposed to direct sunlight for long periods of time.
In order to avoid damaging the instrument or the probe, do not expose to liquids or
solvent agents.
Cleaning:
Inspect the instrument and the probe frequently in accordance with the product’s
operating manual. Clean the outer surface of the instrument according to the following
steps:
1. Wipe off obvious dust on the outside of the instrument and on the probe with a soft,
clean cloth. When cleaning the LCD do not scuff the transparent LCD protective
screen.
2. Wipe the instrument clean while it is in its power off status. Use a soft cloth that is
moistened but not dripping wet. The instrument may be cleaned with mild detergent
and fresh water. To prevent damage to the instrument or to the probe do not use
abrasive chemicals, strong detergents or cleansers to clean the product.
Warning: Before powering and starting the product, please confirm that the
instrument has completely dried so as to avoid electrical short circuit and personal injury.
Storing the Oscilloscope
If the oscilloscope is to be stored for a long time, the lithium battery must be fully charged
before storage.
Charging the Oscilloscope
The lithium battery may not arrive fully charged when it is first received by the customer.
To properly charge the battery, it must be charged for 4 hours (the oscilloscope must be
turned off during charging). The battery can supply power for 4 hours after being charged
completely. When utilizing battery power, a battery charge indicator is displayed on the
top of the screen to show the battery’s remaining power level. The symbols that may
appear include
minutes. To charge the battery and power the instrument, connect the oscilloscope using
a power adapter according to Figure 2 to charge the battery. The charging speed can be
increased by turning off the oscilloscope.
Notice: To avoid overheating the battery during charging, the environmental temperature
should not exceed the temperatures listed in the technical Specifications section.
Note: Once the battery is fully charged, the charger will automatically switch itself to a
slower charging rate, thus eliminating the need to turn off the charger at the time the
battery is fully charged.
, , and , where shows that the battery can only be used for about 5
Replacing the Lithium Battery Unit
It is usually not required to replace the battery unit. But when it is required to be replaced
only qualified personnel should carry out this operation and the battery should be
replaced with the same specified lithium battery.
51
MS400 Version 2.0 – December 2007
 Loading...