

Page 1
DL150 Software Instructions
The DL150 USB software is a program for downloading stored data from the DL150 when it is
connected to a PC or notebook computer. The data may be displayed graphically or as a data list
in Excel or similar programs. The major functions are all listed in the main window.
The maximum storage capability is 100,096 data points.
System Required:
Windows 2000 or Windows XP or Vista
Minimum Hardware Required:
PC or NoteBook with Pentium 90MHz or higher 32 MB RAM ;
At least 7 MB byte hard disk space available to install Datalogger USB software.
Recommended display resolution 1024X768 with High Color(16 bit).
Page 2

Main Menu
File
Save-Save the recorded data to the disk.
Open-Open a saved file.
Print Setup-Change the printer and printing options.
Print Preview-Print preview the graph or the list.
Print-Print the graph or the list.
Instrument
Correct Time-Correct the DATA LOGGER TIME.
Datalogger Setup-Setup the DATA LOGGER Recording Mode, Normal/Peak samprate, Auto
Power off, Logging method and CAP Detection Level.
Download Data-Download data from the DATALOGGER .
Import Data To List.
Previous Measurement-Import the previous measurement data.
Window
Instrument-Show or hide the instrument window.
Info Dialog-Show or hide the info dialog window.
Help
About-Show the version information of the Datalogger Software.
Help Topics-Show the software help document.
Page 3
Operation
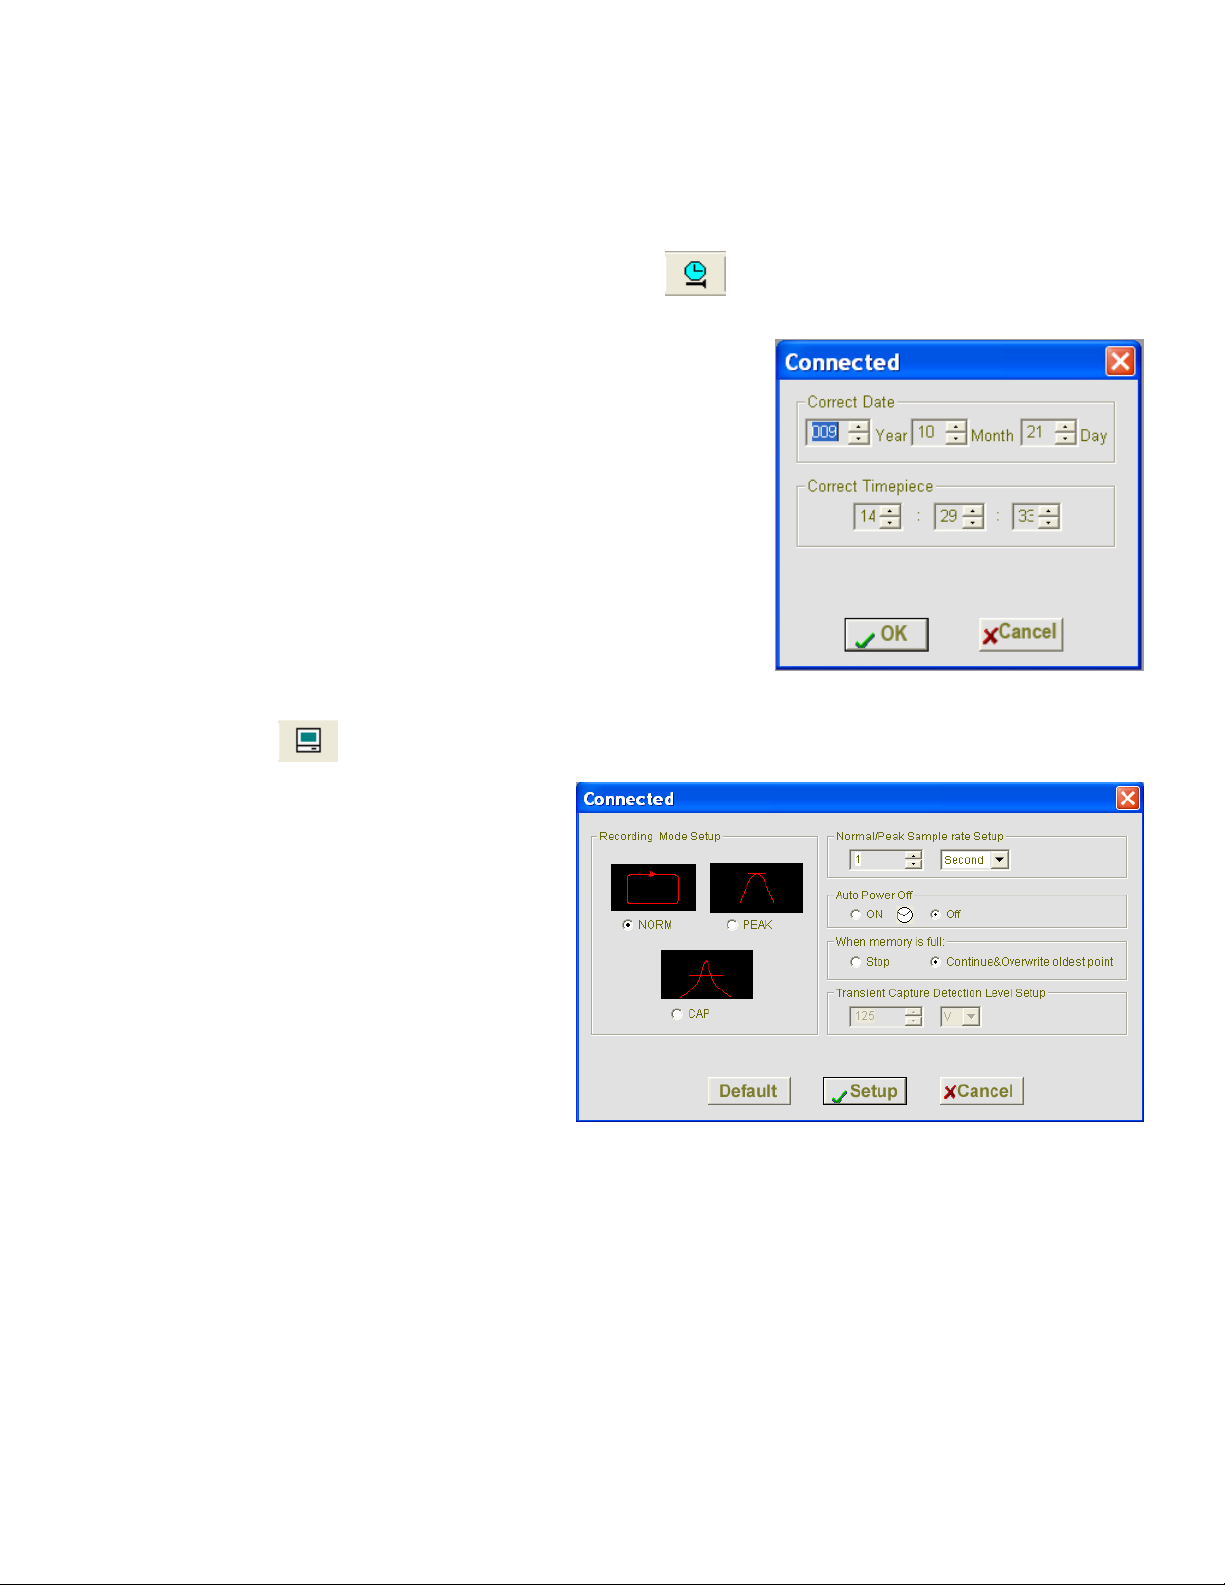
Correct Time
If the DATA LOGGER time is not correct, click the icon to open the Date and Time Dialog:
Input the correct date and time and then click the “OK” button.
The DATA LOGGER time will update.
Datalogger Setup
Click on the icon on the menu bar. The Setup window will appear.
The LOGGER recording mode can be set as
NORM, PEAK or CAP.
The Normal/Peak Sample rate Setup field
instructs the DATA LOGGER to log readings
at a specific rate. Input the desired rate in the
boxes.
This function is available at NORM and
PEAK mode.
Select Auto Power OFF ON or OFF.
When memory is full selection sets the
datalogger to either stop when the memory is
full or to continue logging by overwriting the
oldest data.
Transient Capture Detection Level Setup. Enter the unit (A or V) and desired level in the boxes. The
datalogger will record only when this level is exceeded. This function is only available at CAP mode.
Click on the SETUP button to save changes. Press the DEFAULT button to set the Logger to factory default
condition. Press the CANCEL button to abort the setup.
Notes: Any stored data will be permanently erased when Setup is finished. To save data before it is
lost, click Cancel and then download the data.
Page 4

Datalogger Download
To transfer the readings stored in the Logger to the PC:
1. Connect the DATA LOGGER to the same USB port used when the DATALOGGER was
initialized.
2. Open the Datalogger software program if it is not still running
3. Click the Download icon .
4. The Window shown below will appear. Press DOWNLOAD to begin transferring readings.
If readings are successfully transferred the Data graph window will appear.
The top field show detail infomation of the readings(REC MODE ,SAMPLING RATE, START
TIME,DATANO,CAP Detection Level, Record Max data,Min data),
Page 5
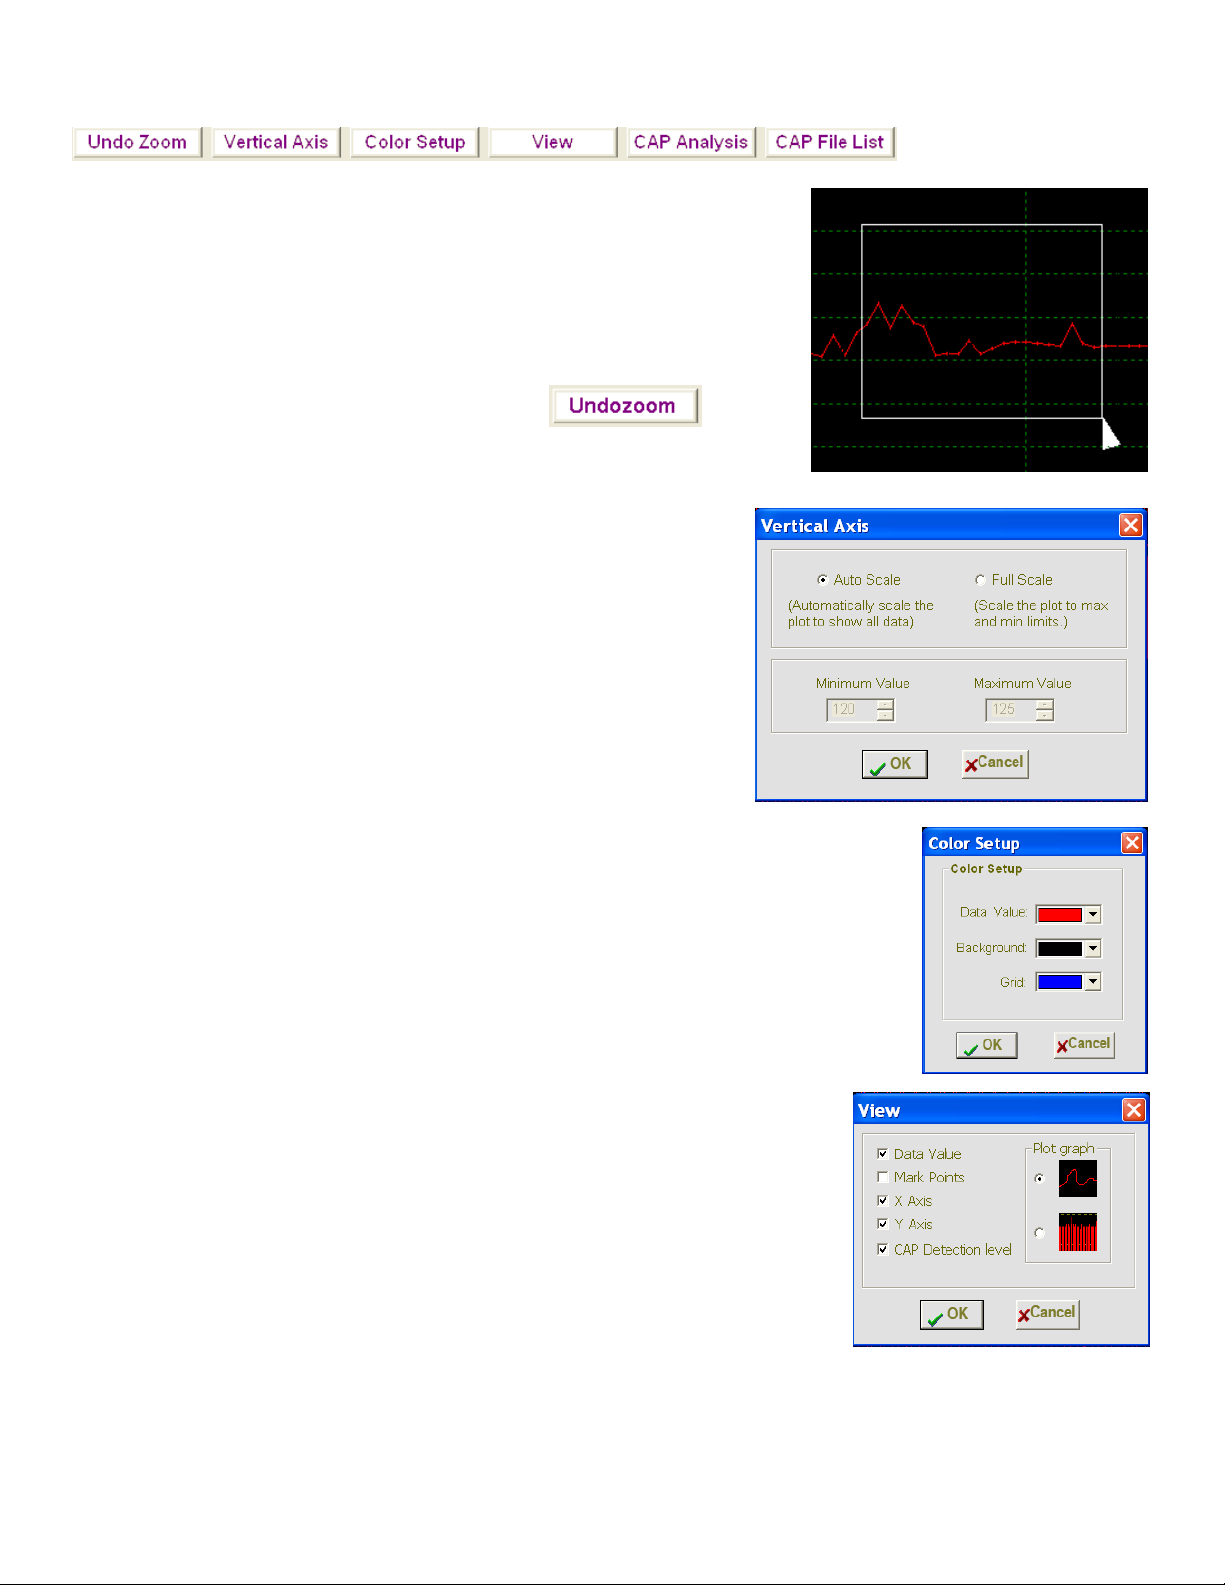
Data Graph Menu
Zoom in:
1. Press the left mouse button and drag a rectangle around the
area to be expanded.
2. Release the mouse button.
3. Use the horizontal scrollbar to scroll through all the data.
4. Use the left vertical scrollbar to scroll through the data point.
Zoom out: Zoom out to full view by clicking
Vertical Axis:
1. Select Auto Scale or Full Scale.
2. For Full Scale, enter the Minimum and Maximum values
3. Click OK
Color Setup:
Setup the data value color, background color and grid color.
View:
1. Select items to display including, Data plot, Data points marked,
Axis and Cap set level
2. Plot as a line or bar graph
Page 6

CAP Analysis:
Analysis the time, frequency, RMS value and the
Vp-p of the wave. This function is only available in
the CAP mode.
1. Select the Vertical cursor and click the right
mouse button on the graph, the dialog will show
the T, F, RMS and the Vp-p of this file wave
graph.
2. Select the Horizontal cursor and click the right
mouse button on the graph, the panel will show
the specific data value at the cursor.
Cap File List:
Get the file list of the wave graph.
Click any item in the list to get the wave graph
of this file.
Page 7

Import data to list
Click the list icon to display data as a list with
time.
File save and open
1. Click the icon to open the file save dialog box.
3. Name the file and save it with the default “.avdata” extension.
The file will be saved with this extension to be reopened in the
Datalogger software program and also as a “.xls”file to be
opened in Excel or other word processing program.
4. Click on the icon to open and view an existing data file in
the data graph window. When prompted, select a “. avdata” file saved earlier.
Print graph and list
Click the icon to print the graph.
Click the icon to import data to a list,then click to print the list
 Loading...