

Page 1
The
P
al
m
ar researc
h
rogram Manu
By Dr. Claudio Klein
X−ray Research G.m.b.H. Tel.: (+49) (40) 529−884−0
Segeberger Chaussee 34 Fax: (+49) (40) 529−884−20
D−22850 Norderstedt Mail: info@marresearch.com
Germany Web: www.marresearch.com
Page 2

m
ar345 Program Manual 2
_
_
h
r
y
P
is
a
m
____________________________________________________________________________________
The mar345 Program Manual
Version 2.0
February 24, 2000
Written by Dr. Claudio Klein
Copyright 2000 X−Ray Research G.m.b.H.
All Rights Reserved.
This document contains proprietary and confidential information of X−ray Researc
G.m.b.H.. The contents of this document may not be disclosed to third parties, copied o
duplicated in any form, in whole or in part, without the prior written consent of X−ra
Research G.m.b.H..
ossession, use, or copying of the software described in this publication
uthorized only pursuant to a valid written license from X−ray Research G.m.b.H.
arresearch and the marresearch logo are registered trademarks of X−ray Research
G.m.b.H..
Page 3

m
ar345 Program Manual 3
_
_
A
____________________________________________________________________________________
Contents
1 Introduction 4
1.1 Computer Requirements 4
1.2 Environment 4
2 Running mar345 5
2.1 Command Line 5
2.2 Input Files 6
2.3 Output Files 6
2.4 Basic Concept and Rules 7
2.5 Starting Up 8
3 User Interface 9
3.1 Main Window 9
3.2 Menu Bar 10
3.3 Scanner Status Area 11
3.4 Scanner Command Area 12
3.5 Editing Data Collection Parameters 13
3.6 Loading and Saving Data Collection Parameters 17
3.7 Moving Distance and Phi 18
3.8 Starting Data Collection 19
3.9 Stopping Data Collection 19
3.10 Single Scan 20
3.11 Shutter Timer 20
3.12 Getting Help 21
3.13 Hardware Status 21
3.14 X−ray Setup 22
3.15 Errors and Warningsp 23
4 Image Display 24
4.1 Display Window 24
4.2 Menu Bar 25
4.3 Image Area 27
4.4 Workr Area 29
4.5 Information Areas 29
4.6 Window Title 30
4.7 Colors Window 30
4.8 Cross−Section Window 32
5 Data Collection 34
5.1 Strategies 34
5.2 Checking Parameters 35
5.3 Warnings and Errors 35
5.4 End of Data Collection 35
6 Troubleshooting 36
ppendix 39
A Configuration File 39
B Calibration Files 40
Page 4

m
_
_
1
d
g
1
1
e
n
G
ar345 Program Manual 4
____________________________________________________________________________________
. Introduction
The program mar345 is a fully menu driven graphical user interface (GUI) for collecting an
displaying images on a mar345 imaging plate system.
The program is provided as binary executable for several computer platforms and operatin
systems:
− Silicon Graphics: IRIX 5.x, 6.x
− Digital: Compaq Tru Unix 4.x, 5.x
− Linux: RedHat 5.x, 6.x, SuSE 6.x
.1 Computer Requirements
− Motif 1.2.x shared libraries (except Linux).
− 8/16/24/32−bit colors X−windows terminal with 1280x1024 pixels.
− Standard Helvetica and Symbol fonts.
− 96 MB RAM memory or more.
.2 Environment
The program relies on definitions of the following environment variables:
− MARTABLEDIR Location of the scanner specific calibration files mar2300.XXX
and mar3450.XXX and the corresponding configuration file
config.XXX (where XXX = MAR_SCANNER_NO ).
− MAR_SCANNER_NO Three digit serial number, e.g. 049.
− MARLOGDIR Location of the log output files.
− MARHELPDIR Location of interactive help files.
The program relies on the correct network setup, i.e. the mar345 scanner must be accessibl
by ping and telnet with IP−address 192.0.2.1.
For a description of the setup of the mar345 software suite, see the "mar345 Installatio
uide".
Page 5

m
_
_
2
2
−
−
−
−
−
−
−
−
−
ar345 Program Manual 5
____________________________________________________________________________________
. Running mar345
.1 Command Line
The program mar345 should be started by just typing "mar345". The program, however,
understands the following command line options:
mar345 [−h] [−colors N] [−def XXXX] [−host HOST] [−keep]
[−more N] [−noxf] [−port PORT] [−setd]
The command line options are:
h Print a usage summary
colors N Use N colors for drawing images.
Default: take N from configuration file.
def XXXX When starting the program, go to scanmode XXXX where
XXXX is 1200, 1600, 1800, 2000, 2300, 2400, 3000 or 3450.
Default: stay in current scan mode.
host HOST Connect to host HOST.
Default: take HOST from configuration file (usually 192.0.2.1)
keep Spiral images will be saved on disk.
Default: do not produce spiral files, only transformed images.
more N Log output level with N=0, 1, 2 or 3.
Use more > 0 only in case of hardware problems.
Default: N=0 (compact output)
noxf Spiral images will not be transformed into Cartesian images.
The program then requires much less memory, but images
cannot be displayed.
Default: Do transform spiral images.
port PORT Connect to host HOST via socket port PORT.
Default: take PORT from configuration file (usually 4441)
setd The user may redefine the distance detector to crystal from
within the program.
Default: Redefining the distance is disallowed..
Page 6

m
ar345 Program Manual 6
_
_
2
a
m
,
b
r
g
le
c
le
is
f
d
is
2
s
o
f
y
t
g
s
n
____________________________________________________________________________________
.2 Input Files
The program mar345 requires the following input files to work properly:
) $MARLOGDIR/mar345.dat
The program continuously saves edited parameters into this file. It is nice to find the progra
in the same state where you left it at startup. However, if mar345.dat cannot be found
program defaults will be used.
) $MARTABLEDIR/config.XXX
XXX is a 3−digit serial number. This file contains essential scanner specific information. Fo
the scanner to produce valid data it is essential to have this file with all entries correspondin
to valid parameters for the scanner. The program mar345 will use program defaults if this fi
is not available.
) $MARTABLEDIR/mar2300.XXX
XXX is a 3−digit serial number. This file contains flat−field corrections and the geometry tab
for transforming spiral images into Cartesian images for all scans at 0.15 mm pixelsize. Th
file is scanner−specific and required to do scans in 0.15 mm pixel modes. The typical size o
this file is 73 MB.
) $MARTABLEDIR/ma3450.XXX
Same as mar23000.XXX but used for all scans at 0.10 mm pixelsize. The typical size of th
file is 103 MB.
See Appendix A and B for more information about input files.
.3 Output Files
The program mar345 writes all relevant messages to standard output but it also produce
several types of log files, depending on the configuration. Since log files can be important t
look at in case of software or hardware problems, the program creates different versions o
log files named:
1.) $MARLOGDIR/log/mar.log.X (always)
2.) $MARLOGDIR/spy/mar.spy.X (configuration file entry: USE SPY)
3.) $MARLOGDIR/lp/mar.lp.X (configuration file entry: USE STATS)
where X is a number running from 1 to 99. All log files reside in the subdirectory assigend b
the logical variable MARLOGDIR. In this directory, there is also a file called "last.log" tha
contains only the version number of the latest (i.e. current) log file and a soft link of mar.lo
to the latest mar.log.X file in subdirectory log. Accordingly, soft links are also set to file
mar.spy and mar.lp if configured..Up to 99 copies of the log files will be kept and the
cyclically overwritten.
Page 7

m
ar345 Program Manual 7
_
_
t
2
st
st
e
y,
m
s
n
a
t
,
____________________________________________________________________________________
The contents of the different types of log files are as follows:
1.) mar.log: All messages on the terminal output.
2.) mar.spy: Native mar345 controller messages.
These messages become very important in case of hardware
problems. Therefore, USE SPY should always be set.
Note, that these files can become very large in size, so sufficien
disk space should be available in $MARLOGDIR (up to
100 MB in total).
3.) mar.lp: Some image statistics like minimum, maximum and average
intensity. Normally, these values are not of much interest, so
USE STATS should rather be the exception.
.4 Basic Concepts and Rules
The program has to perform different tasks:
− Allow user input (i.e. change data collection parameters, analyze images, etc.)
− Send commands to the scanner.
− Receive information from the scanner
− Transform spiral images into Cartesian images.
− Display transformed images.
User input is done via the graphical user interface (see chapter 3).
Communication with the scanner is realized through an Ethernet interface. Usually, the ho
computer features a dedicated Ethernet card for communicating with the scanner. Ho
computer and scanner are linked via a so called "cross−over cable", i.e. a special RJ−45 typ
cable that allows for directly connecting 2 computers without the need of a hub.
Transformation and data display requires some memory as well as CPU−time. Typicall
ar345 keeps the equivalent of 2.5 images in memory. When using 3450x3450 pixel image
this corresponds to 75 MB.
Data collection should always have highest priority. However, there is no real protectio
against abuse of the computer by other processes. In particular, memory consuming dat
processing jobs can cause drops in performance of the workstation to such a degree tha
nothing else will work. Also network I/O can severly degrade the host computer performance
e.g. when processing data across NFS−mounted disks!
Page 8

m
ar345 Program Manual 8
_
_
2
in
d
u
u
o
rk
0
e
o
ly
rt
n
____________________________________________________________________________________
.5 Starting Up
Create a new window for running the program and type: "mar345". Do not run the program
the background and do not use this window for other purposes. The program will sen
important output to the window and you don’t want to miss it.
At start up, the program will tell you something like:
=============================================================
Program : mar345
Version : 2.0.8 (Feb 16 2000)
Scanner no. : 049
Scanner mode: 345 mm @ 0.15 mm
Started on : Wed Feb 16 15:09:08 2000
LOG file is: /home/mar345/log/log/mar.log.58
SPY file is: /home/mar345/log/spy/mar.spy.58
STAT file is: /home/mar345/log/lp/mar.lp.58
=============================================================
It will also tell you if it is able to talk to the scanner. If environment variables are not set yo
will be notified. Next, three windows will be created and automatically placed on the screen:
a startup window, the mar345 main window and an empty image display window.
If the scanner is not turned on at all, by invoking program mar345 on the command line, yo
will not get any feed back. This is because the program tries to open a network connection t
the scanner and the program will sit there and wait until the scanner starts talking to it.
When the scanner is turned on, the scanner controller will start very quickly basic netwo
services, so a ping to the address of the scanner (usually 192.0.2.1) will work within 1
seconds after turning the scanner on. However, before starting communication with th
program mar345, the scanner must do first some initialization, i.e. drive the scanning head t
its default position (scan mode 2300) and lock the plate. Only when the plate is successful
locked ("cling!") program mar345 can start talking to the scanner. You may, however, sta
the program first and then turn on the scanner. The program really waits until a connectio
can be established.
Page 9
m
ar345 Program Manual 9
_
_
3
3
M
r
S
a
S
a
C
u
P
r
S
s
T
t
C
e
____________________________________________________________________________________
. User Interface
enu Ba
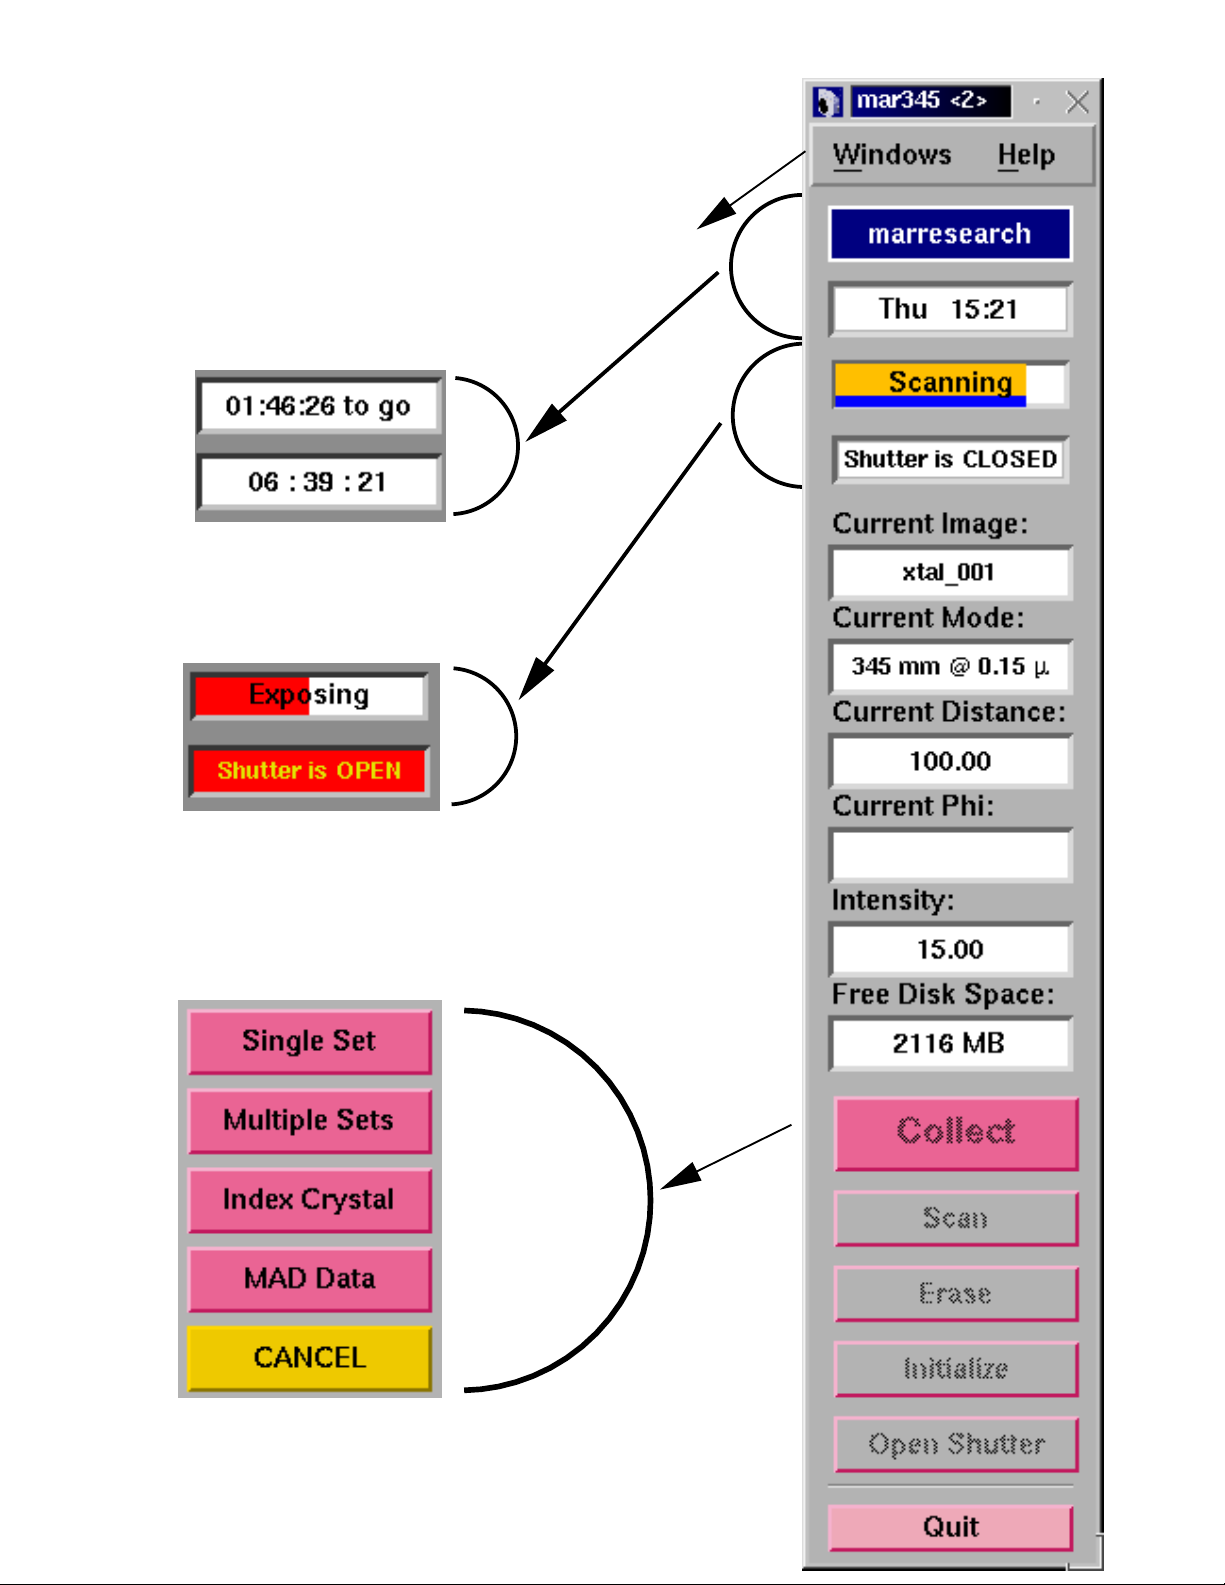
.1 Main Window
ime until End of Data Se
urrent Tim
rogress Ba
hutter Statu
ollect Men
canner Status Are
canner Command Are
Page 10
m
ar345 Program Manual 1 0
_
_
:
3
W
H
3
D
P
X
S
L
H
S
E
____________________________________________________________________________________
The main window controls the most important scanner functions. It consists of different areas
− a menu bar
− the scanner status area
− the scanner command area
.2 Menu Bar
The menu bar features two buttons:
indows Pops up the Windows submenu (3.2.1).
Shortcut: Alt+w.
elp Pops up the mar345−Help window.
Shortcut: F5.
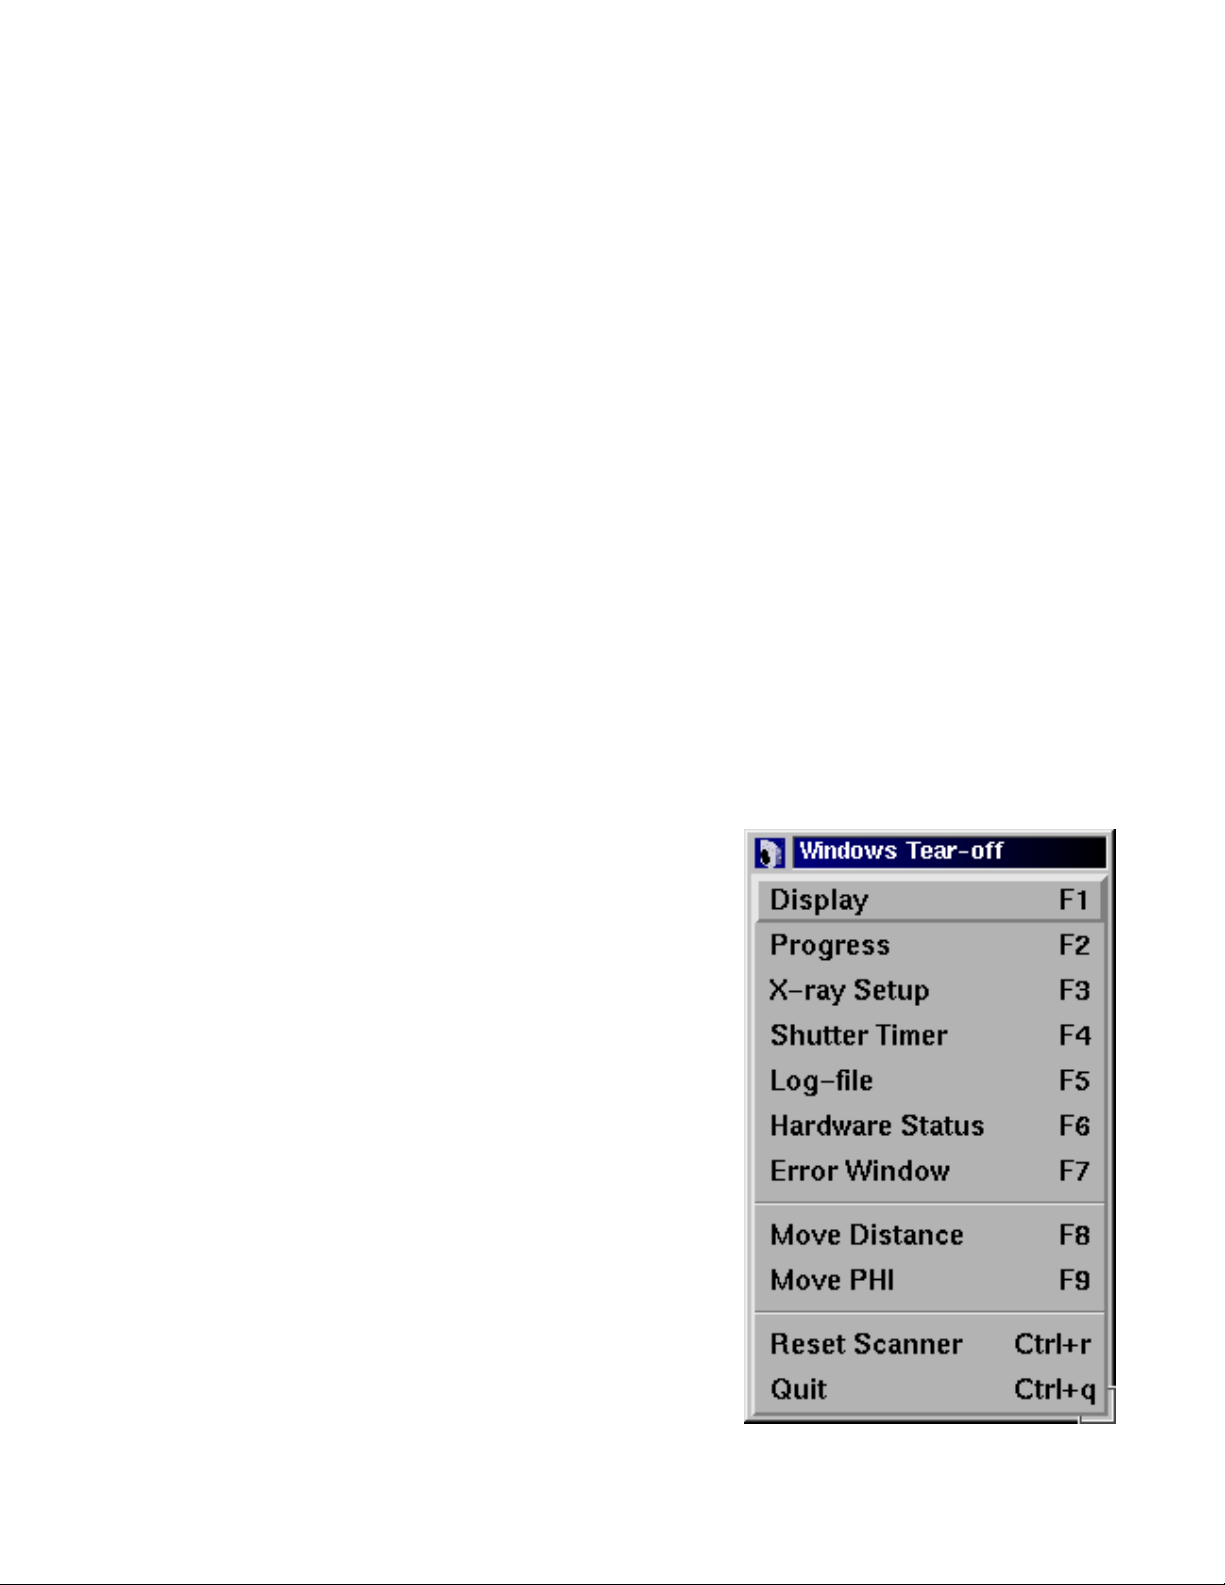
.2.1 Windows Submenu
The Windows submenu pops up if the "Windows" button
in the menu bar was pressed or if "Alt+w" was pressed
while the pointer was in the main window.
The Windows submenu features the following buttons:
isplay Pops up the mar 345−Display window.
Shortcut: F1.
rogress Pops up the mar345−Progress window.
Shortcut: F2.
−ray Setup Pops up the mar345−Setup window.
Shortcut: F3.
hutter Timer Pops up the mar345−Shutter Timer
window. Shortcut: F4.
og−file Pops up the mar345−Help window and
displays the current log file. Shortcut: F5.
ardware Pops up the mar345−Hardware Status
tatus window. Shortcut: F6.
rror Window Pops up the mar345−Error window and
displays the current errors. Shortcut: F7.
Page 11

m
ar345 Program Manual 1 1
_
_
M
M
R
Q
3
e
r
I
m
T
C
P
S
C
C
C
C
I
F
a
____________________________________________________________________________________
ove Distance Pops up the mar345−Distance window. Shortcut: F8.
ove Phi Pops up the mar345−Phi window. Shortcut: F9.
eset Scanner Reboots the scanner reboot. Shortcut: Ctrl+r.
uit Quits program. Shortcut: Ctrl+q.
.3 Scanner Status Area
The status area provides at all times all necessary information about the current status of th
scanner.This part of the user interface changes dynamically according to the current scanne
operation. It features the following items:
_______________________________________________________________________
tem Description
________________________________________________________________________
arresearch / During data collection, this field shows the time it takes
ime until End to finish all active or queued data sets.
urrent Time Displays local computer time.
rogress Bar If the scanner is performing an operation, the progress of this
operation will be displayed with a colored progress bar and
an appropriate text string.
hutter Status Shows the state of the local X−ray beam shutter (open or
closed).
urrent Image Shows the name of the current image leaving out the
directory and file name extension.
urrent Mode Shows the current scanmode of the scanner.
urrent Distance Shows the current distance of detector to crystal.
urrent Phi Shows the current position of the PHI axis.
ntensity Displays the current intensity reading of the selected
ionization chamber.
ree disk space Shows how many MB of disk space are available on the
disk where the current image will be written to.
________________________________________________________________________
Under normal conditions, the program retrieves status information from the scanner once
second. The time and the free disk space will be updated less frequently.
Page 12

m
_
_
N
y
r
e
3
r
rs
B
C
S
E
I
d
e
O
S
M
I
M
C
ar345 Program Manual 1 2
____________________________________________________________________________________
ote: Timing is a crucial issue when operating the scanner. If the computer is very bus
doing other computations, the internal clock of the program will work slower. A good check fo
excessive computer activity is if the X−windows server is not able to repaint the user interac
at a reasonable speed.
.4 Scanner Command Area
The buttons in the command area can be used to send commands directly to the scanner o
to pop up further windows, i.e. the mar345−Scan and mar345−Change Paramete
windows. The functions of the individual buttons are:
_______________________________________________________________________
utton Description
________________________________________________________________________
ollect Changes layout of the button choices, i.e. the Collect Menu buttons are
displayed.
can Pops up the mar345−Scan window.
rase Immediately starts to erase the imaging plate. Erasing is identical to doing
a scan, but no data are taken.
nitialize The scanner will move to its distance reference position (usually at the far en
of the translation stage). This distance initialization may have to be done if th
scanner looses the information about the distance for some reasons. The re−
ference positions are taken from the configuration file. The detector move−
ment has to be confirmed.
The configuration file will be reread when pressing this button.
pen Shutter Opens (or closes) the local X−ray beam shutter.
________________________________________________________________________
And in the Collect Menu there are:
________________________________________________________________________
ingle Set Pops up the mar345−Change Parameters window for programming
a single data set.
ultiple Sets Pops up the mar345−Change Parameters window for programming
up to 64 data sets.
ndex Crystal Pops up the mar345−Change Parameters window for programming
a small number of images to be used for indexing a crystal.
AD Data Pops up the mar345−Change Parameters window for programming
a data collection typical for anomalous and/or MAD data.
ancel Returns to the original layout.
________________________________________________________________________
Page 13

m
_
_
3
ar345 Program Manual 1 3
____________________________________________________________________________________
.5 Editing Data Collection Parameters
Page 14

m
_
_
e
ct
M
−
ll
e
I
.
ll
y
n
M
r
f
I
T
D
I
S
O
C
ar345 Program Manual 1 4
____________________________________________________________________________________
The Change Parameters window is used to program data collection parameters. Th
window comes in 4 slightly different flavours, depending on the button choice in the Colle
enu:
− Single Data Set
− Multiple Data Sets
− Index Crystal
MAD Data
The difference is, that in Multiple Data Sets one can program up to 64 data sets with the fu
range of parameters. The amount of data sets that are offered for programming can b
controlled by the configuration file (entry SETS).
ndex Crystal is a special way of collecting data with a ϕ movement inbetween each image
This ϕ movement is denominated "ϕ increment" and serves the purpose to collect a sma
number of images at different positions in ϕ.To collect 2 images that are 90 degrees awa
from eachother with a ϕ oscillation of 1.0 degree for each image one will have to give a
increment of 89.0 degrees.
AD Data is a special way of collecting data with anomalous signals. In this mode, a numbe
of images is collected, then the ϕ axis moves forward and collects the same number o
images in the equivalent position 180 degrees away.
Otherwise the items displayed in the window are as follows:
_______________________________________________________________________
tem Description
________________________________________________________________________
itle Single Data Set, Multiple Data Sets or Index Crystal.
irectory Directory where the images will be written to.
mage root Name root of image files.
can mode Choice of image plate diameter to be scanned (345, 300,
240 or 180mm) and pixelsize used (0.1mm or 0.15mm)
utput format Usually only 1 choice: mar345. This format features a very
efficient image compression that requires approx. 70% less
disk space than uncompressed data.
ollect mode Time controlled or X−ray dose controlled ϕ movement.
The latter one should be used on X−ray sources with variable
X−ray flux (synchrotrons).
________________________________________________________________________
Page 15

m
ar345 Program Manual 1 5
_
_
I
F
N
E
O
S
D
n
−
).
e
____________________________________________________________________________________
Table continued from previous page.
_______________________________________________________________________
tem Description
________________________________________________________________________
irst image no. Image number of first image. Range is 1 through 999.
o. of images Number of images to be collected. Range is 1 through 999.
xp. time Exposure time in seconds. In DOSE mode, the actual time
may be different from the desired exposure time.
scillations Number of ϕ−oscillations per image. One oscillation is
stronlgy recommended for exposure times < 15 min.
∆ϕper image ϕmovement per image.
tarting ϕϕposition to start data collection.
istance Distance crystal to detector.
________________________________________________________________________
For convenience, the program calculates the maximum resolution possible from the chose
distance and the chosen scan mode (image plate diameter).
The image names are created according to the following convention:
directory / root_TYPE_XXX.extension
− TYPE is:
not used in Single Data Set mode e.g. /images/zeo_001.mar1200
1, 2, 3 or 4 in Multiple Data Set mode e.g. /images/zeo_1_001.mar1200
INDEX in Index Crystal mode e.g. /images/zeo_INDEX_001.mar1200
A or B in MAD Data mode e.g. /images/zeo_A_001.mar1200
XXX is a three digit image number like 027,
− extension is:mar1200, mar1600, mar1800, mar2000, mar2300, mar2400, mar3000 or
mar345 for Output format "mar345", depending on the Scan mode chosen.
In Index Crystal mode "First image number" is replaced by "
The starting image will always be 001 and the following images will have numbers that will b
calculated from their ϕ−position relative to image number 001 according to:
e.g. with
XXX=i*
ϕ increment = 90.0 and ∆ϕ= 2.0, XXX = 1, 46, 91, 136, etc.
ϕ increment / ∆ϕ+ 1 (i=0,1,2,3...)
ϕ increment" (see above
Page 16

m
ar345 Program Manual 1 6
_
_
g
f
y.
r
s
s
p
.
:
g
e
"
e
g
N
e
N
e
w
e
is
____________________________________________________________________________________
In MAD Data mode "No. of images" is replaced by "No. of ϕ blocks" and a field for enterin
the number of images per ϕ block. It is supposed that one wants to collect a number o
contiguous images at a certain position and then the same wedge of data 180 degrees awa
It is not such a good idea to collect only single images at one ϕ position since the detecto
will have to move ϕ very often and that takes time. Finally one ends up with 2 contiguou
data sets A and B, both covering the same ϕ range but differing by 180 degrees.
For your convenience all text fields are followed by a menu with preset values. The menu
can be activated by using the left mouse button. Most of the option menus are followed by u
and down arrows that will increment or decrement the currently displayed values by one unit
In Multiple Data Set mode, the following buttons are added underneath the"Distance" field
You may toggle between different data set parameters by pressing the correspondin
"Selected Set" button. The currently selected set will be highlighted and the title string at th
top of the window will also tell you which of the sets you are programming.
Even if you have edited one of the data sets, you don’t actually have to use it. The "Status
of a programmed data set can be set to "Use" (green) or "Skip" (red). Default is: "Skip".
When more than 4 programmable data sets are configured (entry "SETS" in th
configuration file) one may move forwards and backwards to the next or previous 4 sets usin
the >> and << buttons, respectively.
ote 1:
All changes are saved automatically to file mar345.dat in directory MARLOGDIR and ar
available the next time mar345 is used.
ote 2 (synchrotons only):
Since wavelength varies on synchrotron sources, the configuration file should contain th
keyword:
avelength variable
In this case, there is an additional input field for the used wavelength underneath th
"Distance" field. Make sure that the correct wavelength is entered, since this information
written into image headers and programs like marView rely on it!
Page 17

m
ar345 Program Manual 1 7
_
_
3
.
al
e
d
y
ill
ry
e
e
e
m
rs
y
e
"
____________________________________________________________________________________
.6 Loading and Saving Data Collection Parameters
Crystallographers often collect data of a certain crystal type in always the same way, i.e
using a certain oscillation range, a certain distance, etc.It is therefore useful to store a typic
set of data collection parameters to a file and retrieve the parameters when desired. To sav
parameters, press the "Save" button in the mar345−Change Parameters window.
One now has the choice of saving
only some sets of programme
parameters or all of them. B
default, the files to be saved w
be written into directo
$MARLOGDIR/sets. The filenam
will always be File_root.set.
To retrieve parameters, press th
"Load" button in th
ar345−Change Paramete
window. Select a file b
double−clicking or by pressing th
Load" button.
Page 18

m
ar345 Program Manual 1 8
_
_
3
e
m
"
e
in
g
t"
r
e
e
n
.
____________________________________________________________________________________
.7 Moving Distance and Phi
The detector position and the ϕ axis can be moved by pressing buttons in th
ar345−Change Parameters window. One can also get separate windows for moving "ϕ
and "Distance" by pressing the corresponding status fields in the scanner status area of th
main window and/or by activating the corresponding choices in the menubar of the ma
window. "Starting ϕ" and "Distance" are both followed by two additional buttons. Pressin
"Move" will tell the scanner to move the detector or the motor to the desired position. "Se
will redefine the currently known value. This can be dangerous in case of the detecto
movement, so for the distance this button works only if the program has been started with th
command line argument "−setd".
In any case, confirmation of the desired action is required. If you really want to mov
Distance or ϕ , the mar345−Stop window pops up and stays on the screen until the actio
has finished. During this time you are not allowed to make any further input to the program
The only possible action is pressing the "Stop" button in the mar345−Stop window.
Page 19

m
ar345 Program Manual 1 9
_
_
3
e
m
st
e
m
ly
t
M
B
c
D
c
a
.
u
r
w
3
y
e
g
e
____________________________________________________________________________________
.8 Starting Data Collection
Data collection can be started by pressing the "Go"or"Go/Erase first" button in th
ar345−Change Parameters window. It is a good idea to always let the plate clean fir
before actually starting the data collection.
In Multiple Data Sets mode, before actually sending the command to the scanner th
ar345−Run Parameters window will pop up. This window gives an overview ofthe current
programmed data sets. The buttons in the lower part of the window come with differen
layouts:
_______________________________________________________________________
ode Left Center Right
________________________________________________________________________
efore data "Go" "Change" "Close"
ollection really start reedit parameters Close window
uring data "Abort NOW" "Stop AFTER IMAGE" Close
ollection Aborts exposure Stops after current image Close window
________________________________________________________________________
To start data collection you will have to press the "Go" button in this window. During dat
collection the mar345−Run Parameters window monitors the progress of the data collection
The window can be opened by selecting the "Progress" option in the "Windows" submen
(see 3.2.1). Active data sets are highlighted. Start−ϕ and Image will be updated. The numbe
of oscillations is given by the multiplier in the ∆ϕfield. If the scanner is idle, this windo
cannot be obtained.
.9 Stopping Data Collection
Data collection can be stopped by pressing the "Stop" button in the main window or b
pressing the "Stop"or"Abort" button in the mar345−Run Parameters window. If th
scanner is scanning or erasing the imaging plate, this cycle will always be finished. Pressin
"Abort" in this moment will be the same as pressing "Stop". Otherwise, "Abort" closes th
X−ray beam shutter immediately and stops ϕ or distance movement.
Page 20

m
_
_
3
e
m
e
A
e
3
e
w
t:
F
g
ar345 Program Manual 2 0
____________________________________________________________________________________
.10 Single Scan
A single scan can be done by pressing the "Scan" button in the main window. Th
ar345−Scan window pops up. The directory, image root, image number and scan mod
can be selected. The output format always is "mar345". Press "Scan" to start the scan
scan is always followed by an erase. Instead of a scan one can do an erase cycle. "Chang
Mode" only drives the scanning head to the desired position.
.11 Shutter Timer
The X−ray beam shutter can be operated manually, although normally there should not b
any requirement to do this. When operating the shutter manually it can be useful to know ho
long time the shutter is open. When opening the mar345−Shutter Timer window (shortcu
4) the program starts counting how long time the shutter is open. One may enter a closin
time (in seconds). When this time period has elapsed, the shutter closes automatically.
Page 21

m
_
_
3
y
e
y
lp
m
3
s
e
g
n
e
r
s
e
k
g
e
ar345 Program Manual 2 1
____________________________________________________________________________________
.12 Getting Help
Interactive help can be obtained b
pressing the "Help" button in th
menu bar of the main window or b
pressing the F5 key.
In the mar345−Help window, a he
topic should then be selected fro
the "Topics" submenu (shortcut is:
Alt+t).
.13 Hardware Status
The mar345−Hardware Statu
window can be popped up from th
main window menubar or by pressin
the F6 key.
This window displays informatio
about the current status of som
pieces of the hardware, in particula
the current state of the erase lamp
and the plate locking state. It may b
useful to look at this window to chec
wether the erase lamps are workin
or if the plate locks at the end of th
scan.
Page 22

m
ar345 Program Manual 2 2
_
_
3
t
n
e
e
e
y.
p
n
a
id
r
ft
in
f
.
____________________________________________________________________________________
.14 X−ray Setup
When producing images during data collection many parameters concerning the curren
experiment are automatically written into the output image headers, so this information ca
be retrieved later on. This is most relevant for parameters like the distance and th
goniometer positions. It might, however, be useful to add also some information about th
state of the X−ray source. Unfortunately, the program mar345 does not have knowledg
about the generator and collimator settings, so this information must be entered manuall
For this purpose, open the mar345−X−ray Setup window. This window can be popped u
manually from the main window menubar or by pressing the F3 key. All information give
here is really not essential but it may help later on to track down problems during dat
processing.
The center of diffraction is supposed to be a physical constant (for one data set) and is val
for all scan modes, regardless if working at 0.15 or 0.10 mm pixelsize. This is why the cente
should not be entered in absolute pixels or millimeters referring to an origin in the lower le
corner but as a deviation from the center of the image plate. These values should be given
mm, not in pixels, and can become negative. Negative x deviation means that the center o
diffraction is left of the IP−center. A negative y deviation would be underneath the IP−center
Page 23

m
ar345 Program Manual 2 3
_
_
3
5
d
m
e
e
____________________________________________________________________________________
.15 Errors and Warnings
During operation, i.e. data collection or other tasks, the scanner itself or the program mar34
might produce error messages or warnings. All relevant messages are displaye
automatically in the mar345−Error window. This window can be popped up manually fro
the main window menubar or by pressing the F7 key. Some warnings and errors may hav
an obvious solution if they are not related to the scanner hardware. For latter ones, pleas
refer to section Troubleshooting.
Page 24

m
_
_
4
4
a
ar345 Program Manual 2 4
____________________________________________________________________________________
. Image Display
.1 Display Window
The image display window controls the most important display functions. It consists of
different areas:
Work area Information areas Menu bar Window title Image are
Page 25

m
ar345 Program Manual 2 5
_
_
4
W
O
H
4
r
o
F
C
C
4
f
S
S
D
t
____________________________________________________________________________________
.2 Menu Bar
The menu bar features the following buttons:
indows Pops up the Windows submenu (see 4.2.1). Shortcut: Alt+w.
ptions Pops up the Options submenu (see 4.2.2). Shortcut: Alt+o.
elp Pops up the mar345−Help window.
.2.1 Windows Submenu
The Windows submenu pops up when the "Windows" button in the menu bar was pressed o
if "Alt+w" was pressed while the pointer was in the main window. The submenu is a s
called "tear−off" menu.
The Windows menu features the following buttons:
iles Pops up the mar345−Files window.
Shortcut: Ctrl+f
olors Pops up the mar345−Colors window.
Shortcut: Ctrl+c
lose Closes the display window..
Shortcut: F1
.2.2 Options Submenu
The Options submenu pops up when the "Options" button in the menu bar was pressed or i
"Alt+o" was pressed while the pointer was in the main window. The Options menu features
the following buttons:
how/Hide resolution rings Toggles display of resolution rings
Shortcut: Ctrl+r.
how/Hide statistics Toggles display of image statistics. The statistics about
maximum intensity and average intensity in the image as
well as the wavelength and distance are normally displayed
in the lower left corner of the image area.
Shortcut: Ctrl+a
o not/Keep view Normally, if a new image is loaded, the program displays
the entire image and also calculates the best color scheme.
If you want to look at all images in the very same way, selec
"Keep view". Shortcut: Ctrl+v
Page 26

m
_
_
D
R
T
.
N
P
.
I
Z
e
ar345 Program Manual 2 6
____________________________________________________________________________________
o not/Keep color scales Normally, if a new image is loaded, the program recalculates
a new color scheme. If you want all images to be displayed
in the same way, select "Keep color scales"
Shortcut: Ctrl+k
eset colors Recalculates colors and redisplays the image.
Shortcut: Ctrl+t
urn On/Off 3D−plot Toggles 3−D representation of magnified areas of the image
Available only at zoom factors > 4.
Shortcut: Ctrl+d
ext image Load the next image, i.e. increment image number by 1.
Shortcut: Ctrl+n
revious image Load the previous image, i.e. decrement image number by 1
Shortcut: Ctrl+p
ntegrate Pixels in the image area are integrated and the results are
displayed in the upper right corner of the image area.
Works for zoom factors >= 1 only.
Shortcut: Ctrl+i
oom options Pops up a menu with 3 choices that affect the way the imag
looks at zoom factors < 1. If one pixel on the monitor
corresponds to more than one pixel in the image, the
program will take only one image pixel to display and ignore
the neighbours (n’th pixel) or take the average of the
neighbours or their maximum, respectively.
Note, that "N’th pixel" mode is faster than the others, since
no calculation is involved.
Page 27

m
ar345 Program Manual 2 7
_
_
4
al
B
L
C
B
R
____________________________________________________________________________________
.3 Image Area
In this area, the image is displayed. With the pointer (3−way mouse button) several addition
functions can be accessed.
________________________________________________________________________
utton Action Result
________________________________________________________________________
eft Press Pops up an empty mar345−Cross section window
Drag A red line is drawn from the position of the first mouse press
to the position of the last mouse press.
Release The (interpolated) intensities of the pixels along the line are
displayed in the mar345−Cross section window.
________________________________________________________________________
enter Press The x,y−coordinate, intensity and resolution of the pixel is
displayed in the information area in the upper left corner of
the image area.
________________________________________________________________________
The right mouse button functions depend on the current zoom factor. At zoom factors < 1,
the behaviour is as follows:
________________________________________________________________________
utton Action Result
________________________________________________________________________
ight Press Marks one corner of a zoom area.
Drag A red box is drawn from the position of the first mouse press
to the position of the last mouse press.
Release The pixels contained in the red box are displayed in the
"Image Area". The magnification factor depends on the size
of the box and the size of the window.
________________________________________________________________________
At zoom factors >= 1, the currently displayed magnified part of the image will be recentered
at the position where the right mouse button has been pressed. By this method, one can
move around in the image by always recentering at new positions.
Page 28

m
ar345 Program Manual 2 8
_
_
n
r
e
f
s
____________________________________________________________________________________
At zoom factors > 4 one can obtain a 3−dimensional representation of the magnified portio
of the image. For this feature, use "Turn On 3D−plot" in the Options menu of view window o
toggle this option by pressing Ctrl+d. In 3D mode one can still move around within the imag
by pressing the right hand mouse button, but the recentering corresponds to the position o
the 2D display, so this time it is more guessing. In the 3D−plot one may rescale the peak
using the minimum and maximum intensity field on the y−axis of the plot.
Page 29

m
ar345 Program Manual 2 9
_
_
4
4
e
ly
is
4
4
w
r
t
n
4
U
d
L
,
d
U
g
e
d
e
e
n
____________________________________________________________________________________
.4 Work Area
.4.1 Load Buttons
By pressing the single left or right arrow one can decrease or increase the current imag
number and load the previous or next image, respectively. The double arrow will continous
increase image numbers and continuously load the next image until the stop button
pressed.
.4.2 Zoom Buttons
By pressing the full image button, the image will be displayed such that it fits
entirely into the window. The other buttons will zoom in or zoom out.
.4.3 Colors
The upper text field has the same function as the "Max"−field in the mar345−Colors windo
and the lower text field corresponds to the "Min"−field (see chapter 4.9). Dragging the cente
mouse button in the color area, the color distribution changes. Try it out to see wha
happens!. This doesn’t work for Rainbow mode (see below) and it doesn’t work o
16/24/32−bit color screens, only with 8−bit colors.
.5 Information Areas
pper left corner:
When pressing the center mouse button in the image area, the x,y−coordinate, intensity an
resolution of the pixel under the pointer is displayed.
ower left corner:
Once an image has been loaded successfully, some information (wavelength, distance
maximum intensity and average intensity) is displayed, unless "Hide statistics" was presse
(see 4.2.2).
pper right corner:
When pressing the "Integrate" button in the "Options" submenu (see 4.2.2) the followin
information is displayed: number of pixels in x and y, maximum, minimum and averag
intensity, sum of pixel intensities, standard deviation of intensities, average background an
mean intensity over background (all relative to the pixels displayed in the Image Area). Th
background is calculated from a histogram of intensities of a box of 50x50 pixels around th
center of the zoomed area. Pixel values > 1000 are not included in the histogram. This optio
works for zoom factors >= 1.0 only.
Page 30

m
ar345 Program Manual 3 0
_
_
4
4
a
d
o
s
in
in
M
G
B
R
____________________________________________________________________________________
.6 Window Title
In this area, the image name and some parameters extracted from the image header (total
number of pixels along x, number of pixels with intensities larger than 65535) are displayed.
.7 Colors Window
In this window, colors may be modified. The window provides a drawing area showing
histogram of intensity values found in the image, i.e. intensities are on the horizontal axis an
frequency of the corresponding intensities are on the vertical axis. The histogram is used t
distribute colors or greyscales. The program tries to use 64 colors. All pixels with intensitie
larger than the value given in "Max" (right dashed bar) or smaller than the value given
"Min" (left dashed bar) are drawn in one color. The remaining colors will be distributed
equidistant intensity ranges between Min and Max.
The following color schemes are used:
________________________________________________________________________
ode I <= Min I >= Max All other pixel intensities
________________________________________________________________________
rey scales white black greys
lue scales black white blues
ainbow white red yellow−green−cyan−blue−purple−magenta
________________________________________________________________________
Page 31

m
ar345 Program Manual 3 1
_
_
G
M
M
L
R
C
N
n
o
____________________________________________________________________________________
The functions of the mar345−Colors window widgets are:
rey scales Selection of coloring mode. Alternatives: Blue scales, Rainbow.
in All pixels with intensities <= Min are drawn white (black in Blue scales).
The dashed line in the histogram plot moves to the specified value.
ax All pixels with intensities >= Max are drawn black (Grey scales), white
(Blue scales) or red (Rainbow). Intensities which are above the saturation
limit (128000) are drawn in green. The dashed line in the histogram plot
moves to the specified value.
In the histogram plot, the mouse buttons have the following functions:
eft mouse button press Places the dashed red line in the histogram plot to a new
position marking the minimum. The value in the "Min" text
field is changed accordingly.
ight mouse button press Places the dashed red line in the histogram plot to a new
position marking the maximum. The value in the "Max" text
field is changed accordingly.
enter mouse button drag Changes color tables. Try it out to see what it really does. This
works for grey and blue scales only and for 8−bit color displays
only!
ote:
By changing Min or Max or setting these values with the mouse button the color distributio
for the whole image will be recalculated. This takes some CPU−time, so please don’t d
more than one change at a time.
Page 32

m
_
_
4
e
N
M
ar345 Program Manual 3 2
____________________________________________________________________________________
.8 Cross−Section Window
This window is used for displaying cross sections through the image. The window can b
obtained by pressing the left mouse button in the image area.
The functions for the mar345−Cross section window widgets are as follows:
o. of peaks Specifies the number of peaks between the two dashed lines
in the plot area of the mar345−Cross section window. Use the
arrows on the right hand side of the text field to increment or
decrement the value by 1.
When pressed, the real space cell constant is calculated from
the distance between the two dashed lines and the number of
peaks. The result is displayed in the message area.
essage area Shows the coordinates of the start and end of the line, the
angle with the base line, maximum, minimum, average and
standard deviation of the intensities along the drawn line.
When changing the no. of peaks manually, the second line
displays the derived cell constant.
Page 33

m
ar345 Program Manual 3 3
_
_
V
U
L
L
R
H
d
s.
st
s
e
,
r
al
____________________________________________________________________________________
The plot area of the window shows the following features:
ertical axis Interpolated intensities
pper horizontal axis Length of line in pixel units.
ower horizontal axis Length of line in mm units.
eft dashed red line Marks the begginning of a measured distance. This line can be
moved using the left mouse button.
ight dashed red line Marks the begginning of a measured distance. This line can be
moved using the right mouse button.
orizontal red lines Shows the length of the line in pixels (mm) and the distance
between the dashed vertical lines.
The pointer can be used to measure distances by setting the red dashed lines to the desire
position along the drawn line. This is particularly useful if you want to measure cell constant
The program features a peak finding algorithm which tries to set the bars on top of the fir
and the last peak of the plot. In between the peaks the program then looks for other peak
and tries to calculate the best inter−peak distances by assuming a harmonic oscillation. Th
no. of peaks calculated by the program is displayed in the "No. of peaks" text field. Of course
this value may be modified. The derived cell constants do not take into account any particula
setting or symmetry of the crystal but calculates cell constants assuming plain orthogon
axes in reciprocal space.
Page 34

m
_
_
5
5
n
c.
D
e
,
d
o
o
N
g
ic
,
a
e
E
f
e
d
e
s
N
S
e
ar345 Program Manual 3 4
____________________________________________________________________________________
. Data Collection
.1 Strategies
While some general rules apply how to collect data best, a sensible choice of data collectio
parameters depends on individual circumstances, i.e. crystal quality, beam properties, et
The following section gives some hints on how to program a data collection:
istance crystal−detector:
The distance crystal−detector must be chosen such that spots don’t overlap. It should b
chosen such that the highest resolution of the spots is close to the edge of the scanned area
i.e. move the detector back as far as possible. This gives a better Intensity/σ ratio!
∆ϕper image:
The
∆ϕmust be chosen such that spots don’t overlap. If the background is large compare
to the average spot intensity (i.e. most protein crystals) choose relatively small values (0.5 t
2.0 deg.). The smaller, the better the integration works, but the more exposures you need t
get a complete data set.
umber of images:
How many images you need depends on the symmetry of the space group and on the settin
of the crystal. As a rule of thumb, orthorhombic crystals require 90.0 deg. of data, monoclin
ones 120 deg., triclinic ones 180 deg., trigonal ones 60.0 deg., tetragonal ones 45.0 deg
hexagonal ones about 30.0 deg. and cubic ones about 25.0 deg.. High resolution dat
collections usually require a wedge of data − say 20 deg. − at another crystal setting becaus
of the blind region.
xposure time:
The exposure time should be less than 30 minutes, in any case, because of partial decay o
the F−centers on the imaging plate. For very weak diffractors which require longer exposur
times it is better to scan one exposure after 30 min. and to repeat the same exposure an
add the images together later. Otherwise, exposure times should be chosen such that th
dynamic range (0:130000) is not exceeded. It is actually best to have maximum intensitie
considerably less, e.g. 60000.
umber of oscillations:
Best to leave at 1, except when using exposure times larger than 15 minutes.
can mode:
Why scan the 345 mm plate if there is not enough diffraction? A 180 mm scan takes half th
time to scan, needs 80% less disk space and 80% less processing time!
Page 35

m
_
_
st
s
e
O
k
s
C
0
0
5
s.
It
5
d
.
r
T
5
a
ar345 Program Manual 3 5
____________________________________________________________________________________
The decision about what pixelsize to choose is slightly more difficult. In general, the fine
pixelsize of 0.1mm is more efficient and yields slightly better data. On the other hand, scan
take about 10% longer time and images are larger in size than those taken at the sam
diameter but in 0.15mm pixelsize mode. So the decision is some kind of compromise.
utput format:
Use of "mar345" format is strongly suggested. A mar345 file typically requires 70% less dis
space than a standard uncompressed image file. All major protein data processing package
support this format.
ollect mode:
Use TIME mode unless on synchrotrons.
For indexing crystals, usually 2 images that differ from each other by a movement in
degrees gives good results. In the case of very small molecules (i.e. cell axes of about 1
deg.) you may not get enough spots from 2 images only.
ϕ of 9
.2 Checking Parameters
Before starting a data collection, mar345 makes a consistency check of the input parameter
In most cases the program will tell you if the input parameters really do not make sense.
checks wether files can be opened, if there is enough disk space, etc.
.3 Errors and Warnings
In case of computer or scanner problems, warning messages will be printed on standar
output and in the log file. Very important messages will also be displayed in a special window
Problems fall into 3 categories: fatal errors, warnings and notifications. See chapte
roubleshooting for more details.
.4 End of Data Collection
After having finished a data set, mar345 writes a summary into the corresponding dat
directory. The summary files come in 2 formats:
− image_root.SUMMARY = plain Ascii text file
− image_root.html = Ascii−file with HTML−formatting instructions.
These files should be printed and archived.
Page 36

m
ar345 Program Manual 3 6
_
_
6
e
r
m
m
g
I
ly
a
r
o
____________________________________________________________________________________
. Troubleshooting
Both the computer and the scanner can produce fatal errors and warnings. All messages ar
numbered. Messages with message numbers < 1000 come directly from the scanne
controller and are potentially serious. Message numbers >= 1000 are generated by progra
ar345 and may be a consequence of a controller error or some other kind of malfunctionin
or warning.
f you don’t know how to fix a scanner problem, contact marresearch. We will usual
sk you right away to send us the mar.spy file and the mar.log file where the erro
ccured (see chapter 2.3) since they contain almost all information we need.
The following error messages >= 1000 are produced by program mar345:
_______________________________________________________________________
No. Description
_______________________________________________________________________
1000 Message: "Error sending command to mar controller"
Reason: Network connection to scanner interrupted.
Action: Reboot scanner. Check cables. Try "ping mar345".
1001 Message: "SERVO system cannot be INITIALIZED"
Reason: Severe hardware problem.
Action: Call.
1010 Message: "Waiting for X−rays..."
Reason: The X−ray intensity as read from the ion. chamber has
dropped below the critical level (see configuration file:
INTENSITY MIN xxx). The next exposure starts only
after the X−rays are back.
Action: Check generator, monochromator or collimator.
1020 Message: "Not enough disk space left on device. Aborting data collection"
Reason: Disk full.
Action: Clean up disk.
1030 Message: "The Image Plate has been exposed to X−rays"
Reason: A running exposure has been aborted.
Action: Erase plate and continue.
1040 Message: "X images have been successfully retaken"
Reason: Some images had to be retaken due to hardware problems,
possibly shutter.
Action: Carefully check log file for learning more about the reasons.
_______________________________________________________________________
Page 37

m
ar345 Program Manual 3 7
_
_
____________________________________________________________________________________
Tabel continued from previous page.
_______________________________________________________________________
No. Description
_______________________________________________________________________
1050 Message: "SHUTTER did not work properly. Abandoning data collection"
Reason: X−ray beam shutter damaged or dirty.
Action: Check shutter. Open and close it manually. Is it very hard
to operate?
1060 Message: "X−ray reading too low ..."
Reason: The X−ray intensity as read from the ion. chamber is
below the critical level (see configuration file:
INTENSITY MIN xxx). The data collection starts only
if the X−ray reading is above the configured value.
Action: Check generator, monochromator or collimator.
1061 Message: "X−rays reading too high for DOSE mode ..."
Reason: The X−ray intensity as read from the ion. chamber shows
very large numbers (>100). The work in DOSE mode becomes
inaccurate.
Action: Turn down gain selector of ion. chambers.
1070 Message: "Could not recover from previous errors after X retries"
Reason: Follow up of previous messages.
Action: Check previous messages.
1080 Message: "SHUTTER did not open during exposure" or
"Shutter did not close at end of exposure"
Reason: X−ray beam shutter damaged or dirty.
Action: Check shutter. Open and close it manually. Is it very hard
to operate?
1090 Message: "Scanner home position (X) differs from Y +/− dy"
Reason: Problem with radial movement of reading head.
Action: Mail mar.spy. Call.
1100 Message: "Cannot open nb_code!"
Reason: File $MARTABLEDIR/mar2300.XXX and/or
$MARTABLEDIR/mar3450.XXX are missing or don’t
have read permission.
Action: Check existence of files and permissions.
_______________________________________________________________________
Page 38

m
ar345 Program Manual 3 8
_
_
____________________________________________________________________________________
Tabel continued from previous page.
_______________________________________________________________________
No. Description
_______________________________________________________________________
1101 Message: "No scan modes found in nb_code ..."
1102 "Something wrong with byteorder in nb_code ..."
1105 "No suitable scanning mode found in nb_code".
Reason: File $MARTABLEDIR/mar2300.XXX and/or
$MARTABLEDIR/mar3450.XXX may be corrupted or empty.
Action: Check file sizes (73 MB and 103MB). Use command:
catmar $MARTABLEDIR/mar2300.XXX
to look at the calibration file header.
1103 Message: "Scanner serial number in nb_code differs from config"
Reason: The scanner no. in the file headers of files
$MARTABLEDIR/mar2300.XXX and/or
$MARTABLEDIR/mar3450.XXX are not identical to
$MAR_SCANNER_NO. The calibration files may not
belong to the scanner.
Action: Call.
1110 Message: "Cannot create image file"
1111 "Cannot open image file"
1112 "Error writing image array"
1115 "Error writing image header"
Reason: Insufficient disk space or invalid file permissions.
Action: Clean up disk or check data directory permissions.
1215/1241 Message: "Cannot OPEN SHUTTER at START of EXPOSURE"
1234 "SHUTTER was already OPEN at START of EXPOSURE!"
1238 "Cannot CLOSE SHUTTER at END of EXPOSURE!"
Reason: X−ray beam shutter damaged or dirty. Otherwise, the manual
shutter operation switch mounted on the base may have
been left in the "Open" state.
Action: Check shutter and manual shutter switch on the base.
Open and close the shutter manually. Is it very hard
to operate?
1239 Message: "STEPPER error during EXPOSURE!"
Reason: Problem with PHI axis movement. Possibly software related.
Action: Mail mar.spy file. Call.
_______________________________________________________________________
Page 39

m
ar345 Program Manual 3 9
_
_
A
A
ry
r.
n
ll
____________________________________________________________________________________
ppendix
. Configuration File
Each scanner has a scanner specific configuration file. This file must reside in directo
$MARTABLEDIR and is called config.XXX, where XXX is the three−digit serial numbe
Please refrain from changing values unless there is good reason to do so. The configuratio
file is a keyworded Ascii−file. Please refer to the man page mar345_config_file forafu
description of keywords.
A typical configuration file looks like this:
! ______________________________________
!
! Configuration file for scanner no. 120
! ______________________________________
!
! Only modify the following keywords, if desired...
!
DIST MIN 75.30 MAX 426.30
!
INTENSITY MIN 2.0 WARN 20.0
!
USE SPY
USE STATS
USE INCR
USE RUN
USE HTML
USE SUMMARY
!
COLORS 64
SETS 4
!
WAVE 1.541789
MONOCHROMATOR Mirrors
GENERATOR Rotating anode
!
NETWORK PORT 4441 HOST 192.0.2.1
!
MODE 2300 ROFF 180 ADC 50 AADD −42 BADD −45
MODE 2000 ROFF 180 ADC 50 AADD −42 BADD −45
MODE 1600 ROFF 180 ADC 50 AADD −42 BADD −45
MODE 1200 ROFF 180 ADC 50 AADD −42 BADD −45
!
MODE 3450 ROFF 180 ADC 50 AADD −42 BADD −45
MODE 3000 ROFF 180 ADC 50 AADD −42 BADD −45
MODE 2400 ROFF 180 ADC 50 AADD −42 BADD −45
MODE 1800 ROFF 180 ADC 50 AADD −42 BADD −45
!
!IP−Diameter: 345mm 300mm 240mm 180mm
!GAPS 89615 78601 63852 49103
! 02.2.2000: GAPS valid for S/N 120
!
Page 40

m
ar345 Program Manual 4 0
_
_
B
in
is
d
d
d
g
____________________________________________________________________________________
. Calibration Files
Each scanner comes with 2 scanner specific calibration files. These files must reside
directory $MARTABLEDIR and are called mar2300.XXX and mar3450.XXX, where XXX
the three−digit serial number. The file contain flat field and geometrical corrections require
for producing Cartesian images out of a spiral scan.
− File mar2300.XXX is used for scans at pixelsizes of 0.15mm (modes 2300, 2000, 1600 an
1200) and has a typical size of 73 MB.
− File mar3450.XXX is used for scans at pixelsizes of 0.10mm (modes 3450, 3000, 2400 an
1800) and has a typical size of 103 MB.
Both files are binary files. They feature an Ascii−file header that can be looked up usin
program catmar.
A typical output of command "catmar mar2300.120 " looks like this:
Format type: mar 345 ...
==============================================================
Line At byte Contents
==============================================================
4 ( 192) PROGRAM improve Version 2.8
5 ( 256) DATE Wed Feb 2 12:00:40 2000
6 ( 320) SCANNER 120
7 ( 384) PIXEL LENGTH 75 HEIGHT 150 SUBPIXELS 25
8 ( 448) PHIOFF 269.970
9 ( 512) CUTOFF 0.000
10 ( 576) SCALE 32767.000
11 ( 640) GAIN 1.000
12 ( 704) NUMBER PIXELS 7766361 NEIGHBOURS 25199739
13 ( 768) MODE 2300 X 0 Y 1149 ROFF 0 SKIP 144
14 ( 832) MODE 2000 X 0 Y 999 ROFF 0 SKIP 144
15 ( 896) MODE 1600 X 0 Y 800 ROFF 0 SKIP 809
16 ( 960) MODE 1200 X 0 Y 600 ROFF 0 SKIP 809
17 ( 1024) MODE 2300 PIX 7766361 POS 4096
18 ( 1088) MODE 2000 PIX 5956761 POS 17151502
19 ( 1152) MODE 1600 PIX 3845618 POS 37076767
20 ( 1216) MODE 1200 PIX 2190418 POS 52798207
==============================================================
 Loading...