

Page 1

N3014 EVOLUTION
GRAPHIC MONITOR
OPERATOR MANUAL
Page 2

CONTENTS
1. Description . . . . . . . . . . . . . . . . . . . . . . . . . . . . . . . . . . . . . 4
1.1 Accessories Available . . . . . . . . . . . . . . . . . . . . . . . . . . . . . . . . . . 5
2. Overview of Evolution Graphic Monitoring . . . . . . . . . . . 5
3. Overview of Keypad Symbols ......................6
4. Overview of Connections to the Instrument . . . . . . . . . . 7
5. Overview of Home Screen. . . . . . . . . . . . . . . . . . . . . . . . . 8
6. Overview of Evolution Alarms ......................8
6.1 Non-Latching Alarms . . . . . . . . . . . . . . . . . . . . . . . . . . . . . . . . . . 8
6.2 Latching Alarms . . . . . . . . . . . . . . . . . . . . . . . . . . . . . . . . . . . . . . 8
7. Connecting Probes to the Instrument . . . . . . . . . . . . . . . 9
8. Switching On and Off .............................9
8.1 Display Test/Mode . . . . . . . . . . . . . . . . . . . . . . . . . . . . . . . . . . . . 9
9. Programming the Instrument ......................9
10. Using the Evolution Software .....................10
10.1 Writing a Task for the EVG ............................ 10
10.1.1 Channel Setup . . . . . . . . . . . . . . . . . . . . . . . . . . . . . . 10
10.1. 2 Recording Setup . . . . . . . . . . . . . . . . . . . . . . . . . . . . 11
10.1.3 Miscellaneous ............................... 11
10.2 User Details . . . . . . . . . . . . . . . . . . . . . . . . . . . . . . . . . . . . . . . 11
10.2.1 Instrument Clock ............................ 11
10.2.2 Password Protect . . . . . . . . . . . . . . . . . . . . . . . . . . . . 12
10.3 Saving the Task .................................... 12
10.4 Program Task ......................................12
10.4.1 Unlock Password ............................12
10.5 Retrieving Data. . . . . . . . . . . . . . . . . . . . . . . . . . . . . . . . . . . . . 13
1
Page 3

2
10.6 Data Manipulation . . . . . . . . . . . . . . . . . . . . . . . . . . . . . . . . . . 13
10.6.1 Graphing, Printing and Data Export ..............13
10.6.2 Quick Calcs ................................. 13
10.7 Help . . . . . . . . . . . . . . . . . . . . . . . . . . . . . . . . . . . . . . . . . . . . . 14
11. Manual Setup and Recording for EVG . . . . . . . . . . . . . 14
11.1 Instrument Display Home Screen ....................... 14
11.2 View Data ......................................... 15
11.2.1 Graph . . . . . . . . . . . . . . . . . . . . . . . . . . . . . . . . . . . . . 15
11.2.2 Options . . . . . . . . . . . . . . . . . . . . . . . . . . . . . . . . . . . . 16
11.2.3 Ch . . . . . . . . . . . . . . . . . . . . . . . . . . . . . . . . . . . . . . . . 16
11.2.4 Per + (if applicable) . . . . . . . . . . . . . . . . . . . . . . . . . . 16
11.2.5 Per - (if applicable) ........................... 16
11.2.6 Zoom ...................................... 16
11.2.7 Summary ...................................17
11.3 Single Channel ................................17
11.4 All Channels . . . . . . . . . . . . . . . . . . . . . . . . . . . . . . . . . . . . . . . 18
11.5 List . . . . . . . . . . . . . . . . . . . . . . . . . . . . . . . . . . . . . . . . . . . . . . 18
11.6 Task Setup . . . . . . . . . . . . . . . . . . . . . . . . . . . . . . . . . . . . . . . . 19
11.7 General Settings .................................... 19
11.7.1 Log Interval . . . . . . . . . . . . . . . . . . . . . . . . . . . . . . . . . 20
11.7.2 Alarms ..................................... 20
11.7.3 Wraparound .................................20
11.7.4 Recording Mode . . . . . . . . . . . . . . . . . . . . . . . . . . . . . 20
11.7.5 Description . . . . . . . . . . . . . . . . . . . . . . . . . . . . . . . . . 21
11.7.6 User Details ................................. 22
12. Channel Specic Settings . . . . . . . . . . . . . . . . . . . . . . 22
12.1 Name . . . . . . . . . . . . . . . . . . . . . . . . . . . . . . . . . . . . . . . . . . . . 22
12.2 Enabled . . . . . . . . . . . . . . . . . . . . . . . . . . . . . . . . . . . . . . . . . . 22
12.3 Sensor Type ....................................... 22
12.4 Scale Units ........................................23
12.5 Alarm Hi ...........................................23
12.6 Alarm Lo .......................................... 23
12.7 Alarm Delay . . . . . . . . . . . . . . . . . . . . . . . . . . . . . . . . . . . . . . . 23
Page 4

3
13. Instrument Setup . . . . . . . . . . . . . . . . . . . . . . . . . . . . . . 24
13.1 Password . . . . . . . . . . . . . . . . . . . . . . . . . . . . . . . . . . . . . . . . . 24
13.2 Display Auto Power Off . . . . . . . . . . . . . . . . . . . . . . . . . . . . . . 24
13.3 Alarm Speaker . . . . . . . . . . . . . . . . . . . . . . . . . . . . . . . . . . . . . 24
13.4 Alarm Switch Output .................................24
13.5 50/60Hz Mains Rejection .............................25
13.6 Printer Set up ......................................25
13.7 Demo Mode . . . . . . . . . . . . . . . . . . . . . . . . . . . . . . . . . . . . . . . 25
14. About EVG ....................................25
15. Real Time Data . . . . . . . . . . . . . . . . . . . . . . . . . . . . . . . . 25
16. View Alarms . . . . . . . . . . . . . . . . . . . . . . . . . . . . . . . . . . 25
17. Help . . . . . . . . . . . . . . . . . . . . . . . . . . . . . . . . . . . . . . . . . 26
18. Care of the Instrument ..........................26
19. Changing the Batteries . . . . . . . . . . . . . . . . . . . . . . . . . 27
20. Specications .................................28
Instrument .............................................28
Input/ Output . . . . . . . . . . . . . . . . . . . . . . . . . . . . . . . . . . . . . . . . . . . 29
Enclosure . . . . . . . . . . . . . . . . . . . . . . . . . . . . . . . . . . . . . . . . . . . . . 29
Page 5

4
1. DESCRIPTION
The Comark N3000 Diligence EVG Graphics Monitor range of new
instruments is designed to meet all your data recording needs. These
monitors take data recording to another level with the introduction of a
large backlit LCD for a clear view of the data in both list (tabular) and graph
mode.
Paper and pen chart-recording of data will become a thing of the past
with Diligence EVG Monitors. The N3000 range combines all the features
associated with the successful Comark Diligence EV data loggers and adds
additional features never seen before on a Comark instrument.
Comark Diligence EVG Graphics Monitors have been designed for
applications throughout industry and processing, including the food industry
and scientic and research laboratories.
Each Diligence EVG Graphics Monitor has a very large memory (up to
64,000 readings) for the most demanding applications and can be used
with the existing range of Comark temperature probes.
The stored data points can be displayed directly on the large LCD display
or sent to a PC or to a printer.
The large LCD display is used to indicate all programming and set up,
as well as for the display of valuable information on the status of the
instrument and the measurement channels. Throughout this manual
the various presentations of information on the LCD are referred to as
“screens”. This also differentiates the LCD presentations from the software
presentations, referred to as “pages”.
The proven Evolution software provides for the programming of Diligence
EVG Monitors and enables the stored data to be saved on a PC and
displayed in list or graphical form.
The rst instrument in the N3000 range is the N3014 detailed in this
manual.
Page 6

5
1.1 Accessories Available
The following accessories are available for the N3000 Graphic
Monitor range:
• EVSW or EVSWPRO Multi-lingual Logger Software
• ADP46 Centronics Parallel Printer Cable
• ADP 53 N3000 Comms Lead
• ADP54/UK Power Adaptor UK
• ADP54/EU Power Adaptor EU
• ADP54/US Power Adaptor US
• ADP55 Ni-Mh Rechargeable Cells (Pack of 4)
• LC30 Carrying case
2. OVERVIEW OF EVOLUTION GRAPHIC MONITORING
The N3014 stores readings at pre-set intervals for all active channels in its
large memory. Each reading stored is time and date stamped. The interval
time is programmable from 1 second to 99 hours. There are a number of
user programmable options including alarm intervals, sensor type, channel
set-up, and start/stop times. These options are detailed elsewhere in this
manual. There are also options available for setting the times for data
recording. These include:
Manual start/stop
Manual start/timer stop
Timer start/stop
Wraparound (continuous logging)
Daily logging.
Manual start/stop. The N3014 will only start to record data and stop
recording when manually instructed from the keypad.
Manual start/timer stop. The N3014 will only start logging when manually
instructed from the keypad. The pre-programmed stop time will be
automatic.
Timer start/stop. The pre-programmed start and stop times will be
automatic.
Page 7

6
Wraparound recording. Data will be recorded until the N3014 memory is full
and new data will be written over the oldest data in the memory.
Whenever the N3014 starts a new logging cycle after a time during which
no logging has taken place, a new section is created within the data. Each
separate logging section is therefore related to a specic logging time
period and is referred to as a period. The N3014 can store a maximum of
128 periods.
Data can be displayed in real time on the large graphic LCD while also
being stored in the internal memory for later transfer to a printer or upload
to a PC for storage, and analysis.
3. OVERVIEW OF KEYPAD SYMBOLS
The keypad has a number of buttons for the operation of the instrument
and a number of LEDs for active indication of events. The button functions
are:
ON/OFF – Use this button to power the EVG display on and off to save
power. The instrument will not stop logging or lose data if the display is
turned off.
Backlight – This button will operate the backlight for the LCD. This will
switch off after ve minutes.
Help – A unique feature on an instrument of this type. Press this button for
?
on-screen help. Each operaton screen has its own help screen to assist
with programming and data viewing.
Alarms – This button displays a screen where any alarms not
acknowledged will be highlighted with an asterisk (*). At this point, these
alarms can be acknowledged. This feature can be password protected.
Cancel – This button will either return the display to the previous screen or
will cancel any operations or option.
Multifunction Buttons – These 6 blank buttons have unique functions
related to each displayed screen. Appropriate words and symbols will
appear at the bottom of each screen above the buttons.
Page 8
7
LEDs
The instrument is tted with a number of LEDs:
Mains Adaptor Connected – GREEN Constant
Alarm Indication – RED Flashing
Active/Logging – GREEN Flashing
Low Battery - YELLOW Flashing/constant for battery charging
4. OVERVIEW OF CONNECTIONS TO THE INSTRUMENT
There are a number of connections on each side of the instrument case.
The left side of the case has connections for:
PC connection RS232 (9-Way D Type Connector) and
Axiohm serial small hand held thermal printer model A621B.
Printer (25-Way D type connector) Centronics parallel,
Hewlett Packard PCL5 compatible or 24-pin Epson ESC/P2
dot matrix compatible.
Mains/adaptor
3.5mm jack socket with 24V 500mA maximum rated input
for connection of external alarms and auto-diallers. There is
one volt-free contact available, either normally closed (autodiallers) or normally open (external buzzers etc).
The right side of the case has connections for probes. Please refer to the
instrument specication for more details.
Page 9
8
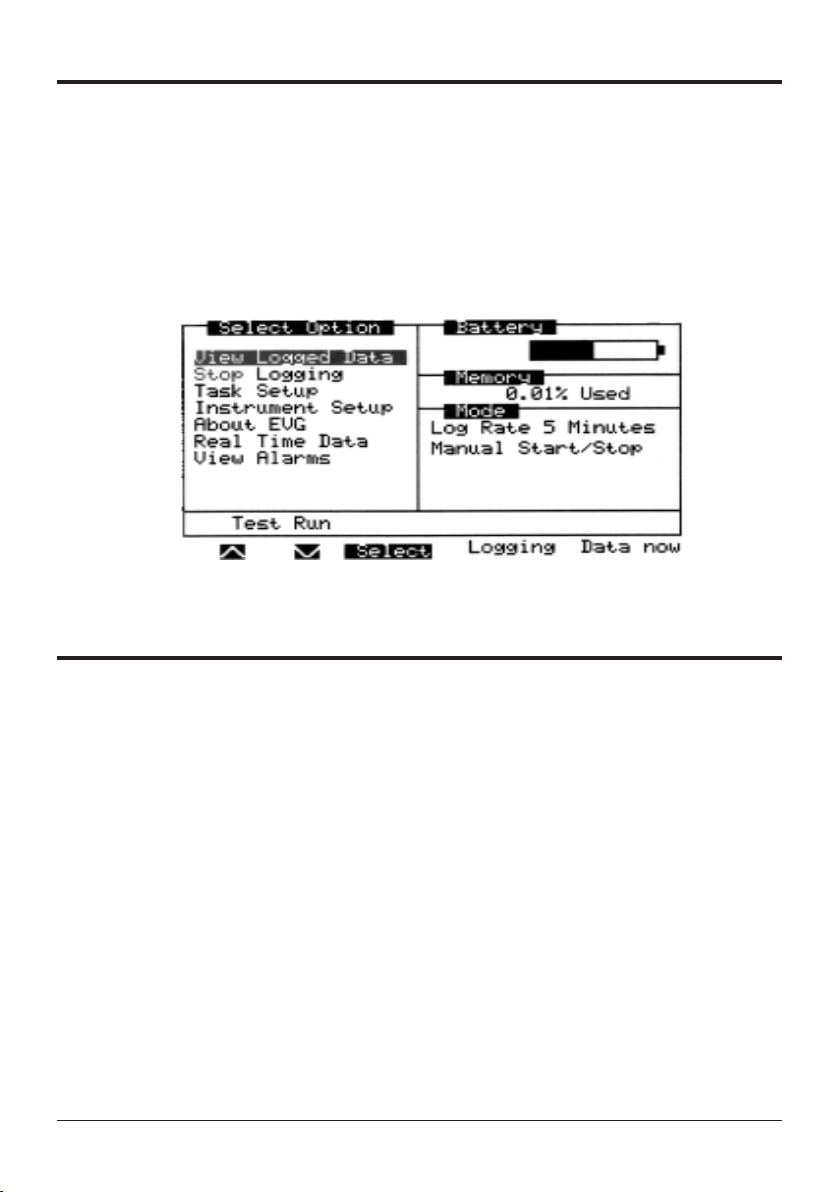
5. OVERVIEW OF HOME SCREEN
The home screen is the main screen for the EVG monitor. This screen
will detail the current status of the instrument, including battery condition,
memory used, and mode. It will also show the current monitoring mode
and if the instrument is currently recording or not. The left hand side of the
screen shows the main menu for the monitor. It is possible to start/stop the
instrument in manual start mode from here. The lower portion of the display
will show the monitor task description as programmed.
Fig.1 Home Screen
6. OVERVIEW OF EVOLUTION ALARMS
Each channel on the instrument can be programmed with a high (Hi) and
low (Lo) alarm limit and an alarm time delay. The delay can be set to pause
the activation of an alarm by a pre-determined amount of time. There is
also an “auto-reset alarms” function used to set alarms as either nonlatching or latching alarms.
6.1 Non-Latching Alarms
If “auto-reset alarms” is set to ON, an alarm indication will turn on
and off if the programmed alarm thresholds are broken.
6.2 Latching Alarms
If “auto-reset alarms" is set to OFF, any alarm that has been
activated will not be reset when the recorded temperature returns to
within the programmed alarm thresholds.
Page 10

9
7. CONNECTING PROBES TO THE INSTRUMENT
The rst N3000 instrument is the N3014. This is an eight-channel
thermocouple monitor tted with industry standard sub-miniature
connectors.
When connecting probes, the polarity of the plug must be checked before
tting. N.B. In order to obtain correct results make sure that the correct
thermocouple type for the probe in use has been selected.
Comark type K thermocouple probes have a Green (Red in USA) lead and
type T themocouple probes have a Brown (Blue in USA) lead.
Note: It is recommended that insulated thermocouples are used with the
N3014 eight channel instrument.
8. SWITCHING ON AND OFF
8.1 Display Test/Mode
The logging function is available as long as power is supplied to
the instrument, from batteries or mains, but the large LCD can be
switched off using the ON/OFF button. Whenever the display is
turned on it will perform a self-test during which time the Comark
logo will be displayed. After the self-test is completed, The LCD will
return to the previously displayed screen or the home screen as
appropriate.
9. PROGRAMMING THE INSTRUMENT
The instrument can be programmed in two different ways. Firstly, it has
been designed to be compatible with the existing Evolution software for
programming via a PC. Secondly, it can be programmed via the keypad.
The next section ‘Using the Evolution Software’ will deal with programming
via the software and the following chapter ‘Manual Setup for EVG’ will
cover the setting up the instrument without software or a PC.
Page 11

10
10. USING THE EVOLUTION SOFTWARE
The N3000 range of monitors can be used with N1SW version 3.1 or
above, however EV or EVSWPRO is recommended. If required, software
upgrades can be obtained from the Comark Sales Ofce or a local Comark
distributor.
Note: Before attempting to install the software please read the software
installation guide supplied with the software.
10.1 Writing a Task for the EVG
Note: It is recommended that this part of the manual be read while
referring to an instrument connected to a PC.
With the software installed and preferences set (see software
installation guide) the system is ready for a task to be written. All
programming of Evolution models is via TASKS. In this way the
task may be saved as a record of the program given to the monitor
and as such may also be retrieved for later use. Connect the EVG
monitor to the PC via the cable supplied. This will t only the 9-Pin
RS232 connector on the side of the EVG. From the Evolution
software select Quick Program from the Shortcuts menu. After a few
seconds the Static Task screen will be displayed on the LCD of the
instrument.
10.1.1 Channel Setup
The number of channels available will be shown across the
screen as a series of ‘TABS’. To set up a particular channel
click on the relevant TAB.
Each tab will allow the conguration of a number of options
pertaining to that channel. The display will show a tick box
to turn the channel on and off and a description eld for the
specic channel, which will be displayed on the EVG LCD.
Settings also include the sensor type, if applicable, individual
High and Low alarms for each channel, and nally the alarm
time delay. For example an alarm time delay can be set to
cover defrost cycles e.g. A delay can be set between 0-99
seconds or minutes.
Page 12

11
Note: Alarms will be triggered if the measured value
rises above, or drops below, the entered Hi and Lo limits.
The rest of the settings are not specic to any N3000 model.
10.1.2 Recording Setup
The 'logging' section of the Task allows programming of the
interval time 1-99 seconds, minutes or hours, manual start/
stop reording, specic date/time recording with or without a
manual start and daily recording between two times. Daily
recording can be over midnight and set for specic day or days
of the week.
If manual start/stop is selected, the option start or stop is
presented on the home screen of the instrument display.
10.1.3 Miscellaneous
The miscellaneous settings will allow for setting up of the
alarms, turn on or off, setting latched alarms and turning the
bleeper on and off. Memory wraparound (continuous logging)
is also enabled from here.
10.2 User Details
The User details screen allows the programming of 12 text elds,
headed title and description. The title eld can be up to 16
characters while the description eld can be up to 24 characters.
Finish with OK or Cancel to abort.
10.2.1 Instrument Clock
The instrument date/time can be set either to synchronise with
the PC clock or manually. The manual setting is useful if the
clock in the instrument is to be set to a different time from the
PC clock, e.g. set to GMT Greenwich Mean Time when the
local time differs, i.e. BST British Summer Time. Note: The
instrument timeclock will not adjust for BST.
Page 13

12
10.2.2 Password Protect
Use the Password protect elds to enter an alphanumeric
password of up to four characters to protect programming or
data retrieval, or both. Only one password can be set and this
protects both programming and data retrieval. More options
are available via manual programming, see section 13.1.
10.3 Saving the Task
The task is now complete and can be saved for later reference by
using the ‘Save Task’ button. This will display a standard File-Save-
As Window. From here a lename can be entered for the task and
saved on the PC.
10.4 Program Task
Progamming tasks is made simple by the ‘Program-Now’ button.
Press this button with the instrument switched on and connected
to the PC and the software will send the new Task information to
the instrument. If the instrument is password protected then the
password will have to be unlocked, see Unlock Password below.
Once programmed the instrument monitor is ready to go. If the
instrument has been programmed for manual start, this option will
appear on the home screen. If the instrument has been programmed
for daily or dated recording then it will start recording automatically
and requires no further input.
10.4.1 Unlock Password
From the menus at the top of the screen, select File-Unlock
Password. Enter the password to unlock the instrument for
programming or data download.
Note: If the password programmed into the instrument is
forgotten, the instrument will have to be returned to
Comark Ltd.
Page 14

13
10.5 Retrieving Data
Once the logger has completed the task, the data can be
downloaded for viewing. Connect the instrument to the PC with the
ADP53 N3000 Comms Lead and select the Retrieve Data shortcut.
The software will scan the instrument for data and will ask for a
lename for the data le. If the logger is password protected and the
password has not been unlocked then the data cannot be retrieved.
See Unlock Password above.
At this point the software will ask for a lename for the data. It will
then ask if the memory is to be cleared and if the instrument is to be
returned to ‘non-logging’ basic mode. Once these questions have
been answered the data will be displayed on the screen. It is now
possible to print and graph the data.
10.6 Data Manipulation
10.6.1 Graphing, Printing and Data Export
The data will be displayed in list mode but can be graphed or
printed at the touch of a button. The quickest way to print or
graph the whole le is to select the ALL tab and then select
either Print Current Tab or Graph Current Tab. Additionally a
portion of the data can be highlighted by using the mouse.
This selection can then be copied and pasted on to a blank
graph. (A new graph Window is created by selecting File-NewEvolution Graph). Additionally the data can be also pasted into
a Word Document or Excel Spreadsheet.
10.6.2 Quick Calcs
The Quick Calcs function will calculate the following values
from the selected data: mean, minimum, maximum, standard
deviation and elapsed time. These calculations will only apply
to data previously selected using the mouse. Select the whole
or part of the data and press Quick Calcs to view the results.
N.B. The calculated results cannot be printed or exported.
Page 15

14
10.7 Help
More comprehensive help is available from the software by using
the F1 key. This can be via context sensitive help or a software
‘Tutorial’.
11. MANUAL SETUP AND RECORDING
11.1 Instrument Display Home Screen
A number of functions can be performed from the instrument home
screen. If the instrument is not already recording and manual start
has been selected, then the rst option is to start recording. Then the
rest of the options are listed as follows:
• View Logged Data
• *Start/Stop Logging
• Task Setup
• Instrument Setup
• About
• View Alarms
* Manual Start or Stop only
Fig. 1 Home Screen
Page 16

15
11.2 View Data
Using the up/down arrow buttons, select the View Data menu from
the home screen and conrm with Select. A View menu and will be
displayed with several options. Use the up/down arrow buttons to
choose an option and nish with Select or Cancel to abort back to
the home screen.
11.2.1 Graph
In this mode the instrument will default to show all data for the
latest period (see section 2 for a denition of "period") for the
rst active channel. It will show the start and stop time for the
graph. It will indicate the scale in use, the channel name, the
channel number and the period. The relevant multifunction
buttons will be displayed at the bottom of the screen.
The graph will auto scale for best t.
Log
Start
Time
Name
Last
Reading
Channel
Number
Fig. 2 Graph
Period
Number
Latest
Logged
Time
Mode
Page 17

16
11.2.2 Options
Use the options buttons to toggle through additional menu
items:
• Full Graph Mode
- Return to full graph mode
• Roll Mode
- Show the last 192 readings continually updated
- Dates will be displayed showing start and end of roll
mode data.
• Print Graph
- Print the current graph as displayed
11.2.3 Ch
Press this button to move from one channel to the next. It will
cycle round all enabled channels.
11.2.4 Per + (if applicable)
Press this button to move from one period to the next.
11.2.5 Per - (if applicable)
Press this button to move back to the previous period.
11.2.6 Zoom
In ‘zoom’ mode it is possible to select a portion of the graph to
be displayed on the screen. This is done by selecting a rst and
second data point. The instrument will then display the graph
between these two points. To select the rst point move the cursor
using the left/right and up/down arrows. When ready press ‘1st
pt’ to make the selection. Then repeat for the second point and
nish by pressing ‘2nd pt’. The graph will enter zoom mode. Two
scroll bars will be displayed to indicate the zoom location in
respect of the full graph. At this point it is possible to zoom further
or scroll left, right, up or down. Use the options menu to select
from ‘Return to Full Graph Mode’, ‘Print Graph’ or ‘Return to Roll
Mode’, or 'List Data from Cursor Point'.
Page 18

17
Scroll
Bars
Data on
cursor
Note: Due to the limited resolution, the cursor may display more
than one date and temperature when placed on the graph. Zoom
in to see a single date and temperature. If more than one date is
shown, this indicates there is more than one reading over the cursor.
The dates will show the period the cursor is on and the minimum and
maximum temperature.
11.2.7 Summary
This screen details the channel number/description, period
from and to period time/date, log rate, high and low alarm
values, maximum and minimum recorded value for the period
and the last recorded reading.
Fig.3 Zoom Mode
11.3 Single Channel
In single channel mode the instrument will display:
• Last recorded reading for the rst active channel
• Channel number
• Channel description
• If reading input is in/out of alarm
• When last reading was taken
• Time since last alarm or duration of current alarm
• Time resolution of the log rate
• Minimum and maximum values for the period
Mode
Page 19

18
From here it is possible to print summary or view alarms. There are
several option buttons available from this screen:
•Ch+ Use this key to move up a channel
•Ch- Use this key to move down a channel
•Scan Off Use this button to toggle between automatic
channel scanning and manual scanning. Each
channel will be shown at approximately 5 second
intervals.
•Summary As above.
Escape by using the Cancel button.
11.4 All Channels
In all channels mode the instrument will display the last logged
reading for all the active channels, with the channel number,
description, and alarm status. Each logged reading will be displayed
along with a time/date stamp indicating exactly when the reading was
taken. Escape by using the Cancel button.
11.5 List
In list mode the instrument will display the last ten readings for the
current channel, along with its log number, temperature, date/time
and alarm status. The period will be indicated. Use options to list
all data, list to and from date/time, print the list, show summary and
graph from top of list (or nearest possible point).
Use CH to move to the next channel and up arrow button to move
back through data. Use Per + and Per - to change period. Select
cancel to return to previous screen. A scroll bar is provided to show
the relative position in the list.
Page 20

19
Fig.4 List Mode
11.6 Task Setup
In Task Setup there are two basic options.
• General Settings
• Channel Specic Settings
Use the up/down arrow buttons to choose an option and then Select.
Select Program Task to nish or Cancel to return to the home page.
11.7 General Settings
These settings are common to all channels. Use the up/down arrow
buttons to choose and Select to change. Choose from
• Logging Mode
• Log interval
• Alarms
• Wraparound
• Description
• User Details
• Date
• Time
Scroll
Bar
Page 21

20
11.7.1 Log Interval
Use the up/down arrow buttons to change the value of the
monitoring interval and then select the monitoring units as
either Hours/Minutes/Seconds. To nish select Done or Cancel
to abort.
11.7.2 Alarms
Use the up/down arrow buttons to select from either:
• Alarms Disabled
• Alarms Enabled
• Alarms Enabled with Auto Reset
Press Select to nish or Cancel to abort.
11.7.3 Wrap around
In wrap around mode the instrument will continue to record when its
memory is full by overwriting the rst recorded readings.
Use the up/down arrow buttons to select from either:-
• Disabled
• Enabled
Press Select to nish or Cancel to abort.
11.7.4 Recording Mode
Use the up/down arrow buttons to select from either:
• Manual Start/Stop
• Manual Start/Dated End
• On Date/Time
• Daily
Page 22

21
‘Manual Start/Stop’
If manual start stop is selected then no further action is
required. An option to start/stop recording will appear on the
home screen.
‘Manual Start/Dated End’
Having selected manual start/dated stop, an option will be
placed on the home screen to start recording. A date and
time for dated end needs to be entered. Use the up/down
arrow buttons and press Select to chose either the stop
date or stop time. Use the up/down arrow buttons to select
the number required then use the Day/Month/Year button to
toggle between elds. To nish press Done or Cancel to Abort.
Repeat for the Stop Time.
‘On Date/Time’
Use the up/down arrow buttons to select/enter the start time
and date and the stop time and date. Select Done to nish or
Cancel to abort.
‘Daily Recording’
In Daily Recording mode a start/end time must be selected,
this can be over midnight, and then the day(s) of the week
to record. Enter the start/stop time as previously. Then use
the up/down arrow buttons to highlight each day. Then using
the up/down arrow buttons select either Yes or No to logging
on that day. Finish with Select or Cancel to abort. Repeat for
all seven days if required. Select Done to nish or Cancel to
abort.
11.7.5 Description
A description of no more than 32 characters in length can be
entered. Use the left and right arrow buttons with the up and
down arrow buttons to select each character at a time. Press
Select to choose the character, Done to nish and Cancel to
abort.
Page 23

22
11.7.6 User Details
Free form text can be entered into the 12 user details
boxes. Each title has a maximum of 16 characters and each
description has 24 characters. Press select to enter. Use
the up/down arrow buttons and the left/right arrow buttons to
choose the character. Press Select to conrm, Done to nish
and Cancel to abort.
12. CHANNEL SPECIFIC SETTINGS
Use the up/down arrow buttons to choose and Select to enter. Press Done
to nish or Cancel to abort. Select from:
•Name
• Enabled
• Sensor Type
• Scale Units
• Alarm Hi
• Alarm Lo
• Alarm Delay
12.1 Name
Use the up/down arrow buttons and left/right arrow buttons to chose
a character. Then press Select to conrm, Done to nish and Cancel
to abort.
12.2 Enabled
Use the up/down arrow buttons to select channel enabled (ON) or
channel disabled (OFF). Conrm with Select and Cancel to abort.
12.3 Sensor Type
Use the up/down arrow buttons to select the sensor type for the
channel, if applicable. Conrm with Select, or Cancel to abort.
Page 24

23
12.4 Scale Units
Use the up/down arrow keys to select the scale of measurement.
Press select to conrm or Cancel to abort.
12.5 Alarm Hi
High alarms will be triggered when the value recorded exceeds the
Hi alarm value.
Use the up/down arrow buttons to change the value of the alarm high
setting in the scale previously chosen. Finish with Done or Cancel to
abort.
12.6 Alarm Lo
Low alarms will be triggered when the measured value drops below
the Lo alarm value.
Use the up/down arrow buttons to change the value of the alarm Lo
setting in the scale previously chosen. Finish with Done or Cancel to
abort.
12.7 Alarm Delay
Use the up/down arrow buttons to select the value of the alarm delay.
Use the Minutes/Seconds button to conrm the time. Finish with
Done or Cancel to abort.
Page 25

24
13. INSTRUMENT SETUP
Instrument set up contains the following settings for the logger. These are
all global settings and are not channel specic.
Please use the up/down arrow buttons to select from the following:
• Password
• Display Auto Power Off
• Alarm Speaker
• Alarm Switch Output
• 50/60Hz Rejection
• Printer Setup
• Demo Mode
Finish with Done or Cancel to abort.
13.1 Password
Use this to enter a password and select those functions to be
password protected.
Note: Alarm Acknowledge, Start/Stop Logging and Instrument
Setup can only be password protected if Program New Task is also
protected. Also, these features cannot be set-up from the Evolution
software.
13.2 Display Auto Power Off
The display can be set to auto power off at a choice of xed time
periods or to stay on.
13.3 Alarm Speaker
The alarm speaker can be set to ON or OFF.
13.4 Alarm Switch Output
This has two options. Option one enables the output and option two
determines whether the switch is opened or closed on alarm.
Page 26

25
13.5 50/60Hz Rejection
Set mains rejection as applicable for the region. For example the UK
is 50Hz and the USA is 60Hz.
13.6 Printer Set-up
Choose from three printer options: parallel Hewlett Packard PCL5
compatible, Epson 24-pin dot matrix ESC/P2 compatible or Axiohm
serial small hand held thermal printer model A621B compatible.
13.7 Demo Mode
In this mode the instrument will display 'Sample Data' to enable all
the features of the instrument to be viewed. If the instrument was
recording prior to being set to Demo Mode, readings will be lost.
14. ABOUT EVG
The About EVG screen advises the instrument part number and rmware
versions for reference to upgrades. It will also show the available memory
capacity. Select Cancel to exit.
15. REAL TIME DATA
In this mode the instrument will show a new reading for each of the active
channels every 10 seconds (independent of task). These readings are not
logged.
16. VIEW ALARMS
This screen details all the alarm occurrences recorded by the instrument
by channel and will show them as Hi or Lo alarms. Use the up/down arrow
buttons to select a channel and then the alarms for that channel will be
displayed for all periods. A period can then be selected and the alarms for
that period displayed by selecting Show Hi or Show Lo respectively.
The alarms will be shown by date/time complete with duration. Use the up/
down arrow buttons to select an alarm for 'List' or 'Graph' to view.
Page 27

26
17. HELP
Uniquely with a product of this type, on-line Help is available for every
screen. Simply press the button when required.
After reading the text select Cancel to return to the previous sreen.
?
18. CARE OF THE INSTRUMENT
Use a damp cloth to remove dusty deposits. Use a mild soapy solution
to remove hard or sticky deposits. Do not use solvent-based cleaners or
methylated spirit, etc. The instrument is not waterproof.
Only use the power supply/battery charger supplied.
Page 28

27
19. CHANGING THE BATTERIES
The instrument is tted with 4 rechargeable AA Ni-Mh cells and these
should last many years before replacement is required. In the event that
these go at or where a mains supply is not available, standard alkaline
cells can be tted. When the battery needs changing the Low Battery LED
will ash. At this point, either connect the power adaptor to recharge the
batteries or replace the alkaline cells. To replace the batteries, slide off the
battery compartment cover and replace all four cells. Never mix new and
old cells and do not under any circumstances mix rechargeable cells with
non-rechargeable ones. Be careful to observe the correct polarity.
The switch in the battery compartment must be used to select
rechargeable or normal batteries.
Note: If a low battery warning is indicated at switch-on, replace or
recharge batteries immediately to continue to use the instrument. To avoid
losing date and time, batteries must be replaced as soon as possible. The
data in the instrument is always protected.
Battery charging starts from the moment external power is supplied. It takes
about 48 hours to fully charge the supplied batteries. This is indicated via
the yellow LED. If the external power is removed and replaced within 4
minutes the charge timer will not restart.
Once charging is completed the batteries will be trickle charged.
Page 29

28
20. SPECIFICATIONS
Instrument
Part Number N3014
Measurement Thermocouple types K, N, T, J, R, S, E, B
2-pin sub-min connector
Measurement Range -200°C to Maximum of +1776°C
Scales °C, °F and K.
Resolution 0.1°
Instrument Accuracy (Type K) better than ± 0.1 % of reading ± 0.2°C
(± 0.3°C during battery charging)
Temperature Coefcient (Type K) less than ± 0.01 % of reading ±0.05 °C per °C
change from 23°C.
Channels 8
Ambient Operating Range 0°C to +50°C operating
0 to 97% RH non-condensing
Battery Four Type I.E.C. LR6 Size AA rechargeable Ni-Mh or
IEC LRG Alkaline
External DC input for mains operation/battery charging
Battery Life - Log rate 5 minutes, 2 Ah Rechargeable Ni-Mh 2.7 Ah Alkaline readings
without backlight
Display always on 10 hours 13 hours
Display on for 5 mins/day 80 days 110 days
Logging Memory (all modes) Readings per channel enabled
1 Ch 64,000
2 Ch 32,000
3 Ch 16,000
4 Ch 16,000
5 Ch 8,000
6 Ch 8,000
7 Ch 8,000
8 Ch 8,000
EMC Tested to EN 61326-1
Criteria A performance
Page 30

29
Input/Output
Ports RS232 port for data communications for programming
and data download. Printing to optional portable printer
Display Large monochrome LCD display, 240 x 180 pixels, for
display of data in graphical form.
Alarm Indication Red LED for indication of alarms
Low Battery Yellow LED ashing for low battery indication/
constant for charging
Logging Active Green LED ashing
DC Power Green LED constant
DC Power Adaptor Supplied
Alarm Switch 24V 500mA maximum switching current
Enclosure
Material High impact polystyrene
Wall Fixing 4 point wall xing supplied
Sounder Piezo
Weight 780g
Dimensions Approx. L190mm x W138mm x D45mm
Page 31

303132
Page 32

Page 33

Page 34

Comark Instruments
52 Hurricane Way
Norwich, Norfolk, NR6 6JB England
Tel: 01603 (+44 1603) 256647
Fax: 01603 (+44 1603) 256644
Email: service@comarkltd.com
Website: www.comarkltd.com
Comark Instruments
PO Box 9090, Everett,
WA 98206, USA
Tel: (503) 643 5204
Fax: (503) 644 5859
Email: sales@comarkUSA.com
Website: www.comarkUSA.com
© Comark Instruments Part No. 17877 Issue 5 (10/10)
 Loading...