

Page 1
Objectives
At the end of this section, participants will be able to:
Apply the Property Sheet parameters and auto-inserted
information for the Edge tool to a sample image
Edge Tools
Section 5
© 2024 Cognex Corporation
1
In the fifth section of the In-Sight Vision Suite Standard class, we will focus on Edge Tools.
In machine vision terminology, an Edge is defined as the boundary (either a line, arc, or
circle) between two adjacent pixel groups with contrasting greyscale values. The In-Sight
Edge Tools are used to detect and process statistics about the found edges. In-Sight vision
systems perform edge detection and processing using the Edge Tool’s functions.
Describe the two groups of Edge tool functions
Explain why the region for the Edge tool must be rotated to
detect a horizontal edge
2
© 2024 Cognex Corporation
Version 24.2.1 | 30.August.2024
At the end of this section, participants will be able to:
Apply the Property Sheet parameters and auto-inserted information for
the Edge tool to a sample image
Describe the two groups of Edge tool functions
Explain why the region for the Edge tool must be rotated to detect a
horizontal edge
Section 5 | Slide 1
Section 5 | Slide 2
Page 2
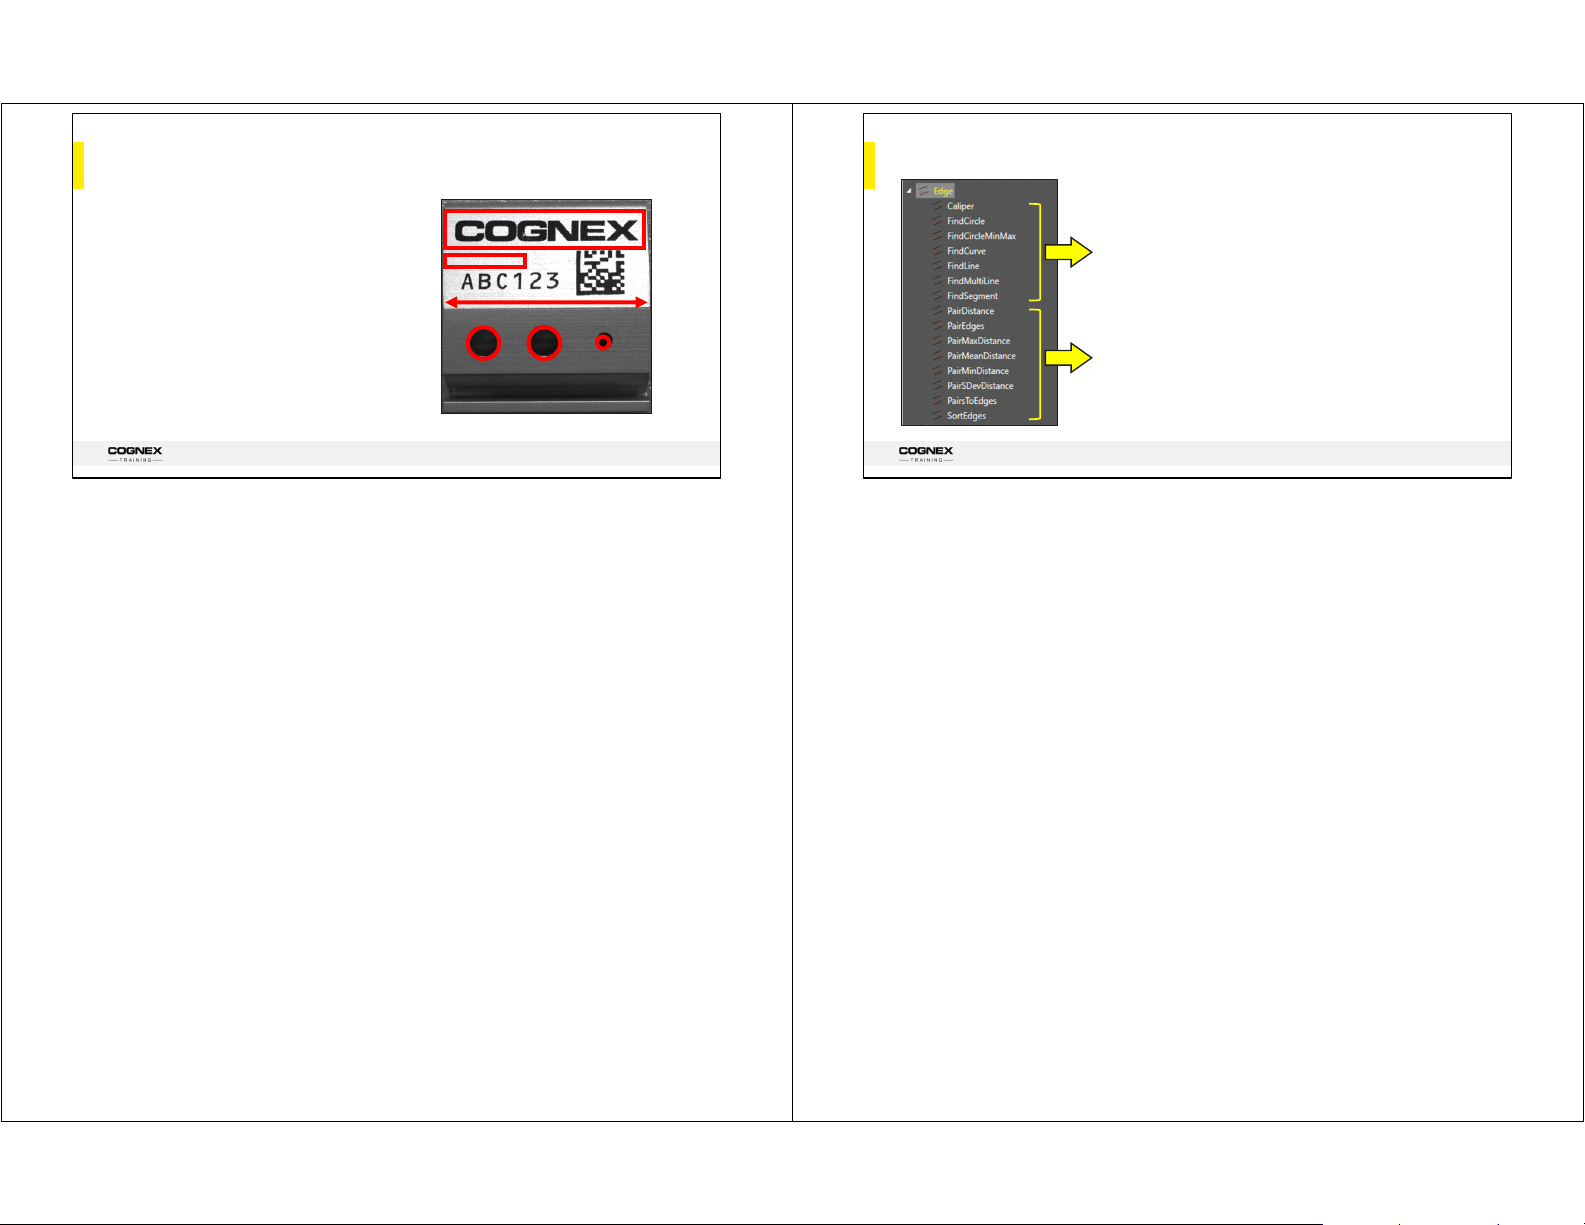
Block Inspection
Steps:
1. Determine the presence and position of block.
2. Determine if the block has a gouge.
3. Determine the block length.
4. Determine if the hole sizes are within
tolerance.
Edge Functions
1
2
3
4
4
4
Functions that extract edges
Functions that operate on previously extracted edges
3
© 2024 Cognex Corporation
Version 24.2.1 | 30.August.2024
Block Inspection Steps:
1. Determine the presence and position of the block using the FindPatterns or
PatMax Tool – this was completed in section 3.
2. Determine if the block has a gouge using the ExtractHistogram tool – just
completed.
3. Determine if the block length is within tolerance using the FindSegment tool.
4. Determine if the hole sizes are within tolerance using the ExtractBlobs tool.
4
© 2024 Cognex Corporation
Version 24.2.1 | 30.August.2024
Extract Edges:
FindSegment: Locates a pair of Edge within an image region and computes the arc
distance between them. FindSegment forms a one-dimensional projection of the image
region by summing pixel values in the x-direction of the region. Edge transitions are
extracted from the projected image data. The arc segment over which the edge-to-edge
distance is computed is derived from the region used to extract the edges.
FindLine: Locates a single straight-line edge within an image region. FindLine forms a
one-dimensional projection of the image region by summing pixel values on radial line
segments scanned in the positive y-direction relative to the region's local coordinate
system. Edge transitions are extracted from the projected image data.
Operate:
PairDistance: Computes the distance between two edges of an Edge data structure.
PairDistance references two edges, by index number, and reports the distance between
their midpoints. The segment over which the edge-to-edge distance is computed is
derived from the region originally used to extract the edges from the image.
PairEdges: Sorts arrays of edges into arrays of edge pairs. PairEdges scans an Edge
data structure for edge pairs that fall within the specified tolerance. Edges belonging to a
pair are ordered consecutively, such that the first edge of a pair is on an even index
number and the second edge of a pair is on an odd index number.
To view a detailed list of each Edge function, go to the Help File.
Section 5 | Slide 3
Section 5 | Slide 4
Page 3
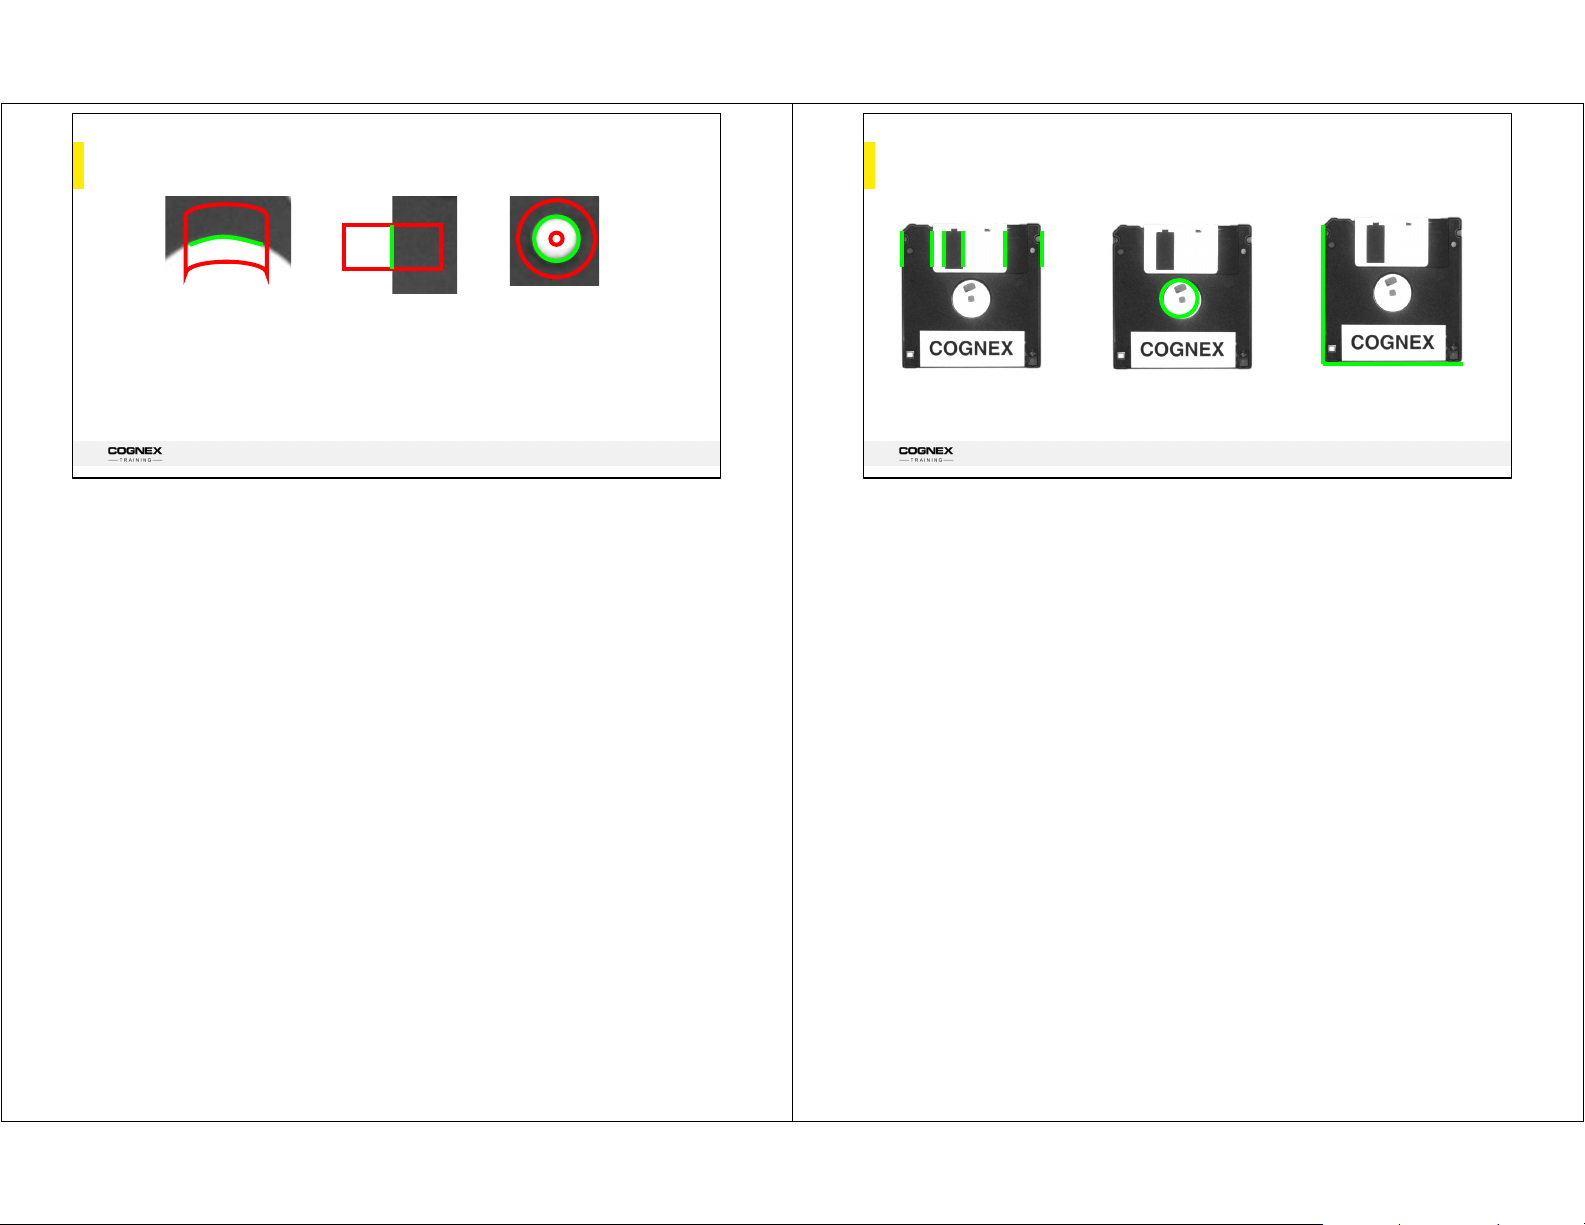
Edges
Edge Applications
Edges represent a location in an image where a transition from dark to light
(or vice versa) occurs
Edges may be straight, curved, or even a complete circle
5
© 2024 Cognex Corporation
Version 24.2.1 | 30.August.2024
In machine vision terminology, an Edge is defined as the boundary (either a line, arc or
circle) between two adjacent pixel groups with contrasting greyscale values. The In-Sight
Edge Tools are used to detect and process statistics about the found edges.
Edges can be comprised of a single edge, or a pair of edges, which consists of two
transitions from dark to light or light to dark as shown above.
6
© 2024 Cognex Corporation
Version 24.2.1 | 30.August.2024
This slide shows some of the applications that you can use an Edge tool to complete:
Gauge parts or part features
Find circle features (center and radius)
Use to quickly locate parts (by finding part edges)
Determine relative contrast using score (0-100)
Section 5 | Slide 5
Section 5 | Slide 6
Page 4
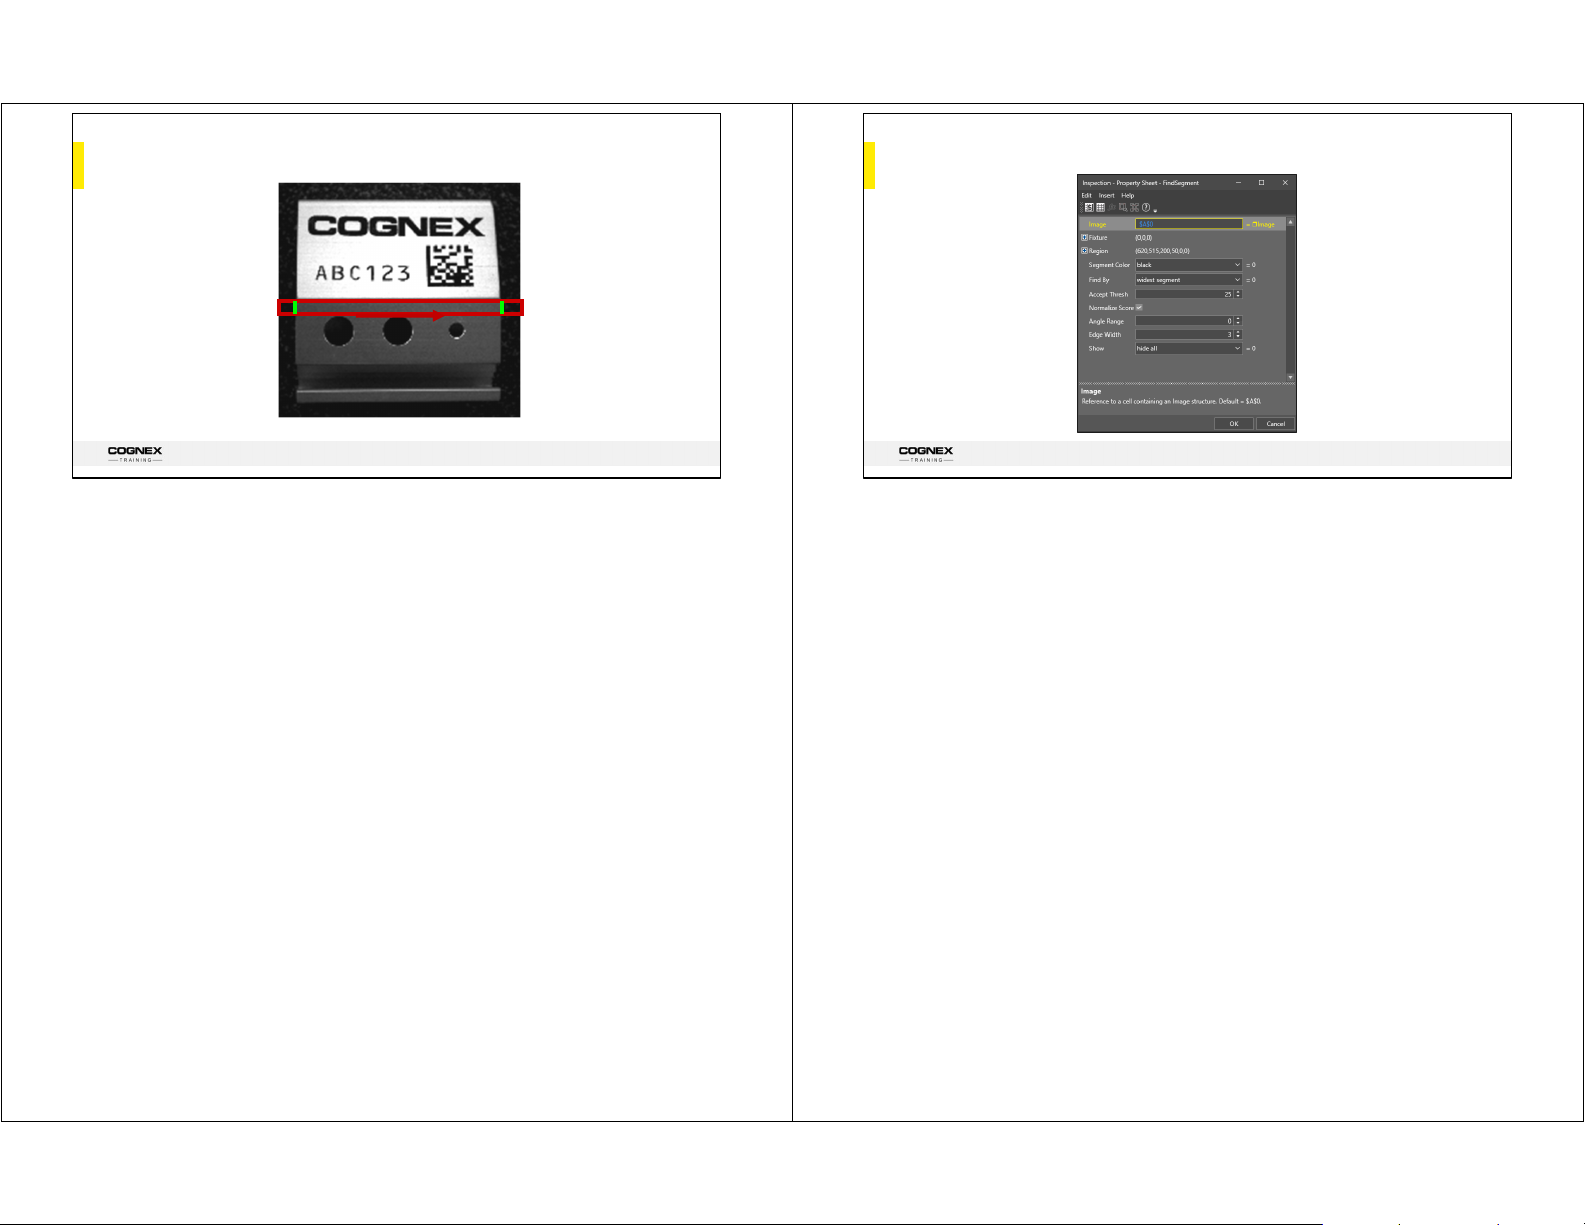
FindSegment
FindSegment: Property Sheet
7
© 2024 Cognex Corporation
Version 24.2.1 | 30.August.2024
The FindSegment Tool locates a pair of edges within an image region and computes the
arc distance between them. FindSegment forms a one-dimensional projection of the image
region by summing pixel values on radial line segments scanned in the positive Y-direction
relative to the region’s local coordinate system.
Edge transitions are extracted from the projected image data. The arc segment over which
the edge-to-edge distance is computed from the region used to extract the edges.
The direction of the arrow in the search region is the most important point to understand
in this section.
© 2024 Cognex Corporation
8
The FindSegment Property Sheet includes the following:
Image – Reference to target image cell
Fixture – Where tool should fixture itself
Region – Region specifying interest zone
Segment Color – Grayscale intensity between edges (black or white)
Find By – Helps select from multiple pairs
Accept Thresh – Minimum contrast score
Normalize Score – Helps find low contrast edges
Angle Range – Allowed angle variation for edges
Edge Width – Number of pixels over transition
Show – Graphic options for display
Version 24.2.1 | 30.August.2024
Section 5 | Slide 7
Section 5 | Slide 8
Page 5
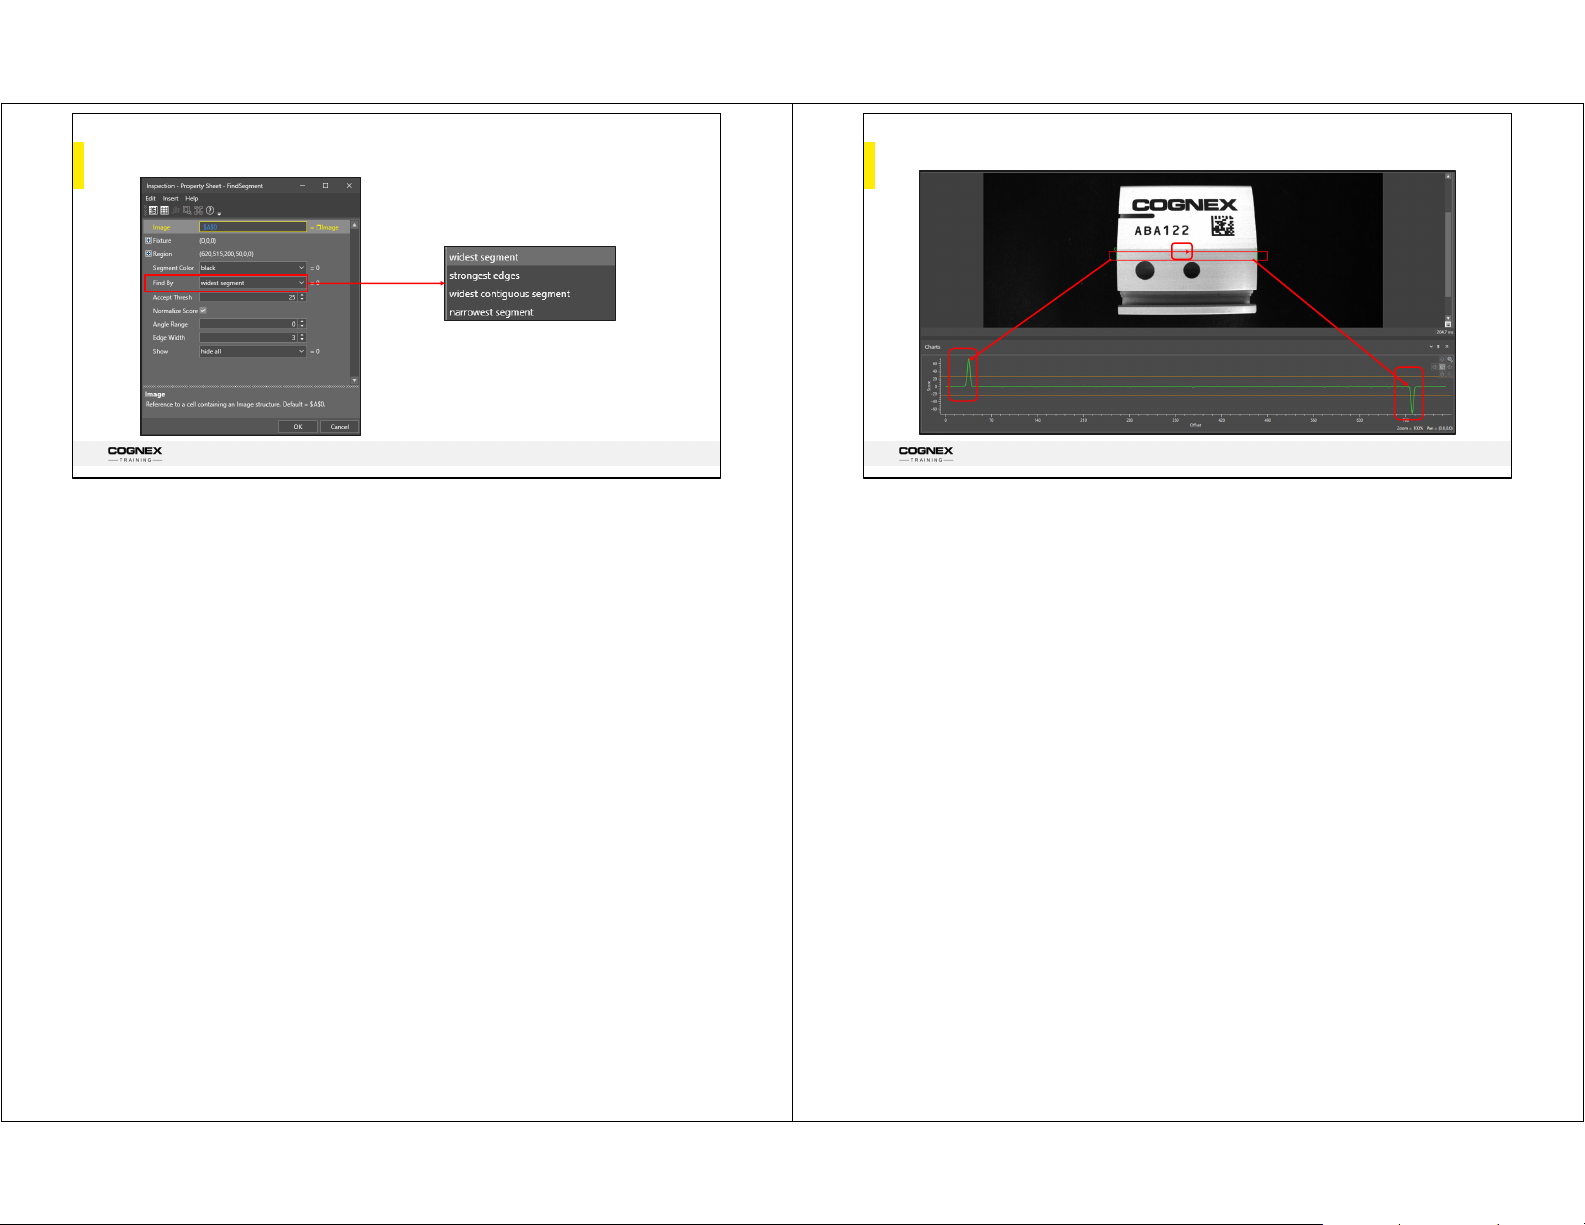
FindSegment: Find By
FindSegment: Region
Pay attention to the
arrow direction!
9
© 2024 Cognex Corporation
Version 24.2.1 | 30.August.2024
The Find By parameter specifies the edge selection technique.
The choices are:
Widest Segment (default) finds the two edges farthest apart from which a
segment of the specified Segment Color can be identified.
Strongest Edges finds the two edges with the strongest response scores from
which a segment of the specified Segment Color can be identified.
Widest Contiguous Segment finds the two edges from which a segment of the
specified Segment Color can be identified without any other edges between
them.
Narrowest Segment finds the two edges nearest each other from which a
segment of the specified Segment Color can be identified.
This parameter can help when we have multiple edge pairs candidate in the search region.
10
© 2024 Cognex Corporation
Version 24.2.1 | 30.August.2024
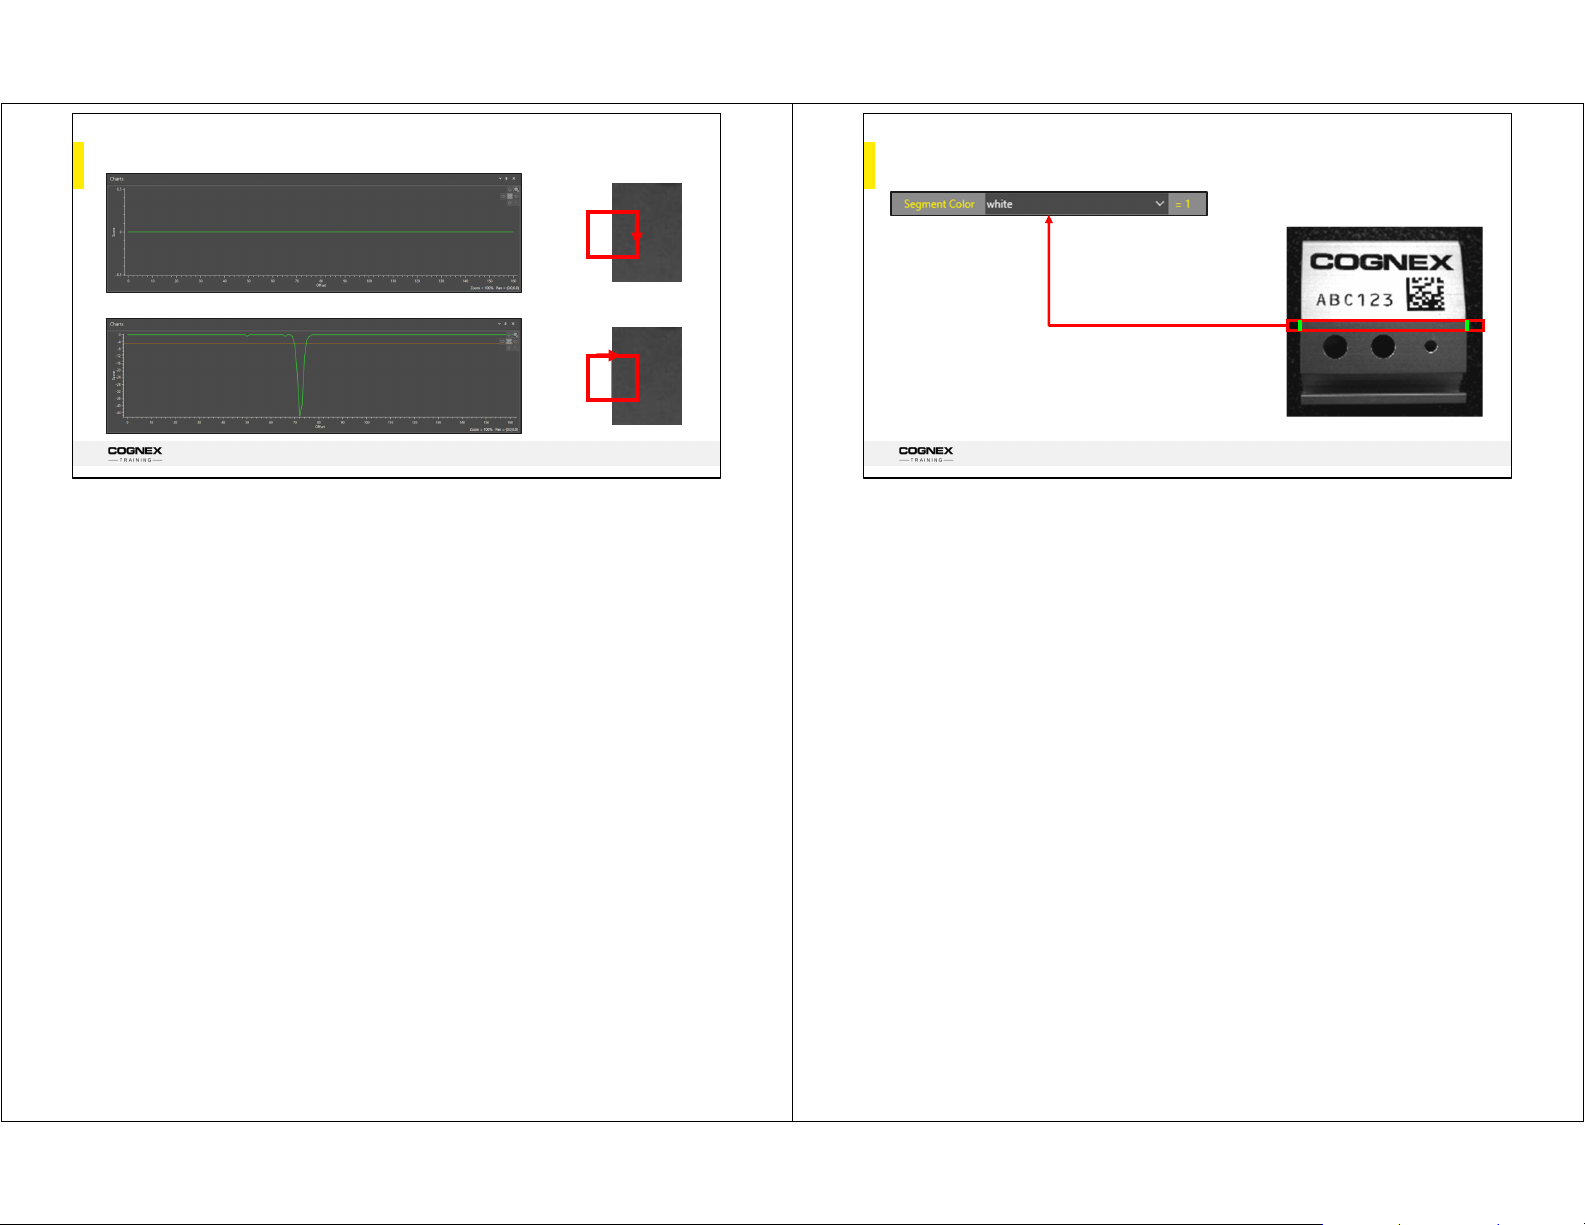
The Edge Response Chart (displayed when the Show parameter is set to show all: input,
result and chart) displays the first derivative of the greyscale values found in the ROI; with
peaks and valleys representing the major edge transitions as show above.
The Accept Thresh/Minimum Contrast parameter is used to set a minimum peak height
(contrast threshold). With this set, any peaks that are lower than the minimum peak height
are excluded from the results. This allows the inspection analysis to be limited to just those
edges in the image that are of a certain magnitude.
Use the function’s edge response chart to determine the correct contrast threshold.
The Score axis is defined by the Score (100 to -100) and the Accept Threshold
parameter set for the tool. Peaks (or positive scores) indicate that the edge
transitions from dark to light, while valleys (or negative scores) indicate that the
edge transitions from light to dark (a score of 0 indicates no edge was detected.
The Offset axis refers to the ROI of detecting the edge feature, where 0
represents the beginning of the region and the right-hand value marks the
maximum width (in pixels) of the region. The apex of the peaks or valleys along
the Offset axis indicates the position of the found edge within the ROI.
Section 5 | Slide 9
Section 5 | Slide 10
Page 6
FindSegment: Chart
FindSegment: Segment Color
NOT
FOUND
FOUND
11
© 2024 Cognex Corporation
Version 24.2.1 | 30.August.2024
It is important to be aware that Edge tools have a specific direction in which they search –
notice the direction of the arrows above. The arrow must touch the edge in order to find it –
the arrow in the first example is parallel to the edge so it does not find it.
N
OTE: The way that you draw your ROI is the direction of the search arrow.
12
© 2024 Cognex Corporation
Version 24.2.1 | 30.August.2024
Segment Color – specifies the color of the segment to be located. FindSegment will only
report edge pairs of the specified polarity.
0 = black (default) – Specifies black or white-to-black followed by black-to-white polarity.
1 = white – Specifies white or black-to-white followed by white-to-black polarity.
Section 5 | Slide 11
Section 5 | Slide 12
Page 7
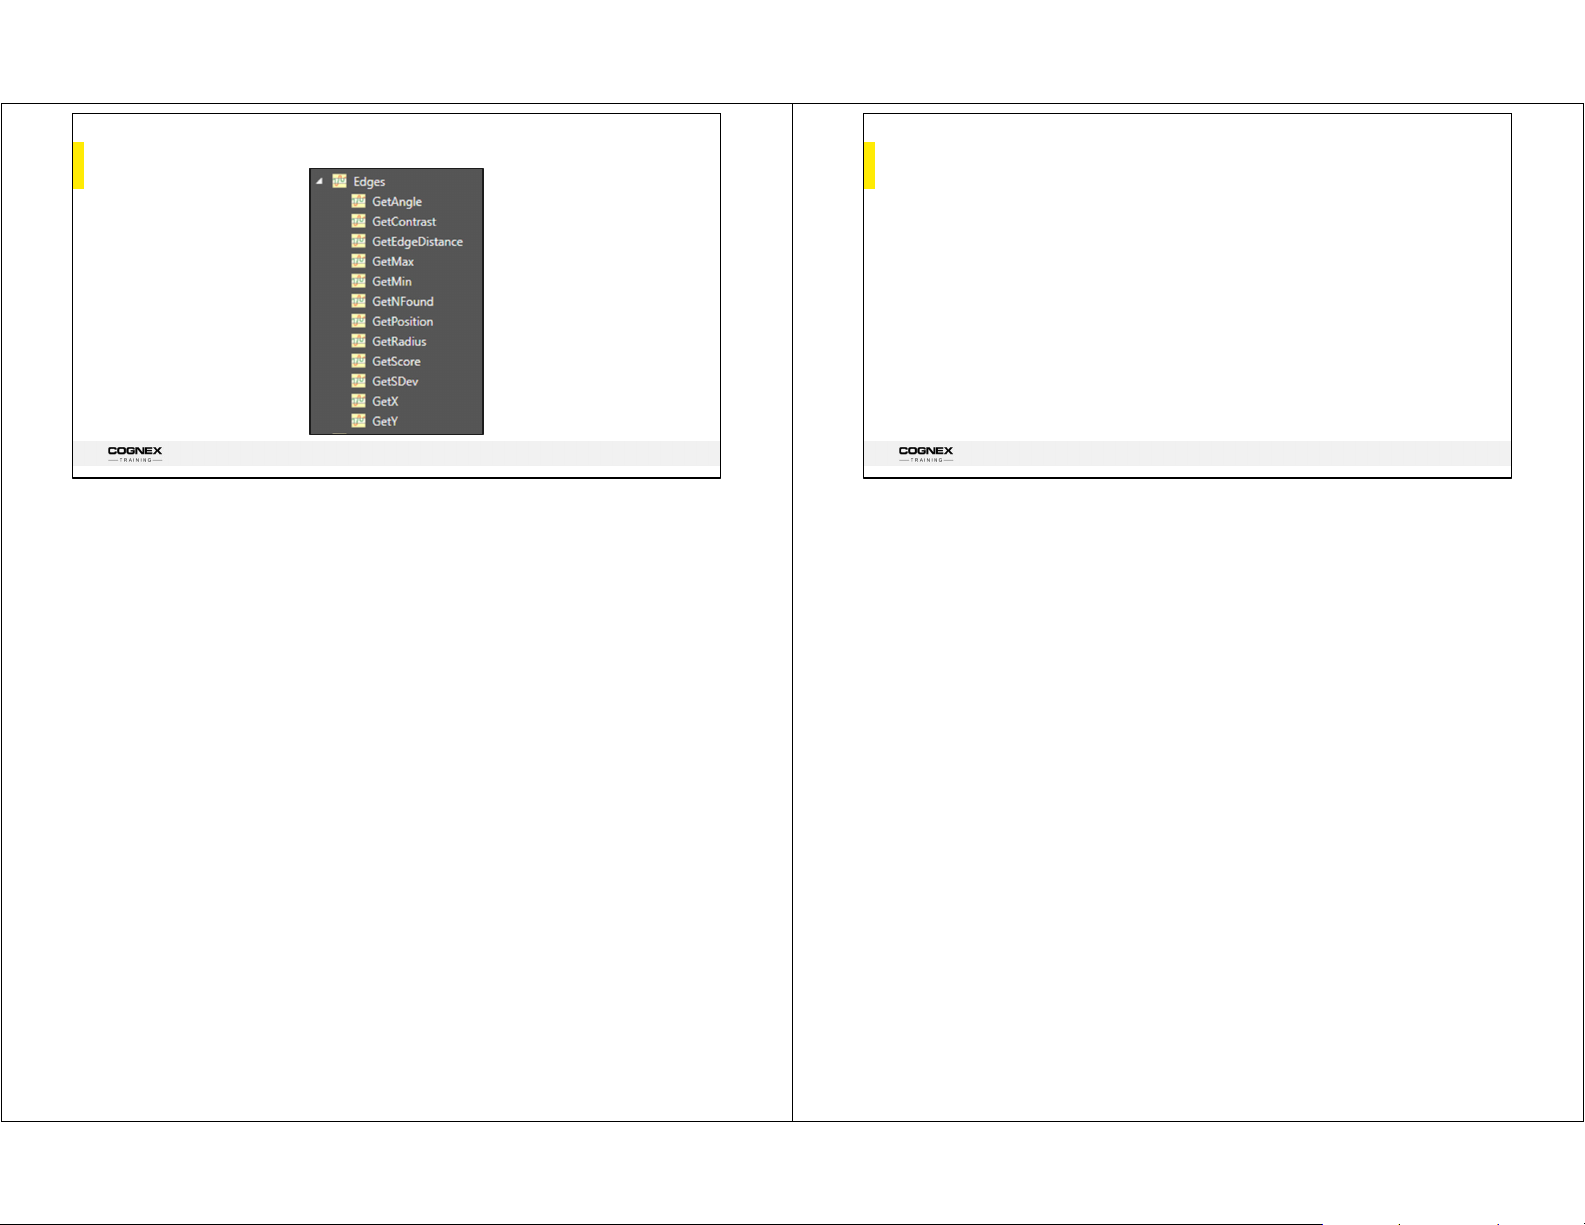
Edges: Vision Data Access
Functions
Summary
There are two groups of Edge Tool functions:
Functions that find edges
Functions that operate on edges returned by the
functions in the first group
13
© 2024 Cognex Corporation
Version 24.2.1 | 30.August.2024
This is an overview of the VDA functions available for Edge tools from the Help file.
GetAngle(Edges, [Index]): Returns the Angle of the indexed edge.
GetContrast(Edges): Returns the average contrast between the foreground and
background (in grey levels, 0 to 255) found. Contrast is positive for black-to-white transitions,
and negative for white-to-black transitions. The Edge structure must be created by a
FindCircleMinMax function.
GetEdgeDistance(Edges, [Index]): Returns the distance between two edges (edge pair). The
Edge structure must be created by a Caliper function.
GetMax(Edges): Returns the radius of the maximum deviation from the best edge. The Edge
structure must be created by a FindCircleMinMax function.
GetMin(Edges): Returns the radius of the minimum deviation from the best edge. The Edge
structure must be created by a FindCircleMinMax function.
GetNFound(Edges): Returns the number of edges found.
GetPosition(Edges, [Index]): Returns the region X position in pixels of the edge or the edge
pair center.
GetRadius(Edges, [Index]): Returns the radius of a specified circle or arc.
GetScore(Edges, [Index1], [Index2]): Returns the Score value (0-100) from the indexed edge.
Score is positive for black-to-white transitions and negative for white-to-black transitions
(except for FindSegment and FindCircleMinMax where Score is always positive).
GetSDev(Edges): Returns the standard deviation value. The Edge structure must be created
by a FindCircleMinMax function. Note: This calculation is a biased standard deviation, where
the denominator is N-1 (an unbiased standard deviation has a denominator of N).
GetX(Edges, [Index1], [Index2]): Returns a x-coordinate. Index1 selects the edge number,
and Index2 specifies an end point (0 = top-most point; 1 = bottom-most point).
GetY(Edges, [Index1], [Index2]): Returns a y-coordinate. Index1 selects the edge number,
and Index2 specifies an end point (0 = left-most point; 1 = right-most point).
© 2024 Cognex Corporation
14
In this section, we covered the following:
There are two groups of Edge Tool functions:
Functions that find edges
Functions that operate on edges returned by the functions in the first group
Version 24.2.1 | 30.August.2024
Section 5 | Slide 13
Section 5 | Slide 14
Page 8
Skills Journal
Complete:
Section 5
Skills Journal
Lab Exercise
© 2024 Cognex Corporation
15
Complete:
Skills Journal (image designed by pngtree)
Lab Exercise
Version 24.2.1 | 30.August.2024
Section 5 | Slide 15
 Loading...