

Page 1

s
ClearView IPMI 1.0
User’s Guide
for V7000 Chassis and
V7100S Blade Management
ClearCube Technology, Inc.
Page 2

Copyright© 2008 ClearCube Technology, Inc. All rights reserved.
Under copyright laws, this publication may not be reproduced or transmitted in any form, electronic or mechanical,
including photocopying, recording, storing in an information retrieval system, or translating, in whole or in part,
without the prior written consent of ClearCube Technology, Inc.
This information is subject to change without notice and ClearCube shall not be liable for any direct, indirect,
special, incidental or consequential damages in connection with the use of this material.
Trademarks
Sentral™, ClearCube™, C3 Architecture™, Blade Switching BackPack™, PC Blade™, and C/Port™
are trademarks of ClearCube Technology Inc. Product and company names mentioned herein
are trademarks or trade names of their respective companies.
Patents
The ClearCube Architecture and its components described in this user manual
are protected by numerous granted and pending U.S. and international patents.
Granted patents include: US05926172, US05966056, US05994952, US06012101, US06020839, US06037884,
US06038616, US06119146, US06148182, US06167241, US06385666, US06421393, US06426970,
US06633934, US06708247, US06735658, US06886055, and US06944826.
Inquiries regarding patented technology should be directed to
ClearCube Corporate Headquarters.
Page 3

iii
Table of Contents
1. Overview .................................................................................................. 1
2. Login and Blade System ......................................................................... 2
2.1. Blade System View ............................................................................. 5
2.2. Blade UI .............................................................................................. 8
2.3. Power Supply UI ............................................................................... 10
2.4. Gigabit Switch UI .............................................................................. 12
2.5. CMM UI ............................................................................................ 16
2.6. InfiniBand UI ..................................................................................... 19
2.7. Failure Summary UI .......................................................................... 21
2.8. Blade Summary UI ........................................................................... 21
2.9. Power Supply Summary UI .............................................................. 22
2.10. Gigabit Switch Summary UI .............................................................. 23
3. Text Console .......................................................................................... 24
4. KVM Console and Optimizing Keyboard and Mouse Settings .......... 26
5. Event Log ............................................................................................... 28
6. Logon Management .............................................................................. 29
7. Virtual Media .......................................................................................... 32
8. CMM Setting ........................................................................................... 33
9. Connecting to the Slave CMM .............................................................. 34
Page 4

1
1. Overview
You can use ClearCube ClearView IPMI to manage ClearCube V7000 chassis
containing one or more Chassis Management Modules (CMM) and ClearCube
V7100S blades. ClearView IPMI sends messages to and from the CMM. Messages
are encapsulated in an RMCP+ (Remote Management Control Protocol) packet that
follows the IPMI standard.
ClearView IPMI monitors and reports on the status of a V7100 system, including the
blade server, power supply, gigabit switch, InfiniBand and CMM modules. ClearView
IPMI shows the V7000 and V7100 in a GUI for easy management, enabling
administrators to monitor the status of each blade module. ClearView IPMI also
supports remote KVM and virtual media. This document describes how to use
ClearView IPMI to manage V7000 and V7100 systems.
Page 5
2
2. Login and Blade System
One V7000 chassis can have a maximum of two CMM modules, with one as the
master CMM and the other one as the slave CMM. Only the master CMM has the full
management functions for the V7000 chassis. For normal system management, you
should connect to the master CMM. The slave CMM is also operating when the
V7000 is turned on. It will take the role of master CMM if the original master CMM
is reset or hangs. By the way, once slave CMM take over master, the master CMM
will become the slave CMM.
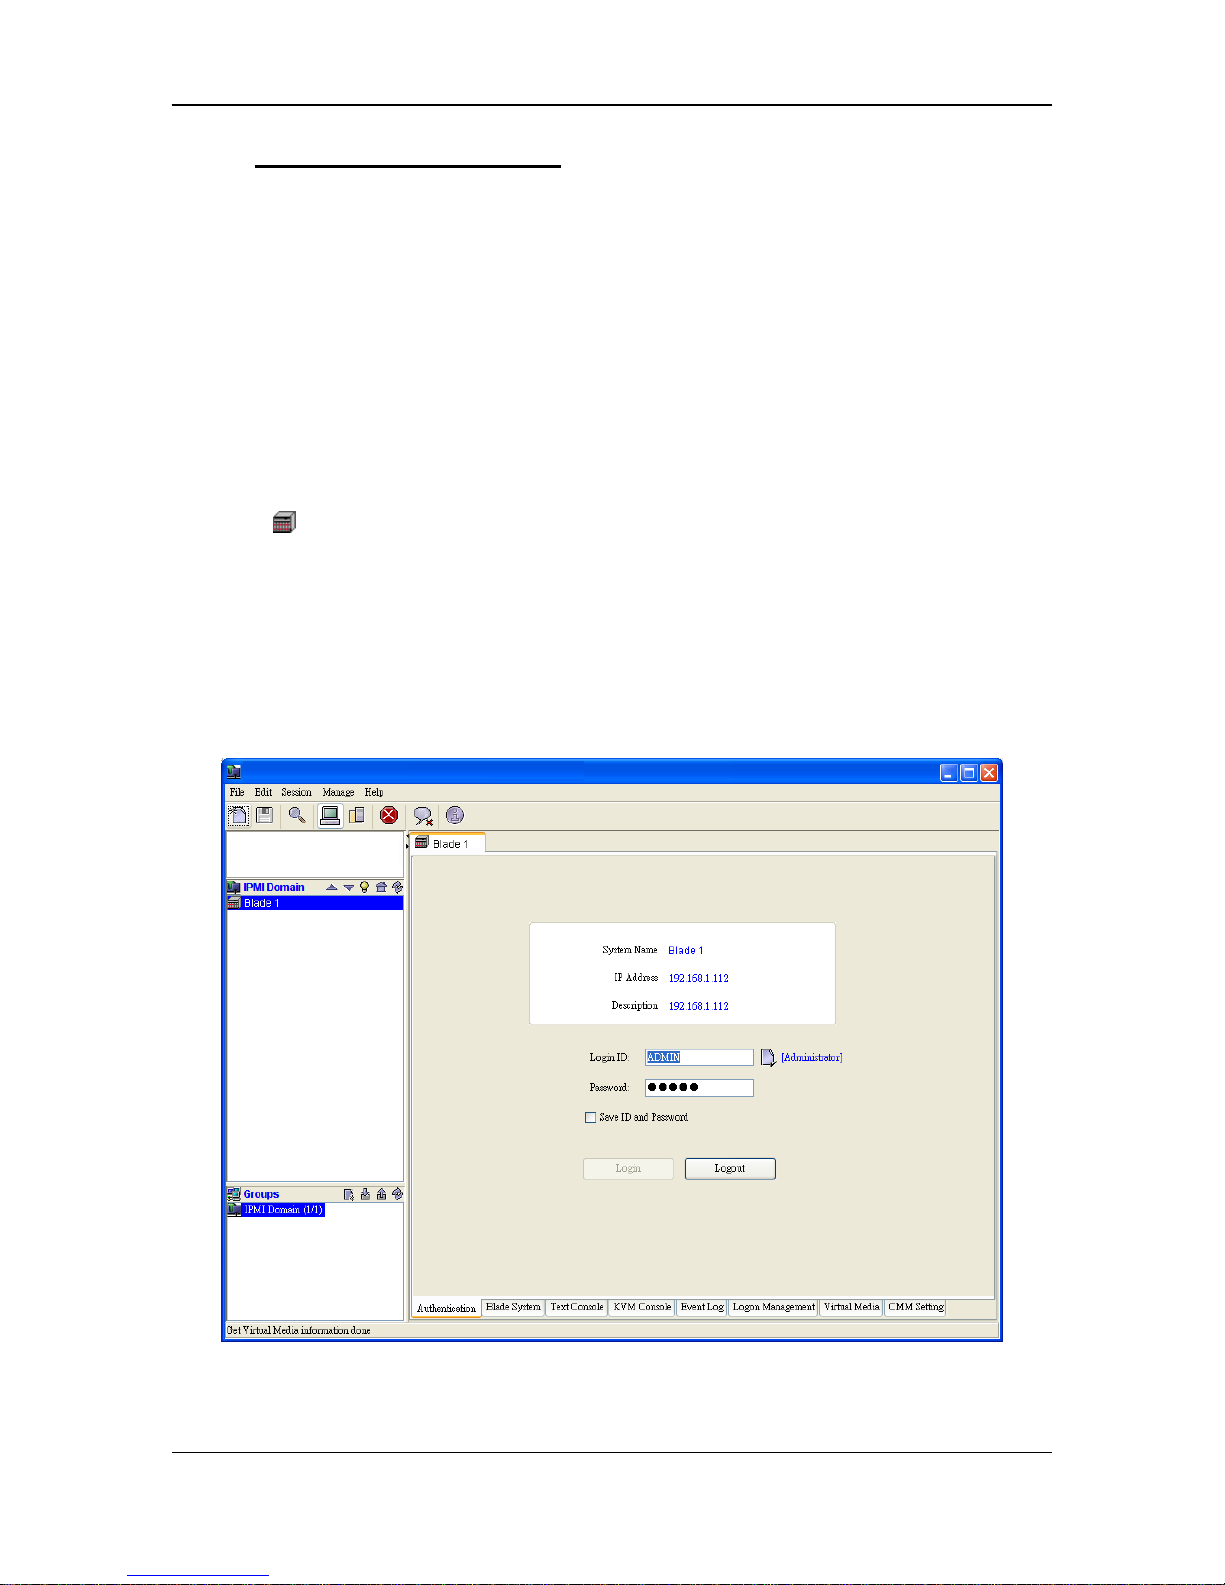
In the ClearView IPMI device list, as shown in Figure 1-2, you will see the V7000
icon ( ) once the CMM added. Double-click this item to display the login screen. To
login:
1. Type in your Username in the Login ID box.
2. Type in your Password in the Password box and click on Login.
3. The default username and the default password are both ADMIN.
Figure 1-2. Logging on to the V7000
Page 6
3
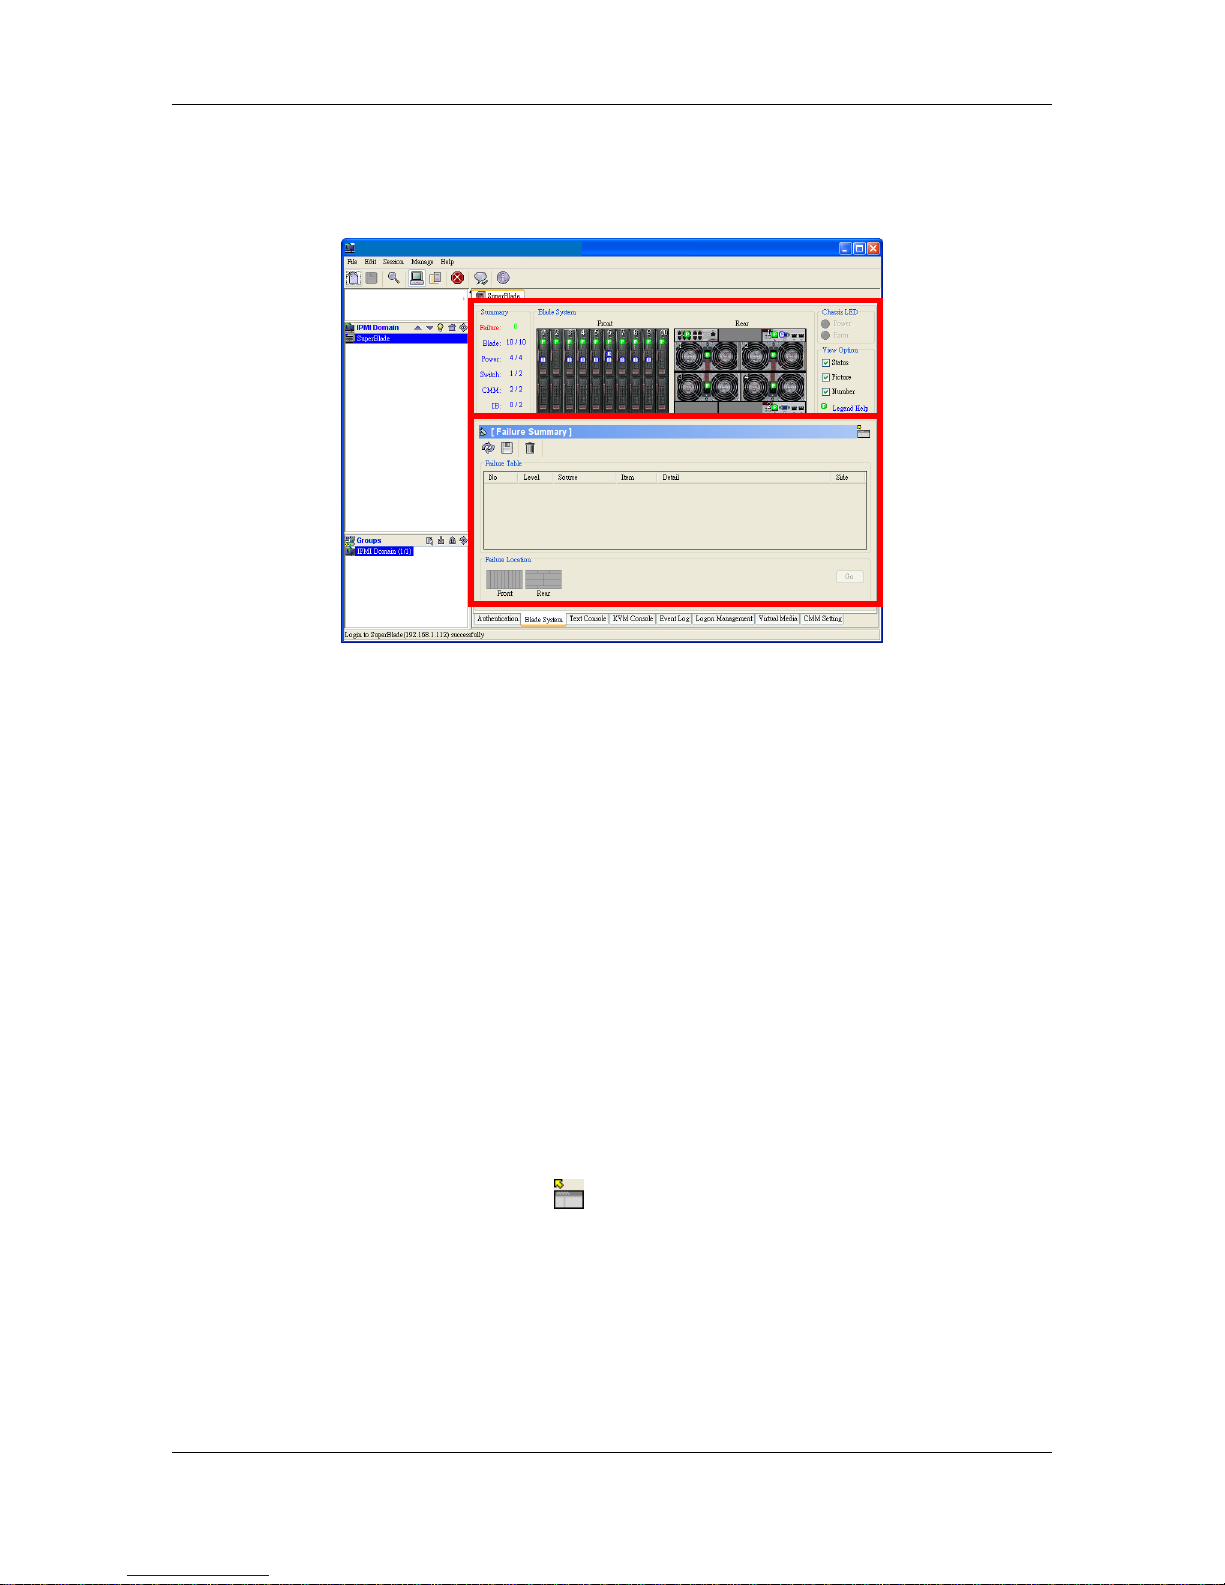
Once you login successfully, the Blade System tab is displayed. This is the main
system management UI (User Interface), as shown in Figure 1-3.
Figure 1-3. Blade System UI (User Interface)
The upper window displays the status of all blades being monitored. Any changes to
the V7100S will be reflected in this view. For example, if someone removes blade
module 1, you will see the blade 1 icon disappear (become grayed out). If you turn off
blade module 10, the power LED on blade 10 will become amber. Different types of
blade modules can occupy the same blade system. If you install a different type of
blade module, its icon in the Blade System View will likewise appear slightly
different due to its type. In this way, the Blade System View reflects a real and current
picture of the V7100S modules.
Each module icon in the Blade System View can be clicked on to show a detailed list
of functions in the bottom (Module User Interface) window. Additional summary
items can be viewed as here well. The Module UI allows users to obtain additional
information and send additional commands to the blade modules.
The Module UI has a detach button ( ) at the upper-right of the window. Clicking
on it will detach the UI as a single window as shown in Figure 1-4. This is useful for
continual monitoring of a specific blade module.
Blade System View
Module UI
Page 7

4
Figure 1-4. Detached Module UI Window
Page 8
5
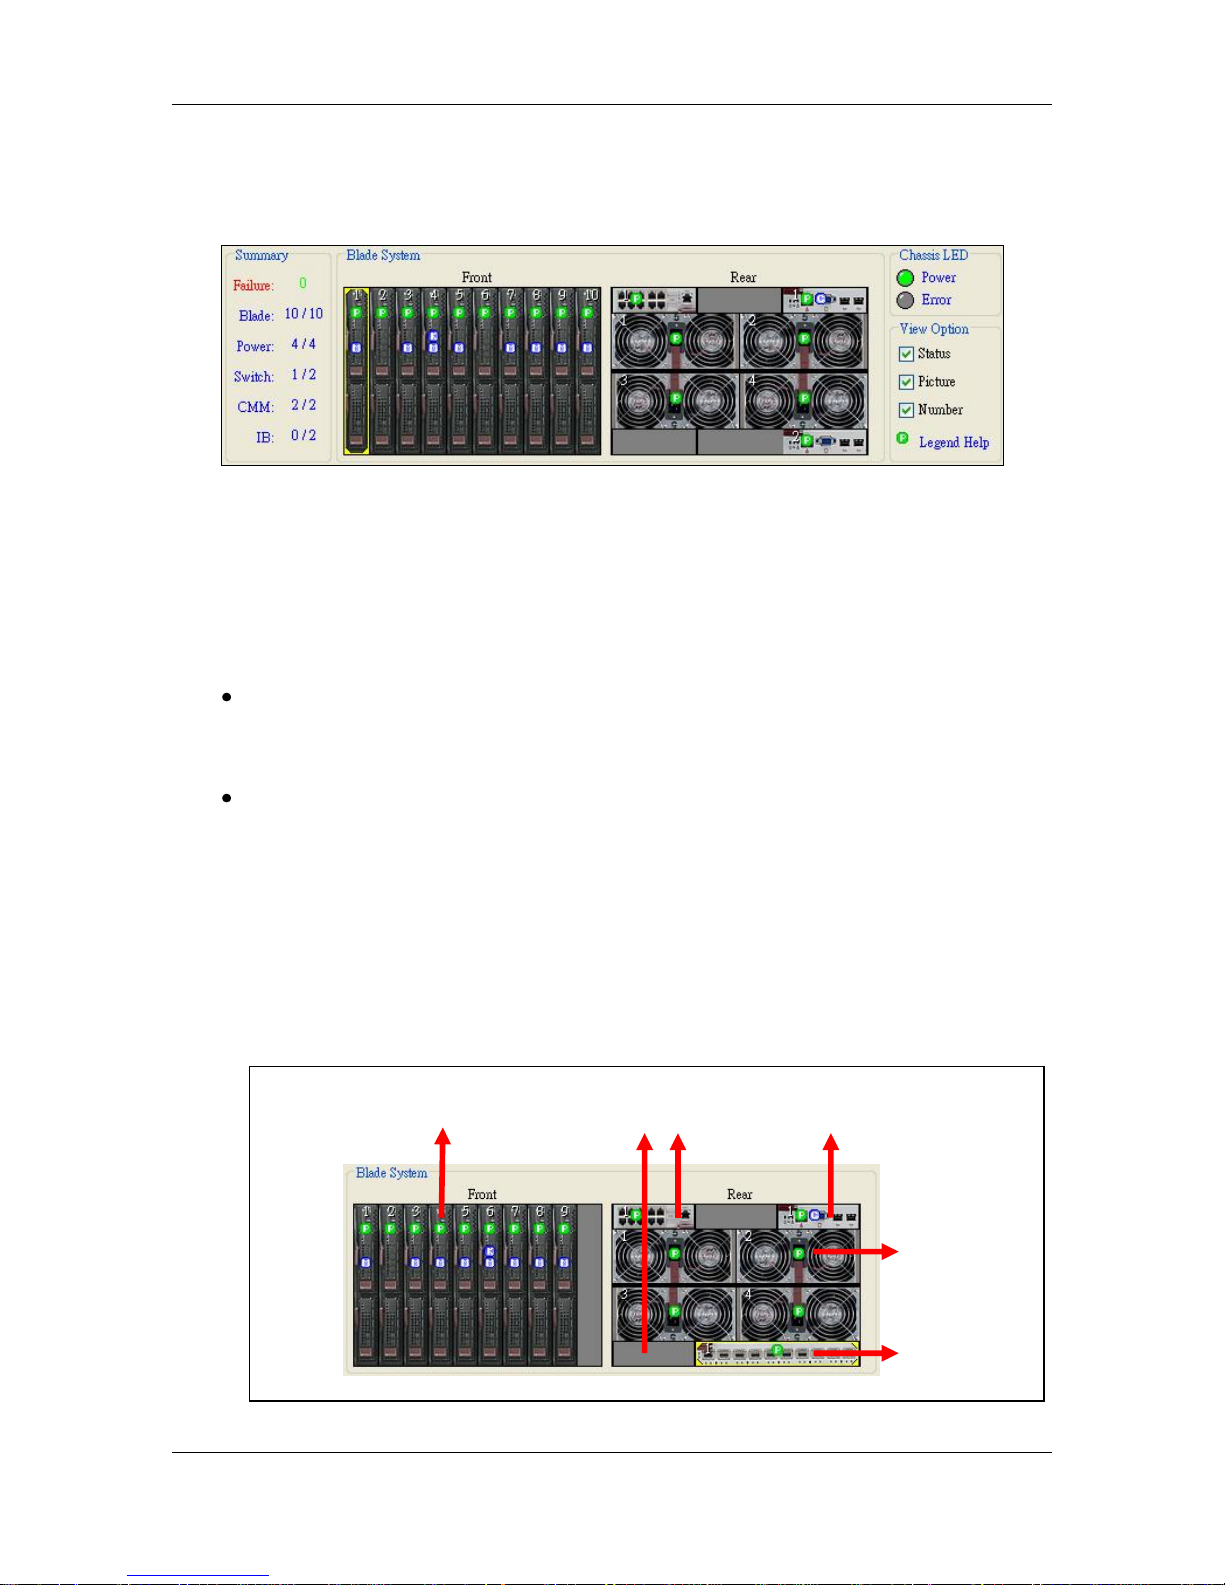
1.1. Blade System View
Figure 2-1. Blade System View
As shown in Figure 2-1, the Blade System View provides an overview of the V7000
and V7100S system.
There are four sections in the Blade System View:
Summary: Shows a summary of failures and how many of each type of module
have been installed. The Failure, Blade, Power and Switch items are shown in
greater detail in the Module UI.
Blade System: As shown in Figure 2-2, the Blade System View shows both front
and rear views of the blade system. The front view shows blade module status
while the rear view shows the status of the power supply, gigabit switch,
InfiniBand and CMM. A yellow rectangle appears around an icon when it is
selected (clicked on), as shown in Figure 2-3. Each icon has a symbol to show its
current status. Each module may display one or more symbols. Refer to the
Legend Help (Figure 2-4) to determine the meaning of a symbol. (Click Legend
Help in the View Option window at the lower right area of the screen.)
Figure 2-2. Blade Module Layout
Blade Modules
Gigabit Switch
InfiniBand
(Or CMM)
Power Supply
Modules
CMM
Page 9
6
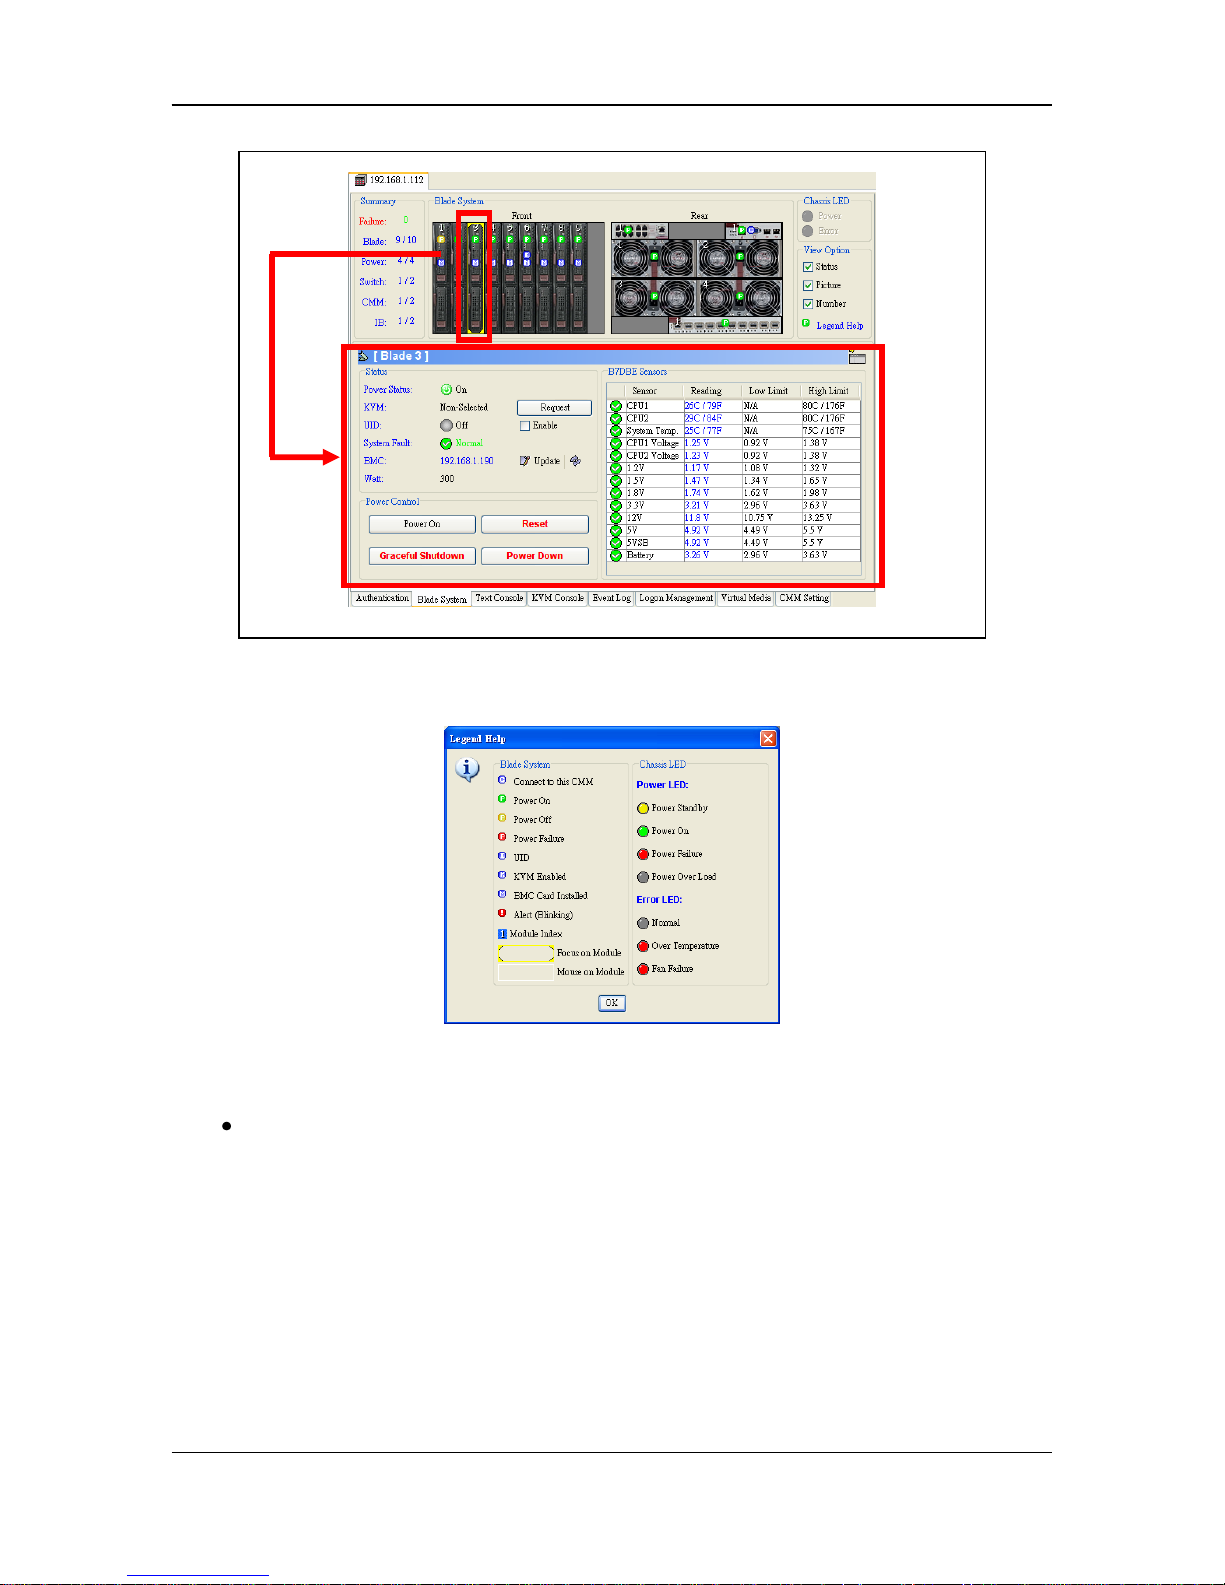
Figure 2-3. Selected Blade Module and Corresponding Management UI
Figure 2-4. Legend Help
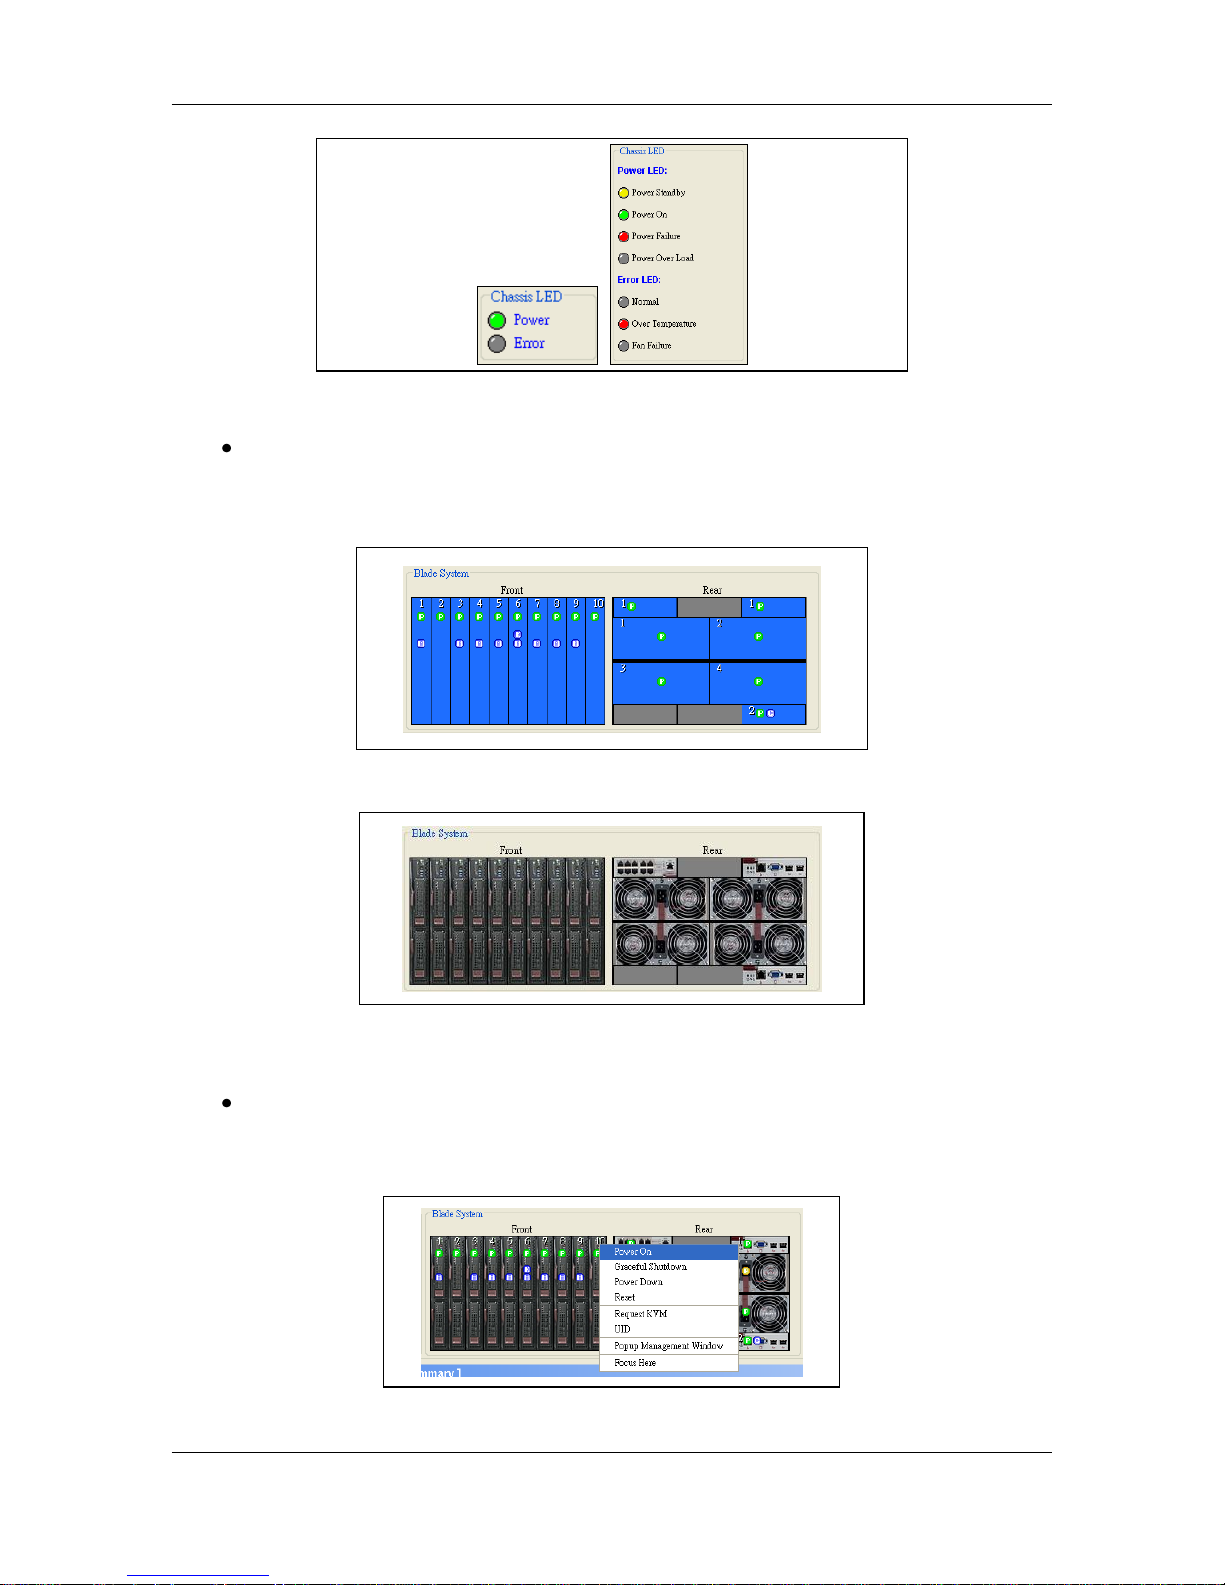
Chassis LED: Figure 2-5 shows the Chassis LED section, which displays the
Power and Error LEDs for the V7000 chassis. The Power LED shows the current
Blade System power status. The Error LED indicates a system over temperature or
fan failure condition. The Legend Help box also shows the various states indicated
by the Classis LED.
Page 10
7
Figure 2-5. Chassis LED and Legend Help
View Option: This option allows a user to choose to show or hide the module
status, picture and number. Figure 2-6 and Figure 2-7 show the results of two
different sets of View Options checked.
Figure 2-6. Show Status and Number, Hide Picture
Figure 2-7. Only Show Picture
Popup Menu Supported: A user can right click on a blade module to enable a
popup window to perform certain actions. As shown in Figure 2-8, right clicking
on a blade displays a window with power, UID and KVM functions.
Figure 2-8. Blade Popup Menu
Page 11

8
1.2. Blade UI
Figure 2-9. Blade UI
Click on a blade module. The Blade UI as shown in Figure 2-9 will appear in the
Module UI section at the bottom of the screen. It contains the following:
Status
Power Status: Shows the current power status. Indications include power on,
power off and power fail status.
KVM: This shows whether KVM is selected or not. Click the Request button to
request KVM on this blade.
UID: This shows the status of the UID LED. Select the Enable option to enable or
disable the UID. Once the UID enabled, the UID LED on the blade panel will flash.
System Fault: This indicates the system fault status.
BMC: Shows BMC status. If BMC is installed, the BMC IP address will appear
here. Click the Update button ( ) to update the BMC IP as shown in Figure
2-10. Click the Refresh button ( ) to reload the BMC IP. If a BMC is not
installed, not installed appears and the Update and Refresh buttons are
disabled.
Watt: The estimated power consumption (wattage) of this blade. It is a static
value supplied by BIOS.
Figure 2-10. Updating the BMC IP
Page 12
9
Power Control
Power On: Click to power on the blade.
Reset: Click to reset the blade.
Graceful Shutdown: Click to perform a graceful shutdown on the blade.
Power Down: Click to power down the blade.
Figure 2-11. Power Control Buttons
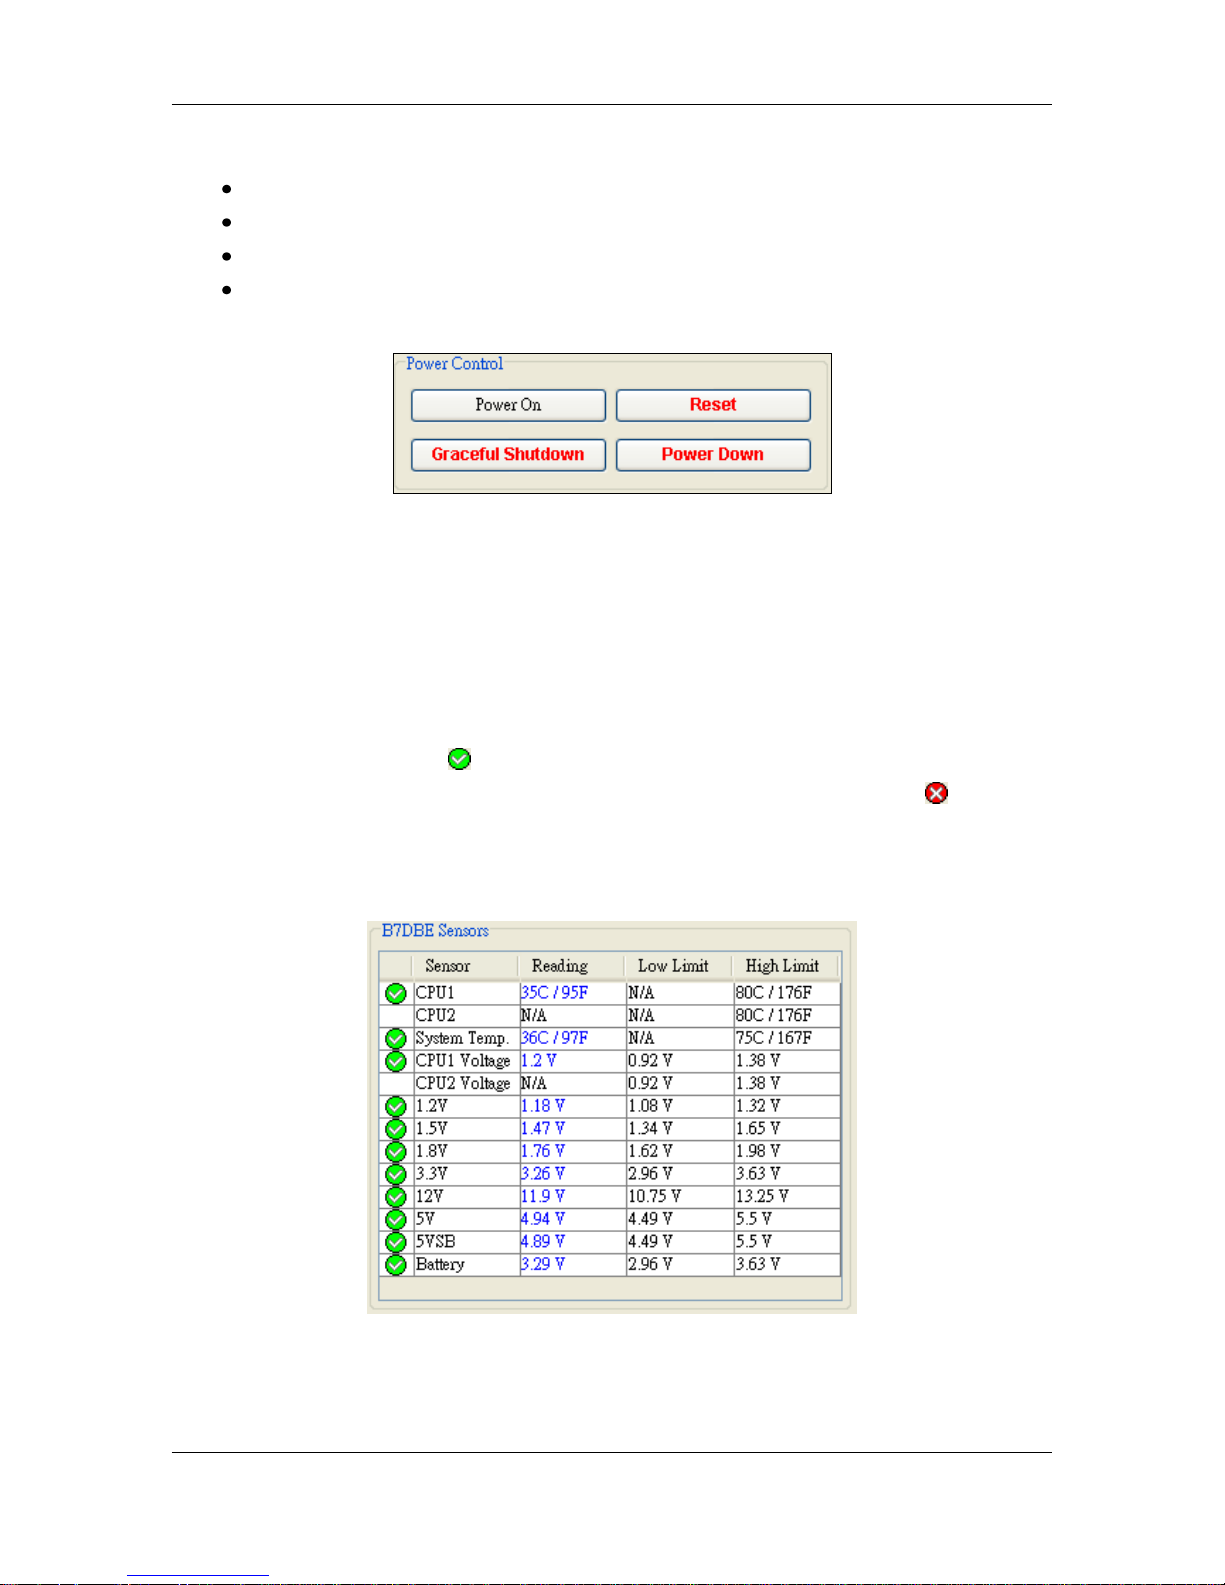
Sensors
As seen in Figure 2-12, the title of the sensor table displays the blade motherboard.
The sensor table shows the CPU(s), system temperature and voltages of the currently
selected blade. The table headers indicate the status, sensor name, reading and the low
and high limits. If the status of a sensor is normal, the reading value is displayed in
blue and an OK symbol ( ) is displayed at the beginning of the row. If a sensor status
is out of range, the reading will be red and the sensor will have a fail symbol ( ). If
the sensor is not present, the reading will be displayed as N/A and without a status
symbol.
Figure 2-12. Blade Sensor Table
Page 13

10
1.3. Power Supply UI
Figure 2-13. Power Supply UI
Clicking on a power supply module displays the Power Supply UI in the Module UI,
in Figure 2-13. This UI includes the following:
Status
Power Status: This shows the current power status: either power on, power off or
power failure.
Fan 1 Status: This shows the status of power supply fan 1 as normal or abnormal.
Fan 2 Status: This shows the status of power supply fan 2 as normal or abnormal.
Watts: This shows total wattage provided by this power supply.
DC current: This shows the DC current. (Only supported for 1400W power
supplies.)
AC RMS current: This shows the AC RMS current. (Only supported for 1400W
power supplies.)
Firmware Ver: This shows the power supply’s firmware version.
FRU Version: This shows the power supply’s FRU version.
Centralized Power Fan Speed Control
Centralized Power Fan Speed Control is used to manage all power supply fans in the
V7100S. The default is automatic fan speed control. When in the automatic mode, the
CMM will monitor the system loading and optimize all fan speeds accordingly. The
manual speed fan control mode allows a user to manually alter the speed of the power
supply fans by clicking one of the arrow icons. Set to minimum speed by clicking the
Page 14

11
icon numbered 1 and to maximum speed by clicking the icon numbered 4. The icons
numbered 2 and 3 are for incremental increases between the minimum and maximum
settings. After changing the fan speed, you should see the fan rpm change in the status
screen. These settings affect all fans simultaneously; you cannot control the speed of
individual fans.
Figure 2-14. Centralized Power Fan Speed Control
Power Control
Power On: Click to power on the power supply.
Power Off: Click to power off the power supply.
Figure 2-15. Power Supply Control
Power Supply Temperature and Power Supply Fans
As Figure 2-16 shows, this displays the current power supply temperature and fan rpm.
Please note that when one power supply is powered off, its fans will be driven by the
other power supply.
Figure 2-16. Power Supply Temperature and Fans
Page 15

12
1.4. Gigabit Switch UI
Figure 2-17. Gigabit Switch UI
Clicking on a gigabit switch module will display the gigabit switch UI as shown in
Figure 2-17. This UI includes the following:
Status
Power Status: This shows the current power status of the selected gigabit switch:
power on or power off.
Error LED: This LED is used to indicate a gigabit switch error.
Initialized: This indicates that the gigabit switch has been initialized.
Switch Temp: This shows the gigabit switch temperature status.
2.5V Status: This shows the status of the 2.5 voltage level.
1.25V Status: This shows status of the 1.25 voltage level.
Power Control
Power On: Click to power on the gigabit switch.
Power Off: Click to power off the gigabit switch.
Reset: Click to reset the gigabit switch.
Figure 2-18. Gigabit Switch Power Control
Page 16
13
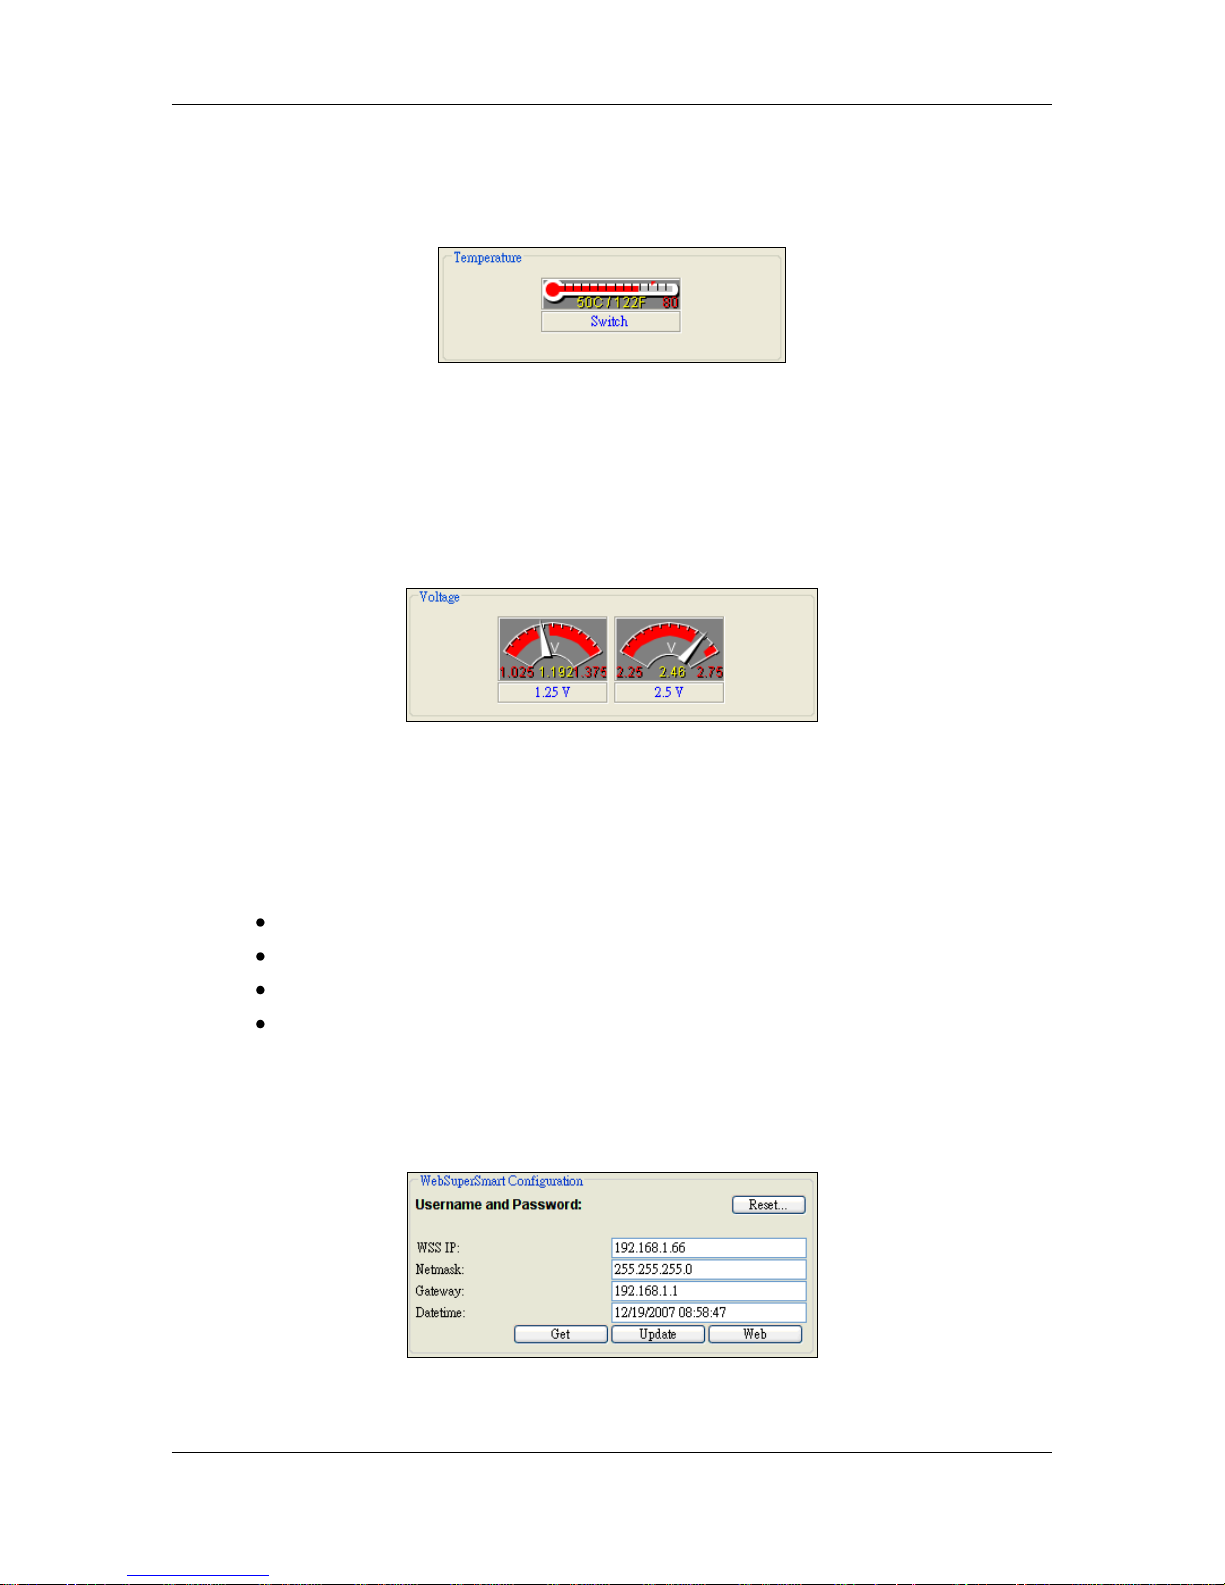
Temperature
As shown in Figure 2-19, this shows the current gigabit switch temperature.
Figure 2-19. Gigabit Switch Temperature
Voltage
As shown in Figure 2-20, this shows the current gigabit switch voltage levels for the
1.25V and 2.5V voltages.
Figure 2-20. Gigabit Switch Voltages
WebSuperSmart Configuration
WebSuperSmart is a web interface used to manage the gigabit switch (see Figure
2-21). With WebSuperSmart, a user can set the following gigabit switch data:
WSS IP: IP address of the WebSuperSmart web engine.
Netmask: Netmask address of the gigabit switch
Gateway: Gateway address of the gigabit switch
Datatime: Date and time settings for the gigabit switch
The Get button is used to immediately reload the gigabit switch settings. Clicking the
Update button applies any address changes to the gigabit switch. Clicking the Web
button will open a browser linked directly to the WSS IP, as shown in Figure 2-22.
Figure 2-21. WebSuperSmart Configuration
Page 17
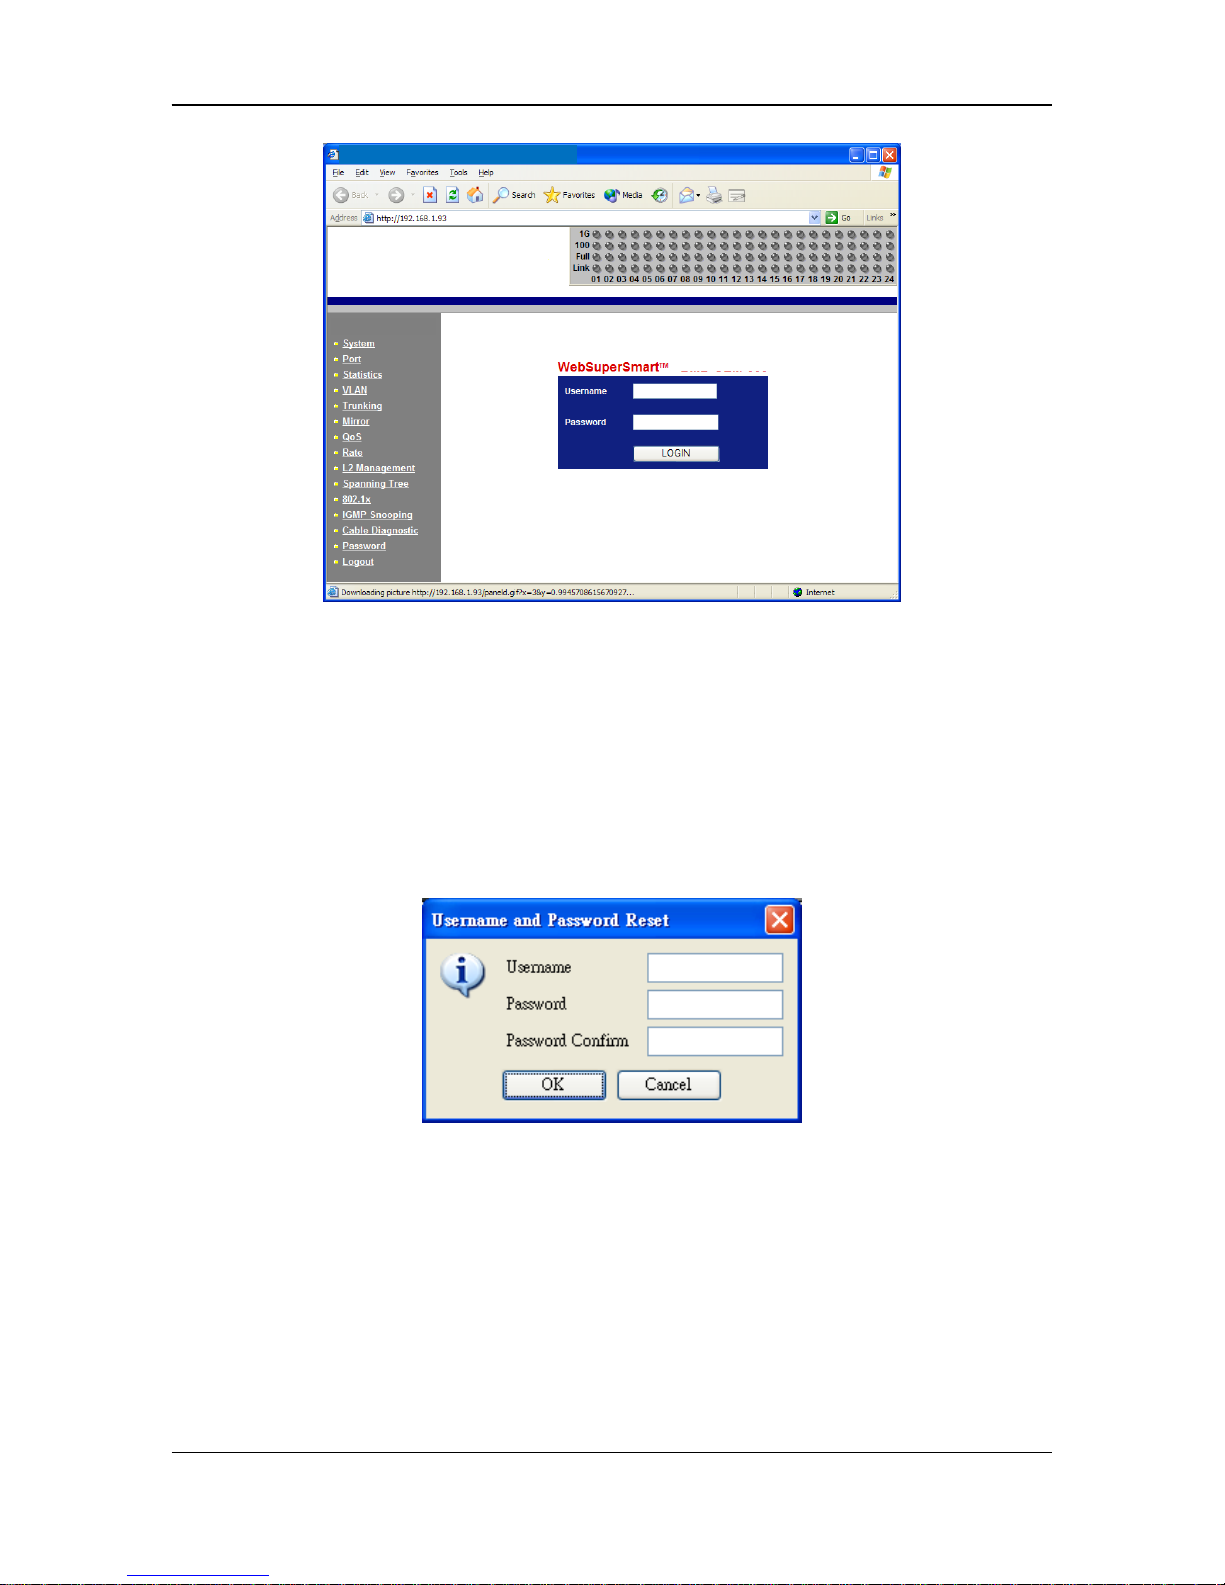
14
Figure 2-22. WebSuperSmart Web Interface
Click the Reset button and the dialog box shown in Figure 2-23 is displayed, allowing
you to reset the username and password. Type the appropriate values in the Username,
Password and Password Confirm text boxes and click OK to apply the change to
the Gigabit switch. This only resets username and password; it does not affect the
Gigabit switch login in ClearView IPMI.
Figure 2-23. Username and Password Reset
NOTE: The gigabit Pass Thru module has the same UI (shown in Figure 2-24) with
the gigabit switch beside the WebSuperSmart configuration and Error LED. They
share the same position in the V7000 enclosure.
Page 18

15
Figure 2-24. GB Pass Thru UI
Page 19
16
1.5. CMM UI
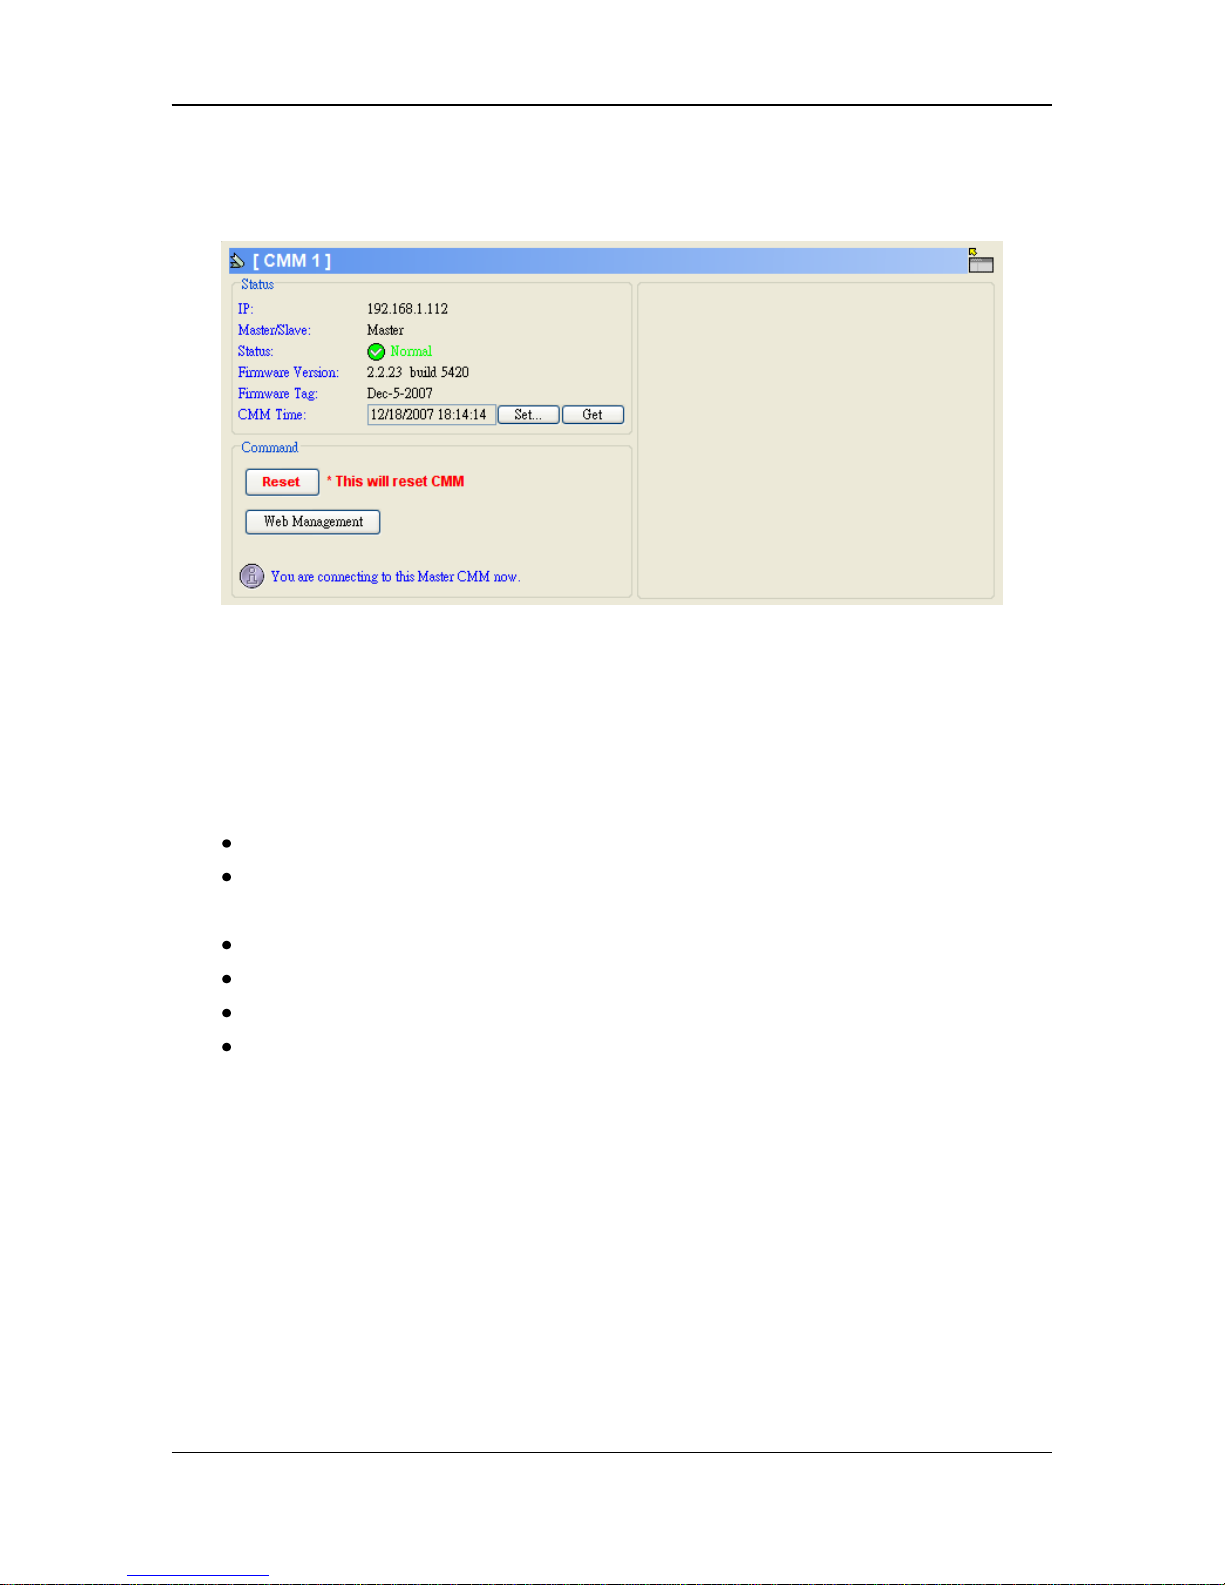
Figure 2-25. CMM UI
Clicking on one of CMM modules causes the CMM UI to appear, as shown in Figure
2-25. This UI includes the following:
Status
IP: This shows the CMM IP address.
Master/Slave: This shows the CMM master/slave status. A master CMM has full
management of the V7000. A slave CMM is a backup to the master CMM.
Status: This shows the CMM status.
Firmware Version: This shows the CMM firmware version.
Firmware Tag: This shows the CMM firmware tag.
CMM Time: This shows the CMM time. The CMM time shown in the text field
may not match the current time. Click the Get button to reload the CMM time
immediately. Click Set to set the CMM time. See the next section for more
details about setting CMM time.
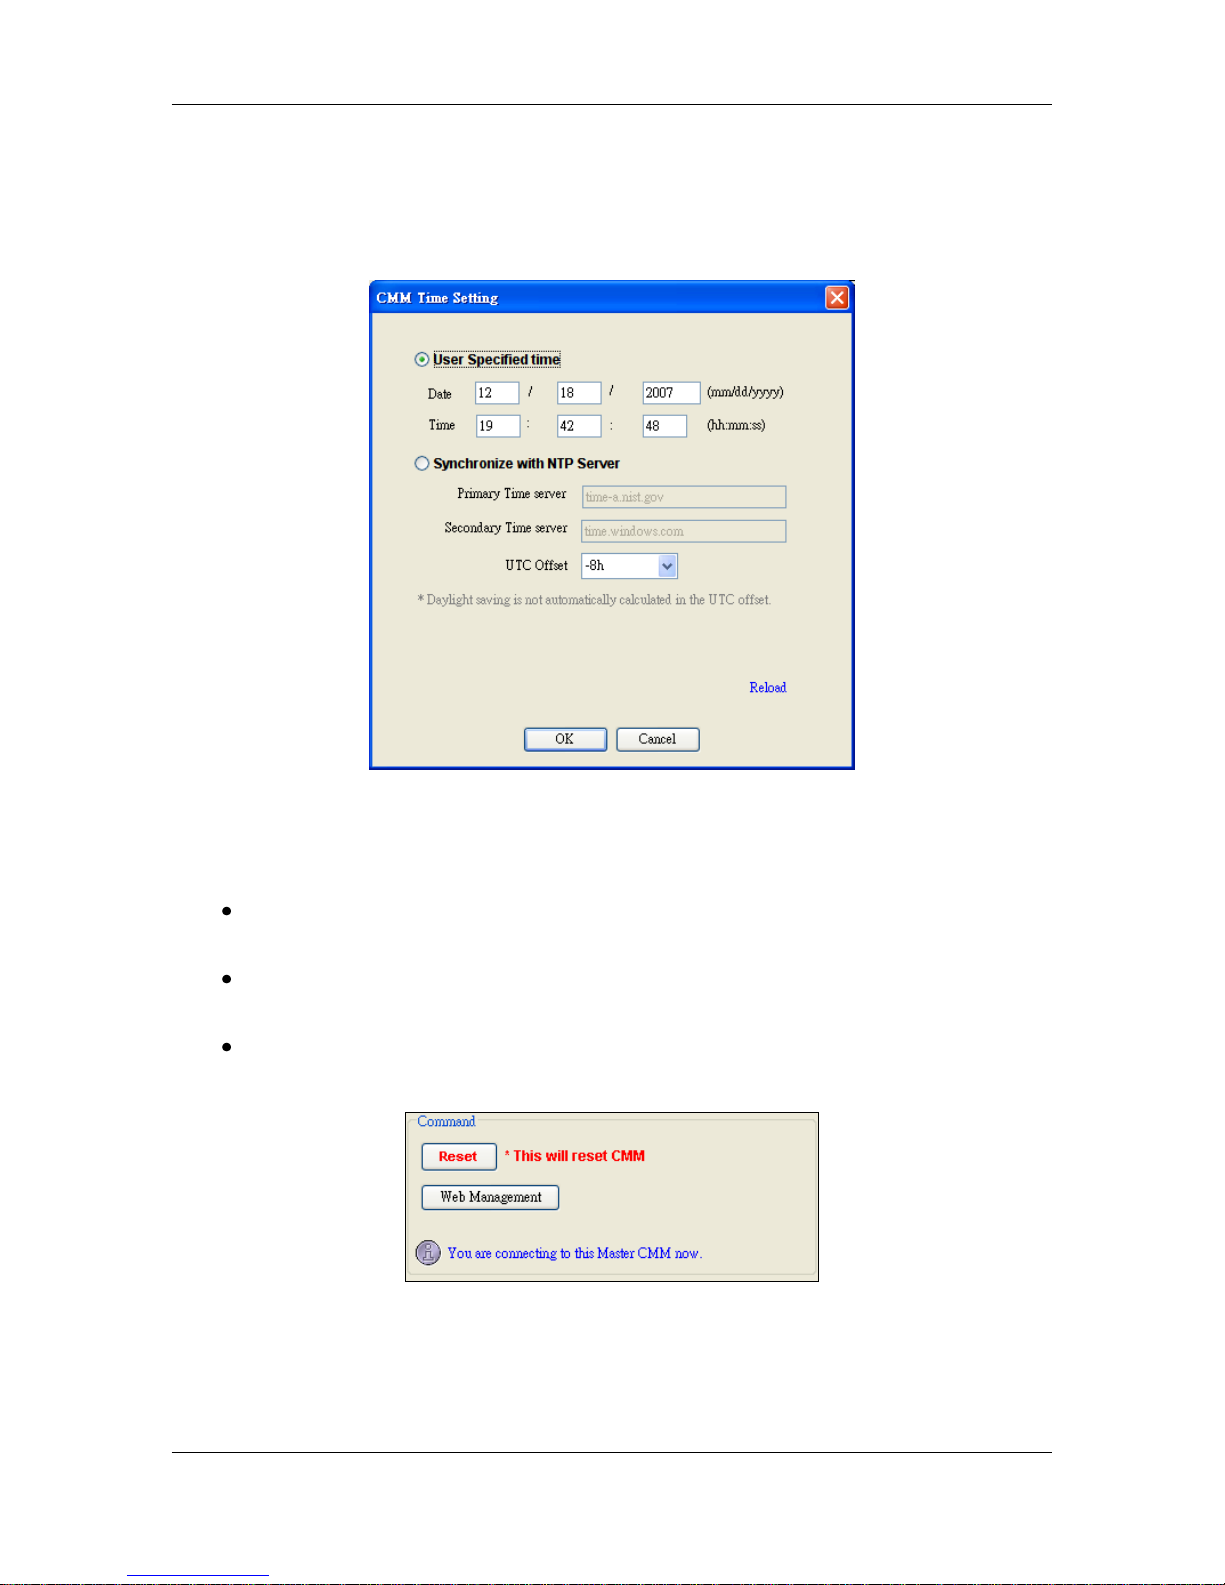
Setting CMM Time
As shown in Figure 2-26, there are two way to set the CMM time. One is for the user to
specify the time, and the other way is to synchronize with Network Time Protocol (NTP)
server time. The User Specified Time option allows the user to enter time values for the
CMM internal real-time clock. Synchronizing with the NTP Server allows your CMM
real-time clock to synchronize with the NTP server. Enter the IP address for either the
primary or secondary NTP server. The UTC Offset allows you to offset the UTC timer.
Page 20
17
NOTE: Daylight savings time cannot be automatically adjusted. Manually set up the
UTC offset twice a year to compensate for daylight savings time.
Figure 2-26. CMM Time Setting
Command and Information
Reset: Click to reset the CMM. Once reset is clicked, ClearView IPMI will
automatically close the session.
Web Management: Click to open a browser that is linked to the CMM web
interface, as shown in Figure 2-28.
CMM type: This shows if the currently running CMM is the master or slave.
Figure 2-27. Command and Information
Page 21
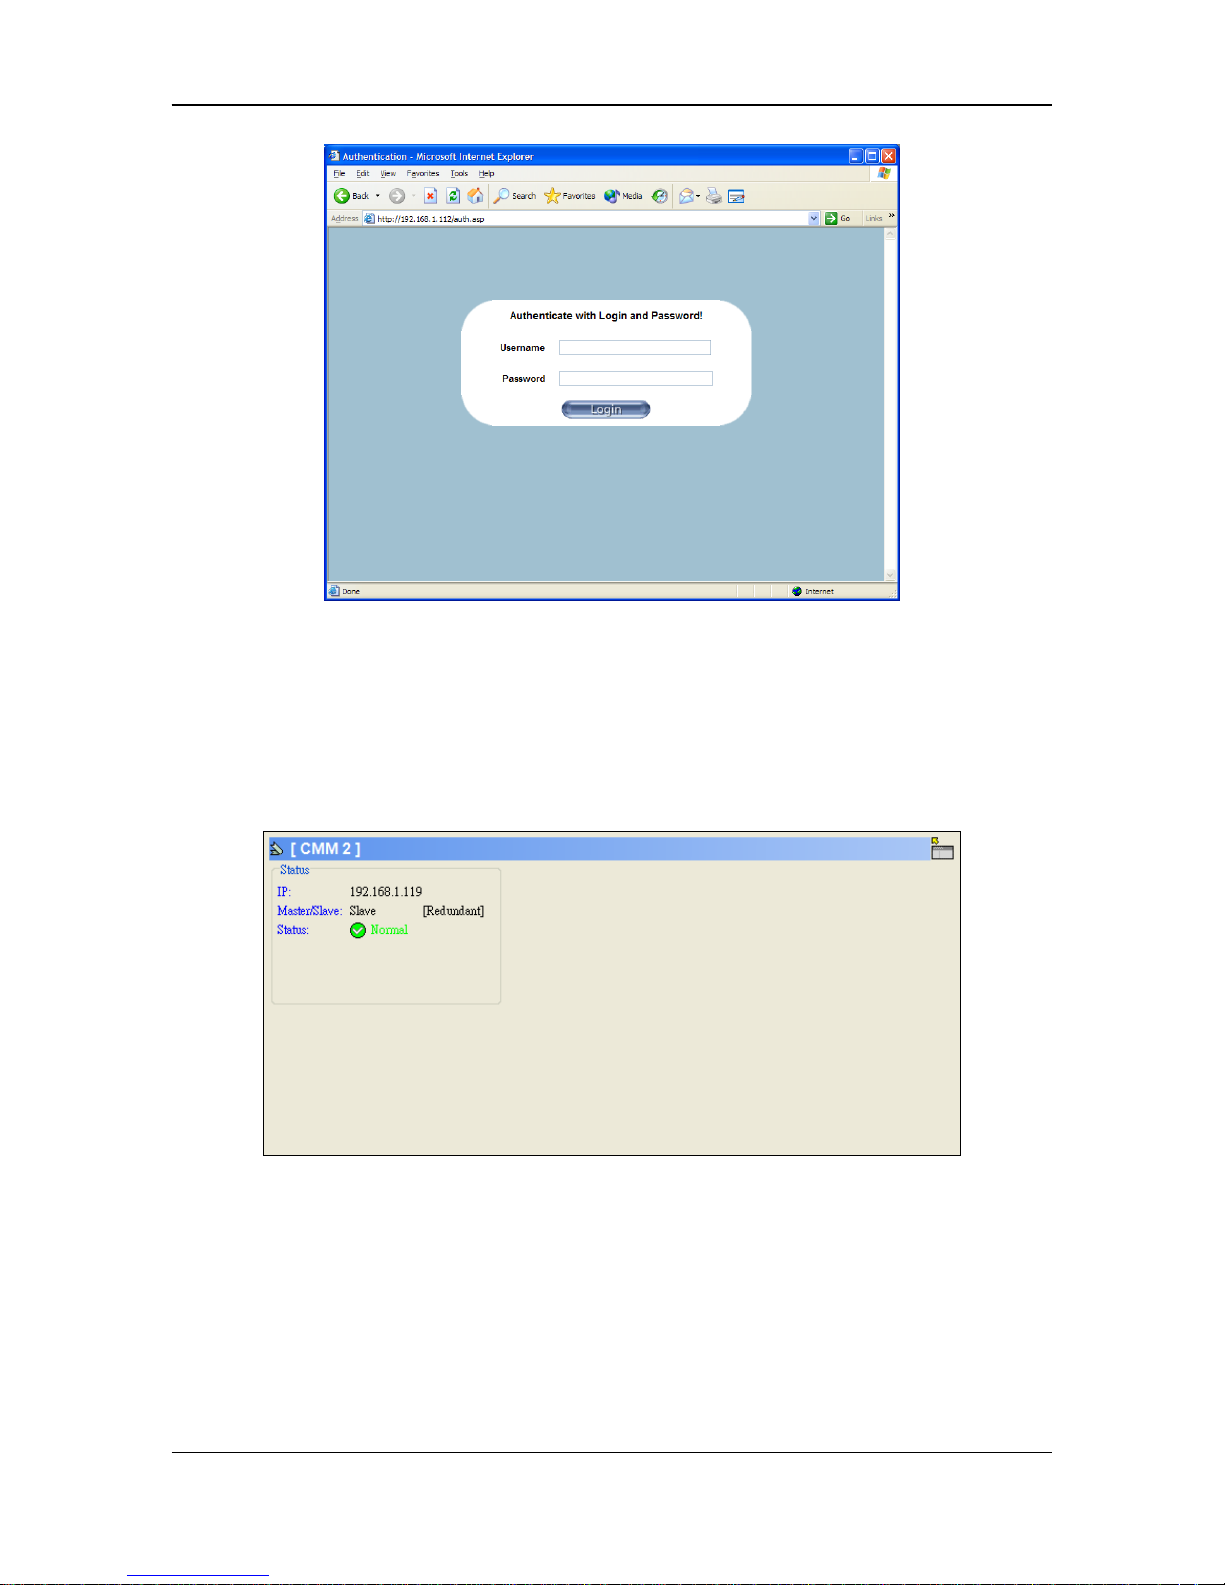
18
Figure 2-28. CMM Web Management Interface
Slave CMM
As shown in Figure 2-29, clicking on the Slave CMM gives you less information on
the CMM. Only IP, Master/Slave and Status information is shown.
Figure 2-29. Slave CMM
Page 22
19
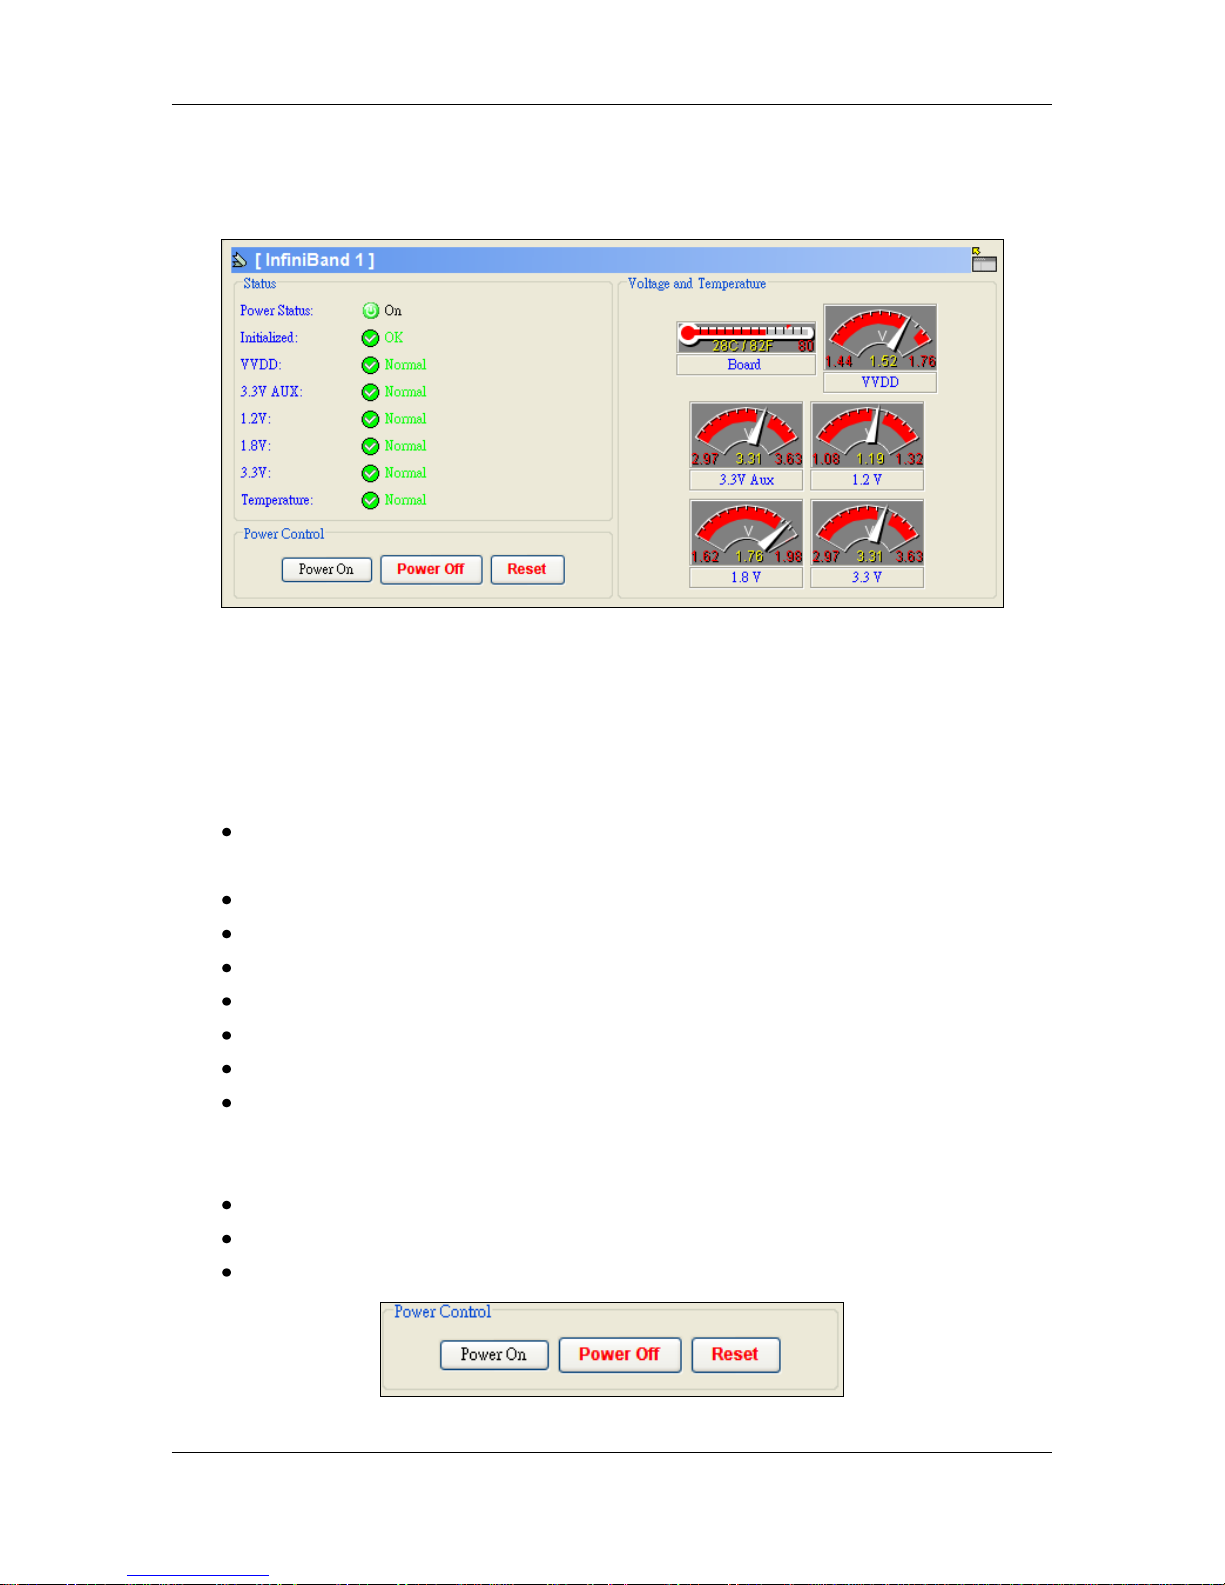
1.6. InfiniBand UI
Figure 2-30. InfiniBand UI
Clicking on one of InfiniBand modules will have the InfiniBand UI appear, as shown
in Figure 2-30. This UI includes the following:
Status
Power Status: This shows the current InfiniBand power status: power on or
power off.
Initialized: This indicates that the InfiniBand has been initialized.
VVDD: This shows the VVDD status of the InfiniBand.
3.3V Aux: This shows the 3.3V Aux status.
1.2V: This shows the 1.2V status.
1.8V: This shows the 1.8V status.
3.3V: This shows the 3.3V status.
Temperature: This shows the temperature status.
Power Control
Power On: Click to power on the InfiniBand module.
Power Off: Click to power off the InfiniBand module.
Reset: Click to reset the InfiniBand module.
Figure 2-31. InfiniBand Power Control
Page 23
20
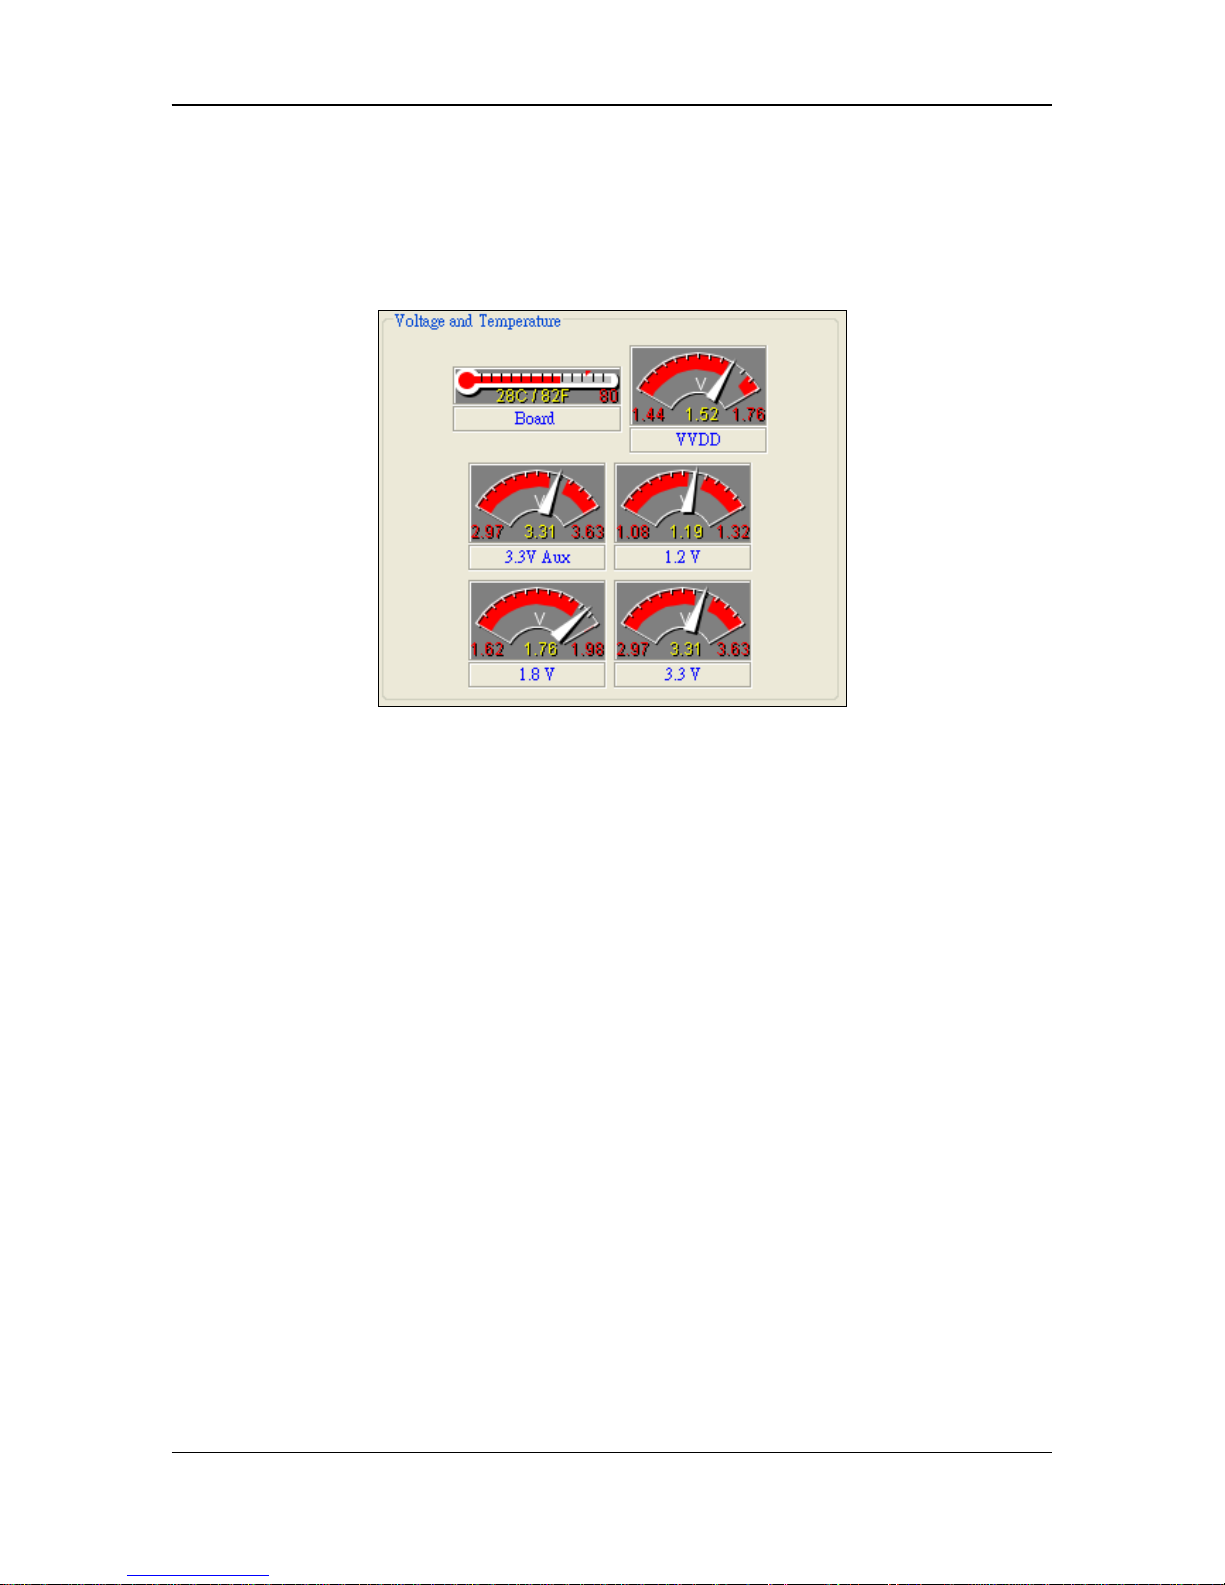
Voltage and Temperature
Figure 2-32 shows the readout of the current InfiniBand voltages and temperature.
Specifically, these are VVDD, 3.3V Aux, 1.2V, 1.8V, 3.3V and board temperature.
Figure 2-32. InfiniBand Temperature and Voltages
Page 24
21
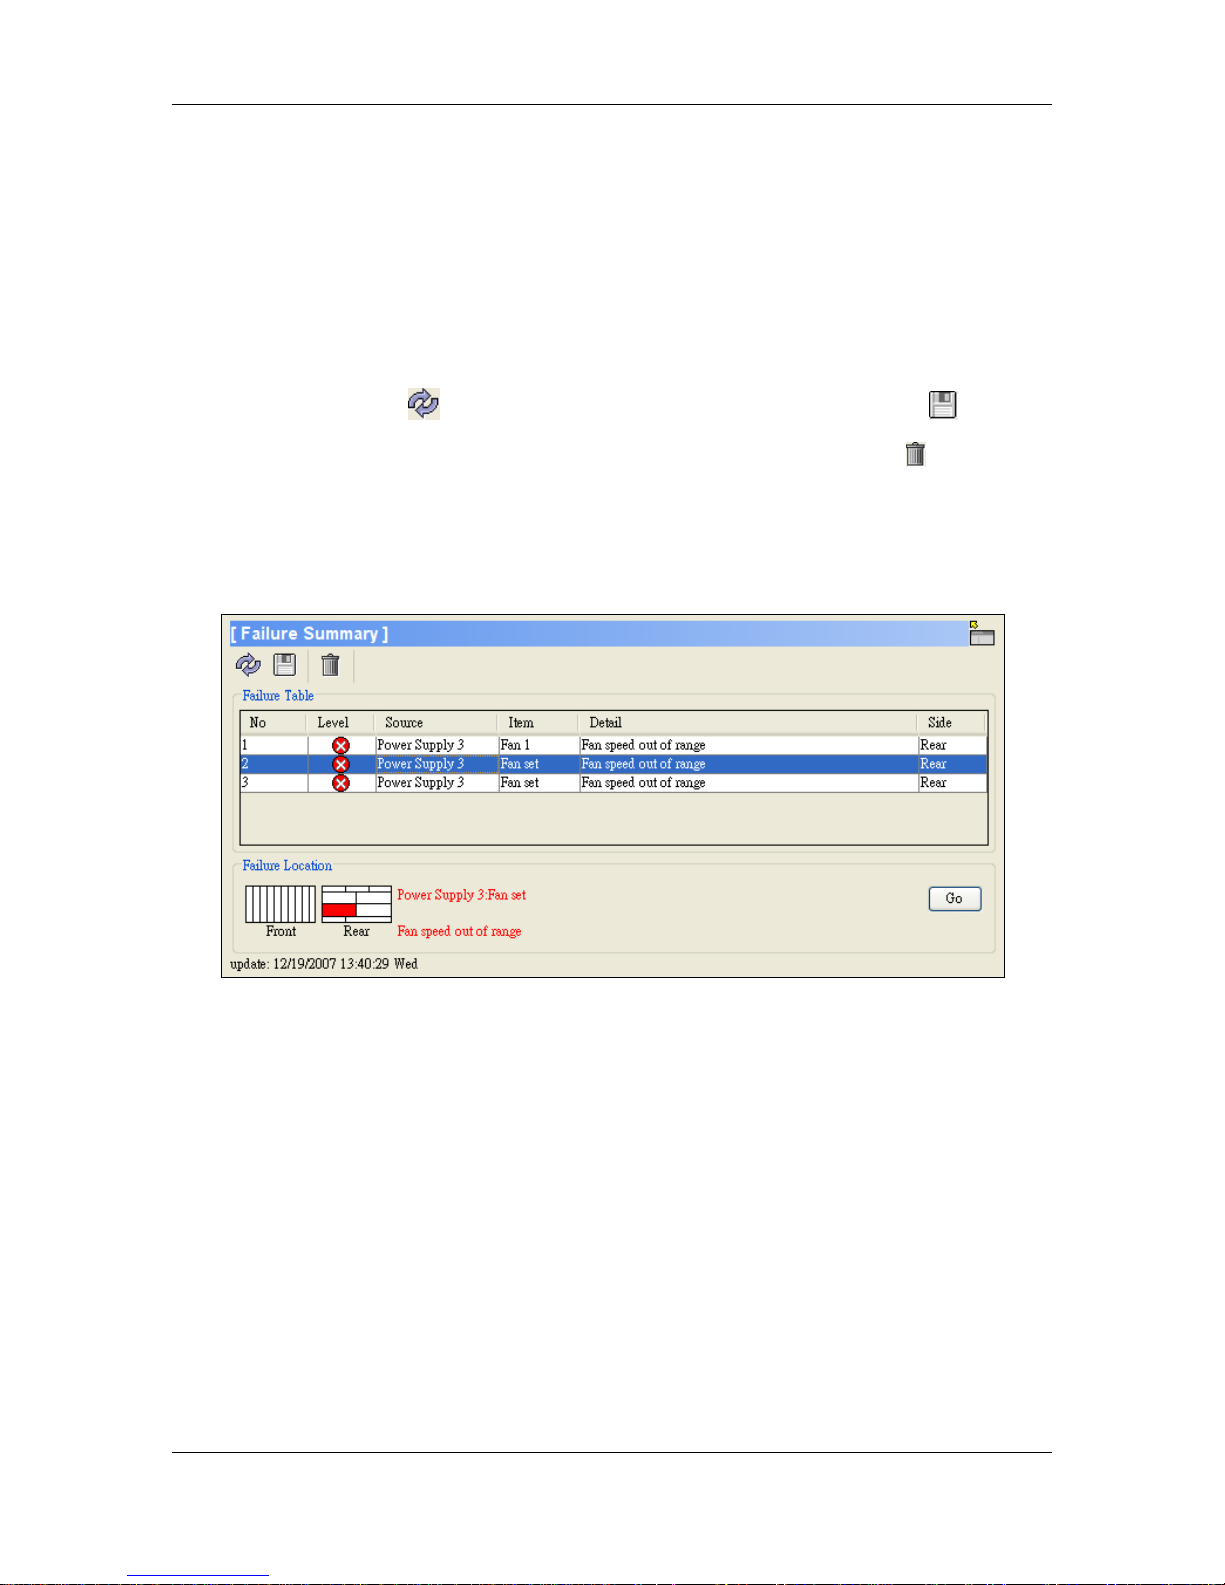
1.7. Failure Summary UI
The Failure Summary, as shown in Figure 2-33, is a list of failures that occurred in the
V7000 system. The failure table shows the failure level, source, item, detail and side
info of the failure item. The failure location shows the exact module and position.
Click Go to switch the UI to the failed module that is highlighted in the table.
Click the Refresh ( ) button to refresh the failure table. Click the Save ( )
button to save the current failure table as a CSV text file. Click the Clear ( )
button to clear the failure items in the current table.
NOTE: If a failure still exists, it is displayed again the next time you refresh the table.
Figure 2-33. Failure Summary
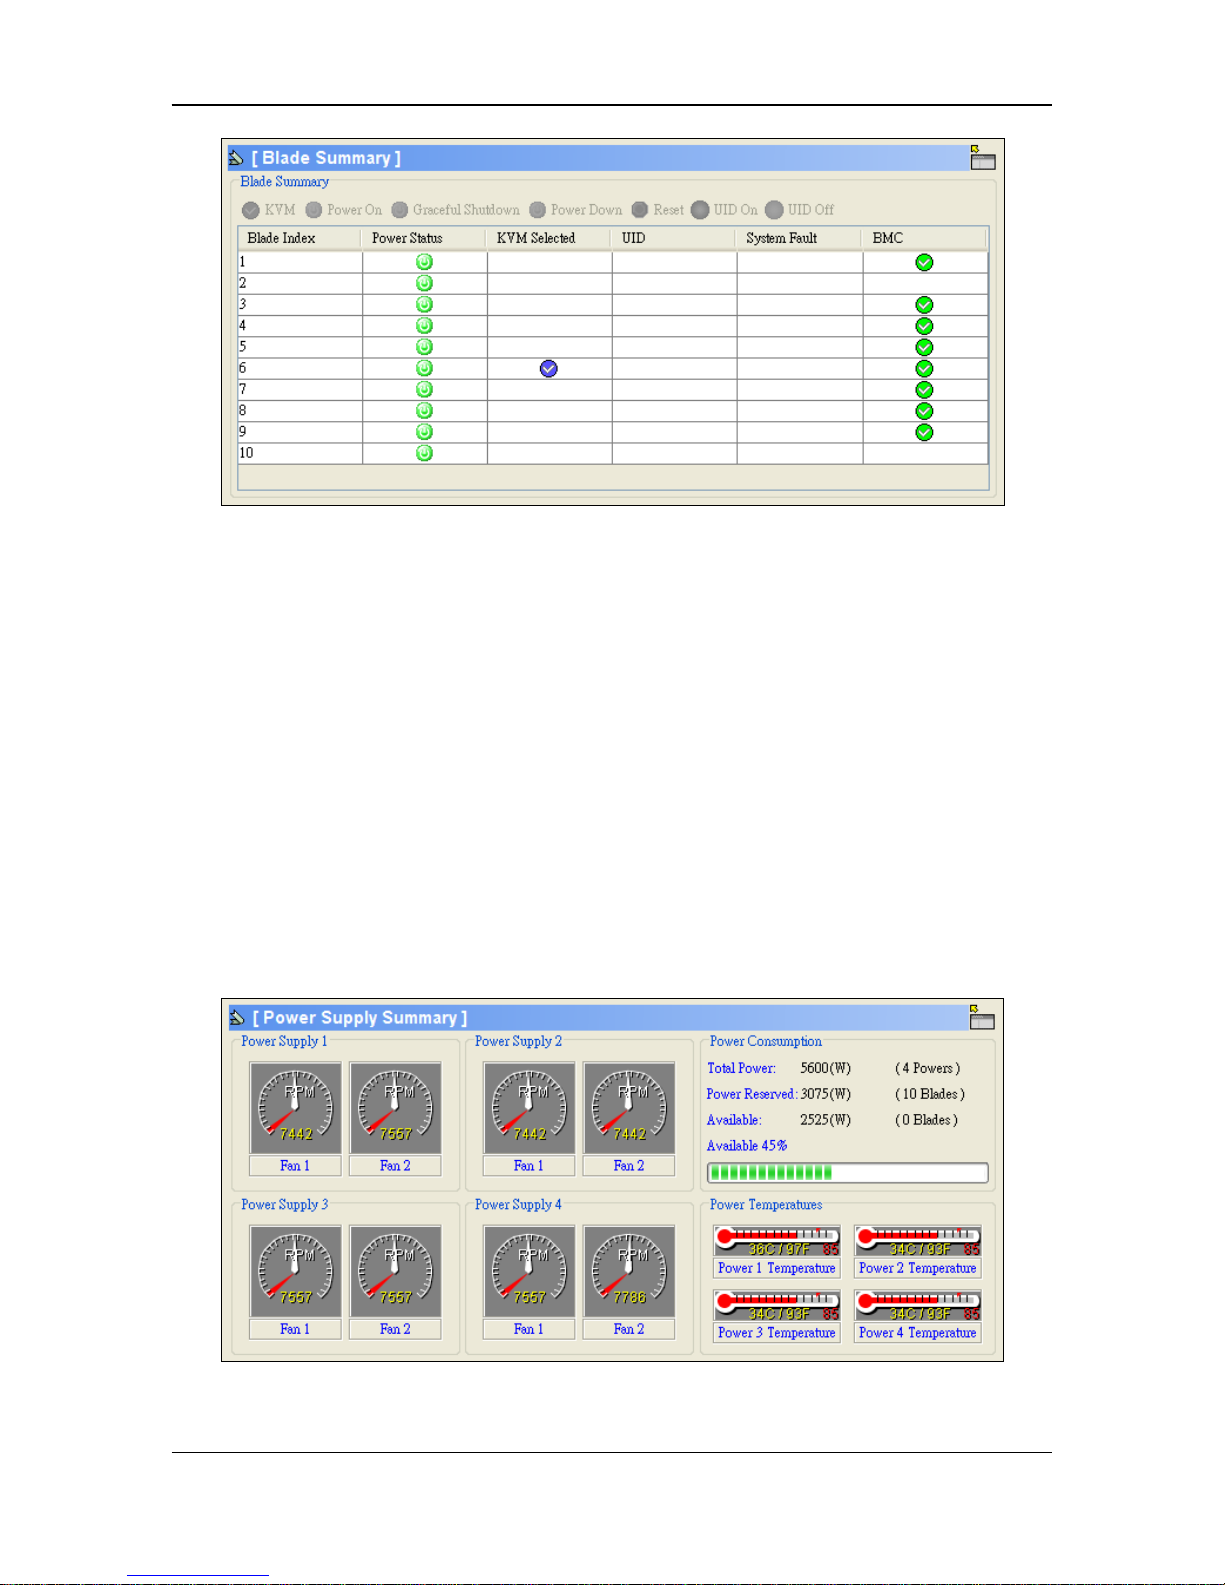
1.8. Blade Summary UI
The Blade Summary, as shown in Figure 2-34, gives an overview of all installed
blades in the server. The summary table includes symbols for Power Status, KVM
Selected, UID, System Fault and BMC status for users to quickly understand the
overall blade status. A group management feature is also included. Users can select
multiple blades and send commands to perform power on, graceful shutdown, power
down, reset, UID on and UID off functions by pressing the corresponding button.
Note that you may only select one blade at a time for KVM.
Page 25
22
Figure 2-34. Blade Summary
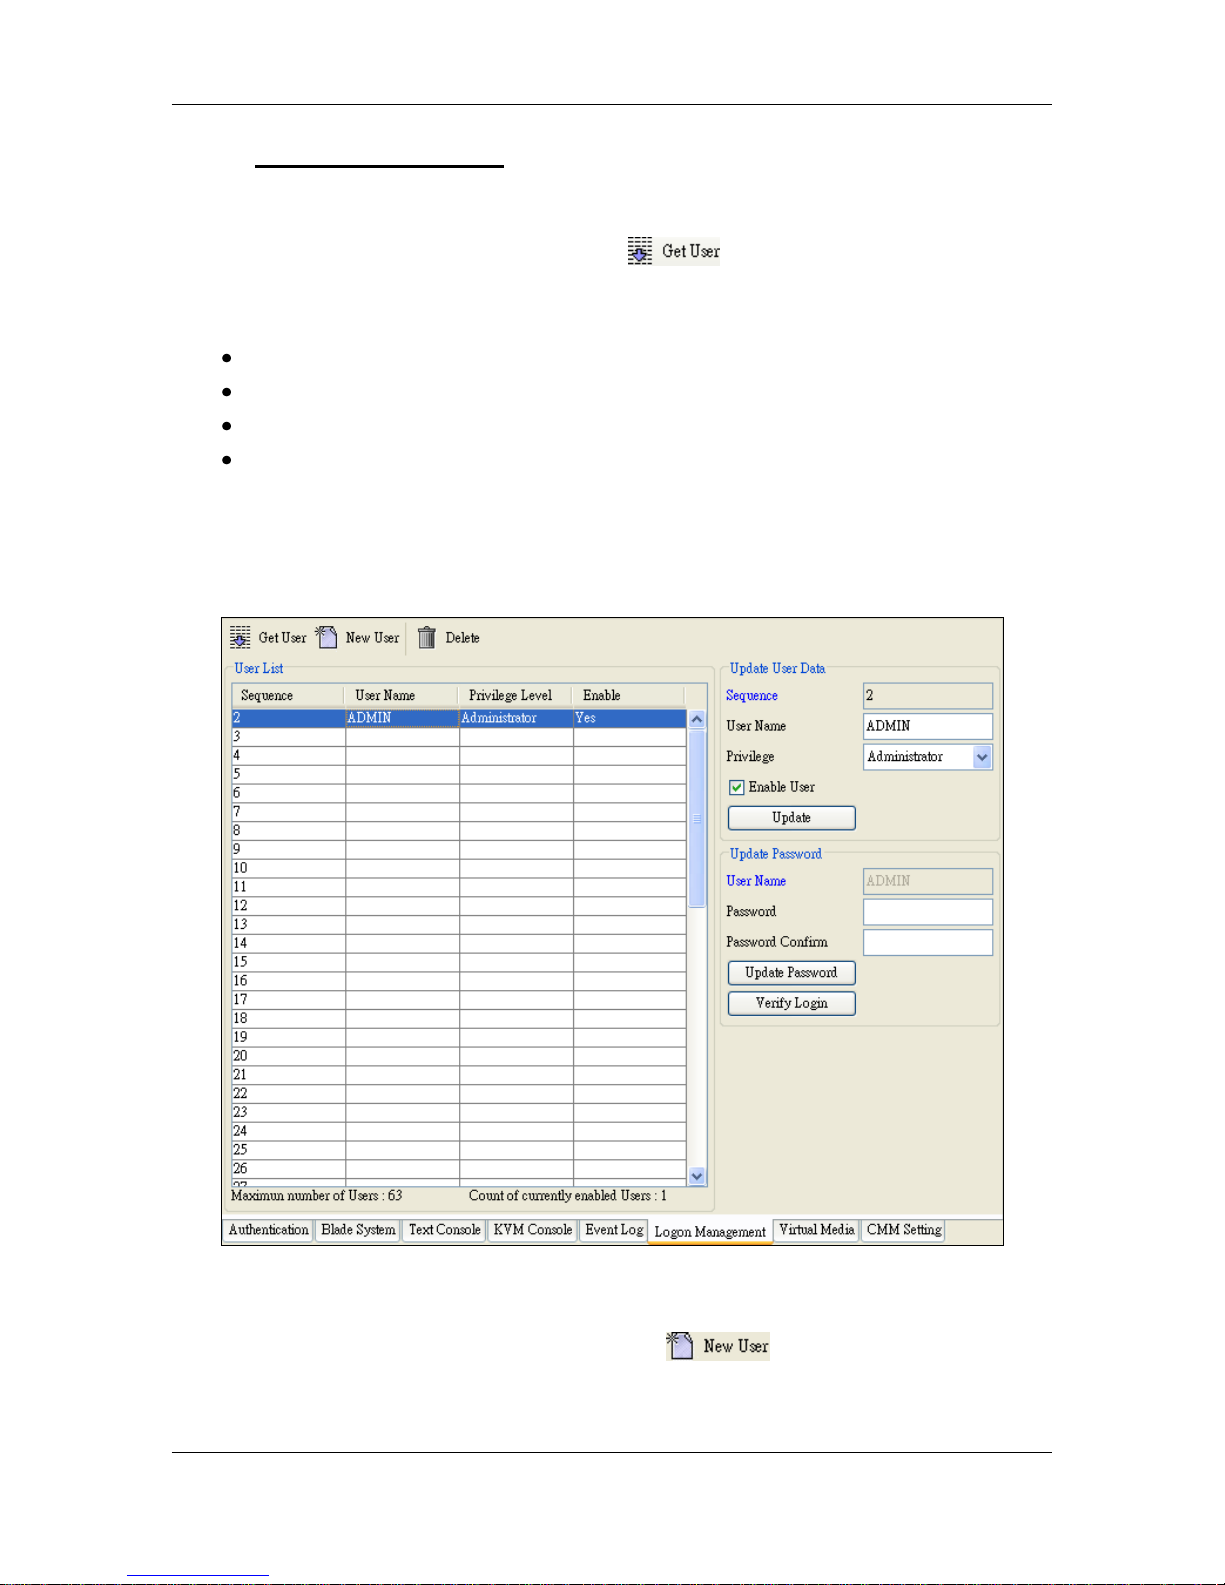
1.9. Power Supply Summary UI
The Power Supply Summary, as shown in Figure 2-35, gives an overview of all
installed power supplies. User can see the all power supply fan and temperature status
in a single view. It is useful to observe the blade system cooling status. Power
Consumption gives an estimation of power (wattage) use. Total Power is the total
power provide from all installed power supplies that are currently turned on. Power
Reserved is an estimation of the possible usage of power wattage from blades.
Available is the amount of power that remains available to the system. If the available
power wattage is insufficient, a blade may not be powered on.
Figure 2-35. Power Supply Summary
Page 26

23
1.10. Gigabit Switch Summary UI
The Gigabit Switch Summary, as shown in Figure 2-36, gives an overview of up to
two installed gigabit switch (or GB pass thru) modules. Here, a user can see all the
voltages, temperatures and switch status in a single view. Clicking the Web
Management button will open a browser that is linked directly to the WSS IP.
Figure 2-36. Gigabit Switch Summary
Page 27

24
3. Text Console
To start the text console, shown in Figure 3-1, click the Text Console tab. Click Start
at the bottom of the screen to initialize the text console connection. The UTF-8
checkbox allows the user to select a different UTF-8 character set to support multiple
languages. Click Stop to stop the text console.
NOTE: If you start a blade text console session from the CMM on a V7000 that
contains an IPMI card, you cannot type in the text console. To type in a blade’s text
console, you must start the text console directly from the blade rather than from the
CMM.
At the top are the Power and KVM control panels for the blades. The power button
can perform a power on, reset, graceful shutdown and power down function on the
selected blade. The power button icon represents the current blade power status: green
for powered on and amber for powered off. The KVM icon shows which blade KVM
has been selected on. Click on another KVM button to switch to a blade which you
want to connect its text console.
Figure 3-1. Text Console
Blade Power and KVM control panel
Text Console (SOL) panel
Page 28

25
When a blade is in a power on status (for example: ), a dialog box as shown in
Figure 3-2 will appear when clicking on the power button. Here, the user can select
which type of power control they want to perform: reset, graceful shutdown and
power down. When a blade is in the power off status (for example: ), click the
power button will power on that blade immediately.
Figure 3-2. Power Control Dialog Box (in Power and KVM Control Panel)
Page 29

26
4. KVM Console and Optimizing Keyboard and Mouse Settings
The KVM Console provides a remote desktop for the user. This feature allows the
user to manipulate a blade’s UI remotely. As shown in Figure 4-1, The KVM Console
Tab has the blade power and KVM control panels as well. These offer the same
functions as those in the Text Console tab.
In the video console panel, you will see the remote desktop of the selected blade. By
clicking on another blade in the control panel, the video console panel will switch the
display to the selected blade. For more video console detail, see “Video Console
Redirection (KVM over IP)” in ClearView IPMI User’s Guide.
Figure 4-1. KVM Console
The keyboard/mouse may behave differently on different operating systems. Select
Options > Keyboard/Mouse Setting to change the following keyboard and mouse
settings. Use any of the following options to fine-tune keyboard and mouse behavior.
Blade Power and KVM control panel
Video Console Panel
Page 30

27
Figure 4-2. Keyboard/Mouse Setting
Keyboard Model: Click the arrow for the pull-down menu to specify the type
of keyboard.
Key Release Timeout: Check this box to enable the Key Release Timeout
function, which will set a time limit for a key being pressed by the user.
Timeout: If the Key Release Timeout option is enabled, click the arrow to
select the timeout setting in the pull-down menu.
USB Mouse Type: For a USB mouse to function properly, select the correct
operating system from the pull-down menu by clicking the arrow. Options
include Windows, Mac and Other Operating System. For Linux OS, select
Other Operating System.
Mouse Speed Auto: Select the option to allow your system to automatically
set your mouse speed.
Mouse Speed Fixed scaling: You can select the Fixed Scaling option and
manually set the mouse speed with the pull-down menu.
Page 31

28
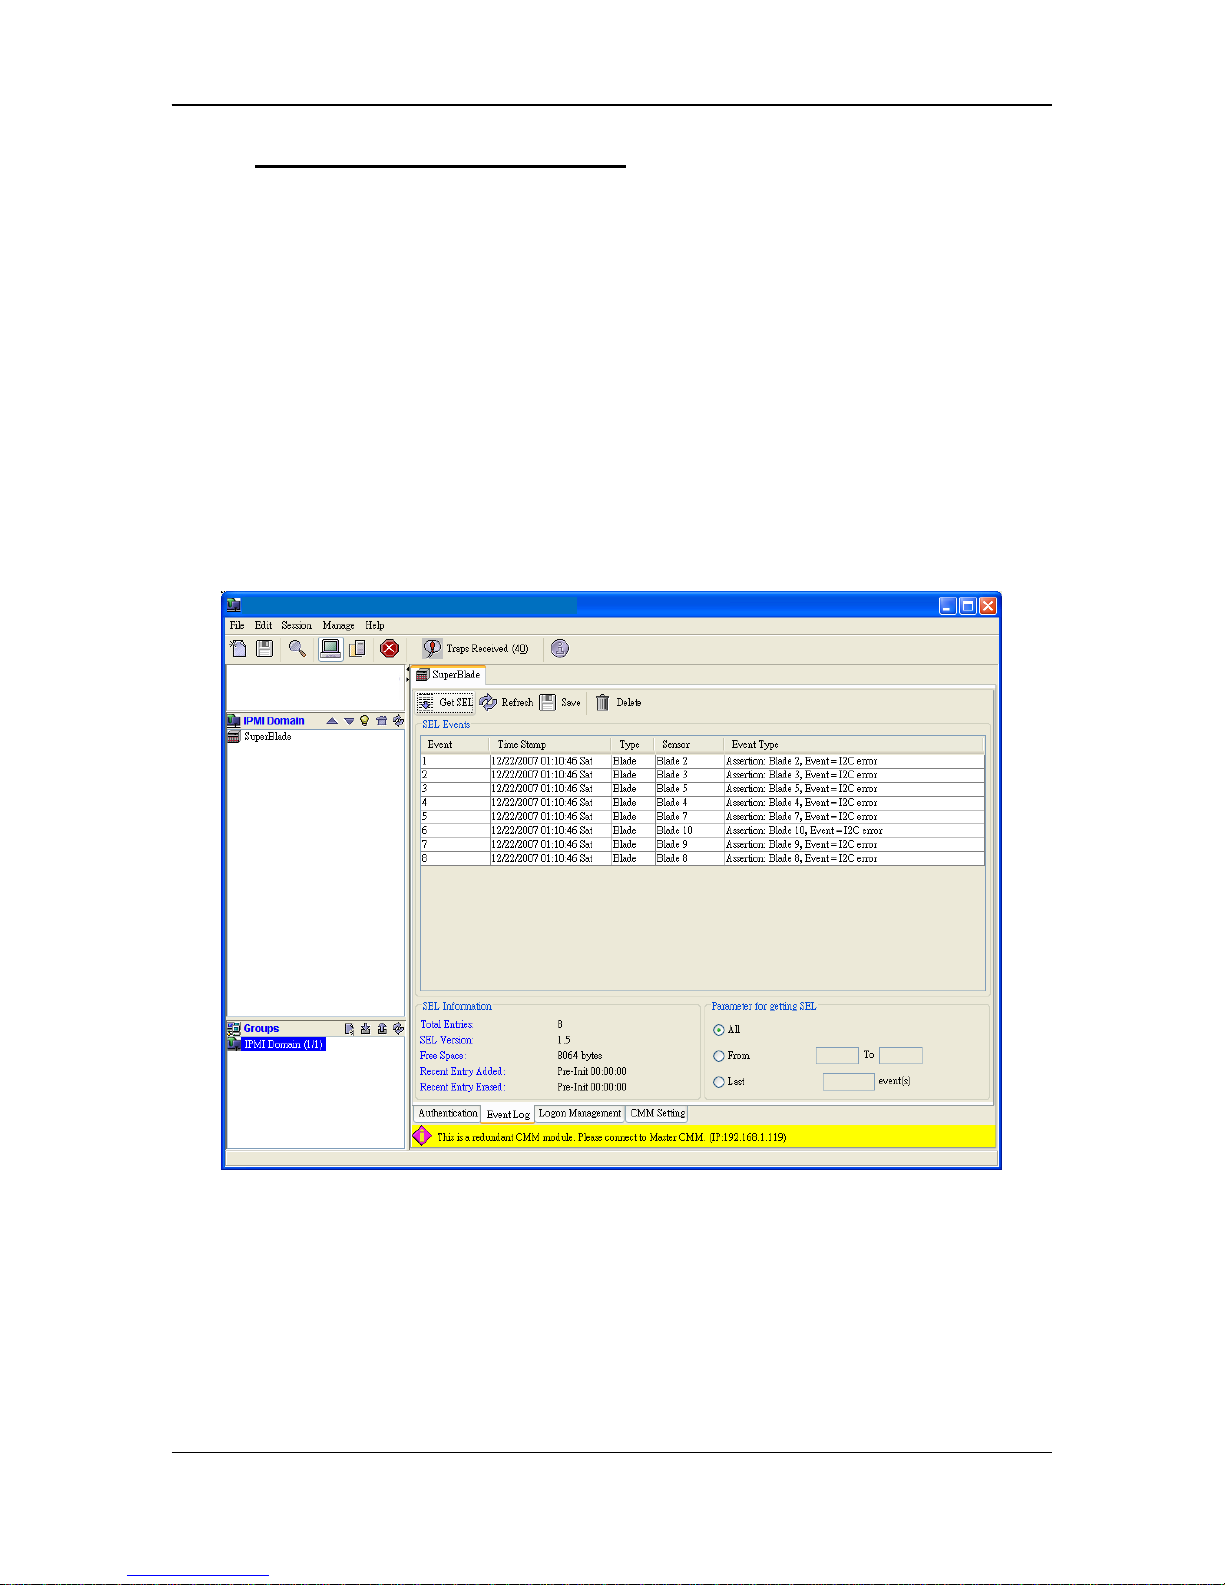
5. Event Log
The V7000 logs system events in the standard IPMI format. To see the event log (as
shown in Figure 5-1), click the Event Log tab. At first, only SEL information will be
loaded, which consists of Total Entries, SEL Version, Free Space, Recent Entry Added
and Recent Entry Erased. In the Parameter for getting SEL window, the default is All
to get the entire SEL log. This may be changed to From ____ to End ____ or to the
last number of the SEL. After entering the parameters, click GET SEL ( )
on the tool bar to start loading SEL.
The SEL events table categorizes events with Time Stamp, Type, Sensor and Event
Type details. The maximum number of SEL table entries is 512. If this number is
exceeded, the click the Save ( ) button to save it as a backup file. Clicking
the Delete ( ) button deletes all SEL events.
NOTE: The Refresh ( ) button only refreshes the SEL information. To
reload SEL, click the Get SEL button.
Figure 5-1. System Event Log
Page 32
29
6. Logon Management
The Logon Management tab is shown in Figure 6-1. Here, a maximum of 63 user
accounts can be listed. Click the Get User ( ) button to retrieve the current
user list. Each user has a Username, a Privilege Level and an Enable field. The
Privilege Level will be one of the following:
Administrator: full functions supported
Operator: full functions supported but no logon management function
User: Less functions. Unavailable functions will be hidden or disabled.
CallBack: Reserved.
If the Enable field is No, it means the user currently cannot login to the blade system.
The administrator can change the Enable field to Yes to allow a user to logon.
Figure 6-1. Logon Management Tab
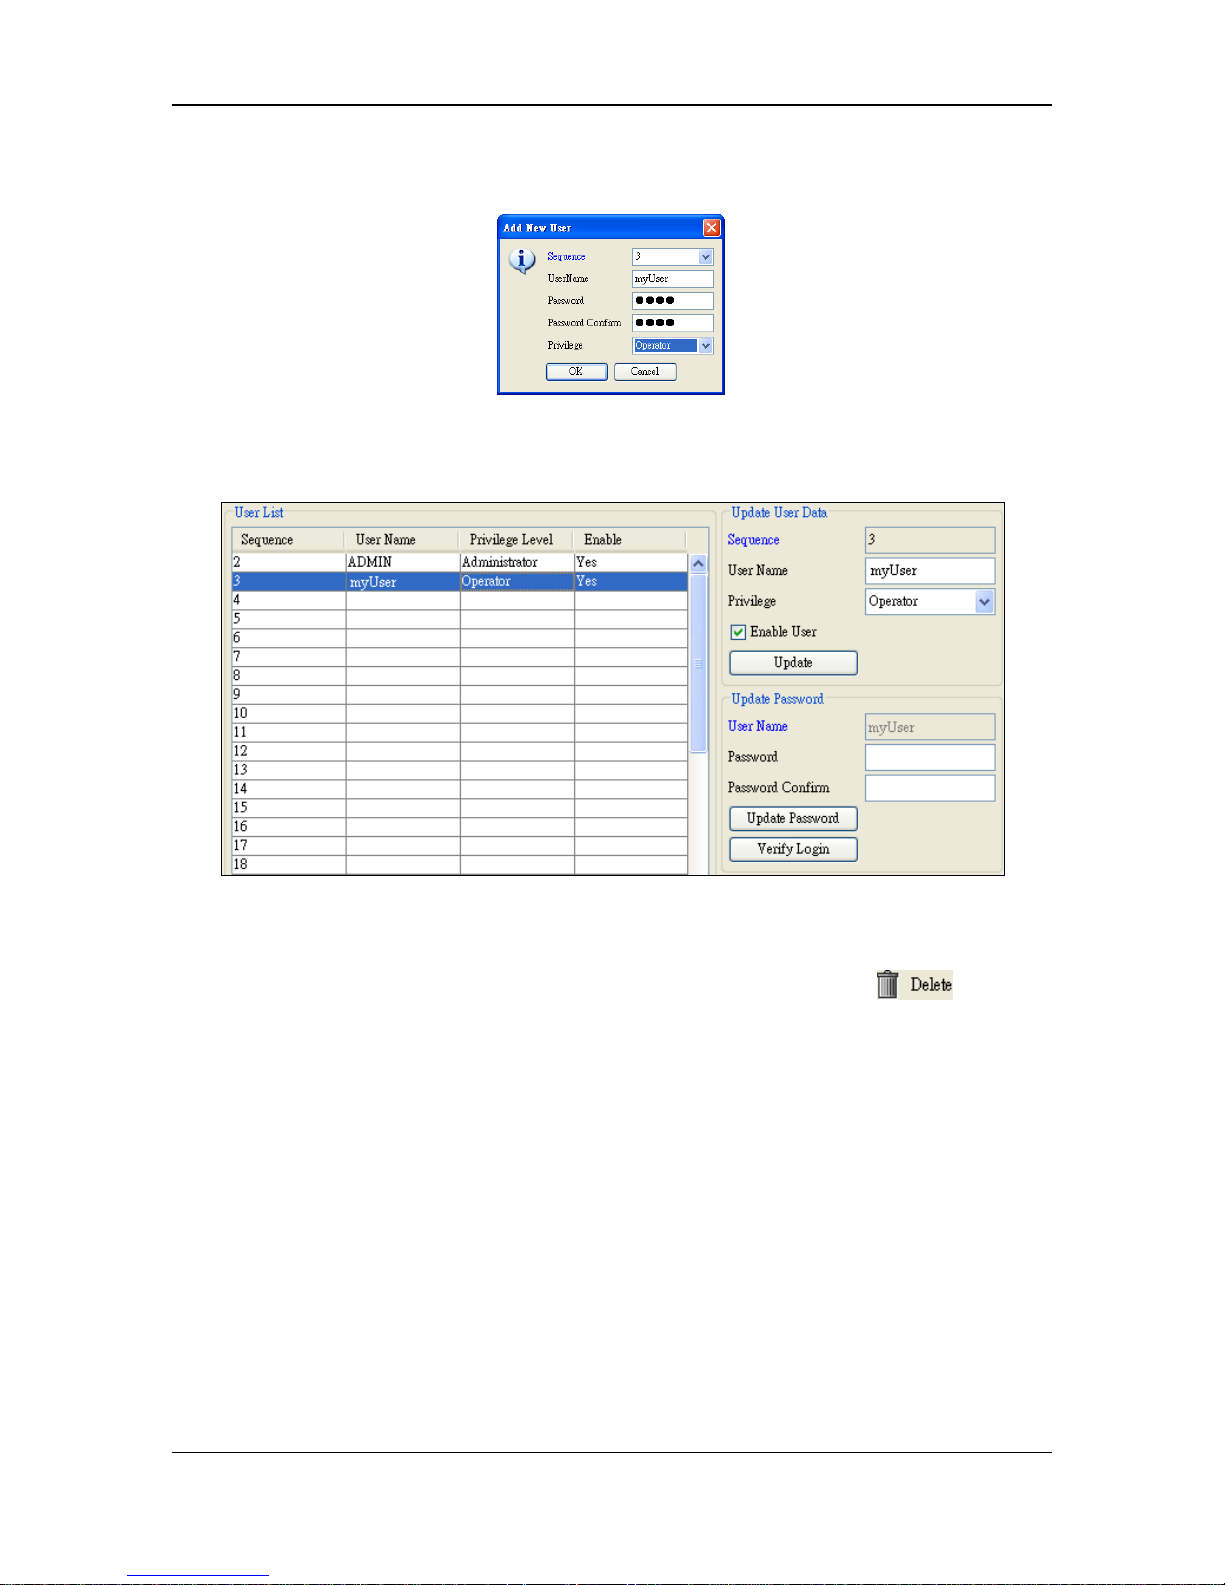
When creating a new user, click the New User ( ) button. A new user
dialog box is displayed, as shown in Figure 6-2. The sequence is the order in the user
list. Type in the username, password, password confirm, and privilege level. A new
Page 33
30
user will then be listed in the table, as shown in Figure 6-3.
Figure 6-2. Add New User Dialog Box
Figure 6-3. Creating a New User Named myUser
To delete a user, select a user in the user list table and click the Delete ( )
button.
To edit the user data, select a user in the user list table. The user data will be shown in
the right panel. In the Update User Data area, you can edit the username and privilege
level. The Enable User option is used to enable or disable a user.
In the Update Password area, you can update the user’s password. Click Update
Password after you type and confirm a new password. We suggest using the Verify
Login to check if the password update is successful. It is also helpful to check that the
new user was created.
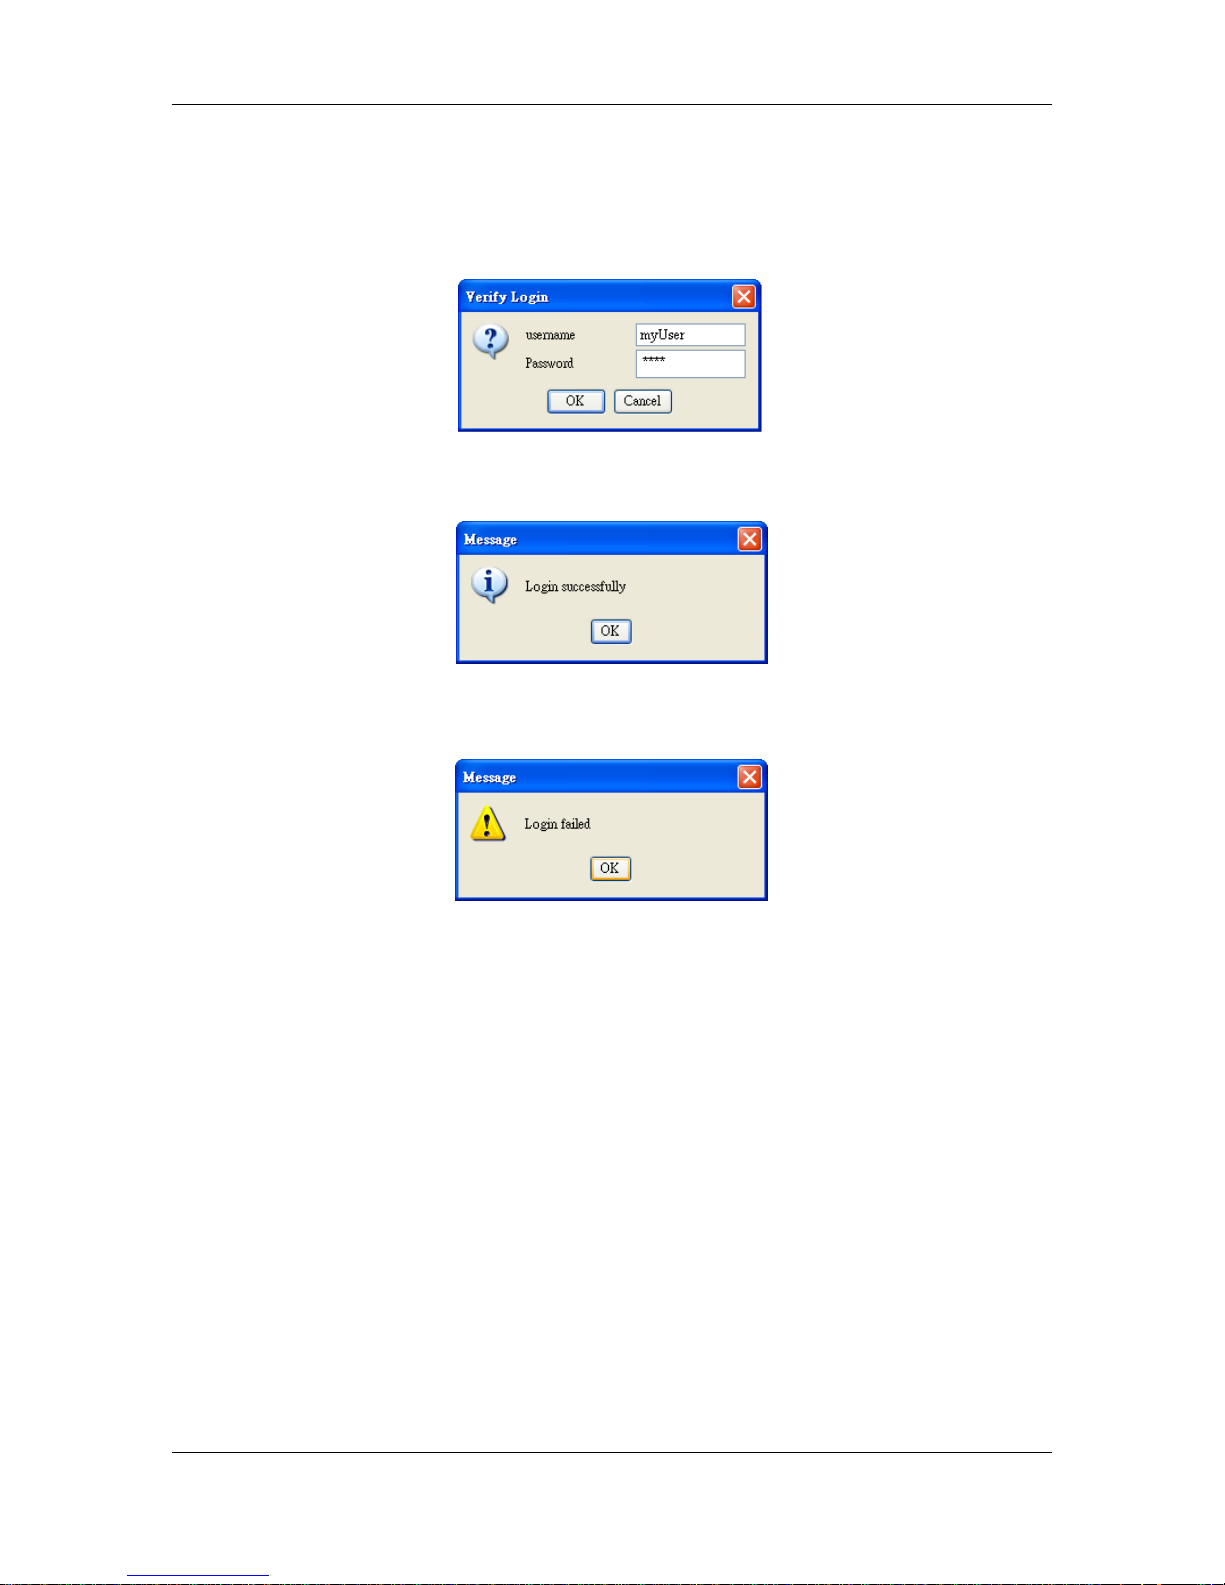
Clicking the Verify Login button displays the dialog box shown in Figure 6-4,
showing the username and password. Input the username and password that you want
Page 34
31
to verify. Once the username and password are verified, the dialog box shown in
Figure 6-5 is displayed. Otherwise, a failure message is displayed, as shown in Figure
6-6.
Figure 6-4. Verify Login
Figure 6-5. Successful Login
Figure 6-6. Failed Login
Page 35
32
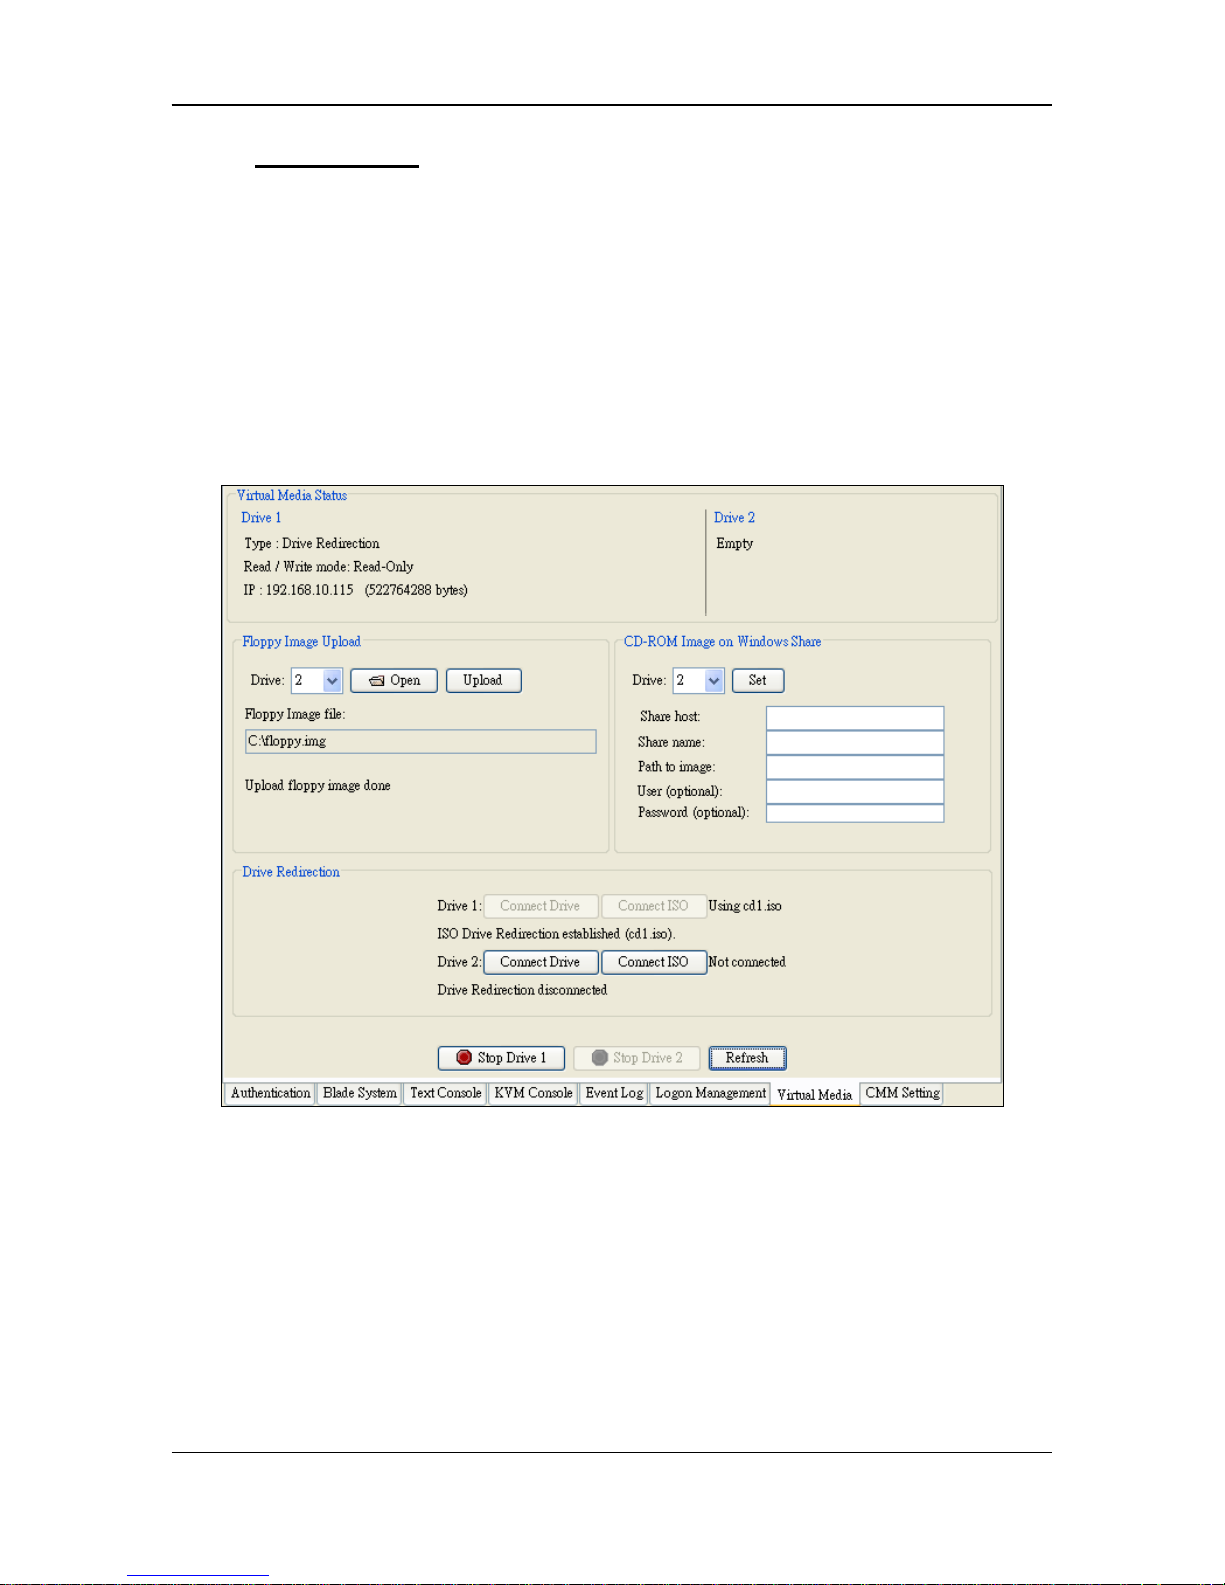
7. Virtual Media
As shown in Figure 7-1, the CMM module supports the use of two virtual drives. The
function is the same as with a SIM IPMI device. See “Virtual Media” in ClearView
IPMI User’s Guide for more information.
NOTE: The virtual drive in the CMM module will be dedicated to the KVM selected
blade. For example, if KVM is currently selected on blade 3, the virtual drive will be
dedicated to blade 3 as a USB device. Once KVM switches to blade 6, the virtual
drive in CMM will be dedicated to blade 6.
Figure 7-1. Virtual Media
Page 36
33
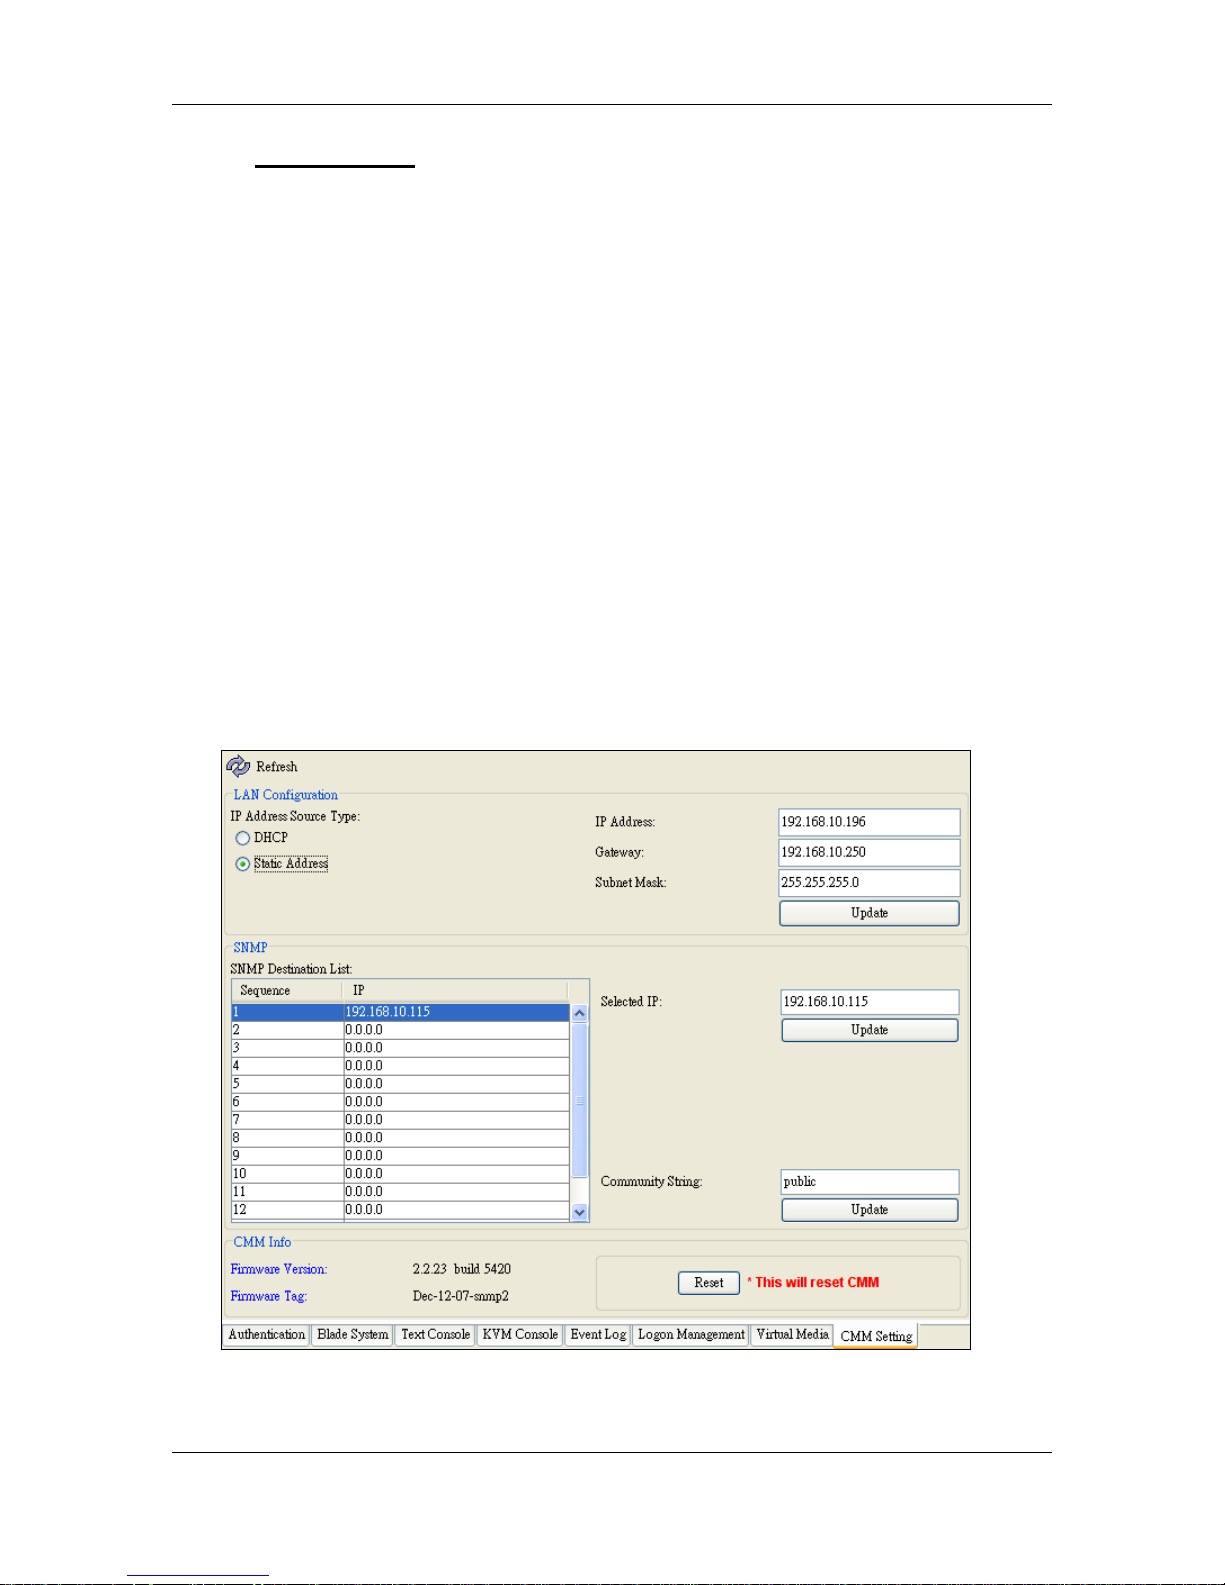
8. CMM Setting
The CMM Setting tab provides the LAN configuration, SNMP setting and CMM
information (Figure 8-1). The LAN Configuration shows the current CMM IP address,
Gateway and Subnet Mask. The CMM IP type can be set as a DHCP or static address.
The SNMP setting lets you specify the SNMP destination address to receive the
SNMP trap from the CMM. Once the CMM detects a failure, it logs into SEL and
immediately sends the SNMP trap to the destinations. Update the SNMP destinations
by selecting from the SNMP list. The selected SNMP will then appear in the text field
of the Selected IP. Update the SNMP destination by pressing the Update Button. The
Community String of the SNMP trap also can be updated. For more information about
receiving traps, see “Trap Receiver” in ClearView IPMI User’s Guide.
The CMM Info shows the firmware version and tag. Click the Reset button to reset
the CMM. You can also view this information and the related commands in the CMM
module through the Blade System tab.
Figure 8-1. CMM Setting
Page 37
34
9. Connecting to the Slave CMM
If you have installed two CMMs in one Blade System, one CMM should be assigned
as the master CMM and the other as the slave CMM. You should connect to the
master CMM for full-function management. However, you may also connect to the
slave CMM for event log checking, Logon Management and CMM settings.
After logging in, you see fewer UIs in the slave CMM, as shown in Figure 9-1. These
include only the Event Log, Logon Management and CMM Settings.
At the bottom is a yellow message bar showing that you are currently connected to the
slave (Redundant) CMM and telling you to connect to the master CMM. You may
refer to the master CMM IP address given to connect to the master CMM.
Figure 9-1. Connecting to Slave CMM
Page 38

ClearCube Technology, Inc.
8834 Capital of Texas Highway North Austin, TX 78759 512.652.3500
www.clearcube.com
P/N G0400073 Rev A
 Loading...