

Page 1
ADMINISTRATION
GUIDE
Cisco 350, 350X and 550X Series Managed Switches, Firmware Release 2.4, ver 0.4
Page 2

Contents
Table of Contents
Chapter 1: Quick Getting Started 10
Before You Begin 10
Rack Mounting Switch 11
Power over Ethernet Considerations 12
Configuring Switches 14
Configuring Your Switch Using the Console Port 16
USB Port 17
Switch Features 17
Chapter 2: General Information 23
Basic or Advanced Display Mode 23
Quick Start Device Configuration 25
Interface Naming Conventions 26
Window Navigation 27
Search Facility 30
Chapter 3: Dashboard 31
Grid Management 31
System Health 33
Resource Utilization 34
Identification 35
Port Utilization 36
PoE Utilization 37
Latest Logs 38
Suspended Interfaces 38
Traffic Errors 40
Cisco 350, 350X and 550X Series Managed Switches, Firmware Release 2.4, ver 0.4 1
Page 3

Contents
Chapter 4: Configuration Wizards 41
Getting Started Wizard 41
VLAN Configuration Wizard 43
ACL Wizard 44
Chapter 5: Status and Statistics 47
System Summary 48
CPU Utilization 50
Interface 50
Etherlike 52
Port Utilization 53
GVRP 53
802.1X EAP 54
ACL 56
Hardware Resource Utilization 56
Health and Power 57
Switched Port Analyzer (SPAN) 61
Diagnostics 62
RMON 66
View Logs 74
Chapter 6: Administration 77
System Settings 78
User Accounts 79
Idle Session Timeout 80
Time Settings 80
System Log 80
File Management 84
Plug-n-Play (PNP) 84
Reboot 88
Cisco 350, 350X and 550X Series Managed Switches, Firmware Release 2.4, ver 0.4 2
Page 4

Contents
Discovery - Bonjour 89
Discovery - LLDP 89
Discovery - CDP 89
Locate Device 90
Ping 90
Traceroute 92
Chapter 7: Administration: File Management 93
System Files 93
Firmware Operations 95
File Operations 99
File Directory 106
DHCP Auto Configuration/Image Update 107
Chapter 8: Administration: Stack Management 116
Overview 116
Types of Units in Stack 117
Stack Topology 118
Unit ID Assignment 119
Master Selection Process 120
Stack Changes 120
Unit Failure in Stack 121
Stack Ports 123
Software Auto Synchronization in Stack 126
Stack Management 130
Chapter 9: Administration: Time Settings 132
System Time Configuration 133
SNTP Modes 134
System Time 135
Cisco 350, 350X and 550X Series Managed Switches, Firmware Release 2.4, ver 0.4 3
Page 5

Contents
SNTP Unicast 137
SNTP Multicast/Anycast 140
SNTP Authentication 140
Time Range 141
Recurring Time Range 143
Chapter 10: Administration: Discovery 144
Bonjour 144
LLDP and CDP 145
Discover - LLDP 147
Discovery - CDP 168
Chapter 11: Port Management 177
Workflow 177
Port Settings 178
Error Recovery Settings 181
Loopback Detection Settings 182
Link Aggregation 185
PoE 193
Green Ethernet 202
Chapter 12: Smartport 210
Overview 210
How the Smartport Feature Works 215
Auto Smartport 215
Error Handling 219
Default Configuration 219
Relationships with Other Features 220
Common Smartport Tasks 220
Configuring Smartport Using The Web-based Interface 222
Cisco 350, 350X and 550X Series Managed Switches, Firmware Release 2.4, ver 0.4 4
Page 6

Contents
Built-in Smartport Macros 227
Chapter 13: VLAN Management 238
Regular VLANs 240
GVRP Settings 247
Voice VLAN 248
Chapter 14: Spanning Tree 261
STP Flavors 261
STP Status and Global Settings 262
STP Interface Settings 264
RSTP Interface Settings 266
Multiple Spanning Tree Overview 268
MSTP Properties 268
VLANs to a MSTP Instance 269
MSTP Instance Settings 270
MSTP Interface Settings 271
Chapter 15: Managing MAC Address Tables 274
Static Addresses 275
Dynamic Addresses 276
Chapter 16: Multicast 277
Multicast Forwarding Overview 277
Properties 283
MAC Group Address 284
IP Multicast Group Address 285
IPv4 Multicast Configuration 287
IPv6 Multicast Configuration 291
IGMP/MLD Snooping IP Multicast Group 294
Cisco 350, 350X and 550X Series Managed Switches, Firmware Release 2.4, ver 0.4 5
Page 7

Contents
Multicast Router Port 295
Forward All 295
Unregistered Multicast 296
Chapter 17: IP Configuration 298
Overview 298
Loopback Interface 300
IPv4 Management and Interfaces 300
IPv6 Management and Interfaces 309
Domain Name System 329
Chapter 18: IP Configuration: RIPv2 334
Overview 334
How Rip Operates on the Device 335
Configuring RIP 338
Access Lists 343
Chapter 19: IP Configuration: VRRP 346
Overview 346
VRRP Topology 347
Configurable Elements of VRRP 348
Configuring VRRP 351
Chapter 20: IP Configuration: SLA 355
Overview 355
Using SLA 358
Chapter 21: Security 362
RADIUS 363
Password Strength 366
Management Access Method 368
Cisco 350, 350X and 550X Series Managed Switches, Firmware Release 2.4, ver 0.4 6
Page 8

Contents
Management Access Authentication 373
SSL Server 374
SSH Client 377
TCP/UDP Services 377
Storm Control 379
Port Security 382
802.1X Authentication 384
Denial of Service Prevention 384
Chapter 22: Security: 802.1X Authentication 393
Overview 393
Properties 401
Port Authentication 403
Host and Session Authentication 405
Authenticated Hosts 406
Chapter 23: Security: Secure Sensitive Data Management 407
Introduction 407
SSD Management 408
SSD Rules 408
SSD Properties 413
Configuration Files 416
SSD Management Channels 420
Menu CLI and Password Recovery 421
Configuring SSD 421
Chapter 24: Security: SSH Server 425
Overview 425
Common Tasks 426
SSH User Authentication 427
Cisco 350, 350X and 550X Series Managed Switches, Firmware Release 2.4, ver 0.4 7
Page 9

Contents
SSH Server Authentication 428
Chapter 25: Security: SSH Client 430
Overview 430
SSH User Authentication 436
SSH Server Authentication 437
Change User Password on the SSH Server 439
Chapter 26: Security: IPv6 First Hop Security 440
IPv6 First Hop Security Overview 440
Router Advertisement Guard 443
Neighbor Discovery Inspection 444
DHCPv6 Guard 444
Neighbor Binding Integrity 445
IPv6 Source Guard 447
Attack Protection 448
Policies, Global Parameters and System Defaults 450
Common Tasks 452
Default Settings and Configuration 454
Configuring IPv6 First Hop Security through Web GUI 455
Chapter 27: Access Control 474
Overview 474
MAC-Based ACLs Creation 478
IPv4-based ACL Creation 480
IPv6-Based ACL Creation 485
ACL Binding 488
Chapter 28: Quality of Service 491
QoS Features and Components 492
Cisco 350, 350X and 550X Series Managed Switches, Firmware Release 2.4, ver 0.4 8
Page 10

Contents
General 496
QoS Basic Mode 506
QoS Advanced Mode 508
QoS Statistics 519
Chapter 29: SNMP 523
Overview 523
Engine ID 527
Views 529
Groups 530
Users 532
Communities 534
Trap Settings 536
Notification Recipients 536
Notification Filter 541
Chapter 30: Smart Network Application (SNA) 542
SNA Sessions 543
SNA Graphics 544
Top Right-Hand Menu 546
Topology View 547
Right-Hand Information Panel 556
Operations 570
Overlays 575
Tags 578
Search 582
Dashboard 584
Notifications 586
Device Authorization Control (DAC) 589
DAC Workflow 589
Cisco 350, 350X and 550X Series Managed Switches, Firmware Release 2.4, ver 0.4 9
Page 11

Contents
Services 595
Saving SNA Settings 613
Technical Details 614
Cisco 350, 350X and 550X Series Managed Switches, Firmware Release 2.4, ver 0.4 10
Page 12

Quick Getting Started
This section covers the following topics:
Before You Begin
Rack Mounting Switch
Power over Ethernet Considerations
Configuring98DX4203, 98DX4204, 98DX4210, 98DX4211, and 98DX4212Switches
1
Before You Begin
Configuring Yo ur Switch Using the Console Port
Out-Of-Band Port
USB Port
Stacking the Switches
98DX4203, 98DX4204, 98DX4210, 98DX4211, and 98DX4212Switch Features
Before you begin installing your device, ensure that the following items are available:
• RJ-45 Ethernet cables for connecting network devices. A category 6a and higher cable
is required for 10G ports; a category 5e and higher cable is required for all other ports.
• Console cable for using the console port to manage your switch.
• Tools for installing the hardware. The rack-mount kit packed with the switch contains
four rubber feet for desktop placement, and two brackets and twelve screws for rackmounting. If the supplied screws are lost, use replacement screws in the following size:
- Diameter of the screw head: 6.9 mm
- Length of face of screw head to base of screw: 5.9 mm
- Shaft diameter: 3.94 mm
Cisco 350, 350X and 550X Series Managed Switches, Firmware Release 2.4, ver 0.4 9
Page 13
1
400925
• Computer with Internet Explorer (version 9.0, 10.0, 11.0), or Firefox (version 36.0,
Rack Mounting Switch
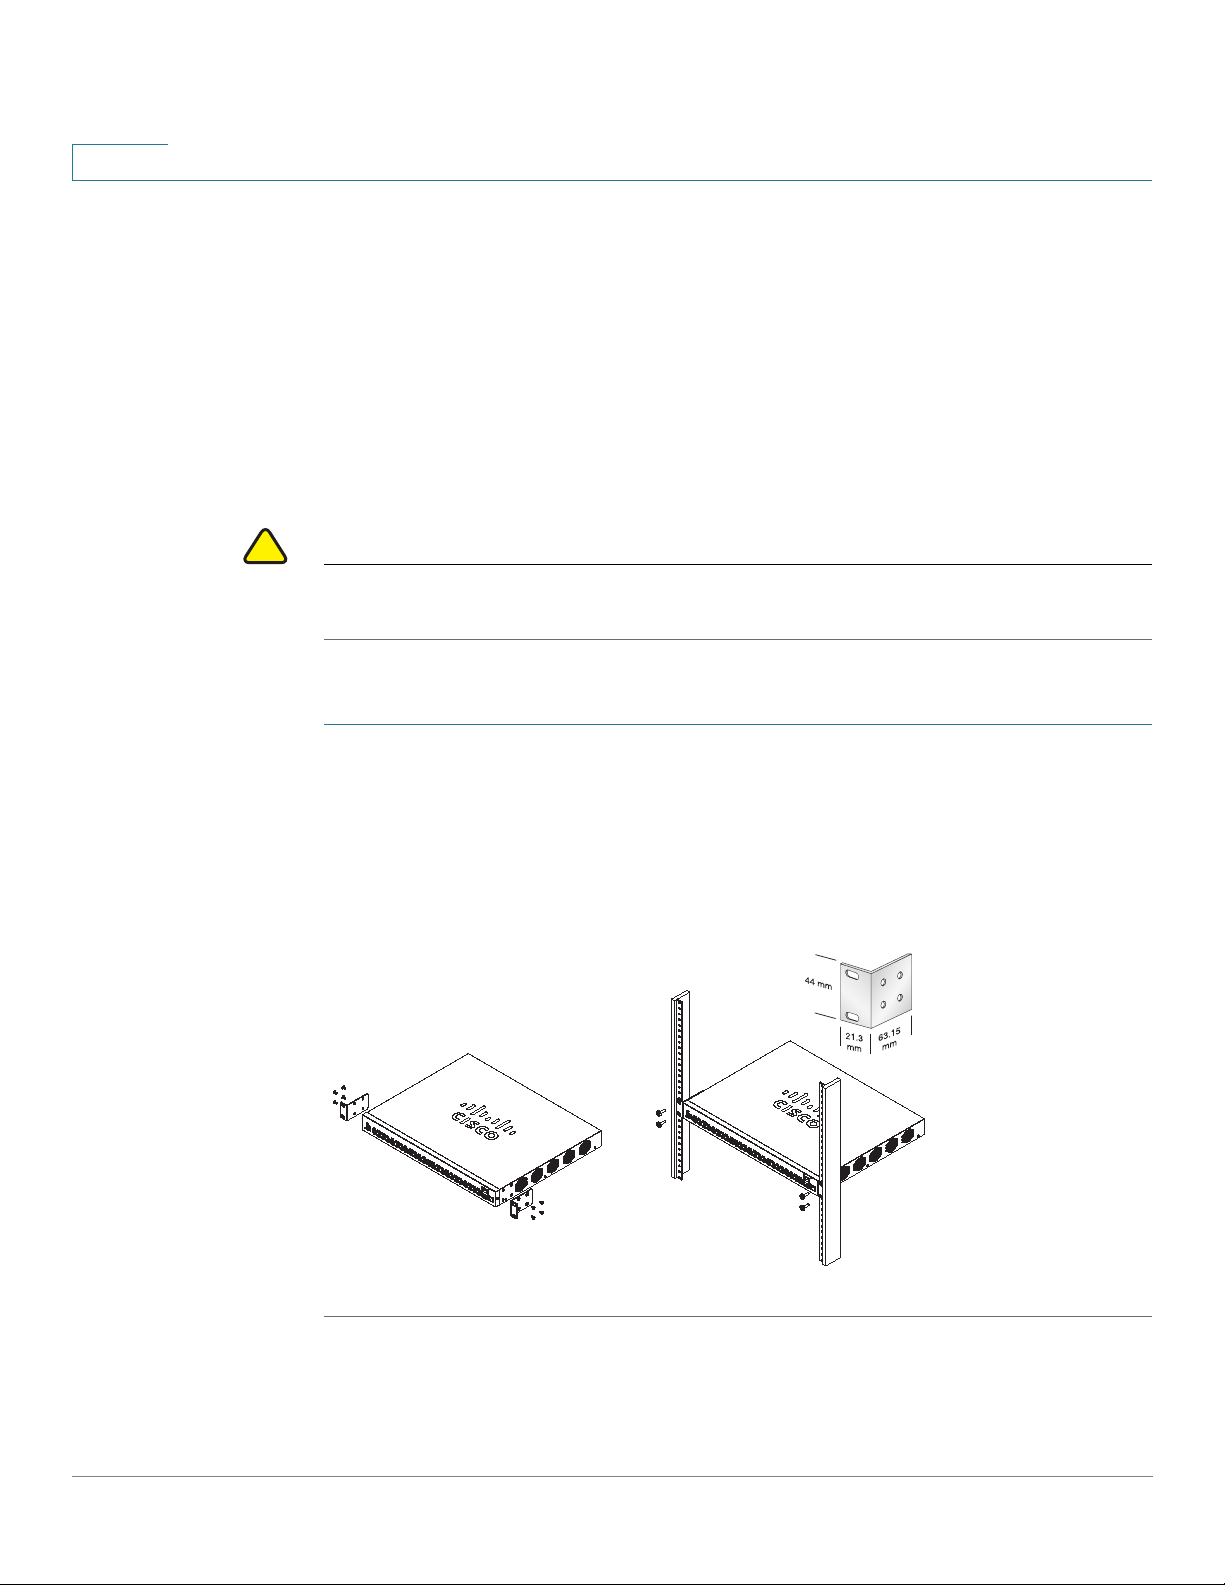
You can mount the switches in any standard size, 19-inch (about 48 cm) wide rack. The switch
requires 1 rack unit (RU) of space, which is 1.75 inches (44.45 mm) high.
!
CAUTION For stability , load the rack from the bottom to the top, with the heaviest devices on the bottom.
A top-heavy rack is likely to be unstable and might tip over.
Quick Getting Started
Rack Mounting Switch
37.0 or higher), or Chrome (version 40,41,42 or higher) for using the web-based
interface or the console port to manage your switch.
To install the switch into a 19-inch standard chassis:
STEP 1 Place one of the supplied brackets on the side of the switch so that the four holes of the
brackets align to the screw holes, and then use the four supplied screws to secure it.
STEP 2 Repe at the prev ious step to attach the other bracket to the opposite side of the switch.
STEP 3 After the brackets are securely attached, the switch is now ready to be installed into a standard
19-inch rack.
.
10 Cisco 350, 350X and 550X Series Managed Switches, Firmware Release 2.4, ver 0.4
Page 14

Quick Getting Started
Power over Ethernet Considerations
Power over Ethernet Considerations
WARNING The switch is to be connected only to PoE networks without routing to the outside plant.
Some devices support PoE while others do not. Models that support PoE have a P at the end of
the model number, such as: SF350-48HP.
PoE fields are described on all relevant pages although they are only supported on devices that
support PoE.
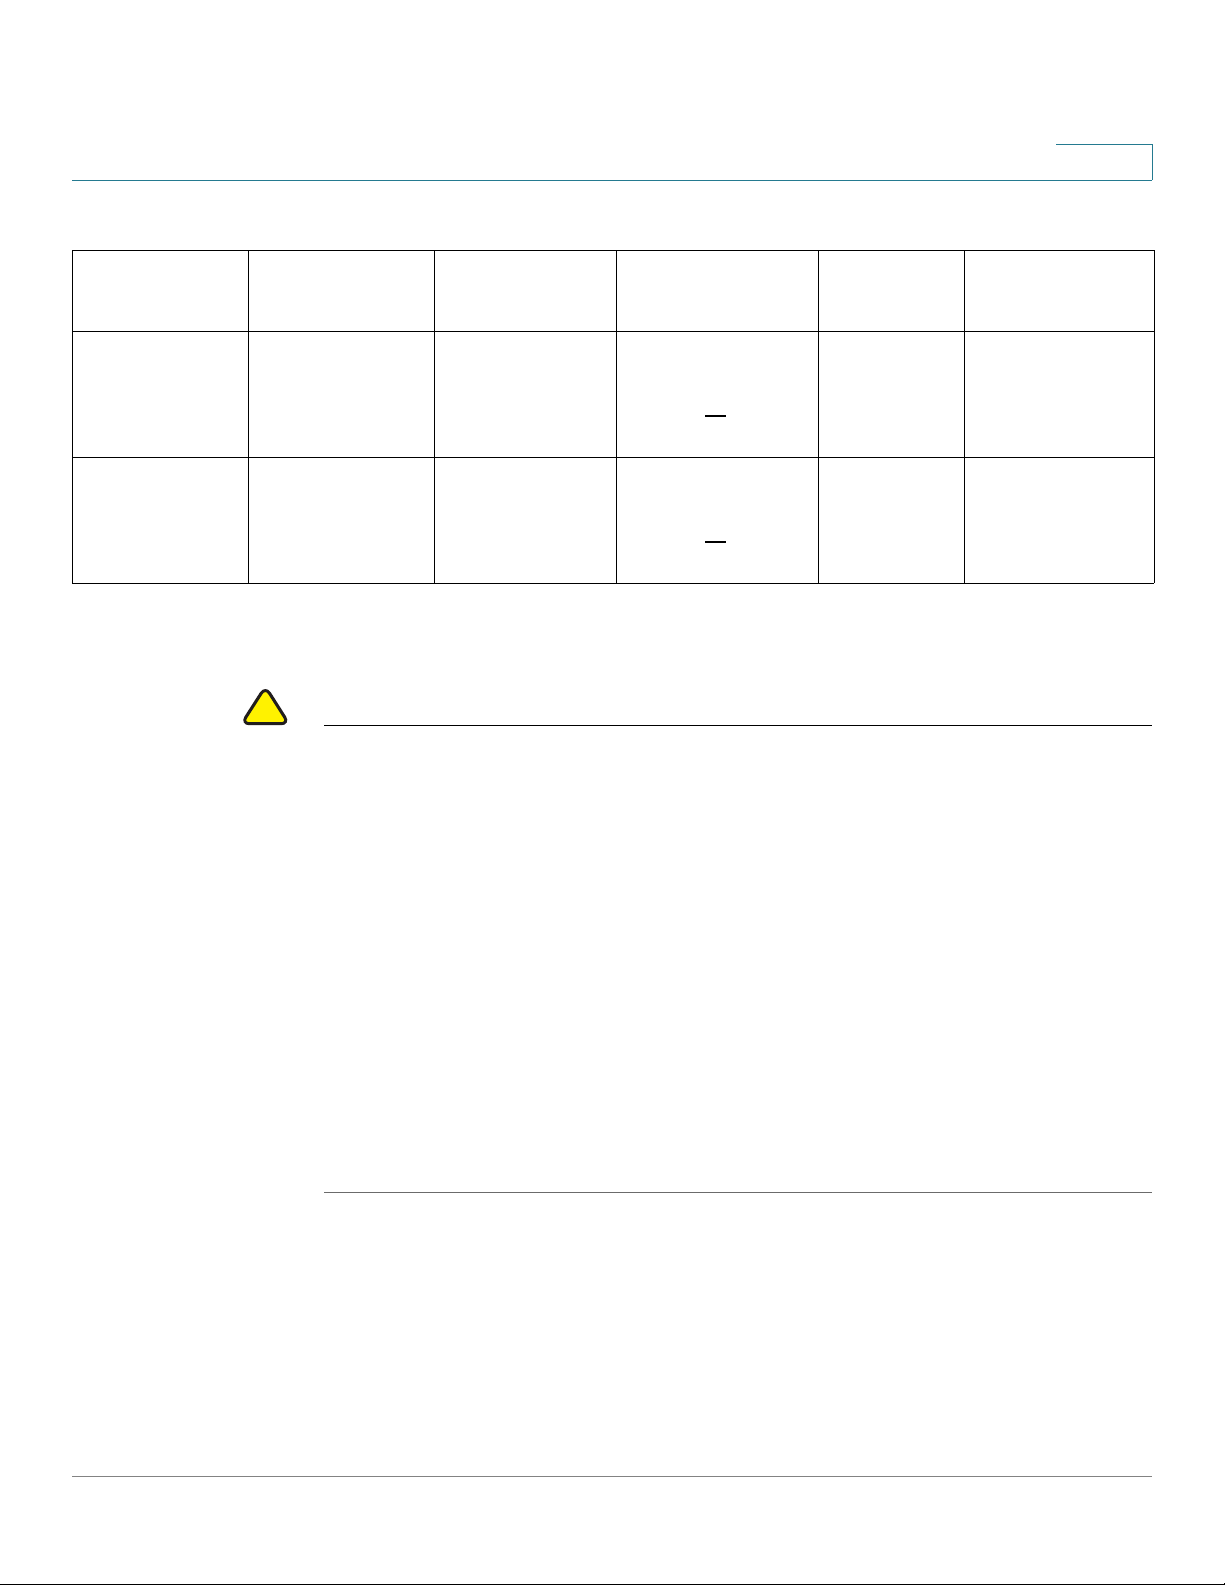
If your switch is one of the Power over Ethernet (PoE) models, consider the following power
requirement
Table 1 Switches with Power Over Ethernet
1
SKU Name Description PoE PD Chipset
Type
SF352-08P SF352-08P 8-Port
10/100 PoE
Managed Switch
SF352-08MP SF352-08MP 8-
Port 10/100 PoE
Managed Switch
SF350-24P SF350-24P 24-
Port 10/100 PoE
Managed Switch
SF350-24MP SF350-24MP 24-
Port 10/100 PoE
Managed Switch
SF350-48P SF350-48P 48-
Port 10/100 PoE
Managed Switch
2x PD70210 + 2x
PD70222 + 1?x
LX7309
2x PD70210 + 2x
PD70222 + 1?x
LX7309
N/A 3*69208M
N/A 3*69208M
N/A 7* PD69208
PoE PSE Chipset
Type
1*69208M
(0x4B42)
1*69208M
(0x4B42)
(0x4B42) +
1*69204
(0x4B42) +
1*69204
(0x4AC2) /
7*69208M
(0x4B42) (as of
2.2.7)
PoE PD AF/
AT/60W
AF/AT/60W AT
AF/AT/60W AT
N/A AF/AT/60W
N/A AF/AT/60W
N/A AF/AT/60W
PoE PSE AF/AT/
60W
SF350-48P SF350-48P 48-
Port 10/100 PoE
Managed Switch
Cisco 350, 350X and 550X Series Managed Switches, Firmware Release 2.4, ver 0.4 11
N/A 7*69208M
(0x4B42)
N/A AF/AT/60W
Page 15

1
Table 1 Switches with Power Over Ethernet (Continued)
Quick Getting Started
Power over Ethernet Considerations
SKU Name Description PoE PD Chipset
Type
SF350-48MP SF350-48MP 48-
Port 10/100 PoE
Managed Switch
SG350-08PD SG350-8PD 8-
Port 2.5G PoE
Managed Switch
SG350-10P SG350-10P 10-
Port Gigabit PoE
Managed Switch
SG355-10P SG355-10P 10-
Port Gigabit PoE
Managed Switch
SG350-10MP SG350-10MP 10-
Port Gigabit PoE
Managed Switch
N/A 7* PD69208
NA 1*69208M
2x PD70210 + 2x
PD70222 + 1?x
LX7309
2x PD70210 + 2x
PD70222 + 1?x
LX7309
2x PD70210 + 2x
PD70222 + 1?x
LX7309
PoE PSE Chipset
Type
(0x4AC2) /
7*69208M
(0x4B42)
(0x4B42)
1* PD69208
(0x4AC2) /
1*69208M
(0x4B42)
1* PD69208
(0x4AC2) /
1*69208M
(0x4B42)
1* PD69208
(0x4AC2) /
1*69208M
(0x4B42)
PoE PD AF/
AT/60W
N/A AF/AT/60W
NA AF/AT
AF/AT/60W AT
AF/AT/60W AT
AF/AT/60W AT
PoE PSE AF/AT/
60W
SG350-10SFP SG350-10SFP 10-
Port Gigabit SFP
Managed Switch
SG350-28P SG350-28P 28-
Port Gigabit PoE
Managed Switch
SG350-28MP SG350-28MP 28-
Port Gigabit PoE
Managed Switch
12 Cisco 350, 350X and 550X Series Managed Switches, Firmware Release 2.4, ver 0.4
N/A N/A N/A N/A
N/A 3x PD69208+
1*PD69204
(0x4AC2) /
3*69208M
(0x4B42) +
1*69204
N/A 3x PD69208+
1*PD69204
(0x4AC2) /
3*69208M
(0x4B42) +
1*69204
N/A AF/AT/60W
N/A AF/AT/60W
Page 16

Quick Getting Started
Power over Ethernet Considerations
Table 1 Switches with Power Over Ethernet (Continued)
1
SKU Name Description PoE PD Chipset
Type
SG350-28SFP SG350-28SFP 28-
Port Gigabit SFP
Managed Switch
SG350-52P SG350-52P 52-
Port Gigabit PoE
Managed Switch
SG350-52MP SG350-52MP 52-
port Gigabit PoE
Managed Switch
SG350X08PMD
SG350X-24P SG350X-24P 24-
SG350X-8PMD
8-Port 2.5G PoE
Stackable
Managed Switch
Port Gigabit PoE
Stackable
Managed Switch
N/A N/A N/A N/A
N/A 7*69208M
N/A 7*69208M
N/A 1*69208M +
N/A 3x PD69208+
PoE PSE Chipset
Type
(0x4B42)
(0x4B42)
1*69204 (0x4B42)
1*PD69204
(0x4AC2) /
3*69208M
(0x4B42) +
1*69204
PoE PD AF/
AT/60W
N/A AF/AT/60W
N/A AF/AT/60W
N/A AF/AT/60W
N/A af/at/60w
PoE PSE AF/AT/
60W
SG350X-24MP SG350X-24MP
24-Port Gigabit
PoE Stackable
Managed Switch
SG350X-24PD SG350X-24PD
24-Port 2.5G PoE
Stackable
Managed Switch
SG350X-48P SG350X-48P 48-
Port Gigabit PoE
Stackable
Managed Switch
Cisco 350, 350X and 550X Series Managed Switches, Firmware Release 2.4, ver 0.4 13
N/A 3x PD69208+
1*PD69204
(0x4AC2) /
3*69208M
(0x4B42) +
1*69204
NA 3*69208M
(0x4B42) +
1*69204
N/A 7* PD69208
(0x4AC2) /
7*69208M
(0x4B42)
N/A af/at/60w
NA AF/AT/60W
N/A af/at/60w
Page 17

1
Table 1 Switches with Power Over Ethernet (Continued)
Quick Getting Started
Power over Ethernet Considerations
SKU Name Description PoE PD Chipset
Type
SG350X-48MP SG350X-48MP
48-Port Gigabit
PoE Stackable
Managed Switch
SF550X-24P SF550X-24P 24-
Port 10/100 PoE
Stackable
Managed Switch
SF550X-24MP SF550X-24MP
24-Port 10/100
PoE Stackable
Managed Switch
SF550X-48P SF550X-48P 48-
Port 10/100 PoE
Stackable
Managed Switch
N/A 7* PD69208
N/A 4* PD69208
N/A 4* PD69208
N/A 7* PD69208
PoE PSE Chipset
Type
(0x4AC2) /
7*69208M
(0x4B42)
(0x4AC2) /
4*69208M
(0x4B42)
(0x4AC2) /
4*69208M
(0x4B42)
(0x4AC2) /
7*69208M
(0x4B42)
PoE PD AF/
AT/60W
N/A af/at/60w
N/A af/at/60w
N/A af/at/60w
N/A af/at/60w
PoE PSE AF/AT/
60W
SF550X-48MP SF550X-48MP
48-Port 10/100
PoE Stackable
Managed Switch
SG550X-24P SG550X-24P 24-
Port Gigabit PoE
Stackable
Managed Switch
SG550X-24MP SG550X-24MP
24-Port Gigabit
PoE Stackable
Managed Switch
SG550X-24MPP SG550X-24MPP
24-Port Gigabit
PoE Stackable
Managed Switch
N/A 7* PD69208
(0x4AC2) /
7*69208M
(0x4B42)
N/A 4* PD69208
(0x4AC2) /
4*69208M
(0x4B42)
N/A 4* PD69208
(0x4AC2) /
4*69208M
(0x4B42)
N/A 4* PD69208
(0x4AC2) /
4*69208M
(0x4B42)
N/A af/at/60w
N/A af/at/60w
N/A af/at/60w
N/A af/at/60w
14 Cisco 350, 350X and 550X Series Managed Switches, Firmware Release 2.4, ver 0.4
Page 18
Quick Getting Started
!
Power over Ethernet Considerations
Table 1 Switches with Power Over Ethernet (Continued)
1
SKU Name Description PoE PD Chipset
Type
SG550X-48P SG550X-48P 48-
Port Gigabit PoE
Stackable
Managed Switch
SG550X-48MP SG550X-48MP
48-Port Gigabit
PoE Stackable
Managed Switch
NOTE 60-Watt PoE extends the IEEE Power of Ethernet Pl us standard to double the power per port to
60 W atts.
CAUTION Consider the following when connecting switches capable of supplying PoE:
The PoE models of the switches are PSE (Power Sourcing Equipment) that are capable of
supplying DC power to attaching PD (Powered Devices). These devices include VoIP phones,
IP cameras, and wireless access points. The PoE switches can detect and supply power to prestandard legacy PoE Powered Devices. Due to the support of legacy PoE, it is possible that a
PoE switch acting as a PSE may mistakenly detect and supply power to an attaching PSE,
including other PoE switches, as a legacy PD.
Even though PoE switches are PSE, and as such should be powered by AC, they could be
powered up as a legacy PD by another PSE due to false detection. When this happens, the PoE
switch may not operate properly and may not be ab le to properly supply power to its attaching
PDs.
To prevent false detection, you should disable PoE on the ports on the PoE switches that are
used to connect to PSEs. You should also first power up a PSE device before connecting it to a
PoE switch. When a device is being falsely detected as a PD, you should disconnect the device
from the PoE port and power recycle the device with AC power before reconnecting its PoE
ports.
N/A 7* PD69208
N/A 7* PD69208
PoE PSE Chipset
Type
(0x4AC2) /
7*69208M
(0x4B42)
(0x4AC2) /
7*69208M
(0x4B42)
PoE PD AF/
AT/60W
N/A af/at/60w
N/A af/at/60w
PoE PSE AF/AT/
60W
Cisco 350, 350X and 550X Series Managed Switches, Firmware Release 2.4, ver 0.4 15
Page 19

Quick Getting Started
1
Configuring98DX4203, 98DX4204, 98DX4210, 98DX4211, and 98DX4212 Switches
Configuring98DX4203, 98DX4204, 98DX4210, 98DX4211, and
98DX4212 Switches
Before You Begin
The switch can be accessed and managed by two different methods; over your IP network
using the web-based interface, or by using the switch’s comman d-line interface through the
console port. Using the console port requires advanced user skills.
The following table shows the default settings used when configuring your switch for the first
time.
Parameter Default Value
Username cisco
Password cisco
LAN IP 192.168.1.254
Configuring Your Switch Using the We b-based Interface
T o access the switch with a web-based interface, you must know the IP address that the switch
is using. The switch uses the factory default IP address of 192.168.1.254, with a subnet of /24.
When the switch is using the factory default IP address, the System LED flashes continuously.
When the switch is using a DHCP server-assigned IP address or an administrator has
configured a static IP address, the System LED is a steady green (DHCP is enabled by
default).
If you are managing the switch through a network connection and the switch IP address is
changed, either by a DHCP server or manually, your access to the switch will be lost. You
must enter the new IP address that the switch is using into your browser to use the web-based
interface. If you are managing the switch through a console port connection, the link is
retained.
To configure the switch using the web-based interface:
STEP 1 Power on the computer and your switch.
STEP 2 For Cisco 350-550 XG switches, connect the computer to the OOB port found on the front
panel. For all other switches, connect the computer to any network port.
16 Cisco 350, 350X and 550X Series Managed Switches, Firmware Release 2.4, ver 0.4
Page 20

Quick Getting Started
!
Configuring98DX4203, 98DX4204, 98DX4210, 98DX4211, and 98DX4212 Switches
STEP 3 Set up the IP configuration on your computer.
a. If the switch is using the default static IP address of 192.168.1.254/24, you must choose an
IP address for the co mputer in the range of 192.168.1.2 to 192.1 68.1.253 that is not already
in use.
b. If the IP addresses will be assigned b y DHCP, make sure that your DHCP server is running
and can be reached from the switch and the computer. You may need to disconnect and
reconnect the devices for them to discover their new IP addresses from the DHCP server.
NOTE Details on how to change the IP address on your computer depend upon the type
of architecture and operating system that you are using. Use your computers local Help
and Support functionality and search for “IP Addressing.”
STEP 4 Open a web browser window. If you are prompted to install an ActiveX plug-in when
connecting to the device, follow the prompts to accept the plug-in.
STEP 5 Enter the switch IP address in the address bar and press Enter. For example,
http://192.168.1.254.
1
STEP 6 When the login page appears, choose the language that you prefer to use in the web-based
interface and enter the username and password.
The default username is cisco. The default password is cisco. Usernames and passwords are
both case sensitive.
STEP 7 Click Log In.
If this is the first time that you have logged on with the default username and password, the
Change Password page opens. The rules for constructing a new password are displayed on the
page.
STEP 8 Enter a new password and confirm the password.
NOTE Password complexity is enabled by default. The password must comply with the
default complexity rules or it can be disabled temporarily by checking Disable next to
the Password Strength Enforcement option.
STEP 9 Click Apply.
CAUTION Make sure that any configuration changes made a re saved before exiting from the web-based
interface by clicking on the Save icon. Exiting before you save your configuration results in all
changes being lost.
Cisco 350, 350X and 550X Series Managed Switches, Firmware Release 2.4, ver 0.4 17
Page 21

1
The Getting Started page opens. You are now ready to configure the switch. Refer to the
Administration Guide or see the help pages for further information.
Configuring Your Switch Using the Console Port
Browser Restrictions
If you are using IPv6 interfaces on your management station, use the IPv6 global address and
not the IPv6 link local address to access the device from your browser.
Configuring Your Switch Using the Console Port
To configure the switch using the console port:
Quick Getting Started
STEP 1 Connect a computer to the switch console port using the supplied console cable.
STEP 2 Start a console port utility such as HyperTerminal on the computer.
STEP 3 Configure the utility with the following parameters:
• 115200 bits per second
• 8 data bits
• no parity
• 1 stop bit
• no flow control
STEP 4 Enter a username and password. The default username is cisco, and the default password is
cisco. Usernames and passwords are both case sensitive.
If this is the first time that you have logged on with the default username and password, the
following message appears:
Please change your password from the default settings. Please change the
password for better protection of your network. Do you want to change the
password (Y/N) [Y]?
STEP 5 Enter Y, and set a new administrator password.
NOTE Password complexity is enabled by default. The password must comply with the
default complexity rules.
18 Cisco 350, 350X and 550X Series Managed Switches, Firmware Release 2.4, ver 0.4
Page 22

Quick Getting Started
!
Out-Of-Band Port
CAUTION Make sure that any configuration changes made are saved before exiting.
Out-Of-Band Port
1
You are now ready to configure the switch. See the CLI Guide for your switch.
NOTE If you are not using DHCP on yo ur network, set the IP address t ype on the switch
to Static and change the static IP address and subnet mask to match your network
topology . Failure to do so may result in multiple switches using the same factory default
IP address of 192.168.1.2 54.
OOB is only supported on SG350XG/SX350X and SG550XG/SX550X devices.
The switch supports an Out-of-Band (OOB) port. This port is used for the management
network. The out-of-band and the in-band ports share the same IP routing table, therefore you
cannot use the same subnet on both in-band and out-of-band interfaces.
The OOB port is assigned an MAC address which is different from the base MAC
address and the addresses of the in-band ports. This MAC address is used as the
source MAC address in all frames (including IP frames) sent by the switch on the
OOB port.
The IP address assigned to this port cannot be assigned to the in-band ports at the same time.
In addition, the IP address assigned to the OOB port must not belong to any IP subnet
configured at the in-band interfaces of the devices.
By default, the OOB port is configured with the default IP address 192.168.1.254. This default
IP address is used when no other address was assigned (dynamically or statically). This sub net
is a reserved one and cannot be assigned on the in-band interfaces.
Bridging
Bridging between the OOB port and the in-band Layer 2 interfaces is not
supported. The OOB port cannot be a member of VLAN or LAG, and the bridge’s
protocols (for example, STP, GVRP, etc.) cannot be enabled on the OOB port.
Only untagged traffic is supported on the OOB port.
Cisco 350, 350X and 550X Series Managed Switches, Firmware Release 2.4, ver 0.4 19
Page 23

1
Quick Getting Started
Out-Of-Band Port
Port Configuration
The following Ethernet configuration is supported for the OOB port:
• Speed (10/100/1000)
• Duplex
• Auto-negotiation
DHCP Client
DHCP client (IPv4 and IPv6) is enabled by default on the OOB por t and on the d efault VLAN.
Static route on OOB port
Static routes are supported on the OOB port.
IPv4 Address on OOB port
Only one IPv4 address can be defined on the OOB port.
The default static IP address is set only on the OOB.
IP Applications
All IP applications, such as telnet, SSH, except for the following ones are supported on the
OOB port:
• ARP Proxy
• Routing protocols
• Relay applications (DHCP, DHCPv6 and UDP)
QoS & ACL
QoS and ACL are not supported on the OOB port (so all TCAM-based features like DOS
Attack Prevention are also not supported).
Only Management ACLs are supported.
20 Cisco 350, 350X and 550X Series Managed Switches, Firmware Release 2.4, ver 0.4
Page 24

Quick Getting Started
USB Port
USB Port
1
Stack Support
The OOB port name is always mapped to the physical OOB port of master unit. The physical
OOB ports of slaves are not functional and will not establish a link when connected to a
neighbor device or PC.
The USB port can be used for connecting external storage (disk-on-key) devices. It can hold
configuration, SYSLOG and image files. In a stack, only the master’s USB port is active. The
USB port fully supports the FAT32 file system, and provides partial support (read only) for the
NTFS file system.
Both relative path or fully qualified paths can be used.
The system supports the following user actions on the USB port through the GUI:
• Display the USB contents
• Copy files to/from USB (the same as with TFTP)
• Delete, rename and display the contents of USB files
Stacking the Switches
By default, the ports on a switch function as regular Ethernet ports, except if you configure
them to do stacking. You cannot mix the stack speeds between the switches or ports.
See the front panel figures in 98DX4203, 98DX4204, 98DX4210, 98DX4211, and
98DX4212Switch Features to help with the stack port descriptions and supported modules.
WARNING Stack ports must be either configured with the sa m e port sp e ed or have th e sa m e sp ee d
capability on the module or cable plug in. If the port speed is configured as auto, then the
module plugged into these two ports will need to have the same speed capability, otherwise the
switch will not be able to form as a stack with multiple units.
A stack can have up to four 350X devices or eight 550X devices in it. Any 10G port of the
switch can be used for stacking. The switch can only be stacked without Mesh topology.
Cisco 350, 350X and 550X Series Managed Switches, Firmware Release 2.4, ver 0.4 21
Page 25

Quick Getting Started
1
The switches in the same stack are connected together through their stack ports. Depending on
the type of stack ports and the desired speed, you may need Cat6a Ethernet cables or Cisco
approved modules or cables for the switches.
98DX4203, 98DX4204, 98DX4210, 98DX4211, and 98DX4212Switch Features
98DX4203, 98DX4204, 98DX4210, 98DX4211, and 98DX4212Switch
Features
This section describes the exterior of the switch to help familiarize you with your switch.
Product Models
The following are the available product models:
Table 2 Product Models
SKU Name Description
SG350XG-24F SG350XG-24F 24-Port 10G SFP+ Stackable Managed Switch
SG350XG-24T SG350XG-24T 24-Port 10GBase-T Stackable Managed Switch
SG350XG-48T SG350XG-48T 48-Port 10GBase-T Stackable Managed Switch
SG350XG-2F10 SG350XG-2F10 12-Port 10G Stackable Managed Switch
SG550XG-8F8T SG550XG-8F8T 16-Port 10G Stackable Managed Switch
SG550XG-24T SG550XG-24T 24-Port 10GBase-T Stackable Managed Switch
SG550XG-48T SG550XG-48T 48-Port 10GBase-T Stackable Managed Switch
SG550XG-24F SG550XG-24F 24-Port 10G SFP+ Stackable Managed Switch
SF350-08 SF350-08 8-Port 10/100 Managed Switch
SF352-08 SF352-08 8-Port 10/100Managed Switch
22 Cisco 350, 350X and 550X Series Managed Switches, Firmware Release 2.4, ver 0.4
Page 26

Quick Getting Started
98DX4203, 98DX4204, 98DX4210, 98DX4211, and 98DX4212Switch Features
Table 2 Product Models (Continued)
SKU Name Description
SF352-08P SF352-08P 8-Port 10/100 PoE Managed Switch
SF352-08MP SF352-08MP 8-Port 10/100 PoE Managed Switch
SF350-24 SF350-24 24-Port 10/100 Managed Switch
SF350-24P SF350-24P 24-Port 10/100 PoE Managed Switch
1
SF350-24MP SF350-24MP 24-Port 10/100 PoE Managed Switch
SF350-48 SF350-48 48-Port 10/100 Managed Switch
SF350-48P SF350-48P 48-Port 10/100 PoE Managed Switch
SF350-48P SF350-48P 48-Port 10/100 PoE Managed Switch
SF350-48MP SF350-48MP 48-Port 10/100 PoE Managed Switch
SG350-08PD SG350-8PD 8-Port 2.5G PoE Managed Switch
SG350-10 SG350-10 10-Port Gigabit Managed Switch
SG350-10P SG350-10P 10-Port Gigabit PoE Managed Switch
Cisco 350, 350X and 550X Series Managed Switches, Firmware Release 2.4, ver 0.4 23
Page 27

1
Quick Getting Started
98DX4203, 98DX4204, 98DX4210, 98DX4211, and 98DX4212Switch Features
Table 2 Product Models (Continued)
SKU Name Description
SG355-10P SG355-10P 10-Port Gigabit PoE Managed Switch
SG350-10MP SG350-10MP 10-Port Gigabit PoE Managed Switch
SG350-10SFP SG350-10SFP 10-Port Gigabit SFP Managed Switch
SG350-20 SG350-20 20-Port Gigabit Managed Switch
SG350-28 SG350-28 28-Port Gigabit Managed Switch
SG350-28P SG350-28P 28-Port Gigabit PoE Managed Switch
SG350-28MP SG350-28MP 28-Port Gigabit PoE Managed Switch
SG350-28SFP SG350-28SFP 28-Port Gigabit SFP Managed Switch
SG350-52 SG350-52 52-Port Gigabit Managed Switch
SG350-52P SG350-52P 52-Port Gigabit PoE Managed Switch
SG350-52MP SG350-52MP 52-port Gigabit PoE Managed Switch
24 Cisco 350, 350X and 550X Series Managed Switches, Firmware Release 2.4, ver 0.4
Page 28

Quick Getting Started
98DX4203, 98DX4204, 98DX4210, 98DX4211, and 98DX4212Switch Features
Table 2 Product Models (Continued)
SKU Name Description
SG350X-08PMD SG350X-8PMD 8-Port 2.5G PoE Stackable Managed Switch
SG350X-24 SG350X-24 24-Port Gigabit Stackable Managed Switch
SG350X-24P SG350X-24P 24-Port Gigabit PoE Stackable Managed Switch
SG350X-24MP SG350X-24MP 24-Port Gigabit PoE Stackable Managed Switch
1
SG350X-24PD SG350X-24PD 24-Port 2.5G PoE Stackable Managed Switch
SG350X-48 SG350X-48 48-Port Gigabit Stackable Managed Switch
SG350X-48P SG350X-48P 48-Port Gigabit PoE Stackable Managed Switch
SG350X-48MP SG350X-48MP 48-Port Gigabit PoE Stackable Managed Switch
SF550X-24 SF550X-24 24-Port 10/100 Stackable Managed Switch
SF550X-24P SF550X-24P 24-Port 10/100 PoE Stackable Managed Switch
Cisco 350, 350X and 550X Series Managed Switches, Firmware Release 2.4, ver 0.4 25
Page 29

1
Quick Getting Started
98DX4203, 98DX4204, 98DX4210, 98DX4211, and 98DX4212Switch Features
Table 2 Product Models (Continued)
SKU Name Description
SF550X-24MP SF550X-24MP 24-Port 10/100 PoE Stackable Managed Switch
SF550X-48 SF550X-48 48-Port 10/100 Stackable Managed Switch
SF550X-48P SF550X-48P 48-Port 10/100 PoE Stackable Managed Switch
SF550X-48MP SF550X-48MP 48-Port 10/100 PoE Stackable Managed Switch
SG550X-24 SG550X-24 24-Port Gigabit Stackable Managed Switch
SG550X-24P SG550X-24P 24-Port Gigabit PoE Stackable Managed Switch
SG550X-24MP SG550X-24MP 24-Port Gigabit PoE Stackable Managed Switch
SG550X-24MPP SG550X-24MPP 24-Port Gigabit PoE Stackable Managed Switch
SG550X-48 SG550X-48 48-Port Gigabit Stackable Managed Switch
SG550X-48P SG550X-48P 48-Port Gigabit PoE Stackable Managed Switch
SG550X-48MP SG550X-48MP 48-Port Gigabit PoE Stackable Managed Switch
26 Cisco 350, 350X and 550X Series Managed Switches, Firmware Release 2.4, ver 0.4
Page 30

Quick Getting Started
98DX4203, 98DX4204, 98DX4210, 98DX4211, and 98DX4212Switch Features
Table 2 Product Models (Continued)
SKU Name Description
SX350X-08 SX350X-08 8-Port 10GBase-T Stackable Managed Switch
SX350X-12 SX350X-12 12-Port 10GB ase-T Stackable Managed Switch
SX350X-24F SX350X-24F 24-Port 10G SFP+ Stackable Managed Switch
SX350X-24 SX350X-24 24-Port 10GB ase-T Stackable Managed Switch
1
SX350X-52 SX350X-52 52-Port 10GB ase-T Stackable Managed Switch
SX550X-16FT SX550X-16FT 16-Port 10G Stackable Managed Switch
SX550X-12F SX550X-12F 12-Port 10G SFP+ Stackable Managed Switch
SX550X-24 SX550X-24 24-Port 10GB ase-T Stackable Managed Switch
SX550X-24FT SX550X-24FT 24-Port 10G Stackable Managed Switch
SX550X-24F SX550X-24F 24-Port 10G SFP+ Stackable Managed Switch
SX550X-52 SX550X-52 52-Port 10GB ase-T Stackable Managed Switch
Cisco 350, 350X and 550X Series Managed Switches, Firmware Release 2.4, ver 0.4 27
Page 31

1
Quick Getting Started
98DX4203, 98DX4204, 98DX4210, 98DX4211, and 98DX4212Switch Features
Front Panel
The ports, LEDs, and Reset button are located on the front panel of the switch as represented
in the following illustrations. Not all SKUs are displayed below. Rather a representative group
is displayed.
SG350-52P
SF350X-24PD
SG350XG-2F10
SG550XG-48T
The following components are found on the front panel of the device:
• USB Port—The USB port connects the switch to a USB device so that you can save
and restore the configuration files, firmware images, and SYSLOG files through the
connected USB device.
• RJ-45 Ethernet Ports—The RJ-45 Ethernet ports connect network devices, such as
computers, printers, and access points, to the switch.
• Multigigabit Ethernet Ports—Highlighted in blue, these ports support speeds of 100
Mbps, 1 Gbps, and 2.5 Gbps, on Cat 5e cables. Much of the cabling deployed
worldwide is limited to 1 Gbps at 100 meters. Cisco Multigigabit Ethernet enables
speeds up to 2.5 Gbps on the same infrastructure without replacing a cable.
28 Cisco 350, 350X and 550X Series Managed Switches, Firmware Release 2.4, ver 0.4
Page 32

Quick Getting Started
98DX4203, 98DX4204, 98DX4210, 98DX4211, and 98DX4212Switch Features
• 60-Watt PoE Ports—Highlighted in yellow. The 60-Watt PoE ports double the PoE
power to 60W. This is not found on the 250 devices nor on the SF350-48P device.
• SFP+ Port (if present)—The small form-factor pluggable plus (SFP+) are connection
points for modules so that the switch can link to other switches. These ports are also
commonly referred to as mini 10GigaBit Interface Converter ports. The term SFP+ is
used in this guide.
• The SFP+ ports are compatible with the following Cisco SFP 1G optical modules
MGBSX1, MGBLH1, MGBT1, as well as other brands.
• The Cisco SFP+ 10G optical modules that are supported in the Cisco switches are:
SFP-10G-SR, SFP-10G-LR, SFP-10G-SR-S, and
SFP-10G-LR-S.
• The Cisco SFP+ Copper Cable modules for stacking that are supported in the Cisco
switches are: SFP-H10GB-CU1M, SFP-H10GB-CU3M, and SFP-H10GB-CU5M.
1
• The SFP+ port is a combination port, shared with one other RJ-45 port. When the
SFP+ is active, the adjacent RJ-45 port is disabled.
• Some SFP interfaces are shared with one other RJ-45 port, called a combo port. When
the SFP is active, the adjacent RJ-45 port is disabled.
• The LEDs of the corresponding RJ-45 port flash green to respond to the SFP interface
traffic.
• OOB Port (if present)—The Out of Band (OOB) port is a CPU Ethernet port that can
be used only as a management interface. Bridging between the OOB port and the inband Layer 2 interface is not supported. This does not appear on 250 devices.
Front Panel LEDs
The following are the global LEDs found on the devices:
• Master—(Green) The LED lights steady when the switch is a stack master.
• System—(Green) The LED lights steady when the switch is powered on, and flashes
when booting, performing self-tests, or acquiring an IP address. If the LED flashes
Green, the switch has detected a hardware failure, a firmware failure, and/or a
configuration file error.
• Stack ID—(Green) The LED lights steady when the switch is stacked and the
corresponding number indicates its Stack ID.
Cisco 350, 350X and 550X Series Managed Switches, Firmware Release 2.4, ver 0.4 29
Page 33

1
Quick Getting Started
98DX4203, 98DX4204, 98DX4210, 98DX4211, and 98DX4212Switch Features
The following are per port LEDs:
• LINK/ACT—(Green) Located on the left of each port. The LED lights steady when a
link between the corresponding port and another device is detected, and flashes when
the port is passing traffic.
• XG—(Green) Located on the right of a 10G port. The LED lights steady when another
device is connected to the port, is powered on, and a 10 Gbps link is established
between the devices. When the LED is off, the connection speed is under 10 Gbps or
nothing is cabled to the port.
• Gigabit—(Green) Located on the right of the OOB port. The LED lights steady when
another device is connected to the port, is powered on, and a 1000 Mbps link is
established between the devices. When the LED is off, the connection speed is under
1000 Mbps or nothing is cabled to the port.
• SFP+ (if present)—(Green) Located on the right of a 10G port. The LED lights steady
when a connection is made through the shared port, and flashes when the port is
passing traffic.
• PoE (if present)—(Amber) Located on the right of the port. The LED lights steady
when power is being supplied to a device attached to the corresponding port.
Reset Button
The switch can be reset by inserting a pin or paper clip into the Reset button opening on the
front panel of the switch. To use the Reset button to reboot or reset the switch, do the
following:
• To reboot the switch, press and hold the Reset button for less than ten seconds.
• To restore the switch to its factory default settings:
- Disconnect the switch from the network or disable all DHC P servers on your
network.
- With the power on, press and hold the Reset button for more than ten seconds.
Back Panel
The following buttons are found on the back panels:
• Power—Connects the switch to AC power.
• Console—Connects a serial cable to a computer serial port so that it can be configured
by using a terminal emulation program.
30 Cisco 350, 350X and 550X Series Managed Switches, Firmware Release 2.4, ver 0.4
Page 34

General Information
This section covers the following topics:
• Basic or Advanced Display Mode
• Quick Start Device Configuration
• Interface Naming Conventions
• Window Navigation
2
• Search Facility
Basic or Advanced Display Mode
The product supports many features, and therefore the WEB GUI includes hundreds of
configuration and display pages. These pages are divided into the following display modes:
• Basic—Basic subset of configuration options are available. If you are missing some
configuration option, select the Advanced mode in the device header.
• Advanced—Full set of configuration options are available.
Navigate from one mode to another, as shown below:
When the user switches from basic to advanced, the browser reloads the page. However, after
reload, the user stays on the same page.
Cisco 350, 350X and 550X Series Managed Switches, Firmware Release 2.4, ver 0.4 22
Page 35

General Information
Basic or Advanced Display Mode
When the user switches from advanced to basic, the browser reloads the page. If the page
exists also on the basic mode, the user stays on the same page. If the page does not exist in the
basic mode, the browser will load the first page of the folder which was used by the user . If the
folder does not exist, the Getting Started page will be displayed.
If there is advanced configuration, and the page is loaded in basic mode, a page-level message
will be displayed to the user (e.g. there are 2 radius server configured but in basic mode only a
single server can be displayed, or there is 802.1X port authentication with time range
configured but time range is not visible in basic mode).
When switching from one mode to another, any configuration which was made on the page
(without Apply) is deleted.
2
Cisco 350, 350X and 550X Series Managed Switches, Firmware Release 2.4, ver 0.4 23
Page 36

2
Quick Start Device Configuration
For quick initial setup, you can use the configuration wizards described in VLAN
Configuration Wizard or use the links on the Getting Started page, as described below:
Category Link Name (on the Page) Linked Page
General Information
Quick Start Device Configuration
Initial Setup
Device Status System Summary System Summary
Quick Access Change Device Password User Accounts
Manage Stack Administration: Stack
Management
Change Management Application s
and Services
Change Device IP Address IPv4 Interface
Create VLAN VLAN Settings
Configure Port Settings Port Settings
Port Statistics Interface
RMON Statistics Statistics
Vi ew Log RAM Memory
Upgrade Device Software Firmware Operations
Backup Device Configuration File Operations
Create MAC-Based ACL MAC-Based ACLs Creation
TCP/UDP Services
Create IP-Based ACL IPv4-based ACL Creation
Configure QoS QoS Properties
Configure SPAN Switched Port Analyzer (SPAN
and RSPAN)
There are two hot links on the Getting Started page that take you to Cisco web pages for more
information. Clicking on the Support link takes you to the device product support page, and
clicking on the Forums link takes you to the Support Community page.
Cisco 350, 350X and 550X Series Managed Switches, Firmware Release 2.4, ver 0.4 24
Page 37

General Information
Interface Naming Conventions
Interface Naming Conventions
Within the GUI, interfaces are denoted by concatenating the following elements:
• Type of interface: The following types of interfaces are found on the various types of
devices:
- Fast Ethernet (10/100 bits)—These are displayed as FE. Supported only on the
350 family.
- Gigabit Ethernet ports (10/100/1000 bits)—These are displayed as GE.
Supported only on the 350 family
- Ten Gigabit Ethernet ports (1000/10,000 Mbps)—These are displayed as XG.
- Out-of-Band Port—This is displayed as OOB.
2
- LAG (Port Channel)—These are displayed as LAG.
- VLAN—These are displayed as VLAN.
- Tunnel —These are displayed as Tunnel.
• Unit Number—Number of the unit in the stack. The unit number together with the
interface number completely identifies the port. For example, GE1/0/4 is port number
4 on the first unit of the stack.
• Slot Number—The slot number is always 0.
• Interface Number: Port, LAG, Tunnel, or VLAN ID.
Cisco 350, 350X and 550X Series Managed Switches, Firmware Release 2.4, ver 0.4 25
Page 38

2
Window Navigation
This section describes the features of the web-based switch configuration utility.
Application Header
The Application Header appears on every page. It provides the following application links:
General Information
Window Navigation
Application Link
Name
Username Displays the name of the user logged on to the device. The default
Host Name Displays the host name assigned in the System Settings page. If the
Description
A flashing red X icon displayed to the left of the Save application
link indicates that Running Configuration changes have been made
that have not yet been saved to the Startup Configuration file. The
flashing of the red X can be disabled on the Copy/Save
Configuration page.
Click Save to display the Copy/Save Configuration page. Save the
Running Configuration file by copying it to the Startup
Configuration file type on the device. After this save, the red X
icon and the Save application link are no longer displayed. When
the device is rebooted, it copies the Startup Configuration file type
to the Running Configuration and sets the device parameters
according to the data in the Running Configuration.
username is cisco. (The default password is cisco).
host name is longer than 20 character, only the first 20 characters
will be displayed with an ellipsis (...) appended. Hovering over the
truncated hostname displays a tooltip showing the full host name.
Language Menu This menu provides the following options:
• Select a language: Select one of the languages that appear
in the menu. This language will be the web-based
configuration utility language.
• Download Language: Add a new language to the device.
NOTE T o upgrade a language file, use the Upgrade/Backup
Firmware/Language page.
Logout Click to log out of the web-based switch configuration utility.
Cisco 350, 350X and 550X Series Managed Switches, Firmware Release 2.4, ver 0.4 26
Page 39

General Information
Window Navigation
2
Application Link
Name
About Click to display the device name and device version number.
Help Click to display the online help.
Description
The SYSLOG Alert Status icon appears when a SYSLOG message,
above the critical severity level, is logged. Click the icon to open
the RAM Memory page. After you access this page, the SYSLOG
Alert Status icon is no longer displayed. To display the page when
there is not an active SYSLOG message, Click Status and
Statistics > View Log > RAM Memory.
Management Buttons
The following table describes the commonly-used buttons that appear on various pages in the
system.
Button Name Description
Use the pull-down menu to configure the number of entries per
page.
Indicates a mandatory field.
Add Click to display the related Add page and add an entry to a table.
Enter the information and click Apply to save it to the Running
Configuration. Click Close to return to the main page. Click Save
to display the Copy/Save Configuration page and save the Running
Configuration to the Startup Configuration file type on the device.
Apply Click to apply changes to the Running Configuration on the device.
If the device is rebooted, the Running Configuration is lost, unless
it is saved to the Startup Configuration file type or another file
type. Click Save to display the Copy/Save Configuration page and
save the Running Configuration to the Startup Configuration file
type on the device.
Cancel Click to reset changes made on the page.
Clear Clear information on page.
Clear Filter Click to clear filter to select information displayed.
Cisco 350, 350X and 550X Series Managed Switches, Firmware Release 2.4, ver 0.4 27
Page 40

2
General Information
Window Navigation
Button Name Description
Clear All Interfaces
Counters
Clear Interface
Counters
Clear Logs Clears log files.
Clear Table Clears table entries.
Close Returns to main page. If any changes were not applied to the
Copy Settings A table typically contains one or more entries containing
Click to clear the statistic counters for all interfaces.
Click to clear the statistic counters for the selected interface.
Running Configuration, a message appears.
configuration settings. Instead of modifying each entry
individually, it is possible to modify one entry and then copy the
selected entry to multiple entries, as described below:
1. Select the entry to be copied. Click Copy Settings to display the
popup.
2. Enter the destination entry numbers in the to field.
3. Click Apply to save the changes and click Close to return to the
main page.
Delete After selecting an entry in the table, click Delete to remove.
Details Click to display the details associated with the entry selected.
Edit Select the entry and click Edit. The Edit page appears, and the
entry can be modified.
1. Click Apply to save the changes to the Running Configuration.
2. Click Close to return to the main page.
Go Enter the query filtering criteria and click Go. The results are
displayed on the page.
Refresh Click Refresh to refresh the counter values.
Test Click Test to perform the related tests.
Restore Defaults Click Restore Defaults to restore factory defaults.
Cancel Defaults Click Cancel Defaults to restore factory defaults.
Cisco 350, 350X and 550X Series Managed Switches, Firmware Release 2.4, ver 0.4 28
Page 41

General Information
Search Facility
Search Facility
2
The search function helps the user to locate relevant GUI pages.
The search result for a keyword includes links to the relevant pages, and also links to the
relevant help pages.
To access the search function, enter a key word and click on the magnifying glass icon. The
following is an example of the results when searching for the keyword: CDP:
If you are in Basic mode, links to pages in Advanced mode are displayed but not available.
Cisco 350, 350X and 550X Series Managed Switches, Firmware Release 2.4, ver 0.4 29
Page 42

Dashboard
3
The dashboard is a collection of 8 squares, initially empty, that can be populated by various
types of information
You can select a number of modules from the available modules and place them in this grid.
You can also customize settings of the currently-displayed modules.
When the dashboard loads, the modules you selected for the dashboard are loaded in their
locations in the grid. The data in the modules is updated periodically , in intervals depending on
the module type. These intervals are configurable for some modules.
This following topics are covered in this chapter:
• Grid Management
Grid Management
• System Health
• Resource Utilization
• Identification
• Port Utilization
• PoE Utilization
• Latest Logs
• Suspended Interfaces
• Stack T opology
• Traffic Errors
The dashboard consists of multiple modules, but only a subset of the modules can be viewed at
the same time.
Cisco 350, 350X and 550X Series Managed Switches, Firmware Release 2.4, ver 0.4 30
Page 43

Dashboard
Grid Management
3
When you open the dashboard, a wire frame view of the grid is displayed, as shown below
(only 2 squares are shown in the following screen capture):
To display modules that are not currently being displayed, click on Customize on the upperright of the dashboard, as shown below:
Add modules to the grid by selecting a module from the list of modules on the right and
dragging and dropping it to any space in the grid.
The modules are divided into the following groups:
• Small Modules are modules that take up a single square
• Large Modules take up two squares.
If you drag a module into a space currently occupied, the new module replaces the previous
one.
You can re-arrange the placement of the modules in the grid by dragging a module from one
occupied grid position to another position. The module can be dropped in an unoccupied spot,
or in a spot occupied by a module of the same size. If the selected spot is occupied, the
modules switch places.
Cisco 350, 350X and 550X Series Managed Switches, Firmware Release 2.4, ver 0.4 31
Page 44

3
Dashboard
System Health
Only when you click Done (in the right-hand corner), are the modules populated by the
relevant information, as shown below:
The title bar of each module in the dashboard displays the title of the module and three
buttons:
These button perform the following:
System Health
• Pencil — Opens configuration options (depending on the module).
• Refresh — Refreshes the information.
• X — Removes the module from the dashboard.
This module displays information about device temperature (when such information is
available) for a standalone device or for each device in the stack, as shown below:
The following icons are shown:
• Fan Status—Yellow if one fan failed and is backed up by the redundant fan; Green if
the fan is operational; Red if the fan is faulty.
32 Cisco 350, 350X and 550X Series Managed Switches, Firmware Release 2.4, ver 0.4
Page 45

Dashboard
Resource Utilization
The following configuration options (pencil icon in upper right-hand corner) are available:
Resource Utilization
3
• Thermometer Status
- Temperature is OK—Green with a nearly empty thermometer.
- Temperature generates a warning—Yellow with a half full thermometer.
- Temperature is critical—Red with a full thermometer.
• Refresh Time—Select one of the options displayed.
• System Health—Click to open the He alth and Power page.
This module displays the utilization status in terms of a percentage of the various system
resources as a bar chart, as shown below:
The resources monitored are:
• Multicast Groups—Percentage of Multicast groups that exist out of the maximum
possible number that are permitted to be defined.
• MAC Address T able—Percentage of MAC Address table in use.
• TCAM—Percentage of TCAM used by QoS and ACL entries.
• CPU—Percentage of CPU being used.
Each bar becomes red if the resource utilization is higher than 80 percent.
Hovering over a bar displays a tooltip displaying the numeric utilization information (used
resources/max available).
Cisco 350, 350X and 550X Series Managed Switches, Firmware Release 2.4, ver 0.4 33
Page 46

3
Identification
Dashboard
Identification
The following configuration options (right-hand corner) are available:
• Refresh Time—Select one of the options displayed.
• Multicast Groups—Click to open MAC Group Address
• MAC Address T able—Click to open Dynamic Addresses.
• TCAM Utilization Information—Click to open Hardware Resource Utilization.
• CPU Utilization Information—Click to open CPU Utilization.
This module displays basic information regarding the device and stack, as shown below:
It displays the following fields:
• System Description—Displays description of the device.
• Host Name—Entered in the System Settings page or default is used. Also can be
added in the Getting Started Wizard.
• Firmware Version—Current firmware version running on device.
• MAC Address (master unit)—MAC address of the unit.
• Serial Number (master unit)—Serial number of the unit.
• System Location—Enter the physical location of the device.
• System Contact—Enter the name of a contact person.
• T otal Available Power—Amount of power available to the device.
34 Cisco 350, 350X and 550X Series Managed Switches, Firmware Release 2.4, ver 0.4
Page 47

Dashboard
Port Utilization
Port Utilization
3
• Current Power Consumption—Amount of power consumed by the device.
The following configuration options (right-hand corner) are available:
• Refresh Time—Select one of the options displayed.
• System Settings—Click to open System Settings.
• System Summary—Click to open System Summary.
This modules displays the ports on the device in either device or chart view. The view is
selected in the configuration options (pencil icon in upper-right corner).
• Display Mode—Device View
Displays the device. Hovering over a port displays information about it.
• Display Mode—Chart View
A list of ports is displayed. The port utilization is displayed in bar format:
For each port, the following port utilization information is displayed:
Tx—% (red)
Rx—% (blue)
Cisco 350, 350X and 550X Series Managed Switches, Firmware Release 2.4, ver 0.4 35
Page 48

3
PoE Utilization
Dashboard
PoE Utilization
• Refresh Time—Select one of the displayed options.
• Interface Statistics—Link to the Status and Statistics -> Interface page.
This module displays a graphic representation of the PoE utilization status., as shown below:
For a standalone unit, this module displays a gauge with a dial of values from 0-100. The
section of the dial from the traps threshold to 100 is red. In the middle of the gauge, the actual
PoE utilization value is shown in watts.
Each bar represents the PoE utilization percentage value of the device on a scale of 0 to 100. If
the PoE utilization is higher than the traps threshold, the bar is red. Otherwise the bar is green.
When hovering on a bar, a tooltip appears showing the actual PoE utilization of the unit in
watts.
Additional views can be selected in the configuration options (pencil icon in upper-right
corner).
• Refresh Time—Select one of the displayed options.
• PoE Global Properties—Link to the Port Management -> PoE -> Properties page.
• PoE Port Settings—Link to the Port Management -> PoE -> Settings page.
36 Cisco 350, 350X and 550X Series Managed Switches, Firmware Release 2.4, ver 0.4
Page 49

Dashboard
Latest Logs
Latest Logs
3
This module contains information about the five latest events logged by the system as
SYSLOGs, as shown below:
The following configuration options (right-hand corner) are available:
• Severity Threshold—Described in Log Settings.
• Refresh Time—Select one of the options displayed.
• View Logs—Click to open RAM Memory.
NOTE See View Logs for more information.
Suspended Interfaces
This module displays interfaces that have been suspended in either device or table view. The
view is selected in the configuration options (pencil icon in upper-right corner).
• Device View
In this view, the device is displayed. This is shown below:
When units are connected in a stack, a drop-down selector enables the user to select the
device to be viewed. All suspended ports in the device are shown as red.
Cisco 350, 350X and 550X Series Managed Switches, Firmware Release 2.4, ver 0.4 37
Page 50

3
Dashboard
Suspended Interfaces
Hovering over a suspended port displays a tooltip with the following information:
- Port name.
- If the port is a member of a LAG, the LAG identity of the port.
- The suspension reason if it is suspended.
• Table View
In table view , there is no need to select a specific stack unit. Information is displayed in
table form, as shown below:
The following fields are displayed:
- Interface—Port or LAG that was suspended
- Suspension Reason—Reason interface was suspended
- Auto-recovery current status—Has auto recovery been enable for the featu re that
caused the suspension.
The following configuration options (right-hand corner) are available:
• Display Mode—Select either Device View or Tab le View.
• Refresh Time—Select one of the options displayed.
• Error Reco very Settings—Click to open Error Recovery Settings.
38 Cisco 350, 350X and 550X Series Managed Switches, Firmware Release 2.4, ver 0.4
Page 51

Dashboard
Stack Topology
Stack Topology
NOTE Stacking is only supported on the SG350 (except for the Sx350) and SG550 family o f dev ices.
3
This module is a graphic representation of the stack topology and is identical in behavior to the
Stack Topology View section in the Stack Management screen, as shown below:
The following fields are displayed:
• Stack Topology—Either Chain or Ring (see Types of Stack Topology).
• Stack Master—Number of unit functioning as the master unit of the stack.
Hovering over a unit in the module displays a tooltip identifying the unit and providing basic
information on its stacking ports.
Hovering over a stack connection in the module displays a tooltip detailing the connected units
and the stacking ports generating the connection.
The following configuration options (right-hand corner) are available:
• Stack Management—Click to open Stack Management.
Cisco 350, 350X and 550X Series Managed Switches, Firmware Release 2.4, ver 0.4 39
Page 52

3
Traffic Errors
Dashboard
Traffic Errors
This modules displays the number of error packets of various types that are counted on the
RMON statistics. The view is selected in the configuration options (pencil icon in upper-right
corner).
The following can be selected in from the pencil icon:
• Display Mode - Device View
The device module mode displays a diagram of the device, as shown below:
In stacking mode, a drop-down selector enables you to select the device to be viewed.
All suspended ports in the device are shown as red.
Hovering over a suspended port displays a tooltip with the following information:
- Port name.
- If the port is a member of a LAG, the LAG identity of the port.
- Details of the last error logged on the port.
• Display Mode - Table View
- Interface—Name of port
- Last traffic error—Traffic error that occurred on a port and the last time the error
occurred.
• Refresh Time—Select one of the refresh rates.
• Traffic Error Information—Click to link to the Statistics page.
40 Cisco 350, 350X and 550X Series Managed Switches, Firmware Release 2.4, ver 0.4
Page 53

Configuration Wizards
This section describes the following configuration wizards:
It covers the following topics:
• Getting Started Wizard
• VLAN Configuration Wizard
•ACL Wizard
4
Getting Started Wizard
This wizard assists in the initial configuration of the device.
STEP 1 Click Configuration Wizards > Getting Started W izard.
STEP 2 Click Launch Wizard and Next.
STEP 3 Enter the fields:
• System Location—Enter the physical location of the device.
• System Contact—Enter the name of a contact person.
• Host Name—Select the host name of this device. This is used in the prompt of CLI
commands:
- Use Default—The default hostname (System Name) of these switches is:
switch123456, where 123456 represents the last three bytes of the device MAC
address in hex format.
- User Defined—Enter the hostname. Use only letters, digits, and hyphens. Host
names cannot begin or end with a hyphen. No other symbols, punctuation
characters, or blank spaces are permitted (as specified in RFC1033, 1034, 1035).
STEP 4 Click Next.
Cisco 350, 350X and 550X Series Managed Switches, Firmware Release 2.4, ver 0.4 40
Page 54

Configuration Wizards
Getting Started Wizard
STEP 5 Enter the fields:
4
• Interface—Select the IP interface for the system.
• IP Interface Source—Select one of the following options:
- DHCP—Select for the device to receive its IP address from a DHCP server.
- Static—Select to enter the IP address of the device manually.
If you selected Static as the IP interface source, enter the following fields:
• IP Addr ess—IP address of the interface.
• Network Mask—IP mask for this address.
• Administrative Default Gateway—Enter the default gateway IP address.
• DNS Server—Enter the IP address of the DNS server.
STEP 6 Click Next
STEP 7 Enter the fields:
• Username—Enter a new user name between 0 and 20 characters. UTF-8 characters are
not permitted.
• Password—Enter a password (UTF-8 characters are not permitted). If the password
strength and complexity is defined, the user password must comply with the policy
configured in Password Strength.
• Confirm Password—Enter the password again.
• Password Strength—Displays the strength of password. The policy for password
strength and complexity are configured in the Password Strength page.
• Keep current username and password—Select to keep current username and
password.
STEP 8 Click Next
STEP 9 Enter the fields:
• Clock Source—Select one of the following:
- Manual Settings—Select to enter the device system time. If this is selected, enter the
Date and Time.
- Default SNTP Servers—Select to use the default SNTP servers.
Cisco 350, 350X and 550X Series Managed Switches, Firmware Release 2.4, ver 0.4 41
Page 55

4
NOTE The default SNTP servers are defined by name, thus DNS must be configured
and operational (DNS server configured and reachable). This is done in DNS Settings.
- Manual SNTP Server—Select and enter the IP address of an SNTP server.
STEP 10 Click Next to view a summary of configuration that you entered.
STEP 11 Click Apply to save the configuration data.
VLAN Configuration Wizard
This wizard assists in configuring VLANs. Each time you run this wizard, you can configure
ports membership in a single VLAN. The first steps are for Trunk port mode (where you
configure trunk ports tagged and untagged ports), and then you configure Access port mode.
Configuration Wizards
VLAN Configuration Wizard
STEP 1 Click Configuration Wizards > VLAN Configuration Wizard.
STEP 2 Click Launch Wizard and Next.
STEP 3 Select the ports that are to be configured as trunk port (by clicking with mouse on the required
ports in the graphical display). Ports that are already configured as Trunk ports are preselected.
STEP 4 Click Next.
STEP 5 Enter the fields:
• VLAN ID—Select the VLAN you want to configure. You can select either an existing
VLAN or New VLAN.
• New VLAN ID—Enter the VLAN ID of a new VLAN.
• VLAN Name—Optionally, enter VLAN name.
STEP 6 Select the trunk ports that are to be configured as untagged members of the VLAN (by
clicking with mouse on the required ports in the graphical display). The trunk ports that are not
selected in this step becomes tagged members of the VLAN.
STEP 7 Click Next.
STEP 8 Select the ports are that to be the access ports of the VLAN. Access ports of a VLAN is
untagged member of the VLAN. (by clicking with mouse on the required ports in the graphical
display).
42 Cisco 350, 350X and 550X Series Managed Switches, Firmware Release 2.4, ver 0.4
Page 56

Configuration Wizards
ACL W izard
STEP 9 Click Next to see the summary of the information that you entered.
STEP 10 Click Apply.
ACL Wizard
STEP 1 Click Configuration Wizards > ACL W izard.
STEP 2 Click Next.
STEP 3 Enter the fields:
4
To create a new ACL.
• ACL Name—Enter the name of a new ACL.
• ACL Type—Select the type of ACL: IPv4 or MAC.
STEP 4 Click Next.
STEP 5 Enter the fields:
• Action on match—Select one of the options:
- Permit Traffic—Forward packets that meet the ACL criteria.
- Deny Traffic—Drop packets that meet the ACL criteria.
- Shutdown Interface—Drop packets that meet the ACL criteria, and disable the port
from where the packets received. Such ports can be reactivated from the Error
Recovery Settings page.
STEP 6 For a MAC-based ACL, enter the fields:
• Source MAC Address—Select Any if all source address are acceptable or User defined
to enter a source address or range of source addresses.
• Source MAC Value—Enter the MAC address to which the source MAC address is to
be matched and its mask (if relevant).
• Source MAC Wildcard Mask—Enter the mask to define a range of MAC addresses.
• Destination MAC Address—Select Any if all destination addresses are acceptable or
User defined to enter a destination address or a range of destination addresses.
• Destination MAC Value—Enter the MAC address to which the destination MAC
address is to be matched and its mask (if relevant).
Cisco 350, 350X and 550X Series Managed Switches, Firmware Release 2.4, ver 0.4 43
Page 57

4
Configuration Wizards
ACL W izard
• Destination MAC Wildcard Mask—Enter the mask to define a range of MAC
addresses. Note that this mask is different than in other uses, such as subnet mask. Here,
setting a bit as 1 indicates don't care and 0 indicates to mask that value.
NOTE Given a mask of 0000 0000 0000 0000 0000 0000 1111 1111 (which means that
you match on the bits where there is 0 and don't match on the bits where there are 1's).
You need to translate the 1's to a decimal integer and you write 0 for each four zeros. In
this example since 1111 1111 = 255, the mask wo uld be written: as 0.0.0.255.
• Time Range Name—If Time Range is selected, select the time range to be used. Time
ranges are defined in the System Time Configuration section. This field is only
displayed if a Time Range was previously created.
STEP 7 For a IPv4-based ACL, enter the fields:
• Protocol—Select one of the following options to create an ACL based on a specific
protocol:
- Any (IP)—Accept all IP protocols packets
- TCP—Accept Transmission Control Protocols packets
- UDP—Accept User Datagram Protocols packets
- ICMP—Accept ICMP Protocols packets
- IGMP—Accept IGMP Protocols packets
• Source Port for TCP/UDP—Select a port from the drop-down list.
• Destination Port for TCP/UDP—Select a port from the drop-down list.
• Source IP Address—Select Any if all source address are acceptable or User defined to
enter a source address or range of source addresses.
• Source IP Value—Enter the IP address to which the source IP address is to be matched
• Source IP Wildcard Mask—Enter the mask to define a range of IP addresses. Note that
this mask is different than in other uses, such as subnet mask. Here, setting a bit as 1
indicates don't care and 0 indicates to mask that value.
• Destination IP Address—Select Any if all source address are acceptable or User
defined to enter a source address or range of source addresses.
• Destination IP Value—Enter the IP address to which the source IP address is to be
matched.
• Destination IP Wildcard Mask—Enter the mask to define a range of IP addresses.
Note that this mask is different than in other uses, such as subnet mask. Here, setting a
bit as 1 indicates don't care and 0 indicates to mask that value.
44 Cisco 350, 350X and 550X Series Managed Switches, Firmware Release 2.4, ver 0.4
Page 58

Configuration Wizards
ACL W izard
STEP 8 Click Next.
STEP 9 Confirm that you want the ACL and ACE to be created.
STEP 10 Click Next and enter the ACL Binding information:
4
• Time Range Name—If Time Range is selected, select the time range to be used. Time
ranges are defined in the System Time Configuration section. This field is only
displayed if a Time Range was previously created.
The details of the ACL rule are displayed. You can click Add another rule to this ACL to
add another rule.
• Binding T ype—Select one of the following options to bind the ACL:
- Physical interfaces only—Bind the ACL to a port. In this case, click a port or ports
on which to bind the ACL.
- VLANs only—Bind the ACL to a VLAN. Enter the list of VLANs in the Enter the
list of VLANs you want to bind the ACL to field.
- No binding—Do not bind the ACL.
Click Apply.
Cisco 350, 350X and 550X Series Managed Switches, Firmware Release 2.4, ver 0.4 45
Page 59

Status and Statistics
This section describes how to view device statistics.
It covers the following topics:
•System Summary
• CPU Utilization
• Interface
5
•Etherlike
• Port Utilization
• GVRP
• 802.1X EAP
•ACL
• Hardware Resource Utilization
• Health and Power
• Switched Port Analyzer (SPAN and RSPAN)
• Diagnostics
•RMON
•sFlow
•View Logs
Cisco 350, 350X and 550X Series Managed Switches, Firmware Release 2.4, ver 0.4 46
Page 60

Status and Statistics
System Summary
System Summary
5
The System Summary page provides a graphic view of the device, and displays device status,
hardware information, firmware version information, general PoE status, and other items.
To view system information, click Status and Statistics > System Summary.
System Information:
• System Description—A description of the system.
• System Location—Physical location of the device. Click Edit to go the System
Settings page to enter this value.
• System Contact—Name of a contact person. Click Edit to go the System Settings
page to enter this value.
• Host Name—Name of the device. Click Edit to go the System Settings page to enter
this value. By default, the device host name is composed of the word switch
concatenated with the three least significant bytes of the device MAC address (the six
furthest right hexadecimal digits).
• System Object ID—Unique vendor identification of the network management
subsystem contained in the entity (used in SNMP).
• System Uptime—Time that has elapsed since the last reboot.
• Current Time—Current system time.
• Base MAC Addr ess—Device MAC address. If there are several units in the stack, the
base MAC address of the master unit is displayed.
• Jumbo Frames—Jumbo frame support status. This support can be enabled or disabled
by using the Port Settings page.
NOTE Jumbo frames support takes effect only after it is enabled, and after the device is
rebooted.
Software Information:
• Firmware Version (Active Image)—Firmware version number of the active image.
NOTE In a stack, the Firmware Version number shown is based on the version of the
master.
• Firmware MD5 Checksum (Active Image)—MD5 checksum of the active image.
Cisco 350, 350X and 550X Series Managed Switches, Firmware Release 2.4, ver 0.4 47
Page 61

5
Status and Statistics
System Summary
• Firmware Version (Non-active)—Firmware version number of the non-active image.
If the system is in a stack, the version of the master unit is displayed.
• Firmware MD5 Checksum (Non-active)—MD5 checksum of the non-active image.
NOTE The following three fields can appear twice - once for each language on the
device.
• Locale—Locale of the first language. (This is always English.)
• Language Version—Language package version of the first or English language.
• Language MD5 Checksum—MD5 checksum of the language file.
TCP/UDP Services Status:
To reset the following fields, click Edit to open the TCP/UDP Services page.
• HTTP Service—Whether HTTP is enabled/disabled.
• HTTPS Service—Whether HTTPS is enabled/disabled.
• SNMP Service—Whether SNMP is enabled/disabled.
• Telnet Service—Whether Telnet is enabled/disabled.
• SSH Service—Whether SSH is enabled/disabled.
PoE Power Information on Master Unit: (on devices supporting PoE)
• PoE Power Information on Master Unit—Click on Detail to link you directly to the
PoE Properties page. This page shows the PoE power information on a per-unit basis.
• Maximum Available PoE Power (W)—Maximum available power that can be
delivered by the switch.
• Total PoE Power Consumption (W)—Total PoE power delivered to connected PoE
devices.
• PoE Power Mode—Port Limit or Class Limit.
The master unit is displayed graphically, as shown below:
Hovering on a port displays its name.
48 Cisco 350, 350X and 550X Series Managed Switches, Firmware Release 2.4, ver 0.4
Page 62

Status and Statistics
CPU Utilization
CPU Utilization
5
The following information is displayed for each unit:
• Unit ID
• Serial Number—Serial number.
• PID VID—Part number and version ID.
The device CPU handles the following types of traffic, in addition to end-user traffic handling
the management interface:
• Management traffic
• Protocol traffic
• Snooping traffic
Excessive traffic burdens the CPU, and might prevent normal device operation. The device
uses the Secure Core Technology (SCT) feature to ensure that the device receives and
processes management and protocol traffic, no matter how much total traffic is received
is enabled by default on the device and cannot be disabled.
There are no interactions with other features.
To display CPU utilization:
STEP 1 Click Status and Statistics > CPU Utilization.
The CPU Input Rate field displays the rate of input frames to the CPU per second.
The window contains a graph displaying CPU utilization on the device. The Y axis is
percentage of usage, and the X axis is the sample number.
STEP 2 Ensure that the CPU Utilization check box is enabled.
STEP 3 Select the Refresh Rate (time period in seconds) that passes before the statistics are refreshed.
A new sample is created for each time period.
The window containing a graph displaying CPU utilization on the device is displayed.
. SCT
Cisco 350, 350X and 550X Series Managed Switches, Firmware Release 2.4, ver 0.4 49
Page 63

5
Interface
Status and Statistics
Interface
The Interface page displays traffic statistics per port. The refresh rate of the information can be
selected.
This page is useful for analyzing the amount of traffic that is both sent and received and its
dispersion (Unicast, Multicast, and Broadcast).
To display Ethernet statistics and/or set the refresh rate:
STEP 1 Click Status and Statistics > Interface.
STEP 2 Enter the parameters.
• Interface—Select the interface for which Ethernet statistics are to be displayed.
• Refresh Rate—Select the time period that passes before the interface Ethernet statistics
are refreshed.
The Receive Statistics area displays information about incoming packets.
• Total Bytes (Octets)—Octets received, including bad packets and FCS octets, but
excluding framing bits.
• Unicast Packets—Good Unicast packets received.
• Multicast Packets—Good Multicast packets received.
• Broadcast Packets—Good Broadcast packets received.
• Packets with Errors—Packets with errors received.
The Transmit Statistics area displays information about outgoing packets.
• Total Bytes (Octets)—Octets transmitted, including bad packets and FCS octets, but
excluding framing bits.
• Unicast Packets—Good Unicast packets transmitted.
• Multicast Packets—Good Multicast packets transmitted.
• Broadcast Packets—Good Broadcast packets transmitted.
STEP 3 To view statistics counters in table view or graphic view:
• Click View All Interfaces Statistics to see all ports in table view.
50 Cisco 350, 350X and 550X Series Managed Switches, Firmware Release 2.4, ver 0.4
Page 64

Status and Statistics
Etherlike
Etherlike
5
• Click View Interface History Graph to display these results in graphic form. In this
view, you can select the T ime Span for which the results will be displayed and the type
of statistic to be displayed. For example, if you select Last 5 Minutes and Unicast
Packets, you will see how many Unicast packets received in the last 5 minutes.
The Etherlike page displays statistics per port according to the Etherlike MIB standard
definition. The refresh rate of the information can be selected. This page provides more
detailed information regarding errors in the physical layer (Layer 1) that might disrupt traffic.
To view Etherlike Statistics and/or set the refresh rate:
STEP 1 Click Status and Statistics > Etherlike.
STEP 2 Enter the parameters.
• Interface—Select the specific interface for which Ethernet statistics are to be
displayed.
• Refresh Rate—Select the amount of time that passes before the Etherlike statistics are
refreshed.
The fields are displayed for the selected interface.
NOTE If one of the following fields shows a number of errors (not 0), a Last Update time is displayed.
• Frame Check Sequence (FCS) Errors—Received frames that failed the CRC (cyclic
redundancy checks).
• Single Collision Frames—Frames that involved in a single collision, but successfully
transmitted.
• Late Collisions—Collisions that have been detected after the first 512 bits of data.
• Excessive Collisions—Transmissions rejected due to excessive collisions.
• Oversize Packets—Packets greater than 2000 octets received.
• Internal MAC Receive Errors—Frames rejected because of receiver errors.
• Pause Frames Received—Received flow control pause frames. This field is only
supported for XG ports. When the port speed is 1G, the received pause frames counter
is not operational.
Cisco 350, 350X and 550X Series Managed Switches, Firmware Release 2.4, ver 0.4 51
Page 65

5
STEP 3 T o view statistics counters in table view, click V iew All Interfaces Statistics to see all ports in
Port Utilization
Status and Statistics
Port Utilization
• Pause Frames T ransmitted—Flow control pause frames transmitted from the selected
interface.
table view.
The Port Utilization page displays utilization of broadband (both incoming and outgoing) per
port.
To display port utilization:
GVRP
STEP 1 Click Status and Statistics > Port Utilization.
STEP 2 Enter the Refresh Rate, which is the time period that passes before the interface Ethernet
statistics are refreshed.
The following fields are displayed for each port:
• Interface—Name of port.
• Tx Utilization—Amount of bandwidth used by outgoing packets.
• Rx Utilization—Amount of bandwidth used by incoming packets.
To view a graph of historical utilization over time on the port, select a port and click View
Interface History Graph. In addition to the above, the following field is displayed:
• Time Span—Select a unit of time. The graph displays the port utilization over this unit
of time.
The GVRP page displays information regarding GARP VLAN Registration Protocol (GVRP)
frames that sent or received from a port. GVRP is a standards-based Layer 2 network protocol,
for automatic configuration of VLAN information on switches. It is defined in the 802.1ak
amendment to 802.1Q-2005.
52 Cisco 350, 350X and 550X Series Managed Switches, Firmware Release 2.4, ver 0.4
Page 66

Status and Statistics
GVRP
STEP 1 Click Status and Statistics > GVRP.
STEP 2 Enter the parameters.
5
GVRP statistics for a port are only displayed if GVRP is enabled globally and on the port. See
the GVRP Settings page.
To view GVRP statistics and/or set the refresh rate:
• Interface—Select the specific interface for which GVRP statistics are to be displayed.
• Refresh Rate—Select the time period that passes before the GVRP page is refreshed.
The Attribute Counter block displays the counters for various types of packets per interface.
These are displayed for Received and Transmitted packets.
• Join Empty—GVRP Join Empty packets received/transmitted.
• Empty—GVRP empty packets received/transmitted.
• Leave Empty—GVRP Leave Empty packets received/transmitted.
• Join In—GVRP Join In packets received/transmitted.
• Leave In—GVRP Leave In packets received/transmitted.
• Leave All—GVRP Leave All packets received/transmitted.
The GVRP Error Statistics section displays the GVRP error counters.
• Invalid Protocol ID—Invalid protocol ID errors.
• Invalid Attribute Type—Invalid attribute ID errors.
• Invalid Attribute V alue—Invalid attribute value errors.
• Invalid Attribute Length—Invalid attribute length errors.
• Invalid Event—Invalid events.
STEP 3 To clear statistics counters, click View All Interfaces Statistics to see all ports on a single
page.
Cisco 350, 350X and 550X Series Managed Switches, Firmware Release 2.4, ver 0.4 53
Page 67

5
802.1X EAP
STEP 1 Click Status and Statistics > 802.1x EAP.
STEP 2 Select the Interface that is polled for statistics.
STEP 3 Select the Refresh Rate (time period) that passes before the EAP statistics are refreshed.
Status and Statistics
802.1X EAP
The 802.1x EAP page displays detailed information regarding the EAP (Extensible
Authentication Protocol) frames that were sent or received. To configure the 802.1X feature,
see the (Security > 802.1x) Properties page.
To view the EAP Statistics and/or set the refresh rate:
The values are displayed for the selected interface.
• EAPOL EAP Frames Received—Valid EAPOL frames received on the port.
• EAPOL Start Frames Received—Valid EAPOL start frames received on the port.
• EAPOL Logoff Frames Received—EAPOL Logoff frames received on the port.
• EAPOL Announcement Frames Received—EAPOL Announcement frames received
on the port.
• EAPOL Announcement Request Frames Received—EAPOL Announcement
Request frames received on the port.
• EAPOL Invalid Frames Received—EAPOL invalid frames received on the port.
• EAPOL EAP Length Error Frames Received—EAPOL frames with an invalid
Packet Body Length received on this port.
• MKPDU Frames with unrecognized CKN Received—EAP frames with
unrecognized CKN received on this port.
• MKPDU Invalid Frames Received—MKPDU invalid frames received on the port.
• Last EAPOL Frame Version—Protocol version number attached to the most recently
received EAPOL frame.
• Last EAPOL Frame Source—Source MAC address attached to the most recently
received EAPOL frame.
• EAPOL EAP Supplicant Frames Transmitted—EAPOL EAP Supplicant frames
transmitted on the port.
• EAPOL Start Frames Transmitted—EAPOL Start frames transmitted on the port.
54 Cisco 350, 350X and 550X Series Managed Switches, Firmware Release 2.4, ver 0.4
Page 68

Status and Statistics
ACL
STEP 4 To clear statistics counters:
5
• EAPOL Logoff Frames Transmitted—EAPOL Logoff frames transmitted on the
port.
• EAPOL Announcement Frames Transmitted—EAPOL Announcemen t frames
transmitted on the port.
• EAPOL Announcement Request Frames Transmitted—EAPOL Announcement
Request frames transmitted on the port.
• EAPOL EAP Authenticator Frames Transmitted—EAP Authenticator frames
transmitted on the port.
• EAPOL MKA Frames with No CKN Transmitted—MKA frames with no CKN
transmitted on the port.
• Click View All Interfaces Statistics to view the counters of all interfaces.
ACL
• Click Clear Interface Counters to clear the counters of all interfaces.
When the ACL logging feature is enabled, an informational SYSLOG message is generated
for packets that match ACL rules.
To view the interfaces on which packets forward or rejected based on ACLs:
STEP 1 Click Status and Statistics > ACL.
STEP 2 Select the Refresh Rate (time period in seconds) that passes before the page is refreshed. A
new group of interfaces is created for each time period.
The following information is displayed:
• Global T rapped Packet Counter—Number of packets trapped globally due to lack of
resources.
• T rapped Packets—Port/LAG Based—The interfaces on which packets forwarded or
rejected based on ACL rules.
• Trapped Packets—VLAN Based—The VLANs on which packets forwarded or
rejected based on ACL rules.
Cisco 350, 350X and 550X Series Managed Switches, Firmware Release 2.4, ver 0.4 55
Page 69

5
STEP 3 T o manage statistics coun ters , cli ck Clear Counters to clear the counters of all interfaces.
Hardware Resource Utilization
This page displays resources used by the system, such as ACLs (Access Control Lists) and
Quality of Service (QoS). The Router TCAM holds the rules for VLAN mapping and policybased routing rules for IPv4 and IPv6.
Some applications allocate rules upon their initiation. Additionally , processes that initialize
during system boot use some of their rules during the startup process.
To view hardware resource utilization, click Status and Statistics > Hardware Resource
Utilization.
Status and Statistics
Hardware Resource Utilization
The following fields are displayed:
• Unit No—Unit in stack for which TCAM utilization appears. This is not displayed
when the device is in not part of a stack.
• IPv4 Policy Based Routing
- In Use—Number of router TCAM entries used for IPv4 Policy-based routing.
- Maximum—Maximum number of available router TCAM entries that can be used
for IPv4 Policy-based routing.
• IPv6 Policy Based Routing
- In Use—Number of router TCAM entries used for IPv6 Policy-based routing.
- Maximum—Maximum number of available router TCAM entries that can be used
for IPv6 Policy-based routing.
• VLAN Mapping
- In Use—Number of router TCAM entries currently used for VLAN mapping.
- Maximum—Maximum number of available router TCAM entries that can be used
for VLAN mapping.
• IP Entries
- In Use—Number of TCAM entries used for IP rules.
- Maximum—Number of available TCAM entries that can be used for IP rules.
56 Cisco 350, 350X and 550X Series Managed Switches, Firmware Release 2.4, ver 0.4
Page 70

Status and Statistics
Health and Power
Health and Power
5
• ACL and QoS Rules
- In Use—Number of TCAM entries used for ACL and QoS rules.
- Maximum—Number of available TCAM entries that can be used for ACL and QoS
rules.
To view how the allocation among various processes can be changed, see the Hardware
Resources section.
The Health and Power page monitors the temperature status, power supply st atus and fan
status on all relevant devices. Depending on the model, there are one or more fans on a device.
Some models have no fans at all.
Redundant Power
This feature is only supported on the SG550 series.
The RPS 2300 is a backup for AC power. It is used for su pplying power to the device if th e AC
power supply stops working. It is only supported on the 550 family.
If it becomes necessary to switch to the backup power, the device changes between the power
sources without reboot and without any disruption to the device operation. The device polls
the RPS status every 1 sec, if RPS is providing power, the RPS LED is set, and if the RPS is
active, a SYSLOG is generated.
When main power supply is again operational, the devices notifies the RPS to stop providing
power. A SYSLOG is generated.
The RPS LED (on the device front panel) displays the current RPS status:
• Off – RPS is not connected
• Green (solid) – RPS is ready
• Amber (blinking) – RPS is currently supplying power to the device
• Amber (solid) – RPS is connected but providing power to two other devices. In this
case, the RPS will not be able to provide power to the current device, while providing
power to the two other devices.
Cisco 350, 350X and 550X Series Managed Switches, Firmware Release 2.4, ver 0.4 57
Page 71

5
Status and Statistics
Health and Power
Fans
In some devices the fans are mandatory for the device operation since without them the device
becomes too hot and automatically shut-down. Since a fan is a moving part, it is subject to
failures. A redundant fan is installed on the system. This fan is not operational unless one or
more of the system fans fails. In this case, the redundant fan becomes part of the environment
monitoring of the device.
It is recommended to let the redundant fan work for at least 1 minute once a day.
58 Cisco 350, 350X and 550X Series Managed Switches, Firmware Release 2.4, ver 0.4
Page 72

Status and Statistics
Health and Power
5
Some devices have a temperature sensor to protect its hardware from overheating. In this case,
the following actions are performed by the device if it overheats and during the cool down
period after overheating:
Event Action
At least one temperature
sensor exceeds the Warning
threshold
At least one temperature
sensor exceeds the Critical
threshold
The following are generated:
• SYSLOG message
• SNMP trap
The following are generated:
• SYSLOG message
• SNMP trap
The following actions are performed:
• System LED is set to solid amber (if hardware
supports this).
• Disable Ports — When the Critical temperature
has been exceeded for two minutes, all ports will
be shut down.
• (On devices that support PoE) Disable the PoE
circuitry so that less power is consumed and less
heat is emitted.
Cool down period after the
Critical threshold was
exceeded (all sensors are
lower than the Warning
threshold - 2 °C).
After all the sensors cool down to Warning Threshold
minus 2 degree C, the PHY will be re-enabled, and all
ports brought back up.
If fan status is OK, the ports are enabled.
(On devices that support PoE) the PoE circuitry is
enabled.
Health and Power Fields
To view the device health parameters, click Status and Statistics > Health and Power.
NOTE Only fields that are relevant to the device are displayed.
This section displays the power saved by the device due to the Green Ethernet and Led Disable
features, as well as due to ports being down (physically or due to time range settings).
Cisco 350, 350X and 550X Series Managed Switches, Firmware Release 2.4, ver 0.4 59
Page 73

5
Status and Statistics
Health and Power
The PoE savings displays the total power saved by using the PoE time range feature that shuts
down PoE to ports at specific times (usually when the PoE network element is not in use).
The following information is displayed (the order of the fields may be different depending on
the device):
Power Savings
• Current Green Ethernet and Port Power Savings—Current amount of the power
savings on all the ports.
• Cumulative Green Ethernet and Port Power Savings—Accumulative amount of the
power savings on all the ports since the device was powered up.
• Projected Annual Green Ethernet and Port Power Savings—Projection of the
amount of the power that will be saved on the device during one week. This value is
calculated based on the savings that occurred during the previous week.
• Current PoE Power Savings—Current amount of the PoE power saved on ports that
have PDs connected to them and on which PoE is not operational due to the Time
Range feature.
• Cumulative PoE Power Savings—Cumulative amount of the PoE power, since the
device was powered up, saved on ports which have PDs connected to them and to
which PoE is not operational due to the Time Range feature.
• Projected Annual PoE Power Savings—Yearly projected amount of PoE power,
since device was powered up, saved on ports that have PDs connected to them and to
which PoE is not operational due to the Time Range feature. The projection is based on
the savings during the previous week.
(For non-XG families of devices) T o schedule power operations for a specific time range, click
the blue links in the following sentence on the page: “Power Savings can be increased by using
a Time Range to schedule data and PoE operations.” The following fields are displayed:
• Time Range—The Administration > Time Settings > Time Range page is
displayed. Set the time range for the power operations.
• Data—The Port Management > Port Settings page is displayed. Connect the time
range to one or more ports.
• PoE—The Port Management > PoE > Settings page is displayed. Connect the time
range to the PoE operations on one or more ports.
60 Cisco 350, 350X and 550X Series Managed Switches, Firmware Release 2.4, ver 0.4
Page 74

Status and Statistics
Health and Power
5
If the device is part of a stack, the Health and Power page displays the following fields:
Health Table
• Unit No.—Displays the unit number in the stack.
• Fan Status—The following values are possible:
- OK—Fan is operating normally.
- Failure—More than one fan is not operating correctly.
- N/A—Fan is not applicable for the specific model.
• Redundant Fan Status—The following values are possible:
- Ready—Redundant fan is operational but not required.
- Active—One of the main fans is not working and this fan is replacing it.
• Temperature—The options are:
- OK—The temperature is below the warning threshold.
- Warning—The temperature is between the warning threshold to the critical
threshold.
- Critical—Temperature is above the critical threshold.
- N/A—Not relevant.
Main Power Status (these fields are found on device that are PD devices and in
devices that support RPS)
- Main Power Supply Status—Displays one of the following for the main power
supply:
Active—Power supply is being used.
Failure—Main power has failed.
- Main Power Supply Budget—Amount of power that can be can be allocated for
device PSE operation by the main power supply.
Cisco 350, 350X and 550X Series Managed Switches, Firmware Release 2.4, ver 0.4 61
Page 75

5
Status and Statistics
Health and Power
- Redundant Power Supply Status—Displays one of the following for the backup
power supply:
Active—Power supply is being used.
Available—Redundant power source is connected, but not used.
Not Available—Redundant p ower so urce is co nn ected, bu t is already pro vid ing
power to other devices.
Not Connected—Redundant power source is not connected.
- Redundant Power Supply Budget—Amount of power that can be can be
allocated for device PSE operation by the backup power supply.
Power Supply Over Ethernet Status (there can be up to 2 PDs)
- PD Port 1 ID—Port number of PD port1
- PD Port 1 Negotiation Mode—Negotiation mode (see definition below)
- PD Port 1 Status—Connected or not connected
- PD Port 1 Type—Type of PD
- PD Port 1 Budget—Maximum amount of power that can be can be allocated for
device PSE operation
- PD Port 2 ID—Port number of PD port1
- PD Port 2 Negotiation Mode—Negotiation mode (see definition below)
- PD Port 2 Status—Connected or not connected
- PD Port 2 Type—Type of PD
- PD Port 2 Budget—Maximum amount of power that can be can be allocated for
device PSE operation
If the device is not part of a stack, the Health and Power page displays the following
fields:
• Fan Status—The following values are possible:
- OK—Fan is operating normally.
- Failure—Fan is not operating correctly.
- N/A—Fan ID is not applicable for the specific model.
62 Cisco 350, 350X and 550X Series Managed Switches, Firmware Release 2.4, ver 0.4
Page 76

Status and Statistics
Health and Power
5
• Redundant Fan Status—The following values are possible:
- Ready—Redundant fan is operational but not required.
- Active—One of the main fans is not working and this fan is replacing it.
- Failure—Regular fans failed and redundant fan is not operating correctly.
• Temperature—The options are:
- OK—The temperature is below the warning threshold.
- Warning—The temperature is between the warning threshold to the critical
threshold.
- Critical—Temperature is above the critical threshold.
- N/A—Not relevant.
Power Supply Status (these fields are found on device that are PD devices and in devices that
support RPS)
• Power Supply Status—The options are:
- Main—Displays one of the following:
Active—Power supply is being used.
Failure—Main power has failed.
- Redundant—Provides the status of the redundant power supply. Displays one of
the following:
Active—Redundant Power Supply (RPS) supply is being used.
Available—RPS is connected but is not being used.
Not Available—RPS is connected but is already providing power to other
devices.
Not Connected—The RPS is not connected.
Present—The RPS is connected.
Ethernet Power Supply Table (displayed only if one of the units in the stack supports PD
ports). The following fields are displayed:
• Port Name—Number of port.
• PD Status—Displays one of the following values:
- Connected—The PD port is connected to a PSE device that is providing power.
Cisco 350, 350X and 550X Series Managed Switches, Firmware Release 2.4, ver 0.4 63
Page 77

5
- Not Connected—The PD port is not connected to a PSE device.
• Negotiation Mode—One of the following values.
- Auto—CDP or LLDP negotiation is used to determine power level.
- Force 802.3AF—Both sides use the AF power standard.
- Force 802.3AT—Both sides use the AT power standard.
- Force 60W—Both sides use the 60W power.
• Power Budget—Amount of power actually allocated to the port.
Switched Port Analyzer (SPAN and RSPAN)
Status and Statistics
Switched Port Analyzer (SPAN and RSPAN)
The SPAN feature, which is sometimes called port mirroring or port monitoring, selects
network traffic for analysis by a network analyzer. The network analyzer can be a Cisco
SwitchProbe device or other Remote Monitoring (RMON) probes.
Port mirroring is used on a network device to send a copy of network packets, seen on a single
device port, multiple device ports, or an entire VLAN, to a network monitoring connection on
another port on the device. This is commonly used when monitoring of network traffic, such
as for an intrusion-detection system, is required. A network analyzer, connected to the
monitoring port, processes the data packets.
The device can mirror up to eight interfaces per session.
A packet, which is received on a network port and assigned to a VLAN that is subject to
mirroring, is mirrored to the analyzer port even if the packet was eventually trapped or
discarded. Packets sent by the device are mirrored when Transmit (Tx) mirroring is activated.
Mirroring does not guarantee that all traffic from the source port(s) is received on the analyzer
(destination) port. If more data is sent to the analyzer port than it can support, some data might
be lost.
VLAN mirroring cannot be active on a VLAN that was not manually created. For example, if
VLAN 23 was created by GVRP, port mirroring will not work on it.
64 Cisco 350, 350X and 550X Series Managed Switches, Firmware Release 2.4, ver 0.4
Page 78

Status and Statistics
Start Switch
Intermediate
Switch(es)
231 4 Final Switch 87
Define RSPAN VLAN
(ex. 10)
Define RSPAN VLAN
10 with port 2 and 3 as
members
Define RSPAN VLAN
10, with port 7 as
member but not port 8
Source
Port
Reflector
Port
Source
Port
Analyzer
Port
Switched Port Analyzer (SPAN and RSPAN)
Remote SPAN
RSPAN extends SPAN by enabling monitoring of multiple switches across your network and
allowing the analyzer port to be defined on a remote switch. In addition to the start (source)
and final (destination) switches, you can define intermediate switches over which the traffic
flows, as shown in Figure 1.
Figure 1 RSPAN Switch Deployment:
5
The traffic for each RSPAN session is carried over a user-specified RSPAN VLAN that is
dedicated for that RSPAN session in all participating switches. The traffic from the source
interfaces on the start device is copied to the RSPAN VLAN through a reflector port and then
forwarded over trunk ports on the intermediate devices to the destination session on the final
switch, which is monitoring the RSPAN VLAN.
The reflector port is the mechanism that copies packets to an RSPAN VLAN. It is a network
port that handles various types of traffic.
The RSPAN VLAN must be configured on all the intermediate switches.
NOTE RSPAN does not always successfully copy all the packets when they are arrive from multiple
sources simultaneously. If accurate monitoring is required, the TCAM-based mirror policy can
be used.
RSPAN Workflow
The following workflow describes how to configure the start, intermediate and final switches:
• Start Switch
• Intermediate Switch(es)
• Final Switch
Cisco 350, 350X and 550X Series Managed Switches, Firmware Release 2.4, ver 0.4 65
Page 79

5
Status and Statistics
Switched Port Analyzer (SPAN and RSPAN)
Start Switch
1. Define the RSPAN VLAN. This RSPAN VLAN must be the same in all switches.
2. Define one or more source interfaces, which can be ports or a VLAN, and ensure that it is
not a member of the RSPAN VLAN.
3. Define a reflector port (destination, egress port) and ensure that it is not a member of the
RSPAN VLAN.
4. Define the Destination Type as Remote VLAN.
5. Set Network Traffic to Enable.
Intermediate Switch(es)
1. Define the RSPAN VLAN. This RSPAN VLAN must be the same in the start, intermediate
and final switches.
2. Ensure that there are at least two ports that are members of the RSPAN VLAN. Traffic will
pass through the switch via the RSPAN VLAN.
Final Switch
1. Define the RSPAN VLAN. This RSPAN VLAN must be the same in the start, intermediate
and final switches.
2. Ensure that the source port, which is connected to the intermediate switch, is a member of
the RSPAN VLAN.
3. Define the Source Interface as Remote VLAN.
4. Define a destination port and make sure it is not in the RSPAN VLAN.
5. Define the Destination Type as Local Interface.
RSPAN VLAN
An RSPAN VLAN must be defined on the start, intermediate and final devices.
To configure a VLAN as an RSPAN VLAN:
STEP 1 Click Status and Statistics > SPAN & RSPAN > RSPAN VLAN.
The previously-defined RSPAN VLAN is displayed.
STEP 2 To configure a VLAN as an RSPAN VLAN, select it from the RSPAN VLAN drop-down list
of VLANs.
66 Cisco 350, 350X and 550X Series Managed Switches, Firmware Release 2.4, ver 0.4
Page 80

Status and Statistics
Switched Port Analyzer (SPAN and RSPAN)
STEP 3 Click Apply.
SPAN Session Destinations
A destinatio n port must be configured on the star t and final devices. On the start device, this is
the reflector port. On the final device, it is the analyzer port.
To add a destination port:
STEP 1 Click Status and Statistics > SPAN & RSPAN > Session Destinations.
The previously-defined destinations are displayed.
STEP 2 Click Add.
STEP 3 Enter the following fields:
5
• Session ID—Select a session ID. This must match the session IDs of the source ports.
• Destination T ype—Select one of the following options:
- Local Interface—Is the destination port on the same device as the source ports
(relevant to SPAN).
- Remote VLAN—Is the destination port on a different device than the source port
(relevant to RSPAN).
If the Destination T ype is Remote VLAN, configure the following field:
- Reflector Port—Select a unit/port that functions as a target port on the first device.
If the Destination Type is Local Interface, configure the following field:
- Port—Select a unit/port that functions as the analyzer port on the device.
• Network T raffic—Select to enable that traffic other than monitored traffic is possible
on the port.
STEP 4 Click Apply.
SPAN Session Sources
One or more SPAN or RSPAN sources must be configured on the start and final devices.
Cisco 350, 350X and 550X Series Managed Switches, Firmware Release 2.4, ver 0.4 67
Page 81

5
Status and Statistics
Diagnostics
To configure the source ports to be mirrored:
STEP 1 Click Status and Statistics > SPAN & RSPAN > Session Sources.
STEP 2 Click Add.
STEP 3 Select the session number from Session ID. This must be the same for all source ports and the
destination port.
STEP 4 For SPAN or for RSPAN on the start switch, select the unit and port or VLAN from which
traffic is monitored (Source Interface). On the final switch, for RSPAN, select Remote
VLAN.
STEP 5 In the Monitor Type field, select whether incoming, outgoing, or both types of traffic are
mirrored.
• Rx and Tx—Port mirroring on both incoming and outgoing packets.
Diagnostics
• Rx—Port mirroring on incoming packets.
• Tx—Port mirroring on outgoing packets.
STEP 6 Click Apply. The source interface for the mirroring is configured.
This section contains information for configuring port mirroring, running cable tests, and
viewing device operational information.
It covers the following topics:
• Copper Ports Tests
• Optical Module Status
• Tech-Support Information
Copper Ports Tests
The Copper Test page displays the results of integrated cable tests performed on copper cables
by the Virtual Cable Tester (VCT).
68 Cisco 350, 350X and 550X Series Managed Switches, Firmware Release 2.4, ver 0.4
Page 82

Status and Statistics
Diagnostics
5
VCT performs two types of tests:
• Time Domain Reflectometry (TDR) technology tests the quality and characteristics of
a copper cable attached to a port. Cables of up to 140 meters long can be tested. These
results are displayed in the Test Results block of the Copper Test page.
• DSP-based tests are performed on active XG links to measure cable length. These
results are displayed in the Advanced Information block of the Copper Test page. This
test can run only when the link speed is 10G.
Preconditions to Running the Copper Port Test
Before running the test, do the following:
• (Mandatory) Disable Short Reach mode (see the Properties page)
• (Optional) Disable EEE (see the Properties page)
Use a CAT6a data cable when testing cables using (VCT).
The test results have an accuracy within an error range of +/- 10 for advanced Testing and +/-
2 for basic testing.
CAUTION When a port is tested, it is set to the Down state and communications are interrupted. After the
test, the port returns to the Up state. It is not recommended that you run the copper port test on
a port you are using to run the web-based switch configuration utility, because communications
with that device are disrupted.
To test copper cables attached to ports:
STEP 1 Click Status and Statistics > Diagnostics > Copper Test.
STEP 2 Select the unit and port on which to run the test.
STEP 3 Click Copper Test.
STEP 4 When the message appears, click OK to confirm that the link can go down or Cancel to abort
the test.
The following fields are displayed in the Test Results block:
• Last Update—Time of the last test conducted on the port.
• Test Results—Cable test results. Possible values are:
- OK—Cable passed the test.
- No Cable—Cable is not connected to the port.
Cisco 350, 350X and 550X Series Managed Switches, Firmware Release 2.4, ver 0.4 69
Page 83

5
Status and Statistics
Diagnostics
- Open Cable—Cable is connected on only one side.
- Short Cable—Short circuit has occurred in the cable.
- Unknown Test Result—Error has occurred.
• Distance to Fault—Distance from the port to the location on the cable where the fault
was discovered.
• Operational Port Status—Displays whether port is up or down.
The Advanced Information block contains the following information, which is refreshed
each time you enter the page:
• Cable Length—Provides an estimate for the length.
• Pair—Cable wire pair being tested.
• Status—Wire pair status. Red indicates fault and Green indicates status OK.
• Channel—Cable channel indicating whether the wires are straight or cross-over.
• Polarity—Indicates if automatic polarity detection and correction has been activated
for the wire pair.
• Pair Skew—Difference in delay between wire pairs.
Optical Module Status
The Optical Module Status page displays the operating conditions reported by the SFP (Small
Form-factor Pluggable) transceiver.
The following GE SFP (1000Mbps) transceivers are supported:
• MGBBX1: 1000BASE-BX-20U SFP transceiver, for single-mode fiber, 1310 nm
wavelength, supports up to 40 km.
• MGBLH1: 1000BASE-LH SFP transceiver, for single-mode fiber, 1310 nm
wavelength, supports up to 40 km.
• MGBLX1: 1000BASE-LX SFP transceiver, for single-mode fiber, 1310 nm
wavelength, supports up to 10 km.
• MGBSX1:1000BASE-SX SFP transceiver, for multimode fiber , 850 nm wavelength,
supports up to 550 m.
70 Cisco 350, 350X and 550X Series Managed Switches, Firmware Release 2.4, ver 0.4
Page 84

Status and Statistics
Diagnostics
5
• MGBT1: 1000BASE-T SFP transceiver for category 5 copper wire, supports up to
100 m.
The following XG SFP+ (10,000Mbps) transceivers are supported:
• Cisco SFP-10GSR
• Cisco SFP-10GLRM
• Cisco SFP-10GLR
The following XG passive cables (Twinax/DAC) are supported:
• Cisco SFP-H10GCU1m
• Cisco SFP-H10GCU3m
• Cisco SFP-H10GCU5m
To view the results of optical tests, click Status and Statistics > Diagnostics > Optical
Module Status.
This page displays the following fields:
• Port—Port number on which the SFP is connected.
• Description—Description of optical transceiver.
• Serial Number—Serial number of optical transceiver.
• PID—VLAN ID.
• VID—ID of optical transceiver.
• Temperature—Temperature (Celsius) at which the SFP is operating.
• Voltage—SFPs operating voltage.
• Current—SFPs current consumption.
• Output Power—Transmitted optical power.
• Input Power—Received optical power.
• Transmitter Fault—Remote SFP reports signal loss. Values are True, False, and No
Signal (N/S).
• Loss of Signal—Local SFP reports signal loss. Values are True and False.
• Data Ready—SFP is operational. Values are True and False.
Cisco 350, 350X and 550X Series Managed Switches, Firmware Release 2.4, ver 0.4 71
Page 85

5
Status and Statistics
RMON
Tech-Support Information
This page provides a detailed log of the device status. This is valuable when the technical
support are trying to help a user with a problem, since it gives the output of many show
commands (including debug command) in a single command.
To view technical support information useful for debugging purposes:
STEP 1 Click Status and Statistics > Diagnostics > Tech-Support Information.
STEP 2 Click Generate.
Information from a variety of show CLI commands is displayed.
NOTE Generation of output from this command may take some time. When the information is
generated, you can copy it from the text box in the screen by clicking on Select tech-support
data.
RMON
RMON (Remote Networking Monitoring) enables an SNMP agent in the device to proactively
monitor traffic statistics over a given period and send traps to an SNMP manager. The local
SNMP agent compares actual, real-time counters against predefined thresholds and generates
alarms, without the need for polling by a central SNMP management platform. This is an
effective mechanism for proactive management, provided that you have set the correct
thresholds relative to your network’s base line.
RMON decreases the traffic between the manager and the device since the SNMP manager
does not have to poll the device frequently for information, and enables the manager to get
timely status reports, since the device reports events as they occur.
With this feature, you can perform the following actions:
• V iew the current statistics (from the time that the counter values cleared). You can also
collect the values of these counters over a period of time, and then view the table of
collected data, where each collected set is a single line of the History tab.
• Define interesting changes in counter values, such as “reached a certain number of late
collisions” (defines the alarm), and then specify what action to perform when this
event occurs (log, trap, or log and trap).
72 Cisco 350, 350X and 550X Series Managed Switches, Firmware Release 2.4, ver 0.4
Page 86

Status and Statistics
RMON
5
Statistics
The Statistics page displays detailed information regarding packet sizes and information
regarding physical layer errors. The information is displayed according to the RMON
standard. An oversized packet is defined as an Ethernet frame with the following criteria:
• Packet length is greater than MRU byte size.
• Collision event has not been detected.
• Late collision event has not been detected.
• Received (Rx) error event has not been detected.
• Packet has a valid CRC.
To view RMON statistics and/or set the refresh rate:
STEP 1 Click Status and Statistics > RMON > Statistics.
STEP 2 Select the Interface for which Ethernet statistics are to be displayed.
STEP 3 Select the Refresh Rate, which is the time period that passes before the interface statistics are
refreshed.
The following statistics are displayed for the selected interface.
NOTE If one of the following fields shows a number of errors (not 0), a Last Update time is displayed.
• Bytes Received—Octets received, including bad packets and FCS octets, but excluding
framing bits.
• Drop Events—Packets dropped.
• Packets Received—Good packets received, including Multicast and Broadcast
packets.
• Broadcast Packets Received—Good Broadcast packets received. This number does
not include Multicast packets.
• Multicast Packets Received—Good Multicast packets received.
• CRC & Align Errors—CRC and Align errors that have occurred.
• Undersize Packets—Undersized packets (less than 64 octets) received.
• Oversize Packets—Oversized packets (over 2000 octets) received.
• Fragments—Fragments (packets with less than 64 octets, excluding framing bits, but
including FCS octets) received.
Cisco 350, 350X and 550X Series Managed Switches, Firmware Release 2.4, ver 0.4 73
Page 87

5
Status and Statistics
RMON
• Jabbers—Received packets that longer than 1632 octets. This number excludes frame
bits, but includes FCS octets that had either a bad FCS (Frame Check Sequence) with
an integral number of octets (FCS Error) or a bad FCS with a non-integral octet
(Alignment Error) number. A Jabber packet is defined as an Ethernet frame that satisfies
the following criteria:
- Packet data length is greater than MRU.
- Packet has an invalid CRC.
- Received (Rx) Error Event has not been detected.
• Collisions—Collisions received. If Jumbo frames are enabled, the threshold of Jabber
frames is raised to the maximum size of Jumbo frames.
• Frames of 64 Bytes—Frames, containing 64 bytes that were sent or received.
• Frames of 65 to 127 Bytes—Frames, containing 65-127 bytes that were sent or
received.
• Frames of 128 to 255 Bytes—Frames, containing 128-255 bytes that were sent or
received.
• Frames of 256 to 511 Bytes—Frames, containing 256-511 bytes that were sent or
received.
• Frames of 512 to 1023 Bytes—Frames, containing 512-1023 bytes that were sent or
received.
• Frames of 1024 Bytes or More—Frames, containing 1024-2000 bytes, and Jumbo
Frames, that were sent or received.
STEP 4 T o view counters in table view or graphic view:
• Click View All Interfaces Statistics to see all ports in table view.
• Click Graphic View to display these results in graphic form. In this view , you can select
the Time Span for which the results will be displayed and the type of statistic to be
displayed.
RMON History
The RMON feature enables monitoring statistics per interface.
The History page defines the sampling frequency, amount of samples to store and the port
from which to gather the data.
74 Cisco 350, 350X and 550X Series Managed Switches, Firmware Release 2.4, ver 0.4
Page 88

Status and Statistics
RMON
STEP 1 Click Status and Statistics > RMON > History. The fields disp layed on this page are defined
STEP 2 Click Add.
STEP 3 Enter the parameters.
5
After the data is sampled and stored, it appears in the History Table page that can be viewed by
clicking History Table.
To enter RMON control information:
in the Add RMON History page, below. The only field is that is on this page and not defined in
the Add page is:
• Current Number of Samples—RMON is allowed by the standard to not grant all
requested samples, but rather to limit the number of samples per request. Therefore, this
field represents the sample number actually granted to the request that is equal or less
than the requested value.
• New History Entry—Displays the number of the new History table entry.
• Source Interface—Select the type of interface from which the history samples are to
be taken.
• Max No. of Samples to Keep—Enter the number of samples to store.
• Sampling Interval—Enter the time in seconds that samples are collected from the
ports. The field range is 1-3600.
• Owner—Enter the RMON station or user that requested the RMON information.
STEP 4 Click Apply. The entry is added to the History Control Table page, and the Running
Configuration file is updated.
STEP 5 Click History T able (described below) to view the actual statistics.
RMON History Table
The History page displays interface-specific statistical network samplings. The samples
configured in the History Control table described above.
To view RMON history statistics:
STEP 1 Click Status and Statistics > RMON > History.
STEP 2 Click History T able.
Cisco 350, 350X and 550X Series Managed Switches, Firmware Release 2.4, ver 0.4 75
Page 89

5
Status and Statistics
RMON
STEP 3 From the History Entry No. drop down menu, optionally select the entry number of the
sample to display.
The fields are displayed for the selected sample.
• Owner—History table entry owner.
• Sample No.—Statistics taken from this sample.
• Drop Events—Dropped packets due to lack of network resources during the sampling
interval. This may not represent the exact number of dropped packets, but rather the
number of times dropped packets detected.
• Bytes Received—Octets received including bad packets and FCS octets, but excluding
framing bits.
• Packets Received—Packets received, including bad packets, Multicast, and Broadcast
packets.
• Broadcast Packets—Good Broadcast packets excluding Multicast packets.
• Multicast Packets—Good Multicast packets received.
• CRC Align Errors—CRC and Align errors that have occurred.
• Undersize Packets—Undersized packets (less than 64 octets) received.
• Oversize Packets—Oversized packets (over 2000 octets) received.
• Fragments—Fragments (packets with less than 64 octets) received, excluding framing
bits, but including FCS octets.
• Jabbers—T otal number of re ceived p ackets t hat long er than 2000 octets. This number
excludes frame bits, but includes FCS octets that had either a bad FCS (Frame Check
Sequence) with an integral number of octets (FCS Error) or a bad FCS with a nonintegral octet (Alignment Error) number.
• Collisions—Collisions received.
• Utilization—Percentage of current interface traffic compared to maximum traffic that
the interface can handle.
76 Cisco 350, 350X and 550X Series Managed Switches, Firmware Release 2.4, ver 0.4
Page 90

Status and Statistics
RMON
STEP 1 Click Status and Statistics > RMON > Events.
5
RMON Events Control
You can control the occurrences that trigger an alarm and the type of notification that occurs.
This is performed as follows:
• Events Page—Configures what happens when an alarm is triggered. This can be any
combination of logs and traps.
• Alarms Page—Configures the occurrences that trigger an alarm.
To define RMON events:
This page displays previously defined events.
The fields on this page are defined by the Add RMON Events dialog box except for the Time
field.
• Time—Displays the time of the event. (This is a read-only table in the parent window
and cannot be defined).
STEP 2 Click Add.
STEP 3 Enter the parameters.
• Event Entry—Displays the event entry index number for the new entry.
• Community—Enter the SNMP community string to be included when traps are sent
(optional). Note that the community must be defined using the Notification Recipients
pages for the trap to reach the Network Management Station.
• Description—Enter a name for the event. This name is used in the Add RMON Alarm
page to attach an alarm to an event.
• Notification Type—Select the type of action that results from this event. Values are:
- None—No action occurs when the alarm goes off.
- Log (Event Log Table)—Add a log entry to the Event Log table when the alarm is
triggered.
- Trap (SNMP Manager and Syslog Server)—Send a trap to the remote log server
when the alarm goes off.
- Log and Trap—Add a log entry to the Event Log table and send a trap to the remote
log server when the alarm goes off.
• Owner—Enter the device or user that defined the event.
Cisco 350, 350X and 550X Series Managed Switches, Firmware Release 2.4, ver 0.4 77
Page 91

5
Status and Statistics
RMON
STEP 4 Click Apply. The RMON event is saved to the Running Configuration file.
STEP 5 Click Event Log Table to display the log of alarms that have occurred and that have been
logged (see description below).
RMON Events Logs
The Events page displays the log of events (actions) that occurred. Two types of events can be
logged: Log or Log and Trap. The action in the event is performed when the event is bound to
an alarm (see the RMON Alarms page) and the conditions of the alarm have occurred.
STEP 1 Click Status and Statistics > RMON > Events.
STEP 2 Click Event Log Table.
You can select an interface in the filter to view events on a specific interface.
This page displays the following fields:
• Event Entry No.—Event’s log entry number.
• Log No.—Log number (within the event).
• Log Time—Time that the log entry was entered.
• Description—Description of event that triggered the alarm.
RMON Alarms
RMON alarms provide a mechanism for setting thresholds and sampling intervals to generate
exception events on counters or any other SNMP object count er maintained by the agent. Both
the rising and falling thresholds must be configured in the alarm. After a rising threshold is
crossed, no rising events are generated until the companion falling threshold is crossed. After a
falling alarm is issued, the next alarm is issued when a rising threshold is crossed.
One or more alarms are bound to an event, which indicates the action to be taken when the
alarm occurs.
Alarm counters can be monitored by either absolute values or changes (delta) in the counter
values.
78 Cisco 350, 350X and 550X Series Managed Switches, Firmware Release 2.4, ver 0.4
Page 92

Status and Statistics
RMON
STEP 1 Click Status and Statistics > RMON > Alarms.
STEP 2 Click Add.
STEP 3 Enter the parameters.
5
To enter RMON alarms:
All previously-defined alarms are displayed. The fields are described in the Add RMON
Alarm page below. In addition to those fields, the following field appears:
• Counter Value—Displays the value of the statistic during the last sampling period.
• Alarm Entry—Displays the alarm entry number.
• Interface—Select the type of interface for which RMON statistics are displayed.
• Counter Name—Select the MIB variable that indicates the type of occurrence
measured.
• Sample Type—Select the sampling method to generate an alarm. The options are:
- Absolute—If the threshold is crossed, an alarm is generated.
- Delta—Subtracts the last sampled value from the current value. The difference in
the values is compared to the threshold. If the threshold was crossed, an alarm is
generated.
• Rising Threshold—Enter the value that triggers the rising threshold alarm.
• Rising Event—Select an event to be performed when a rising even t is triggered. Events
are configured in the RMON Events Control page.
• Falling Threshold—Enter the value that triggers the falling threshold alarm.
• Falling Event—Select an event to be performed when a falling event is triggered.
• Startup Alarm—Select the first event from which to start generation of alarms. Rising
is defined by crossing the threshold from a low-value threshold to a higher-value
threshold.
- Rising Alarm—A rising value triggers the rising threshold alarm.
- Falling Alarm—A falling value triggers the falling threshold alarm.
- Rising and Falling—Both rising and falling values trigger the alarm.
• Interval—Enter the alarm interval time in seconds.
Cisco 350, 350X and 550X Series Managed Switches, Firmware Release 2.4, ver 0.4 79
Page 93

5
sFlow
Status and Statistics
sFlow
• Owner—Enter the name of the user or network management system that receives the
alarm.
STEP 4 Click Apply. The RMON alarm is saved to the Running Configuration file.
The sFlow feature enables co lle cting statistics using the sFlow sampling technology, based on
sFlow V5.
This sampling technology is embedded within switches and routers. It provides the ability to
continuously monitor traffic flows on some or all the interfaces, simultaneously.
The sFlow monitoring system consists of an sFlow agent (embedded in a switch or router or in
a stand alone probe) and a central data collector, known as the sFlow collector.
The sFlow agent uses sampling technology to capture traffic and statistics from the device it is
monitoring. sFlow datagrams are used to forward the sampled traffic and statistics to an sFlow
collector for analysis.
sFlow V5 defines:
• How traffic is monitored.
• The sFlow MIB that controls the sFlow agent.
• The format of the sample data used by the sFlow agent when forwarding data to a
central data collector. The device provides support for two types of sFlow sampling:
flow sampling and counters sampling. The following counters sampling is performed
according to sFlow V5 (if supported by the interface):
- Generic interface counters (RFC 2233)
- Ethernet interface counters (RFC 2358)
Workflow
By default, flow and counter sampling are disabled.
80 Cisco 350, 350X and 550X Series Managed Switches, Firmware Release 2.4, ver 0.4
Page 94

Status and Statistics
sFlow
STEP 1 Click Status and Statistics > sFlow > sFlow Receivers.
STEP 2 Enter the following fields:
5
To enable sFlow sampling:
1. Set the IP address of a receiver (also known as a collector or server) for sFlow statistics. Use
the sFlow Receiver Settings page for this.
2. Enable flow and/or counter sampling, direct the samples to a receiving index, and configure
the average sampling rate. Use the sFlow Interface Settings pages for this.
3. View and clear the sFlow statistics counters. Use the sFlow Statistics page for this.
sFlow Receiver Settings
To set the sFlow receiver parameters:
• IPv4 Source Interface— Select the IPv4 source interface.
NOTE If the Auto option is selected, the system takes the source IP address from the IP
address defined on the outgoing interface.
• IPv6 Source Interface— Select the IPv6 source interface
STEP 3 To add a receiver (sFlow analyzer), click Add and select one of the pre-defined sampling
definition indices in Receiver Index.
STEP 4 Enter the receiver’s address fields:
• Receiver Definition—Select whether to specify the sFlow server By IP addr ess or By
name.
If Receiver Definition is By IP Address:
• IP Version—Select whether an IPv4 or an IPv6 address for the server is used.
• IPv6 Address Type—Select the IPv6 address type (if IPv6 is used). The options are:
- Link Local—The IPv6 address uniquely identifies hosts on a single network link.
A link local address has a prefix of FE80, is not routable, and can be used for
communication only on the local network. Only one link local address is supported.
If a link local address exists on the interface, this entry replaces the address in the
configuration.
- Global—The IPv6 address is a global Unicast IPV6 type that is visible and
reachable from other networks.
Cisco 350, 350X and 550X Series Managed Switches, Firmware Release 2.4, ver 0.4 81
Page 95

5
Status and Statistics
sFlow
• Link Local Interface—Select the link local interface (if IPv6 is used) from the list.
STEP 5 Enter the fields:
• Receiver IP Address/Name—Enter the IP address or the name of the receiver,
whichever is relevant.
• Port—Port to which SYSLOG message are sent.
• Maximum Datagram Size—Maximum number of bytes that can be sent to the receiver
in a single sample datagram (frame).
STEP 6 Click Apply.
sFlow Interface Settings
To sample datagrams or counters from a port, the port must be associated with a receiver.
sFlow port settings can be configured only after a receiver has been defined in the sFlow
Receiver Settings pages.
To enable sampling and configure the port from which to collect the sFlow information:
STEP 1 Click Status and Statistics > sFlow > sFlow Interface Settings.
The sFlow interface settings are displayed.
STEP 2 To associate an sFlow receiver with a port, select a port, click Edit, and enter the fields:
- Interface—Select the unit/port from which information is collected.
- (Flow Sampling) State—Enable/disable flow sampling.
- Sampling Rate—If x is entered, a flow sample will be taken for each x frames.
- Maximum Header Size—Maximum number of bytes that should be copied from a
sampled packet.
- Receiver Index—Select one of the indices that was defined in the sFlow Receiver
Settings pages.
- (Counter Sampling) State—Enable/disable counters sampling.
- Sampling Interval—If x is entered, this specifies that a counter sample will be
taken for each x seconds.
- Receiver Index—Select one of the indices that was defined in these sFlow
Receiver Settings pages.
STEP 3 Click Apply.
82 Cisco 350, 350X and 550X Series Managed Switches, Firmware Release 2.4, ver 0.4
Page 96

Status and Statistics
View Logs
View Logs
5
sFlow Statistics
To view sFlow statistics:
• Click Status and Statistics > sFlow > sFlow Statistics.
The following sFlow statistics per interface are displayed:
- Interface — Port for which sample was collected.
- Packets Sampled — Number of packets sampled.
- Datagrams Sent to Receiver — Number of sFlow sampling packets sent.
The device can write to the following logs:
• Log in RAM (cleared during reboot).
• Log in Flash memory (cleared only upon user command).
You can configure the messages that are written to each log by severity, and a message can go
to more than one log, including logs that reside on external SYSLOG servers.
RAM Memory
The RAM Memory page displays all messages that saved in the RAM (cache) in chronological
order. Entries are stored in the RAM log according to the configuration in the Log Settings
page.
Pop-Up SYSLOG Notifications
When a new SYSLOG message is written to the RAM log file, a notification is displayed in
the web GUI showing its contents.
The web GUI will poll the RAM log every 10 seconds. Notifications pop-ups for all
SYSLOGs created in the last 10 seconds will appear at the bottom right of the screen.
Cisco 350, 350X and 550X Series Managed Switches, Firmware Release 2.4, ver 0.4 83
Page 97

5
Status and Statistics
View Logs
The notification pop-up displays as follows:
If more than 7 pop-up notifications are displayed, a summary pop-up is displayed. This p op-up
states how many SYSLOG notifications are not displayed. It also contains a button that
enables closing all of the displayed pop-ups, as shown below:
To view log entries, click Status and Statistics > View Log > RAM Memory.
The following are displayed at the top of the page:
• Alert Icon Blinking—Toggles between disable and enable.
• Pop-Up Syslog Notification—Enables receiving pop-up SYSLOGs as described
above.
• Current Logging Threshold—Specifies the levels of logging that are generated. This
can be changed by clicking Edit by the field’s name.
This page contains the following fields for every log file:
• Log Index—Log entry number.
• Log Time—Time when message was generated.
• Severity—Event severity.
• Description—Message text describing the event.
To clear the log messages, click Clear Logs. The messages are cleared.
84 Cisco 350, 350X and 550X Series Managed Switches, Firmware Release 2.4, ver 0.4
Page 98

Status and Statistics
View Logs
5
Flash Memory
The Flash Memory page displays the messages that stored in the Flash memory, in
chronological order . The minimum severity for l ogging is configured in the Log Settings page.
Flash logs remain when the device is rebooted. You can clear the logs manually.
To view the Flash logs, click Status and Statistics > View Log > Flash Memory.
The Current Logging Threshold specifies the levels of logging that are generated. This can
be changed by clicking Edit by the field’s name.
This page contains the following fields for each log file:
• Log Index—Log entry number.
• Log Time—Time when message was generated.
• Severity—Event severity.
• Description—Message text describing the event.
To clear the messages, click Clear Logs. The messages are cleared.
Cisco 350, 350X and 550X Series Managed Switches, Firmware Release 2.4, ver 0.4 85
Page 99

Administration
This section describes how to view system information and configure various options on the
device.
It covers the following topics:
• System Settings
• Console Settings (Autobaud Rate Support)
6
• Stack Management
• User Accounts
• Idle Session Timeout
• Time Settings
•System Log
• File Management
•Plug-n-Play (PNP)
•Reboot
• Hardware Resources
• Discovery - Bonjour
• Discovery - LLDP
• Discovery - CDP
• Locate Device
•Ping
• Traceroute
Cisco 350, 350X and 550X Series Managed Switches, Firmware Release 2.4, ver 0.4 76
Page 100

Administration
System Settings
System Settings
STEP 1 Click Administration > System Settings.
STEP 2 View or modify the system settings.
6
To enter system settings:
• System Description—Displays a description of the device.
• System Location—Enter the physical location of the device.
• System Contact—Enter the name of a contact person.
• Host Name—Select the host name of this device. This is used in the prompt of CLI
commands:
- Use Default—The default hostname (System Name) of these switches is:
switch123456, where 123456 represents the last three bytes of the device MAC
address in hex format.
- User Defined—Enter the hostname. Use only letters, digits, and hyphens. Host
names cannot begin or end with a hyphen. No other symbols, punctuation
characters, or blank spaces are permitted (as specified in RFC1033, 1034, 1035).
• Custom Banner Settings—The following banners can be set:
- Login Banner—Enter text to display on the Login page before lo gin. Click Preview
to view the results.
- Welcome Banner—Enter text to display on the Login page after login. Click
Preview to view the results.
NOTE When you define a login banner from the web-based configuration utility , it also
activates the banner for the CLI interfaces (Console, Telnet, and SSH).
The banner can contain up to 1000 characters. After 510 characters, press <Enter> to
continue.
STEP 3 Click Apply to save the values in the Running Configuration file.
Cisco 350, 350X and 550X Series Managed Switches, Firmware Release 2.4, ver 0.4 77
 Loading...