

Page 1

User Guide for Internetwork Performance Monitor
Software Release 2.6
CiscoWorks
Corporate Headquarters
Cisco Systems, Inc.
170 West Tasman Drive
San Jose, CA 95134-1706
USA
http://www.cisco.com
Tel: 408 526-4000
800 553-NETS (6387)
Fax: 408 526-4100
Text Part Number: OL-11291-01
Page 2

THE SPECIFICATIONS AND INFORMATION REGARDING THE PRODUCTS IN THIS MANUAL ARE SUBJECT TO CHANGE WITHOUT NOTICE. ALL
STATEMENTS, INFORMATION, AND RECOMMENDATIONS IN THIS MANUAL ARE BELIEVED TO BE ACCURATE BUT ARE PRESENTED WITHOUT
WARRANTY OF ANY KIND, EXPRESS OR IMPLIED. USERS MUST TAKE FULL RESPONSIBILITY FOR THEIR APPLICATION OF ANY PRODUCTS.
THE SOFTWARE LICENSE AND LIMITED WARRANTY FOR THE ACCOMPANYING PRODUCT ARE SET FORTH IN THE INFORMATION PACKET THAT
SHIPPED WITH THE PRODUCT AND ARE INCORPORATED HEREIN BY THIS REFERENCE. IF YOU ARE UNABLE TO LOCATE THE SOFTWARE LICENSE
OR LIMITED WARRANTY, CONTACT YOUR CISCO REPRESENTATIVE FOR A COPY.
The Cisco implementation of TCP header compression is an adaptation of a program developed by the University of California, Berkeley (UCB) as part of UCB’s public
domain version of the UNIX operating system. All rights reserved. Copyright © 1981, Regents of the University of California.
NOTWITHSTANDING ANY OTHER WARRANTY HEREIN, ALL DOCUMENT FILES AND SOFTWARE OF THESE SUPPLIERS ARE PROVIDED “AS IS” WITH
ALL FAULTS. CISCO AND THE ABOVE-NAMED SUPPLIERS DISCLAIM ALL WARRANTIES, EXPRESSED OR IMPLIED, INCLUDING, WITHOUT
LIMITATION, THOSE OF MERCHANTABILITY, FITNESS FOR A PARTICULAR PURPOSE AND NONINFRINGEMENT OR ARISING FROM A COURSE OF
DEALING, USAGE, OR TRADE PRACTICE.
IN NO EVENT SHALL CISCO OR ITS SUPPLIERS BE LIABLE FOR ANY INDIRECT, SPECIAL, CONSEQUENTIAL, OR INCIDENTAL DAMAGES, INCLUDING,
WITHOUT LIMITATION, LOST PROFITS OR LOSS OR DAMAGE TO DATA ARISING OUT OF THE USE OR INABILITY TO USE THIS MANUAL, EVEN IF CISCO
OR ITS SUPPLIERS HAVE BEEN ADVISED OF THE POSSIBILITY OF SUCH DAMAGES.
CCSP, CCVP, the Cisco Square Bridge logo, Follow Me Browsing, and StackWise are trademarks of Cisco Systems, Inc.; Changing the Way We Work, Live, Play, and Learn,
and iQuick Study are service marks of Cisco Systems, Inc.; and Access Registrar, Aironet, BPX, Catalyst, CCDA, CCDP, CCIE, CCIP, CCNA, CCNP, Cisco, the Cisco
Certified Internetwork Expert logo, Cisco IOS, Cisco Press, Cisco Systems, Cisco Systems Capital, the Cisco Systems logo, Cisco Unity, Enterprise/Solver, EtherChannel,
EtherFast, EtherSwitch, Fast Step, FormShare, GigaDrive, GigaStack, HomeLink, Internet Quotient, IOS, IP/TV, iQ Expertise, the iQ logo, iQ Net Readiness Scorecard,
LightStream, Linksys, MeetingPlace, MGX, the Networkers logo, Networking Academy, Network Registrar, Packet, PIX, Post-Routing, Pre-Routing, ProConnect,
RateMUX, ScriptShare, SlideCast, SMARTnet, The Fastest Way to Increase Your Internet Quotient, and TransPath are registered trademarks of Cisco Systems, Inc. and/or
its affiliates in the United States and certain other countries.
All other trademarks mentioned in this document or Website are the property of their respective owners. The use of the word partner does not imply a partnership relationship
between Cisco and any other company. (0601R)
User Guide for Internetwork Performance Monitor
Copyright © 1998-2006, Cisco Systems, Inc. All rights reserved.
Page 3

Preface ix
Audience ix
Conventions ix
Product Documentation x
Obtaining Documentation xi
Cisco.com xi
Product Documentation DVD xi
Ordering Documentation xi
Documentation Feedback xii
Cisco Product Security Overview xii
Reporting Security Problems in Cisco Products xii
Obtaining Technical Assistance xiii
Cisco Technical Support & Documentation Website xiii
Submitting a Service Request xiv
Definitions of Service Request Severity xiv
CONTENTS
CHAPTER
CHAPTER
Obtaining Additional Publications and Information xiv
1 Overview of IPM 1-1
What is IPM? 1-1
Key Terms and Concepts 1-2
How Does IPM Work? 1-3
Client/Server Architecture 1-3
New Features in IPM 2.6 1-5
2 Getting Started With IPM 2-1
Starting IPM 2-1
Starting IPM Server on Solaris 2-1
Starting IPM Server on Windows 2-2
Starting IPM Client 2-2
Starting IPM Client From the CiscoWorks Homepage 2-2
OL-11291-01
User Guide for Internetwork Performance Monitor
iii
Page 4

Contents
Starting IPM as a Standalone Client 2-3
Starting IPM Standalone Client on Solaris 2-3
Enabling the IPM Password on Solaris 2-5
Starting IPM Standalone Client on Windows 2-6
Starting IPM Client from the Windows Command Prompt 2-6
Enabling the IPM Password on Windows 2-7
Running Simultaneous IPM Sessions 2-8
Configuring the IPM Components 2-8
Defining a Source Device 2-8
Defining a Target 2-10
Defining a Collector 2-12
Viewing Network Performance Statistics 2-17
Viewing Network Performance Statistics in Real Time 2-18
Viewing Historical Network Performance Statistics 2-20
Understanding Next Range 2-26
Understanding Previous Range 2-26
CHAPTER
Printing IPM Statistics 2-27
Exiting the IPM Client 2-28
3 Using IPM to Measure Network Performance 3-1
Measuring Network Performance for DHCP 3-2
Defining a DHCP Operation 3-2
Viewing Statistics for DHCP 3-4
Measuring Network Performance for DLSw 3-5
Defining a DLSw Operation 3-5
Viewing Statistics for DLSw 3-7
Measuring Network Performance for DNS 3-8
Defining a DNS Operation 3-8
Viewing Statistics for DNS 3-9
Measuring Network Performance for HTTP 3-11
Defining an HTTP Operation 3-11
Viewing Statistics for HTTP 3-13
Measuring Network Performance for FTP 3-15
Defining an FTP Operation 3-15
Viewing Statistics for FTP 3-17
iv
User Guide for Internetwork Performance Monitor
OL-11291-01
Page 5

Measuring Network Performance for IP 3-18
Measuring End-to-End Performance for IP 3-19
Defining an IP Echo Operation 3-19
Viewing End-to-End Statistics for IP 3-21
Measuring Hop-by-Hop Performance for IP 3-22
Defining an IP Path Echo Operation 3-22
Viewing Hop-by-Hop Statistics for IP 3-24
Measuring Network Performance for SNA 3-29
Defining an SNA Echo Operation 3-30
Viewing Statistics for SNA 3-31
Measuring Network Performance for TCP 3-33
Defining a TCP Operation 3-33
Viewing Statistics for TCP 3-35
Measuring Network Performance for UDP 3-36
Defining a UDP Operation 3-36
Viewing Statistics for UDP 3-38
Contents
CHAPTER
Measuring Network Performance for Enhanced UDP 3-39
Defining an Enhanced UDP Operation 3-40
Viewing Statistics for Enhanced UDP 3-41
4 Modifying IPM Components 4-1
Working With Source Devices 4-1
Viewing a List of Configured Source Devices 4-2
Viewing Source Properties 4-2
Adding a New Source Device 4-3
Deleting Source Devices 4-3
Working With Target Devices 4-3
Viewing a List of Defined Targets 4-4
Viewing Target Properties 4-4
Adding a New Target 4-5
Deleting Targets 4-5
Working With Operations 4-6
Viewing a List of Defined Operations 4-6
Viewing Operation Properties 4-8
Adding a New Operation 4-9
Setting Thresholds and Generating Alerts 4-9
Deleting Operations 4-11
OL-11291-01
User Guide for Internetwork Performance Monitor
v
Page 6

Contents
Working With Collectors 4-11
Viewing a List of Defined Collectors 4-12
Viewing a Collector State Summary 4-12
Viewing Collector Properties 4-13
Adding a New Collector 4-14
Stopping Collectors 4-15
Deleting Collectors 4-15
Adding Components Using Seed Files 4-16
Creating a Seed File 4-16
Seed File Syntax 4-17
Sample Source Seed File 4-18
Sample Target Seed File 4-19
Sample Collector Seed File 4-19
Loading Components From a Seed File 4-21
Viewing Seed File Output Files 4-21
Changing IP Addresses 4-22
Setting the Baseline 4-23
Setting IPM Database Preferences 4-24
Displaying the Current Database Preferences 4-25
Changing the Database Preferences 4-25
Database Preferences File Format 4-27
Setting SNMP Timeout and Retry Environment Variables 4-29
Setting SNMP Environment Variables in Solaris 4-30
Setting SNMP Environment Variables in Windows 4-31
Setting New IPM Server Process Timeout Values 4-32
Setting Server Timeout Values in Solaris 4-33
Setting Server Timeout Values in Windows 4-33
Setting the DISPLAY Variable in Solaris 4-34
Backing Up or Restoring the IPM Database 4-35
NVRAM Settings 4-35
Managed Source Interface Settings 4-36
Changing Administrative Password 4-37
vi
Changing IPM Database Password 4-37
Working With Message Log Window 4-38
Log Control 4-38
Log Display 4-39
User Guide for Internetwork Performance Monitor
OL-11291-01
Page 7

Contents
CHAPTER
5 Working With IPM From the CiscoWorks Homepage 5-1
Accessing IPM Data From the CiscoWorks Homepage 5-1
Viewing IPM Server Information 5-2
Viewing Status Information for IPM Servers 5-3
Viewing Version Information for the IPM Server and Components 5-4
Viewing the IPM Server Log 5-4
Viewing the IPM Console Log 5-5
Viewing the Troubleshooting Log for IPM 5-6
Importing Devices From Device and Credential Repository 5-7
Downloading the IPM Client 5-10
Downloading the IPM Client for Solaris 5-10
Downloading the IPM Client for Windows 5-11
Viewing Configuration Information 5-13
Viewing Source Configuration Information 5-13
Viewing Target Configuration Information 5-14
Viewing Operation Configuration Information 5-14
Viewing Collector Configuration Information 5-15
Viewing Path Echo Collector Path Usage Data 5-16
APPENDIX
Viewing Latency Data 5-17
Viewing Daily Latency Data 5-18
Viewing Weekly Latency Data 5-21
Viewing Monthly Latency Data 5-22
Viewing Jitter Data 5-23
Viewing Daily Jitter Data 5-23
Viewing Weekly Jitter Data 5-25
Viewing Monthly Jitter Data 5-26
Viewing HTTP Data 5-27
Viewing Daily HTTP Data 5-27
Viewing Weekly HTTP Data 5-28
Viewing Monthly HTTP Data 5-29
Accessing Software Updates and Additional Information 5-30
Viewing Information About IPM on Cisco.com 5-30
A IPM FAQs and Troubleshooting Tips A-1
IPM FAQs A-1
Troubleshooting IPM A-11
OL-11291-01
User Guide for Internetwork Performance Monitor
vii
Page 8

Contents
APPENDIX
APPENDIX
G
LOSSARY
I
NDEX
B IPM Command Reference B-1
Output of ipm status Command B-8
Output of ipm help Command B-8
Output of ipm export help Command B-11
IPM Internal Commands B-13
C SA Agent Feature Mapping C-1
Verify Your SA Agent Version C-2
viii
User Guide for Internetwork Performance Monitor
OL-11291-01
Page 9

Audience
Preface
This document describes how to use Internetwork Performance Monitor (IPM) 2.6, a software to monitor
the performance of multi-protocol networks. This preface describes who should read this guide, and
outlines the document conventions used in this guide.
This document is for the network administrator or operator who uses the Internetwork Performance
Monitor software. Network administrators or operators should have:
• Basic network management skills
Conventions
This document uses the following conventions:
• Basic Windows system administrator skills
• Basic Solaris system administrator skills
Item Convention
Commands and keywords boldface font
Variables for which you supply values italic font
Displayed session and system information
Information you enter
Variables you enter
Menu items and button names boldface font
Selecting a menu item in paragraphs Option > Network Preferences
Selecting a menu item in tables Option > Network Preferences
screen font
boldface screen font
italic screen font
OL-11291-01
Note Means reader take note. Notes contain helpful suggestions or references to material not covered in the
publication.
User Guide for Internetwork Performance Monitor
ix
Page 10

Product Documentation
Caution Means reader be careful. In this situation, you might do something that could result in equipment
Preface
damage or loss of data.
Warning
This symbol means danger. You are in a situation that could cause bodily injury.
Product Documentation
Note We sometimes update the printed and electronic documentation after original publication. Therefore,
you should also review the documentation on Cisco.com for any updates.
Table 1 describes the product documentation that is available.
Table 1 Product Documentation
Document Title Available Formats
Release Notes for Internetwork
Performance Monitor 2.6
Installation Guide for Internetwork
Performance Monitor 2.6
User Guide for Internetwork
Performance Monitor 2.6
Context-sensitive online help
• On Cisco.com at this URL:
http://www.cisco.com/en/US/products/sw/cscowork/ps1008/prod_release_note0
9186a008035c18b.html
• PDF on the documentation CD-ROM.
• On Cisco.com at this URL:
http://www.cisco.com/en/US/products/sw/cscowork/ps1008/products_installatio
n_guide_book09186a0080366ce9.html
• PDF on the documentation CD-ROM.
• On Cisco.com at this URL:
http://www.cisco.com/en/US/products/sw/cscowork/ps1008/products_user_guid
e_book09186a0080366cf7.html
• Select an option from the navigation tree, then click Help.
• Click the Help button in the dialog box.
User Guide for Internetwork Performance Monitor
x
OL-11291-01
Page 11

Preface
Obtaining Documentation
Cisco documentation and additional literature are available on Cisco.com. Cisco also provides several
ways to obtain technical assistance and other technical resources. These sections explain how to obtain
technical information from Cisco Systems.
Cisco.com
You can access the most current Cisco documentation at this URL:
http://www.cisco.com/techsupport
You can access the Cisco website at this URL:
http://www.cisco.com
You can access international Cisco websites at this URL:
http://www.cisco.com/public/countries_languages.shtml
Obtaining Documentation
Product Documentation DVD
Cisco documentation and additional literature are available in the Product Documentation DVD package,
which may have shipped with your product. The Product Documentation DVD is updated regularly and
may be more current than printed documentation.
The Product Documentation DVD is a comprehensive library of technical product documentation on
portable media. The DVD enables you to access multiple versions of hardware and software installation,
configuration, and command guides for Cisco products and to view technical documentation in HTML.
With the DVD, you have access to the same documentation that is found on the Cisco website without
being connected to the Internet. Certain products also have .pdf versions of the documentation available.
The Product Documentation DVD is available as a single unit or as a subscription. Registered Cisco.com
users (Cisco direct customers) can order a Product Documentation DVD (product number
DOC-DOCDVD=) from Cisco Marketplace at this URL:
http://www.cisco.com/go/marketplace/
Ordering Documentation
Beginning June 30, 2005, registered Cisco.com users may order Cisco documentation at the Product
Documentation Store in the Cisco Marketplace at this URL:
http://www.cisco.com/go/marketplace/
Nonregistered Cisco.com users can order technical documentation from 8:00 a.m. to 5:00 p.m.
(0800 to 1700) PDT by calling 1 866 463-3487 in the United States and Canada, or elsewhere by
calling 011 408 519-5055. You can also order documentation by e-mail at
tech-doc-store-mkpl@external.cisco.com or by fax at 1 408 519-5001 in the United States and Canada,
or elsewhere at 011 408 519-5001.
OL-11291-01
User Guide for Internetwork Performance Monitor
xi
Page 12

Documentation Feedback
Documentation Feedback
You can rate and provide feedback about Cisco technical documents by completing the online feedback
form that appears with the technical documents on Cisco.com.
You can send comments about Cisco documentation to bug-doc@cisco.com.
You can submit comments by using the response card (if present) behind the front cover of your
document or by writing to the following address:
Cisco Systems
Attn: Customer Document Ordering
170 West Tasman Drive
San Jose, CA 95134-9883
We appreciate your comments.
Cisco Product Security Overview
Cisco provides a free online Security Vulnerability Policy portal at this URL:
Preface
http://www.cisco.com/en/US/products/products_security_vulnerability_policy.html
From this site, you can perform these tasks:
• Report security vulnerabilities in Cisco products.
• Obtain assistance with security incidents that involve Cisco products.
• Register to receive security information from Cisco.
A current list of security advisories and notices for Cisco products is available at this URL:
http://www.cisco.com/go/psirt
If you prefer to see advisories and notices as they are updated in real time, you can access a Product
Security Incident Response Team Really Simple Syndication (PSIRT RSS) feed from this URL:
http://www.cisco.com/en/US/products/products_psirt_rss_feed.html
Reporting Security Problems in Cisco Products
Cisco is committed to delivering secure products. We test our products internally before we release them,
and we strive to correct all vulnerabilities quickly. If you think that you might have identified a
vulnerability in a Cisco product, contact PSIRT:
• Emergencies—security-alert@cisco.com
An emergency is either a condition in which a system is under active attack or a condition for which
a severe and urgent security vulnerability should be reported. All other conditions are considered
nonemergencies.
xii
• Nonemergencies—psirt@cisco.com
In an emergency, you can also reach PSIRT by telephone:
• 1 877 228-7302
• 1 408 525-6532
User Guide for Internetwork Performance Monitor
OL-11291-01
Page 13

Preface
Tip We encourage you to use Pretty Good Privacy (PGP) or a compatible product to encrypt any sensitive
information that you send to Cisco. PSIRT can work from encrypted information that is compatible with
PGP versions 2.x through 8.x.
Never use a revoked or an expired encryption key. The correct public key to use in your correspondence
with PSIRT is the one linked in the Contact Summary section of the Security Vulnerability Policy page
at this URL:
http://www.cisco.com/en/US/products/products_security_vulnerability_policy.html
The link on this page has the current PGP key ID in use.
Obtaining Technical Assistance
Cisco Technical Support provides 24-hour-a-day award-winning technical assistance. The Cisco
Technical Support & Documentation website on Cisco.com features extensive online support resources.
In addition, if you have a valid Cisco service contract, Cisco Technical Assistance Center (TAC)
engineers provide telephone support. If you do not have a valid Cisco service contract, contact your
reseller.
Obtaining Technical Assistance
Cisco Technical Support & Documentation Website
The Cisco Technical Support & Documentation website provides online documents and tools for
troubleshooting and resolving technical issues with Cisco products and technologies. The website is
available 24 hours a day, at this URL:
http://www.cisco.com/techsupport
Access to all tools on the Cisco Technical Support & Documentation website requires a Cisco.com user
ID and password. If you have a valid service contract but do not have a user ID or password, you can
register at this URL:
http://tools.cisco.com/RPF/register/register.do
Note Use the Cisco Product Identification (CPI) tool to locate your product serial number before submitting
a web or phone request for service. You can access the CPI tool from the Cisco Technical Support &
Documentation website by clicking the Tools & Resources link under Documentation & Tools. Choose
Cisco Product Identification Tool from the Alphabetical Index drop-down list, or click the Cisco
Product Identification Tool link under Alerts & RMAs. The CPI tool offers three search options: by
product ID or model name; by tree view; or for certain products, by copying and pasting show command
output. Search results show an illustration of your product with the serial number label location
highlighted. Locate the serial number label on your product and record the information before placing a
service call.
OL-11291-01
User Guide for Internetwork Performance Monitor
xiii
Page 14

Obtaining Additional Publications and Information
Submitting a Service Request
Using the online TAC Service Request Tool is the fastest way to open S3 and S4 service requests. (S3
and S4 service requests are those in which your network is minimally impaired or for which you require
product information.) After you describe your situation, the TAC Service Request Tool provides
recommended solutions. If your issue is not resolved using the recommended resources, your service
request is assigned to a Cisco engineer. The TAC Service Request Tool is located at this URL:
http://www.cisco.com/techsupport/servicerequest
For S1 or S2 service requests or if you do not have Internet access, contact the Cisco TAC by telephone.
(S1 or S2 service requests are those in which your production network is down or severely degraded.)
Cisco engineers are assigned immediately to S1 and S2 service requests to help keep your business
operations running smoothly.
To open a service request by telephone, use one of the following numbers:
Asia-Pacific: +61 2 8446 7411 (Australia: 1 800 805 227)
EMEA: +32 2 704 55 55
USA: 1 800 553-2447
For a complete list of Cisco TAC contacts, go to this URL:
http://www.cisco.com/techsupport/contacts
Preface
Definitions of Service Request Severity
To ensure that all service requests are reported in a standard format, Cisco has established severity
definitions.
Severity 1 (S1)—Your network is “down,” or there is a critical impact to your business operations. You
and Cisco will commit all necessary resources around the clock to resolve the situation.
Severity 2 (S2)—Operation of an existing network is severely degraded, or significant aspects of your
business operation are negatively affected by inadequate performance of Cisco products. You and Cisco
will commit full-time resources during normal business hours to resolve the situation.
Severity 3 (S3)—Operational performance of your network is impaired, but most business operations
remain functional. You and Cisco will commit resources during normal business hours to restore service
to satisfactory levels.
Severity 4 (S4)—You require information or assistance with Cisco product capabilities, installation, or
configuration. There is little or no effect on your business operations.
Obtaining Additional Publications and Information
Information about Cisco products, technologies, and network solutions is available from various online
and printed sources.
• Cisco Marketplace provides a variety of Cisco books, reference guides, documentation, and logo
merchandise. Visit Cisco Marketplace, the company store, at this URL:
http://www.cisco.com/go/marketplace/
xiv
User Guide for Internetwork Performance Monitor
OL-11291-01
Page 15

Preface
Obtaining Additional Publications and Information
• Cisco Press publishes a wide range of general networking, training and certification titles. Both new
and experienced users will benefit from these publications. For current Cisco Press titles and other
information, go to Cisco Press at this URL:
http://www.ciscopress.com
• Pack et magazine is the Cisco Systems technical user magazine for maximizing Internet and
networking investments. Each quarter, Packet delivers coverage of the latest industry trends,
technology breakthroughs, and Cisco products and solutions, as well as network deployment and
troubleshooting tips, configuration examples, customer case studies, certification and training
information, and links to scores of in-depth online resources. You can access Packet magazine at
this URL:
http://www.cisco.com/packet
• iQ Magazine is the quarterly publication from Cisco Systems designed to help growing companies
learn how they can use technology to increase revenue, streamline their business, and expand
services. The publication identifies the challenges facing these companies and the technologies to
help solve them, using real-world case studies and business strategies to help readers make sound
technology investment decisions. You can access iQ Magazine at this URL:
http://www.cisco.com/go/iqmagazine
or view the digital edition at this URL:
http://ciscoiq.texterity.com/ciscoiq/sample/
• Internet Protocol Journal is a quarterly journal published by Cisco Systems for engineering
professionals involved in designing, developing, and operating public and private internets and
intranets. You can access the Internet Protocol Journal at this URL:
http://www.cisco.com/ipj
• Networking products offered by Cisco Systems, as well as customer support services, can be
obtained at this URL:
http://www.cisco.com/en/US/products/index.html
• Networking Professionals Connection is an interactive website for networking professionals to share
questions, suggestions, and information about networking products and technologies with Cisco
experts and other networking professionals. Join a discussion at this URL:
http://www.cisco.com/discuss/networking
• World-class networking training is available from Cisco. You can view current offerings at
this URL:
http://www.cisco.com/en/US/learning/index.html
OL-11291-01
User Guide for Internetwork Performance Monitor
xv
Page 16

Obtaining Additional Publications and Information
Preface
xvi
User Guide for Internetwork Performance Monitor
OL-11291-01
Page 17

Overview of IPM
This chapter provides an overview of Internetwork Performance Monitor (IPM) application. It contains
the following sections:
• What is IPM?
• Key Terms and Concepts
• How Does IPM Work?
• Client/Server Architecture
What is IPM?
IPM is a network management application that allows you to monitor the performance of multi-protocol
networks. IPM measures the latency and availability of IP networks on a hop-by-hop (router-to-router)
basis. It also measures latency between routers and the mainframe in Systems Network Architecture
(SNA) networks, and monitors jitter in networks.
CHAPTER
1
You can use IPM to:
• Troubleshoot problems by checking the network performance between devices.
• Send Simple Network Management Protocol (SNMP) traps and SNA alerts when a user-configured
threshold is exceeded, a connection is lost and reestablished, or a timeout occurs.
• Analyze potential problems before they occur by accumulating statistics, which then can be used to
model and design future network topologies.
• Monitor latency, availability, and errors between two network end points.
• Monitor jitter, packet loss, and errors between two network end points.
• Discover network paths between two network end points, and monitor network performance
statistics on a hop-by-hop basis.
• Provide Web-based access to long-term information to help determine statistical trends.
• Monitor the availability of critical network servers.
• Monitor SNA performance in mainframe environments.
• Establish service-level agreements.
OL-11291-01
User Guide for Internetwork Performance Monitor
1-1
Page 18

Key Terms and Concepts
The IPM/SA Agent monitoring solution is composed of:
1. The IPM server
2. The IPM client application
3. The Service Assurance (SA) Agent feature of the Cisco IOS software
The focus of this document is the IPM network management application, which includes the server and
the client. In some cases, however, it is not possible to fully describe IPM without including information
about the SA Agent feature. Therefore, we have included some information about the Cisco IOS feature.
Information about the SA Agent feature, provided in the latest Cisco IOS software documentation takes
precedence over the information about the SA Agent feature, contained in this document.
Key Terms and Concepts
The key terms and concepts in IPM are:
• Network Performance Statistics—Five key statistics measured by IPM:
–
Latency
Chapter 1 Overview of IPM
–
Availability
–
Jitter
–
Packet Loss
–
Errors
• Source—Originating switch or router running IOS, from which IPM makes network performance
measurements. The source switch or router must be running a version of Cisco IOS software that
supports the SA Agent feature. For detailed information about the supported versions of the Cisco
IOS software, see the “Cisco IOS Software Requirements” section in the Installation Guide for
Internetwork Performance Monitor.
• Targ et —Destination of the network performance measurements. The target can be any
IP-addressable device, an IBM Multiple Virtual Storage (MVS) mainframe that can be reached by
the source router, or an SA Agent-enabled Cisco router. For jitter measurements, the target must be
an SA Agent-enabled Cisco router or switch with RTR responder enabled.
• Operation—Set of parameters used in measuring network performance statistics. The parameters
specify the type of measurement to be performed.
• Collector—Entity defined to measure network performance statistics from a specific source device
to a specific target device. The collector definition includes information about its source, target,
operation, start time, duration, and type.
• Interval—How often, in seconds, the collector on the source router executes the measurement to
and from the target. The value is usually every 60 seconds. The valid range is 10 to 3600 seconds (1
hour). The source router automatically aggregates all samples for a single hour into a single set of
metrics for that hour. IPM retrieves these metrics from the source router once every hour.
• Duration—How long, in days, hours, and minutes, the collector runs and gathers information from
the source router. The default value is forever. The valid range is 1 hour to forever.
• SA Agent Responder—Component embedded in a target Cisco device, running version 12.1 or
later of the Cisco IOS software. It responds to SA Agent request packets from a source running the
SA Agent software, supporting Enhanced UDP measurements, such as jitter.
1-2
User Guide for Internetwork Performance Monitor
OL-11291-01
Page 19

Chapter 1 Overview of IPM
How Does IPM Work?
IPM measures and displays network performance statistics (latency, availability, jitter, packet loss, and
error information) between a source and a target device.
The target can be an IP-addressable device, an IBM MVS mainframe, or an SA Agent-enabled Cisco
router:
• If the target is an IP-addressable device, it can be a network device, a server, or a workstation.
• If the target is an IBM MVS mainframe, it must be running an IPM Virtual Telecommunications
Access Method (VTAM) application called NSPECHO for measuring SNA latency. See the
“Installing NSPECHO to Measure SNA Response Times” chapter of the Installation Guide for
Internetwork Performance Monitor for more information.
• If the target is an SA Agent-enabled, the source must be running version 12.1 or later of the Cisco
IOS software. The IPM application is used to configure the SA Agent in each source device. The
SA Agent measures the performance between the source router and the target device.
The source aggregates all measurements into a single sample value for each network performance
statistic. IPM gathers the data from the source and stores it in the IPM database.
IPM also provides a real-time feature that allows you to display the data without waiting for the one-hour
data collection interval. However, the data displayed in the Real Time window is not stored in the IPM
database.
Additionally, IPM provides an extensive set of reports and graphs for viewing and analyzing the
collected performance metrics. IPM supports both standalone and Web-based clients in a multi-platform
environment.
How Does IPM Work?
Client/Server Architecture
IPM provides central services and database functions on an IPM server, which communicates through a
messaging interface to multiple IPM clients (Figure 1-1). The IPM software consists of server software
and client software components that can be installed on the same workstation or on different
workstations.
OL-11291-01
User Guide for Internetwork Performance Monitor
1-3
Page 20
Client/Server Architecture
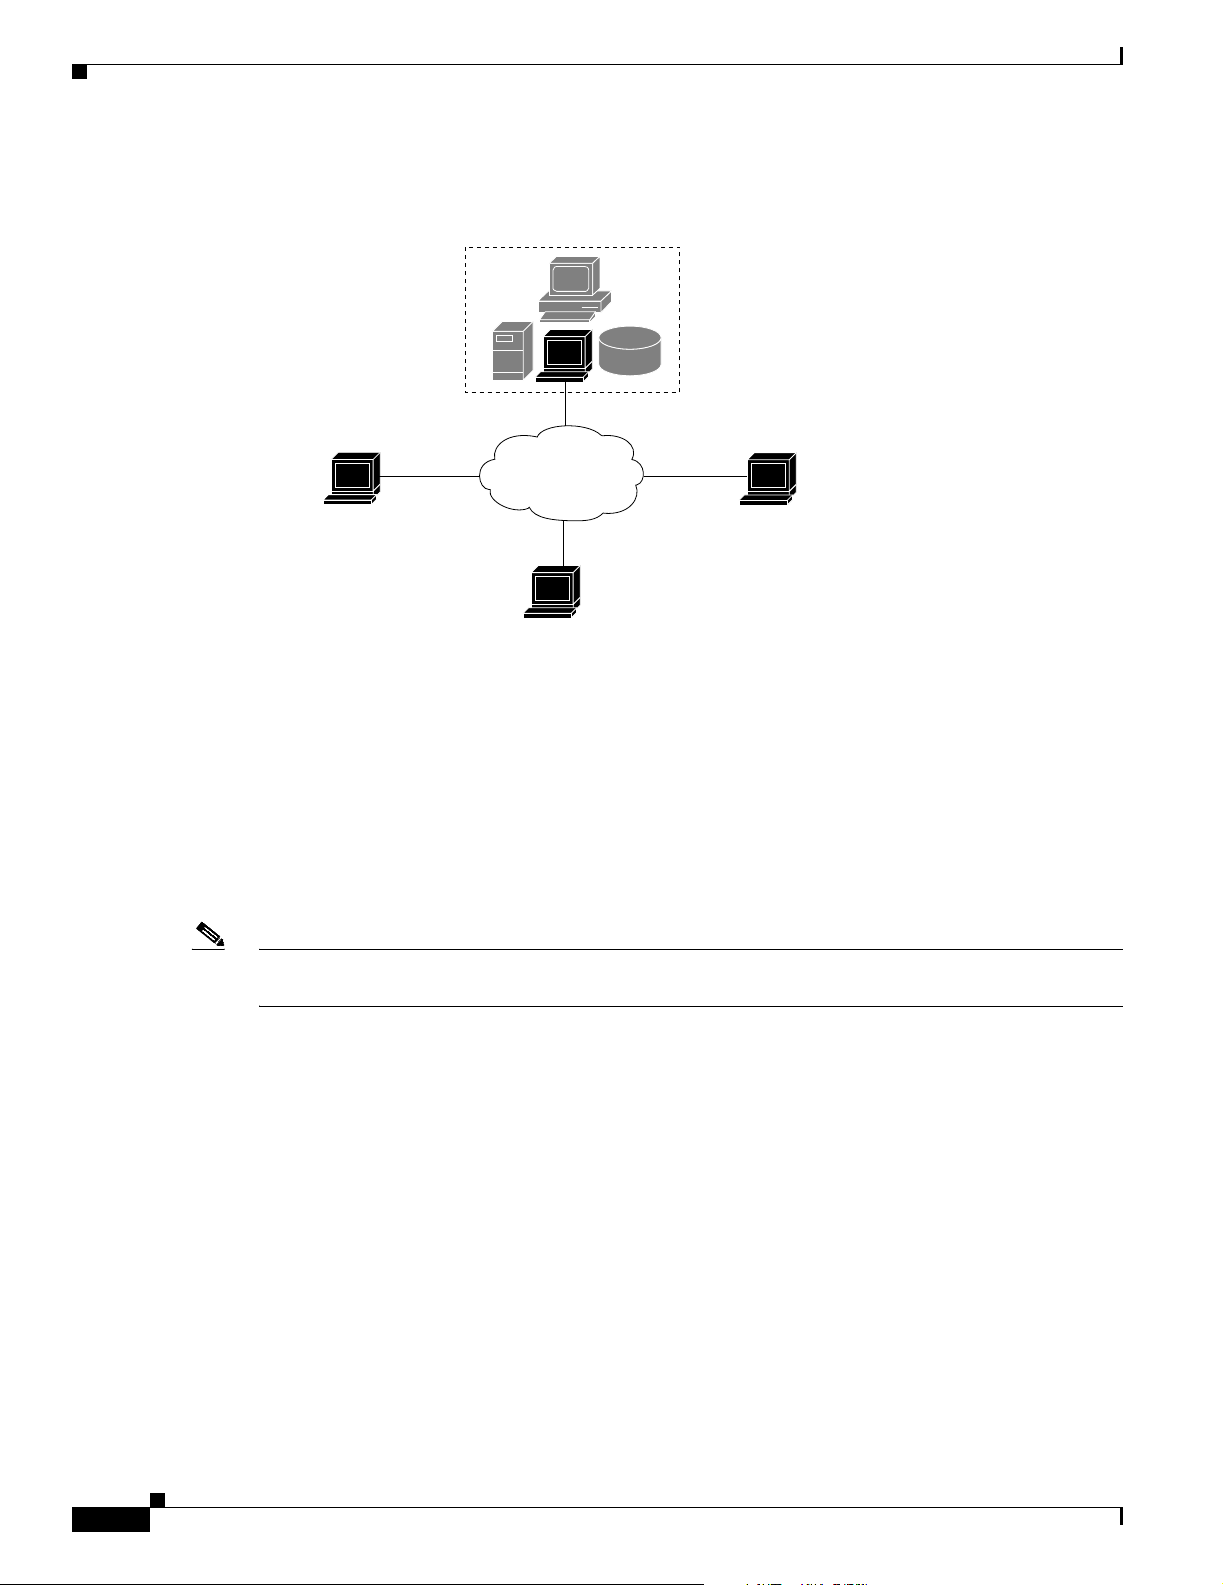
Figure 1-1 IPM Client/Server Architecture
Chapter 1 Overview of IPM
Solaris or Windows 2000 System
(IPM server, client, and database)
IPM client on
Windows 2000 workstation
Network
IPM client on
Solaris workstation
IPM client on
Windows XP workstation
85632
For this release of IPM, the server software runs on Solaris 2.8, Solaris 2.9, and Windows 2000
Professional and Server (with SP3 or SP4), Windows 2000 Advanced Server (with SP3 or SP4),
Windows 2000 Terminal Services Remote Administration Mode (with SP3 or SP4) or Windows 2003.
The client software runs on Solaris 2.8, Solaris 2.9, Windows 2000 Professional and Server (with SP3
and SP4), Windows XP Professional (with SP1a) or Windows 2003 platforms.
The client/server architecture is cross-platform compatible, which allows you to run the client and server
software in mixed operating system environments. For example, you can run the IPM server on a Solaris
workstation and access it from an IPM client running on a Windows workstation.
Note IPM does not support Network Address Translation (NAT) and Port Address Translation (PAT) between
the client and the server.
1-4
The IPM server software consists of a group of functional services that manage the data among the
network, client workstations, and the centralized database.
The IPM server manages the exchange of data between the IPM database and the network devices, such
as the source routers. The IPM process manager launches and manages all of the IPM servers, providing
a robust and reliable launching platform for IPM.
The IPM client integrates with the CiscoWorks homepage.
From a Web browser running on a Solaris 2.8, Solaris 2.9, Windows 2000 Professional and Server (with
SP3 and SP4), Windows XP Professional (with SP1a) or Windows 2003 platforms workstation on the
network, you can:
• Access the source, target, operation, and collector definitions.
• View Web-based reports of the performance metrics.
User Guide for Internetwork Performance Monitor
OL-11291-01
Page 21

Chapter 1 Overview of IPM
• Download/Launch the IPM client.
• View Web-based troubleshooting information.
• Determine the version of IPM that has been installed.
• View seed files.
All the above functions can be launched via the CiscoWorks homepage.
New Features in IPM 2.6
These are the new features in IPM 2.6:
• Support for importing device from Device and Credential Repository — IPM 2.6 provides you the
facility to import devices from the Device and Credential Repository. You can import devices as
Sources, as Target SAA Responders, or as Target IP Devices.
• Differentiated Service Code Point (DSCP) support — In IPM 2.6 users are provided with the feature
of selecting either the IP Precedence settings or DSCP setting.
• Source interface on collector — In the earlier IPM releases, users could not specify a source
interface configuration on an individual collector basis while configuring a collector. IPM 2.6 has
features to overcome this limitation.
• Device Center Integration — In IPM 2.6, the Device Center will be launched for devices in IPM.
The Device Center will be launched irrespective of whether a device is present in Device and
Credential Repository or not.
• Improved Scalability— IPM 2.6 supports 2000 collectors in one single IPM Server.
New Features in IPM 2.6
• SSL Compliance — IPM 2.6 is SSL compliant and enables secure HTTP communication between
the client and server. The IPM web links from the CiscoWorks homepage are SSL-compliant.
OL-11291-01
User Guide for Internetwork Performance Monitor
1-5
Page 22

New Features in IPM 2.6
Chapter 1 Overview of IPM
1-6
User Guide for Internetwork Performance Monitor
OL-11291-01
Page 23

Getting Started With IPM
This chapter provides information about starting the IPM application and configuring a collector to
gather latency data. It includes the following major sections:
Starting IPM
• Starting IPM
• Running Simultaneous IPM Sessions
• Configuring the IPM Components
• Viewing Network Performance Statistics
• Printing IPM Statistics
• Exiting the IPM Client
CHAPTER
2
Since the IPM application is comprised of a server component and a client component, you must start
both components to run the application. If the IPM server and client are installed on the same system,
you can start the IPM server and client using a single command, or you can start them separately.
The following sections provide details for starting the IPM server and client:
• Starting IPM Server on Solaris
• Starting IPM Server on Windows
• Starting IPM Client From the CiscoWorks Homepage
• Starting IPM Standalone Client on Solaris
• Starting IPM Standalone Client on Windows
Starting IPM Server on Solaris
To start the IPM server on a Solaris system, enter:
# cd /opt/CSCOipm/bin
# ./ipm start
To enter the ipm start command, you must be logged in as the root user, or your login must have
administrator privileges.
OL-11291-01
User Guide for Internetwork Performance Monitor
2-1
Page 24

Starting IPM Client
Starting IPM Server on Windows
To start the IPM server on a Windows system, enter:
cd c:\Program Files\Internetwork Performance Monitor\Server\bin
ipm start
To enter the ipm start command, you must be logged in as the administrator, or your login must have
administrator privileges.
Starting IPM Client
You can access the IPM Client in two ways: As a web client from the CiscoWorks homepage, or as a
standalone client.
This section describes:
• Starting IPM Client From the CiscoWorks Homepage
• Starting IPM as a Standalone Client
Chapter 2 Getting Started With IPM
Starting IPM Client From the CiscoWorks Homepage
You can start IPM from an Internet Explorer or Netscape Navigator Web browser if:
• You are running Solaris 2.8, Solaris 2.9, Windows XP Professional and Server (with SP3, SP4),
Windows 2000 Advanced Server (with SP3, SP4)
Windows 2000 Terminal Services Remote Administration mode (with SP3, SP4) or Windows 2003
Server (Standard Edition and Enterprise Edition).
• You have installed the Java plug-in 1.4.2-04. (For information about installing the Java plug-in, see
the “Installing IPM on Windows” chapter of the Installation Guide for Internetwork Performance
Monitor.)
To start the IPM client from the CiscoWorks homepage:
Step 1 Make sure the IPM server to which you are connecting is currently running.
Step 2 From your browser, go to the URL where the IPM application is installed (for example,
http://youripmserver:1741).
The homepage for the IPM Client Software appears (Figure 2-1).
2-2
User Guide for Internetwork Performance Monitor
OL-11291-01
Page 25

Chapter 2 Getting Started With IPM
Figure 2-1 IPM CiscoWorks Homepage
Starting IPM Client
If you do not have this URL, contact the system administrator who installed the IPM server software.
Step 3 Select Client > Web Client.
The Java applet loads and the IPM Main Window is displayed.
The IPM Main Window is the starting point from where you can carry out the various IPM operations.
In addition to and accessing the IPM Main Window from the CiscoWorks homepage, you can also launch
the IPM Main Window from a standalone Solaris or a Windows client.
For details on starting IPM on Solaris, see Starting IPM Standalone Client on Solaris, page 2-3. For
details on starting IPM on Windows, see Starting IPM Standalone Client on Windows, page 2-6.
Starting IPM as a Standalone Client
This section describes the following:
• Starting IPM Standalone Client on Solaris
• Starting IPM Standalone Client on Windows
Starting IPM Standalone Client on Solaris
To start only the IPM client on a Solaris system, enter:
# cd /opt/CSCOipm/bin
# ./ipm start client
To start the IPM server and client on a Solaris system, enter:
# cd /opt/CSCOipm/bin
# ./ipm
OL-11291-01
User Guide for Internetwork Performance Monitor
2-3
Page 26

Starting IPM Client
Chapter 2 Getting Started With IPM
The default directory for installing IPM is /opt. If you installed IPM in a different directory, you must
specify that directory instead of /opt.
If you installed the IPM client and IPM server on different Solaris systems, you must enter the ipm start
command from the /opt/CSCOipmClient/bin directory:
# cd /opt/CSCOipmClient/bin
# ./ipm start client
To start the IPM client and connect to an IPM server other than the default server, enter:
# cd /opt/CSCOipmClient/bin
# ./ipm start client
where server_name is the Solaris or Windows system on which the IPM server is running.
To protect the device credentials, IPM does not allow you to disable the administrative password. IPM
will prompt you to enter the password at the time of launching the standalone client.
When the IPM client starts, it displays the IPM Main Window (Figure 2-2). The name of the system on
which the IPM server is running, appears in the title bar of the IPM Main Window.
Figure 2-2 IPM Main Window
server_name
2-4
You can also access the IPM Main Window from the CiscoWorks homepage. For more details, see
Starting IPM Client From the CiscoWorks Homepage, page 2-2. Alternatively, you can click View >
CiscoWorks Home Page to access the CiscoWorks homepage.
When you start IPM for the first time, the IPM Main Window contains no collectors. As you configure
collectors, they appear in this window. Each collector is a combination of a configured source, a target,
and an operation. For each collector, you can specify parameters for gathering statistics and scheduling.
User Guide for Internetwork Performance Monitor
OL-11291-01
Page 27

Chapter 2 Getting Started With IPM
Enabling the IPM Password on Solaris
To enable IPM passwords on Solaris:
Step 1 Log in as the root user.
Step 2 Enter:
# cd /opt/CSCOipm/bin
# ./ipm password
Note The default directory for installing IPM is /opt. If you installed IPM in a different directory, you
must specify that directory instead of /opt.
IPM prompts you to enter a password.
Step 3 Enter a password and press Enter.
The password is case sensitive and should begin with an alphabet. You can enter only a maximum of 15
characters and you can enter only alphanumeric characters.
IPM prompts you to confirm the password.
Step 4 Enter the password again and press Enter.
IPM displays:
IPM Administrative Password is Changed.
Use IPM Administrative Password to access standalone IPM Client and CLI commands
The administrative password is required for launching the IPM standalone client.
Starting IPM Client
Note To protect device credentials IPM does not allow you to disable the administrative password. During
IPM installation, you will be prompted to enter the administrative password. It is important that you set
the administrative password.
OL-11291-01
User Guide for Internetwork Performance Monitor
2-5
Page 28

Starting IPM Client
Starting IPM Standalone Client on Windows
When you install the IPM client on a Windows 2000 Professional and Server (with SP3 and SP4),
Windows 2000 Advanced Server (with SP3, SP4), Windows XP Pro (SP1a) or Windows 2000 (WS2K3)
system, the installation program adds two icons to your desktop: one icon for connecting to the IPM
server you specified during installation, and one icon for connecting to any IPM server.
To start the IPM client on a Windows system and connect to the default IPM server:
Step 1 Make sure the IPM server to which you are connecting is currently running.
Step 2 Double-click on the IPM client icon on your desktop.
The IPM client starts and displays the IPM Main Window (Figure 2-2).
You can also access the IPM Main Window from the CiscoWorks homepage. For more details, see
Starting IPM Client From the CiscoWorks Homepage, page 2-2. Alternatively, you can click View >
CiscoWorks Home Page to access the CiscoWorks homepage.
To start the IPM client on a Windows system and connect to any IPM server:
Chapter 2 Getting Started With IPM
Step 1 Make sure the IPM server to which you are connecting is currently running.
Step 2 Double-click on the IPM Any Server icon on your desktop.
A prompt appears asking you for the name of the IPM server to which you want to connect.
Step 3 Enter the IPM server name and click OK.
The IPM client starts and displays the IPM Main Window (Figure 2-2)
Starting IPM Client from the Windows Command Prompt
To start the IPM server and client from the command prompt on a Windows system, enter:
cd c:\Program Files\Internetwork Performance Monitor\Server\bin
ipm
The default directory for installing IPM is C:\Program Files\Internetwork Performance Monitor\. If you
installed IPM in a different directory, you must specify that directory instead of C:\Program
Files\Internetwork Performance Monitor\.
To start only the IPM client on a Windows system, enter:
cd c:\Program Files\Internetwork Performance Monitor\Server\bin
ipm start client
If you installed the IPM client and IPM server on different Windows systems, you must enter the ipm
start command from the c:\Program Files\Internetwork Performance Monitor\client\bin directory:
cd c:\Program Files\Internetwork Performance Monitor\client\bin
ipm start client
2-6
User Guide for Internetwork Performance Monitor
OL-11291-01
Page 29

Chapter 2 Getting Started With IPM
To start the IPM client and connect to an IPM server other than the default server, enter:
cd c:\Program Files\Internetwork Performance Monitor\client\bin
ipm start client
server_name
where server_name is the Solaris or Windows system on which the IPM server is running.
Note To protect IPM device credentials, IPM does not allow you to disable the administrative password. IPM
will prompt you to enter the password when you launch the client.
When the IPM client starts, it displays the IPM Main Window (Figure 2-2). The name of the system on
which the IPM server is running appears in the title bar of the IPM Main Window.
When you start IPM for the first time, the IPM Main Window contains no collectors. As you configure
collectors, they are displayed in the window. Each collector is a combination of a configured source, a
target, and an operation. For each collector, you can specify parameters for gathering statistics and
scheduling.
Enabling the IPM Password on Windows
To enable an IPM password on Windows:
Starting IPM Client
Step 1 Log in as the administrator.
Step 2 Enter:
cd c:\Program Files\Internetwork Performance Monitor\Server\bin
ipm password
The default directory for installing IPM is c:\Program Files\Internetwork Performance Monitor. If you
installed IPM in a different directory, specify that directory instead of c:\Program Files\Internetwork
Performance Monitor.
IPM prompts you to enter a password.
Step 3 Enter a password and press Enter.
The password is case sensitive and should begin with an alphabet. You can enter only a maximum of 15
characters and you can enter only alphanumeric characters.
IPM prompts you to confirm the password.
Step 4 Enter the password again and press Enter.
IPM displays:
IPM Administrative Password is Changed.
Use IPM Administrative Password to access standalone IPM Client and CLI commands
The Administrative password is required for launching the IPM standalone Client.
Note To protect device credentials, IPM does not allow you to disable the administrative password. During
IPM installation, you will be prompted to enter the administrative password. It is important that you set
the administrative password.
OL-11291-01
User Guide for Internetwork Performance Monitor
2-7
Page 30

Running Simultaneous IPM Sessions
Running Simultaneous IPM Sessions
IPM allows you to run multiple sessions of the IPM client simultaneously. Central services and database
functions are provided on an IPM server that communicates to multiple IPM clients. You can install the
IPM client software on the same system as the IPM server, or on a different system on the same network
as the IPM server.
Running more than one IPM client on the same workstation can degrade the workstation’s performance.
Configuring the IPM Components
To collect network performance metrics using IPM, you must define a collector in a source router. A
collector is a definition of a source router, a target device, an operation, and a collector schedule.
To define a collector, complete the following tasks:
• Defining a Source Device
• Defining a Target
Chapter 2 Getting Started With IPM
• Defining a Collector
Defining a Source Device
IPM source devices are the devices from which packets are sent to measure and store statistical data,
including network latency, jitter, availability, packet loss, and errors. Each source device must contain
the Cisco IOS software SA Agent feature.
The types of operations you can use are determined by the version of the Cisco IOS software running on
the source device. IPM automatically checks the Cisco IOS software version on the device and limits the
creation of operations to those supported by the source device.
For information about the recommended versions of Cisco IOS software to use with IPM, see the “Cisco
IOS Software Requirements” section of the Installation Guide for Internetwork Performance Monitor.
To define a new source router:
Step 1 Verify that the SNMP read community and write community strings are configured properly on the
router.
If you want to receive traps at your network management system (NMS), verify that the router is
configured to send SA Agent-generated traps to your NMS.
For information about trap configuration on the source router, see the “Configuring Your Routers to Send
SA Agent-Related Traps” section in the “Preparing to Install” chapter of the Installation Guide for
Internetwork Performance Monitor.
Step 2 From the IPM Main Window (Figure 2-2), select Edit > Configuration.
The Configuration window (Figure 2-3) appears. By default, Sources is selected in the navigation pane
and the Source Configuration window appears within the Configuration window.
2-8
User Guide for Internetwork Performance Monitor
OL-11291-01
Page 31

Chapter 2 Getting Started With IPM
Figure 2-3 Configuration Window—Source Configuration
Configuring the IPM Components
Step 3
In the Hostname or IP Address field, enter the host name or IP address of the device to use as the source
for network performance measurements. This host name can be from 1 to 64 characters in length.
Step 4 In the Read Community field, enter the SNMP community name for read access to the information
maintained by the SNMP agent on the source device. This value can be from 1 to 255 characters in
length.
Step 5 In the Write Community field, enter the SNMP community name for write access to the information
maintained by the SNMP agent on the source device. This value can be from 1 to 255 characters in
length.
Step 6 In the Alias Name field, enter a name to assign to the source router. By default, this field matches the
Hostname or IP Address field, but you can modify the name (for example, to use as an alias). In the
Description field, you can enter a brief description of the source router.
Step 7 Click Add.
IPM attempts to locate the source and determine whether or not it is SNMP-enabled with the correct
Read and Write community string. If the router is successfully located, IPM adds it to the IPM database.
If IPM cannot reach the router, IPM displays an error message.
Note If you specify an IP address instead of a host name, and that IP address cannot be resolved by
standard address resolution techniques, then IPM assumes that the IP address is valid and does
not resolve to a host name.
Step 8 Click OK to close the Configuration window and return to the IPM Main Window.
OL-11291-01
User Guide for Internetwork Performance Monitor
2-9
Page 32

Configuring the IPM Components
If you must add a large number of source routers to IPM, you can use the Source Configuration window
to add them one by one, but it is more efficient to use a seed file. For information about using a seed file
to add source routers to IPM, see the “Adding Components Using Seed Files” section on page 4-16. For
information about viewing or deleting source routers, see the “Working With Source Devices” section
on page 4-1.
Defining a Target
IPM targets are destination devices for which you want to gather data. A target can be any IP-addressable
device, an SA Agent Responder, or an SNA host.
To define a device as a target:
Step 1 Select Edit > Configuration from the IPM Main Window (Figure 2-2).
The Configuration window (Figure 2-3) appears.
Step 2 Click Targ ets .
The Target Configuration window(Figure 2-4) appears within the Configuration window.
Chapter 2 Getting Started With IPM
Figure 2-4 Target Configuration Window
2-10
User Guide for Internetwork Performance Monitor
OL-11291-01
Page 33

Chapter 2 Getting Started With IPM
Step 3 In the Target Type field, select the protocol type to be used with this target. The possible values are:
• IP—Any IP-addressable device. Requires a destination IP address or host name.
• Cisco SAA Responder—Component embedded in a target Cisco device running version 12.1 or later
of the Cisco IOS software. Its function is to respond to SA Agent request packets from a source
router running the SA Agent software.
This target type is required for Enhanced UDP operations measuring jitter, or if the target uses the
SA Agent (to avoid potential connection problems).
You must enable the SA Agent Responder at the router using the rtr responder configuration
command.
• SNA—SNA LU Type 0 or Type 2 connection to Cisco’s NSPECHO mainframe host application, or
SNA SCCP-LU Native Echo. Requires the PU name defined for the SNA PU connection to VTAM.
NSPECHO must be installed on the VTAM mainframe to be used as the target. The NSPECHO
application is provided on the IPM product CD. For information about installing NSPECHO, see the
“Installing NSPECHO to Measure SNA Response Times” chapter of the Installation Guide for
Internetwork Performance Monitor.
Step 4 Based on the protocol type you selected, take one of the following actions:
Configuring the IPM Components
• If you selected IP, enter the host name or IP address of the target device in the Hostname or IP
Address field.
• If you selected Cisco SAA Responder, enter the host name or IP address of the target device in the
Hostname or IP Address field. In the Read Community field, enter the SNMP community name for
read access to the information maintained by the SNMP agent on the target device. This is an
optional field. If you enter the Read Community String, IPM will verify the SAA responder status
on the target device.
• If you selected SNA, enter the SNA host name of the target device in the PU Name field.
Step 5 In the Alias Name field, enter a name to assign to the target. By default, this field matches the Hostname,
IP Address, or PU Name field, but you can modify the name (for example, to use as an alias). In the
Description field, you can enter a brief description of the target.
Step 6 Click Add.
IPM adds the newly defined target to the IPM database.
If you specify an IP address instead of a host name, and that IP address cannot be resolved by standard
address resolution techniques, then IPM assumes that the IP address is valid and does not resolve to a
host name.
Step 7 Click OK to close the Configuration window and return to the IPM Main Window.
If you must add a large number of targets to IPM, you can use the Target Configuration window to add
them one-by-one, but it is more efficient to use a seed file.
OL-11291-01
For information about using a seed file to add targets to IPM, see t Adding Components Using Seed Files.
For information about viewing or deleting targets, see Working With Target Devices.
User Guide for Internetwork Performance Monitor
2-11
Page 34

Configuring the IPM Components
Defining a Collector
Defining a new collector involves selecting a source, a target, an operation, and a collector schedule.
IPM configures collectors on the source device.
There are two modes in which IPM configures a collector:
• Mode 1: Collector is configured on the device without specifying which IP address to be filled in as
source IP address. In this case, SAA fills in the source IP address according to routing table based
on the IP address of the destination. This is the default mode.
• Mode 2: Collector is configured on the device specifying which IP address needs to be filled in as
source IP address. This IP address is the IP address of device known to IPM.
You can set the desired mode by modifying the configuration parameter
IPM_USE_MANAGED_SRC_INTF_ADDR in the ipm.env configuration file. If the value of this
variable is ‘0’, IPM works in mode1. If the value is 1, IPM works in mode 2.
In addition to the above configuration modes, you can also specify the IP address of the interface on
source device to which packets have to be returned from the destination device to source device.
When IP packets are forwarded to the destination device, the SAA fills in the source IP address and the
destination address in the packet. The source address is the IP address of one of the source device
interfaces and it determines the interface to which the packets are returned from the destination.
For information about setting the source interface address as the managed interface address, see
Managed Source Interface Settings.
Defining a collector involves selecting a source router, a target, an operation, and a collector schedule.
Chapter 2 Getting Started With IPM
To define a new collector:
Step 1 From the IPM Main Window (Figure 2-2), select Edit > Configuration.
The Configuration Window (Figure 2-3) appears.
Step 2 Click Collectors.
The Collector Configuration window (Figure 2-5) appears within the Configuration window.
2-12
User Guide for Internetwork Performance Monitor
OL-11291-01
Page 35

Chapter 2 Getting Started With IPM
Figure 2-5 Collector Configuration Window
Configuring the IPM Components
Step 3
In the Name field, type a name to assign to the collector. In the Description field, you can enter a brief
description of the collector.
Though the Name field in the Collector Settings dialog box allows you to enter more than 15 characters,
the trap PDUs displays only the first 15 characters. The IPM database, however, will contain the
complete collector name you have entered.
Step 4 In the Collector Type field:
• Select Statistical to gather data and store it in the IPM database for future analysis. This is the
default setting.
• Select Monitored to monitor for threshold violations and view data in real-time, but network
performance data is not stored in the IPM database.
Step 5 Do one of the following tasks to define the schedule for the collector:
• To configure and start the collector at a later time, enable the On Demand option and go to Step 10.
• To specify when the collector starts, click Set Date. The Set Date Range window is displayed
(Figure 2-6). By default, the collector schedule is set to start now and run forever.
OL-11291-01
User Guide for Internetwork Performance Monitor
2-13
Page 36

Configuring the IPM Components
Figure 2-6 Set Date Range Window
Step 6
Specify a start date for the collector. The options are:
• Now—Starts the collector immediately after it is configured. This is the default setting.
Chapter 2 Getting Started With IPM
39286
• On Date—Starts the collector at the specified date and time. If you select this option, you must
specify the time based on a 24-hour clock, specify the year in the format YYYY, select the month
from the month list, and select the date from the calendar. The default setting for On Date is the
current date and time when the collector is being defined.
If the date selected is in the future, then the collector’s status in the
IPM Main Window is Schedule Pending. At the scheduled start time, IPM configures the collector in the
router and the status is reflected in the
IPM Main Window.
Step 7 Specify an end date for the collector. The options are:
• Forever—Allows the collector to run continuously until you stop it by selecting Edit > Stop from
the IPM Main Menu.
• Duration—Stops the collector after the specified length of time has expired. You can specify the
duration in any combination of days, hours, and minutes.
• On Date—Stops the collector at the specified date and time. If you select this option, you must
specify the time based on a 24-hour clock, specify the year in the format YYYY, select the month
from the month list, and select the date from the calendar. The default end date is exactly one day
from the current date and time.
Step 8 Click OK.
The specified start time and end time are defined for the collector.
Step 9 From the Sources list, select the router to designate as the source router for initiating test packets. If you
already know the name of the router, start typing the name in the Search field.
The cursor moves to the matching router in the Sources list.
2-14
User Guide for Internetwork Performance Monitor
OL-11291-01
Page 37

Chapter 2 Getting Started With IPM
Step 10 In the Source Interface field, enter a valid IP address of the source device interface. This is the IP address
of the source device interface to which the packets are returned from the destination
The Source Interface field is an optional field. If you do not specify an IP address, IPM configures
collector based on the properties specified in the ipm.env file.
Step 11 From the Targets list, select the device to designate as the target. If you already know the name of the
target, start typing the name in the Search field.
The cursor moves to the matching target in the Targets list.
If you select a DNS, DHCP, or HTTP operation, the Targets list is disabled because these operations do
not use targets.
Step 12 From the Operations list, select the operation to use for this collector. If you already know the name of
the operation, start typing the name in the Search field
The cursor moves to the matching operation in the Operations list.
When you install IPM, a group of predefined operations is provided. The predefined operations are
described in Table 2-1.
Table 2-1 Predefined Operations
Configuring the IPM Components
Operation Description
DefaultDHCP Measures end-to-end latency for acquiring a new DHCP lease.
DefaultDLSw Measures end-to-end latency in a network which uses DLSw to route
SNA traffic over an IP network. Request size is set to 64 and Response
Payload is set to 64.
DefaultDNS Measures end-to-end latency for DNS lookups. DNS Name Server is
set to the IP address of the DNS server configured on the system on
which the IPM server is running. The DNS Lookup Name is set to the
name of the host to look up for the DNS request.
When you create a non-default operation, it is mandatory to specify a
DNS Name Server.
DefaultIpEcho Measures end-to-end latency in an IP network. Protocol is set to IP,
Packet Priority is set to 0 (no priority), and Request Payload is set to
64 bytes.
DefaultIpPathEcho Measures hop-by-hop latency in an IP network. Packet Priority is set
to 0 (no priority), Request Payload is set to 64 bytes, Maximum Paths
is set to 5, Maximum Hops is set to 15, and sample interval is set to
180 seconds.
DefaultNNTP Measures the time to perform a TCP connect operation directed at the
selected target on the standard Network News Transport Protocol
(NNTP) port 119. Packet Priority is set to 0 (no priority) and Target
Port is set to 119.
DefaultPOP3 Measures the time to perform a TCP connect operation directed at the
selected target on the standard Post Office Protocol v.3 (POP3) port
110. Packet Priority is set to 0 (no priority) and Target Port is set to
110.
OL-11291-01
User Guide for Internetwork Performance Monitor
2-15
Page 38

Configuring the IPM Components
Table 2-1 Predefined Operations (continued)
Operation Description
DefaultSMTP Measures the time to perform a TCP connect operation directed at the
DefaultSnaLu0Echo Measures end-to-end latency in an SNA network using LU0. Protocol
DefaultSnaLu2Echo Measures end-to-end latency in an SNA network using LU2. Protocol
DefaultSnaSSCPEcho Measures end-to-end latency in an SNA network using SSCP protocol.
DefaultTelnet Measures the time to perform a TCP connect operation directed at the
DefaultUDPEcho Measures end-to-end latency for a UDP datagram. Packet Priority is
DefaultVideo Measures latency and jitter for Video traffic. Packet Priority is set to
DefaultVPN Measures latency and jitter for VPN traffic. Packet Priority is set to
Default160ByteVoice Measures latency and jitter for Voice over IP traffic. Packet Priority is
Default60ByteVoice Measures latency and jitter for Voice over IP traffic. Packet Priority is
Chapter 2 Getting Started With IPM
selected target on the standard Simple Mail Transfer Protocol (SMTP)
port 25. Packet Priority is set to 0 (no priority) and Target Port is set to
25.
is set to SNA LU0, Mode Name is set to INTERACT, and Response
Payload is set to 64 bytes.
is set to SNA LU2, Mode Name is set to D4A32782, and Response
Payload is set to 64 bytes.
Protocol is set to SNA SSCP.
selected target on the standard Telnet port 23. Packet Priority is set to
0 (no priority) and Target Port is set to 23.
set to 0 (no priority), Request Payload is set to 64 bytes, and Target
Port is set to 7.
0 (no priority), Request Payload is set to 1024 bytes, Packet Interval is
set to 20 milliseconds, Number of Packets is set to 20, and Target Port
is set to 50505.
0 (no priority), Request Payload is set to 1024 bytes, Packet Interval is
set to 20 milliseconds, Number of Packets is set to 20, and Target Port
is set to 2000.
set to 5, Request Payload is set to 160 bytes, Packet Interval is set to
20 milliseconds, Number of Packets is set to 10, and Target Port is set
to 16400.
set to 5, Request Payload is set to 60 bytes, Packet Interval is set to
20 milliseconds, Number of Packets is set to 10, and Target Port is set
to 16400.
2-16
Note that you can define one or more new operations to fit your needs. For information about defining,
modifying, or deleting operations, see Working With Operations.
Note Although you cannot modify the default operations, you can use them as templates for creating
your own operations.
IPM does not provide a predefined HTTP or FTP operation. Therefore, before you create an HTTP
collector or a FTP collector, you must first create the respective HTTP or FTP operation.
User Guide for Internetwork Performance Monitor
OL-11291-01
Page 39

Chapter 2 Getting Started With IPM
Step 13 Click Add.
IPM adds the newly defined collector to the IPM database.If you selected a DNS operation, the Extra
DNS Settings window appears (Figure 2-7).
Step 14 Enter a DNS Lookup Name (the name of the host to look up for the DNS request) and click OK.
Figure 2-7 Extra DNS Settings Window
Viewing Network Performance Statistics
Step 15
Click Close to close the Configuration window and return to the
IPM Main Window.
The newly defined collector has been added to the list of collectors in the
IPM Main Window.
If you must add a large number of collectors to IPM, you can use the Collector Configuration window
to add them one-by-one, but it is more efficient to use a seed file.
For information about using a seed file to add collectors to IPM, see Adding Components Using Seed
Files. For information about viewing or deleting collectors, see Working With Collectors.
Viewing Network Performance Statistics
As your collectors begin to gather network performance statistics and store the information in the IPM
database, you can view the resulting data.
IPM provides two methods for reviewing network performance statistics:
• Viewing Network Performance Statistics in Real Time, page 2-18
• Viewing Historical Network Performance Statistics, page 2-20
OL-11291-01
User Guide for Internetwork Performance Monitor
2-17
Page 40

Viewing Network Performance Statistics
Viewing Network Performance Statistics in Real Time
The Real Time Statistics window allows you to view statistics for an active collector as the data is being
collected. This data appears only in real time, it is not stored in the IPM database.
The Real Time Statistics window displays up to 1000 points of data; the most recent 1000 points are
always displayed. That is, when a real time graph reaches 1000 points of data, as the most recent points
are added to the right side of the graph the earliest points disappear from the left side. If you watch the
last data point at the far right of the graph, you can see it change at the end of a sampling interval.
For example, if your sampling interval is once every 60 seconds, in less than a day the real time graph
will have reached 1000 points of data. After that time, you can see the last data point on the right of the
graph change every 60 seconds.
To view statistics in real time:
Step 1 From the IPM Main Window (Figure 2-2), select the collector to be viewed.
Step 2 Select View > Realtime Statistics.
The Real Time Statistics window (either Figure 2-8 or Figure 2-9) appears.
Chapter 2 Getting Started With IPM
Figure 2-8 Real Time Statistics Window
2-18
39287
User Guide for Internetwork Performance Monitor
OL-11291-01
Page 41

Chapter 2 Getting Started With IPM
Figure 2-9 Jitter Real Time Statistics Window
Viewing Network Performance Statistics
39288
Statistics appear as soon as the frequency interval elapses. Data points are added to the graph for each
interval that the statistics are measured for the selected collector.
Table 2-2 describes the actions you can perform in the Real Time Statistics window.
Table 2-2 Real Time Statistics Window Options
Action Key Combination
Zoom in on a specific point
Press Shift and click a point on the graph.
on the graph.
Zoom in on a specific area
of the graph.
Press Shift and drag and click on an area of the
graph. Release the mouse button and the graph
zooms in on the area you selected.
Zoom out to the graph’s
Click anywhere on the graph.
original view.
Shift the x-axis or y-axis of
the graph through the data.
Press Ctrl and click a point on the graph, then drag
left or right to go backward or forward, or drag up
or down to shift the x-axis of the graph.
OL-11291-01
User Guide for Internetwork Performance Monitor
2-19
Page 42

Viewing Network Performance Statistics
Viewing Historical Network Performance Statistics
To view statistics gathered over an historical monitoring period:
Step 1 From the IPM Main Window (Figure 2-2), select one or more collectors (up to 10) to be viewed.
Step 2 Select View > Statistics.
The Statistics Data Filter window (Figure 2-10) appears.
Figure 2-10 Statistics Data Filter Window
Chapter 2 Getting Started With IPM
Step 3
In this window, specify the time period for which you want to view statistics.
You can view statistics for all or part of the time that the data was collected. The window displays the
currently defined start date and end date.
Step 4 To change the date range, click the Calendar icon.
The Set Date Range window appears (Figure 2-6).
Step 5 Specify a new start date, a new end date, or both, and click OK.
The start time and end time you specified for the collector for viewing statistics appears.
For more information about changing the date range, see the Defining a Collector.
To make graphs easier to read, IPM provides optional popup labels for historical graphs. (Popup labels
are always on for real-time graphs.)
When you turn on popup labels for a graph, you can roll the cursor over a collection point on the graph
and see a popup label containing key information for that point, such as the exact latency value.
To turn on popup labels for a graph, select the Show Popup Labels checkbox. To turn off popup labels,
clear the checkbox.
2-20
User Guide for Internetwork Performance Monitor
OL-11291-01
Page 43

Chapter 2 Getting Started With IPM
Step 6 In the Statistical Format field, specify the initial increment for the granularity for displaying the
statistical graphs. Choose one of the available options: Hourly, Daily, Weekly, or Monthly.
For Weekly statistical graph, the start time is always the beginning of the Week i.e. Sunday.
For Monthly statistical graph, the start time is always the beginning of the Month.
Consider a Collector started on 15 January 2004. The Monthly statistical graph for that Collector would
have a time plot on 1 January 2004 (the start date of that month) and the Weekly statistical graph would
have a time plot on 13 January 2004 (the start date of that week)
By default, IPM selects the option that best matches the amount of data currently in the IPM database
for the selected collector. For additional information about how IPM gathers and calculates hourly, daily,
weekly, and monthly data, see Setting IPM Database Preferences.
Step 7 Click OK.
The Historical Statistics window (Figure 2-11, Figure 2-12, or Figure 2-13) appears.
Figure 2-11 Historical Statistics Window—Echo Collector
Viewing Network Performance Statistics
OL-11291-01
User Guide for Internetwork Performance Monitor
2-21
Page 44

Viewing Network Performance Statistics
Figure 2-12 Historical Statistics Window—Path Echo Collector
Chapter 2 Getting Started With IPM
2-22
User Guide for Internetwork Performance Monitor
OL-11291-01
Page 45

Chapter 2 Getting Started With IPM
Figure 2-13 Historical Statistics Window—Enhanced UDP Collector
Viewing Network Performance Statistics
If you selected more than one collector, their statistics appear in a single graph in the Historical
Statistics—Multi-Collector Graph window (Figure 2-14). Multi-collector graphing is not available for
Enhanced UDP, HTTP, or Path Echo collectors.
OL-11291-01
User Guide for Internetwork Performance Monitor
2-23
Page 46

Viewing Network Performance Statistics
Figure 2-14 Historical Statistics Window—Multi-Collector Graph
Chapter 2 Getting Started With IPM
Table 2-3 describes the tasks you can perform in the Historical Statistics window.
Table 2-3 Historical Statistics Window Options
To Action
Zoom in on a specific point
Press Shift and click a point on the graph.
on the graph.
Zoom in on a specific area
of the graph.
Zoom out to the graph’s
Press Shift and drag and click on an area of the graph. Release the mouse
button and the graph zooms in on the area you selected.
Click anywhere on the graph.
original view.
Shift the x-axis or y-axis of
the graph through the data.
Press Ctrl and click a point on the graph, then drag left or right to go
backward or forward, or drag up or down to shift the x-axis of the graph.
Print or save the graph. Select File > Print to print or save the graph.
For more information, see Printing IPM Statistics.
39290
2-24
User Guide for Internetwork Performance Monitor
OL-11291-01
Page 47

Chapter 2 Getting Started With IPM
Table 2-3 Historical Statistics Window Options (continued)
To Action
Request an immediate poll
of statistics
(single-collector graphs
only).
Change settings in the
Statistics Data Filter
window.
Display statistics for the
next time period.
Display statistics for the
previous time period.
Viewing Network Performance Statistics
Select View > Demand Poll. IPM typically polls a collector once per
hour.
If you are between polls and do not want to wait until the next polling
period, you can use the Demand Poll function to request an immediate
poll of the collector. The graphs are updated with the new statistics.
If for some reason the poll fails and new statistics are not collected, the
following error message appears.
Demand Poll Failed, make sure router is available.
Select View > Filter Data to change the time period and granularity of the
graphs.
Select View > Next Range. The graphs are updated to reflect the new
range.
For more information, see Understanding Next Range.
Select View > Prev Range. The graphs are updated to reflect the new
range.
Hide the legend bar at the
bottom of each graph.
Show the legend bar at the
bottom of each graph.
Show combined statistics in
one graph for all paths in
the path list, or all hops in a
selected path (Path Echo
collectors only).
Show separate statistics in
one or more graphs for all
paths in the path list, or all
hops in a selected path
(Path Echo collectors only).
For more information, see Understanding Previous Range.
Select View > Hide Legend.
Select View > Show Legend.
Select Path List, or select a specific path, then select
View > Show Combined.
A single graph is displayed showing combined statistics for all the paths
in the path list (up to 128 paths), or all the hops in the hop list (up to 25
hops) for the selected path. The combined graph shows only average
statistics.
If a path has no data available, IPM displays (No Data) for that path in
the right side of the window.
If a path never reaches its target, it is an invalid path, and IPM displays
(No Target) for that path in the right side of the window.
Select Path List, or select a specific path, then select
View > Show Separate. Multiple graphs are displayed, one for each path
in the path list, or hop in the hop list for the selected path. Each graph
shows minimum, maximum, and average statistics.
If a path has no data available, IPM displays No Data Available for that
path instead of a graph.
OL-11291-01
User Guide for Internetwork Performance Monitor
2-25
Page 48

Viewing Network Performance Statistics
Understanding Next Range
Keep the following points in mind when you select View > Next Range:
• The new start time is the current end time. The new end time is the current end time, plus the current
duration.
For example, if the current start time is midnight April 11 and the current end time is midnight April
12, the duration is 24 hours. So the new start time is midnight April 12, and the new end time is
midnight April 13.
• The new end time might be later than the actual current time, even though you are displaying
historical statistics.
• If View > Next Range is grayed out, it means the new range falls after the collector was stopped.
• If you select View > Next Range and IPM displays the following error message:
Could not get operation stats from the server for the given time range, chart will be
empty.
This means there was no statistical data available for the next time period. The IPM server or source
router might have been down during that time period, and no statistical data was collected. When
you click OK, IPM displays blank graphs for the next time period.
• If you select View > Next Range for a Path Echo collector and IPM displays the following error
message:
No Path List could be found. Forcing a demand poll. Wait a few minutes and try again.
This means there was no statistical data available for the next time period. The IPM server or source
router might have been down during that time period, and no statistical data was collected. When
you click OK, IPM still displays graphs for the current time period.
Chapter 2 Getting Started With IPM
Understanding Previous Range
Keep the following points in mind when you select View > Prev Range:
• The new start time is the current start time, minus the current duration. The new end time is the
current start time.
For example, if the current start time is midnight April 11 and the current end time is midnight April
12, the duration is 24 hours. So the new start time is midnight April 10, and the new end time is
midnight April 11.
• If View > Prev Range is grayed out, it means the new range falls before the collector was started.
• If you select View > Prev Range and IPM displays the following error message:
Could not get operation stats from the server for the given time range, chart will be
empty.
This means there was no statistical data available for the previous time period. The IPM server or
source router might have been down during that time period, and no statistical data was collected.
When you click OK, IPM displays blank graphs for the previous time period.
2-26
User Guide for Internetwork Performance Monitor
OL-11291-01
Page 49

Chapter 2 Getting Started With IPM
Printing IPM Statistics
IPM provides the following printing options for the Real Time Statistics and Historical Statistics
windows:
• Specifying options for printing.
• Printing the currently displayed statistical graphs.
To access the printing options:
Step 1 Display the window containing the data you want to print, either the Real Time Statistics window or the
Historical Statistics window for a specific collector.
Step 2 Click the Print button (from a Real Time Statistics window) or select File > Print (from a Historical
Statistics window).
The printing options require you to define a printer on your system. If you click the Print button or select
the File > Print menu option and the Print Dialog window does not appear, make sure you have defined
a printer on your system.
Step 3 Enter the required data in the Print Dialog Window.
Printing IPM Statistics
Step 4 Click Print.
IPM sends the output to the printer or file you specified.
OL-11291-01
User Guide for Internetwork Performance Monitor
2-27
Page 50

Exiting the IPM Client
Exiting the IPM Client
When you are finished monitoring network performance statistics, you can exit the IPM client by
completing the following steps:
Step 1 From the IPM Main Window (Figure 2-2), select File > Exit.
The Exit IPM confirmation window appears.
If you are running IPM as an applet and you exit the Web browser or close the active window, IPM exits
but the confirmation window does not appear.
Step 2 Click Ye s to close the IPM client application.
Collectors that were still running when you closed the IPM client will continue to run and gather
statistics until they reach the end date specified in the collector configuration. Collectors defined to run
forever, continue to run and gather statistics until you stop them.
To shut down the IPM servers completely, use the ipm stop command. To stop gathering statistics, stop
the collectors before exiting the IPM client. When you stop a collector, the gathered data for that
collector is still available for viewing.
Chapter 2 Getting Started With IPM
Collectors remain in the IPM database until you do one of the following:
• Delete them from the IPM server
• Delete them from the source routers using the ipm rmcoll command
2-28
User Guide for Internetwork Performance Monitor
OL-11291-01
Page 51

CHAPTER
3
Using IPM to Measure Network Performance
This chapter provides details on using IPM to measure latency, jitter, availability, packet loss, and errors.
It includes the following sections:
• Measuring Network Performance for DHCP
• Measuring Network Performance for DLSw
• Measuring Network Performance for DNS
• Measuring Network Performance for HTTP
• Measuring Network Performance for FTP
• Measuring Network Performance for IP
• Measuring Network Performance for SNA
• Measuring Network Performance for TCP
• Measuring Network Performance for UDP
• Measuring Network Performance for Enhanced UDP
You can zoom in on any of the graphs by clicking and dragging over the area of the graph you want to
enlarge. To return to the normal view, click anywhere outside the graph.
OL-11291-01
For the IPM Operations, the IPM Request size does not include the size of the headers added by the
respective layers. The header size varies according to the type of the RTR probe.Overhead added by
different layers:
• TCP Layer - 20 bytes.
• UDP Layer - 8 bytes.
• IP Layer - 20 to 60 bytes.
• ICMP Layer - 8 Bytes.
• RTR/SAA - 8 bytes
User Guide for Internetwork Performance Monitor
3-1
Page 52

Chapter 3 Using IPM to Measure Network Performance
Measuring Network Performance for DHCP
Measuring Network Performance for DHCP
The DHCP operation measures the round-trip latency time taken to discover a DHCP server and obtain
a lease from it. After obtaining an IP address, SA Agent releases the IP address that was leased by the
server. By default, the DHCP operation sends discovery packets on every available IP interface on the
source router.
However, if a specific DHCP server is configured on the router, then discovery packets are sent to only
that DHCP server. The DHCP operation also measures availability and errors for DHCP services.
To measure end-to-end performance for DHCP:
Step 1 Define a device as the source device from which to measure performance. For details on defining a
source device, see Defining a Source Device.
Step 2 To control how statistics are collected, use the DefaultDHCP operation or define your own DHCP
operation. For details on defining a DHCP operation, see Defining a DHCP Operation.
Step 3 Define a collector to measure performance between the source router and the DHCP servers. For details
on defining a collector, see Defining a Collector.If you set the collector’s schedule to On Demand, start
the collector when needed.
Step 4 View the statistics in the DHCP Historical Statistics window. For details on viewing statistics for DHCP,
see Viewing Statistics for DHCP.
Defining a DHCP Operation
IPM provides a default DHCP operation for measuring performance in leasing an IP address from a
DHCP server. In addition, IPM provides the option to create, modify, or delete your own DHCP
operations from the DHCP Operation Configuration window.
To define a DHCP operation:
Step 1 From the IPM Main Window, select Edit > Configuration.
The Configuration window appears.
Step 2 Click Operation.
The Operation Configuration window appears within the Configuration window.
Step 3 Click DHCP.
The DHCP Operation Configuration window (Figure 3-1) appears.
3-2
User Guide for Internetwork Performance Monitor
OL-11291-01
Page 53

Chapter 3 Using IPM to Measure Network Performance
Figure 3-1 DHCP Operation Configuration Window
Measuring Network Performance for DHCP
Step 4 In the Name field, enter a descriptive name to assign to the operation. In the Description field, you can
enter a brief description of the operation, including its purpose.
Step 5 Select Enable DHCP Server to enable a specific server name or address for DHCP operations. Then,
enter the DHCP server name or address.
IPM will use the server you specify for collectors you have configured for the DHCP operation.
If you have not selected Enable DHCP Server, the source will do a broadcast and select any of the DHCP
servers configured on the network.
Step 6 Click Add.
IPM adds the newly defined operation to the IPM database.
Step 7 Click Close to close the Configuration window.
For more detailed information about the options available from the DHCP Operation Configuration
window, see the “DHCP Operation Configuration Window” topic in the online help.
OL-11291-01
User Guide for Internetwork Performance Monitor
3-3
Page 54

Measuring Network Performance for DHCP
Viewing Statistics for DHCP
The DHCP Historical Statistics window displays statistical and graphical information gathered over the
monitoring period for the selected DHCP collector.
To view end-to-end statistics for DHCP:
Step 1 From the IPM Main Window, select one or more DHCP collectors (up to 10).
Step 2 Select View > Statistics.
The DHCP Historical Statistics window (Figure 3-2) appears.
Figure 3-2 DHCP Historical Statistics Window
Chapter 3 Using IPM to Measure Network Performance
3-4
If you selected more than one collector, their statistics are displayed in a single graph in the Historical
Statistics—Multi-Collector Graph window (see Figure 2-14 for an example).
For more detailed information about the statistics displayed in the DHCP Historical Statistics window,
see the “DHCP Historical Statistics Window” topic in the online help.
User Guide for Internetwork Performance Monitor
OL-11291-01
Page 55

Chapter 3 Using IPM to Measure Network Performance
Measuring Network Performance for DLSw
DLSw+ is the enhanced Cisco version of DSCP RFC 1795. DLSw+ tunnels SNA traffic over IP
backbones via TCP. The routers performing the tunneling of SNA traffic onto TCP/IP are referred to as
DLSw peers.
The DLSw operation measures the DLSw+ protocol stack and round-trip latency between DLSw peers.
Normally DLSw peers communicate through TCP port 2065.
A prerequisite to successfully running the DLSw operation is having a connected DLSw+ peer between
the source and destination Cisco devices. On the source DLSw+ device, an operation can be defined for
a DLSw+ partner peer. The DLSw operation also measures availability and errors for DLSw services.
Note To measure the round-trip latency between two DLSw peers, the IP address that you define as the source
router must be one of the DLSw peers, and the IP address that you define as the target router must be
configured as the DLSw peer to the source router.
To measure end-to-end performance for DLSw:
Measuring Network Performance for DLSw
Step 1 Define a router as the source router from which to measure performance. For details on defining a source
device, see Defining a Source Device.
Step 2 Define a device as the target of DLSw requests from the source device. For details on defining a target,
see Defining a Target.
Step 3 To control how statistics are collected, use the DefaultDLSw operation or define your own DLSw
operation. For details on defining a DLSw operation, see Defining a DLSw Operation.
Step 4 Define a collector to measure performance between the source router and target you defined. For details
on defining a collector, see Defining a Collector. If you set the collector’s schedule to On Demand, start
the collector when desired.
Step 5 View the statistics in the DLSw Historical Statistics window. For details on viewing end-to-end statistics
for DLSw, see Viewing Statistics for DLSw.
Defining a DLSw Operation
IPM provides a default DLSw operation for measuring performance between a source and target. In
addition, IPM provides the option to create, modify, or delete your own DLSw operations from the
DLSw Operation Configuration window.
To define a DLSw operation:
OL-11291-01
Step 1 From the IPM Main Window, select Edit > Configuration.
The Configuration window appears.
Step 2 Click Operation.
The Operation Configuration window appears within the Configuration window.
User Guide for Internetwork Performance Monitor
3-5
Page 56

Measuring Network Performance for DLSw
Step 3 Click DLSw.
The DLSw Operation Configuration window (Figure 3-3) appears.
Figure 3-3 DLSw Operation Configuration Window
Chapter 3 Using IPM to Measure Network Performance
Step 4
In the Name field, enter a descriptive name to assign to the operation. In the Description field, you can
enter a brief description of the operation, including its purpose.
Step 5 In the Request Payloads field, enter the number of bytes to use for the size of the payload of the request
packet. The default setting is 64 bytes.
Step 6 In the Response Payloads field, enter the number of bytes to use for the size of the payload of the
response packet. The default setting is 64 bytes.
Step 7 Click Add.
IPM adds the newly defined operation to the IPM database.
Step 8 Click Close to close the Configuration window.
For more detailed information about the options available from the DLSw Operation Configuration
window, see the “DLSw Operation Configuration Window” topic in the online help.
3-6
User Guide for Internetwork Performance Monitor
OL-11291-01
Page 57

Chapter 3 Using IPM to Measure Network Performance
Viewing Statistics for DLSw
The DLSw Historical Statistics window displays statistical and graphical information gathered over the
monitoring period for the selected DLSw collector.
To view end-to-end statistics for DLSw:
Step 1 From the IPM Main Window, select one or more DLSw collectors (up to 10).
Step 2 Select View > Statistics.
The DLSw Historical Statistics window (Figure 3-4) appears.
Figure 3-4 DLSw Historical Statistics Window
Measuring Network Performance for DLSw
OL-11291-01
If you selected more than one collector, their statistics appear in a single graph in the Historical
Statistics—Multi-Collector Graph window (see Figure 2-14 for an example).
For more detailed information about the statistics displayed in the DLSw Historical Statistics window,
see the “DLSw Historical Statistics Window” topic in the online help.
User Guide for Internetwork Performance Monitor
3-7
Page 58

Chapter 3 Using IPM to Measure Network Performance
Measuring Network Performance for DNS
Measuring Network Performance for DNS
DNS operation latency is computed by measuring the time between sending a DNS request and receiving
a reply. The operation queries for an IP address if you specify a host name, or queries for a host name if
you specify an IP address. The DNS operation also measures availability and errors for DNS services.
To measure end-to-end performance for DNS:
Step 1 Define a device as the source device from which to measure performance. For details on defining a
source device, see Defining a Source Device.
To control how statistics are collected, use the DefaultDNS operation or define your own DNS operation.
For details on defining a DNS operation, see Defining a DNS Operation.
Step 2 Define a collector to measure performance between the source router and DNS server. For details on
defining a collector, see Defining a Collector. If you set the collector’s schedule to On Demand, start
the collector when desired.
Step 3 View the statistics in the DNS Historical Statistics window. For details on viewing end-to-end statistics
for DNS, see Viewing Statistics for DNS.
Defining a DNS Operation
IPM provides a default DNS operation for measuring performance between a source and a DNS server.
In addition, IPM provides the option to create, modify, or delete your own DNS operations from the DNS
Operation Configuration window.
To define a DNS operation:
Step 1 From the IPM Main Window, select Edit > Configuration.
The Configuration window appears.
Step 2 Click Operation.
The Operation Configuration window appears within the Configuration window.
Step 3 Click DNS.
The DNS Operation Configuration window (Figure 3-5) appears.
Step 4 In the Name field, enter a descriptive name to assign to for the operation. In the Description field, you
can enter a brief description of the operation, including its purpose.
Step 5 In the DNS Name Server field, enter the host name or IP address for the DNS name server.
IPM automatically creates the DefaultDNS operation at startup based on the DNS server configuration
of the IPM server.
3-8
User Guide for Internetwork Performance Monitor
OL-11291-01
Page 59

Chapter 3 Using IPM to Measure Network Performance
Figure 3-5 DNS Operation Configuration Window
Measuring Network Performance for DNS
Step 6 In the DNS Lookup Name field, enter the DNS host name to look up on the specified DNS name server.
Step 7 Click Add.
IPM adds the newly defined operation to the IPM database.
Step 8 Click Close to close the Configuration window.
For more detailed information about the options available from the DNS Operation Configuration
window, see the “DNS Operation Configuration Window” topic in the online help.
Viewing Statistics for DNS
The DNS Historical Statistics window displays statistical and graphical information gathered over the
monitoring period for the selected DNS collector.
To view end-to-end statistics for DNS:
Step 1 From the IPM Main Window, select one or more DNS collectors (up to 10).
Step 2 Select View > Statistics.
The DNS Historical Statistics window (Figure 3-6) appears.
OL-11291-01
User Guide for Internetwork Performance Monitor
3-9
Page 60

Measuring Network Performance for DNS
Figure 3-6 DNS Historical Statistics Window
Chapter 3 Using IPM to Measure Network Performance
If you selected more than one collector, their statistics appear in a single graph in the Historical
Statistics—Multi-Collector Graph window (see Figure 2-14 for an example).
For more detailed information about the statistics displayed in the DNS Historical Statistics window, see
the “DNS Historical Statistics Window” section in the online help.
3-10
User Guide for Internetwork Performance Monitor
OL-11291-01
Page 61

Chapter 3 Using IPM to Measure Network Performance
Measuring Network Performance for HTTP
The HTTP operation measures the round-trip latency time required to connect to and access data from
an HTTP server. Three HTTP server response time measurements are made:
• DNS Lookup—Round-trip latency in looking up the domain name.
• TCP Connect—Round-trip latency in performing a TCP connect to the HTTP server.
• HTTP transaction time—Round-trip latency in sending a request to, and receiving a reply from, the
HTTP server (the probe retrieves the base HTML page only).
The HTTP operation also measures availability and errors for HTTP services.
To measure end-to-end performance for HTTP:
Step 1 Define a device as the source device from which to measure performance. For details on defining a
source device, see Defining a Source Device.
To control how statistics are collected, define your own HTTP operation. For details on defining an
HTTP operation, see Defining an HTTP Operation.
Step 2 Define a collector to measure performance between the source device and the HTTP servers. For details
on defining a collector, see Defining a Collector, page 2-12. If you set the collector’s schedule to On
Demand, start the collector when needed.
Step 3 View the statistics in the HTTP Historical Statistics window. For details on viewing statistics for HTTP,
see Viewing Statistics for HTTP.
Measuring Network Performance for HTTP
Defining an HTTP Operation
Use the HTTP Operation Configuration window to create, modify, or delete your own HTTP operations
for measuring performance in connecting and accessing data from an HTTP server. IPM does not provide
a default HTTP operation.
To define an HTTP operation:
Step 1 From the IPM Main Window, select Edit > Configuration.
The Configuration window appears.
Step 2 Click Operation.
The Operation Configuration window appears within the Configuration window.
Step 3 Click HTTP.
The HTTP Operation Configuration window (Figure 3-7) appears.
OL-11291-01
User Guide for Internetwork Performance Monitor
3-11
Page 62

Measuring Network Performance for HTTP
Figure 3-7 HTTP Operation Configuration Window
Chapter 3 Using IPM to Measure Network Performance
Step 4
In the Name field, enter a descriptive name to assign to the operation. In the Description field, you can
enter a brief description of the operation, including its purpose.
Step 5 Select the IP QoS Type as IP Precedence or DSCP. The IP QoS Settings values change based on your IP
QoS Type selection.
• If you have selected IP QoS Type as IP Precedence, select the IP QoS Settings value from the
drop-down. The value you select sets the priority for the HTTP request packet. The default setting
is 0 (no priority). This option sets the ToS bits in the IP packet.
• If you have selected IP QoS Type as DSCP, select the desired IP QoS Settings value from the
drop-down. The value you select defines the packet priority and is based on the DSCP RFC
standards.
Step 6 In the URL Lookup String field, enter the Website URL to use for the HTTP request.
IPM validates the format of the HTTP string that you enter in the URL Lookup String field.
• The URL that you enter should be in the http://host[:port][/path[?searchpart]] format.
• The hostname should contain only alphanumeric characters, ‘.’ and ‘-’.
• The port number should be greater than 0 and less than 65536.
If you specify the path in the URL string, the next two characters that follow a ‘%’ should be
hexadecimal values. The maximum length of characters that you can specify in the URL String field is
255.
IPM displays appropriate error messages if any of the variables you enter in the URL string is incorrect.
You can clear the Download URL from Cache checkbox if you want the router to query the Website for
the HTTP request. Select the checkbox if you want the source to search its cache for the Website and, if
it is found, download it instead of querying the Website. The default setting is for this box to be cleared
(query the Website).
3-12
User Guide for Internetwork Performance Monitor
OL-11291-01
Page 63

Chapter 3 Using IPM to Measure Network Performance
Step 7 To configure IPM so that it can use a proxy server, select Use HTTP Proxy Server, and enter the name
or address of the proxy server.
IPM will use the proxy server you specify for collectors you have configured for the HTTP operation.
The default port for the HTTP proxy server would be 80, and the type of proxy server would be HTTP.
You can set proxy server settings for IOS versions 12.1(9a) and above. To specify a different proxy port,
enter the server name as:
Step 8 Click Add.
IPM adds the newly defined operation to the IPM database.
Step 9 Click Close to close the Configuration window.
For more detailed information about the options available from the HTTP Operation Configuration
window, see the “HTTP Operation Configuration Window” topic in the online help.
Viewing Statistics for HTTP
Measuring Network Performance for HTTP
http proxy server: port number
The HTTP Historical Statistics window displays statistical and graphical information gathered over the
monitoring period for the selected HTTP collector.
To view end-to-end statistics for HTTP:
Step 1 From the IPM Main Window, select an HTTP collector. (Do not select more than one HTTP collector.
You cannot include HTTP collectors in multi-collector graphs.)
Step 2 Select View > Statistics.
The HTTP Historical Statistics window (Figure 3-8) appears.
OL-11291-01
User Guide for Internetwork Performance Monitor
3-13
Page 64

Measuring Network Performance for HTTP
Figure 3-8 HTTP Historical Statistics Window
Chapter 3 Using IPM to Measure Network Performance
3-14
For more detailed information about the statistics displayed in the HTTP Historical Statistics window,
see the “HTTP Historical Statistics Window” topic in the online help.
User Guide for Internetwork Performance Monitor
OL-11291-01
Page 65

Chapter 3 Using IPM to Measure Network Performance
Measuring Network Performance for FTP
The FTP operation measures the round-trip latency time required to connect to and access data from an
FTP server. The FTP transaction time server response shows the round-trip latency in sending a request
to, and downloading the file from the FTP server.
The FTP operation also measures availability and errors for FTP services.
To measure end-to-end performance for FTP:
Step 1 Define a device as the source device from which to measure performance. For details on defining a
source device, see Defining a Source Device.
To control how statistics are collected, define your own FTP operation. For details on defining an FTP
operation, see Defining an FTP Operation.
Step 2 Define a collector to measure performance between the source device and the FTP servers.
For details on defining a collector, see Defining a Collector. If you set the collector’s schedule to On
Demand, start the collector when needed.
Step 3 View the statistics in the FTP Historical Statistics window.
For details on viewing statistics for FTP, see Viewing Statistics for FTP.
Measuring Network Performance for FTP
Defining an FTP Operation
Use the FTP Operation Configuration window to create, modify, or delete your own FTP operations for
measuring performance while connecting and accessing data from an FTP server. IPM does not provide
a default FTP operation.
To define an FTP operation:
Step 1 From the IPM Main Window, select Edit > Configuration.
The Configuration window appears.
Step 2 Click Operation.
The Operation Configuration window appears within the Configuration window.
Step 3 Click FTP.
OL-11291-01
User Guide for Internetwork Performance Monitor
3-15
Page 66

Measuring Network Performance for FTP
The FTP Operation Configuration window (Figure 3-9) appears.
Figure 3-9 FTP Configuration Window
Chapter 3 Using IPM to Measure Network Performance
Step 4 In the Name field, enter a descriptive name to assign to the operation. In the Description field, you can
enter a brief description of the operation, including its purpose.
Step 5 Select the IP QoS Type as IP Precedence or DCSP. The IP QoS Settings values change based on your IP
QoS Type selection.
• If you have selected IP QoS Type as IP Precedence, select the IP QoS Settings value from the
drop-down. The value you select sets the priority for the HTTP request packet. The default setting
is 0 (no priority). This option sets the ToS bits in the IP packet.
• If you have selected IP QoS Type as DSCP, select the desired IP QoS Settings value from the
drop-down. The value you select defines the packet priority and is based on the DSCP RFC
standards.
Step 6 In the FTP URL Lookup String field, enter the URL of the file to be downloaded from the FTP server.
The URL has to be in the format:
If it is anonymous ftp server, use the format:
Caution While defining an FTP operation, you have to specify the hostname/ip address of the FTP server. The
ftp://user:passwd@servername/dir/file.
ftp://servername/dir/file.
hostname you specify has to be DNS resolvable. If you execute an ftp operation without a
DNS-resolvable hostname, then all the routers on which the ftp collectors are configured would reboot.
IPM validates the format of the FTP string that you enter in the FTP URL Lookup String field and
displays appropriate error messages if any of the variables you enter in the URL string is incorrect.
IPM checks the syntax and also checks whether:
• If userinfo (if specified) is in the format user:pwd.
3-16
User Guide for Internetwork Performance Monitor
OL-11291-01
Page 67

Chapter 3 Using IPM to Measure Network Performance
• The server name contains only alphanumerical characters, '.' and '-'.
• The username contains only alphanumerical characters, safe characters ('$','-','_','.','+'), and extra
characters ('!','*',',',0x27,0x28,0x29).
• The password contains only alphanumerical characters, safe characters, extra characters, and ‘%’.
• The path, dir/file, contains only alphanumerical characters, safe characters, extra characters,
reserved characters ('?','@','&','='.'/'), ‘ ’, and ‘%’.
Step 7 Select the mode of FTP session.
• In Active FTP, the client opens a control connection on port 21 to the server, and whenever the client
requests data from the server, the server opens a TCP session on port 20.
• In Passive FTP, the client opens the data sessions, using a port number supplied by the server.
For detailed information on active and passive FTP transfer modes, see Appendix A, IPM FAQs.
Step 8 Click Add.
IPM adds the newly defined operation to the IPM database.
Step 9 Click Close to close the Configuration window.
Measuring Network Performance for FTP
For more detailed information about the options available from the FTP Operation Configuration
window, see the “FTP Operation Configuration Window” topic in the online help.
Viewing Statistics for FTP
The FTP Historical Statistics window displays statistical and graphical information gathered over the
monitoring period for the selected FTP collector.
To view end-to-end statistics for FTP:
Step 1 From the IPM Main Window, select one or more FTP collectors.
Step 2 Select View > Statistics.
The FTP Historical Statistics window (Figure 3-10) appears.
OL-11291-01
User Guide for Internetwork Performance Monitor
3-17
Page 68

Measuring Network Performance for IP
Figure 3-10 FTP Historical Statistics Window
Chapter 3 Using IPM to Measure Network Performance
For more detailed information about the statistics displayed in the FTP Historical Statistics window, see
the “FTP Historical Statistics Window” topic in the online help.
Measuring Network Performance for IP
In an IP network there are two types of measurements that you can take:
• IP Echo—Measures the total round-trip latency from the source to the target device. The SA Agent
feature in the source router issues an Internet Control Message Protocol (ICMP) ping to the target
device and extracts the latency data from the reply.
See Measuring End-to-End Performance for IP for more information.
• IP Path Echo—Measures the total round-trip latency as well as the incremental latency for each hop
in all paths between the source router and the target device. Path Echo is available only for the IP
protocol.
The SA Agent feature first issues a traceroute command to determine the path through the network
from the specified source to the specified target device.
The data returned from the traceroute command contains the host name or IP address of each of the
routers in the path. SA Agent then issues ICMP pings to each of the routers listed in the traceroute
data.
The ICMP ping returns statistics regarding the latency, availability, and errors between the specified
source and each of the routers.
See Measuring Hop-by-Hop Performance for IP for more information.
3-18
User Guide for Internetwork Performance Monitor
OL-11291-01
Page 69

Chapter 3 Using IPM to Measure Network Performance
Measuring End-to-End Performance for IP
IPM’s Echo operations measure end-to-end performance between a source and any IP-enabled device.
Latency is computed by measuring the time taken between sending an ICMP echo request message to
the destination and receiving an ICMP echo reply. The IP Echo operation also measures availability and
errors for IP services.
With an IP Echo operation, you can determine performance on a specific path by using Loose Source
Routing. Additionally, IPM provides an option for measuring quality of service (QoS) between
endpoints by setting the DSCP and the type of service (ToS) bits on the IP packet.
To measure end-to-end performance for IP:
Step 1 Define a device as the source device from which to measure performance. For details on defining a
source device, see Defining a Source Device.
Step 2 Define a device as the target of ICMP echo requests from the source device. For details on defining a
target, see Defining a Target.
To control how statistics are collected, use the DefaultIPEcho operation or define your own IP Echo
operation. For details on defining an IP Echo operation, see Defining an IP Echo Operation.
Step 3 Define a collector to measure performance between the source and target you defined. For details on
defining a collector, see Defining a Collector. If you set the collector’s schedule to On Demand, start
the collector when needed.
Step 4 View the statistics in the Echo Historical Statistics window. For details on viewing end-to-end statistics
for IP, see Viewing End-to-End Statistics for IP.
Measuring Network Performance for IP
Defining an IP Echo Operation
IPM provides a default IP Echo operation for measuring performance between a source and target. In
addition, IPM provides the option to create, modify, or delete your own IP Echo operations from the
Echo Operation Configuration window.
To define an IP Echo operation:
Step 1 From the IPM Main Window, select Edit > Configuration.
The Configuration window appears.
Step 2 Click Operation.
The Operation Configuration window appears within the Configuration window.
Step 3 Click Echo.
The Echo Operation Configuration window (Figure 3-11) appears.
OL-11291-01
User Guide for Internetwork Performance Monitor
3-19
Page 70

Measuring Network Performance for IP
Figure 3-11 IP Echo Operation Configuration Window
Chapter 3 Using IPM to Measure Network Performance
Step 4
In the Name field, enter a descriptive name to assign to the operation. In the Description field, you can
enter a brief description of the operation, including its purpose.
Step 5 In the Protocol field, select one of the following protocols and specify a Mode Name:
• IP
• SNA LU 0
• SNA LU 2
• SNA SSCP
Step 6 Select the IP QoS Type as IP Precedence or DCSP. The IP QoS Settings values change based on your IP
QoS Type selection.
• If you have selected IP QoS Type as IP Precedence, select the IP QoS Settings value from the
drop-down. The value you select sets the priority for the HTTP request packet. The default setting
is 0 (no priority). This option sets the QoS bits in the IP packet.
• If you have selected IP QoS Type as DSCP, select the desired IP QoS Settings value from the
drop-down. The value you select defines the packet priority and is based on the DSCP RFC
standards.
In the Request Payload field, enter the number of bytes to use for the size of the payload of the ICMP
echo request packet. The default setting is 64 bytes.
If you have selected the Protocol as SNA LU0 or SNA LU2, enter the number of bytes in the Response
Payload field. This the number of bytes for use for the size of the payload of the response packet. The
default setting is 64 bytes.
3-20
User Guide for Internetwork Performance Monitor
OL-11291-01
Page 71

Chapter 3 Using IPM to Measure Network Performance
To measure performance for a specific path, enable the Loose Source Routing option and add the hops
for the operation to use.
Note Step 6 is valid only if you have selected the protocol as IP in step 5. In case you have selected any other
protocol, this step is not applicable.
Step 7 Click Add.
IPM adds the newly defined operation to the IPM database.
Step 8 Click Close to close the Configuration window.
For more detailed information about the options available from the Echo Operation Configuration
window, see the “Echo Operation Configuration Window” topic in the online help.
Viewing End-to-End Statistics for IP
The IP Echo Historical Statistics window displays statistical and graphical information gathered over the
monitoring period for the selected Echo collector.
To view end-to-end statistics for IP:
Measuring Network Performance for IP
Step 1 From the IPM Main Window, select one or more IP Echo collectors (up to 10).
Step 2 Select View > Statistics.
The IP Echo Historical Statistics window (Figure 3-12) appears.
Figure 3-12 IP Echo Historical Statistics Window
OL-11291-01
User Guide for Internetwork Performance Monitor
3-21
Page 72

Measuring Network Performance for IP
If you selected more than one collector, their statistics are displayed in a single graph in the Historical
Statistics—Multi-Collector Graph window (see Figure 2-14 for an example).
For more detailed information about the statistics displayed in the Echo Historical Statistics window, see
the “Echo Historical Statistics Window” topic in the online help.
Measuring Hop-by-Hop Performance for IP
IPM’s IP Path Echo operation determines hop-by-hop performance between a server and any IP device
on the network, by discovering the path. It uses traceroute and then measures performance between the
source and each intermittent hop in the path.
If there are multiple equal cost routes between the source and the target, the Path Echo operation can
identify the correct path by using Loose Source Routing, if this option is enabled on the intermediate
hop devices.
This feature enables SA Agent to discover paths more accurately compared to a regular traceroute. The
IP Path Echo operation also measures availability and errors for IP services.
To measure hop-by-hop performance for IP:
Chapter 3 Using IPM to Measure Network Performance
Step 1 Define a device as the source device from which to measure performance. For details on defining a
source device, see the Defining a Source Device.
Step 2 Define a device as the target of ICMP echo requests from the source device. For details on defining a
target, see the Defining a Target.
To control how statistics are collected, use the DefaultIpPathEcho operation or define your own IP Path
Echo operation. For details on defining an IP Path Echo operation, see the Defining an IP Path Echo
Operation.
Step 3 Define a collector to measure performance between the source router and target you defined. For details
on defining a collector, see the Defining a Collector. If you set the collector’s schedule to On Demand,
start the collector when needed.
Step 4 View the statistics in the Path Echo Historical Statistics window. For details on viewing hop-by-hop
statistics for IP, see the Viewing Hop-by-Hop Statistics for IP.
Defining an IP Path Echo Operation
IPM provides a default IP Path Echo operation for measuring performance between a source and target.
In addition, IPM provides the option to create, modify, or delete your own IP Path Echo operations from
the Path Echo Operation Configuration window.
To define an IP Path Echo operation:
3-22
Step 1 From the IPM Main Window, select Edit > Configuration.
The Configuration window appears.
Step 2 Click Operation.
The Operation Configuration window appears within the Configuration window.
User Guide for Internetwork Performance Monitor
OL-11291-01
Page 73

Chapter 3 Using IPM to Measure Network Performance
Step 3 Click Path Echo.
The Path Echo Operation Configuration window (Figure 3-13) appears.
Figure 3-13 IP Path Echo Operation Configuration Window
Measuring Network Performance for IP
Step 4 In the Name field, enter a descriptive name to assign to the operation. In the Description field, you can
enter a brief description of the operation, including its purpose.
Step 5 Select the IP QoS Type as IP Precedence or DCSP. The IP QoS Settings values change based on your IP
QoS Type selection.
• If you have selected IP QoS Type as IP Precedence, select the IP QoS Settings value from the
drop-down. The value you select sets the priority for the HTTP request packet. The default setting
is 0 (no priority). This option sets the ToS bits in the IP packet.
• If you have selected IP QoS Type as DSCP, select the desired IP QoS Settings value from the
drop-down. The value you select defines the packet priority and is based on the DSCP RFC
standards.
Step 6 In the Request Payload field, enter the number of bytes to use for the size of the payload of the ICMP
echo request packet. The default setting is 64 bytes.
• To specify the maximum number of paths to discover, enter a value in the Maximum Paths field. The
valid range is 1 to 128 paths. The default setting is 5. To ensure that you do not miss collecting
statistics for relevant paths, set this value to a number slightly higher than the expected number of
paths.
• To specify the maximum number of hops to discover, enter a value in the Maximum Hops field. The
valid range is 1 to 25 hops. The default setting is 25 hops. To ensure that you do not miss collecting
statistics for relevant hops, set this value to a number slightly higher than the expected number of
hops.
OL-11291-01
User Guide for Internetwork Performance Monitor
3-23
Page 74

Measuring Network Performance for IP
Step 7 Click Add.
IPM adds the newly defined operation to the IPM database.
Step 8 Click Close to close the Configuration window.
Note The sample interval must be greater than the timeout value multiplied by the number of hops.
For more detailed information about the options available from the Path Echo Operation Configuration
window, see the “Path Echo Operation Configuration Window” topic in the online help.
Viewing Hop-by-Hop Statistics for IP
The IP Path Echo Historical Statistics window displays statistical and graphical information gathered
over the monitoring period for the selected IP Path Echo collector.
To view hop-by-hop statistics for IP:
Chapter 3 Using IPM to Measure Network Performance
Step 1 From the IPM Main Window, select a Path Echo collector. (Do not select more than one Path Echo
collector. You cannot include Path Echo collectors in multi-collector graphs.)
Step 2 Select View > Statistics.
The Path Echo Historical Statistics window for all paths (Figure 3-14) appears.
3-24
User Guide for Internetwork Performance Monitor
OL-11291-01
Page 75

Chapter 3 Using IPM to Measure Network Performance
Figure 3-14 IP Path Echo Historical Statistics Window—All Paths
Measuring Network Performance for IP
By default, IPM displays graphs for all paths in the path list. To view the list of hops for a single path,
and their graphs, click on the path folder. The Path Echo Historical Statistics window for all hops in a
single path (Figure 3-15) appears.
OL-11291-01
User Guide for Internetwork Performance Monitor
3-25
Page 76

Measuring Network Performance for IP
Figure 3-15 IP Path Echo Historical Statistics Window—All Hops in a Path
Chapter 3 Using IPM to Measure Network Performance
To view the graphs for a specific hop, click on the hop. The Path Echo Historical Statistics window for
a single hop (Figure 3-16) appears.
3-26
User Guide for Internetwork Performance Monitor
OL-11291-01
Page 77

Chapter 3 Using IPM to Measure Network Performance
Figure 3-16 IP Path Echo Historical Statistics Window—One Hop
Measuring Network Performance for IP
Step 3
By default, IPM displays a single graph for each path in the path list, or for each hop in a given path.
However, you can choose to display combined statistics for more than one path or hop in a single graph
also.
To do so, select the path list, or a specific path, in the Path Echo Historical Statistics window, then select
View > Show Combined. The Combined Path List or Combined Hop List window appears.
Figure 3-17 shows a sample Combined Path List window.
OL-11291-01
User Guide for Internetwork Performance Monitor
3-27
Page 78

Measuring Network Performance for IP
Figure 3-17 IP Path Echo Combined Path List Window
Chapter 3 Using IPM to Measure Network Performance
Figure 3-18 shows a sample Combined Hop List window.
39292
3-28
User Guide for Internetwork Performance Monitor
OL-11291-01
Page 79

Chapter 3 Using IPM to Measure Network Performance
Figure 3-18 IP Path Echo Combined Hop List Window
Measuring Network Performance for SNA
It is easier to compare different paths and hops when viewing combined statistics.
To return to separate graphs for each path or hop, select View > Show Separate.
For more detailed information about the statistics displayed in the Path Echo Historical Statistics
window, see the “Path Echo Historical Statistics Window” topic in the online help.
Measuring Network Performance for SNA
For SNA environments, IPM allows you to measure the round-trip latency to an MVS mainframe using
the following types of SNA sessions:
• System services control point-logical unit (SSCP-LU)
• LU 0
• LU 2
Since SNA is a connection-oriented protocol, the only type of measurement you can request is Echo.
When measuring latency to an SNA mainframe, IPM measures round-trip latency between a source
device and an echo response program running on an SNA mainframe.
You can install NSPECHO, a program provided by IPM, on an MVS mainframe to provide the echo back
to the router.
39293
OL-11291-01
User Guide for Internetwork Performance Monitor
3-29
Page 80

Measuring Network Performance for SNA
You can customize both the request and response payload sizes to model traffic flow for various
applications. The SNA operations also measure availability and errors for SNA services.
To measure end-to-end performance for SNA:
Step 1 Define a device as the source device from which to measure performance. For details on defining a
source device, see the Defining a Source Device.
Step 2 Define a device as the target of SNA echo requests from the source device. For details on defining a
target, see the Defining a Target.
To control how statistics are collected, use one of the default SNA operations, or define your own SNA
Echo operation. For details on defining an SNA Echo operation, see the Defining an SNA Echo
Operation.
Step 3 Define a collector to measure performance between the source router and target you defined. For details
on defining a collector, see the Defining a Collector. If you set the collector’s schedule to On Demand,
start the collector when desired.
Step 4 View the statistics in the Echo Historical Statistics window. For details on viewing end-to-end statistics
for SNA, see the Viewing Statistics for SNA.
Chapter 3 Using IPM to Measure Network Performance
Defining an SNA Echo Operation
The SNA Echo Operation Configuration window allows you to create, modify, or delete an SNA Echo
operation.
To define an SNA Echo operation:
Step 1 From the IPM Main Window, select Edit > Configuration.
The Configuration window appears.
Step 2 Click Operation.
The Operation Configuration window appears within the Configuration window.
Step 3 Click Echo.
The Echo Operation Configuration window (Figure 3-11) appears.
Step 4 In the Name field, enter a descriptive name to assign to the operation. In the Description field, you can
enter a brief description of the operation, including its purpose.
Step 5 In the Protocol field, select one of the following protocols:
• SNA LU 0
• SNA LU 2
• SNA SSCP
Step 6 In the Request Payload field, enter the number of bytes to use for the size of the payload of the request
packet. The default setting is 64 bytes.
3-30
User Guide for Internetwork Performance Monitor
OL-11291-01
Page 81

Chapter 3 Using IPM to Measure Network Performance
Step 7 In the Response Payload field, enter the number of bytes to use for the size of the payload of the response
packet. The default setting is 64 bytes.
• To check for connection loss, click Enable Connection Lost Action.
• To increment the Verify Data counter whenever a response contains unexpected data, click Enable
Data Verification.
Step 8 Click Add.
IPM adds the newly defined operation to the IPM database.
Step 9 Click Close to close the Configuration window.
For more detailed information about the options available from the Echo Operation Configuration
window, see the “Echo Operation Configuration Window” topic in the online help.
Viewing Statistics for SNA
The SNA Echo Historical Statistics window displays statistical and graphical information gathered over
the monitoring period for the selected Echo collector.
To view end-to-end statistics for SNA:
Measuring Network Performance for SNA
Step 1 From the IPM Main Window, select one or more SNA collectors (up to 10).
Step 2 Select View > Statistics.
The SNA Echo Historical Statistics window (Figure 3-19) appears.
OL-11291-01
User Guide for Internetwork Performance Monitor
3-31
Page 82

Measuring Network Performance for SNA
Figure 3-19 SNA Echo Historical Statistics Window
Chapter 3 Using IPM to Measure Network Performance
39294
If you selected more than one collector, their statistics appear in a single graph in the Historical
Statistics—Multi-Collector Graph window (see Figure 2-14 for an example).
For more detailed information about the statistics displayed in the Echo Historical Statistics window, see
the “Echo Historical Statistics Window” topic in the online help.
3-32
User Guide for Internetwork Performance Monitor
OL-11291-01
Page 83

Chapter 3 Using IPM to Measure Network Performance
Measuring Network Performance for TCP
IPM’s TCP Connect operation measures round-trip latency between a source and any IP-enabled device
running TCP services. Latency is computed by measuring the time taken by the source to perform a TCP
connect operation to the target device. This operation is useful for simulating Telnet or HTTP connection
times. The TCP operation also measures availability and errors for TCP services.
You can specify any port number, well known or otherwise, on any IP host, Cisco or non-Cisco, as long
as someone is listening on that port on the target. A well known port is a port number less than or equal
to 1024 (for example, 21 for FTP, 23 for Telnet, and 80 for HTTP). IPM provides default TCP
Connection operations for several of these common TCP services.
To measure end-to-end latency for TCP:
Step 1 Define a device as the source device from which to measure performance. For details on defining a
source device, see Defining a Source Device.
Step 2 Define a device as the target of connection requests from the source device. For details on defining a
target, see Defining a Target.
To control how statistics are collected, use one of the default operations for TCP or define your own TCP
operation. For details on defining a TCP operation, see Defining a TCP Operation.
Step 3 Define a collector to measure performance between the source router and target you defined. For details
on defining a collector, see Defining a Collector. If you set the collector’s schedule to On Demand, start
the collector when needed.
Measuring Network Performance for TCP
Step 4 View the statistics in the TCP Historical Statistics window. For details on viewing end-to-end statistics
for TCP, see Viewing Statistics for TCP.
Defining a TCP Operation
IPM provides several default TCP operations for measuring performance between a source and target.
In addition, IPM provides the option to create, modify, or delete your own TCP operations from the TCP
Operation Configuration window.
To define a TCP operation:
Step 1 From the IPM Main Window, select Edit > Configuration.
The Configuration window appears.
Step 2 Click Operation.
The Operation Configuration window appears within the Configuration window.
Step 3 Click TCP Connect
The TCP Operation Configuration window (Figure 3-20) appears.
OL-11291-01
User Guide for Internetwork Performance Monitor
3-33
Page 84

Measuring Network Performance for TCP
Figure 3-20 TCP Operation Configuration Window
Chapter 3 Using IPM to Measure Network Performance
Step 4 In the Name field, enter a descriptive name to assign to the operation. In the Description field, you can
enter a brief description of the operation, including its purpose.
Step 5 Select the IP QoS Type as IP Precedence or DCSP. The IP QoS Settings values change based on your IP
QoS Type selection.
• If you have selected IP QoS Type as IP Precedence, select the IP QoS Settings value from the
drop-down. The value you select sets the priority for the HTTP request packet. The default setting
is 0 (no priority). This option sets the ToS bits in the IP packet.
• If you have selected IP QoS Type as DSCP, select the desired IP QoS Settings value from the
drop-down. The value you select defines the packet priority and is based on the DSCP RFC
standards.
Step 6 In the Target Port field, enter the TCP port number for the target device to use when sending a response
to a connection request. Valid values are 1 to 65535. The default setting is 3000.
You can specify any port number, well known or otherwise, on any IP host, Cisco or non-Cisco, as long
as someone is listening on that port on the target.
• If this target uses the SA Agent, make sure you configured it as a Cisco SAA Responder target on
the Target Configuration window.
• If you mistakenly configured it as an IP target, and you specify a Target Port that is not well known
(that is if you specify a port number greater than 1024), IPM considers the target an IP device rather
than an SA Agent device. In such as case, IPM does not enable the SA Agent Control protocol. As
a result, the collector cannot connect to the target and no data is collected.
Step 7 Click Add.
3-34
IPM adds the newly defined operation to the IPM database.
Step 8 Click Close to close the Configuration window.
User Guide for Internetwork Performance Monitor
OL-11291-01
Page 85

Chapter 3 Using IPM to Measure Network Performance
For more detailed information about the options available from the TCP Operation Configuration
window, see the “TCP Operation Configuration Window” topic in the online help.
Viewing Statistics for TCP
The TCP Historical Statistics window displays statistical and graphical information gathered over the
monitoring period for the selected TCP collector.
To view end-to-end statistics for TCP:
Step 1 From the IPM Main Window, select one or more TCP Connect collectors (up to 10).
Step 2 Select View > Statistics.
The TCP Historical Statistics window (Figure 3-21) appears.
Figure 3-21 TCP Historical Statistics Window
Measuring Network Performance for TCP
OL-11291-01
If you selected more than one collector, their statistics appear in a single graph in the Historical
Statistics—Multi-Collector Graph window (see Figure 2-14 for an example).
User Guide for Internetwork Performance Monitor
3-35
Page 86

Chapter 3 Using IPM to Measure Network Performance
Measuring Network Performance for UDP
For more detailed information about the statistics displayed in the TCP Historical Statistics window, see
the “TCP Historical Statistics Window” topic in the online help.
Measuring Network Performance for UDP
IPM’s UDP operation measures round-trip latency between a source and any IP-enabled device running
UDP services. Latency is computed by measuring the time taken to send a datagram and receive a
response from the target device. The UDP operation also measures availability and errors for UDP
services.
To measure end-to-end performance for UDP:
Step 1 Define a device as the source device from which to measure performance. For details on defining a
source device, see Defining a Source Device.
Step 2 Define a device as the target of connection requests from the source device. For details on defining a
target, see Defining a Target.
To control how statistics are collected, use the DefaultUDP operation or define your own UDP operation.
For details on defining a UDP operation, see Defining a UDP Operation.
Step 3 Define a collector to measure performance between the source router and target you defined. For details
on defining a collector, see Defining a Collector. If you set the collector’s schedule to On Demand, start
the collector when desired.
Step 4 View the statistics in the UDP Historical Statistics window. For details on viewing end-to-end statistics
for UDP, see Viewing Statistics for UDP.
Defining a UDP Operation
IPM provides a default UDP operation for measuring performance between a source and target. In
addition, IPM provides the option to create, modify, or delete your own UDP operations from the UDP
Operation Configuration window.
To define a UDP operation:
Step 1 From the IPM Main Window, select Edit > Configuration.
The Configuration window appears.
Step 2 Click Operation.
The Operation Configuration window appears within the Configuration window.
Step 3 Click UDP.
3-36
The UDP Operation Configuration window (Figure 3-22) appears.
User Guide for Internetwork Performance Monitor
OL-11291-01
Page 87

Chapter 3 Using IPM to Measure Network Performance
Figure 3-22 UDP Operation Configuration Window
Measuring Network Performance for UDP
Step 4
In the Name field, enter a descriptive name to assign to the operation. In the Description field, you can
enter a brief description of the operation, including its purpose.
Step 5 Select the IP QoS Type as IP Precedence or DCSP. The IP QoS Settings values change based on your IP
QoS Type selection.
• If you have selected IP QoS Type as IP Precedence, select the IP QoS Settings value from the
drop-down. The value you select sets the priority for the HTTP request packet. The default setting
is 0 (no priority). This option sets the ToS bits in the IP packet.
• If you have selected IP QoS Type as DSCP, select the desired IP QoS Settings value from the
drop-down. The value you select defines the packet priority and is based on the DSCP RFC
standards.
Step 6 In the Request Payload (bytes) field, enter the number of bytes to use for the size of the payload of the
request packet. The default setting is 64 bytes.
Step 7 Select or clear the Verify Data checkbox to enable or disable data verification.
If this option is enabled, the Verify Data counter is incremented whenever a response contains
unexpected data. You can use this option to monitor for data corruption. The default setting is for this
box to be cleared (no data verification).
Step 8 In the Target Port field, enter the UDP port number for the target device to use when sending response
packets. Valid values are 7, and 1025 to 65535. The default setting is 7.
• If the target device is a Cisco router running version 12.1 or later of the Cisco IOS software, you can
specify any port that is not well known (that is, you can specify any port number greater than 1024)
to communicate with the SA Agent Responder, as long as someone is listening on that port on the
target. The only allowed well known port is UDP port 7.
OL-11291-01
• If the target is not running version 12.1 or later of the Cisco IOS software, whether a Cisco or a
non-Cisco IP host, you must specify UDP port 7 as the target port.
User Guide for Internetwork Performance Monitor
3-37
Page 88

Measuring Network Performance for UDP
Step 9 Click Add.
IPM adds the newly defined operation to the IPM database.
Step 10 Click Close to close the Configuration window.
For more detailed information about the options available from the UDP Operation Configuration
window, see the “UDP Operation Configuration Window” topic in the online help.
Viewing Statistics for UDP
The UDP Historical Statistics window displays statistical and graphical information gathered over the
monitoring period for the selected UDP collector.
To view end-to-end statistics for UDP:
Step 1 From the IPM Main Window, select one or more UDP collectors (up to 10).
Step 2 Select View > Statistics.
Chapter 3 Using IPM to Measure Network Performance
The UDP Historical Statistics window (Figure 3-23) appears.
Figure 3-23 UDP Historical Statistics Window
3-38
User Guide for Internetwork Performance Monitor
OL-11291-01
Page 89

Chapter 3 Using IPM to Measure Network Performance
Measuring Network Performance for Enhanced UDP
If you selected more than one collector, their statistics appear in a single graph in the Historical
Statistics—Multi-Collector Graph window (see Figure 2-14 for an example).
For more detailed information about the statistics displayed in the UDP Historical Statistics window, see
the “UDP Historical Statistics Window” topic in the online help.
Measuring Network Performance for Enhanced UDP
The Enhanced UDP operation for Voice over IP measures round-trip latency, packet loss, and jitter in IP
networks by generating synthetic UDP traffic. The Enhanced UDP operation sends a defined number of
packets of a defined size from the source to a target with a defined interpacket delay.
Both the source and the target must be running version 12.1 or later of the Cisco IOS software, and the
SA Agent Responder must be enabled on the target.
To enable the SA Agent Responder on the target, use the rtr responder IOS configuration command.
The packets sent out to measure jitter contain packet sequence information, as well as sending and
receiving timestamps from the source and the Responder.
Note The Enhanced UDP operation sends only UDP data traffic, and does not send any voice packets.
The Enhanced UDP operation measures the following network performance statistics:
• Round-trip network latency
• Per-direction packet loss
• Per-direction interpacket delay variance (jitter)
• Network availability and errors
To measure end-to-end performance for Enhanced UDP:
Step 1 Define a device as the source device from which to measure performance. For details on defining a
source device, see Defining a Source Device.
Step 2 Define a device as the target of discovery requests from the source device. For details on defining a
target, see Defining a Target.
To control how statistics are collected, use one of the default Enhanced UDP operations or define your
own Enhanced UDP operation. For details on defining an Enhanced UDP operation, see Defining an
Enhanced UDP Operation.
Step 3 Define a collector to measure performance between the source router and target you defined. For details
on defining a collector, see Defining a Collector. If you set the collector’s schedule to On Demand, start
the collector when needed.
Step 4 View the statistics in the Enhanced UDP Historical Statistics window. For details on viewing end-to-end
statistics for Enhanced UDP, see Viewing Statistics for Enhanced UDP.
OL-11291-01
User Guide for Internetwork Performance Monitor
3-39
Page 90

Measuring Network Performance for Enhanced UDP
Defining an Enhanced UDP Operation
IPM provides several default Enhanced UDP operations for measuring performance between a source
and target. In addition, IPM provides the option to create, modify, or delete your own Enhanced UDP
operations from the Enhanced UDP Operation Configuration window.
To define an Enhanced UDP operation:
Step 1 From the IPM Main Window, select Edit > Configuration.
The Configuration window appears.
Step 2 Click Operations.
The Operation Configuration window appears within the Configuration window.
Step 3 Click Enhanced UDP.
The Enhanced UDP Operation Configuration window (Figure 3-24) appears.
Figure 3-24 Enhanced UDP Operation Configuration Window
Chapter 3 Using IPM to Measure Network Performance
3-40
Step 4
In the Name field, enter a descriptive name to assign to the operation. In the Description field, you can
enter a brief description of the operation, including its purpose.
Step 5 Select the IP QoS Type as IP Precedence or DCSP. The IP QoS Settings values change based on your IP
QoS Type selection.
• If you have selected IP QoS Type as IP Precedence, select the IP QoS Settings value from the
drop-down. The value you select sets the priority for the HTTP request packet. The default setting
is 0 (no priority). This option sets the ToS bits in the IP packet.
• If you have selected IP QoS Type as DSCP, select the desired IP QoS Settings value from the
drop-down. The value you select defines the packet priority and is based on the DSCP RFC
standards.
User Guide for Internetwork Performance Monitor
OL-11291-01
Page 91

Chapter 3 Using IPM to Measure Network Performance
Step 6 In the Request Payload field, enter the number of bytes to use for the size of the payload of the UDP
request packet. The default setting is one of the following values:
• 60 bytes for Default60ByteVoice operations
• 160 bytes for Default160ByteVoice operations
• 1024 bytes for DefaultVPN and DefaultVideo operations
Step 7 In the Packet Interval field, enter the number of milliseconds to use for the interpacket delay between
packets sent from the source router to the target router. The default setting is 20 milliseconds.
Step 8 In the Number of Packets field, enter the number of packets to send to the target to measure latency. The
default setting is 10 packets.
Step 9 In the Target Port field, enter the UDP port number for the target device to use when sending a response
packet. Valid values are 0 to 65535. The default setting is 16400 for Voice and 2000 for other traffic.
Step 10 Click Add.
IPM adds the newly defined operation to the IPM database.
Step 11 Click Close to close the Configuration window.
Measuring Network Performance for Enhanced UDP
For more detailed information about the options available from the Enhanced UDP Operation
Configuration window, see the “Enhanced UDP Operation Configuration Window” topic in the online
help.
Viewing Statistics for Enhanced UDP
The Enhanced UDP Historical Statistics window displays statistical and graphical information gathered
over the monitoring period for the selected Enhanced UDP collector.
To view statistics for Enhanced UDP:
Step 1 From the IPM Main Window, select the collector.
Do not select more than one Enhanced UDP collector. You cannot include Enhanced UDP collectors in
multi-collector graphs.
Step 2 Select View > Statistics.
The Enhanced UDP Historical Statistics window (Figure 3-25 and Figure 3-26) appears.
OL-11291-01
User Guide for Internetwork Performance Monitor
3-41
Page 92

Measuring Network Performance for Enhanced UDP
Figure 3-25 Enhanced UDP Historical Statistics Window—Part 1
Chapter 3 Using IPM to Measure Network Performance
3-42
User Guide for Internetwork Performance Monitor
OL-11291-01
Page 93

Chapter 3 Using IPM to Measure Network Performance
Figure 3-26 Enhanced UDP Historical Statistics Window—Part 2
Measuring Network Performance for Enhanced UDP
OL-11291-01
For more detailed information about the statistics displayed in the Enhanced UDP Historical Statistics
window, see the “Enhanced UDP Historical Statistics Window” topic in the online help.
User Guide for Internetwork Performance Monitor
3-43
Page 94

Measuring Network Performance for Enhanced UDP
Chapter 3 Using IPM to Measure Network Performance
3-44
User Guide for Internetwork Performance Monitor
OL-11291-01
Page 95

CHAPTER
4
Modifying IPM Components
This chapter provides information about modifying IPM components. IPM components include
collectors, source devices, target devices, and operations. Information is provided on viewing, updating,
and deleting these components.
This chapter contains the following major sections:
• Working With Source Devices
• Working With Target Devices
• Working With Operations
• Working With Collectors
• Adding Components Using Seed Files
• Changing IP Addresses
• Setting IPM Database Preferences
• Setting SNMP Timeout and Retry Environment Variables
• Setting New IPM Server Process Timeout Values
• Setting the DISPLAY Variable in Solaris
• Backing Up or Restoring the IPM Database
• NVRAM Settings
• Changing Administrative Password
• Changing IPM Database Password
• Working With Message Log Window
Working With Source Devices
IPM source is a device from which you initiate operations for measuring network performance statistics.
Each source must contain the SA Agent feature and an SNMP agent.
Information about working with source is provided in the following subsections:
• Viewing a List of Configured Source Devices
• Viewing Source Properties
• Adding a New Source Device
• Deleting Source Devices
OL-11291-01
User Guide for Internetwork Performance Monitor
4-1
Page 96

Working With Source Devices
Viewing a List of Configured Source Devices
To view a list of configured sources, select Edit > Configuration from the IPM Main window. The
Configuration window (Figure 2-3) appears. By default, Sources is selected in the navigation pane and
the Source Configuration window appears within the Configuration window.
The Source Configuration window displays source devices you have already configured. From this
window, you can add a new source router, change the configuration of an existing source, or delete an
existing source.
Viewing Source Properties
The Source Properties window allows you to view the properties of a defined source.
To view source properties:
Step 1 From the IPM Main Window, select a collector that uses the source.
Step 2 Select View > Properties.
Chapter 4 Modifying IPM Components
The Properties Viewer window appears. By default, the Collector Properties window appears within the
Properties Viewer window.
Step 3 Click Source.
The Source Properties window (Figure 4-1) appears.
Figure 4-1 Source Properties Window
4-2
For information about these fields, see the “Source Properties Window” topic in the Online help.
User Guide for Internetwork Performance Monitor
OL-11291-01
Page 97

Chapter 4 Modifying IPM Components
Adding a New Source Device
Before you can use a source for a collector, you must add the source to IPM.
You can optionally, verify that the SNMP read community and write community strings are configured
properly on the source. Also, if you want to receive traps at your network management system (NMS),
verify that the router is configured to send SA Agent-generated traps to your NMS. IPM itself does not
receive traps.
For information about configuring SNMP on the source, see the “Configuring Your Routers to Send
SA Agent-Related Traps” section in the “Preparing to Install” chapter of the Installation Guide for
Internetwork Performance Monitor.
For information about adding a new source device, see Defining a Source Device
Deleting Source Devices
You can delete source devices you no longer need. You can delete more than one source device at a time.
Working With Target Devices
Note If a source device has been configured as part of one or more collectors, you must delete the collectors
before you can delete the source device.
To delete a source device:
Step 1 From the Source Configuration window (Figure 2-3), select the source device or sources you want to
delete.
Step 2 Click Delete.
The confirmation box appears,
Step 3 Click Ye s.
The selected source routers are deleted from the IPM database.
Working With Target Devices
IPM targets are destination devices for which you want to gather network performance statistics. A target
can be any IP-addressable device, a Cisco device running the SA Agent Responder, or an SNA host.
Note The SA Agent Responder is supported only in Cisco IOS 12.1(2)T or later. We strongly recommend that
you use software release 12.1 or later.
OL-11291-01
Information about working with target devices is provided in the following subsections:
• Viewing a List of Defined Targets
• Viewing Target Properties
• Adding a New Target
• Deleting Targets
User Guide for Internetwork Performance Monitor
4-3
Page 98

Working With Target Devices
Viewing a List of Defined Targets
After you have defined a device as an IPM target, it appears in the list of defined targets in the Target
Configuration window.
To view a list of defined targets:
Step 1 In the IPM Main Window, select Edit > Configuration.
The Configuration window (Figure 2-3) appears.
Step 2 Click Targ ets .
The Target Configuration window (Figure 2-4) appears.
The Target Configuration window displays a list of all devices defined as IPM targets. From this window,
you can define a new target, modify an existing target, or delete a target.
Viewing Target Properties
Chapter 4 Modifying IPM Components
The Target Properties window allows you to view the properties of a defined target.
To view target properties:
Step 1 From the IPM Main Window, select a collector that uses the target device.
Step 2 Select View > Properties.
The Properties Viewer window (Figure 4-6) appears. By default, the Collector Properties window
appears within the Properties Viewer window.
Step 3 Click Targ et.
The Target Properties window (Figure 4-2) appears.
4-4
User Guide for Internetwork Performance Monitor
OL-11291-01
Page 99

Chapter 4 Modifying IPM Components
Figure 4-2 Target Properties Window
Working With Target Devices
For information about these fields, see the “Target Properties Window” topic in the online help.
Adding a New Target
IPM targets are destination devices for which you want to gather data. A target can be any IP-addressable
device, an SA Agent Responder, or an SNA host.
To add a new target, see the Defining a Target
Deleting Targets
You can delete targets you no longer need. You can delete more than one target at a time.
After you have associated a target with a collector, you cannot delete the target without first deleting the
collector with which it is associated.
To delete a target:
Step 1 From the Target Configuration window (Figure 2-4), select the target or targets you want to delete.
Step 2 Click Delete.
The confirmation box appears,
Step 3 Click Ye s.
The selected targets are deleted from the IPM database.
OL-11291-01
User Guide for Internetwork Performance Monitor
4-5
Page 100

Working With Operations
If you try to delete a target and IPM issues an error message such as Could not delete the target,
appears. The reason could be:
To resolve this problem:
Step 1 Make sure the target is not being used as a final target by any collector. On the IPM Main Window, look
for the target’s name in the Target column. If you find the target’s name, you must delete that collector
before you can delete the target.
If you cannot find the target’s name, remember that the Path Echo Historical Statistics window shows
only the 10 most used paths.
To see the rest of the intermediate paths, you must use the IPM Path Usage report. To do so:
a. On the CiscoWorks homepage, select Reports > Configuration Reports > Collectors.
b. Select the first Path Echo collector in the list and click Path Usage in the Details column.
c. Click a path to expand it, showing all of its intermediate hops, and look for the target’s name. If you
Chapter 4 Modifying IPM Components
• The target is being used as a final target by one or more collectors.
• The target is being used as an intermediate hop by one or more Path Echo collectors.
The Collector Information page appears.
The Path Usage page appears.
find the target’s name, you must delete that Path Echo collector before you can delete the target.
d. Repeat this procedure for every path under every Path Echo collector.
Working With Operations
An IPM operation is an alias for a set of parameters used in measuring performance. information about
working with operations is provided in the following subsections:
• Viewing a List of Defined Operations
• Viewing Operation Properties
• Adding a New Operation
• Setting Thresholds and Generating Alerts
• Deleting Operations
Viewing a List of Defined Operations
To view a list of defined operations:
Step 1 From the IPM Main Window, select Edit > Configuration.
4-6
The Configuration window (Figure 2-3) appears.
Step 2 Click Operations.
The list of operations expands to show the types of operations that were defined.
User Guide for Internetwork Performance Monitor
OL-11291-01
 Loading...