

Page 1

CONTENTS
i
1
2
3
4
INTRODUCTION 1
Instrument overview.............................................................................................................. 2
Instrument specifications ....................................................................................................... 3
Safety warnings .................................................................................................................... 3
UNPACKING AND ASSEMBLY 5
Unpacking the CMR V -4500................................................................................................. 5
User-Supplied Equipment ..................................................................................................... 6
CMRV-4500 APPARATUS DESCRIPTION 7
CMR V -4500 unit/accessories ............................................................................................... 7
Air/W ater Heat Exchanger .................................................................................................... 9
Front panel operations ........................................................................................................ 10
SETUP 11
Physical placement.............................................................................................................. 11
Tubing connections ............................................................................................................. 12
Filling the Air/W ater Heat Exchanger ................................................................................... 12
Electrical /serial connections ................................................................................................ 13
Pulley-wheel installation ...................................................................................................... 14
Installation notes ................................................................................................................. 15
Setting the CMR V instrument address ................................................................................. 15
Cleaning the instrument housing ........................................................................................... 16
Flushing and draining the Air/W ater Heat Exchanger ............................................................ 16
Flushing fluid from the Exchanger ............................................................................ 16
Draining fluid from the Exchanger ............................................................................ 17
5
VISCPRO® INSTALLATION 19
VISCPRO® for W indows® XP®.......................................................................................... 19
Installing VISCPRO® software............................................................................................ 19
Computer requirements........................................................................................... 19
Windows® XP® installation ...................................................................................... 19
Installation actions................................................................................................... 19
CANNON
®
Mini-Rotary Viscometer
Version 1.1e—October, 2011 • CANNON
2139 High Tech Road • State College, PA • 16803 • USA
CMRV-4500
Instruction & Operation Manual
®
Instrument Company
Page 2

ii
5
6
7
VISCPRO® INSTALLATION (continued)
Running the software........................................................................................................... 20
Loading software .................................................................................................... 20
Displaying the Instrument V iew window................................................................... 20
V iewing report data ................................................................................................ 22
Logging in ............................................................................................................... 23
Checking Instrument Settings .................................................................................. 23
Setting multiple CMR V instrument addresses ....................................................................... 25
Security options .................................................................................................................. 25
Initial security setup................................................................................................. 26
PREPARING FOR CMRV TESTING/CALIBRATION 29
Cleaning cycle .................................................................................................................... 29
Cleaning procedure................................................................................................. 29
Inserting rotors ....................................................................................................... 32
CALIBRATING THE CMRV TEMPERATURE PROBE 33
8
9
Probe calibration procedure .................................................................................... 33
Manual restoration of voltage and offset data ........................................................... 34
CALIBRATING THE CMRV CELLS 35
Calibration theory ............................................................................................................... 35
Cell calibration procedure ................................................................................................... 36
Preparing the cells................................................................................................... 36
Cell calibration test procedure ................................................................................. 38
USING THE CMRV SOFTWARE 41
VISCPRO® generic instrument interface .............................................................................. 41
Main options .......................................................................................................... 42
Security options ...................................................................................................... 44
Initial security setup................................................................................................. 45
Print/Print setup options .......................................................................................... 46
Analyses options................................................................................................................. 46
Analysis types......................................................................................................... 47
Analyses menu options............................................................................................ 47
Window options ................................................................................................................. 48
CANNON
®
Mini-Rotary Viscometer
Version 1.1e—October, 2011 • CANNON
2139 High Tech Road • State College, PA • 16803 • USA
CMRV-4500
Instruction & Operation Manual
®
Instrument Company
Page 3

iii
9
10
USING THE CMRV SOFTWARE (continued)
CMR V module menu options .............................................................................................. 49
Configure options ................................................................................................... 49
Print Instrument and Tray Settings ........................................................................... 49
Instrument Settings.................................................................................................. 49
Profile Designer ...................................................................................................... 50
V iew Cell Constants ............................................................................................... 50
Saving a configuration ............................................................................................. 51
Restoring instrument settings from a saved configuration ........................................... 51
Calibrate Cell Constants ......................................................................................... 52
Service menu options .......................................................................................................... 54
SUMMARY OF TEST PROCEDURE 55
ASTM D 4684 method ...................................................................................................... 55
ASTM D 3829 method ...................................................................................................... 56
ASTM D 6821 method ...................................................................................................... 56
ASTM D 6896 method ...................................................................................................... 57
SAE J300 notes ................................................................................................................. 57
Delayed start option............................................................................................................ 57
11
12
RUNNING PROFILES 59
Starting a profile ................................................................................................................. 61
Profile operation notes ........................................................................................................ 62
Adjusting temperature at the end of a profile ............................................................ 63
Displaying a profile graph .................................................................................................... 63
Printing a profile graph ........................................................................................................ 64
Exporting time/temperature profile data ............................................................................... 64
MEASURING YIELD STRESS AND VISCOSITY 65
Measuring yield stress ......................................................................................................... 65
Notes on yield stress testing ................................................................................................ 67
Measuring apparent viscosity .............................................................................................. 67
Notes on viscosity testing .................................................................................................... 68
Printing yield stress/viscosity test results ............................................................................... 69
Exporting yield stress/viscosity data ..................................................................................... 69
CANNON
®
Mini-Rotary Viscometer
Version 1.1e—October, 2011 • CANNON
2139 High Tech Road • State College, PA • 16803 • USA
CMRV-4500
Instruction & Operation Manual
®
Instrument Company
Page 4

iv
13
14
ANALYSIS CONFIGURATION OPTIONS 71
Creating an analysis ............................................................................................................ 71
Sorting analysis data ........................................................................................................... 73
Using the date filter ............................................................................................................. 73
Using the sample/error filter................................................................................................. 74
Using the report/port output filter......................................................................................... 75
Reconfiguring a displayed analysis ....................................................................................... 75
Resizing table columns ........................................................................................................ 76
Saving a current analysis configuration ................................................................................. 76
Deleting an analysis configuration......................................................................................... 76
Printing an analysis .............................................................................................................. 76
Keystrokes for selecting data for printing ................................................................. 77
DESIGNING CUSTOMIZED PROFILES 79
Cooling Profiles .................................................................................................................. 79
The Profile Designer ........................................................................................................... 79
Opening the Profile Designer ................................................................................... 80
Interface options ..................................................................................................... 81
Managing profiles ................................................................................................... 81
Using the Profile Editor ........................................................................................... 82
Editing points .......................................................................................................... 83
Deleting points ........................................................................................................ 83
Cooling profile limitations .................................................................................................... 84
Profile Designer test parameters .......................................................................................... 84
Changing test parameters ....................................................................................... 85
15
16
17
MRV DATA TABLE ANALYSIS 87
Configuring the MR V Data T able ............................................................................ 88
ERROR LOG TABLE ANALYSIS 91
Configuring the Error Log analysis ........................................................................... 91
EXPORT ANALYSES 95
Configuring the Port Export analyses ....................................................................... 96
CANNON
®
Mini-Rotary Viscometer
Version 1.1e—October, 2011 • CANNON
2139 High Tech Road • State College, PA • 16803 • USA
CMRV-4500
Instruction & Operation Manual
®
Instrument Company
Page 5

v
18
19
A
USING THE DATABASE MANAGER 101
Archiving old data................................................................................................. 102
Changing the database directory............................................................................ 102
Importing archived data ........................................................................................ 103
Repairing/compacting the database........................................................................ 103
Exit ...................................................................................................................... 103
WARRANTY/RETURN INFORMATION 105
Products limited warranty.................................................................................................. 105
Reagent and chemical warranty ......................................................................................... 105
APPENDIX A — TROUBLESHOOTING 107
Instrument status window not updating .................................................................. 107
The CMR V -4 is not heating properly..................................................................... 107
The Y ield and V iscosity lights on the CMR V front panel are blinking rapidly ............ 107
CMR V cooling/temperature control problems........................................................ 107
Yield stress or viscosity test results inconsistent...................................................... 108
T est icons "greyed out"--unable to initiate viscosity tests ......................................... 108
B
C
D
I
APPENDIX B — REPLACEMENT PARTS LIST 109
APPENDIX C — THERMOMETRY 111
Kinematic viscosity and temperature...................................................................................111
ASTM thermometer tables................................................................................................ 112
ASTM D 445 — Checking the ice point ........................................................................... 113
NBS Monograph150: Joining separated mercury columns ................................................. 115
APPENDIX D — MULTI-UNIT CONFIGURATION 117
Introduction ...................................................................................................................... 117
Procedure ........................................................................................................................ 117
INDEX 119
CANNON
®
Mini-Rotary Viscometer
Version 1.1e—October, 2011 • CANNON
2139 High Tech Road • State College, PA • 16803 • USA
CMRV-4500
Instruction & Operation Manual
®
Instrument Company
Page 6

vi
This page intentionally left blank.
CANNON
®
Mini-Rotary Viscometer
Version 1.1e—October, 2011 • CANNON
CMRV-4500
Instruction & Operation Manual
®
Instrument Company
2139 High Tech Road • State College, PA • 16803 • USA
Page 7
CHAPTER
1
1
Purpose of the manual
Instrument utility
NOTE
INTRODUCTION
This manual has been written to provide the information necessary for
proper installation, operation, and maintenance of the CANNON
Rotary Viscometer (CMRV-4500).
®
The CANNON
viscosity and yield stress of engine oils and drive line lubricants within
the temperature range of -10
4684, D 3829, D6821 and D 6896. ASTM test method D 4684 is required
by the Society of Automotive Engineers (SAE) Engine Oil Viscosity
Classification SAE J300.
The CMRV-4500 capabilities have been tailored to the requirements of
the current ASTM methods cited above. For this reason, the instrument
may not be suitable for some general-purpose viscometry applications.
Consult with CANNON® Customer Service before testing with materials
and/or methodology at significant variance with ASTM D 4684, ASTM D
3829 or ASTM D 6821.
Mini-Rotary Viscometer is used to measure the apparent
°
C to -40°C using ASTM test methods D
®
Mini-
Improvements
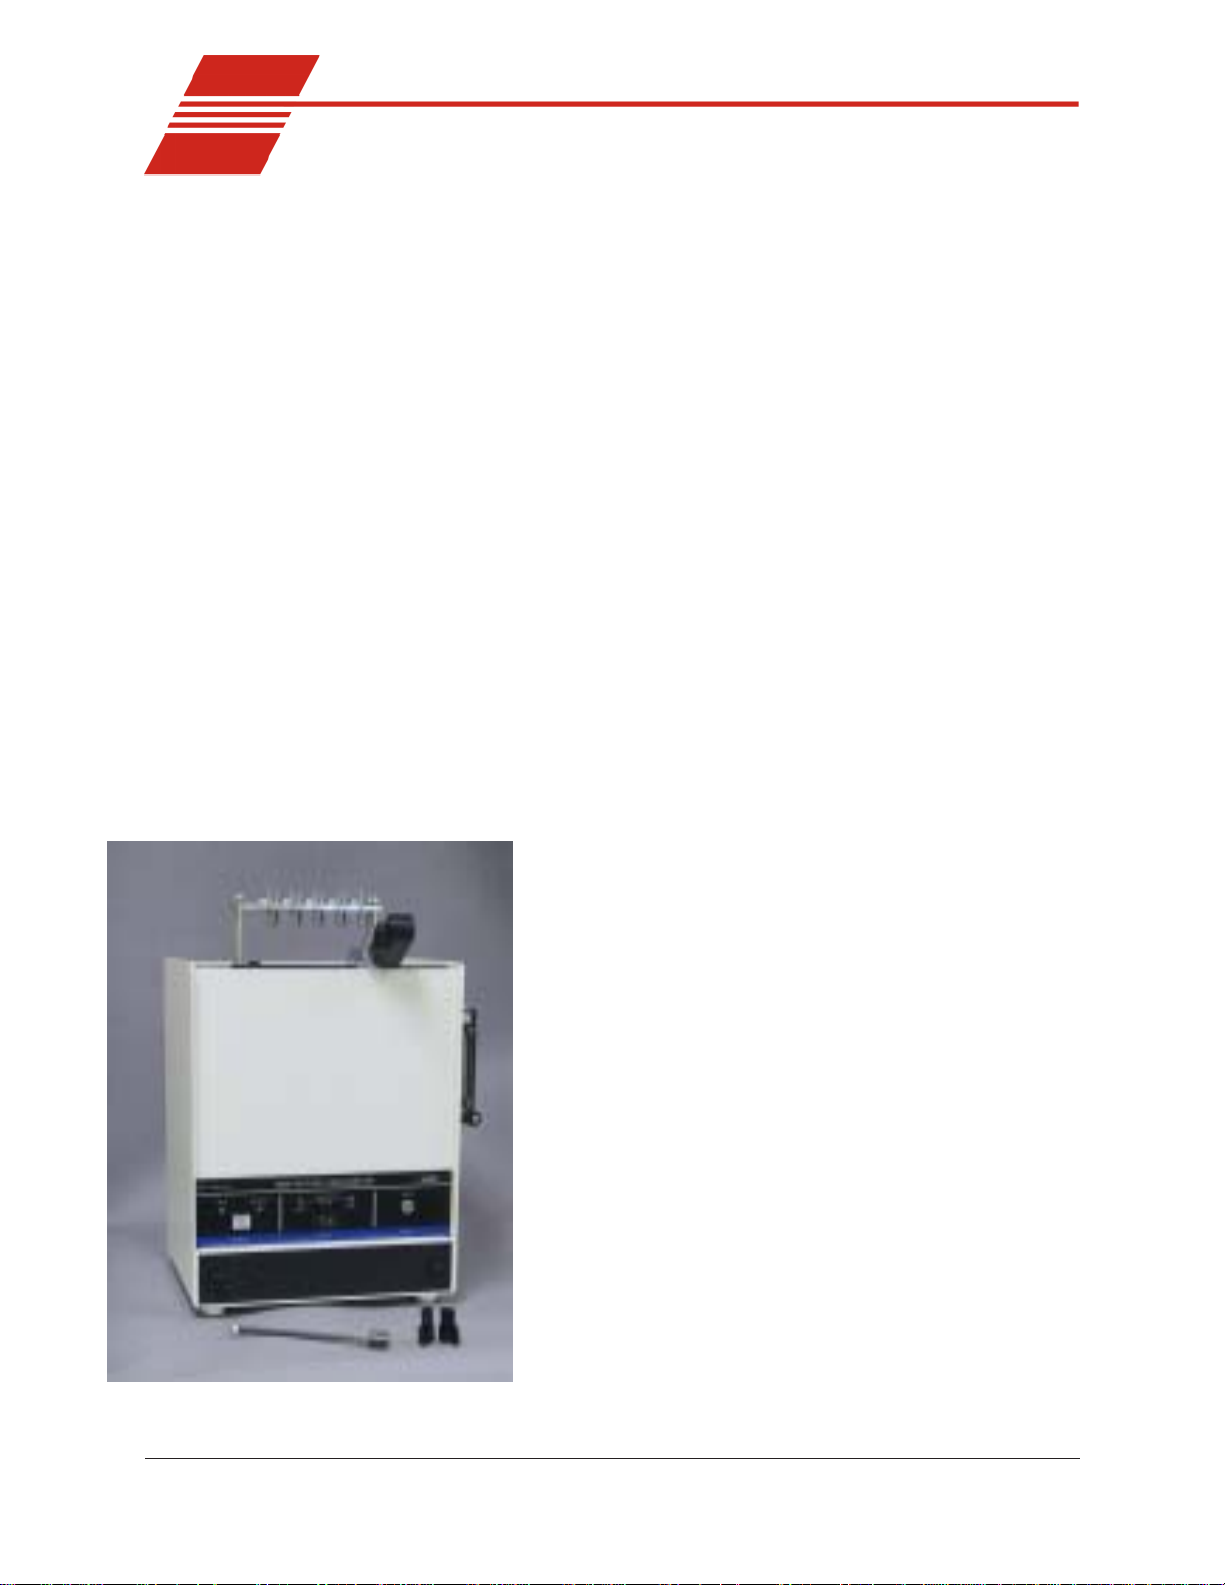
CMRV-4500 with pulley-wheel assembly
The CMRV-4500 is a state-of-the-art system offering many superior
features including:
New Method compatibility
The CMRV-4500 is fully compatible with ASTM D 6821,
the new Drive Line Lubricants test method. The CMRV-4500
is fully compatible with ASTM D 6896, a new method for
testing used diesel oils.
Improved insulation for temperature control
The CMRV-4500 instrument features a redesigned housing
and accessory rotor caps to enhance insulating characteristics
and precision.
Software library of temperature profiles
(cooling profiles)
Predefined cooling profiles that comply with methods ASTM
D 3829, ASTM D 4684, ASTM D 6821 and ASTM D 6896
are supplied with the CMRV software. The user may also
create custom cooling profiles with the Profile Designer.
VISCPRO
®
The VISCPRO
Profile Designer for creating unique cooling profiles.
software for Windows® XP® features a
®
software with Profile Designer
CANNON
®
Mini-Rotary Viscometer CMRV-4500 Instruction & Operation Manual
Version 1.1e—October, 2011 • CANNON
2139 High Tech Road • State College, PA • 16803 • USA
®
Instrument Company
Page 8

2
Networking capability for multiple instruments
®
The VISCPRO
software can control/monitor up to four CMRV instruments with one computer via RS-485 serial connections. See APPENDIX
D for more information.
Instrument overview
The CANNON® Mini-Rotary Viscometer is designed for precision
control of temperature over time, enabling accurate yield stress and
viscosity measurement of oil samples in conformance with ASTM D
3829, ASTM D 4684, ASTM D 6821 and ASTM D 6896 test methods.
Test procedure
Oil samples placed in the CMRV-4500 viscometric cells are heated and
cooled at a predetermined rate according to a user-specified cooling
profile. The cooling profile parameters are downloaded to the CMRV4500 onboard memory via a serial interface with the host computer. The
CMRV-4500 then uses this profile to control the rate of temperature
change, independent of the host computer.
All three methods specify that the samples be initially heated to ensure
that all components of the sample are released into solution. The samples
are then slowly cooled to the test temperature using the user-selected
temperature profile and maintained at test temperature for a specified
soak period. Following the soak period, apparent viscosity (and yield
stress if applicable) for each sample is determined by applying a constant
torque to, and measuring the rotational speed of, a cylindrical rotor which
has been immersed in the sample.
The time required for completion of the ASTM D 3829 test cycle is
approximately 19 hours. The time required for completion of the ASTM
D 4684 (TP-1, two-day) test is 45½ to 53½ hours. The time required for
completion of the ASTM D 6821 test cycle is approximately 18 hours.
The time required for completion of the ASTM D 6986 test cycle is
approximately 43½ to 53½ hours.
NOTE
CANNON
See Chapter 10 for additional information on the ASTM procedures.
®
Mini-Rotary Viscometer CMRV-4500 Instruction & Operation Manual
Version 1.1e—October, 2011 • CANNON
2139 High Tech Road • State College, PA • 16803 • USA
®
Instrument Company
Page 9
Instrument specifications
ledoMtnemurtsnI
snoisnemiD )"52.91×52.01×5.21(hgihmm984×peedmm062×ediwmm713
thgieW )sbl14(gk6.81
thgieWgnippihS )sbl06(gk72
erutarepmetlanoitarepO C°04-otC°08
snoitidnoCgnitarepO IIyrogetacnoitallatsnI;gnisnednoc-nonHR%09-%01,C°03-C°51
gnitaResuF "¼1;V052A5M×"¼
ecnailpmoC )CEE/32/37(evitceridegatlovwoL;)CEE/633/98(evitceridCME
/rebmuNgolataC
stnemeriuqeRlacirtcelE
3
SNOITACIFICEPSSEIRES0054VRMC
0054ledoM
2eergednoitulloP
).ces06,CDV0091(TOP-IH
)0054ledoM(12R-8279 )0054ledoM(22R-8279
ylbmessAkcolBVRMC
%01±CAV001
sttaw004,zH06/05
)F0054ledoM(32R-8279 )sledoMllA(
ylbmessAkcolBVRMC
%01±CAV032
sttaw004,zH06/05
ylbmessAkcolBVRMC
%01±CAV511
sttaw004,zH06/05
retaW/riAVRMC
regnahcxEtaeH
)1556.25P(%01±CAV001
)2456.25P(%01±CAV511
)3456.25P(%01±CAV032
sttaw0011,zH06/05
.tinuruoyhtiwdeilppusdrocrewopdevorppaehtylnoesU
Safety warnings
Please observe the following safety procedures and notices for proper
operation of your CMRV-4500 unit:
• Make sure that your unit is operated only by qualified personnel
• Make sure that you read and understand all operating instructions
and safety precautions listed in this manual before installing or
operating your unit. If you have questions regarding instrument
operation or documentation, contact CANNON
®
Instrument Company.
• Deviation from the installation, operation or maintenance procedures
described in this manual may result in a hazardous situation and may
void the manufacturer's warranty .
• Transport the unit with care. Sudden jolts or drops may cause dam-
age to components.
• Observe all warning labels.
• Never remove warning labels.
• Never operate damaged or leaking equipment.
• Always turn off the unit and disconnect the mains cable from the
power source before performing service or maintenance procedures,
or before moving the unit.
• Always remove sample from the cells before moving the unit.
• Never operate the equipment with damaged mains power cables.
CANNON
®
Mini-Rotary Viscometer CMRV-4500 Instruction & Operation Manual
Version 1.1e—October, 2011 • CANNON
®
Instrument Company
2139 High Tech Road • State College, PA • 16803 • USA
Page 10
4
• Refer all service and repairs to qualified personnel.
In addition to the warnings previously listed, additional cautions are
posted throughout the manual. These warnings may be designated by an
appropriate symbol inside an equilateral triangle. General cautions are
General Caution
indicated with an exclamation point (see diagram, left). Read and follow
these important instructions. Failure to observe these instructions can
result in permanent damage to the unit, significant property damage, and
personal injury.
Hot surface cautions (see diagram, left) may be attached on or near hot
surfaces of the CMRV-4500. Avoid touching these surfaces when running
Hot Surface Caution
profiles at temperatures above 50°C.
The Protective Conductor Terminal symbol is used to indicate required
ground connections for your instrument electrical supply .
Protective Conductor
WARNING
AC Power Input Symbol
( O )
Supply OFF Symbol
When supplying power to this instrument, connect the protective ground
(earth) terminals of the instrument to the protective conductor of the
(supplied) line (MAINS) power cord. The main plug for the power cord
should only be inserted in a socket outlet (receptacle) provided with a
protective ground (earth) contact.
Do not use an extension cord (power
cable) without a protective conductor (grounding).
The ~MAINS symbol indicates instructions or connections for the AC
power supply . The AC Power input must match the electrical specifications listed on the label on the rear panel of the instrument. The supplied
AC Mains power cord must be attached to the connector labelled
~MAINS. This connection serves as a means of disconnect and should be
readily accessible.
The (O) symbol indicates the OFF position for the electrical switches for
your unit (AC Mains or accessories).
CANNON
®
Mini-Rotary Viscometer CMRV-4500 Instruction & Operation Manual
Version 1.1e—October, 2011 • CANNON
2139 High Tech Road • State College, PA • 16803 • USA
®
Instrument Company
Page 11

CHAPTER
5
2
UNPACKING AND ASSEMBLY
Unpacking the CMRV-4500
CAUTION
Some CMRV components, including the Air/Water Heat Exchanger, are
quite heavy. To avoid injury, obtain necessary assistance when lifting
and moving shipping cartons and heavier unpacked components.
Remove all components from the shipping container(s).
Remove any and all packing materials (styrofoam, etc.) from the
components.
V erify reception of shipped materials by comparing equipment items
with packing/parts list(s). Report missing items to CANNON
ment Company immediately.
®
Instru-
Damaged items
System components
Inspect each component for signs for damage. Report damages to the
shipper and to the CANNON
Retain all packing materials until the instrument is connected and functioning properly. If any component(s) must be returned to
CANNON
aged in the original shipping container. Refer to Chapter 19 of this
manual for instructions on returning defective equipment. Customers
outside the United States should contact the local CANNON® agent for
procedures on returning products to CANNON® .
Before beginning assembly , please verify that all components listed on
the packing slip are present, including:
CMRV-4500 chassis/controller
Air/Water Heat Exchanger
®
Instrument Company , the damaged item(s) should be repack-
®
Instrument Company immediately .
Main power cord
Pulley-wheel assembly
9 Matched rotors
9 Rings and threads
RS-232 interface cable
Small uncalibrated thermometer (0°C to +105°C)
Large calibrated ASTM thermometer (-46°C to +30°C)
3k-ohm temperature probe
CD-ROM with VISCPRO
®
software for Windows® XP
®
CANNON
®
Mini-Rotary Viscometer CMRV-4500 Instruction & Operation Manual
Version 1.1e—October, 2011 • CANNON
2139 High Tech Road • State College, PA • 16803 • USA
®
Instrument Company
Page 12

6
Set of weights:
One 150-gram weight • One hook-cage • Nine additional weights
1 Bottle of N105B with test sample and data sheet
Tubing and tube clamps
Plexiglas
®
T op Cover
Instruction & Operation Manual
9 Rotor bearing pins
10 Rotor locking pins
User-Supplied Equipment
The user must supply an electrical power source matching the electrical
requirements indicated on the rear panel of the CMRV-4500 model.
Computer
Cleaning supplies
®
An IBM-compatible computer with the W indows
XP® operating system
(see computer specifications sheet included with your instrument) and
printer are also required.
The following items are required for regular cleaning of the viscometer
cells between tests:
oil solvent
acetone
suitable solvent-resistant container for placing/cleaning rotors
vacuum source with trap for solvent and oil
flexible tube, about 150 mm long and 3-5 mm in diameter, connected
to the vacuum trap
two plastic squeeze bottles, each with an extension long enough to
direct oil solvent and acetone directly into the viscometer cells
CANNON
®
Mini-Rotary Viscometer CMRV-4500 Instruction & Operation Manual
Version 1.1e—October, 2011 • CANNON
2139 High Tech Road • State College, PA • 16803 • USA
®
Instrument Company
Page 13
CHAPTER
7
3
CMRV-4500 APPARATUS
CMRV-4500 unit/accessories
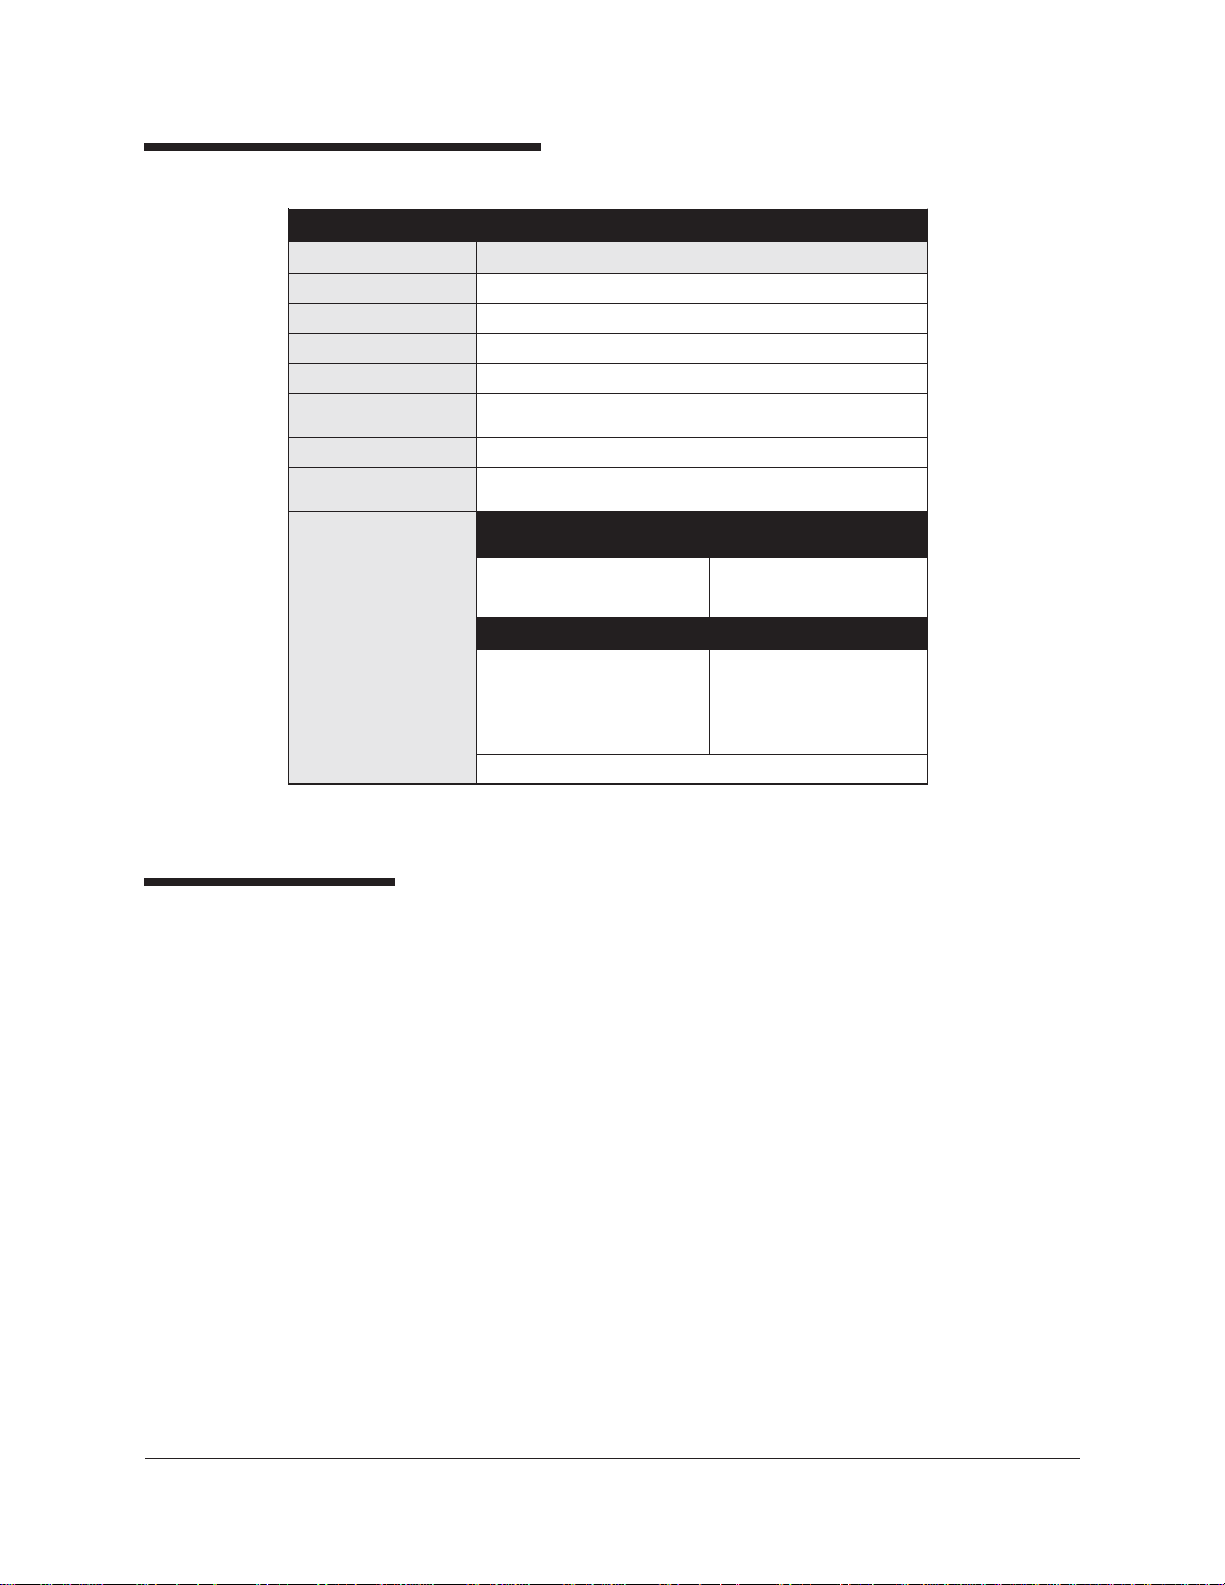
The CMRV-4500 unit contains an aluminum block with
a heater for warming the
block. Nine viscometric cells
are closely fitted into nine
holes in the block (see photo).
There are also two thermometer wells in the block.
Lower rotor bearing
Each viscometric cell
consists of an aluminum
block aperture with a
rotor resting in a stainless
steel cup at the base. The
rotor is attached to a rotor
shaft with a pivot point at
the bottom. The pivot
point fits a mating
conical depression at the
bottom of the stainless
steel cup; this mechanism
serves as the lower
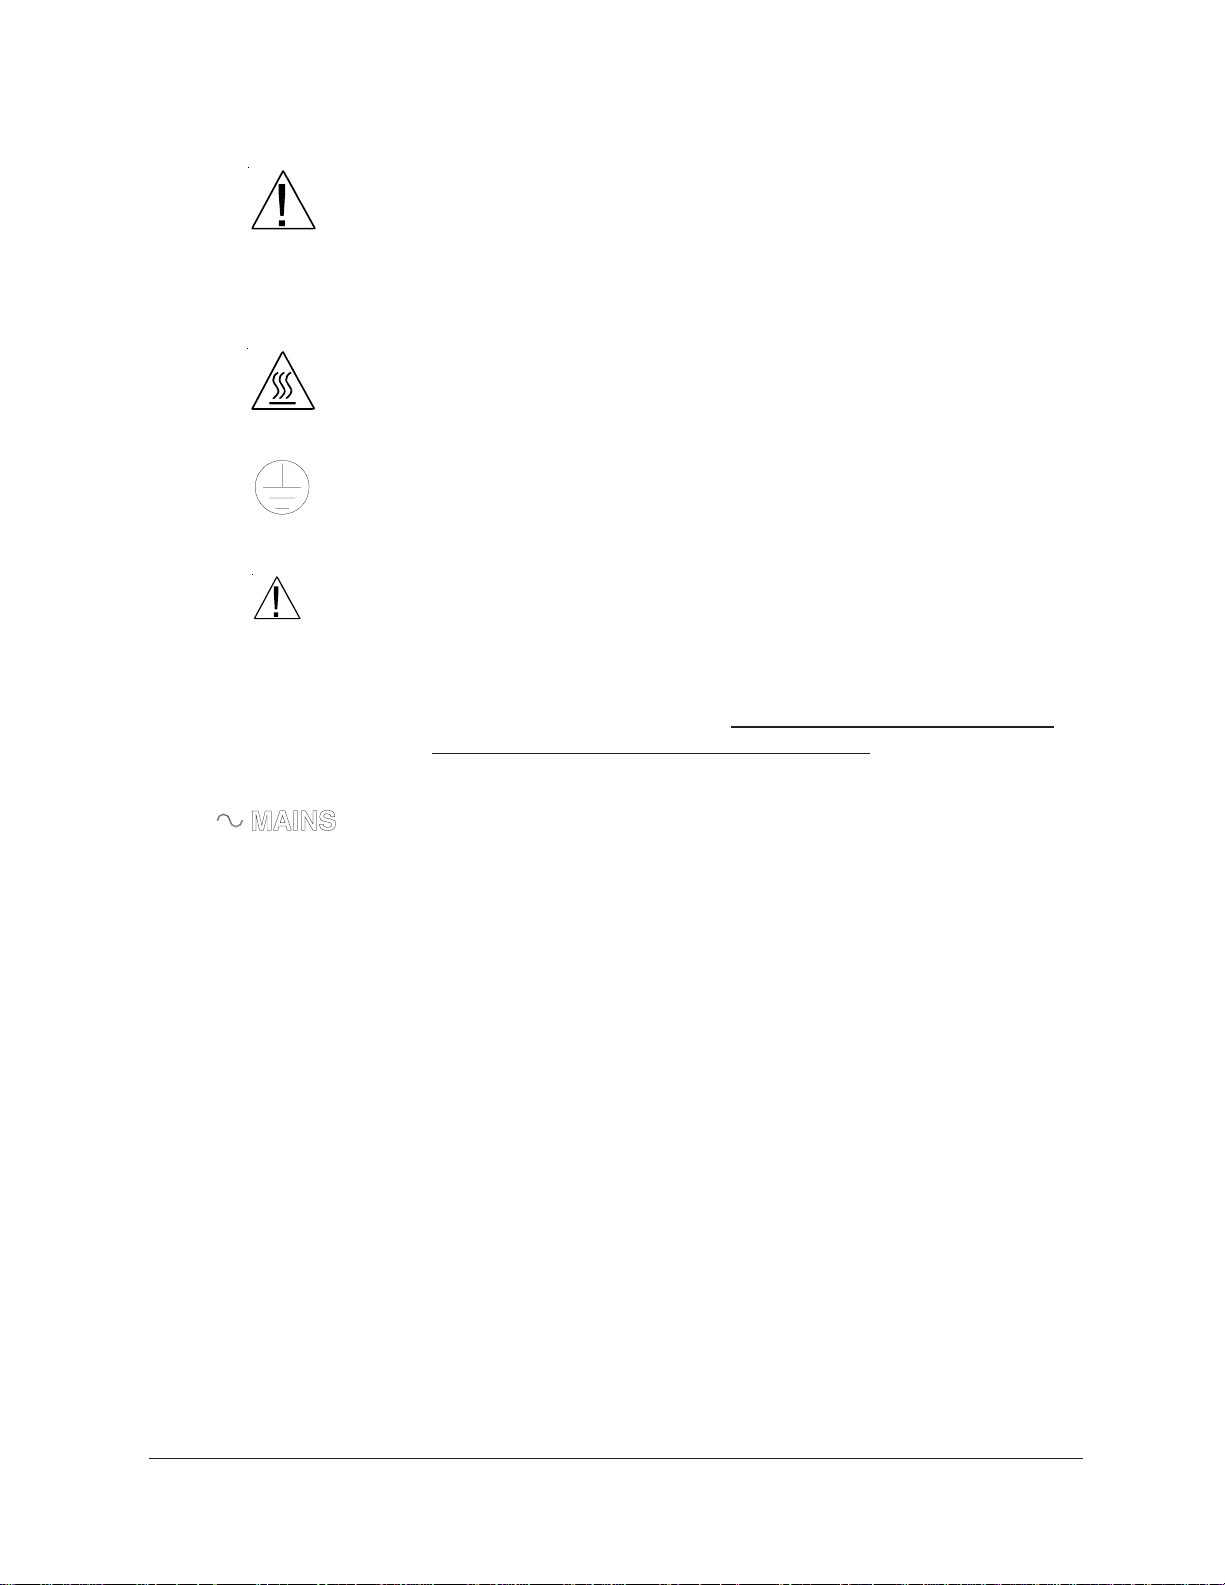
bearing. The standard rotor composition is hardened stainless steel. The
drive line rotor composition is Delrin
(NOTE: The drive line rotors/pins/
weights must be purchased separately
from CANNON®.)
DESCRIPTION
CMRV-4 unit with rotors inserted
and thread wound on pulley-wheel
Rotor for oil testing (top) and
drive line lubricant testing
®
Upper rotor bearing
CANNON
The upper bearing consists of a brass
insert at the top of the rotor shaft with
a 1.2 mm hole on the shaft axis. A
cylindrical rotor pin is inserted
through the upper bearing plate about
one or two millimeters into the hole
on the shaft axis.
Upper bearing assembly with
rotor and rotor locking pin in
place
®
Mini-Rotary Viscometer CMRV-4500 Instruction & Operation Manual
Version 1.1e—October, 2011 • CANNON
2139 High Tech Road • State College, PA • 16803 • USA
®
Instrument Company
Page 14
8
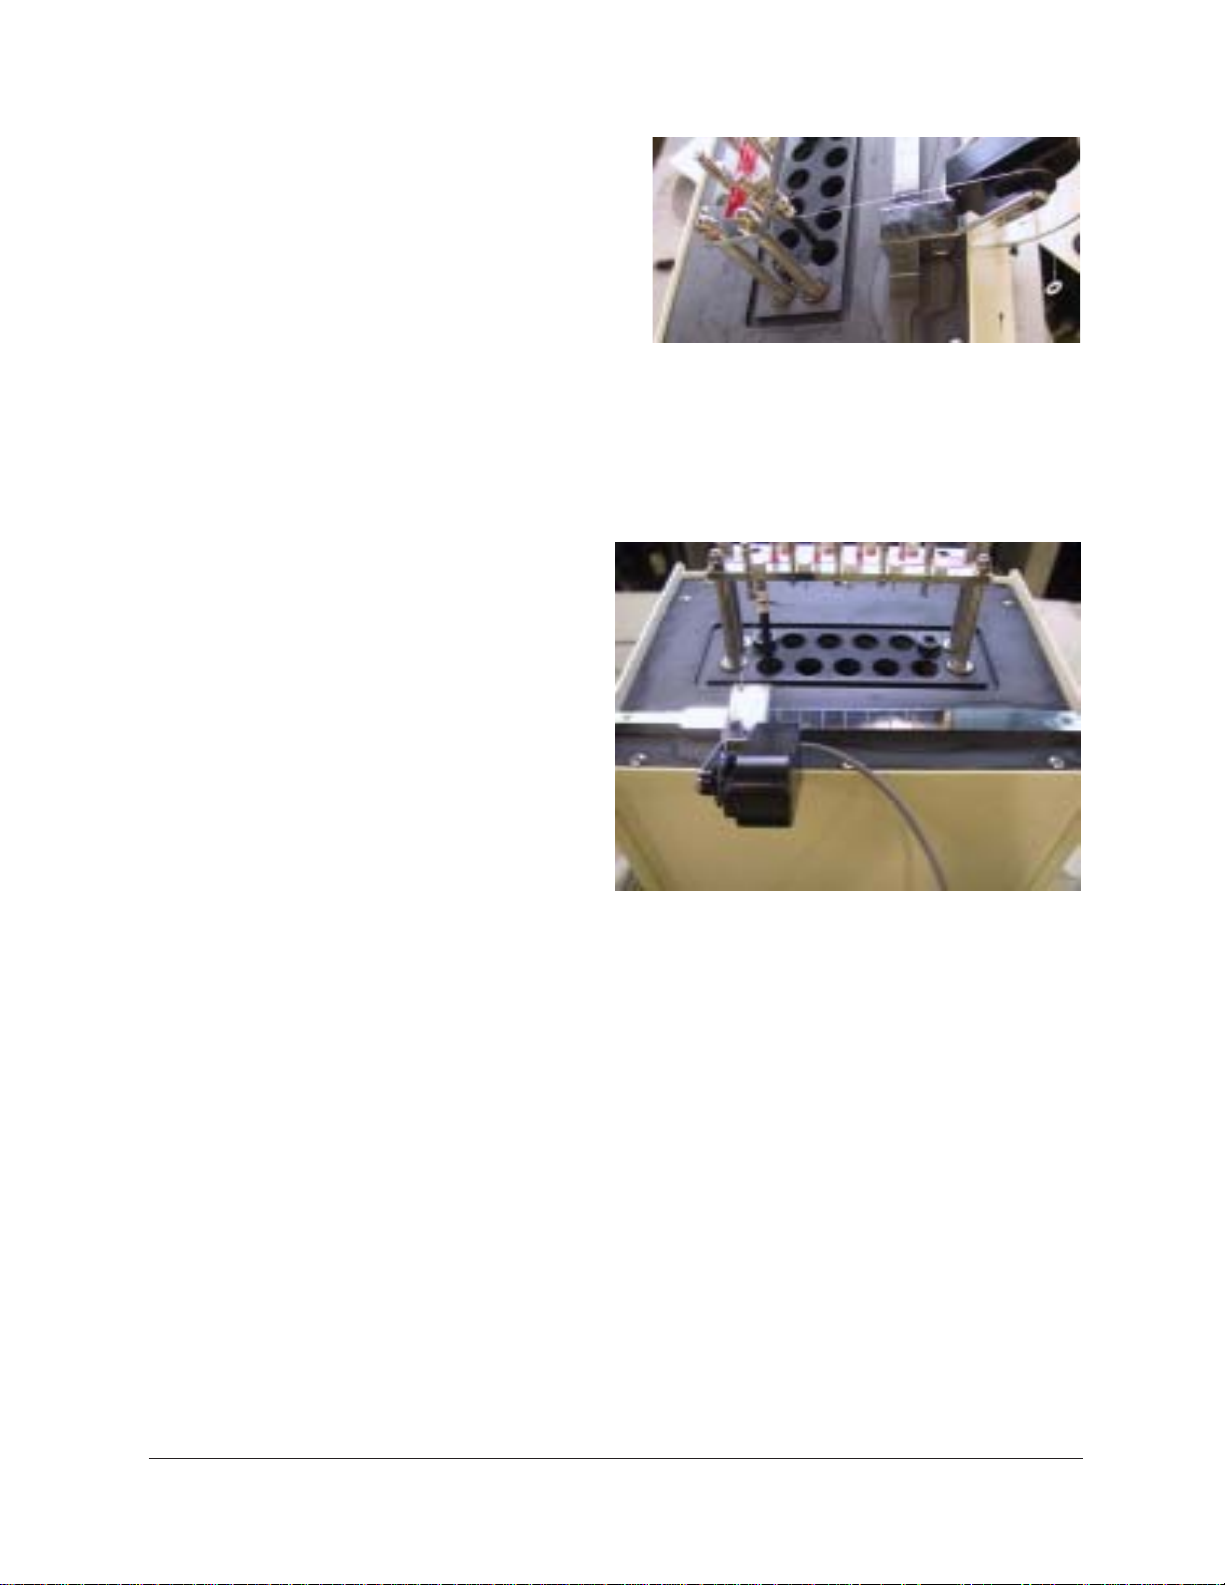
Rotor crossbar
Rotor locking pins
Pulley-wheel assembly
The rotor crossbar is
used to hold the loop
at the end of the
thread. It also serves
as an indicator for
(optional) manual
timing of rotor
rotation.
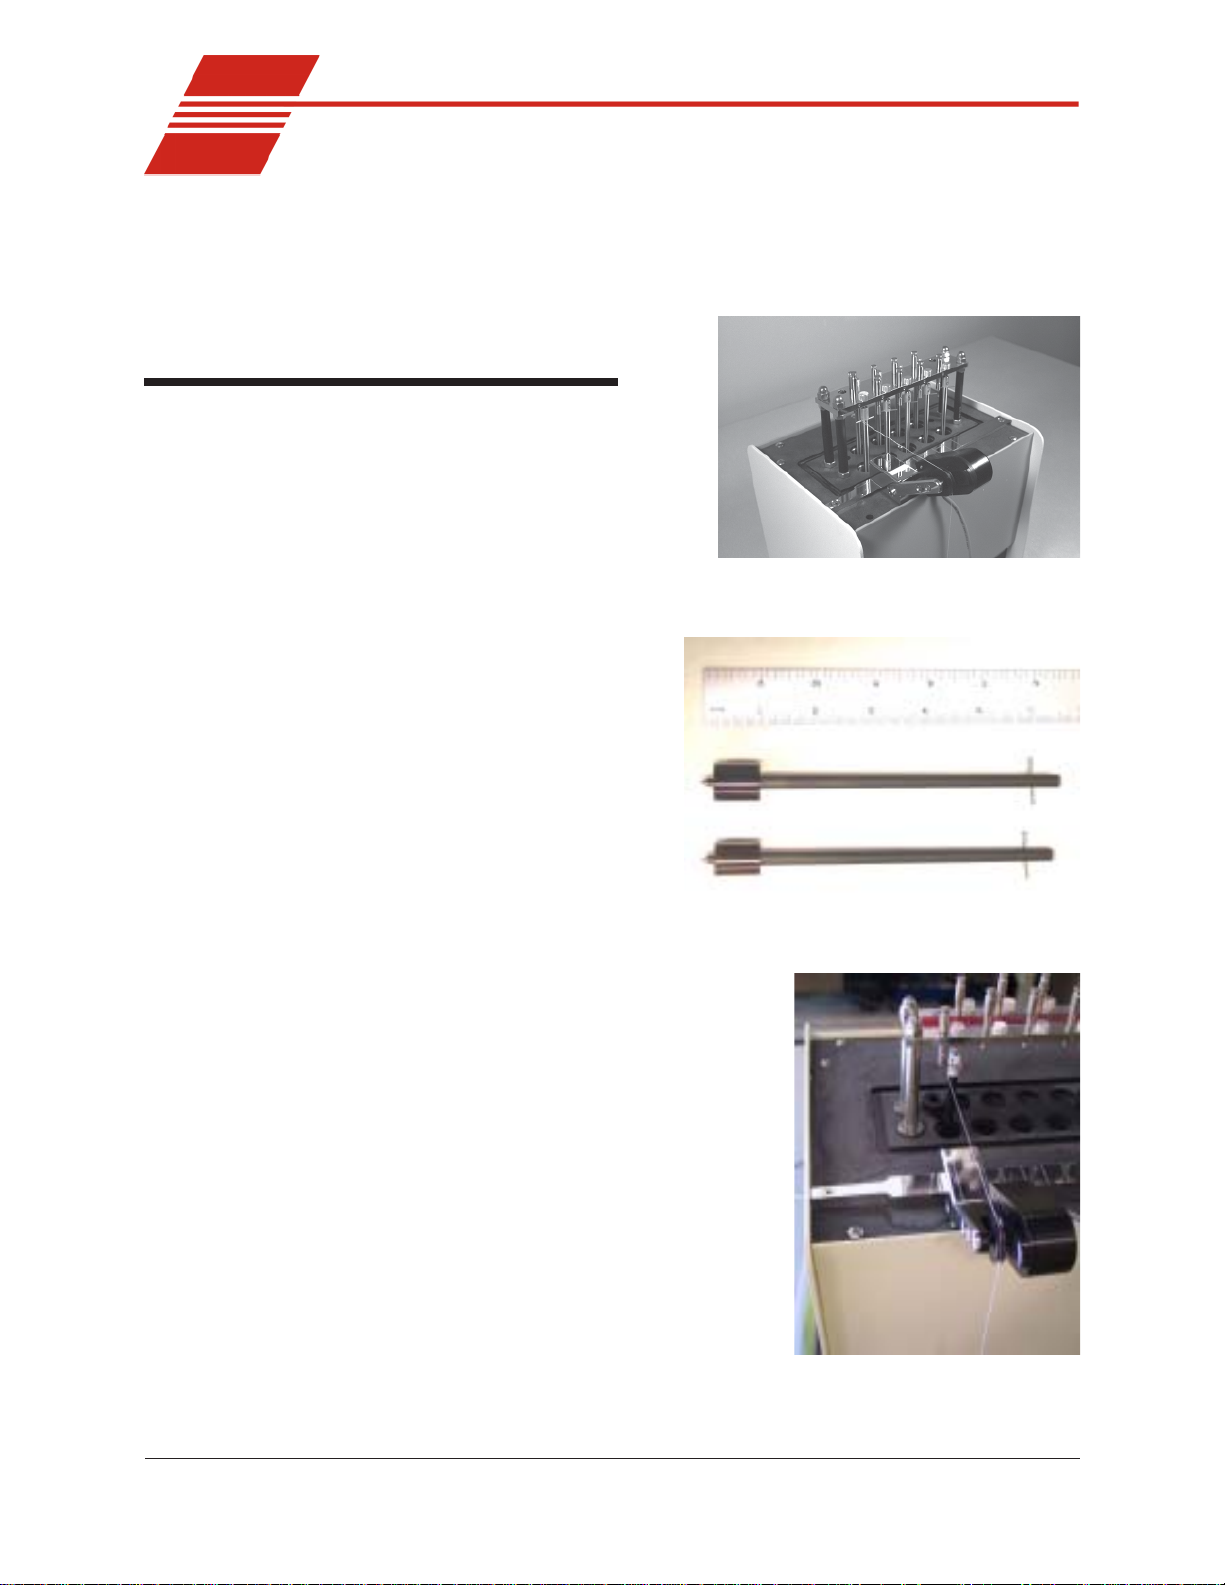
The rotor locking pins
String on rotor and pulley-wheel assembly
are used to prevent
unwanted rotor rotation. When the locking pin is lowered over the rotor
crossbar (see photo), rotation is prevented. When the pins are in the
raised (detent) position, the rotors are free to rotate.
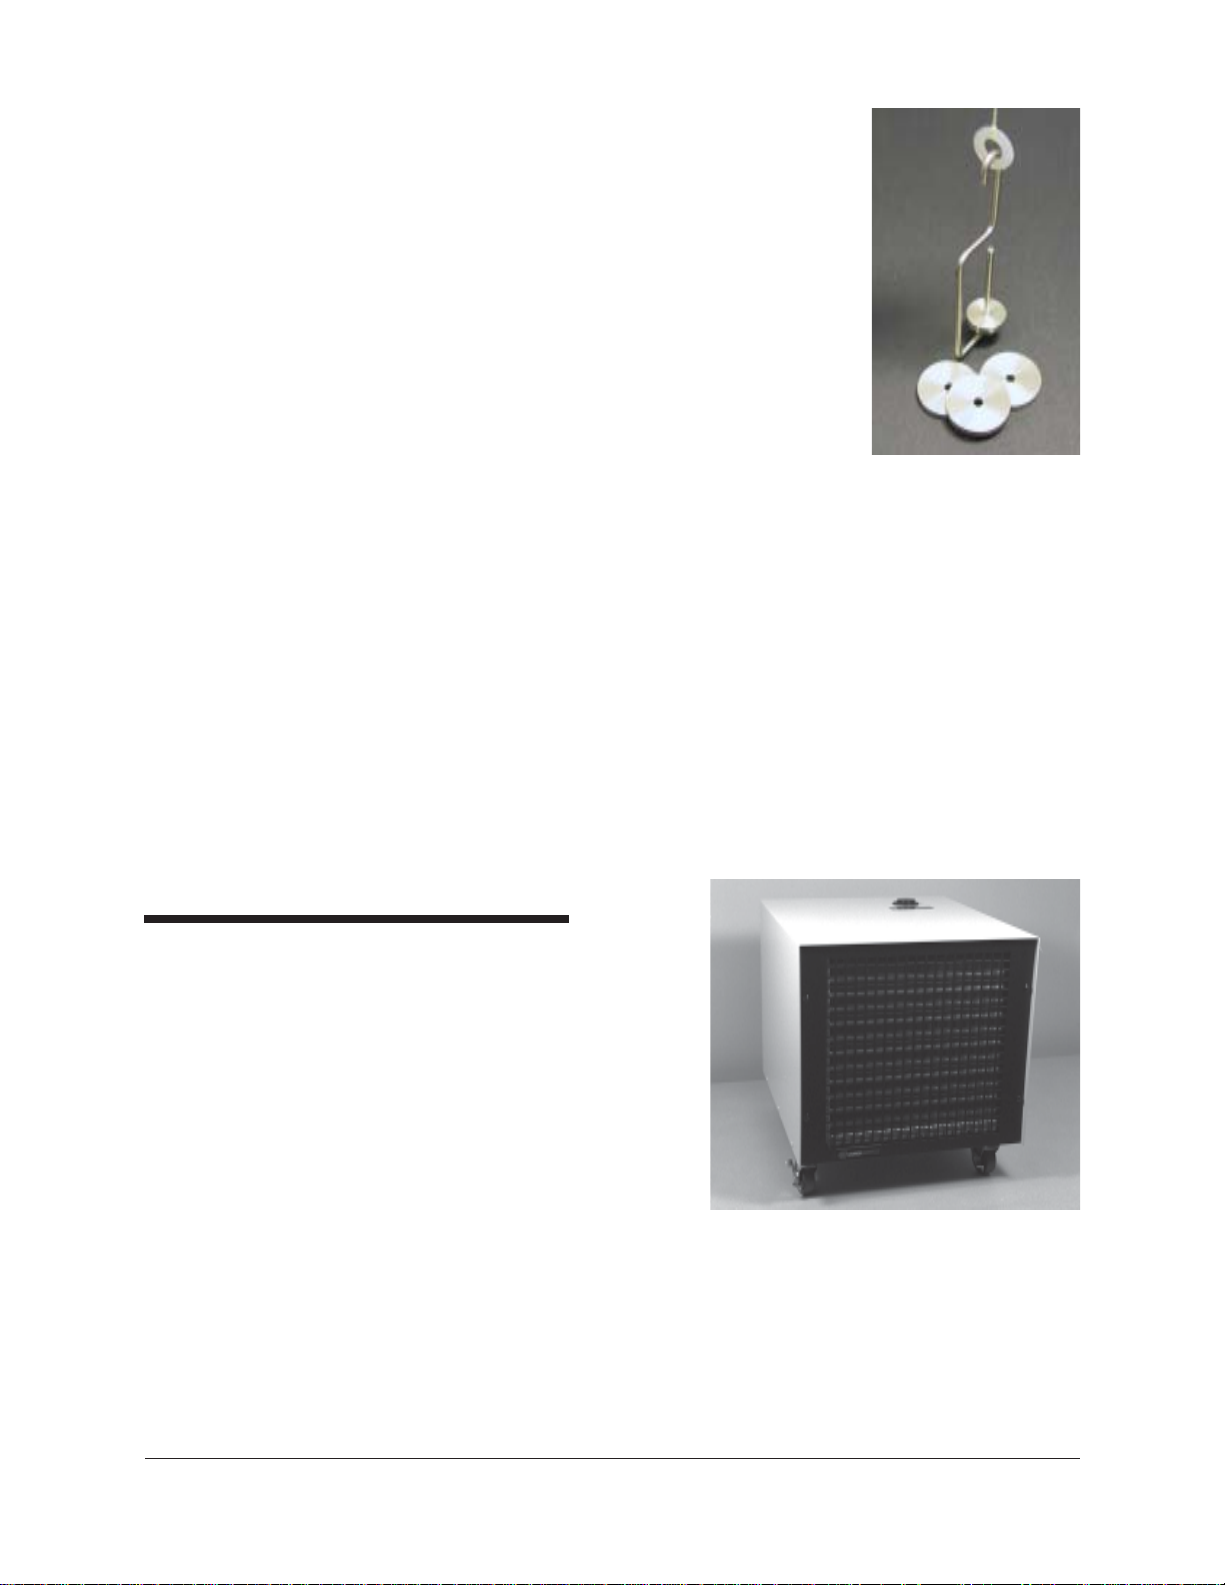
The pulley-wheel
assembly consists
of a V-channel
timing wheel with
a digital-optical
sensor permitting
precise measurement of the wheel
rotation. The
pulley-wheel base
is designed to be
fitted to the
CMR V-4500 slide
track adjacent to
the viscometric
cells. The probe
Slide track with pulley-wheel assembly
cable is connected to the jack on the front of the CMRV-4500 housing.
Winding thread
Slide track
CANNON
The thread used for CMRV-4500 testing is a single, nonelastic strand of
70 cm (28") winding thread of silk, cotton, or similar material (Coats
North America or comparable brand, 0.1 mm radius) with a loop on one
end. One end is wound around the CMRV-4500 rotor. The other end of
the thread is tied to a small rigid plastic ring from which the test weight
may be suspended.
The pulley-wheel assembly is designed to interlock with the pulleywheel slide track and move laterally so it can be aligned with the scored
marks on the track opposite each of the nine rotor shafts.
®
Mini-Rotary Viscometer CMRV-4500 Instruction & Operation Manual
Version 1.1e—October, 2011 • CANNON
2139 High Tech Road • State College, PA • 16803 • USA
®
Instrument Company
Page 15
9
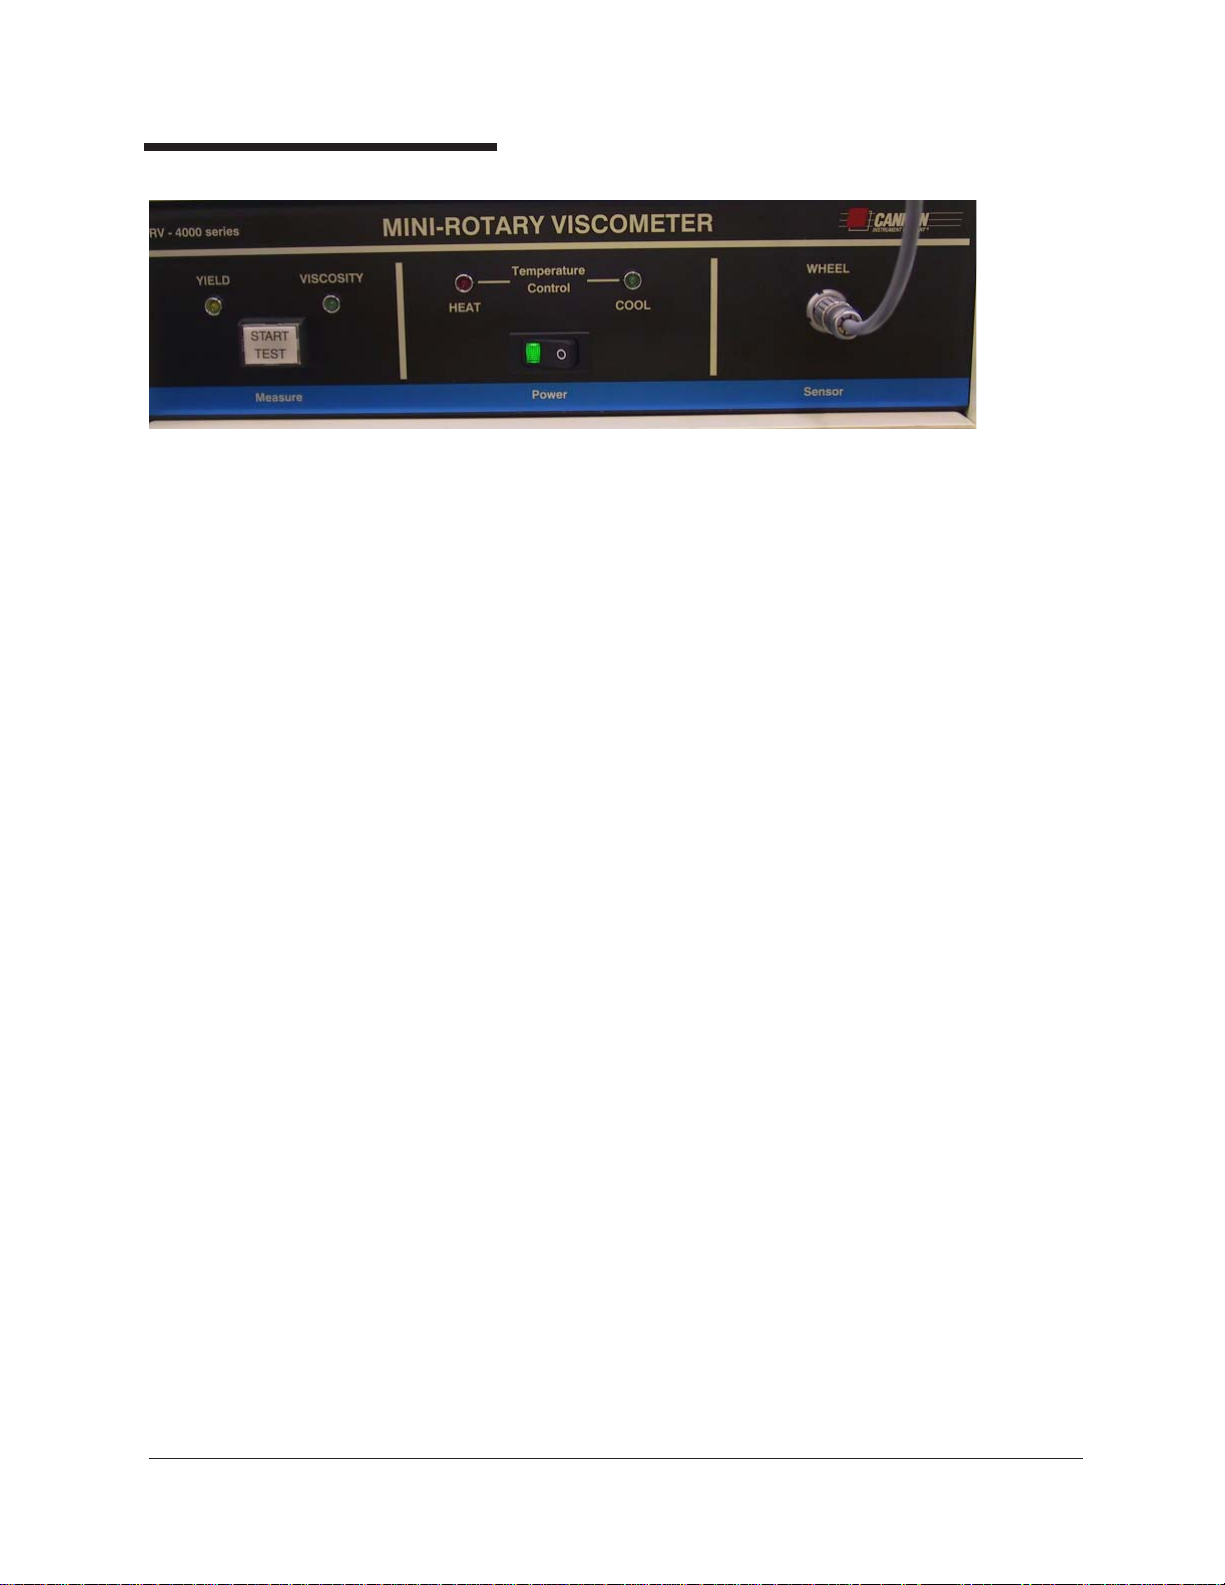
Hook-weights
Temperature probe
Thermometers
Hook-weights are hung on the plastic ring at
the free end of the thread to apply the required
force to the rotor during yield stress and
viscosity measurements. Nine disk weights,
one hook-cage, and one larger hook-weight are
provided. Weights vary depending on the
ASTM Method used for testing.
CMRV-4500 block temperature is detected by
a 3k-ohm temperature probe, which must be
seated securely in the thermistor aperture at the
rear of the CMRV housing and plugged into
the electronic chassis.
Hook-weights
The CMRV-4500 unit is shipped from CAN-
®
with two thermometers to be used to check the temperature of the
NON
block.
The long thermometer used for the probe and cell calibrations is a
PRINCO mercury-thallium calibrated thermometer with a range of
-46°C to +30°C in .2°C increments and an accuracy of ± 0.01°C
below 20°C.
NOTE
If a thermometer is removed from the CMRV-4500 when the unit is
cooling, plug the thermometer aperture in the Plexiglas® cover to prevent
ice formation around the rotors.
The shorter, high-temperature uncalibrated thermometer has a range
of 0°C to 105°C in 1°C increments with an accuracy of ± 1°C.
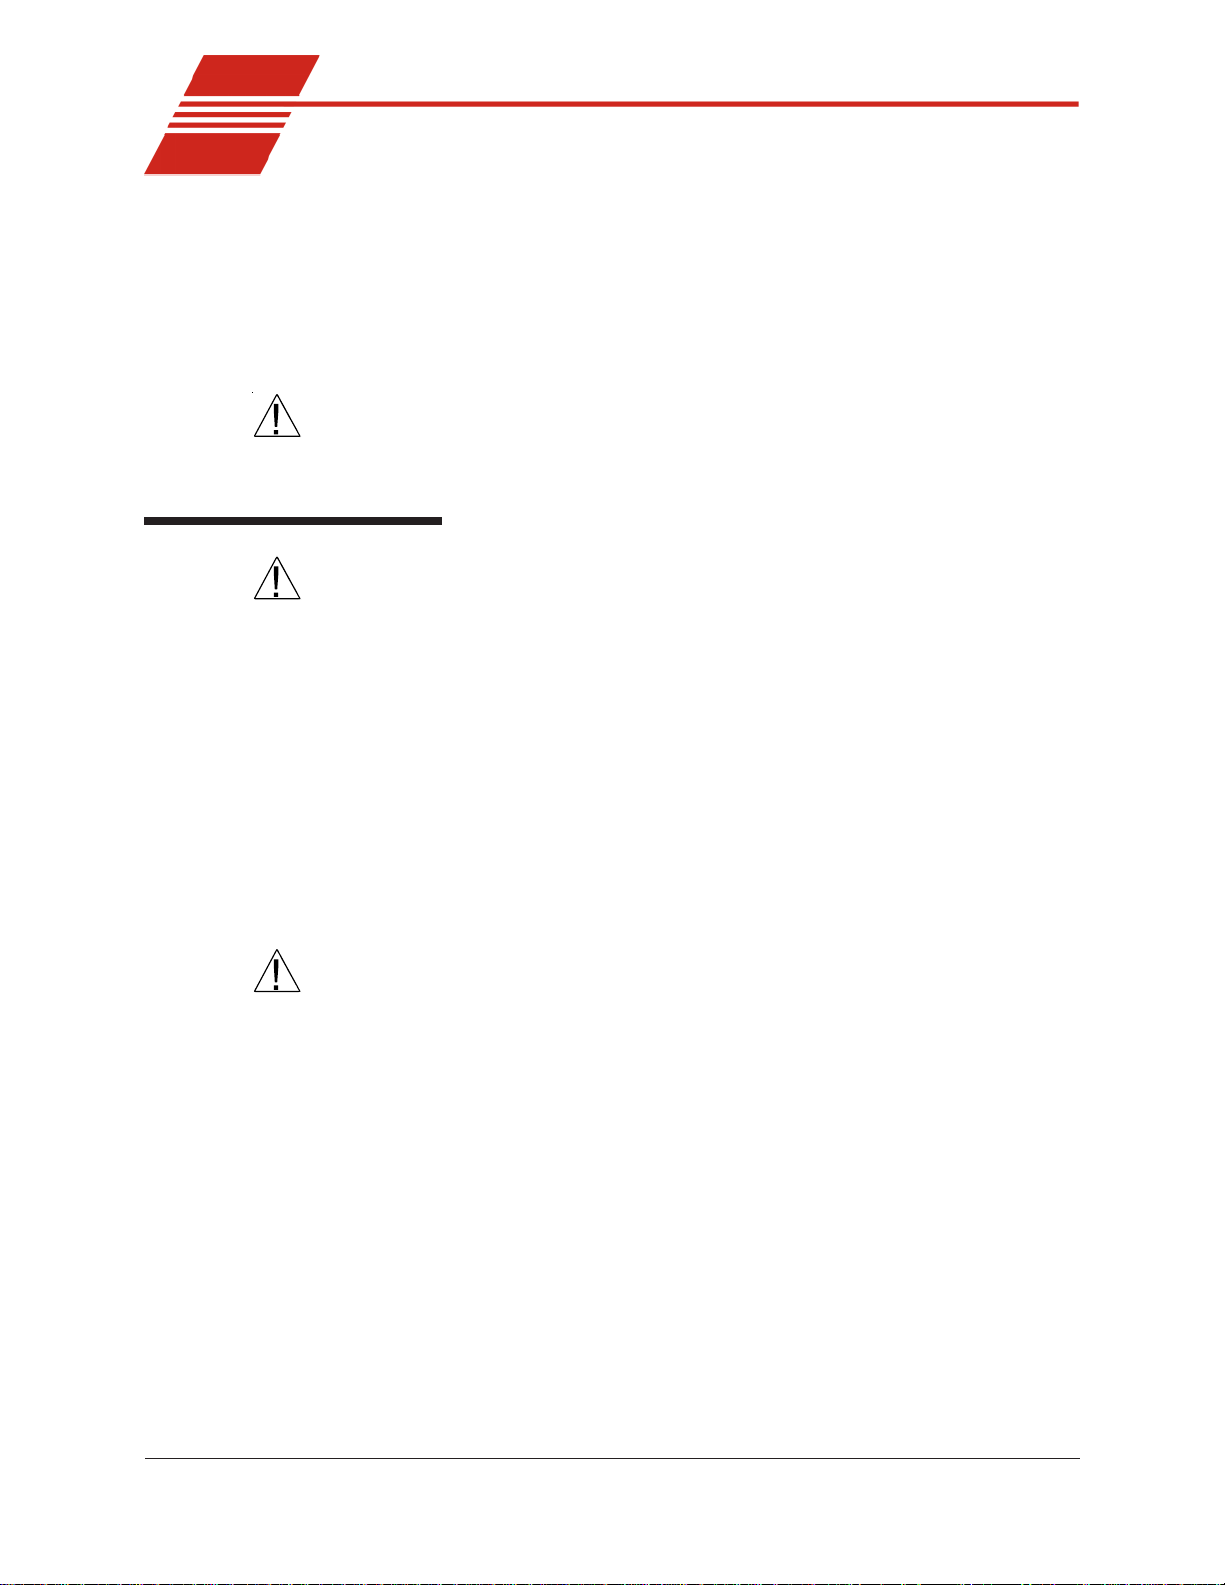
Air/Water Heat Exchanger
CMRV-4500 cooling is
accomplished with internal
thermoelectric cells and an
external Air/W ater Heat
Exchanger circulating a
mixture of water and
antifreeze to remove heat
from the thermoelectric
modules.
The Air/Water Heat Exchanger contains the electronics necessary to monitor
the coolant flow rate and regulate the action of the circulating pump
during the running of ASTM-specified temperature profiles. The Heat
Exchanger also supplies DC power for the operation of the CMRV
thermoelectric modules.
Air/Water Heat Exchanger
(see chapter 4 for Setup diagram)
CANNON
®
Mini-Rotary Viscometer CMRV-4500 Instruction & Operation Manual
Version 1.1e—October, 2011 • CANNON
2139 High Tech Road • State College, PA • 16803 • USA
®
Instrument Company
Page 16
10
Front panel operations
CMRV front panel
Control features
CMRV front panel control features are simple and functional. The central
switch on the front panel is the power switch for the unit. The lightemitting diodes (LEDs) above the switch indicate function of the heating
and cooling systems. The Sensor connection on the right side of the
panel mates with the cable from the pulleywheel optical sensor. The Start
Test button on the left side of the panel is used to initiate CMRVcontrolled testing and calibration routines. The Yield and Viscosity
LEDs light during yield stress or viscosity testing.
For additional details on front panel operation, refer to the calibration and
testing chapters of this manual.
CANNON
®
Mini-Rotary Viscometer CMRV-4500 Instruction & Operation Manual
Version 1.1e—October, 2011 • CANNON
2139 High Tech Road • State College, PA • 16803 • USA
®
Instrument Company
Page 17
CHAPTER
11
4
CAUTION
Physical placement
CAUTION
Control unit placement
SETUP
The instructions in this chapter are for setting up a single CMRV-4500
with the Air/Water Heat Exchanger. For additional information on multiunit configurations, see APPENDIX D.
Do not apply power to the CMRV-4500 or Heat Exchanger until all
connections are secure.
Some CMRV components, including the Air/Water Heat Exchanger, are
quite heavy. To avoid injury, obtain necessary assistance when lifting
and moving these components.
Place the CMRV-4500 on a stable laboratory bench or table top within 10
mm of the front edge. This will allow the weight suspended from the
pulley-wheel assembly to clear the edge of the table during viscosity and
yield stress tests. Allow 30.5 cm (12") of clearance to the back and sides
of the unit.
A/W Heat Exchanger
CAUTION
Thermometer placement
NOTE
Place the Air/Water Heat Exchanger below the table top on which the
CMRV-4500 is placed. The unit may be located within the parameters
permitted by the length of the hoses and cables shipped with the unit.
Do not obstruct the front or rear cooling vents on the Air/Water Heat
Exchanger.
When in use, the large thermometer (-46°C to +30°C) is placed in the
thermometer well on the left side of the CMR V-4500 unit (seen from the
front).
When in use, the small thermometer (0°C to 105°C) is placed in the thermometer well on the right side of the CMR V-4500 unit (as seen from the
front).
If the mercury column in a thermometer has separated during shipment,
read the instructions included in APPENDIX C. These instructions offer
several methods for joining separated mercury columns.
CANNON
®
Mini-Rotary Viscometer CMRV-4500 Instruction & Operation Manual
Version 1.1e—October, 2011 • CANNON
2139 High Tech Road • State College, PA • 16803 • USA
®
Instrument Company
Page 18
12
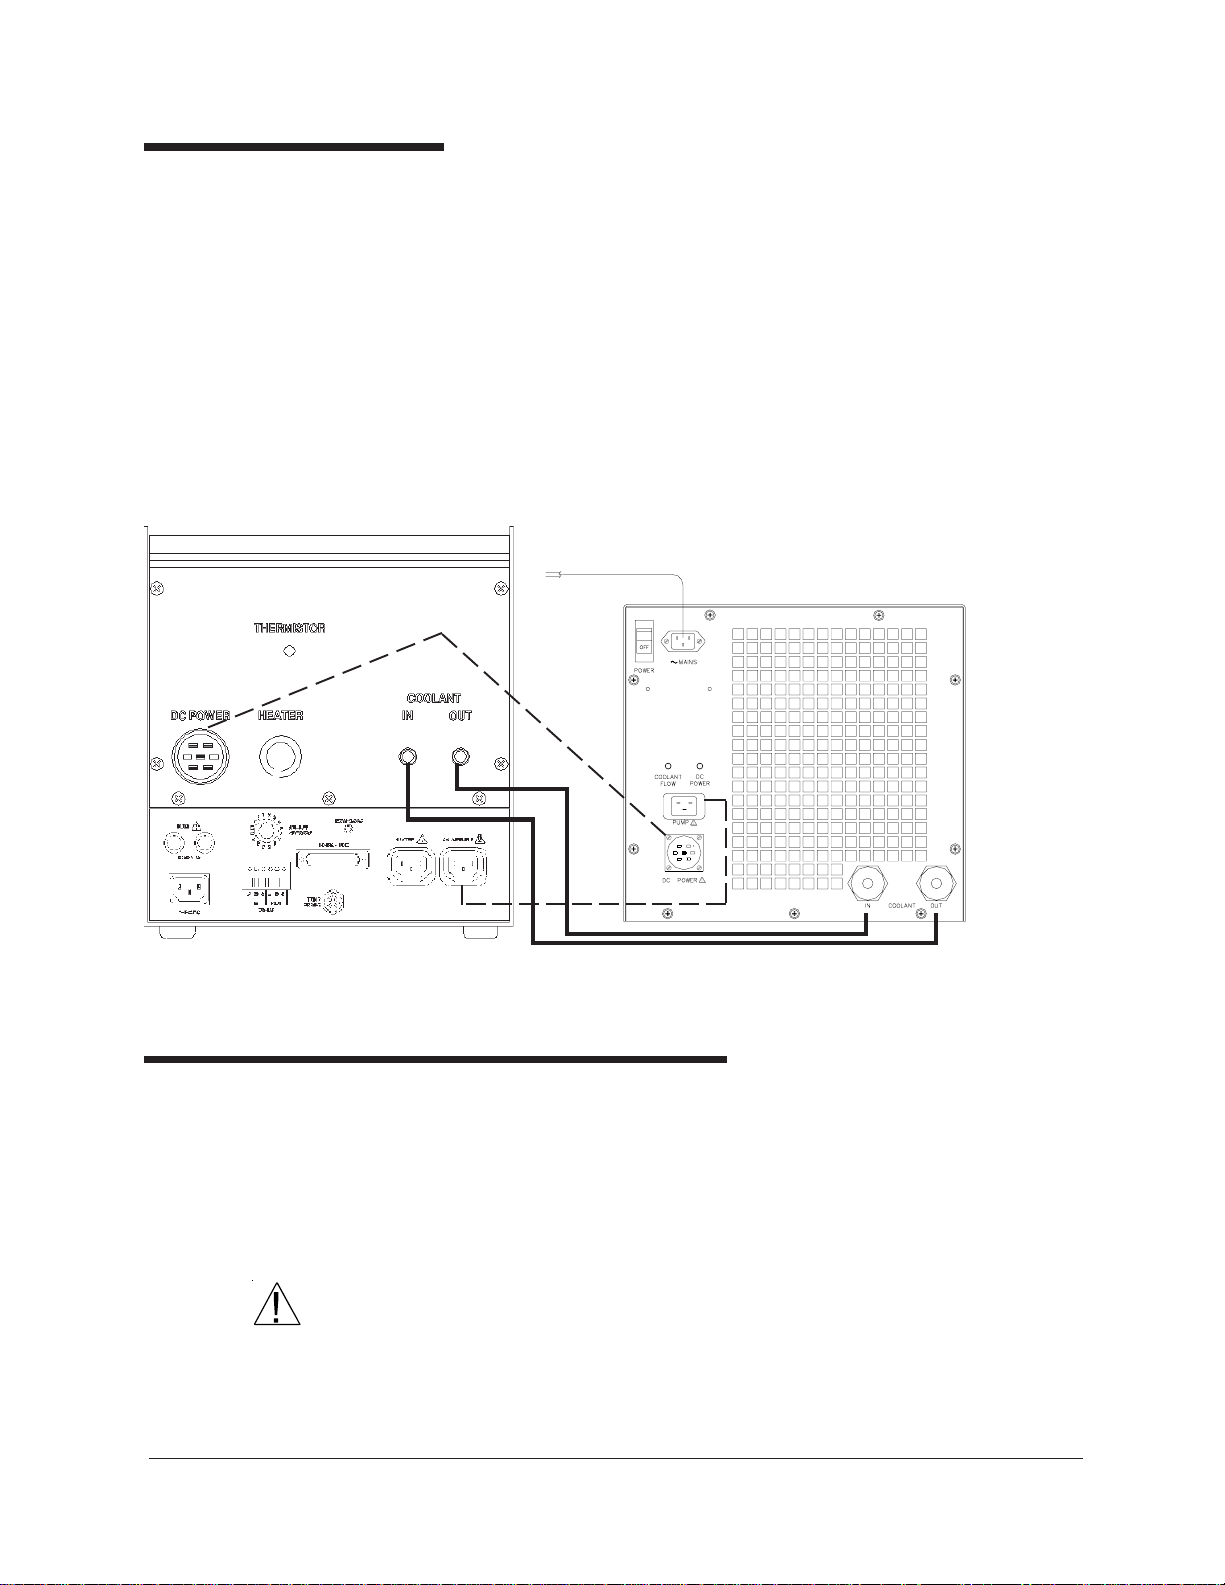
Tubing connections
There are two tubing connections on the rear of the CMRV-4500 housing
(see diagram, next page). The fitting on the left is the coolant INLET (for
introducing coolant to the CMRV-4500) and the fitting on the right of the
rear panel is the coolant OUTLET (for returning coolant to the Ex
changer). Clamp the open ends of both hoses to these fittings, then secure
the hoses to the appropriate bulkhead fittings on the Air/Water Heat
Exchanger using the bulkhead inserts provided with the tubing (see
Figure). The fittings will snap into place. To release and remove the
tubing from the Air/Water Heat Exchanger, push down on the button on
the bulkhead fittings to release the connector locking clips.
CMRV-4500 tubing (solid lines) and electrical (dotted lines) controller/AWHE connections
Filling the Air/Water Heat Exchanger
Obtain a supply of quality automotive antifreeze (ethylene glycol) and
mix it with water in a ratio of 30 percent antifreeze to 70 percent water.
Do not mix antifreeze types in the Air-Water Heat Exchanger.
After you have secured the Exchanger tubing connections (see previous
section) pour this antifreeze/water mixture into the reservoir opening on the
top of the Air/Water Heat Exchanger until it is full (approximately 4 liters).
CAUTION
NOTE
CANNON
Ethylene glycol is a toxic substance. Use proper safety precautions when
handling. Follow appropriate MSDS instructions.
Depending on the amount of fluid displacement in the coolant lines, it
may be necessary to add additional antifreeze/water mixture to the
®
Mini-Rotary Viscometer CMRV-4500 Instruction & Operation Manual
Version 1.1e—October, 2011 • CANNON
2139 High Tech Road • State College, PA • 16803 • USA
®
Instrument Company
Page 19
Exchanger when the unit commences operation. Y ou will be able to
observe the liquid circulating inside the reservoir from the opening at the
top of the Exchanger during normal operation. If air bubbles are consistently visible in the coolant lines, add additional mixture until the Exchanger is full.
13
CAUTION
The water-antifreeze mix should be replaced annually for reliable performance and to prevent corrosion of internal components (see Flushing
and draining the Air/Water Heat Exchanger, this chapter).
Electrical /serial connections
A/W Heat Exchanger
Plug the male end of the DC power cable into the DC POWER OUT
fitting on the rear panel of the Air/Water Heat Exchanger and turn the
locking clip clockwise to secure the connection. Attach the other end of
the cable to the receptacle labelled DC POWER at the back of the
CMRV-4500 unit (see figure, previous page). This connection provides
power to the thermoelectric cooling modules.
Insert the power cable for the Air/Water Heat Exchanger into the receptacle on the Exchanger rear panel. Secure the power cable in place by
tightening the Phillips screw on the cable clamp.
Make sure the Air/Water Heat Exchanger power switch is in the OFF
position; then insert the power line cord from the Exchanger into an
appropriate power source for your unit.
Before providing mains power to the unit, check the label on the rear
panel of the Exchanger to verify that the electrical specifications for the
unit match those of the power supply.
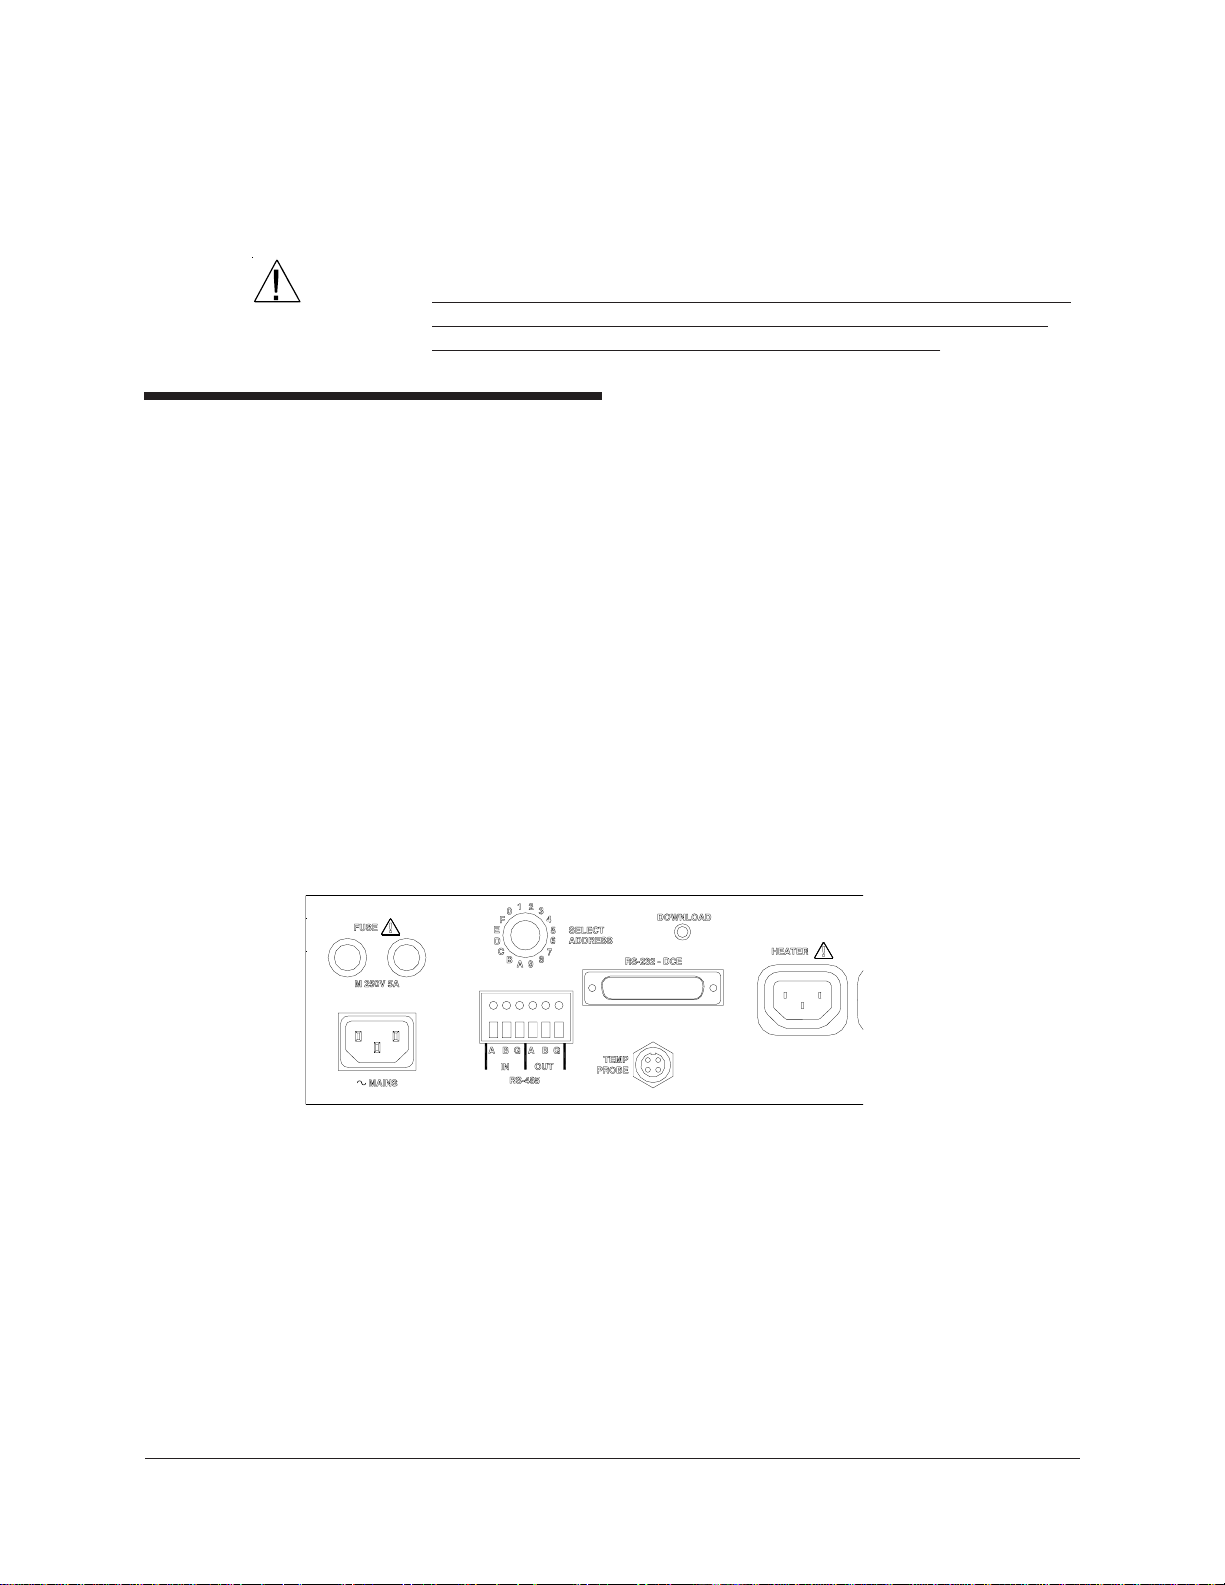
Thermistor
Figure 11: CMRV rear panel
Attach the M-F three-prong connector cable from the Exchanger PUMP
outlet to the PUMP receptacle on the CMRV-4500 controller (see figures on
pages 12-13). This power connection permits CMRV-4500 control of pump
operation.
Insert the Lemo
TEMP PROBE on rear of the CMRV controller (see Figure 11). Insert
the probe tip as far as it will go into the hole marked THERMISTOR on
the rear of the CMRV-4500 chassis.
CANNON
®
Mini-Rotary Viscometer CMRV-4500 Instruction & Operation Manual
Version 1.1e—October, 2011 • CANNON
2139 High Tech Road • State College, PA • 16803 • USA
®
plug from the temperature probe into the jack marked
®
Instrument Company
Page 20
14
Heater
CMRV-4500 power cord
Serial connections
NOTES
Insert the heater plug from the upper section of the CMRV-4500 housing
into the HEATER receptacle on the rear panel of the CMRV controller.
Make sure the CMRV-4500 power switch is in the OFF position. Then
insert the power line cord from the rear panel of the CMRV controller
into an appropriate power source for your unit
Before providing mains power to the unit, check the label on the rear
panel of the Exchanger to verify that the electrical specifications for the
unit match those of the power supply. Use only the supplied, approved
appliance cords for the CMRV.
T o connect a single CMRV -4500 instrument to the host computer,
connect the computer cable to the RS-232, DB-25-pin socket at the rear
of the CMRV-4500 controller and secure the cable connection with the
two small screws on the ears of the plug. Attach the other end of the cable
to the RS-232 port at the rear of your computer.
COM 2 and COM 4 use the same IRQ settings on most computers,
meaning that they cannot be used simultaneously. The COM 1 and
COM 3 ports have the same problem. Do not try to use a device on COM
4 if you are using COM 2 for the CMRV instrument.
Some display adaptors (in particular, S3, 8514A and ATI mach 8) have
an address conflict with COM 4 ports. If this is the case, you may need to
use another COM port or replace your current display adaptor.
RS-485 serial connections
T o install multiple CMRV units using RS-485 serial cable connections,
see the multi-unit configuration instructions in APPENDIX D.
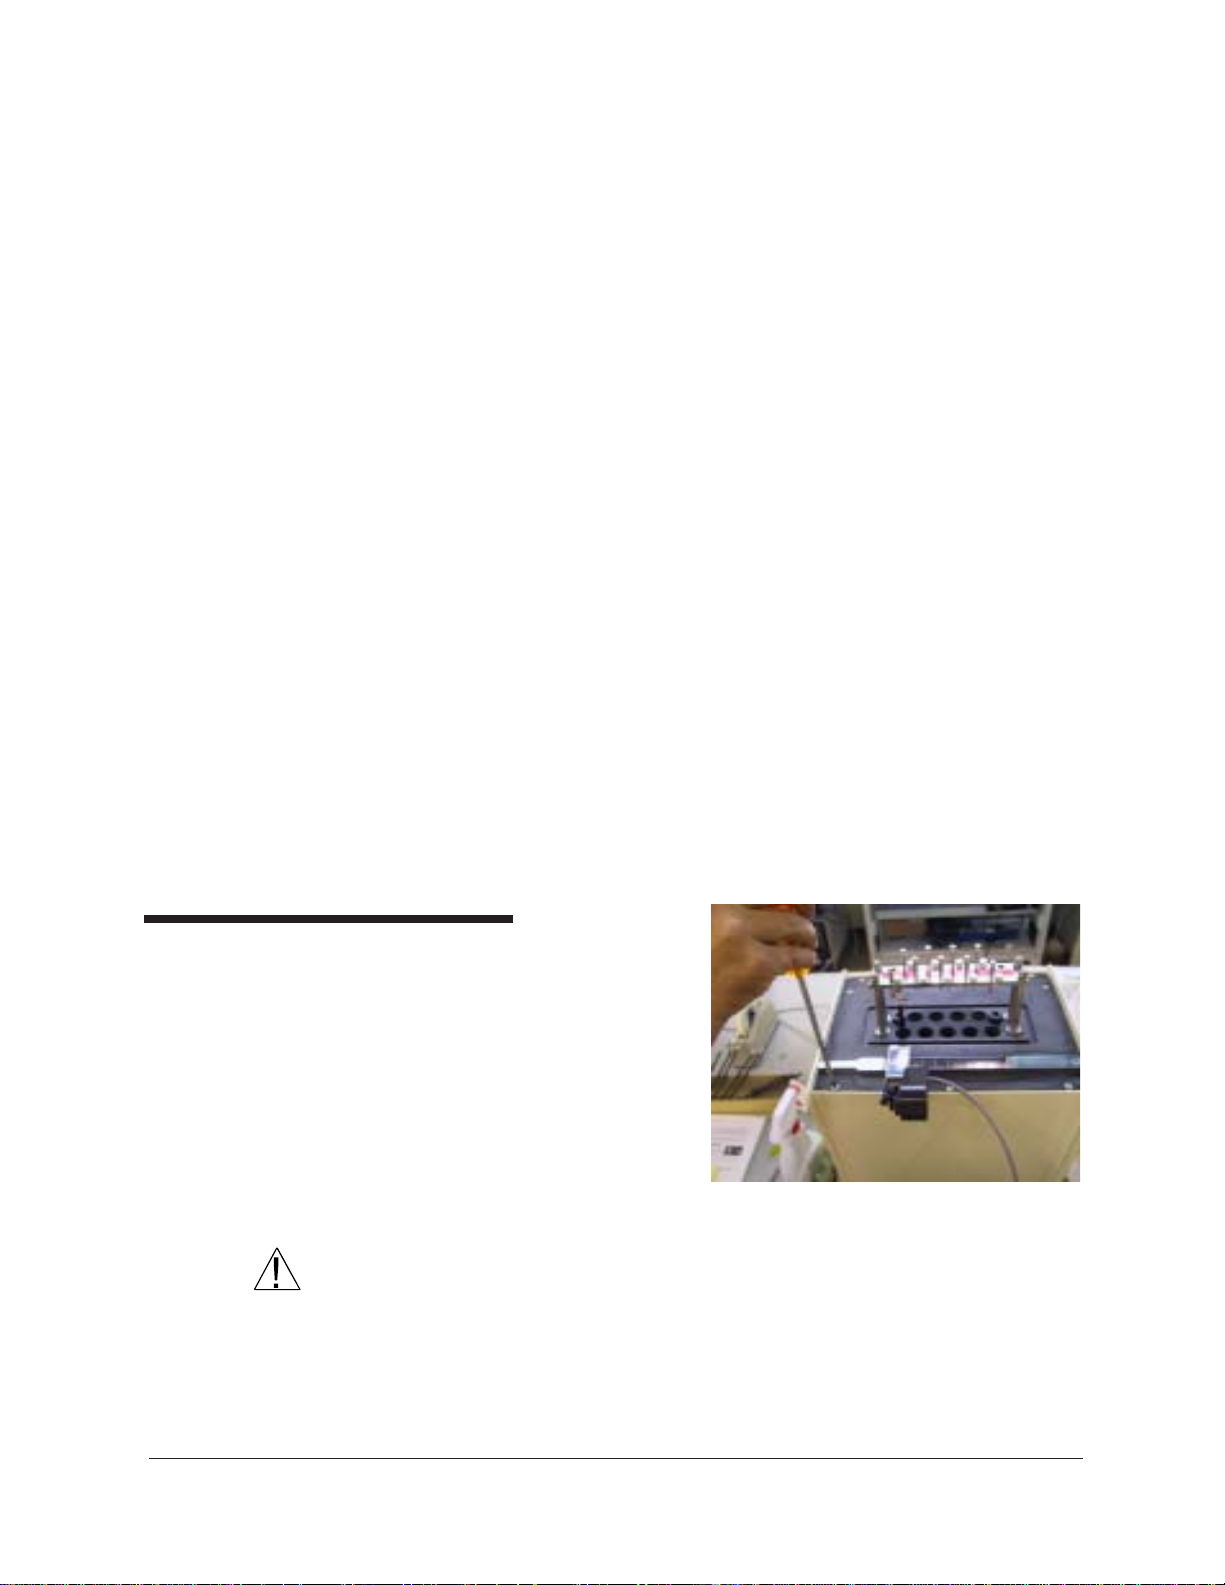
Pulley-wheel installation
T o install the pulley-wheel
assembly atop the CMRV:
1. Remove the left screw
from the front of the
upper panel (see photo).
This will provide
clearance to install the
assembly on the slide
track.
CAUTION
Use care in handling the pulley-wheel assembly to avoid damage to the
wheel or the movement sensor.
Removing screw to install pulley wheel
CANNON
2. Install the pulley-wheel assembly by sliding it onto the left end of the
slide track with the pulley-wheel facing out (see photo).
®
Mini-Rotary Viscometer CMRV-4500 Instruction & Operation Manual
Version 1.1e—October, 2011 • CANNON
2139 High Tech Road • State College, PA • 16803 • USA
®
Instrument Company
Page 21
15
CAUTION
NOTE
Installation notes
Download button
Make sure that the
assembly is seated
securely on the
track.
3. Replace the
left front
screw . This
Pulley-wheel assembly mounted on slide track
will prevent
the assembly from sliding off the track.
4. Plug the free end of the pulley-wheel sensor wire into the jack
labelled WHEEL on the front of the CMRV-4500 controller.
To disconnect the sensor, pull it out by the knurled portion of the plug.
The CMRV-4500 is capable of receiving firmware updates from the
computer via the DOWNLOAD button on the rear of the electronic
®
chassis. Should such an update be required, CANNON
will provide
detailed instructions regarding the download procedure for updating the
firmware.
NOTE
If the DOWNLOAD button is pressed inadvertently, switch off the CMRV4500 power for at least four seconds, then
restore power to the unit.
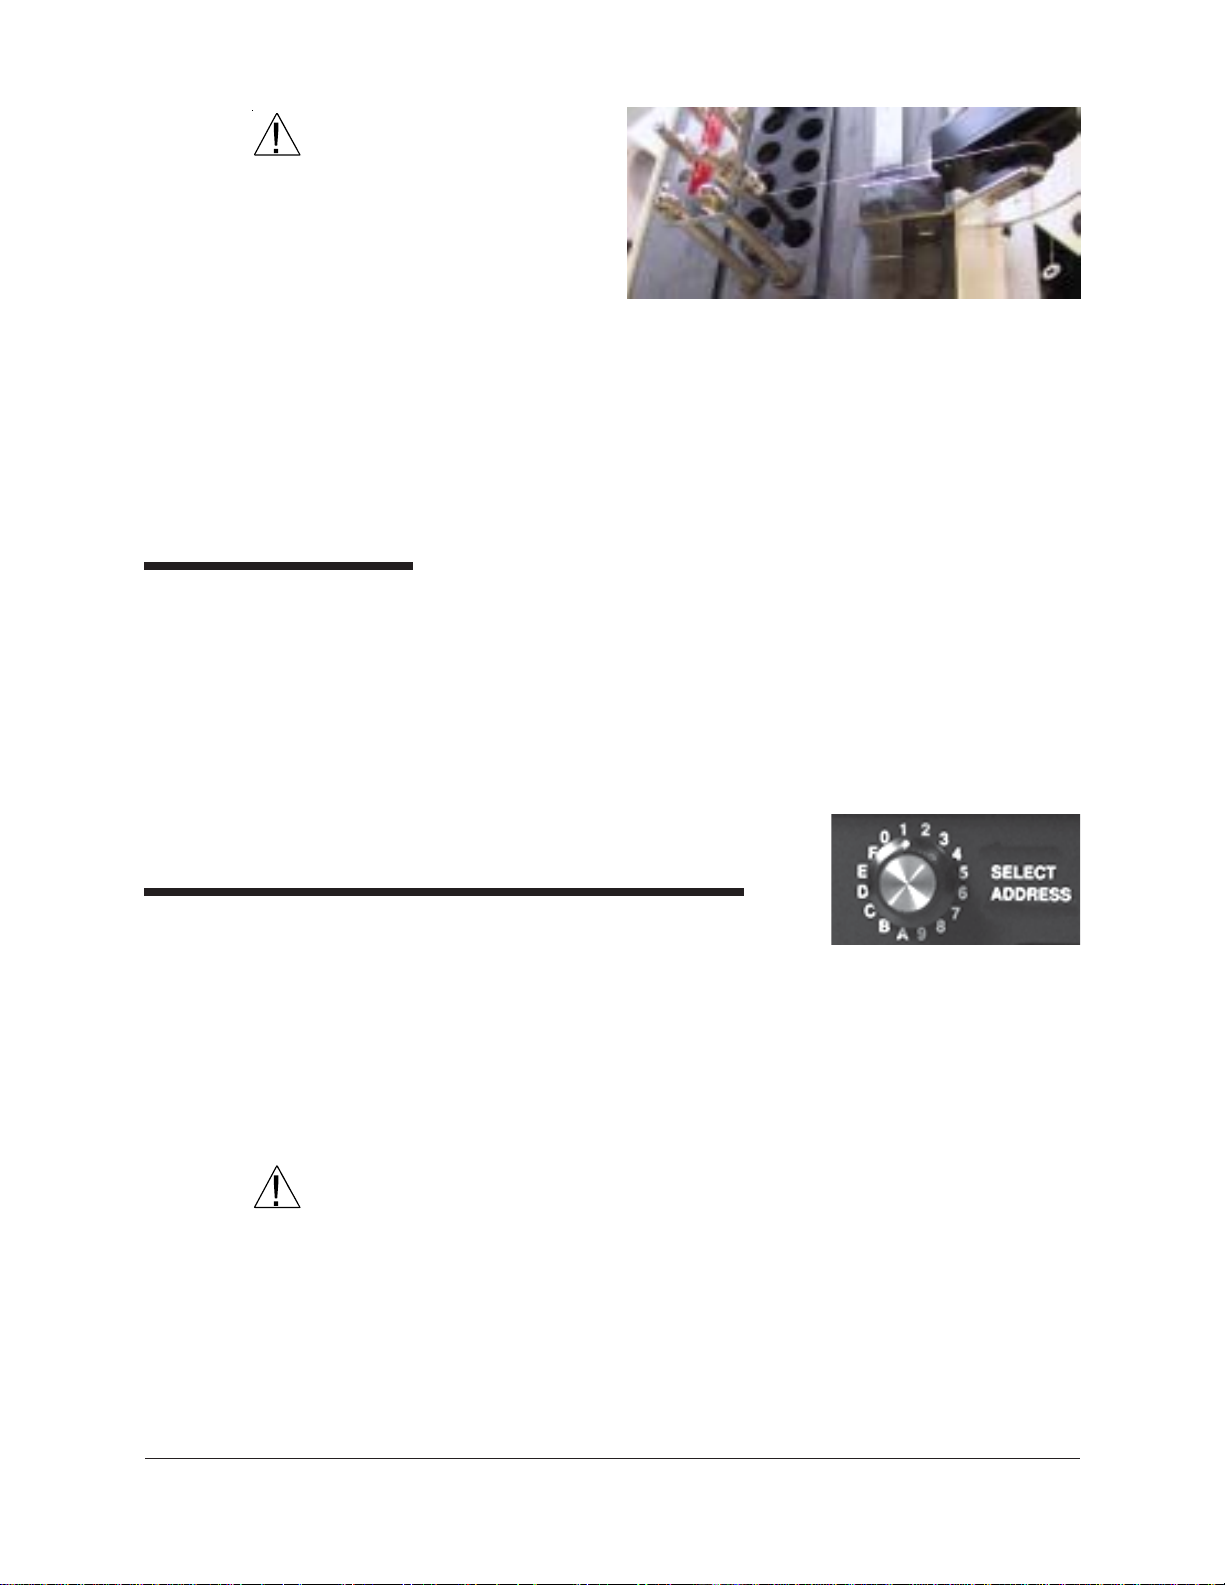
Setting the CMRV instrument address
When installing/connecting a new CMR V
instrument, you must set the instrument
address using the SELECT ADDRESS
dial on the rear of the CMRV controller. This dial offers 16 settings (0-9,
A-F).
Procedure
CAUTION
T o set the address, rotate the dial (see photo) to a setting not currently in
use by other CMRV instruments.
The MRVW software will not function correctly unless each networked
CMRV instrument is set to a different address (see APPENDIX D for
multi-unit configuration).
Address selection knob
CANNON
®
Mini-Rotary Viscometer CMRV-4500 Instruction & Operation Manual
Version 1.1e—October, 2011 • CANNON
2139 High Tech Road • State College, PA • 16803 • USA
®
Instrument Company
Page 22
16
Cleaning the instrument housing
CAUTION
Before cleaning the CMRV housing, turn off the instrument and unplug
the power cord. Do not clean the instrument unless the cell temperature
is within 10°C of ambient.
Periodically clean the outside of the unit with a damp cloth moistened
with water and/or a mild detergent solution.
Flushing and draining the Air/Water Heat Exchanger
The water-antifreeze mixture should be replaced annually for reliable
performance and to prevent corrosion of internal components. Do not
mix antifreeze types in the Air-Water Heat Exchanger.
T o flush fluid from the Exchanger and CMRV -4500, obtain replacement
antifreeze, a funnel, a drain bucket and a supply of warm water. Then
complete the following procedures:
Flushing fluid from the Exchanger
1. Turn off the Heat Exchanger power switch
to remove power from the Exchanger.
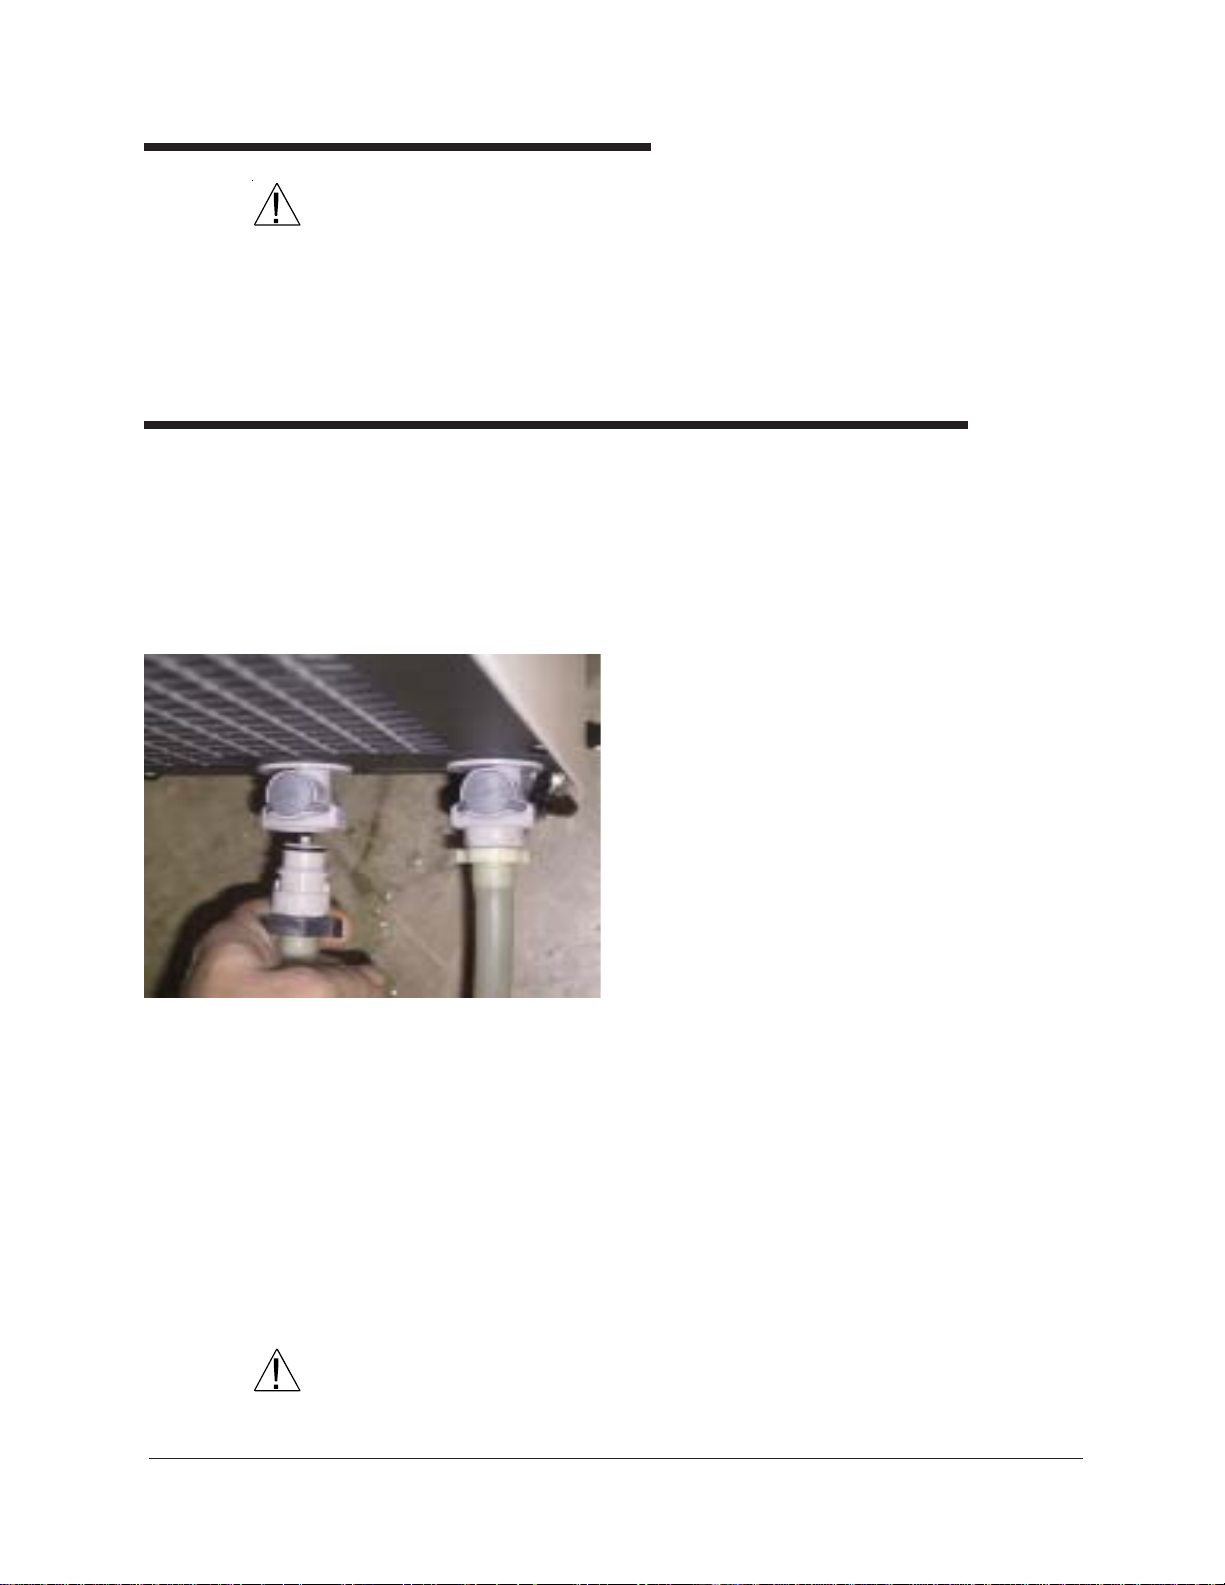
2. Detach the quick-connect fitting securing the
tubing from the CMRV-4500 to the IN
connection on the Exchanger (see photo) by
pushing down on the release button while
pulling the hose connection out. Place the
tube end in the drain bucket and pull the
hose off of the ribbed section of the fitting.
Fluid will begin draining from the CMRV4500 and Exchanger.
Removing the Exchanger tubing connection
4. Turn on the Exchanger power switch to engage the Exchanger
circulating pump. Fluid from the Exchanger and CMRV-4500 will
flow into the drain bucket.
5. Immediately begin adding warm water to the Exchanger reservoir
through the funnel and continue as it is pumped out into the drain
bucket until the water exiting the drain hose into the drain bucket
flows clear.
6. Stop adding water to the reservoir and immediately turn off the Heat
Exchanger power switch.
CAUTION
CANNON
Do NOT permit the Exchanger pump to operate without fluid in the
system. Doing so will damage the pump.
®
Mini-Rotary Viscometer CMRV-4500 Instruction & Operation Manual
Version 1.1e—October, 2011 • CANNON
2139 High Tech Road • State College, PA • 16803 • USA
3. Open the lid of the Exchanger reservoir and
place the funnel in the opening.
®
Instrument Company
Page 23
7. Replace the connector on the Exchanger hose, and reattach the
connector to the fitting on the Exchanger (see photo).
Draining fluid from the Exchanger
After the antifreeze mixture has been flushed from the Air/Water Heat
Exchanger per the preceding procedure, drain the system as follows:
1. Make certain that the Heat Exchanger power is OFF, then remove the
external housing from the Air/Water Heat Exchanger by removing
the six screws securing the housing to the sides of the frame (three
screws on each side of the unit) and the six screws on the top and
sides of the rear panel.
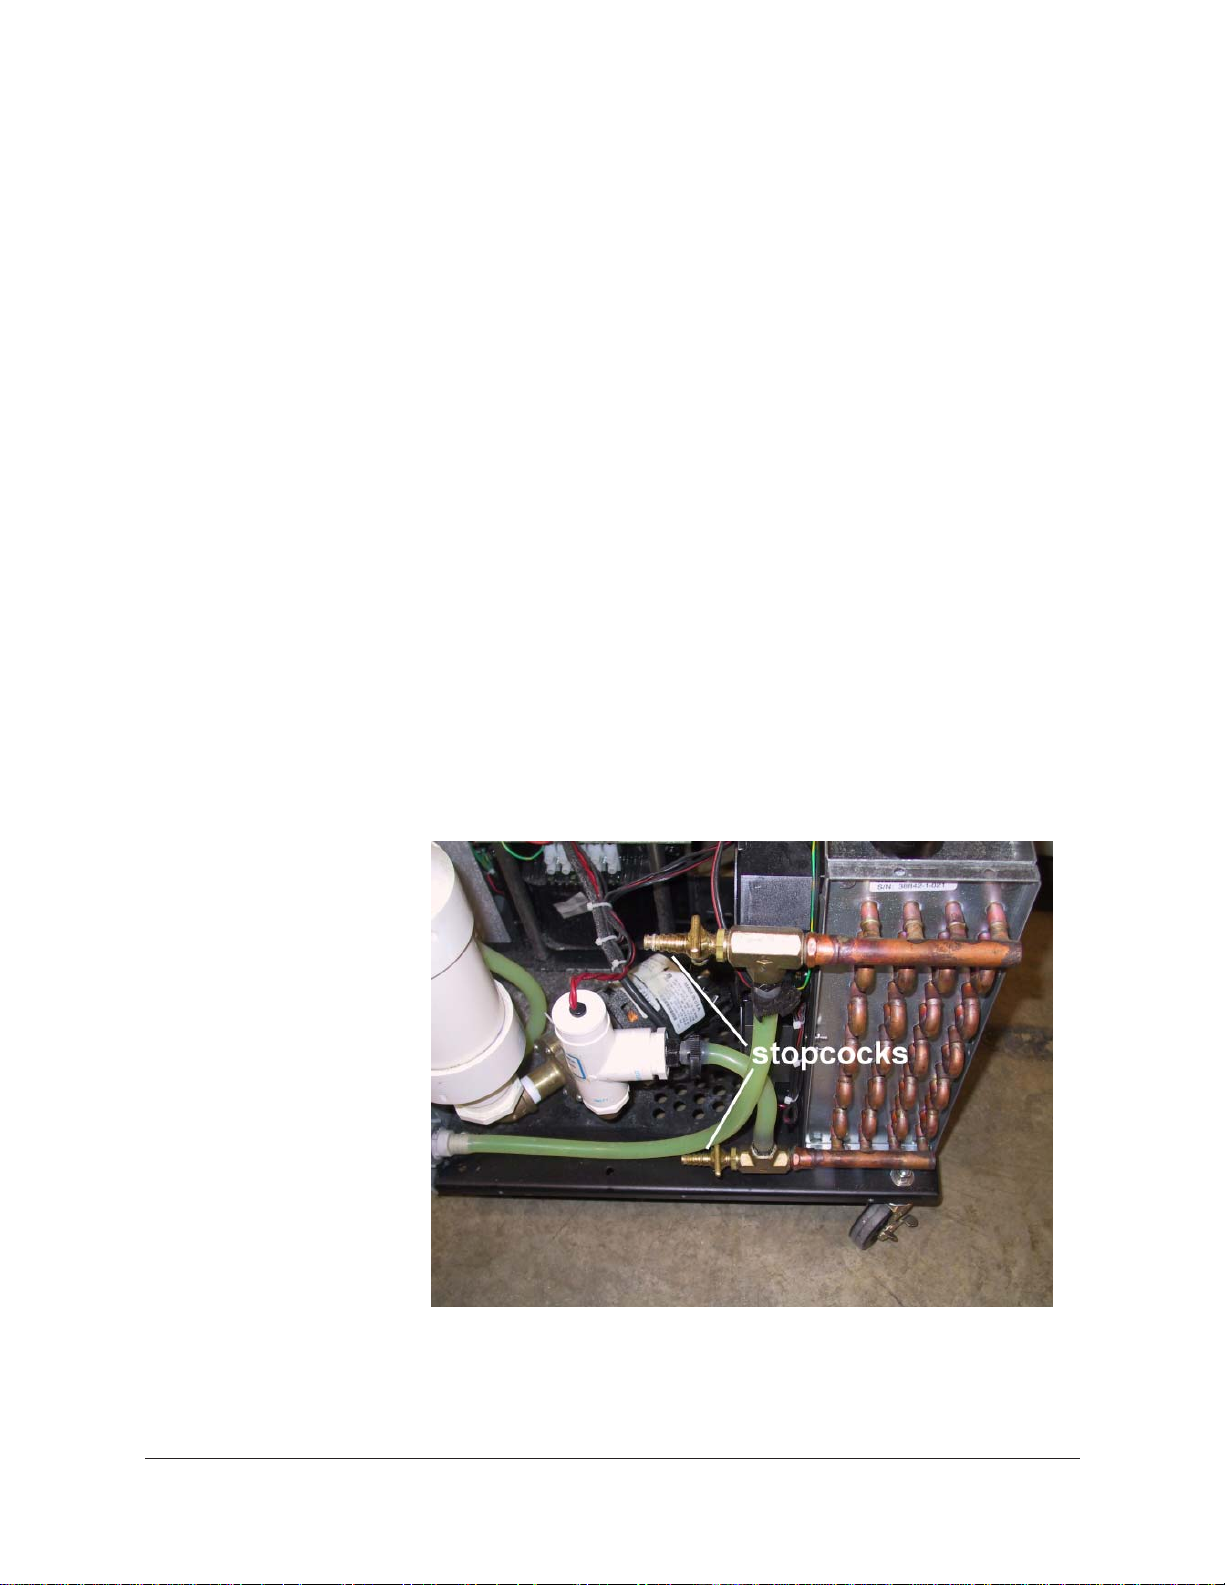
2. Locate the twin stopcocks at the top and bottom of the radiator (see
photo, next page). Attach a drain hose to the bottom stopcock and
place the opposite end of the hose in a drain bucket.
3. Open the top and bottom stopcocks by turning them parallel to the
nozzle and permit water to drain from the radiator. Then close the
stopcocks and remove the drain hose from the bottom stopcock.
17
NOTE
A small amount of water/antifreeze mixture may remain in the tubing
leading from the external connector to the reservoir. If desired, this fluid
may be drained by pulling the hose off of the ribbed section of the quickconnect fitting previously installed. Reattach the tubing before completing
the remainder of this procedure.
CANNON
Heat Exchanger with housing removed and stopcocks highlighted
®
Mini-Rotary Viscometer CMRV-4500 Instruction & Operation Manual
Version 1.1e—October, 2011 • CANNON
2139 High Tech Road • State College, PA • 16803 • USA
®
Instrument Company
Page 24

18
4. Replace the external housing on the Air/Water Heat Exchanger and
secure it with the six screws previously removed. If necessary, reseat
the gasket around the reservoir opening with a small screwdriver.
5. Add water-antifreeze mixture to the Exchanger per the earlier
instructions in this chapter to complete the water-antifreeze flush and
drain procedure.
FHP MOTOR
NOTES
For rountine maintenance and improved bearing life expectancy , a few
drops of non detergent “twenty weight” oil can be added every 12 months.
Fans should be cleared of dust/other material on a regular basis.
CANNON
®
Mini-Rotary Viscometer CMRV-4500 Instruction & Operation Manual
Version 1.1e—October, 2011 • CANNON
2139 High Tech Road • State College, PA • 16803 • USA
®
Instrument Company
Page 25

CHAPTER
19
5
VISCPRO® for Windows® XP
VISCPRO® is a powerful new software product providing a generic
instrument interface for controlling and operating your CANNON
instrument(s) via computer. VISCPRO® also includes reporting/analysis
modules for processing and displaying sample data.
VISCPRO® INSTALLATION
®
Installing VISCPRO® software
T o install the VISCPRO® software, follow the instructions below in the
sequence presented. Make certain that you complete the sections on
checking instrument settings and calibration data. If you encounter
difficulties at any stage in the installation process, call CANNON
service at 814-353-8000.
Computer requirements
IBM-compatible computer with pentium processor and Windows® XP
installed and operating normally • SVGA compatible display •
32 MB RAM • 200 MB hard disk space • CD-ROM drive • serial port
®
®
®
Windows® XP
®
installation
Installation actions
1. Turn on your computer. Wait for the Windows® software to load.
2. From the Windows
the first VISCPRO® installation CD-ROM into the disk drive.
3. Double-click the Add/Remove Programs icon and follow the
Windows prompts to complete the installation procedure. The
executable file for VISCPRO
The installation program will:
®
Start Bar click Settings/Control Panel. Insert
®
software installation is SETUP.EXE.
create a directory for your data files. The default directory is
C:\Program Files\Cannon Instrument\VISCPRO).
write SETUP information to the Windows
®
registry.
copy the software executable file and other necessary files to the
directory you specify.
update other files in your Windows
compatible with the current VISCPRO® software.
place a shortcut icon for the VISCPRO
Windows
®
desktop.
®
directories to versions fully
®
executable file on your
CANNON
®
Mini-Rotary Viscometer CMRV-4500 Instruction & Operation Manual
Version 1.1e—October, 2011 • CANNON
2139 High Tech Road • State College, PA • 16803 • USA
®
Instrument Company
Page 26
20
Running the software
Loading software
Make certain that your CMRV instrument is properly connected to your
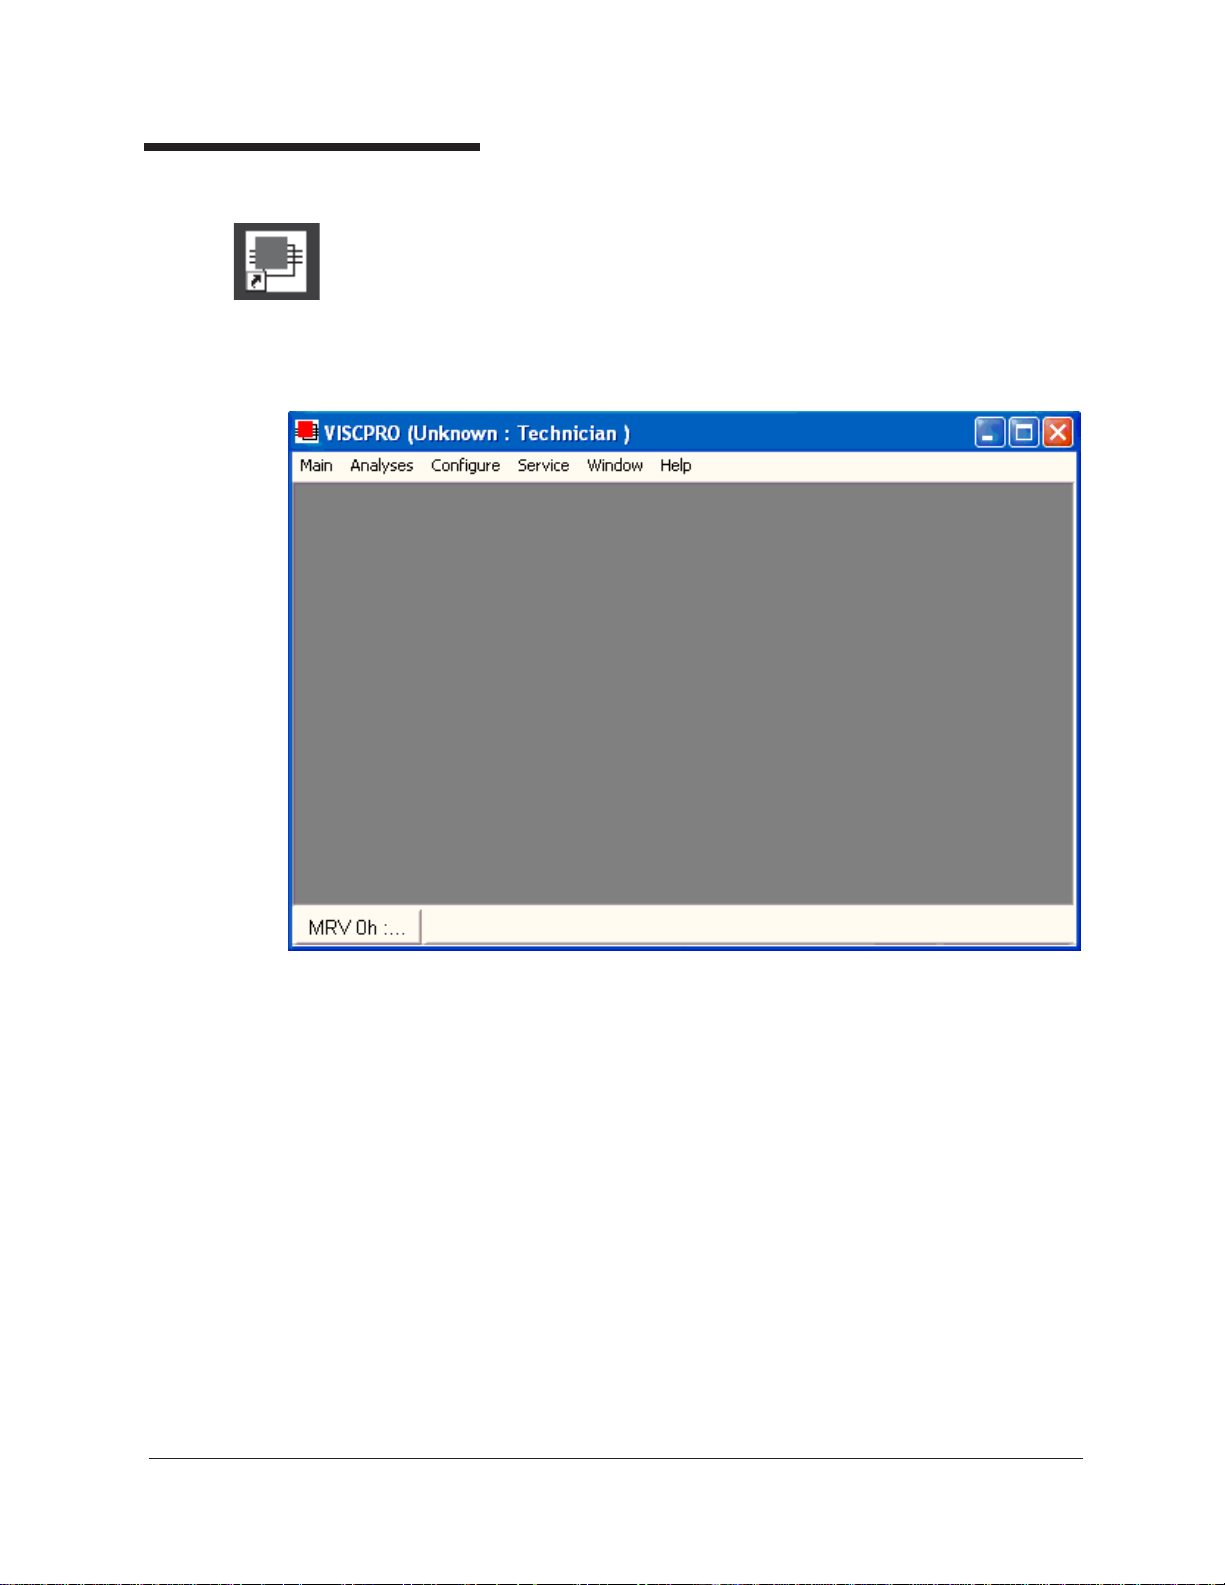
computer and the CMRV power switch is ON. Then start the VISCPRO
software by double-clicking the VISCPRO® icon on your W indows
desktop. Or click Start/Programs/VISCPRO/VISCPRO.EXE).
Right now , your computer monitor should look like this:
®
®
The VISCPRO® primary display
®
The VISCPRO
primary display window is framed on the top by the
VISCPRO® title bar and menu bar, and on the bottom by the VISCPRO
status bar.
Displaying the Instrument View window
The application window can be configured to display child windows, such as
the Instrument View window, which describes your CANNON® instrument and provides controls for running tests:
CANNON
®
Mini-Rotary Viscometer CMRV-4500 Instruction & Operation Manual
Version 1.1e—October, 2011 • CANNON
2139 High Tech Road • State College, PA • 16803 • USA
®
Instrument Company
®
Page 27
21
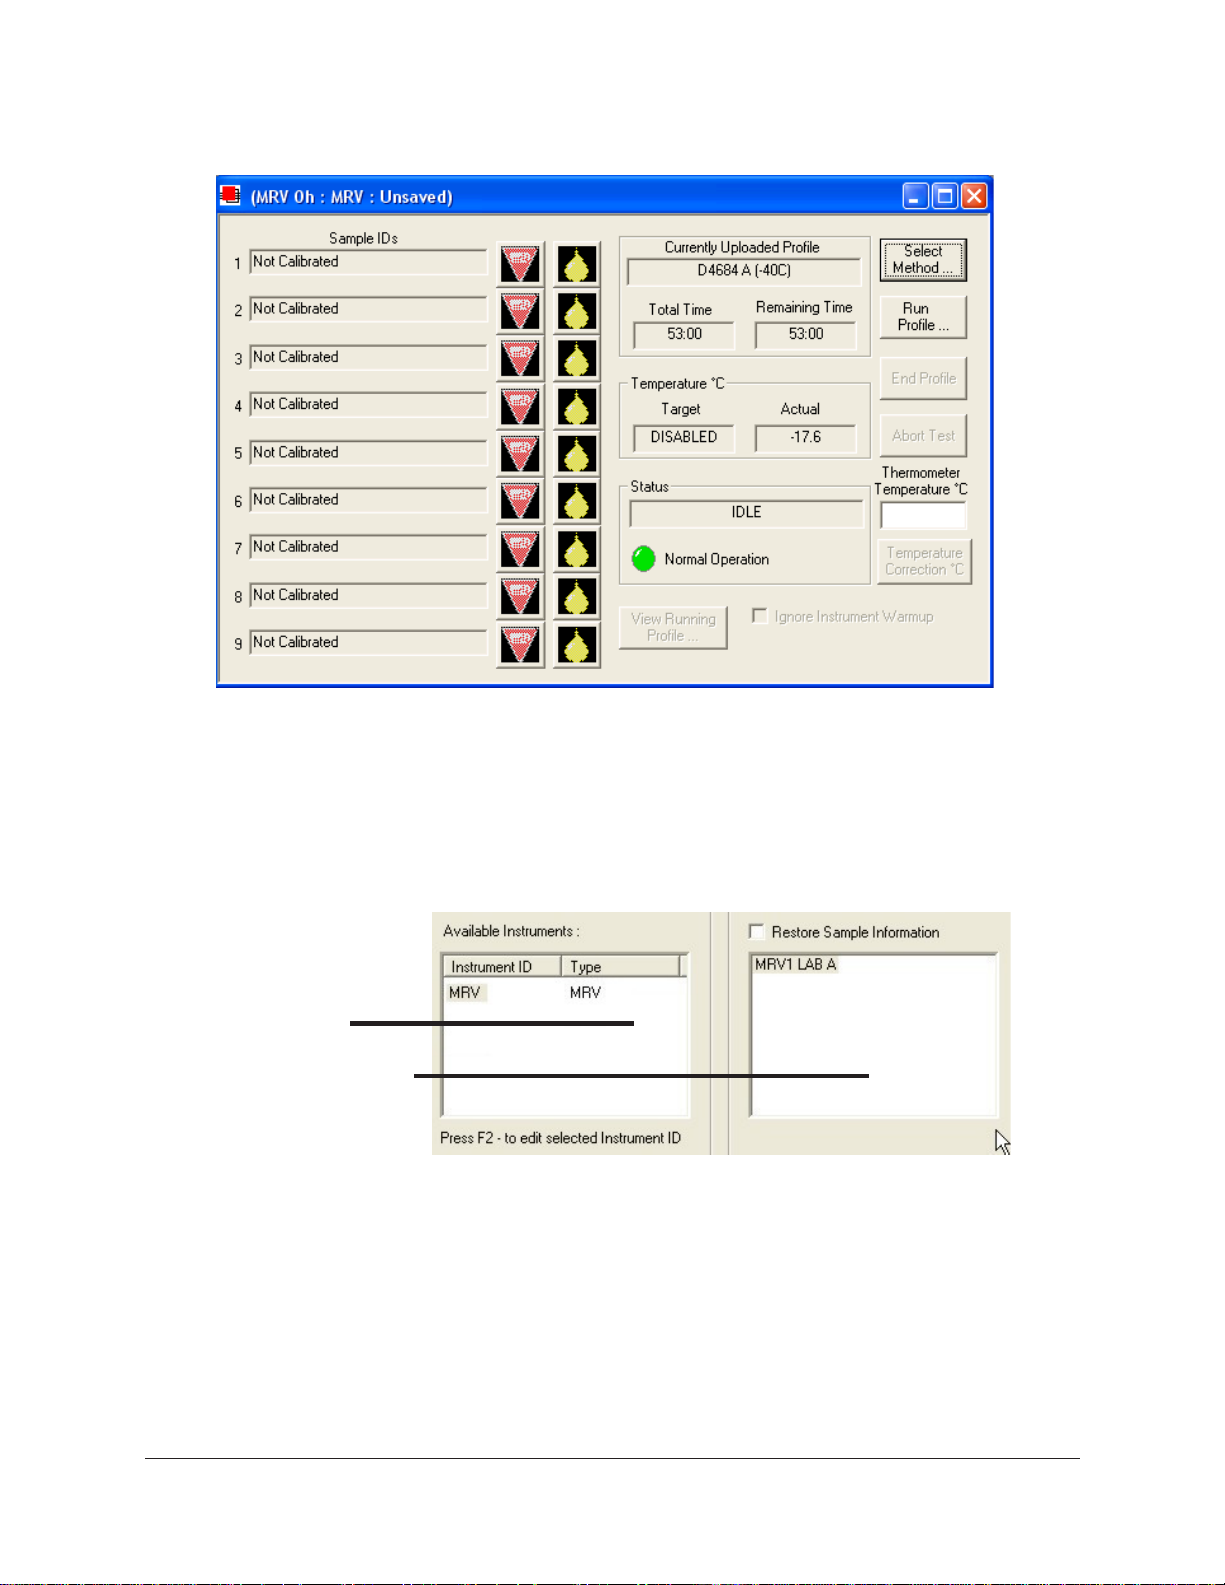
The Instrument View window
NOTE
Instrument ID/T ype
Instrument Configuration
To display the Instrument View window, click View Instrument from the
Main menu. The View Instrument window will appear. Then click the
MRV instrument ID to display the list of available configurations. For
now, select the default configuration and click OK.
If the Available Instruments list box is blank, your instrument(s) may not
be on-line. Check cable connections and make certain the instrument
power switch is ON.
CANNON
®
Mini-Rotary Viscometer CMRV-4500 Instruction & Operation Manual
Version 1.1e—October, 2011 • CANNON
2139 High Tech Road • State College, PA • 16803 • USA
®
Instrument Company
Page 28
22
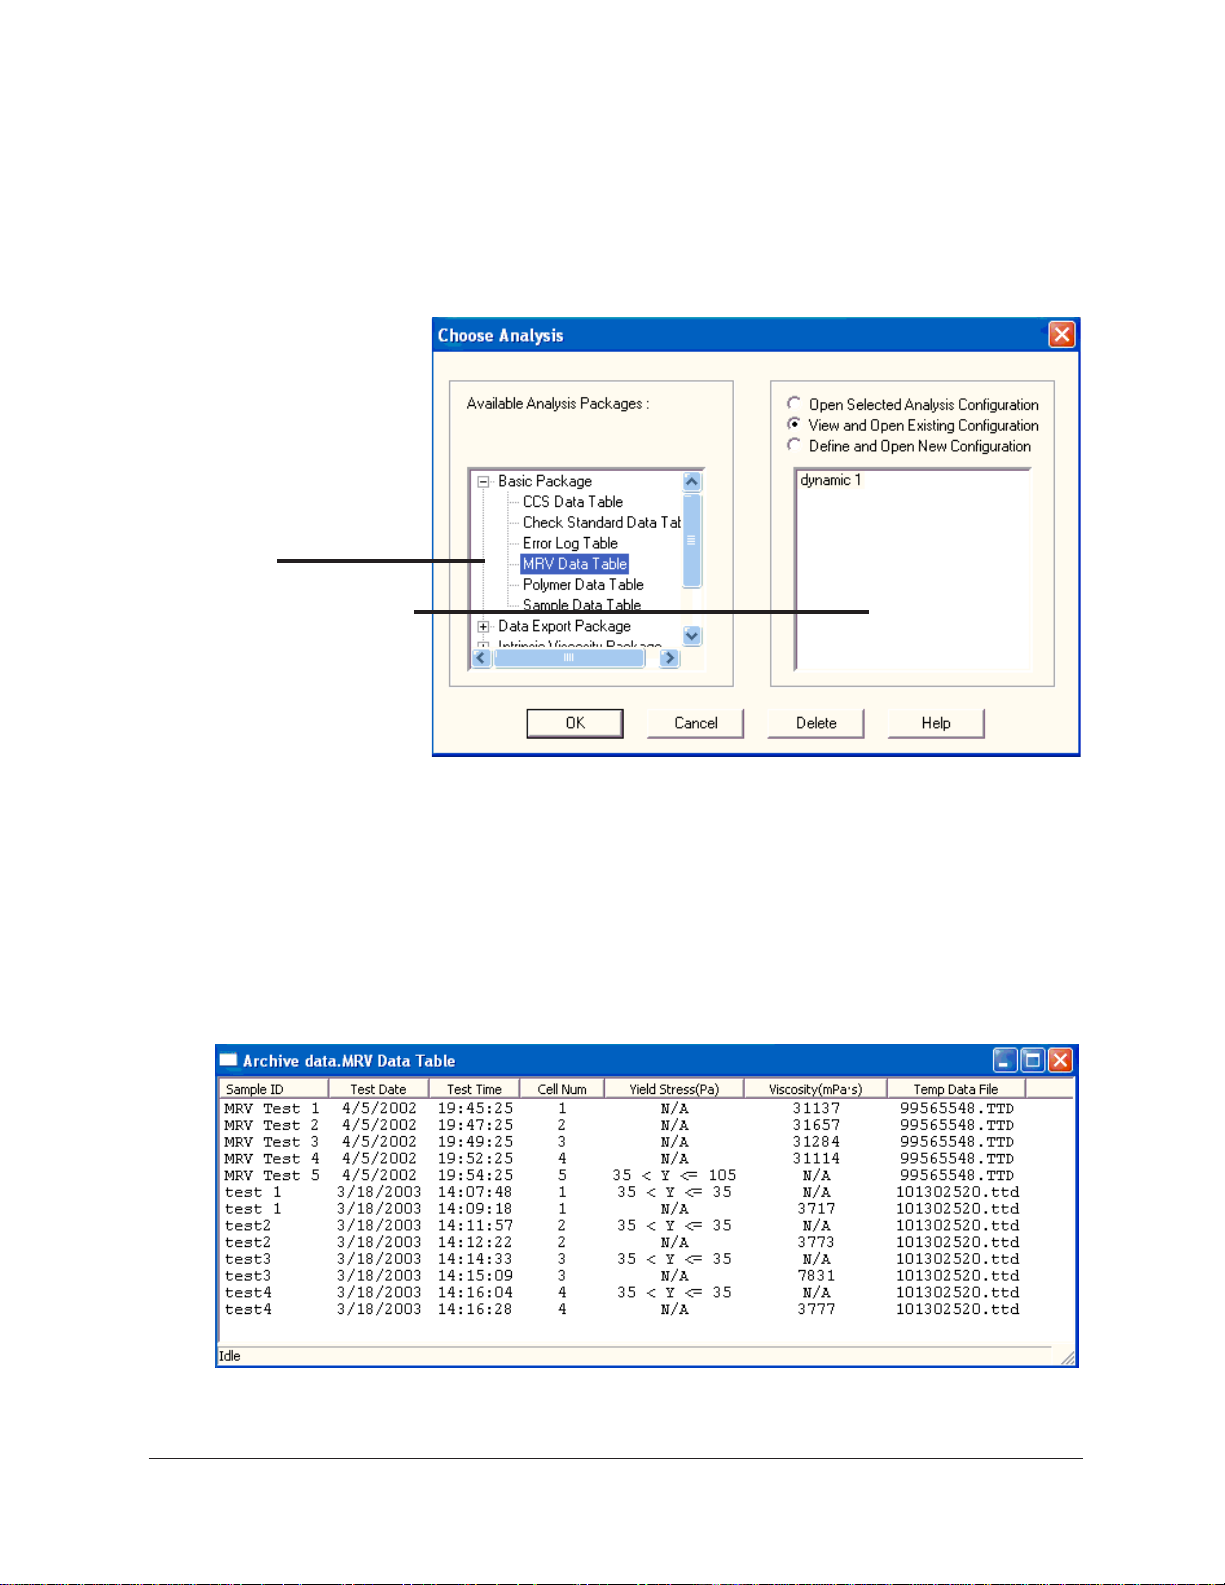
Viewing report data
After you have completed CMRV calibration and testing (see next
chapters), you will be able to display a report window with CMRV-4500
test results. To access the database and display test data, click Analyses/
View Analysis. Then select MRV Data Table from the list of available
analyses:
Report T ype
Report Configuration
The Choose Analysis window
Choose the desired report configuration from the list of available configurations and then click OK to open the Analysis Configuration
window. Then select report configuration options (see Chapter 13 for
more information) and click OK to generate the analysis from existing
sample data. If the report window is blank, you may have to change the
Date Filter options to include the desired range of samples from the
database.
The Sample Analysis Table window
CANNON
®
Mini-Rotary Viscometer CMRV-4500 Instruction & Operation Manual
Version 1.1e—October, 2011 • CANNON
2139 High Tech Road • State College, PA • 16803 • USA
®
Instrument Company
Page 29
23
Checking Configuration data
Configuration protection
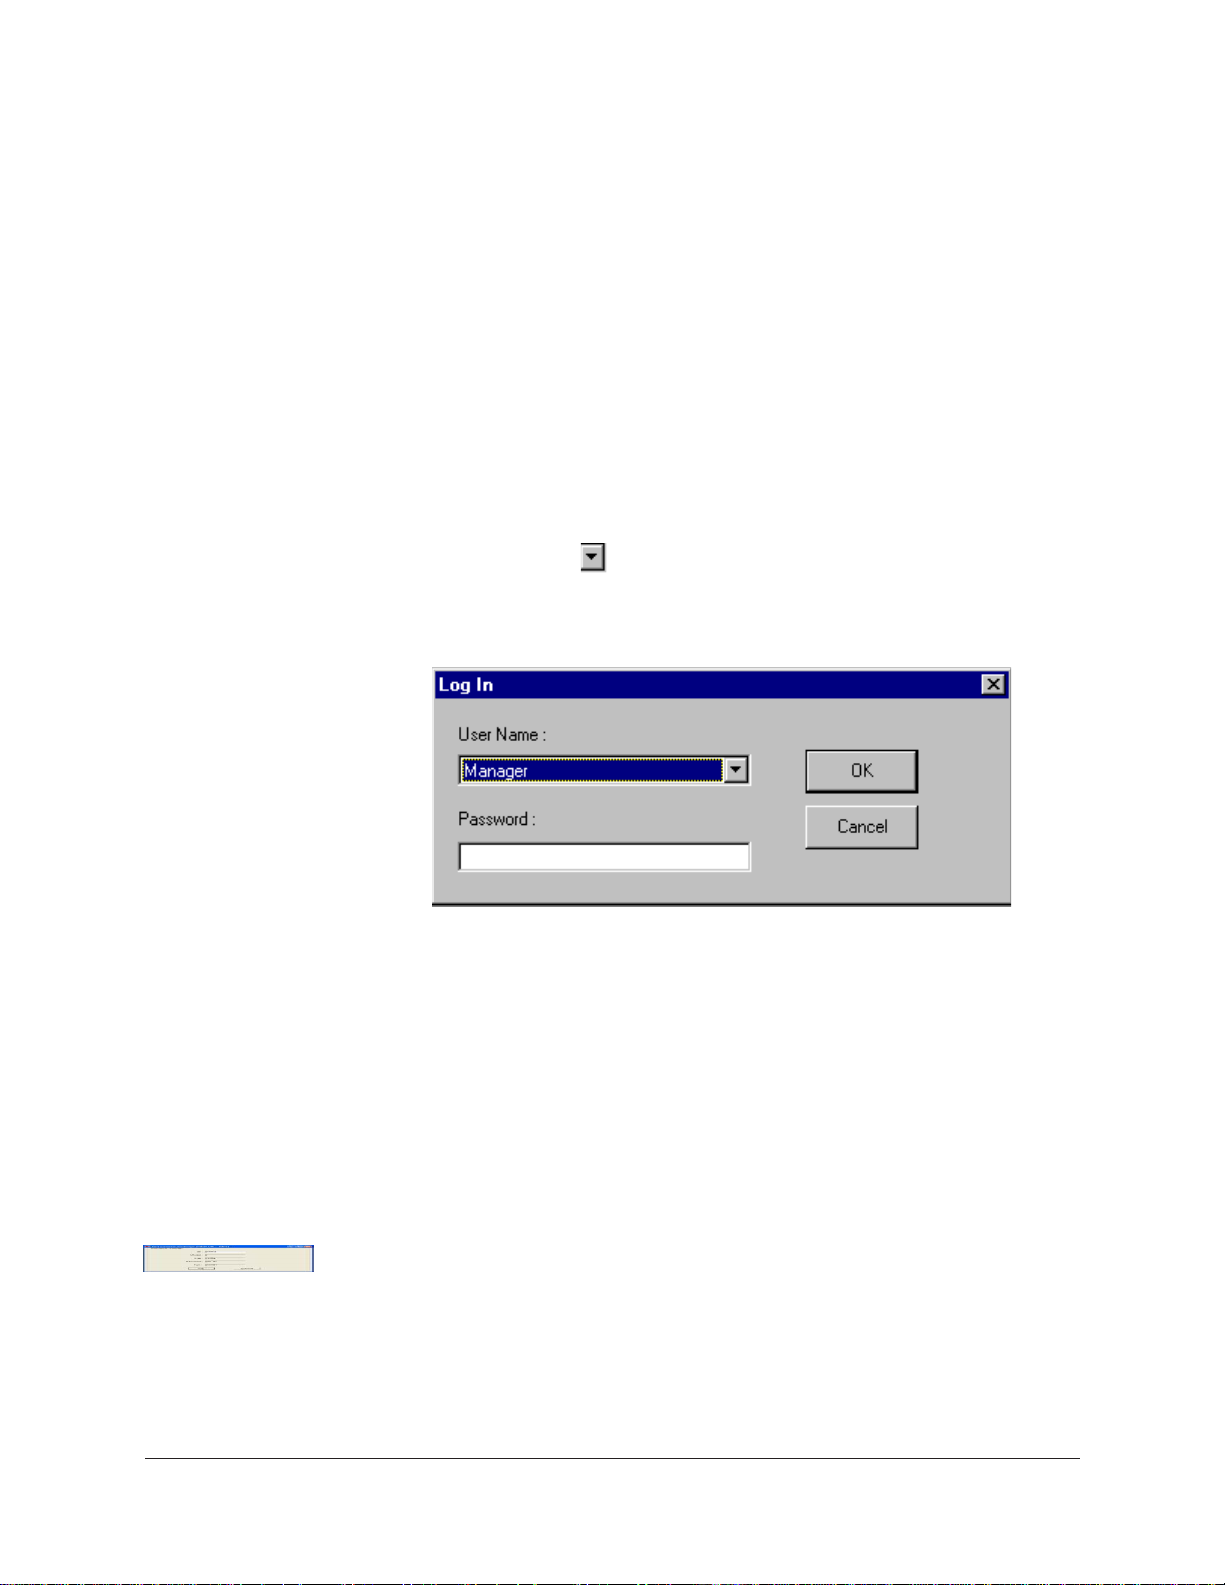
Logging in
Follow the procedures in the next several sections of this chapter to select
and verify the instrument and calibration settings to ensure that they
®
conform to the actual characteristics of your CANNON
instrument.
T o check the configuration settings for your instrument(s), you must log
in to the security system as a manager. The software is installed with a
default Manager account. This account has no password, allowing any
operator access to manager-level software functions as long as the
password is not activated/changed. If you would like to engage the fullrelease security options, see Security Options, this chapter, for instructions.
1. Use your mouse to click Main from the VISCPRO® menu bar.
2. Click Log In from the Main menu options.
3. Click on the
(arrow) on the right side of the User Name: list box
to display the list of registered users.
4. Click Manager. Do NOT enter a password!
5. Click OK. The Log In window will close automatically and you will
be logged in as management personnel.
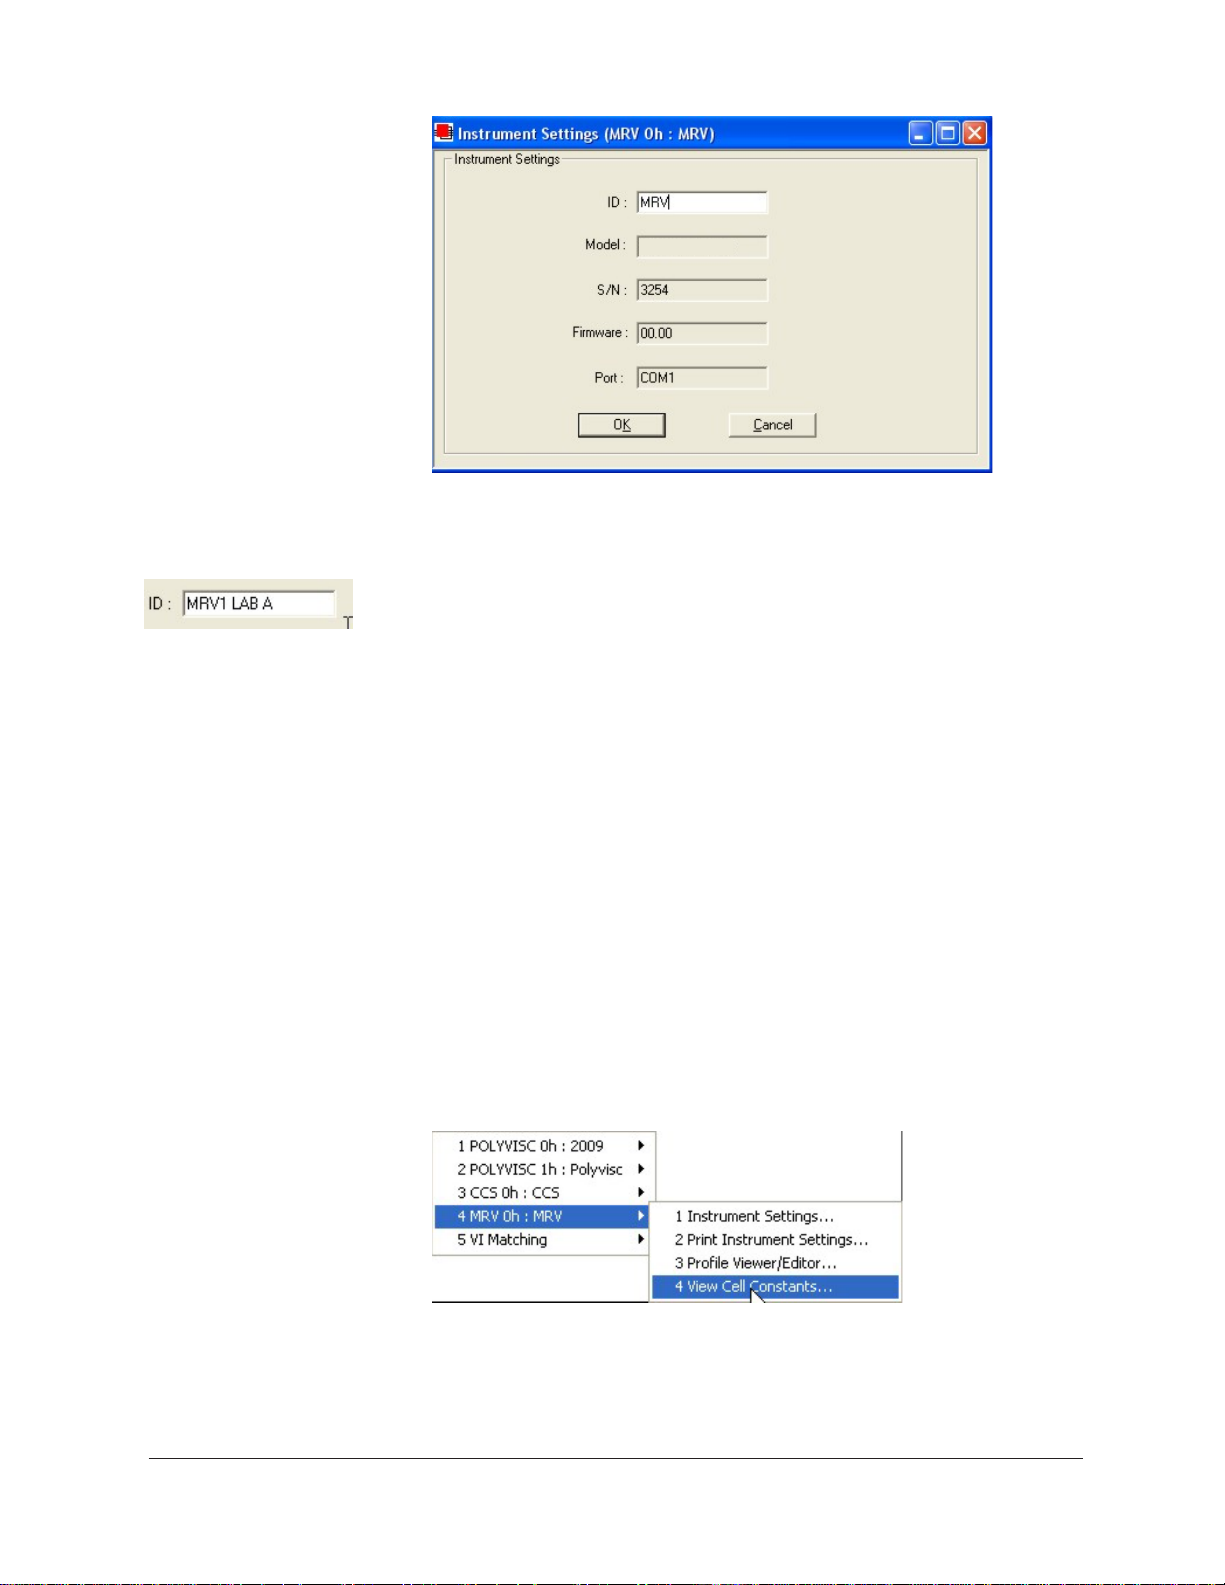
Checking Instrument Settings
1. Use your mouse to click (select) Configure from the VISCPRO
menu bar.
2. Select your instrument from the list of available instruments (there
may be only one instrument in the list).
3. Select Instrument Settings from the list of configuration options.
The Instrument Settings window will appear.
You will use the Instrument Settings window (see graphic following) to
describe and control MRV instrument operational features. These settings
affect the instrument as a whole. Check the instrument settings for your
instrument per the instructions, and make any necessary changes:
CANNON
®
Mini-Rotary Viscometer CMRV-4500 Instruction & Operation Manual
Version 1.1e—October, 2011 • CANNON
2139 High Tech Road • State College, PA • 16803 • USA
®
Instrument Company
®
Page 30
24
The Instrument Settings window
4. Use the ID field to input instrument identification information using
up to 30 alphanumeric characters.
Checking initial calibration
The remaining fields in the Instrument Settings window are noneditable (information is obtained via serial communication with the
CMRV instrument). The Model: field will indicate the model of your
instrument. The S/N: field indicates the serial number from the label
on the rear service panel. The Firmware: field indicates the version
for the current instrument firmware. The Port: field indicates the
current communications port for the RS-232 cable connecting your
computer to the CMRV-4500 instrument.
5. When you have entered all settings, click OK.
After you have completed the CMRV instrument calibration for temperature and cell constants (see following chapters), follow the procedure
below to verify the initial calibration settings.
1. From the VISCPRO primary window, click Configure/MRV/View
Cell Constants. The View Cell Constants window will open.
CANNON
2. Ensure that Calibration data, including constants and viscosity, is
available for each cell. Then click OK to close the View Cell Con-
stants window.
®
Mini-Rotary Viscometer CMRV-4500 Instruction & Operation Manual
Version 1.1e—October, 2011 • CANNON
2139 High Tech Road • State College, PA • 16803 • USA
®
Instrument Company
Page 31

25
NOTE
NOTE
Some fields/options are security-protected, and may not be viewable.
The View Cell Constants window
3. Click Configuration/Print Instrument Settings to open the Win-
®
dows
Print window. Select the desired printer and click OK to print
current calibration settings.
CANNON recommends printing calibration settings each time the
calibration values change.
Setting multiple CMRV instrument addresses
When installing/connecting multiple CMRV instruments, ensure that the
instrument address for each instrument is different. See APPENDIX D
for more information on multi-unit configuration.
Security options
The VISCPRO® application offers a level-based security system with a
log in procedure. This system ensures that available software functions
are appropriate for the user's needs.
Following initial installation of the software, security options may be
accessed and changed from the VISCPRO® Main menu by individuals
who have the manager password (initially blank).
Each user can be assigned a security level, which is used to determine
permitted operations. Three security levels are defined by the software:
Technician (least privileged), Manager (intermediate privilege), and
Service (maximum privilege–reserved for CANNON® Instrument
Company service personnel).
Users log in when using the software by typing their name and (optional)
password in the Log In window . Different security levels offer different
instrument use options. Technicians are permitted to access operational
CANNON
®
Mini-Rotary Viscometer CMRV-4500 Instruction & Operation Manual
Version 1.1e—October, 2011 • CANNON
2139 High Tech Road • State College, PA • 16803 • USA
®
Instrument Company
Page 32

26
features required for testing samples and performing other routine
operations. Managers may access advanced configuration and reporting
options. The Service level permits access to all instrument and security
parameters.
Initial security setup
The VISCPRO® software installation creates a security account for one
manager with a blank password. After VISCPRO® installation, a password should be assigned for the manager using the Change Password
menu option from Main. Managers may add or change accounts for
technician status personnel.
Use the Log In feature to identify the CMRV operator and/or access
security functions.
Procedure
Procedure
NOTE
Once an operator is logged in, that operator’s name is associated with
any sample data obtained during that VISCPRO session. The operator
name may be included in analyses.
1. Click Log In from Main.
2. Select the desired name from the drop-down list box.
3. Type the desired password in the Password field for the individual
selected.
4. Click OK.
Use the Change Password feature to change the current user password.
1. Log in to the VISCPRO® software using the Log In command from
Main.
2. Select Change Password from the Main menu options.
3. Type in the new password in the Password field.
4. Retype the password in the Confirm Your New Password field.
5. Click OK to save the new password and close the Change Pass-
word window.
CANNON
Use the Update User Information feature to update the security list of
authorized technicians and managers. User information can only be
updated by an individual logged in with a higher security clearance than
the user for which information is to be altered. Manager status is necessary to change Technician information. Service status is necessary to
change Manager information. T o obtain Service status, it is necessary
to select user CANNON Instrument Company from the Log In window
and to type in the current CANNON® password. For the current password (updated daily), call CANNON® at (814) 353-8000.
®
Mini-Rotary Viscometer CMRV-4500 Instruction & Operation Manual
Version 1.1e—October, 2011 • CANNON
2139 High Tech Road • State College, PA • 16803 • USA
®
Instrument Company
Page 33

27
Procedure
NOTE
1. Click Log In from Main.
2. Select your Manager or Service level user name from the User
Name list box. Input the correct password in the appropriate field.
3. Click OK.
4. Click Update User Information from Main.
5. Select the desired user from the User Name list box.
To delete a user, just click Remove User after selecting the user name.
The account will be immediately and permanently removed.
6. Enter and verify the desired password, and select user security status
using the appropriate list boxes.
7. Retype the password in the Confirm Password field.
8. Click Add or Update User to save your changes.
9. Click Done to exit the Change User List window.
To use the Log Out feature, click Log Out from Main. The current user
will be logged out of the security list of authorized technicians and
managers. The software will automatically reset to the lowest security
level. Any ongoing test operations will continue.
CANNON
®
Mini-Rotary Viscometer CMRV-4500 Instruction & Operation Manual
Version 1.1e—October, 2011 • CANNON
2139 High Tech Road • State College, PA • 16803 • USA
®
Instrument Company
Page 34

28
This page intentionally left blank.
CANNON
®
Mini-Rotary Viscometer CMRV-4500 Instruction & Operation Manual
Version 1.1e—October, 2011 • CANNON
®
Instrument Company
2139 High Tech Road • State College, PA • 16803 • USA
Page 35

CHAPTER
29
6
NOTE
A/W Heat Exchanger
Checking thermometers
PREPARING FOR CMRV
TESTING/CALIBRATION
The procedures in this chapter should be followed when preparing for
CMRV-4500 testing or calibration.
In the event that the protocols of your ASTM test method differ from any
of the procedures outlined in this manual, the ASTM method should take
precedence.
T o prepare for operation of the CMRV-4500 unit, turn on the POWER
switch on the upper rear panel of the Air/Water Heat Exchanger.
The ice point of the CMRV-4500 thermometers should be checked
periodically at 76 mm immersion, which corresponds to the depth of
immersion in the CMRV-4500 aluminum block.
Cleaning cycle
CAUTION
CAUTION
Cleaning procedure
Small deviations in the ice point (less than 0.4°C) should be noted and
added to (or subtracted from) calibration readings at all other temperatures (See section on temperature calibration). If corrections larger than
0.4°C are needed, there may be a problem with the thermometer. Examine the thermometer for a bubble of gas in the lower reservoir, a bubble
of mercury in the upper reservoir, or a break in the mercury column. For
information on joining separated mercury columns see APPENDIX C.
Clean the rotors and all nine viscometric cells as described in the following procedure.
When handling the rotors, be careful not to damage the rotor tips.
Damage to the tips will cause erroneous test results and may damage
the cells.
When operating the CMRV, make sure that the rotor and cell numbers
coincide (use the #1 rotor in cell #1, the #2 rotor in cell #2, and so on).
Failure to do so may diminish test accuracy and void the cell calibration
constants.
1. Remove the Plexiglas® cover from the CMRV-4500 and place it away
from the cleaning solvents.
CANNON
®
Mini-Rotary Viscometer CMRV-4500 Instruction & Operation Manual
Version 1.1e—October, 2011 • CANNON
2139 High Tech Road • State College, PA • 16803 • USA
®
Instrument Company
Page 36

30
NOTE
CAUTION!
Exposure to acetone liquid or acetone vapor may damage the cover.
2. Turn on the CMRV-4500 (the green power indicator on the switch
will light and the left panel lights will flash once).
The CMRV cleaning procedure may be initiated from a "cold" CMRV;
however, a calibration or profile should not be initiated until the instrument has completed a warmup period of approximately 45 minutes. If the
warm-up period is less than 45 minutes, the instrument may not control
temperature within acceptable tolerance parameters.
3. Assemble the necessary cleaning supplies:
oil solvent
acetone (optional during low humidity)
suitable solvent-resistant container for placing/cleaning rotors
vacuum w/trap for solvent and oil
flexible tube, about 150 mm long and 3-5 mm in diameter, connected
to the vacuum trap
two plastic squeeze bottles, each with an extension long enough to be
able to direct oil solvent and acetone directly into the cup of the
viscometer cells
4. Start the VISCPRO
®
software.
5. Click Service/MRV and select the Cleaning ... option to open the
Cleaning Service window. The window displays the current CMRV
block temperature for the selected instrument, as measured by the
temperature probe. The window also indicates the current instrument
status.
The Cleaning Service window
6. Click Start Cleaning Service. to initiate the cleaning cycle. The
instrument will be heated to 50°C for convenient cleaning.
NOTE
CANNON
7. Remove the threads from the rotors and set the threads aside.
CANNON® recommends hanging the threads on individual hooks during
cleaning. Hanging a paper clip on each loop reduces the chance of curling.
®
Mini-Rotary Viscometer CMRV-4500 Instruction & Operation Manual
Version 1.1e—October, 2011 • CANNON
2139 High Tech Road • State College, PA • 16803 • USA
®
Instrument Company
Page 37

8. Wait for the CMRV-4500 to reach the cleaning temperature.
31
NOTE
CAUTION
When the CMRV-4500 cleaning cycle is activated, the internal heater
raises the viscometer block temperature 2-3°C per minute to approximately 50°C. Precise temperature control is not necessary for cleaning.
9. When the CMRV-4500 has reached cleaning temperature remove the
rotors and wipe excess oil from them. Gently place the rotors into a
solvent-resistant container, such as a 500-ml glass beaker.
Be careful not to damage the rotor tips when handling the rotors.
10. Use a vacuum to remove oil from the viscometric cells.
11. Thoroughly rinse the
inside surfaces of each
cell at least twice with
oil solvent using a
squeeze bottle with a
length of plastic tubing
attached to the nozzle
(see photo). Direct the
stream from the spray
bottle in such a way that
the liquid swirls around
the inside walls of the
Solvent cleaning of CMRV test cells
cell.
Cleaning rotors
WARNING
WARNING
Your solvent may be a hazardous substance. Use in accordance with
procedures recommended by your Material Safety Data Sheet (MSDS).
Avoid contact with skin and eyes. Avoid inhaling vapors. Use only in a
well-ventilated area.
12. Use vacuum to remove the solvent from the cells after each rinse.
13. Repeat steps 11-12 using acetone in place of solvent.
Acetone is a hazardous substance. Use in accordance with procedures
recommended by your Material Safety Data Sheet (MSDS). Avoid
contact with skin and eyes. Avoid inhaling vapors. Use only in a wellventilated area.
14. After the final rinse, allow the acetone to evaporate from the visco-
metric cell until the surfaces are completely dry .
15. Thoroughly rinse each rotor individually with oil solvent, then with
acetone. Properly dispose of waste liquid after cleaning.
16. After the final acetone rinse, place the rotors in a clean, dry area until
the remaining solvent on rotor surfaces has evaporated.
CANNON
®
Mini-Rotary Viscometer CMRV-4500 Instruction & Operation Manual
Version 1.1e—October, 2011 • CANNON
2139 High Tech Road • State College, PA • 16803 • USA
®
Instrument Company
Page 38

32
17. When you have finished cleaning the viscometer cells and rotors,
click Stop Cleaning Cycle. Then click
to exit the Cleaning ...
window.
NOTE
Inserting rotors
CAUTION
Inserting rotor pins
NOTE
After the cleaning cycle, you should permit the cells and rotors to dry for
15 minutes before introducing oil sample into the viscometric cells.
The viscometric cells are numbered from left to right when looking at the
viscometer from the pulley-wheel side, with cells 1, 3, 5, 7, and 9 in the
front row and cells 2, 4, 6, and 8 in the back row. Each rotor is identified
by the number at the top of its shaft.
1. Rotors are normally stored in the integral storage drawer. When you
are ready to begin a temperature profile, inject the sample and gently
place each of the nine numbered rotors into their corresponding
viscometric cells.
Do NOT drop the rotors into position or you may damage the rotor tips.
2. Align the rotor beneath the corresponding hole in the upper bearing
plate.
The upper bearing support should have approximately 1 to 2 mm (1/32
to 1/16 inch) clearance above the top of the rotor shaft. If the rotor tip is
not seated properly, there will not be enough clearance between the top
of the rotor shaft and the upper bearing plate to permit orientation of the
rotor under the bearing plate.
NOTE
Checking rotors
Sensor connection
CANNON
3. Insert the pin through the plate and into the center bearing hole at the
top of the rotor shafts.
The pins, when inserted through the upper bearing plate, should extend
approximately 3 mm (1/8 inch) below the plate.
4. Make sure that the rotor locking pins are in the raised (detent)
position. Rotate each of the rotors to ensure that it spins freely and
without signs of binding at either bearing.
5. Remove the rotors from the viscometric cells.
6. If necessary, install the pulley-wheel assembly on the slide track. See
Chapter 4 for details.
7. Make sure that the free end of the sensor wire from the pulley-wheel
assembly is plugged into the receptacle marked WHEEL on the
CMRV-4500 front panel.
You are now ready to perform the CMRV-4500 calibration procedure or
run a test sample using the applicable test methods or a custom profile.
See the appropriate chapter for further instructions.
®
Mini-Rotary Viscometer CMRV-4500 Instruction & Operation Manual
Version 1.1e—October, 2011 • CANNON
2139 High Tech Road • State College, PA • 16803 • USA
®
Instrument Company
Page 39

CHAPTER
33
7
CALIBRATING THE CMRV
TEMPERATURE PROBE
The CMRV temperature probe must be calibrated before performing the
initial cell calibration or running temperature profiles. A complete
calibration session involves setting temperature offsets in the VISCPRO
software for key temperature checkpoints beginning at 80°C, then 50°C,
then other temperatures at 5-degree increments from 0 to -40°C. The
calibration process ensures that temperature probe readings are correctly
interpreted by the CMRV hardware and software. This ensures accurate
temperature control throughout the temperature profile.
There is a 10-minute equilibration time at each calibration temperature.
The entire calibration procedure requires at least 3 hours and requires
operator input at each temperature plateau. Thereafter, the probe should
be calibrated at the user's discretion, particularly when viscosity data is
suspect, the instrument exhibits poor repeatability , or the probe temperature on the display does not correspond with the calibrated thermometer
reading.
Probe calibration procedure
Checking temperature probe
NOTE
Both the CMRV probe calibration and cell calibration procedures should
be completed shortly after initial installation of the CMRV software.
Probe calibration must precede cell calibration to ensure accurate temperature control during the cell calibration process. Periodic probe
calibration will enhance the accuracy of test results.
1. After preparing the CMR V instrument (see Chapter 6), place 10 ml ± 0.1
ml of any clean generic oil sample into each of the viscometric cells
being calibrated. Carefully place the rotors into their corresponding
viscometric cells and secure each rotor in position with the rotor pin.
2. Make sure that the thermistor probe sheath is securely seated in the
cylindrical opening on the rear of the CMRV housing.
3. Using the VISCPRO
Calibration. The Temperature Probe Calibration window will open.
In preparation for the heating phase of the calibration procedure, remove
the calibrated -46°C to +30°C thermometer from the CMRV block to
prevent separation of the mercury column. Reinsert the calibrated
thermometer when CMRV block temperature is within its range.
®
software, click Service/MR V/Temperature Probe
CANNON
4. Select the desired temperature for calibration by clicking on the
thermometer graphic or selecting the temperature from the dropdown box. Then click the Calibrate button to begin the calibration
®
Mini-Rotary Viscometer CMRV-4500 Instruction & Operation Manual
Version 1.1e—October, 2011 • CANNON
2139 High Tech Road • State College, PA • 16803 • USA
®
Instrument Company
Page 40

34
NOTE
In each calibration session, the initial probe calibration must be performed at 80°C (see procedure below) before calibrating at other temperatures. When prompted by the VISCPRO software: "Do you want to
zero the offset at 80°C before calibrating?", click YES the first time in the
session that you attempt to calibrate at 80°C. Thereafter, click NO unless
you would like to start the calibration over from the default offset value.
The CMRV unit will begin heating or cooling to the desired temperature. When it reaches temperature, a 10-minute timer will start. This
delay allows the CMRV temperature to stabilize at the calibration
temperature. Note that more time may be required for stabilization at
80°C, 50°C and 0°C. After the timed delay, the Thermometer
Temperature °C field will become active, enabling data entry.
5. After the instrument reaches the probe calibration temperature and
completes the temperature stabilization period, type the actual
temperature from the reference thermometer in the Thermometer
Temperature °C field. Then click the Accept button to store the
temperature calibration offset to the current instrument configuration.
6. Click the Calibrate button again to reset the timer and check the
calibration for that temperature. If the reference temperature varies
from the displayed temperature, repeat steps 5 & 6.
NOTE
Make certain to use the "-" key when entering a temperature below 0°.
7. Repeat steps 4 through 6 for each desired calibration temperature.
Then click to exit the Temperature Probe Calibration window.
NOTES
Make certain to SAVE the instrument following a successful calibration
(File/Save Instrument). You should also print an archive copy of calibration data (click Configure/MRV/Print Instrument Settings). A partial
calibration session may enable you to run some profiles as long as the
coldest calibration offset is 5° lower than the lowest profile temperature.
Manual restoration of voltage and offset data
If the VISCPRO database is corrupted, or if temperature calibration data is lost
for any other reason, voltage and temperature offset values may be manually
restored without recalibrating the instrument. Existing data can be viewed by
clicking Service/MRV/Temperature Probe Calibration. When the user is
logged into VISCPRO as a Manager, the Temperature Probe Calibration
window displays additional security-protected controls for manual adjustment/
restoration of voltage and offset values obtained during the probe calibration.
T o manually adjust temperature offsets or voltage reference values, log into the
VISCPRO software as a Manager. Then open the probe calibration window
(Service/MRV/Temperature Probe Calibration). The Reference Supply
Voltages and offset fields will now be editable. Use your printed copy of the most
current instrument settings to determine appropriate values and input the values
in the indicated fields. Click OK when the values have been entered correctly.
Then click the Accept Manually Entered Offsets and V olt ages button.
CANNON
®
Mini-Rotary Viscometer CMRV-4500 Instruction & Operation Manual
Version 1.1e—October, 2011 • CANNON
2139 High Tech Road • State College, PA • 16803 • USA
®
Instrument Company
Page 41

CHAPTER
35
8
Initial calibration
Frequency
Calibration theory
CALIBRATING THE
CMRV CELLS
T o ensure the accuracy of sample data, the CMRV -4500 cell calibration
procedure must be completed after initial installation of the software.
First complete the temperature probe calibration (see previous chapter)
and instrument preparation (Chapter 6). Then follow the procedure in this
chapter to calibrate the CMRV cells.
After the initial calibration, CANNON
calibrated every 4-8 weeks at the discretion of the user. Note that some
ASTM methods may require multiple calibrations prior to sample testing.
These ASTM profiles will not appear in the drop-down list until all
calibration(s) required by the method is/are performed.
®
recommends that the cells be
Each of the nine viscometric cells must be calibrated to determine the
relationship between viscosity , angular velocity of the rotor, and the
applied mass.
The general calibration constant is determined from the following
equation:
where C' = general calibration constant, millipascals (mPa)
r = number of full revolutions
η = known viscosity of calibration oil at the calibration
temperature in centipoise (cP)
(1 centipoise = 1 millipascal second (mPa·s (cP))
M = applied mass, grams (g)
m = mechanical friction of bearings, grams (g)
t' = time for r revolutions in seconds (s)
When this test is run according to the applicable ASTM procedures, m is
negligible relative to M, r = 3, and M = 150. Thus, for convenience, the
calibration equation can be simplified as follows:
CANNON
where C = calibration constant for a specific cell for 3 revolutions
at a mass of 150 g (mPa)
®
Mini-Rotary Viscometer CMRV-4500 Instruction & Operation Manual
Version 1.1e—October, 2011 • CANNON
2139 High Tech Road • State College, PA • 16803 • USA
®
Instrument Company
Page 42

36
η = viscosity of the calibration standard (cP)
t
3r
Cell calibration procedure
= time for 3 revolutions of the rotor (sec)
Calibration standards
Preparing the cells
Introducing sample
CANNON
®
viscosity standard N105B is recommended for calibration at
-20°C and -25°C. This calibration is required for running ASTM profiles
included with the software. At -20°C, N105B has a nominal viscosity of
30,000 cP (mPa·s). At -25°C, N105B has a nominal viscosity of 56,600
cP (mPa·s).
It is also possible to calibrate the CMRV cells at -25°C using viscosity
standard N400B with a nominal viscosity of 60,000 cP (mPa·s).
CANNON
®
Instrument Company can furnish viscosity standards for a
variety of temperatures and viscosities. The CMRV-4500 can be calibrated over the viscosity range of 1 to 99,999 cP (mPa·s).
After you have prepared the CMRV-4500 for the calibration run (see
Chapter 6) follow the procedure below to calibrate the CMRV.
1. Place 10 ml of the calibration
standard into each of the nine
cells (see photo).
2. Carefully place the rotors in
their corresponding viscometric cells, making sure that the
rotor tip at the bottom of the
shaft slides into the recess at
Injecting standard into CMRV test
cells
the bottom of the cup. Do NOT drop the rotors into place.
Winding rotors
CANNON
3. Secure each rotor in position with a rotor pin, and make sure that the
rotor locking pin is in the raised position.
4. To wind the rotors in preparation for the cell calibration, slide the
pulley-wheel assembly along the track until the pulley is aligned with
the rotor to be wound. Use the engraved lines on the slide bar as a
guide to determine the proper position of the left side of the pulleywheel block.
5. Place the loop of a thread over the left end of the crossbar at the top
of the rotor shaft.
6. Pass the free end of the thread (the end with the plastic ring) over the
pulley-wheel and allow it to hang freely in front of the viscometer.
While holding the rotor motionless, hook a light weight, such as a
large paper clip, on the plastic ring to apply slight tension to the
thread.
7. Guiding the thread with your finger, turn the rotor clockwise to wind
the thread above the crossbar until the knot in the loop has been
®
Mini-Rotary Viscometer CMRV-4500 Instruction & Operation Manual
Version 1.1e—October, 2011 • CANNON
2139 High Tech Road • State College, PA • 16803 • USA
®
Instrument Company
Page 43

wound around the rotor shaft.
Then pass the thread below the
crossbar and continue turning the
rotor clockwise (as viewed from
above) to wind 20 closely spaced turns of
thread around the shaft below the crossbar
without overlapping the turns. About 200 mm
(8 inches) of thread will remain. Place this
remaining length of thread over the upper
bearing support plate so it hangs to the rear of
the viscometer
and secure the
rotor in place by
lowering the rotor
locking pin over
the rotor crossbar
(see figure and
photo). Y ou may
need to turn the
rotor slightly to
align the crossbar
with the locking
pin.
37
Plexiglas
®
cover placement
8. Repeat steps 4-7
for each of the
remaining rotors/
cells.
9. Place the
®
Plexiglas
cover
in position over
the top of the
viscometric cells.
The small hole
Wound rotor with cell
caps in place
which allows the 46 to 30°C thermometer to extend through the
cover should be on the left when viewed from
the front of the viscometer.
10. CMRV users following the ASTM D 4684 or
ASTM D 3829 methodology should connect a
flexible 3/16"-OD tube from their dry gas
supply and regulator to the dry gas purge in the
Plexiglas
®
cover . The tubing may be removed,
along with the cover, prior to viscosity/yield
stress testing.
CANNON
11. Whatever the methodology, the purge should
continue throughout the temperature profile
using dry gas at a flow rate
between 20 and 30
milliliters per minute.
®
Mini-Rotary Viscometer CMRV-4500 Instruction & Operation Manual
Version 1.1e—October, 2011 • CANNON
2139 High Tech Road • State College, PA • 16803 • USA
®
Instrument Company
CMRV with sidemounted dry gas
purge
Page 44

38
NOTES
Cell calibration test procedure
Cell calibration
To reduce the chance of separating the mercury column during the heating
phase of the temperature profile, you may wish to initially remove the
calibrated thermometer from the CMRV unit. Store the thermometer in a
vertical position. You may replace the calibrated thermometer when the
CMRV has cooled to 30°C or lower. If the thermometer is not in place
during CMRV-4500 cooling, you should seal the thermometer well in the
block and the thermometer hole in the Plexiglas® cover with stoppers,
particularly when the humidity of the ambient air is high. This will help
prevent frost buildup on the surface of the block and enhance temperature
control.
Be sure the thread is properly wound around each rotor and the Plexiglas
cover is in place on top of the CMRV-4500 before proceeding with the test.
®
Use the VISCPRO
software to input calibration information as follows:
1. Load the VISCPRO software and make certain that the MR V instrument is listed on a button bar at the bottom of the Primary Window.
If it is not, click Poll for Instruments from the Main menu to
establish computer contact with the CMRV unit.
2. Click Service/Calibrate Cell Constants. The Calibration Param-
eters window will open.
®
3. Click the Temperature field and select the desired calibration
temperature from the drop-down options.
4. Click the Mass field and select the correct value for the test mass.
5. Click the Known
Viscosity field and input
the known viscosity of
the standard at the
calibration temperature
in centipoise (mPa·s).
6. Click the Calibrate ...
button to open the
Calibrate Cell Constants window. The
CMRV-4500 will cool to
the desired calibration
temperature and maintain the temperature for
one hour. When the
instrument has completed the calibration
profile, the Status field
in the Calibrate Cell
Running a calibration test
Constants window will
indicate Ready to Calibrate.
CANNON
®
Mini-Rotary Viscometer CMRV-4500 Instruction & Operation Manual
Version 1.1e—October, 2011 • CANNON
2139 High Tech Road • State College, PA • 16803 • USA
®
Instrument Company
Page 45

7. Remove the Plexiglas® cover and align the pulley-wheel with the cell
to be calibrated.
8. Place the thread from this cell over the pulley-wheel. Hook the
calibration weight specified by the Method to the end of the thread
(see photo).
9. From the Calibrate window, click the desired cell number for
calibration.
10. Press the blinking Start Test button on the CMRV controller.
11. Raise the locking pin quickly and smoothly. The weight will apply
torque to the rotor. The computer will record the time for three
complete revolutions.
12. Permit the wheel to make at least three complete revolutions (the
viscosity LED will go out). Then catch and remove the 150-gram
weight before the thread is completely unwound. Do not permit the
thread to completely unwind.
39
NOTE
NOTE
NOTE To view previously-stored calibration constants, click Configure/MRV/
Limiting calibration time
NOTE
After the rotor revolution time has been recorded, the program will
calculate the calibration constant for that cell.
13. At the conclusion of the test, the VISCPRO® software will display
the newly-calculated calibration constants.
If the new constants vary from the previous cell constants by more than 4
percent, an error will be generated. It is generally advisable to recalibrate
the cell in this instance.
View Cell Constants.
14. Repeat the above calibration routine for the remaining cells.
It is recommended that you perform the cell calibration immediately
following the one-hour sample soak time. Although CANNON® viscosity
standards N105B and N400B have been dewaxed to a very low temperature, the standard should not be allowed to soak at -20°C for more than
two hours. The small amount of wax which may be in the oil could cause
an error in calibration.
If any cell has a calibration constant more than 10 percent higher or
lower than the average for the other cells, the fault may be excessive
friction in the upper bearing, improper seating of the lower bearing, or a
damaged rotor tip. Examine the rotor for damage and, if necessary,
replace the rotor and recalibrate the cell.
Saving calibration data
CANNON
15. At the conclusion of the calibration, review the displayed data in the
Calibrate Cell Constants window. If the data is not acceptable,
recalibrate as necessary .
®
Mini-Rotary Viscometer CMRV-4500 Instruction & Operation Manual
Version 1.1e—October, 2011 • CANNON
2139 High Tech Road • State College, PA • 16803 • USA
®
Instrument Company
Page 46

40
16. When acceptable values have been obtained, click Abort T emperature Control. Then click Save Data to save the new calibration
constants.
Do not omit this step or new calibration data will be lost.
17. Close the Calibrate Cell Constants window and then click Main/
Save Instrument. The Save Instrument window will appear.
18. In the Save As box, input a name for the new instrument configuration (which includes the newly-calculated calibration constants).
Then click OK to save the configuration.
Printing calibration data
CANNON Instrument Company recommends generating a hard copy
record of calibration data after each calibration session. To print the
current calibration constants, click Configure/Print Instrument Set-
tings.
CANNON
®
Mini-Rotary Viscometer CMRV-4500 Instruction & Operation Manual
Version 1.1e—October, 2011 • CANNON
2139 High Tech Road • State College, PA • 16803 • USA
®
Instrument Company
Page 47

CHAPTER
41
9
USING THE CMRV SOFTWARE
VISCPRO® generic instrument interface
Your software for Windows® 95/NT® is comprised of a generic instrument interface (VISCPRO®) and a collection of instrument/analysisspecific modules. This chapter of the manual will explain the software
options for the VISCPRO
bundled with the instrument software. Additional software modules,
customized software, and any documentation for add-on software options, are provided separately .
®
program and other modules commonly
HELP system
NOTE
CANNON
VISCPRO
Your software supports a complete HELP system. To access HELP for
the software, click the HELP option from the VISCPRO
display . For context-sensitive HELP support for your interface, press 1
or click on the HELP buttons provided.
Because the VISCPRO
mented menu options may not be visible to technician-operators.
®
Mini-Rotary Viscometer CMRV-4500 Instruction & Operation Manual
Version 1.1e—October, 2011 • CANNON
2139 High Tech Road • State College, PA • 16803 • USA
®
primary display with menu options
®
software is security-protected, some docu-
®
Instrument Company
®
primary
Page 48

42
Main options
The View Instrument option opens the View Instrument window which
permits you to view existing instruments and configurations. You may
also select and restore elements from saved configurations for on-line
instruments.
The View Instrument window
The View Instrument window is comprised of:
Two list boxes (Available Instruments and Saved Configurations)
Restore ... check boxes (the Restore Instrument Settings and
Five button options (OK, Cancel, Refresh (screen refresh), Delete
Available Instruments: The Available Instruments list box in the
View Instrument window displays a list of all on-line instruments for
configuration. To view and/or select saved configuration options for an
on-line instrument, you must first click on the desired instrument from
the list of available instruments.
NOTE
To access the Instrument View window to enter sample information for
the selected instrument WITHOUT restoring a saved configuration, click
on the desired instrument, then click OK without checking any of the
Restore options. The last-used configuration for that instrument will be
retrieved.
Restore Service Settings options are password-protected managerial/service functions)
and Help).
CANNON
®
Mini-Rotary Viscometer CMRV-4500 Instruction & Operation Manual
Version 1.1e—October, 2011 • CANNON
2139 High Tech Road • State College, PA • 16803 • USA
®
Instrument Company
Page 49

Saved Configurations: The Saved Configurations list box (located
directly under the Restore . . . check boxes) allows you to make changes
to the current configuration for any networked CANNON
®
instrument by
restoring any or all elements (Instrument, Tray or Sample) of a saved
configuration. To restore saved configuration settings, select the instrument from the Available Instruments window and then click on the
desired configuration from the list of saved configurations. Then click on
the desired Restore ... options (see below) and click OK.
43
NOTE
If you wish to permanently delete a saved Configuration, highlight it and
click the DELETE button or press the D key. Click Yes at the Confirm
Delete prompt to immediately and permanently delete the configuration.
Restore ... : The Restore check boxes allow you to restore Instru-
ment, Tray or Sample information from the saved configuration for the
selected instrument.
Click the Restore Instrument Settings check box if you want to restore
all Instrument Settings for the highlighted saved configuration (see
Instrument Settings section in this chapter). Instrument settings apply to
the instrument as a whole.
Click the Restore Tray Settings check box if you want to restore all
tray settings for the highlighted saved configuration. Tray Settings are
common to other CANNON instruments but are not applicable to the
CMR V instrument.
Click the Restore Sample Information check box if you want to restore
all sample ID information for the highlighted saved configuration.
Sample information includes individual sample IDs and actions.
View Instrument window button options:
CANNON
Opens the Instrument V iew window for the selected
instrument and restores any selected configuration
settings.
Closes the View Instrument window.
Updates the Available Instruments list box to include
instruments which may have come on-line since the
software was loaded.
Permanently and immediately deletes the highlighted
instrument configuration (functions only when a configuration is selected).
Accesses context-sensitive help.
®
Mini-Rotary Viscometer CMRV-4500 Instruction & Operation Manual
Version 1.1e—October, 2011 • CANNON
2139 High Tech Road • State College, PA • 16803 • USA
®
Instrument Company
Page 50

44
The Save Instrument option opens the Save Instrument window. The
Save Instrument window permits you to save all current instrument
information for any selected instrument, including Instrument Settings,
Tray Settings and Sample settings, to the database. Once saved, the
instrument information may be restored at any time using the Restore
options from the View Instrument window.
T o use the Save Instrument window, select the desired instrument by
clicking on the instrument name in the Available Instruments list box.
Then enter a name for the configuration in the Save As: field.
NOTE
Security options
If you wish, you may choose to overwrite an existing configuration with
current settings by clicking on the name of the existing configuration in
the Configuration list box. The Configuration name will be transferred to
the Save As: field.
Click OK to store the new configuration. To exit the Save Instrument
window without saving the configuration, click Cancel.
The Poll for Instruments option queries the hardware interface to
establish communications with CANNON® instruments attached to the
host computer.
Use the Poll for Instruments option to establish a computer connection
with instruments which may have come “on line” after the software has
been in operation. When the connection has been verified by the controlling software via the hardware interface, the instrument name will be
added to the status bar at the bottom of the VISCPRO
®
window.
The VISCPRO® application offers a level-based security system with a
log in procedure. This system ensures that available software functions
are appropriate for the security level of the user.
CANNON
Initial security settings will be completed during CMR V installation. Following installation, security options may be accessed and changed from the
VISCPRO® Main menu by individuals who have the manager password.
Each user can be assigned a security level, which is used to determine
permitted operations. Three security levels are defined by the software:
Technician (least privileged), Manager (intermediate privilege), and
Service (maximum privilege–reserved for CANNON® Instrument
Company service personnel).
Users log in when using the software by typing their name and (optional)
password using the Log In window. Dif ferent security levels offer
different CMRV use options. Technicians are permitted to access operational features required for testing samples and performing other routine
®
Mini-Rotary Viscometer CMRV-4500 Instruction & Operation Manual
Version 1.1e—October, 2011 • CANNON
2139 High Tech Road • State College, PA • 16803 • USA
®
Instrument Company
Page 51

Initial security setup
45
operations. Managers may access advanced configuration and reporting
options. The Service level permits access to all instrument and security
parameters.
The VISCPRO® software installation creates a security account for one
manager with a blank password. After VISCPRO® installation, a password should be assigned for the manager using the Change Password
menu option from Main. Managers may add or change accounts for
technician status personnel.
Use the Log In feature to identify the CMRV operator and/or access
security functions.
Procedure
Procedure
NOTE
Once an operator is logged in, that operator’s name is associated with
any sample data obtained during that VISCPRO session. The operator
name may be included in analyses.
1. Click Log In from Main.
2. Select the desired name from the drop-down list box.
3. Type the desired password in the Password field for the individual
selected.
4. Click OK.
Use the Change Password feature to change the current user password.
1. Log in to the VISCPRO® software using the Log In command from
Main.
2. Select Change Password from the Main menu options.
3. Type in the new password in the Password field.
4. Retype the password in the Confirm Your New Password field.
5. Click OK to save the new password and close the Change Pass-
word window.
Procedure
CANNON
Use the Update User Information feature to update the security list of
authorized technicians and managers. User information can only be
updated by an individual logged in with a higher security clearance than
the user for which information is to be altered. Manager status is necessary to change Technician information. Service status is necessary to
change Manager information. T o obtain Service status, it is necessary
to select user CANNON Instrument Company from the Log In window
and to type in the current CANNON® password. For the current password (updated daily), call CANNON® at (814) 353-8000.
1. Click Log In from Main.
®
Mini-Rotary Viscometer CMRV-4500 Instruction & Operation Manual
Version 1.1e—October, 2011 • CANNON
2139 High Tech Road • State College, PA • 16803 • USA
®
Instrument Company
Page 52

46
2. Select your Manager or Service level user name from the User
Name list box. Input the correct password in the appropriate field.
3. Click OK.
4. Click Update User Information from Main.
5. Select the desired user from the User Name list box.
NOTE
To delete a user, just click Remove User after selecting the user name.
The account will be immediately and permanently removed.
6. Enter and verify the desired password, and select user security status
7. Retype the password in the Confirm Password field.
8. Click Add or Update User to save your changes.
9. Click Done to exit the Change User List window.
To use the Log Out feature, click Log Out from Main. The current user
will be logged out of the security list of authorized CAV technicians and
managers. The software will automatically reset to the lowest security
level. Any ongoing test operations will continue.
Print/Print setup options
Select this standard W indows® print option to access the Windows® print
window. Then select print options for the currently-active analysis/report
(see Analysis options).
Select this standard W indows® print option to access the print setup
window. Check your printer driver documentation for additional information on print setup options.
using the appropriate list boxes.
Analyses options
CANNON
Version 1.1e—October, 2011 • CANNON
Select the Exit option to exit the instrument software. Or you may click
on the application title bar .
Data obtained from all instruments during sample testing is stored in the
central VISCPRO® database. To view data, you must create an analysis
configuration requesting the desired sample information in the desired
format. Analysis configurations can be saved and later restored. The
analysis configuration options provide powerful tools for reporting
sample information. Refer to Chapter 13 of the manual for general
information on using the analysis options. For specific information
regarding the individual analysis packages shipped with your software
(e.g., Data Table, Data Export), consult the manual chapter for that
particular analysis.
®
Mini-Rotary Viscometer CMRV-4500 Instruction & Operation Manual
2139 High Tech Road • State College, PA • 16803 • USA
®
Instrument Company
Page 53

47
Each analysis generates a report based on instrument data in the
VISCPRO
software:
Analysis types
Error Data Export, MRV Data Export analyses—configures data
Error Log Table—lists error messages and related data.
MRV Data Table—displays test information.
Analyses menu options
The following VISCPRO® menu options are used to create and manage
analyses:
View Analysis—opens the Choose Analysis window. See View
Report Title—opens the Designate Report Title window. Permits
Configure Analysis—Accesses Configuration options. For informa-
Save Configuration—Opens the Save Configuration window.
®
database. The following analyses are shipped with the
for output to a file, parallel port, or serial port.
Analysis, below, for more details.
data entry of up to three lines of text for the report title.
tion on configuring analyses, consult Chapter 13 and the manual
chapter corresponding to the particular analysis.
Type the desired file name in the Save As: field and click OK to
save the configuration.
NOTE
The Choose Analysis window
NOTE
“Unopened” report
directories identified with
the symbol contain
one or more analysis
packages. Click on the
to reveal or conceal
the list.
The Configure Analysis and Save Analysis options are only available
from the Analyses menu when an analysis window is open.
Select View Analysis to select an analysis from a list of available
analyses or define a new analysis.
To display an analysis, click the View Analysis option from the Analy-
ses menu. The Choose Analysis window will appear. The Choose
Analysis window provides a list of available analyses in a list box on the
left side of the window. The analyses are organized into similar groups
using a directory tree structure.
CANNON
®
Mini-Rotary Viscometer CMRV-4500 Instruction & Operation Manual
Version 1.1e—October, 2011 • CANNON
2139 High Tech Road • State College, PA • 16803 • USA
®
Instrument Company
Page 54

48
Select the desired analysis from the directory tree. After an analysis has
been selected, you can configure the analysis to display the information
you want from the central VISCPRO
®
database. The Choose Analysis
window provides three options for doing this:
NOTE
Window options
Click the appropriate radio button
. Then select the desired saved
configuration (if any) and click OK:
Select Open Selected Analysis Configuration if you wish to
create and display the selected analysis using the saved configuration
highlighted in the list box on the right side of the Choose Analysis
window.
Select View and Open Existing Configuration if you wish to open
the configuration window for the analysis configuration highlighted
in the list box on the right side of the Choose Analysis window.
Select Define and Open New Configuration to open the configura-
tion window using default settings for the selected analysis.
For more information on defining and using configurations, see Chapter
13.
The Window menu provides options for scaling and arranging multiple
windows/icons for screen display. In VISCPRO® you can also save and
restore a specific window configuration.
Select this standard W indows® display option to arrange any minimized
analysis/report or instrument windows at the bottom of the primary
application window .
Select this W indows® display option to resize and regroup all open
windows to view multiple on-screen reports/instruments. You may select
horizontal or vertical tiling for more convenient viewing of data.
Select this standard W indows® display option to resize and regroup all
open windows in an overlapping format which provides more space for
the active window .
Select this security-protected Manager-level function to save the current
VISCPRO® screen configuration, including any currently-open analyses
and Instrument View windows. To restore the saved configuration to the
VISCPRO® display , click Restore W indow Layout (see below).
This function restores the saved VISCPRO® screen configuration. Any
currently-open analysis windows will be closed before the saved configuration is loaded. Also note that currently-open Instrument View windows
may be obscured by the restored configuration. To view these obscured
CANNON
®
Mini-Rotary Viscometer CMRV-4500 Instruction & Operation Manual
Version 1.1e—October, 2011 • CANNON
2139 High Tech Road • State College, PA • 16803 • USA
®
Instrument Company
Page 55

windows, click Window from the VISCPRO® primary display and select the
desired instrument view . Restoring a saved window configuration does not
affect current CMRV sample testing operations.
CMRV module menu options
49
Configure options
In addition to the VISCPRO
®
menu functions, unique software applica-
tion modules for each type of CANNON® instrument generate additional
interface options. The modules determine the characteristics, function
®
and appearance of VISCPRO
software module generates menu choices from the VISCPRO
software menus and windows. The CMRV
®
primary
display . These menu choices (under the Configure and Service headings) access important CMRV configuration and operation options.
The Configure menu provides the user with a powerful tool for description of CMRV instrument capabilities, and for customizing CMRV test
procedures. Once configuration settings have been determined for
optimum performance, the settings can be saved and restored using the
Main menu Save Instrument and View Instrument functions.
Configuration settings will need to be updated when instrument specifications or components change (temperature probes, calibration).
Each of the configuration menus is explained in detail in the following
sections. To access the configuration options, click Configure from the
VISCPRO
®
primary display and select the desired instrument.
Print Instrument and Tray Settings
The Print Instrument and Tray Settings option prints instrument and
tray settings. When you select this option, a standard Print window is
opened. Select the desired print settings and click OK to print out a hard
copy of the instrument settings, including Instrument and Configuration
ID, Model, Serial Number, Firmware Version, Temperature Probe Calibration Data, and Cell Constants at all calibration temperatures. You may
wish to retain the printout for diagnostics, verification and recordkeeping purposes.
Instrument Settings
Select Instrument Settings to open the Instrument Settings window,
which provides features for describing the CMRV and controlling the
instrument. These settings apply to the instrument as a whole.
Use the ID field to input instrument identification information using up to
30 alphanumeric characters.
All other Instrument Settings (Serial Number, Firmware Version, and
Port Setting) are non-editable and derived by VISCPRO
MR V microprocessor .
®
queries to the
CANNON
®
Mini-Rotary Viscometer CMRV-4500 Instruction & Operation Manual
Version 1.1e—October, 2011 • CANNON
2139 High Tech Road • State College, PA • 16803 • USA
®
Instrument Company
Page 56

50
Profile Designer
View Cell Constants
Instrument Settings window button options:
saves the current instrument settings and exits the
Instrument Settings window
.
closes the Instrument Settings window without saving
any configuration changes.
The Profile Designer option opens the Profile Designer window,
enabling selection and editing of temperature profiles. For information
using the Profile Designer and Profile Editor, see Chapter 14, Designing
Customized Profiles.
The View Cell Constants option opens the View Cell Constants
window. You can view current cell constants from this window, and you
can edit them if you are logged in to VISCPRO® as a Manager.
Viewing Cell Constants
Editing Cell Constants
CANNON
The View Cell Constants window
T o view cell constants for a specific temperature, click
temperature field to display the valid calibration temperatures. Then click
the desired temperature to select it. Do the same for the test Mass.
T o edit Cell Constants, follow the instructions below:
1. Log into VISCPRO
®
as a Manager.
2. Open the View Cell Constants window.
3. Select the desired temperature and test mass (see Viewing Cell
Constants, above).
®
Mini-Rotary Viscometer CMRV-4500 Instruction & Operation Manual
Version 1.1e—October, 2011 • CANNON
2139 High Tech Road • State College, PA • 16803 • USA
®
Instrument Company
from the
Page 57

4. Click on the desired cell number (or select it from the drop-down
box).
5. Input the desired value(s) for the calibration(s) and the viscosity of
the calibration standard. Constant 1 represents the most current
calibrated value, and Constant 2 represents the value from the
previous cell calibration). The viscosity of the standard is indicated
on the bottle label.
51
Saving a configuration
Procedure
NOTE
NOTE
If constants are edited with invalid information, data from samples tested
using the constant information will be compromised.
6. Click the Update Data button to transfer Constant and Viscosity
information to the Cell Constants list box.
7. Repeat steps 4-6 for other desired cells. Then click the Save button
to save the updated constant information to the current instrument
configuration and exit the View Cell Constants window.
If you do not click the SAVE button, updated data will not be saved.
Whenever you have altered an instrument configuration, you may wish to
save the resulting settings as a new or existing configuration. To save
current settings, use the Save Instrument option:
1. From the VISCPRO® primary menu options, select Main.
2. Click on Save Instrument. The Save Instrument window will appear.
3. Select an instrument to apply the current Instrument Configuration
settings to.
4. Type a name for the new configuration in the Save As: box. Or click
to select an existing configuration name from the configuration list
box.
5. Click OK to save the configuration. Or click Cancel to exit the
Save Instrument window without saving your changes.
Restoring instrument settings from a saved configuration
There are three options for restoring instrument settings from a saved
configuration. These restore options are individually selectable from the
View Instrument window.
NOTE
CANNON
The Restore Instrument Settings and Restore Tray Settings options are
only available if you are logged in as a manager.
®
Mini-Rotary Viscometer CMRV-4500 Instruction & Operation Manual
Version 1.1e—October, 2011 • CANNON
2139 High Tech Road • State College, PA • 16803 • USA
®
Instrument Company
Page 58

52
Restore procedure
NOTE
T o restore instrument settings from a saved configuration:
1. Click on View Instrument from the Main menu options.
2. Select the desired instrument from the left list box.
3. Select the desired saved configuration from the right list box.
4. Use the check boxes to select the desired configuration elements to
be restored.
Restore Instrument Settings restores instrument properties from
the saved configuration.
Restore Tray Settings is not applicable to the CMRV instrument.
Restore Sample Information restores all sample ID setup informa-
tion for the Instrument View window from the saved configuration.
5. Click OK. If you clicked the check box to restore instrument, tray or
sample settings, the current instrument will be updated with the
selected settings.
If you have updated the settings, you may wish to save the current
instrument/tray/sample configuration by selecting Save Instrument from
the Main menu, inputting the configuration name in the Save As: text
box, and clicking OK.
Calibrate Cell Constants
The Calibrate Cell Constants option from the Service menu initiates a
software-guided cell calibration procedure. For detailed information on
calibrating the CMRV cells, see Chapter 8.
The Calibration Parameters window
The Calibration Parameters window options are described briefly
below:
CANNON
®
Mini-Rotary Viscometer CMRV-4500 Instruction & Operation Manual
Version 1.1e—October, 2011 • CANNON
2139 High Tech Road • State College, PA • 16803 • USA
®
Instrument Company
Page 59

Temperature: Click to select the desired temperature for calibration.
53
Mass: Click
to select the desired test mass for calibration.
Known Viscosity: Enter the known viscosity of the standard, as printed
on the standard bottle label.
Calibrate ... : After you have entered the calibration data described
above, click the Calibrate ... button to access the CMRV Cell Calibration
window.
The Calibrate Cell Constants window
Reset Constants to Original: Click the Reset Constants to
Original button to restore constants to the last saved values.
Abort Temperature Control: Click the Abort Temperature Control
button to abort CMRV temperature control. The calibration procedure
will be halted.
Abort Calibration: Click the Abort Calibration button to abort CMRV
calibration. The individual cell calibration will be halted if the S tart Test
button on the CMRV instrument has not yet been pressed.
Save Data: Click the Save Data button to save the current cell con-
stants to the current instrument configuration.
CANNON
®
Mini-Rotary Viscometer CMRV-4500 Instruction & Operation Manual
Version 1.1e—October, 2011 • CANNON
2139 High Tech Road • State College, PA • 16803 • USA
®
Instrument Company
Page 60

54
Service menu options
MRV Monitor
Cleaning Service
Temperature Probe Calib.
T o access the service options, click Service from the VISCPRO
®
pri-
mary display and select the desired instrument.
The MRV Monitor window permits the user to view current operational
values for the CMRV instrument. These settings may be helpful to
®
CANNON
technical personnel when troubleshooting difficulties with
the CMR V.
Select Cleaning Service to open the Cleaning Service window . Then
Click the Start Cleaning button to initiate an instrument heating cycle
(50°C). The current instrument temperature and instrument status will be
displayed in the window . Click the Stop Cleaning Service button when
cleaning is completed.
The Temperature Probe Calibration window provides a software
interface for calibrating the CMRV block temperature probe. Consult
Chapter 7 of the CMRV Instruction & Operation Manual for details
regarding the software-driven probe calibration procedure.
CANNON
®
Mini-Rotary Viscometer CMRV-4500 Instruction & Operation Manual
Version 1.1e—October, 2011 • CANNON
2139 High Tech Road • State College, PA • 16803 • USA
®
Instrument Company
Page 61

CHAPTER
55
10
ASTM D 3829 method
ASTM D 4684 method
SUMMARY OF TEST PROCEDURE
In the ASTM D 3829, ASTM D 4684 and ASTM D 6821 test methods, a
10-ml sample is placed in a test cell, pre-heated to a specified temperature, and held at that temperature for a specified time to ensure complete
solution of all components of the oil. The temperature of the cell is then
lowered to the test temperature at a programmed cooling rate. The test
temperature and the cooling program (profile) are determined by the
nature of the sample being tested and by the test method being used.
ASTM D 3829 uses slow cooling followed by a soak period at the test
temperature and requires about 19 hours for completion of the entire test.
The test is designed for engine oils.
ASTM D 4684 uses much slower cooling and requires between 45 and
54 hours for completion of the test. (The D 4684 temperature cycle is
sometimes referred to as the TP-1 cycle.) The test is designed for engine
oils.
ASTM D 6821 method
ASTM D 6896 method
NOTE CANNON may provide copies of a relevant ASTM Method with your CMRV
ASTM D 6821 uses slow cooling and requires about 18 hours for
completion of the test.The test is designed for drive line lubricants.
ASTM D 6896 uses slow cooling and requires between 43 and 45 hours
for completion of the test. This test method covers the measurement of
the yield stress and viscosity of used diesel oils.
instrument purchase. The ASTM D 6821 method is currently provided with
any order for the special drive line rotors available for the MRV. Additional
reprints of the ASTM test methods may be purchased from:
ASTM
100 Barr Harbor Drive
West Conshohocken, PA 19428
The CMRV-4500 determines the yield stress and apparent viscosity of the
sample by measuring the rotational speed of a cylindrical rotor immersed
in the sample in the test cell. For ASTM D 3829, yield stress is measured
by adding 10-gram disks successively until discernible rotation occurs.
Apparent viscosity is then determined by measuring the angular velocity
of the rotor when a 150-gram weight is applied.
ASTM D 4684 method
CANNON
ASTM Method D 4684 describes the procedure for measuring yield
stress and apparent viscosity . Yield stress is an indication of a structure
that has formed within the oil under the cooling conditions of the test.
®
Mini-Rotary Viscometer CMRV-4500 Instruction & Operation Manual
Version 1.1e—October, 2011 • CANNON
2139 High Tech Road • State College, PA • 16803 • USA
®
Instrument Company
Page 62

56
NOTE
Most commercial oils do not have a yield stress when tested as specified
by the SAE J300 Viscosity Classification.
For the complete, definitive description of the ASTM D 4684 method,
see the provided
and Apparent Viscosity of Engine Oils at Low Temperature, Designation:
D 4684, also available in the Annual Book of ASTM Standards, Volume
05.03.
NOTE
Nothing in this manual is intended to supersede the provisions of the
ASTM test method.
The cooling cycles used in the ASTM D 4684 test method are sometimes
referred to as the TP-1 cycles. For details, see ASTM D 4684 and
Henderson, K. O., Manning, R. E., May , C. J., and Rhodes, R. B., “New
Mini-Rotary V iscometer Temperature Profiles That Predict Engine Oil
Pumpability ,” SAE Paper No. 850443.
Required test time
The ASTM D 4684 temperature program (profile) requires 45 to 54 hours
to complete, depending on the final test temperature. Additional time is
required to perform yield stress and apparent viscosity measurements.
ASTM D 3829 method
Standard Test Method for Determination of Yield Stress
For the complete, definitive description of this method, see the provided
Standard Test Method for Predicting the Borderline Pumping Temperature of Engine Oil, Designation: D 3829, also available in the Annual
Book of ASTM Standards, Section 5, Volume 05.03.
NOTE
Nothing in this manual is intended to supersede the provisions of the
ASTM test method.
ASTM Method D 3829 offers the option of reporting that the BPT
(borderline pumping temperature) is below a certain temperature. The
temperature control profiles for the CMRV-4500 are designed to run the
test at the limiting BPT for each viscosity grade. Thus, viscosity or yield
stress values must be below the critical values for an oil to be acceptable.
The temperature profile for this method consists of a 2-hour soak at 80°C
± 3°C, a 10-hour nonlinear cool-down to the test temperature, and a 6hour soak at the test temperature. The entire temperature profile, up to the
point of measuring yield stress and viscosity , requires about 18.5 hours.
ASTM D 6821 method
For the complete, definitive description of this method, see the provided
Standard Test Method for Low Temperature Viscosity of Drive Line
Lubricants in a Constant Shear Stress Viscometer, Designation: D 6821.
NOTE
CANNON
Nothing in this manual is intended to supersede the provisions of the
ASTM test method.
®
Mini-Rotary Viscometer CMRV-4500 Instruction & Operation Manual
Version 1.1e—October, 2011 • CANNON
2139 High Tech Road • State College, PA • 16803 • USA
®
Instrument Company
Page 63

The temperature profile for this method consists of a 1.5-hour soak at
50°C ± 1°C, a 2-hour nonlinear cool-down to the test temperature, and a
14-hour soak ± 0.02°C at the test temperature. The entire temperature
profile, up to the point of measuring yield stress and viscosity , requires
17.5 hours.
ASTM D 6896 method
For the complete, definitive description of this method, obtain a copy of
the Standard Test Method for the Determination of Yield S tress and
Apparent Viscosity of Used Engine Oils at Low Temperature, Designation ASTM D 6896.
This test method covers the measurement of the yield stress and viscosity
of used diesel oils after cooling at controlled rates over a period of 43 or
45 hours to a final test temperature of -20 or -25°C. The viscosity measurements are made at a shear stress of 525 Pa over a shear rate of 0.4 to
15 s-1. This method is suitable for measurement of viscosities ranging
from 4,000 mPa-s to 400,000 mPa-s, and is suitable for yield stress
measurements of 7 Pa to >350 Pa. The Method is quite similar to ASTM
D 4684 except that the preheat phase is accomplished in an oven (not
provided with the CMRV) immediately prior to commencing the temperature profile.
57
SAE J300 notes
SAE Standard SAE J300, Engine Oil Viscosity Classification temperatures, specified according to the viscosity grade, are as follows:
SAE Viscosity Grade Low-Temperature Pumping Viscosity
Source: SAE J300 Revised DEC99
NOTE The user of the CMRV-4500 is advised to be alert for revisions of the
SAE J300 Viscosity Classification.
Delayed start option
Because of the length of the profile, the starting time should be chosen so
that the test temperature will be reached at a convenient time for testing.
The delayed start option is quite useful for starting the cooling cycle over
a weekend or holiday in preparation for running samples on the following business day. For details, see Chapter 10.
(cP Max With No Yield Stress)
0W 60,000 at -40°C
5W 60,000 at -35°C
10W 60,000 at -30°C
15W 60,000 at -25°C
20W 60,000 at -20°C
25W 60,000 at -15°C
CANNON
®
Mini-Rotary Viscometer CMRV-4500 Instruction & Operation Manual
Version 1.1e—October, 2011 • CANNON
2139 High Tech Road • State College, PA • 16803 • USA
®
Instrument Company
Page 64

58
This page intentionally left blank.
CANNON
®
Mini-Rotary Viscometer CMRV-4500 Instruction & Operation Manual
Version 1.1e—October, 2011 • CANNON
®
Instrument Company
2139 High Tech Road • State College, PA • 16803 • USA
Page 65

CHAPTER
59
11
NOTE
Test preparation
Procedure
NOTE
RUNNING PROFILES
The guidelines in this section are not intended to supercede any test
method. Always refer to the method for validation of any test procedure.
T o run a temperature profile, first prepare the CMRV -4500 for testing
(see Chapter 6). Make sure that the Air/Water Heat Exchanger POWER
switch is on and that the unit is operating normally .
1. Place 10 ml of test oil in each of the viscometric cells to be used. Any
number of cells, one to nine, may be used but all test oils for the run
must be for the same test temperature. Use a syringe or small plastic
cup to fill the cells.
If testing with fewer than nine cells, fill unused cells with 10 ml of a clean
oil prior to running the test.
2. Load the VISCPRO® software and click Main/View Instrument.
Select the desired instrument type (MRV) and configuration from the
View Instrument window. Then click OK.
NOTE
CAUTION
3. Record the sample ID for the first calibrated MRV cell by clicking in
the Sample ID field and typing the sample name. Then press the Tab
key to move the cursor to the next Sample ID field (or just click in
the desired ID field). Repeat the process until ID information has
been entered for all test samples.
4. (optional) Save your MRV instrument configuration by clicking
Main/Save Instrument. Select your instrument type (MRV) and
enter a name for the configuration in the Save As: field. Then click
OK to save the configuration.
You may change the Sample ID at any time prior to initiating the Yield
Stress or Viscosity tests. If you change the sample information, you may
wish to save the configuration (see step 4, above) before closing the
Instrument View window or your changes may be lost.
5. Carefully insert the rotors into their corresponding test cells, making
sure that the rotor tip at the bottom of the shaft slides into the recess
at the bottom of the cup.
Do not drop the rotors into place or you may damage the rotor tips.
6. Secure each rotor in position with a rotor bearing pin.
CANNON
®
Mini-Rotary Viscometer CMRV-4500 Instruction & Operation Manual
Version 1.1e—October, 2011 • CANNON
2139 High Tech Road • State College, PA • 16803 • USA
®
Instrument Company
Page 66

60
Winding rotors
7. To wind the rotors in preparation for the profile, slide the pulleywheel assembly along the track until the pulley is aligned with the
first viscometric cell. Use the engraved lines on the slide bar as a
guide to determine the proper position of the left side of the pulleywheel block.
8. Place the loop of a thread over the left end of the crossbar at the top
of the rotor shaft.
9. Pass the free end of the thread (the end with the plastic ring) over the
pulley-wheel and allow it to hang freely in front of the viscometer.
While holding the rotor motionless, hook a light weight, such as a
large paper clip, on the plastic ring to apply slight tension to the
thread.
10. Guiding the thread with your finger, turn the rotor clockwise to wind
the thread above the crossbar until the knot in the loop has been
wound around the rotor shaft. Then pass the thread below the crossbar and continue turning the rotor clockwise (as viewed from above)
to wind 20 closely spaced turns of thread around the shaft below the
crossbar without overlapping the turns. About 200 mm (8 inches) of
thread will remain. Place this remaining length of thread over the
upper bearing support plate so it hangs to the rear of the viscometer
and secure the rotor in place by lowering the rotor locking pin over
the rotor crossbar. You may need to turn the rotor slightly to align the
crossbar with the locking pin.
Plexiglas
®
cover placement
CAUTION
11. Repeat steps 8-10 for each of the remaining rotors/cells.
12. Place the Plexiglas
®
cover in position over
the top of the viscometric cells (see
photo). The small
hole which allows the
-46 to 30°C thermometer to extend through
the cover should be
on the left when
viewed from the front
of the viscometer.
CMRV 4500 with rotors wound and
Plexiglas® cover in place.
If a thermometer is not in place during CMRV-4500 testing, you should
seal the thermometer opening in the Plexiglas® cover, particularly when
the humidity of the ambient air is high. Otherwise, moisture may condense and freeze on the top of the block.
13. CMRV users following the ASTM D 4684 or ASTM D 3829 methodology should insert a flexible 3/16"-OD tube from their dry gas
supply and regulator through the dry gas purge in the Plexiglas
®
CANNON
®
Mini-Rotary Viscometer CMRV-4500 Instruction & Operation Manual
Version 1.1e—October, 2011 • CANNON
2139 High Tech Road • State College, PA • 16803 • USA
®
Instrument Company
Page 67

Starting a profile
cover (Step 9.2.6 in the ASTM D 4684-98 method and step 9.1.6 in
the ASTM D 3829 method). The tubing may be removed, along with
the cover, prior to viscosity/yield stress testing.
14. Whatever the methodology, the pur ge should continue throughout the
temperature profile using dry gas at a flow rate
between 20 and 30
milliliters per minute.
1. If the View Instrument window is not open, click Main/View
Instrument and select the desired instrument type (MRV) and
configuration from the View Instrument window . Then click OK.
61
Polling instruments
NOTES
If you are unable to select your CMRV from the list of available instruments in the View Instrument window, make sure the instrument is
turned on and warmed up (see Chapter 6); then select Poll for Instruments from the Main menu.
2. From the MRV Instrument View window, click the Upload Profile
button to open the Upload Profile window .
3. Select a Standard or User-Defined profile from the available
profiles in the drop-down box, then click OK.
To run samples using -20°C or -25°C calibration data per ASTM specifications, ensure that the correct profile is selected from the ASTM Standard Profile laboratory. Standard Profiles with only one temperature
indicated are run using calibration data obtained at -20°C. For profiles
with two temperatures indicated, the first temperature refers to the final
test temperature for the profile and the second refers to the desired
calibration temperature for that profile.
(-10°C profile using -20°C calibration data)
You will not be able to select and run ASTM profiles in cells for which
calibration data is unavailable at the specified temperature. The ASTM
profiles will not appear in the drop-down list until the number of calibrations required by the method are performed.
NOTE
CANNON
4. Click the Run Profile button to open the Run Profile window. The
on-board CMRV microprocessor will control the temperature until
the profile has been completed. A computer connection is no longer
required until it is time to initiate viscosity/yield stress testing.
5. Select the desired End Time for the profile (this is the time you
would like to start testing) and click OK. The Start Test button will
begin blinking to indicate that profile timing has begun. The profile
will be initiated at the appropriate time.
The default End Time is the time that the temperature profile would be
completed if the profile is started immediately.
®
Mini-Rotary Viscometer CMRV-4500 Instruction & Operation Manual
Version 1.1e—October, 2011 • CANNON
2139 High Tech Road • State College, PA • 16803 • USA
®
Instrument Company
Page 68

62
5. At the conclusion of the temperature profile you are ready to test
samples. See Chapter 11 for the test procedure.
Profile operation notes
Instrument Status window
Removing thermometer
During the profile, the Instrument View window will display the current
status of the profile, the current test temperature, the desired temperature,
time elapsed, and the time remaining until the yield stress and viscosity
tests should be run. Display data is normally updated every 0.5 seconds.
The following status options are available:
RED–Fatal Instrument Fault (unlikely); Instrument stops responding to
queries for more than 60 seconds (or 385 seconds during a Viscosity
Test)
YELLOW–Instrument Warmup (displayed for 45 minutes after turning
on instrument). During this time, instrument calibration cannot be
performed. A test can be run on a calibrated instrument only if the
“Ignore Instrument Warmup” box is checked in the instrument view.
GREEN–Normal Instrument Operation
T o reduce the chance of separating the mercury column, you may wish to
remove the calibrated thermometer from the CMRV unit prior to running
a cooling profile. Store the thermometer in a vertical position. You may
replace the calibrated thermometer when the CMR V has cooled to 30°C or
lower. If the thermometer is not in place during CMRV -4500 cooling, you
should seal the thermometer hole in the Plexiglas® cover, particularly when
the humidity of the ambient air is high. Otherwise, moisture may condense
on the top of the block.
Verifying temperature
Tolerance problems
Completing CMRV tests
NOTES
When the profile has concluded, verify the temperature reading and then
measure the yield stress and viscosity .
If the CMRV instrument fails to maintain temperatures within required
tolerances during the profile, the MRVW software will display a warning.
The profile will be completed, but displays and printouts of CMRV data
will indicate that the profile was out of tolerance.
Viscosity and yield stress tests should be completed shortly after the
completion of the profile.
ASTM D 4684 requires completion of yield stress and viscosity tests
within 30 minutes of the conclusion of the profile.
If, at the conclusion of a test, the block temperature is more than 0.2°C
cooler or warmer than the specified test temperature then the test may
not conform to ASTM D 4684 or ASTM D 3829 requirements. Consult
the appropriate ASTM method for additional information. If the test is out
of tolerance the temperature probe may have to be recalibrated and the
test rerun to obtain reliable readings for the desired temperature. Yield
stress and viscosity tests may still be performed for the samples, but the
calculated values will be indicative of the actual temperature at the end
of the profile, not the desired temperature.
CANNON
®
Mini-Rotary Viscometer CMRV-4500 Instruction & Operation Manual
Version 1.1e—October, 2011 • CANNON
2139 High Tech Road • State College, PA • 16803 • USA
®
Instrument Company
Page 69

Adjusting temperature at the end of a profile
In the event that the CMRV instrument fails to attain the desired temperature at the conclusion of a profile, it is possible to adjust the instrument
temperature using the following procedure:
1. Wait until the profie is completed and the Temperature Correction
button is active.
2. Click in the Thermometer Temperature field and type the current
temperature (as indicated by your calibrated thermometer) to the
nearest 0.1°C in the Thermometer Temperature field. Make certain
to use the minus (-) sign for subzero temperatures.
3. Click the Temperature Correction button to enter the temperature
reading.
63
NOTE
If you input a temperature but do not click the Correction button, the input
temperature value will be stored in the database as the actual temperature for the test.
4. Wait for the instrument to stabilize at the new temperature for the
desired time period.
5. Continue with the Y ield S tress and Viscosity test procedures.
NOTES
The Temperature Correction button option is only active at the conclusion of the temperature profile and prior to yield Stress or Viscosity
testing.
If the amount of the Final Temperature adjustment is greater than the
tolerances specified in the profile, the temperature probe and CMRV
cells should be recalibrated per the manual procedure.
If you do not enter a Thermometer Temperature, the final profile temperature will be recorded as the actual temperature for the test(s).
Displaying a profile graph
Graphing the current profile
T o view a graph displaying time/temperature data from the current profile
during CMRV testing, click the View Running Profile button from the
Instrument View window to view updated data from the current test in
graph format (X axis = time; Y axis = CMRV sample temperature). The
graph information is updated approximately every 10 minutes.
Graphing earlier profile data
Mouse-over display features
CANNON
Version 1.1e—October, 2011 • CANNON
T o view a graph of time/temperature data from a previous test (viscosity
or yield stress), just configure an analysis for the data (see chapters on
Analyses) and right-click anywhere inside the data window for the
analysis. Then click the Display Temperature Graph popup menu
option.
After you have displayed the profile graph, you can move the mouse
cursor over any portion of the graph and the status bar at the bottom of
the Profile Graph window will dispay the Time, Actual Temperature
and Target Temperature values for that point in the profile.
®
Mini-Rotary Viscometer CMRV-4500 Instruction & Operation Manual
2139 High Tech Road • State College, PA • 16803 • USA
®
Instrument Company
Page 70

64
Zooming in
T o view a section of the profile graph in greater detail, click and drag
(press and hold down the left mouse button) the cursor to "draw" a box
around the desired graph area. Then release the mouse button. The graph
will be redrawn to include only the selected area.
Zooming out
Refreshing the graph
T o reduce the graph magnification, click the
If you are displaying the profile graph while a temperature profile is
running, you may not be viewing the most current temperature data. To
ensure that the graph includes the latest information from the CMRV
microprocessor, click the Profile Graph window Refresh Graph
icon.
Printing a profile graph
To print the profile graph:
1. Display the graph window (see above).
2. Click the Profile Graph window Print
3. Follow Windows
Consult your Windows® manual for more information.
icon.
icon.
®
conventions for printer selection and printing.
Exporting time/temperature profile data
T o export time/temperature data from the current profile:
1. Configure an analysis for the data (see chapters on Analyses) and
right-click anywhere inside the data window for the analysis.
2. Then click the Export Time Temp Data popup menu option. The
Save As ... window will open.
3. Input the file name and select the desired directory for the data file.
Then click OK.
You may import the file data into your word processor or spreadsheet per
the import instructions provided with your application. This data provides a minute-by-minute temperature record of the profile in the following format:
XXXX [tab] YYYY [tab] ZZZZ [carriage return]
where X = time in the profile (minutes)
Y = actual temperature as recorded by the CMRV probe (°C)
Z = target temperature required by the cooling profile (°C)
Exporting archived profile data
T o export time/temperature data from a previous test (viscosity or yield
stress), just configure an analysis for the data (see chapters on Analyses)
and right-click anywhere inside the data window for the analysis. Then
click the Export Time Temp Data popup menu option.
CANNON
®
Mini-Rotary Viscometer CMRV-4500 Instruction & Operation Manual
Version 1.1e—October, 2011 • CANNON
2139 High Tech Road • State College, PA • 16803 • USA
®
Instrument Company
Page 71

CHAPTER
65
12
NOTE
NOTE
MEASURING YIELD STRESS
AND VISCOSITY
The guidelines in this section are not intended to supercede any test
method. Always refer to the method for validation of any test procedure.
Yield S tress and V iscosity testing should take place shortly after the
profile is completed.
ASTM D 4684 requires completion of yield stress and viscosity tests
within 30 minutes of the conclusion of the profile.
When the CMRV-4500 has reached the final test temperature, the Instrument View window will display the Ready for Test/Instrument Ready
status.
The
will also be enabled.
(yield stress) and (viscosity) icons for each sample
NOTE
The yield stress test must be completed BEFORE testing for viscosity.
T o view test results as they are recorded in the VISCPRO database, open
and/or configure the appropriate analysis (see the next chapter on Analyses
for more information) prior to beginning the tests.
Measuring yield stress
Procedure
1. Remove the Plexiglas
2. Slide the pulley-wheel assembly along the track until the pulley is
aligned with the left side of the shaft of the appropriate rotor. Use the
engraved lines on the slide track to determine the proper position of
pulley wheel block relative to the rotor.
3. Make sure that the pulley-wheel sensor wire is placed in a position to
prevent its interference with the falling hook-cage/weight during
yield stress/viscosity testing.
4. Place the rotor thread over the pulley-wheel with the plastic disk
hanging in front of the viscometer block and over the edge of the
table.
5. Hang the hook-cage on the ring at the end of the thread.
®
cover from the CMRV-4500 unit.
NOTE
CANNON
®
Mini-Rotary Viscometer CMRV-4500 Instruction & Operation Manual
Version 1.1e—October, 2011 • CANNON
2139 High Tech Road • State College, PA • 16803 • USA
®
Instrument Company
Page 72

66
ASTM D 3829 and 4684 specify an initial weight of 10-grams, and increase
of weight in 10-gram increments. ASTM D 6821 specifies an initial weight
of 2.5 grams and increase of weight in 2.5-gram increments.
6. Ensure that a Sample ID has been entered for each sample. Then
click
for the desired sample. OR use the Tab key to highlight
the yield stress icon and then press R. The Yield LED (lightemitting diode) on the CMRV-4500 will glow and the Start Test
button will begin flashing rapidly.
7. Press the flashing Start Test button on the CMRV front panel and
proceed immediately to step 8.
8. Slide the rotor locking pin
upward to its detent position,
allowing the weight/hookcage to hang free. The Yield
LED will flash as the CMRV
microprocessor measures the
wheel rotation (See Notes on
yield testing on the next page
regarding the ASTM D 4684
method). If no yield stress is
observed (sufficient rotation),
the blinking Yield Stress light
on the instrument front panel
will turn off. If it does,
conclude the test by lowering
the locking pin to prevent the
rotor from further rotation.
Adding a 10-gram weight to the
hook-cage during yield stress test
NOTES
CAUTION
CANNON
9. (Optional) If there is insufficient movement of the rotor during the
15-second sampling period, follow the screen prompts to add weight
to the hook-cage per ASTM methodology (see photo). The CMRV4500 will calculate the range for the yield stress value. If there has
not been adequate movement of the rotor by the time the weight load
reaches 100 grams, the MRVW software will calculate a minimum
value in Pascals for yield stress.
When adding weights to the hook-cage, support the hook cage with one
hand while keeping some tension on the thread. When releasing the
hook cage use a smooth downward motion of the hand to prevent the
hook-cage from swinging back and forth and to avoid jarring the rotor.
To view test results as soon as they have been recorded in the database, open an MRV Data Table analysis with the Use Dynamic Update
option (see Chapter 13).
Make sure to wait for the CMRV software prompts before adding additional weights.
®
Mini-Rotary Viscometer CMRV-4500 Instruction & Operation Manual
Version 1.1e—October, 2011 • CANNON
2139 High Tech Road • State College, PA • 16803 • USA
®
Instrument Company
Page 73

10. If testing viscosity for the sample, follow the directions for viscosity
testing (see Measuring Apparent V iscosity, next page).
11. Repeat steps 1-10 to perform yield stress/viscosity tests for all
remaining cells to be tested in order from left to right.
Notes on yield stress testing
Step 9 (see previous section) is required for ASTM D 3829.
The ASTM D 4684 method is a pass-fail method for fresh oils. If the
rotor fails to move with the weight of the 10-gram hook-cage, the oil
has failed the test. However, the MRVW program permits adding of
additional weights. If this alternate method is preferred, continue with
the procedure as described in step 9. Otherwise, click the Abort Test
button to abort yield stress testing on that cell.
67
NOTE
Do not abort CMRV temperature control until you have finished all yield
stress and viscosity tests for the cells.
Pulley-wheel motion is detected by the digital-optical sensor. Ad-
equate rotor movement is defined as 13° of rotation for ASTM D
4684 and ASTM D 6821 (This is equivalent to 3 mm of motion by
the crossarm). For ASTM D 3829, 10° of rotation is required.
If yield stress testing on a cell is aborted before adequate rotor
movement is detected, the resultant calculated yield stress will be
based on the highest weight used. For example, if the operator aborts
a yield stress calculation after testing with a total of 30 grams with no
rotor movement, the CMRV software will report yield stress greater
than 105 Pascals (Y>105).
Measuring apparent viscosity
After the yield stress test has concluded, you may measure apparent
viscosity using the procedure below:
1. Place the pulley-wheel in line with the appropriate viscometric cell
and place the rotor thread over the pulley-wheel.
NOTE
CANNON
ASTM methodology requires testing the samples in sequence from left to
right.
2. Ensure that a Sample ID has been entered for each sample. Then
click
for the desired sample. OR use the Tab key to highlight
the desired viscosity test icon and then press R. The Viscosity
LED (light-emitting diode) on the CMRV-4500 will glow and the
Start Test button will begin flashing rapidly.
3. Carefully place the large hook-weight on the end of the thread (see
photo, next page), supporting the weight with your hand to prevent
rotation of the rotor.
®
Mini-Rotary Viscometer CMRV-4500 Instruction & Operation Manual
Version 1.1e—October, 2011 • CANNON
2139 High Tech Road • State College, PA • 16803 • USA
®
Instrument Company
Page 74

68
5. Press the flashing Start Test button and proceed immediately to step 6.
6. Lift the locking pin and release the weight by lowering your hand
quickly and smoothly.
The CMRV-4500 will
measure the speed of rotor
rotation by timing the
revolution(s) of the pulleywheel as the weight falls.
NOTE
NOTE
CAUTION
The total number of rotations
measured by the CMRV-4500
during the viscosity test depends
on the viscosity of the sample
and the values chosen in the
Advanced Settings box. Default
values for the Advanced Settings
correspond to the specifications
of the ASTM method selected for
the profile.
7. When the Viscosity LED on
the CMRV front panel stops
flashing, indicating the
conclusion of the viscosity
test, remove the hook-weight
Placing the large hook-weight in
preparation for the test.
from the string.
Do not remove the weight while the Viscosity LED is still flashing.
To view test results as soon as they have been recorded in the database, open an MRV Data Table analysis with the Use Dynamic Update
option (see Chapter 13).
8. To test additional cells, repeat steps 1-7 above, testing in order from
left to right.
After all viscosity tests have been concluded, select End Profile from the
Instrument View window to terminate temperature control of the CMRV.
NOTE
No further testing can be conducted after temperature control has been
aborted.
Notes on viscosity testing
Do not let the large hook-weight swing back and forth during testing or
the apparent viscosity measurement may be distorted.
Viscosity data
CANNON
The computer determines the apparent viscosity , along with the time
required for rotation of the rotor. Time and temperature data for the test is
recorded in the associated .ttd file.
®
Mini-Rotary Viscometer CMRV-4500 Instruction & Operation Manual
Version 1.1e—October, 2011 • CANNON
2139 High Tech Road • State College, PA • 16803 • USA
®
Instrument Company
Page 75

69
Notes on ASTM methods
The protocols for measuring viscosity differ considerably between the
ASTM methods. For further information on the methodology used to
measure viscosity , consult the applicable ASTM method.
Printing yield stress/viscosity test results
T o print the CMRV data form, including viscosity and yield stress test
results:
1. Open and/or configure the appropriate analysis.
2. Use the mouse to highlight the desired data.
3. Click Print from the Main menu options.
4. Follow Windows
Consult your Windows
®
conventions for printer selection and printing.
®
manual for more information.
Exporting yield stress/viscosity data
T o export yield stress and viscosity test data to an ASCII tab-delineated
file, create an MRV Export Analysis (see chapters 13 and 17).
Temperature/time data
T o export time/temperature data from the associated .ttd file for the
profile, see Exporting Time/Temperature Profile Data in Chapter 13.
CANNON
®
Mini-Rotary Viscometer CMRV-4500 Instruction & Operation Manual
Version 1.1e—October, 2011 • CANNON
2139 High Tech Road • State College, PA • 16803 • USA
®
Instrument Company
Page 76

70
This page intentionally left blank.
CANNON
®
Mini-Rotary Viscometer CMRV-4500 Instruction & Operation Manual
Version 1.1e—October, 2011 • CANNON
®
Instrument Company
2139 High Tech Road • State College, PA • 16803 • USA
Page 77

CHAPTER
71
13
Data obtained from all instruments during sample testing is stored in the
central VISCPRO
configuration requesting the desired sample information in the desired
format. Analysis configurations can be saved and later restored. The
analysis configuration options provide powerful tools for reporting
sample information. Analyses may be displayed on the computer screen,
printed, or output via the computer RS-232 port.
Creating an analysis
1. Click Analyses from the VISCPRO® primary menu options.
2. Click View Analysis ... from the Analyses menu options. The
ANALYSIS CONFIGURATION
OPTIONS
®
database. To view data, you must create an analysis
Choose Analysis window will appear.
3. Highlight the desired analysis from the list of available analyses.
NOTE Use the directory tree structure to browse the report options. Click on
the or icons to reveal/hide analyses.
CANNON
®
Mini-Rotary Viscometer CMRV-4500 Instruction & Operation Manual
Version 1.1e—October, 2011 • CANNON
2139 High Tech Road • State College, PA • 16803 • USA
®
Instrument Company
Page 78

72
4. Click on the radio button corresponding to the desired analysis
action:
The Open selected Analysis option will open the selected analysis
without providing an opportunity for modification of the analysis.
The View and Open Existing Configuration option will permit the
user to view/modify an existing analysis (see notes and procedure
following).
The Define New Analysis option will create a new analysis (see
notes and procedure following).
NOTES
If no analyses have been created, none will appear in the text box on the
right side of the window, and only the Define New Analysis option will be
available. If you have already configured and saved an analysis, its
name will appear in the list box. If you select an existing configuration
and click OK, the analysis will be performed using the current configuration settings. It will not be necessary to complete the remaining steps in
this procedure.
5. Click OK. If the Open Selected Analysis option was selected, the
analysis will be immediately displayed. If the View and Open
Existing Configuration or Define New Analysis options were
selected, the Analysis Configuration window will appear. The
Analysis Configuration window consists of tabbed pages with filter
options appropriate for the analysis.
6. Click on the tab corresponding to the filter you wish to set and
complete the configuration options. For further information on
selecting filter options, see the following sections of this chapter, as
well as the chapter corresponding to the specific analysis.
7. When you have completed the configuration, click OK. The program
will prompt you to save the configuration.
8. Click Yes to save the configuration. The Save Configuration
window will appear. Type the name of the new configuration in the
Save As: field.
NOTES
CANNON
Or click the name of a preexisting configuration in the Existing
Configurations list box (If you select this option, you will replace
the existing configuration with the new configuration settings).
9. Click OK. The analysis will be performed and displayed using the
selected configuration settings.
You may click Cancel from the Save Configuration window to exit without
saving configuration changes.
You may display several analyses simultaneously by repeating the
instructions above. Use the tiling options available from the Window
menu to display multiple analyses in the desired window format (horizontal, vertical or cascade view options are available).
®
Mini-Rotary Viscometer CMRV-4500 Instruction & Operation Manual
Version 1.1e—October, 2011 • CANNON
2139 High Tech Road • State College, PA • 16803 • USA
®
Instrument Company
Page 79

Sorting analysis data
After you have displayed an analysis, you may sort alphanumerically by
any of the table headings (the default sort for most reports is Time
Stamp). To sort, simply click on the desired column heading. The table
will be displayed with the new sort order.
73
NOTE
The Sort function is only available for an analysis when the Dynamic
Update mode option is NOT selected. To restore sort functionality for an
analysis, reconfigure the analysis by clicking Configure Analysis from the
Analyses menu. Then access the Date filter options for the analysis and
click the Use Fixed Date and Time radio button
parameters and click OK to create the new analysis.
Using the date filter
Use the date filter to select date/time parameters for the analysis. To use
the date filter, click the Date Filter tab from the analysis configuration
window.
. Set the Date/Time
CANNON
To define a Fixed Date and Time, click the corresponding radio button
. Then use the spin controls and/or list box selection options to set
the appropriate date/time parameters. All samples tested after the start
date/time and before the end date/time, inclusive, will be included.
®
Mini-Rotary Viscometer CMRV-4500 Instruction & Operation Manual
Version 1.1e—October, 2011 • CANNON
2139 High Tech Road • State College, PA • 16803 • USA
®
Instrument Company
Page 80

74
To automatically update the report with sample data as tests are completed, click the Use Dynamic Update radio button. Click the Do not
show previous samples box if you do not wish to display samples
tested prior to the time the analysis is opened.
Use the spin controls
range of recent samples to be included in the analysis). Data from
samples tested within [x] hours will be displayed in the analysis.
that the analysis sorting options are disabled if you are using Dynamic
Update.
EXAMPLE
If the Do not show previous samples box was unchecked and a Sample
Time Window value of 5 hours was selected, the analysis (when opened)
would display data for all samples tested within the last five hours.
Using the sample/error filter
Use the sample filter to limit the analysis to samples which have been
tested with certain instruments, profile names, by certain technicians, or
which have certain Sample ID characteristics. To filter samples using
these variables, click the Sample Filter tab from the analysis configuration window .
to select the Sample Time Window (the desired
Note
NOTE For the error analysis, this tab is labelled Error Filter and the filter options
are limited to instrument and technician).
CANNON
®
Mini-Rotary Viscometer CMRV-4500 Instruction & Operation Manual
Version 1.1e—October, 2011 • CANNON
2139 High Tech Road • State College, PA • 16803 • USA
®
Instrument Company
Page 81

Then select the desired instruments and profile names from their respective list boxes. To select a range of profile names/instruments, click on
the first desired item and then hold down the S key while clicking
on the last desired item in the sequence. To individually select profile
names/instruments from the list boxes and add them to the analysis, hold
down the C key while clicking on each desired profile/instrument.
T o filter by Sample ID characteristics, place the pointer/cursor in the
Sample ID field and type the desired sample IDs, or leave the field blank
to include all sample IDs for the selected instruments. You may use
wildcards (%,_) to select a range of samples. For example, S% would
include data from all samples starting with S. %S% would include data
from all samples containing S. The underscore (_) is a single-character
wildcard. You may use multiple IDs separated by a comma. For example,
CL%,MRV% would display all samples beginning with CL or MRV.
75
NOTE
If no instruments/profile names/Sample IDs are selected, the analysis will
display data for ALL instruments/profiles/Sample IDs.
Using the report/port output filter
Use the Report or Port Output filter to determine which data will be
calculated and/or included in the analysis, and/or in what sequence that
data will be displayed. Report/Port Output filter options will vary depending on the nature of the analysis. For more information on Report/Port
Output filter options, please see the chapter on the specific analysis.
Reconfiguring a displayed analysis
An on-screen analysis may be reconfigured using the same filtering tools
available when creating a new configuration. To access configuration
options for a displayed analysis:
1. Select Analyses from the VISCPRO
2. Select Configure Analysis from the Analyses options.
®
primary menu options.
CANNON
3. Select the desired analysis from the available analyses. The Sample
Analysis Configuration window will appear.
4. Reconfigure the analysis as desired by clicking the tabs to access the
Date, Sample and Report filtering options (see previous sections).
When done, click OK.
®
Mini-Rotary Viscometer CMRV-4500 Instruction & Operation Manual
Version 1.1e—October, 2011 • CANNON
2139 High Tech Road • State College, PA • 16803 • USA
®
Instrument Company
Page 82

76
5. Y ou will be prompted to save the new analysis configuration. After
you make your selection(s), the analysis will be performed and
displayed using the new configuration settings.
Resizing table columns
T o resize columns from a displayed analysis for easier viewing/printing,
move your mouse pointer/cursor to the edge of the desired column
heading. The mouse pointer will change to a bi-dimensional arrow.
Click and drag the edge of the heading to the new location and then
release the mouse button. The entire column will be resized as you drag.
User column size settings will be maintained as long as the analysis
window is open.
Saving a current analysis configuration
T o save a current analysis configuration:
1. Select Analyses from the VISCPRO® primary menu options.
2. Select Save Configuration from the Analyses menu options.
3. Select the desired analysis. The Save Configuration window will
appear. Type the name of the new configuration in the Save As:
field. Or double-click the name of a preexisting configuration in the
Existing Configurations list box to replace the existing configuration with the new configuration settings.
4. Click OK.
NOTE
You may click Cancel from the Save Configuration window to exit without
saving configuration changes.
Deleting an analysis configuration
You can delete an existing analysis configuration from the Choose
Analysis window by highlighting the desired configuration in the list
box and clicking the Delete button or pressing the D key. The
configuration will be immediately and permanently deleted.
Printing an analysis
CANNON
T o print the complete analysis, select Print from the VISCPRO® Main
menu while the analysis is being displayed. If multiple VISCPRO
windows are open, click the analysis window for the analysis you want to
print to make it the active window before you select Print. Then choose
®
Mini-Rotary Viscometer CMRV-4500 Instruction & Operation Manual
Version 1.1e—October, 2011 • CANNON
2139 High Tech Road • State College, PA • 16803 • USA
®
Instrument Company
®
Page 83

77
print options from the Windows® Print window and click OK to print the
analysis. (Consult your W indows
mentation for more information on print settings).
It is also possible to select individual or multiple samples from an
analysis for printing (see next section).
NOTES
The font size for printed analyses will be automatically adjusted to fit data
columns to the selected printer paper size. If the font is too small, or if
columns of data are missing or truncated, try using print options to set
your printer to print in landscape instead of portrait orientation. Or create
two analyses for the desired data instead of just one.
The Print option from Main will not be accessible unless the analysis
window is the active window. Click on the desired window to make it the
active window.
Keystrokes for selecting data for printing
You can print data for a selected sample or samples from an on-screen
analysis by highlighting the desired sample data and then using the Print
option from the VISCPRO® Main Menu.
T o select data for a single sample, click on the line of data associated
with the sample on the screen display . To print a sequential range of
samples, highlight the first sample in the range, then hold down the
S key and click on the last sample in the range. To individually
select test data from the on-screen list box for printing, hold down the
C key while clicking on each desired entry.
®
manual and printer/print driver docu-
When all desired data has been selected, click on Print from the Main
menu. Make certain that the Selection radio button has been selected
from the Print range options. Then click OK to print to the selected
printer.
CANNON
®
Mini-Rotary Viscometer CMRV-4500 Instruction & Operation Manual
Version 1.1e—October, 2011 • CANNON
2139 High Tech Road • State College, PA • 16803 • USA
®
Instrument Company
Page 84

78
This page intentionally left blank.
CANNON
®
Mini-Rotary Viscometer CMRV-4500 Instruction & Operation Manual
Version 1.1e—October, 2011 • CANNON
®
Instrument Company
2139 High Tech Road • State College, PA • 16803 • USA
Page 85

CHAPTER
79
14
Cooling Profiles
DESIGNING CUSTOMIZED
PROFILES
The cooling profile may be pictured graphically as a curve (temperature over
time) calculated from up to 25 individual user-defined data points.
T o design a profile, you will use the Profile Editor from the VISCPRO
Profile Designer window to input time, temperature and (if desired)
tolerance values for each point:
:emiT
ifeht
:erutarepmeT
:ecnareloT
The Profile Designer
Cooling profiles are displayed and maintained using the VISCPRO
Profile Designer window . The Profile Designer window provides a userfriendly interface for selecting and/or creating profiles and, if necessary ,
modifying them to create additional profiles.
CANNON
®
Mini-Rotary Viscometer CMRV-4500 Instruction & Operation Manual
Version 1.1e—October, 2011 • CANNON
2139 High Tech Road • State College, PA • 16803 • USA
®
.deveihcaebotsierutarepmetderisedahcihwtanur-elpmasehtgnirudemitehT
batpeccA.99-0erasruohrofseulavelbatpeccA
.C°04-otC°09+
elebyamdleifsihT.)C°ni(eulaverutarepmet
®
Instrument Company
.deriuqersiecnarelotonfiknalbtf
tahtetoN.95-0erasetunimrofseulavel
.setunim0DNAsruoh0foeulavllunaevahTONdluohseliforpanitnioptsr
erasretemarapelbatpeccA.deificepsemitralucitrapehttaerutarepmetVRMCderiuqerehT
deificepsehtmorf)°1.0tseraenehtot(ecnairaverutarepmetVRMCelbatpeccaehT
®
Page 86

80
Opening the Profile Designer
T o create a new profile or modify an existing profile, Click Configure/
MRV/Profile Designer.
The Profile Designer window will open.
CANNON
The Profile Designer window
The Profile Designer window provides button options for copying and
modifying existing profiles or creating entirely new profiles. It also
provides buttons for management of profile data, including displaying
and printing a graph of the profile and deleting unwanted profiles from
®
Mini-Rotary Viscometer CMRV-4500 Instruction & Operation Manual
Version 1.1e—October, 2011 • CANNON
2139 High Tech Road • State College, PA • 16803 • USA
®
Instrument Company
Page 87

Interface options
81
the profile library . The Profile Designer window also displays Y ield S tress
and Viscosity test parameters for the profile. The Profile Designer
interface options are explained briefly in the following section:
The profile library
The profile library consists of two types of profiles—ASTM-defined
profiles and User-defined profiles.
Click the "down" arrow ( ) to display the list of available profiles.
Then click the desired profile to select it and display the Time, Tempera-
ture and Tolerance data for each defined point of the profile.
Managing profiles
CANNON
®
Version 1.1e—October, 2011 • CANNON
Time/Temperature/Tolerance data from the Profile Designer window
Click the Print Selected Profile button to print the currently-displayed
profile.
Click the Graph Selected Profile button to display a Profile Graph
plotted from the defined points of the profile.
Mini-Rotary Viscometer CMRV-4500 Instruction & Operation Manual
2139 High Tech Road • State College, PA • 16803 • USA
®
Instrument Company
Page 88

82
Click the Delete Selected Profile button to delete the currently-displayed User Defined Profile (ASTM Standard Profiles cannot be deleted
from the Library).
Using the Profile Editor
Click the Create New Profile button to open the Profile Editor and
begin creating a new profile OR
Click Copy Selected Profile to copy the currently-selected profile to the
Profile Editor and begin adapting it to your specifications OR
Click Edit Selected Profile to open the Profile Editor and begin editing
the currently-selected User Defined Profile (ASTM Standard Profiles
cannot be edited).
CANNON
The Profile Editor window (all fields editable)
®
Mini-Rotary Viscometer CMRV-4500 Instruction & Operation Manual
Version 1.1e—October, 2011 • CANNON
2139 High Tech Road • State College, PA • 16803 • USA
®
Instrument Company
Page 89

83
NOTE
NOTES
ASTM-defined profiles may be selected and viewed but may not be
altered. To make revisions to an ASTM-defined profile, you must first
Copy Selected Profile ... and then Save it as a User-defined profile.
1. To define the cooling profile, input desired information (Hours,
Minutes, Temperature and Tolerance) in the appropriate fields for a
single point in the temperature profile.
Adding a data point to the profile
2. Click the Add Point button to add the data to the profile.
Tolerance is the amount of temperature variation permitted for a given
temperature/time point in the cooling profile. If the temperature, as
measured by the CMRV-4500 temperature probe, varies from the
temperature specified in the profile by an amount greater than the
tolerance value for that data point, the data will be tagged as "Profile out
of tolerance" in displays and printouts of profile data.
You cannot enter a tolerance value for the first profile point. Leave the
tolerance field blank for that point.
The first data point in the profile must be the highest temperature in the
profile.
NOTE
Editing points
Deleting points
NOTE
3. Repeat steps 1 & 2 to add up to 25 data points in the cooling profile.
4. Input the desired data for Profile Name, Yield and V iscosity Test
parameters, and Calibration protocol. Then click Save to save the
new User Defined profile.
If you do not rename the profile, the default name will be the same as the
original profile with the (Copy) prefix added. You cannot use an existing
cooling profile name for a new profile!
To edit a point, double-click the point in the point list. This transfers the
point data to the Profile Editor.
Edit the values for time (hours and minutes), temperature and/or toler-
ance in the Profile Editor and Then click Add Point.
To delete a point, highlight the point in the point list; then click the
Delete Selected button OR press the D key on your computer
keyboard.
To select multiple points for deletion, hold down the S or C keys
while clicking on the points to be deleted. To de-select any point, just
click on it again.
CANNON
®
Mini-Rotary Viscometer CMRV-4500 Instruction & Operation Manual
Version 1.1e—October, 2011 • CANNON
2139 High Tech Road • State College, PA • 16803 • USA
®
Instrument Company
Page 90

84
TO delete the point click Yes. To keep the selected point(s) click No.
Cooling profile limitations
CMRV cooling capacity
Correcting profiles
The CMRV cooling capacity changes proportionally with the temperature
at which the instrument is controlling. Greater cooling capacity is
achieved at warmer temperatures, and capacity decreases as temperature
decreases. This makes linear rates-of-cooling impossible in relatively
short time frames.
If the rate-of-cooling for a profile exceeds the cooling capacity of the
instrument, one of three things must be done:
Lengthen the time between the two fixed temperature points
Decrease the temperature change between the two fixed times
Apply a combination of the two previous options.
When a profile data point with a specified tolerance is entered in the
Profile Designer, software calculations are automatically made to determine if the rate-of-cooling relative to the previously-entered point is
within the instrument’s capability. It is assumed that the instrument can
achieve the temperature specified by the previous point. If no tolerance is
specified for that point, then this assumption may or may not be warranted. For this reason, it is possible to design a profile that the instrument is incapable of achieving. The software will only flag those points
that are absolutely impossible to realize. This suggests that experience
and experimentation are needed to properly design profiles which can be
run successfully .
NOTE
The ASTM D 3829 and ASTM D 4684 profiles supplied with the MRVW
software define non-toleranced points which are outside of the
instrument’s capability, but these are merely necessary stepping stones
which permit the instrument to attain proper temperature control at the
subsequent temperatures that are toleranced.
Profile Designer test parameters
The Profile Designer displays important test parameters for Yield Stress
and Viscosity testing. These values are editable from the Profile Editor.
For all ASTM profiles in the profile library, these values have been preset
in conformity with current ASTM specifications.
CANNON
®
Mini-Rotary Viscometer CMRV-4500 Instruction & Operation Manual
Version 1.1e—October, 2011 • CANNON
2139 High Tech Road • State College, PA • 16803 • USA
®
Instrument Company
Page 91

85
ll
NOTE
When the user is designing an entirely new profile “from scratch”, the test
parameters will default to ASTM D 4684 specifications. Copies or
modifications of standard profiles will default to the parameters associated with the ASTM method (D 3829 or D 4684).
Changing test parameters
T o change test parameters:
1. Open the Profile Designer.
2. Select the desired profile and click the Create ..., Copy ... or Edit ...
button as desired. The Profile Editor window will open.
3. Enter appropriate test parameter values. See the chart below for
information on default test parameters.
5. Make any other necessary changes to the profile; then save the
profile by clicking the Save button from the Profile Editor window.
NOTE
The new settings will be effective for that profile and any copies or
modifications based on that profile.
sretemaraPtseTrengiseDeliforP
noitpO tluafeD noitpircseD
tnemercnissaM01 marg-netA.gnitsetssertsdleiyfonoititeperhcaetadeddassamfotnuomA
wmarg-01lanoitiddaenindnaegac-kooh
dleiY
muminiMtseT
noitatoRseergeD
tseTytisocsiV/dleiY
tuoemiT
dlohserhtytisocsiV021ro02
tsetytisocsiV
tuoemit
noitarbilaC
erutarepmet
?eciwTetarbilaCdekcehcton laciripmE.resuehtybderisedfieciwtdemrofrepebyamnoitarbilacllecehT
01 ehtybderiuqernoitomleehw-yellupfotnuomaehtstsujdaretemarapsihT
)C°(02-
021ro03
)sdnoces06ro51(
)sdnoces06ro01(
)sdnoces06(021 noitelpmocrofdettimrep)stnemercnidnoces5.0ni(emitfotn
sertsdleiyonfonoitanimretedarofrosneslacitpo-latigid
.sdnoces06signitsetytisocsiV
4DMTSA;sdnoces
uomamumixaM
.tsetytisocsivehtfo
tisocsivgninimretedrofdesustnatsnoc
.eliforpehtfoerutarepmetlanif
ggusgnitset
VRMCrofdedivorperasthgie
.smarg5.2fostnemercniseificepsdohteM1286DMTSAehT.gnitset
signittes°31ehT.s
.°01esu9283DMTSAroF.1286DMTSAdna4864DMTSArof
tluafedehT.tsethcaerofdetacolla)stnemercnidnoces5.0ni(emitfotnuomA
rofeulavtluafedehtdnasdnoces51signitsetssertSdleiYrofeulavtuoemiT
noitulover½tsrifehtrofdettimrep)stnemercnidnoces5.0ni(emitfotnuomA
06seificeps9283DMTSA.snoitatorllufeerhtgnirusaemfitfahsrotorehtfo
.sdnoces01yficeps1286DMTSAdna486
ecehtstcelesgnittessihT.serutarepmetelpitlumtadetarbilacebnacsllecehT
ehtebyliranidrodluohseulavsihT.y
.ycaruccatsetecnahneyamnoitarbilacelbuodatahtstse
CANNON
®
Mini-Rotary Viscometer CMRV-4500 Instruction & Operation Manual
Version 1.1e—October, 2011 • CANNON
2139 High Tech Road • State College, PA • 16803 • USA
®
Instrument Company
Page 92

86
This page intentionally left blank.
CANNON
®
Mini-Rotary Viscometer CMRV-4500 Instruction & Operation Manual
Version 1.1e—October, 2011 • CANNON
®
Instrument Company
2139 High Tech Road • State College, PA • 16803 • USA
Page 93

CHAPTER
87
15
MRV DATA TABLE ANALYSIS
The MRV Data Table analysis is designed to permit convenient viewing
of data collected from samples which have been tested with the CMRV.
The sample analysis displays sample data in a tabular format. In addition
to Sample identification (ID), the following data may be included:
Sample ID—Sample identification information
Test Date—Date the sample was measured
Test Time—Time the sample was measured
Cell Num—Number of the test cell (1-9)
Profile Name—Name of cooling profile used for test
Prof Start Date—Date the profile began
Prof Start Time—Time the profile began
Temp Data File—The .ttd file associated with the sample test
Technician—Technician name (the individual logged in at the time
the test was completed)
Instrument Type—The instrument model identification
Instrument ID—The unique instrument identification information
Instrument S/N—The instrument model serial number
Yield Stress —Yield Stress test result
Y. S. Factor—Yield Stress factor for the profile
Total Yield Mass—Yield Stress total mass added during test
Test Temp—Temperature at which the sample was tested
Therm Reading—Reference thermometer value (input by user)
Viscosity—Viscosity of sample
Visc T ime 1—Time elapsed during the viscosity test
Visc Rev 1—Number of rotor revolutions during the viscosity test
Cell Constant—Percentage difference between calculated and
known viscosities
Viscosity Mass—Mass used to test for viscosity
Reporting options
CANNON
The MRV Data Table analysis can present data for any or all samples
residing in the database. Several powerful filters may be used to create
useful reports. These filters may be used by making selections from the
tabbed property sheets found in the CMRV Analysis Configuration
window. Once the appropriate filters have been designated, the resulting
report configuration can be saved for future use.
®
Mini-Rotary Viscometer CMRV-4500 Instruction & Operation Manual
Version 1.1e—October, 2011 • CANNON
2139 High Tech Road • State College, PA • 16803 • USA
®
Instrument Company
Page 94

88
Configuring the MRV Data Table
For general information on using analyses, see Chapter 13. To access and
configure the MRV Data Table, follow the procedure below:
1. Select Analyses from the VISCPRO
®
primary menu options.
2. Select View Analysis ... from the Analyses menu. The Choose
Analysis window will appear.
3. Double-click Basic Package (or click the adjacent “
”sign) from
the list of Available Analysis Packages.
4. Select MRV Data Table from the Basic Package report options.
The Choose Analysis window
5. Click on the Define and Open New Configuration radio button
NOTE
If you have already configured and saved an analysis, its name will
appear in the list box on the right side of the window. If you click on an
existing configuration and click OK, the analysis will be performed using
the selected configuration settings. It will not be necessary to complete
the remaining steps in this procedure.
6. Click OK. The CMRV Analysis Configuration window will appear.
CANNON
®
Mini-Rotary Viscometer CMRV-4500 Instruction & Operation Manual
Version 1.1e—October, 2011 • CANNON
2139 High Tech Road • State College, PA • 16803 • USA
(or verify that the option is selected).
The Sample Analysis Configuration window consists of three
tabbed pages:
®
Instrument Company
Page 95

Date Filter—allows you to select date/time parameters for the
analysis (see Chapter 13 for additional details).
Sample Filter—allows you to select which tests will be included in
the analysis (see Chapter 13 for additional details).
MRV Report Filter—allows you to select what sample data will
appear in the Sample Data Table and how the data will be displayed
7. Click on the tab corresponding to the filter you wish to set and
complete configuration options per the instructions below:
89
Date/Sample filters
CMRV Report filter
Complete selection of Date and Sample Filter options per the
instructions in Chapter 13.
T o select specific data for the analysis, click CMRV Report. Then
click in the Column Name field to select desired data. You can also
click the right mouse button in the Column Name field to delete or
to insert additional columns of data. To change precision values for
data, triple-click in the Precision field and type the number desired.
After individual options have been selected, use the related spin
controls
to determine the appearance of data (precision/rounding,
unit of measure, etc.) for viscosity, temperature and other selected
items. Use the check boxes
to filter by data type (V iscosity, Yield
Stress, or both).
CMRV Report data filter options
CANNON
®
Mini-Rotary Viscometer CMRV-4500 Instruction & Operation Manual
Version 1.1e—October, 2011 • CANNON
2139 High Tech Road • State College, PA • 16803 • USA
®
Instrument Company
Page 96

90
8. When you have completed the configuration, click OK. The program
will prompt you to save the configuration.
9. Click Yes to save the configuration. The Save Configuration
window will appear.
NOTES
Exporting archived profile data
The Save Configuration window
10. Type the name of the new configuration in the Save As: field. Or
click the name of a preexisting configuration in the Existing Con-
figurations list box to replace the existing configuration with the
new configuration settings.
11. Click OK. The analysis will be performed and displayed using the
selected configuration settings.
You may click Cancel from the Save Configuration window to exit without
saving configuration changes.
You may display several analyses simultaneously by repeating the
instructions above. Use the tiling options available from the Window
menu to display multiple analyses in the desired window format (horizontal, vertical or cascade view options are available).
T o export time/temperature data from a previous test (viscosity or yield
stress), just configure an analysis for the data and right-click anywhere
inside the data window for the analysis. Then click the Export T ime
Temp Data popup menu option.
CANNON
®
Mini-Rotary Viscometer CMRV-4500 Instruction & Operation Manual
Version 1.1e—October, 2011 • CANNON
2139 High Tech Road • State College, PA • 16803 • USA
®
Instrument Company
Page 97

CHAPTER
91
16
ERROR LOG TABLE ANALYSIS
The Error Log Table is designed as a troubleshooting tool to display error
messages generated by the software during automatic processing of
sample data.
The Error Log Table displays data in a tabular format. In addition to an
error description, the following data may be included:
Time—Time at which the error occurred
Date—Date at which the error occurred
Error Source—Source of error
Instrument ID—Instrument identification (if applicable)
Sample ID—Sample identification
Tray Index—Identifies the Sample Tray number (always “1” for the
CMR V instrument)
Smpl Index—Indicates the number of the test cell (if applicable)
Bulb—This VISCPRO reporting option is not applicable to CMRV
analyses
Technician—Technician logged on at the time of the error
Reporting options
Configuring the Error Log analysis
The Error Log analysis can present data for any errors encountered
during sample runs for which data resides in the database. Several
powerful filters may be used to create useful Error Log reports. These
filters may be used by making selections from the tabbed property sheets
found in the Error Log Configuration window . Once the appropriate
filters have been designated, the resulting report configuration can be
saved for future use.
For general information on using analyses, see Chapter 13. To access and
configure the Error Log Table, follow the procedure below:
1. Select Analyses from the VISCPRO
2. Select View Analysis ... from the Analyses menu. The Choose
Analysis window will appear.
3. Select the Error Log Table from the list of analyses included in the
Basic Package.
®
primary menu options.
CANNON
®
Mini-Rotary Viscometer CMRV-4500 Instruction & Operation Manual
Version 1.1e—October, 2011 • CANNON
2139 High Tech Road • State College, PA • 16803 • USA
®
Instrument Company
Page 98

92
Choosing the Error Log Table analysis
4. Click on the Define and Open New Configuration radio button
(or verify that the option is selected).
NOTE
If you have already configured and saved an analysis, its name will
appear in the list box on the right side of the window. If you click on an
existing configuration and click OK, the analysis will be performed using
the selected configuration settings. It will not be necessary to complete
the remaining steps in this procedure.
5. Click OK. The Error Log Configuration window will appear.
The Error Log Configuration window consists of tabbed pages with
filter options.
Date Filter—allows you to select date/time parameters for the
analysis (see Chapter 13 for additional details).
Error Filter—allows you to select which profiles/technicians/tests
will be included in the analysis (see Chapter 13 for additional
details).
Error Report—allows you to select what sample data will appear in
the Error Log Table and how the data will be displayed.
CANNON
6. Click on the tab corresponding to the filter you wish to set and
complete configuration options. Use the check boxes to select which
data to include in the report.
7. When you have completed the configuration, click OK. The program
will prompt you to save the configuration.
®
Mini-Rotary Viscometer CMRV-4500 Instruction & Operation Manual
Version 1.1e—October, 2011 • CANNON
2139 High Tech Road • State College, PA • 16803 • USA
®
Instrument Company
Page 99

8. Click Yes to save the configuration. The Save Configuration
window will appear.
93
NOTES
CANNON
The Save Configuration window
9. Type the name of the new configuration in the Save As: field. Or
double-click the name of a preexisting configuration in the Existing
Configurations list box to replace the existing configuration with the
new configuration settings.
10. Click OK. The analysis will be performed and displayed using the
selected configuration settings.
You may click Cancel from the Save Configuration window to exit without
saving configuration changes.
You may display several analyses simultaneously by repeating the
instructions above. Use the tiling options available from the Window
menu to display multiple analyses in the desired window format (horizontal, vertical or cascade view options are available).
®
Mini-Rotary Viscometer CMRV-4500 Instruction & Operation Manual
Version 1.1e—October, 2011 • CANNON
2139 High Tech Road • State College, PA • 16803 • USA
®
Instrument Company
Page 100

94
This page intentionally left blank.
CANNON
®
Mini-Rotary Viscometer CMRV-4500 Instruction & Operation Manual
Version 1.1e—October, 2011 • CANNON
®
Instrument Company
2139 High Tech Road • State College, PA • 16803 • USA
 Loading...