

Page 1
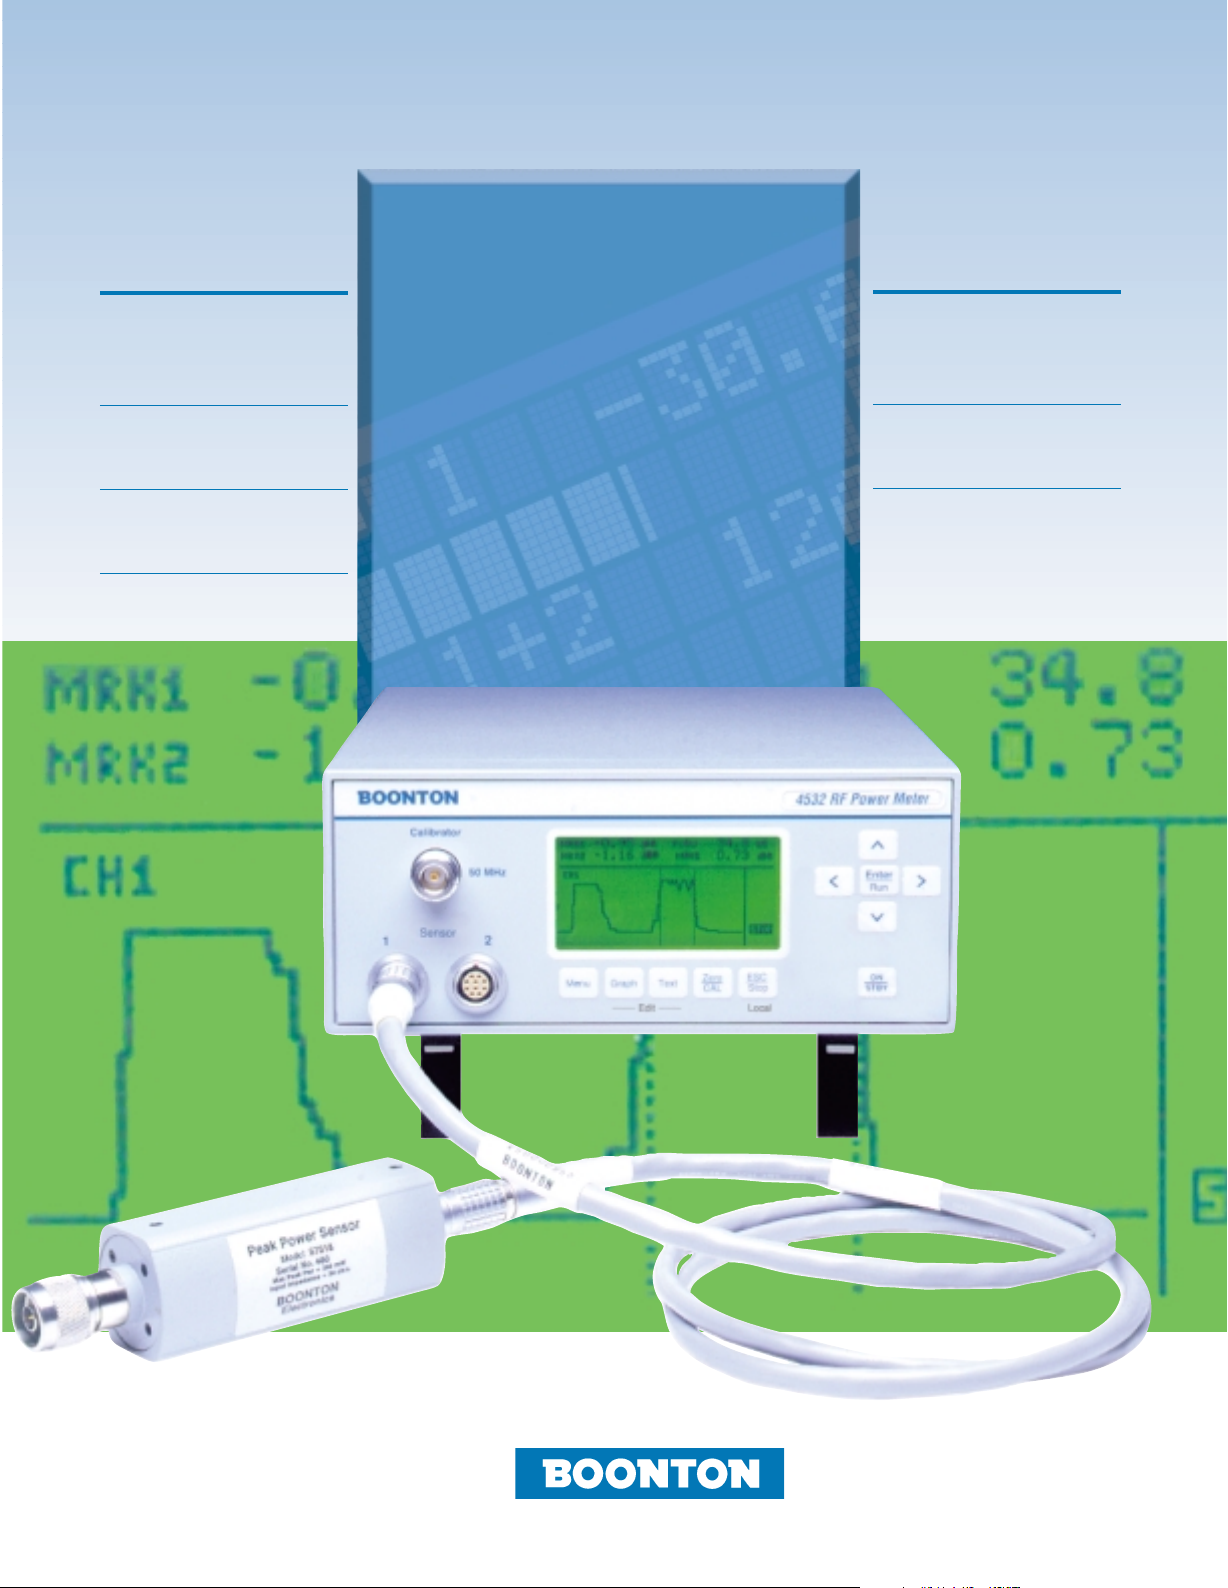
4530 SERIES RF POWER METER
PEAK POWER
FREQUENCY
RANGE:
50MHz TO 40GHz
DYNAMIC RANGE:
>60dB
BANDWIDTH:
20MHz
4530 Series
RF Power
Meter
CW POWER
FREQUENCY
RANGE:
10kHz TO 40GHz
DYNAMIC RANGE:
90dB
Page 2
The 4530 Series:Measure peak
THE 4530 SERIES RF POWER METERS: ACCURACY AND
SPEED FOR PRODUCTION TEST
Boonton’s 4530 Series RF power meters combine the accuracy of
a laboratory-grade instrument with the speed required for production
test. They employ proprietary measurement techniques that
accurately measure digitally-modulated signals, faster, than any other
RF power meters on the market. So whether you’re measuring CW
power or the peak power of W-CDMA or HDTV signals, Boonton’s
single-channel Model 4531 and dual-channel Model 4532 are the
logical choice for high-volume production test.
MORE THAN POWER ALONE
The 4530 is more than a simple RF power meter. It measures CW
power, peak power, voltage, and performs statistical power analysis
(CDF and PDF) as well. The 4530 is compatible with all Boonton RF
power and voltage sensors too, from coaxial dual-diode types, to
thermal sensors, for measurements up to 40 GHz. Sensor set-up is
easy and accurate too, since calibration and set-up data are
automatically downloaded from the sensor, as soon as it’s plugged in.
60
dB
>
The 4530 provides seamless CW power measurement over its
broad dynamic range—without the interruptions and nonlinearities
caused by range changes required by lesser power meters. Our
thermal and peak-power sensors never need range switching, and
even our CW diode sensors—with 90 dB dynamic range—use only
two widely overlapping ranges.
FUTURE PERFECT
The 4530 measures the precise peak and
average power of today’s complex
digitally-modulated carriers...and
those of tomorrow as well.
Modulation bandwidths up to
20 MHz are within the range of
the 4530, which makes it the
best choice for measuring CDMA,
W-CDMA, CDMA2000, TDMA, GSM, GSM-EDGE, GPRS, OFDM,
HDTV, and UMTS with the flexibility to accommodate new modulation
schemes in the future. The 4530 displays periodic and pulse
waveforms in graphical format, and a host of automatic
measurements characterize the time and power profiles of the pulse.
Powerful triggering, effective sampling rates up to 50 MSamples/sec.
and programmable cursors give you instantaneous power
BOONTON ELECTRONICS (A Wireless Telecom Group Company) 1
P.O. Box 465, Parsippany, NJ 07054-0465 • Tel: (973) 386-9696 • Fax: (973) 386-9191 • E-mail: sales@boonton.com • Website: www.boonton.com
Page 3
measurements at precise time delays from the pulse edge. With an
internal or external trigger you can perform time-gated or power-gated
peak and average power measurements as well. Triggering can be
synchronous or asynchronous. Display can be adjusted to pre-trigger
or post-trigger to view any portion of the waveform.
For CDMA or other spread-spectrum signals, the 4530’s powerful
statistical analysis mode allows full profiling of power probability at
all signal levels. The 4530 makes even these complex measurements
fast, thanks to sustained acquisition rates above 1 MSample/sec. and
smooth, range-free operation that allows a representative population
to be acquired and analyzed rapidly.
RELIEF FOR AMPLIFIER DESIGNERS
The random and infrequent nature of power peaks makes them
almost impossible to detect and measure with conventional power
meters. That means you’ll never know how an amplifier will perform in
the field when driven into compression by these fleeting peaks–until
it’s too late. The 4530 gives you this critical information by analyzing
the probability-of-occurrence near the point of absolute peak power,
then detecting and analyzing the data with the high accuracy
required to realistically evaluate an amplifier’s performance. And with
its extremely wide video bandwidth, the 4530 detects even the
narrowest peaks.
The 4530’s powerful dual-processor architecture enables
comprehensive measurements with unprecedented
speed and performance. It eliminates the speed
tradeoffs between data acquisition and output
via GPIB that are a fact of life with other power
meters. A high-speed, floating-point digital
signal processor (DSP) performs the
measurements, gathers and processes the
power samples from the sensors, timestamps the measurements, and provides
linearity correction, gain adjustment and
filtering—all in less than a microsecond.
The processed measurements are then passed to a dedicated,
32-bit I/O processor that sends them to the LCD display and over
RS-232 or GPIB interfaces when formatted measurements are
required. Programming is easier as well, thanks to comprehensive
use of the industry standard SCPI command syntax.
BOONTON ELECTRONICS (A Wireless Telecom Group Company) 2
P.O. Box 465, Parsippany, NJ 07054-0465 • Tel: (973) 386-9696 • Fax: (973) 386-9191 • E-mail: sales@boonton.com • Website: www.boonton.com
Page 4

MODULATED AVERAGE POWER,
MRK1
MRK1
SNSR1
SNSR2
MRK2
MRK2
-42.64 dBm
-17.22 dBm
Run
-28.50
dBm
8.91 dBm
1
2
Wave Time
SNSR1
Rep.Freq 702. kHz
Pls.Width 217. ns
PlsPeriod 1.43 µs
DutyCycle 15.3 %
RiseTime 23.1 ns
FallTime 28.5 ns
Mrk2
Run
Mrk1 -20 ns
180 ns
MIN
MIN
-11.93 dBm
SNSR1
Run
Avg
Avg
SNSR2
dBm
17.7O dBm
O.OO dBm
PEAK
PEAK
8.828 dBm
-3.017 dBm
.
1
2
1
2
SNSR1
Run
CDF
5.6 M Samples
0:05 Totl Time
PEAK POWER AND MORE
Using Boonton Peak Power sensors,
the 4530 Series can measure the true
average power of modulated waveforms,
while providing important information
about the instantaneous peak power
missing in other power meters using
“universal” power sensors.
The absolute peak power and
crest factor are available, plus the
held minimum and maximum average
powers for viewing long-term trends.
The MODULATED mode text display, showing the true average
power for both channels, plus their tracking instantaneous
peak and minimum values.
And Boonton’s exclusive peak
tracking mode allows short term
crest factor measurements to be
made on real signals without the
need to manually reset the held peak
every time the signal level changes.
A flexible text display shows
the measurements for one or both
channels, and a “chart recorder”
display of average power may be
displayed graphically.
The PULSE mode graph display allows the measured
waveforms to be shown in a real-time “oscilloscope” format,
which can be zoomed or panned as desired.
The 4530’s Pulse Mode provides
the solution today’s engineers need for
characterizing all types of communication signals where not only the RF
power, but the timing of that power is
important.
Pulse Mode is designed to feel
familiar to most engineers and
technicians - the instrument can be
operated in much the same way
as a digital oscilloscope. Flexible
timebase and triggering capabilities
allow you to quickly view and measure
pulse or burst waveforms.
Common pulse power and timing
measurements can be set up and
performed automatically by the
instrument, or can be defined manually
for optimum flexibility.
Two programmable cursors can be
used to measure instantaneous power at
two time offsets relative to the trigger, or
to define a time interval, also known as a
“time gate,” over which average and
peak power measurements may be made.
HIGH-SPEED STATISTICAL
MEASUREMENTS
In addition to its industry-leading
performance with pulse and burst
modulated signals, the 4530 Series offers
the only true solution for characterizing
nonperiodic signals such as CDMA and
HDTV. These wideband signals are often
noise-like, with many brief peaks that
vary in magnitude and frequency of
occurrence.
Measuring the average power of a
spread spectrum signal does little to
indicate how well an amplifier is coping
with these peaks. Even adding a crest
factor display only gives information
about the highest peak (which by
definition, only occurs once, and is of
little value in predicting error rate).
The only way to accurately
characterize these signals is to build
a very large population of power
samples in a short time, and analyze
the statistical probability of occurrence
of each power level.
The Cumulative Distribution Function (CDF) plots the
probability of occurence of all power levels in a group
of power samples.
The pulse average and peak power,
CONTINUOUS OR PULSE
MEASUREMENTS
width, frequency, and edge transition
times are just a few of the many
automatic measurements performed.
In many of today’s digital modulation
formats, the data is transmitted in short
bursts, and the RF carrier is then
switched off to allow other users to
occupy the same channel (often known
as time division multiple access, or
TDMA). In these signals, there are
important restrictions not only on the
power of the burst, but also on the edge
positions within a data frame and the
slopes of those transitions.
BOONTON ELECTRONICS (A Wireless Telecom Group Company) 3
P.O. Box 465, Parsippany, NJ 07054-0465 • Tel: (973) 386-9696 • Fax: (973) 386-9191 • E-mail: sales@boonton.com • Website: www.boonton.com
The PULSE mode text display can page through a series of
automatic measurements of commonly needed pulse
parameters.
The Cumulative Distribution Function,
or CDF, displayed by the 4530 plots the
probability that the power will be at or
below a specified level. By examining
the areas close to 100% probability, it is
possible to see how often the highest
peaks occur. It is easy to see amplifier
compression under actual operating
conditions, and to predict the effect on
error rate that this may have.
The 4530’s Statistical Mode allows you
to place one or two vertical or horizontal
cursors on the plot, and read the percent
Page 5

probability for a particular power level, or
Mrk2
Run
Mrk1 22 µs
532 µs
SNSR1
Wave Power
AvgCycle --.-- dBm
AvgPulse 6.75 dBm
PeakPower 6.86 dBm
Top Ampl 6.77 dBm
Bot Ampl . dBm
OverSht. 0.09 dB
Marker1
1
Marker1 = 0.020 %
Marker2MrkrMod
Run
SNSR1
SNSR1
CDF
Run
14.6 M Samples
0:14 Totl time
AvgPower 7.42 dBm
PeakPower 16.44 dBm
MinPower -16.44 dBm
Peak/Avg 9.01 dB
99.000% 16.12 dBm
99.995% 16.32 dBm
SNSR1
Mrk2
Run
Mrk1 22 µs
532 µs
the power at a probability. And of course
the accumulated average, peak and
minimum powers for the entire population
may be displayed.
As with all measurement modes, the
graph display includes complete pan
and zoom ability, and can present the
data in CDF, CCDF or distribution
(histogram bar) formats.
Viewing statistical data in the CCDF presentation allows
close examination of the probability of very infrequent peaks
that approach the absolute peak power.
AUTOMATIC TIME GATING
For measurement of single bursts
such as the GSM reverse link, the
4530’s automatic time gated pulse
measurements can be used to quickly
measure the “on” power during the
active portion of the burst while
excluding the edge transitions.
For example, the time gating may be
set to measure the burst between the
3% and 97% time points. For a GSM
WIDEBAND CDMA POWER
The 4530’s wide bandwidth, high
speed sampling and digital signal
processing speed allows fast and
accurate characterization of current and
future CDMA2000 and WCDMA formats.
GSM AND BEYOND
The standard GSM signal uses a
digitally modulated burst to transmit
data. Each user is allocated one of eight
“timeslots,” and must only transmit within
its assigned timeslot. In addition to
burst (on time about 564µS) this means
that the leading and trailing 17µS will be
excluded, and the reading will be the
average power of the burst during the
middle 530µS.
controlling power when on, an on/off
ramp profile must be carefully followed
to avoid interference with other users.
The 4530’s pulse mode is ideal for
measuring all power and timing
parameters of current and future GSM
formats. With trigger delay and holdoff,
The 4530 Series’ Statistical Mode displays the full set of
statistical calculations for the entire population.
No other power meter offers the wide
bandwidth of the 4530 series–up to
it is possible to synchronize on difficult
bursts, and measure power at any
instant or over any interval, whether
pre- or post-trigger.
As an alternative to manual cursors, the automatic time
gating feature locates the burst start and stop times from
the edge transitions, and performs the measurement over
a user-defined portion of this time interval.
20 MHz. And only Boonton’s innovative
sensor architecture allows measurement
of the ENTIRE dynamic range of a signal
without range switching and its
associated bandwidth limiting as the
signal level changes.
This allows modulated and peak
measurements of wide dynamic range
signals, but is doubly important for
Screen cursors can be easily positioned over the active
portion of a single GSM timeslot, allowing measurement of
average power and crest factor during this interval.
statistical measurements, since
changing the range and bandwidth
for a portion of samples would invalidate
the statistical properties of the entire
sample population, and render the
measurements meaningless.
In addition to bandwidth, the 4530’s
high sustained sampling and processing
speed ensures that few of the narrow
peaks of wideband signals will fall
between samples, and a representative
population can be acquired in seconds.
BOONTON ELECTRONICS (A Wireless Telecom Group Company) 4
P.O. Box 465, Parsippany, NJ 07054-0465 • Tel: (973) 386-9696 • Fax: (973) 386-9191 • E-mail: sales@boonton.com • Website: www.boonton.com
Two programmable cursors allow
power measurements on the active
portions of each timeslot, while
excluding the transition intervals
between, or can be used to examine the
ramp profile during timeslot transition
intervals. Interval (or “time gated”)
measurements include average as well
as peak and minimum power, so the
4530 Series is ready for even the
wideband next-generation GSM formats.
Page 6

SPECIFICATION 4530 POWER METER
Sensor Inputs (Performance depends upon sensor model selected)
Channels: Single (4531) and dual (4532) channel versions available
RF Frequency Range: Determined by sensor, 10Hz to 40 GHz
Peak Power Measurement Range: -40 to +20 dBm
CW Measurement Range: -70 to +20 dBm
Relative Offset Range: ±99.99 dB
Video Bandwidth: 20 MHz
Pulse Repetition Rate: 1.8 MHz max.
Calibration Sources
Internal Calibrator
Output Frequency: 50 MHz ±0.005%
Level: -60 to +20 dBm
Resolution: 0.1 dB steps
Source SWR (Refl. Coeff.): 1.05(0.024)
Accuracy: 0° to 20°C, (NIST traceable): +20 to –39.9 dBm ±0.06 dB (1.4%)
-40 to -60 dBm ±0.09 dB (2.1%)
RF Connector: Type N
Trigger (Pulse mode only, signal inputs.)
Modes: Pre-trigger and post-trigger
Internal Trigger Level Range: Equivalent to -30 to +20 dBm pulse amplitude range.
External Trigger Level Range: ±5 volts, ±50 volts with 10:1 divider probe.
External Trigger Input: 1 megohm in parallel with approximately 15pF, dc coupled.
Connector type: BNC
Trigger time resolution: 20 ns
Trigger Delay Range: ±900 microseconds for timespans 5µs and faster
±4 milliseconds for timespans 10µs to 50µs
±(80*timespan) for timespans 50µs to 2ms
±(30*timespan) for timespans 5ms and slower
Trigger Holdoff Range: 10 microseconds to 1 second
Trigger Holdoff Resolution: 1 microsecond
Sampling Characteristics
Effective sampling rate: 50 Megasamples per second (each channel, pulse mode)
Sustained sampling rate: 2.5 Megasamples per second (each channel, pulse mode)
Measurement Technique: Continuous and triggered (burst) sampling
Measurement Characteristics
Measurements: Average Power*
Maximum Average Power*
Minimum Average Power*
Maximum Instantaneous (“Peak”) Power*
Minimum Instantaneous Power*
Peak to Average Power Ratio*
Cumulative Distribution Functions: CDF, 1-CDF
Probability Distribution (histogram)
Power at a percent statistical probability
Statistical probability at a power level
CW Power
RF Voltage
Channel Math: Displays the sum or difference between channels or between
a channel and a reference measurement (Modulated and CW
modes only).
Trace Averaging: 1 to 4096 samples per data point.
Panel setup storage: 4 complete setups.
Measurement rate (via GPIB): Greater than 200 two-channel measurements per second,
neglecting bus master overhead, or 500 single-channel
measurements per second.
Interface
Video Output: Detected logarithmic RF envelope for external oscilloscope
monitor.
GPIB Interface: Complies with IEEE-488.1. Implements AH1, SH1,T6,
LE0, SR1, RL1, PP0, DC1, DT1, C0, and E1.
RS-232 Interface: Accepts GPIB commands (except bus dependent commands).
Provide for user software updates.
Remote Programming: SCPI-like and Native Mode commands via GPIB or
RS-232 interfaces.
Software Drivers: LABVIEW drivers available.
Environmental Specifications
General: Manufactured to the intent of MIL-T28800E, Type III,
Class 5, Style E
CE Mark: Conforms to European Community (EU) specifications:
EN 61010-1(90)(+A1/92)(+A2/95)
EN 61010-2-031
EN 61326-1(97)
EN 55022(94)(A2/97)ClassB
Display: Graphic type LCD, LED backlighted. Text and trace displays.
Operating Temperature: 0 to 50°C
Ventilation: Fan cooled.
Altitude: Operation up to 15,000 feet.
Storage Temperature: -40 to 75°C
Humidity: 95% ±5% maximum (non-condensing)
Power Requirements: 90 to 260 VAC, 47 to 63 Hz, <50 VA, <30 Watts.
No voltage switching required.
Physical Specifications
Dimensions: 3.5 inches (8.9 cm) high, 8.4 inches (21.3 cm) wide, approx
13.5 inches (34.3 cm) deep, not including feet and connector
clearances.
Weight: 7lbs. (3.2kg)
Connector location option: Sensor input(s)and calibrator connector: Front or rear panel.
Construction: Surface mount, multi-layer printed circuit boards mounted to
rigid aluminum frame and front extrusion/casting with
aluminum sheet metal enclosure.
* All measurements marked with an asterisk (*) may be performed continuously, or in a
synchronous, triggered mode. When triggered, these measurements may be made at a single
time offset relative to the trigger, or over a defined time interval. The time offset or interval may
be before or after, or may span the trigger interval.
Note: Specifications subject to change without notice.
BOONTON ELECTRONICS (A Wireless Telecom Group Company) 5
P.O. Box 465, Parsippany, NJ 07054-0465 • Tel: (973) 386-9696 • Fax: (973) 386-9191 • E-mail: sales@boonton.com • Website: www.boonton.com
Page 7

PEAK POWER SENSORS
Model Frequency Range Dynamic Range Overload Rating Risetime / Bandwidth Maximum SWR
Impedance (Low Bandwidth setting) Peak Power Range Pulse Sensor Response on 4530
RF Connector Internal Trigger Range Continuous Fast Risetime Slow Risetime Frequency SWR
(Bandwidth) (Bandwidth)
DUAL DIODE SENSORS
57318 0.5 to 18 GHz -24 to +20 dBm 1 W for 1µs <20 ns
(1)
<10 µs 0.05 to 2 GHz 1.15
50Ω (0.05 to 18 GHz) -10 to +20 dBm 200 mW (20 MHz) (350 KHz) 2 to 6 GHz 1.20
N(M) 6 to 16 GHz 1.28
57340 0.5 to 40 GHz -24 to +20 dBm 1 W for 1µs <20 ns
(1)
<10 µs 0.05 to 4 GHz 1.25
16 to 18 GHz 1.34
50Ω (0.05 to 40 GHz) -10 to +20 dBm 200 mW (20 MHz) (350 KHz) 4 to 38 GHz 1.65
K(M) 38 to 40 GHz 2.00
57518 0.1 to 18 GHz -40 to +20 dBm 1 W for 1µs <100 ns <10 µs 0.05 to 2 GHz 1.15
50Ω (0.05 to 18 GHz) -27 to +20 dBm 200 mW (6 MHz) (350 KHz) 2 to 6 GHz 1.20
N(M) 6 to 16 GHz 1.28
16 to 18 GHz 1.34
57540 0.1 to 40 GHz -40 to +20 dBm 1 W for 1µs <100 ns <10 µs 0.05 to 4 GHz 1.15
50Ω (0.05 to 40 GHz) -27 to +20 dBm 200 mW (6 MHz) (350 KHz) 4 to 38 GHz 1.65
K(M) 38 to 40 GHz 2.00
(1)
Models 4400A and 4500A: <15ns, (35 MHz).
CW POWER SENSORS
Model Frequency Range Dynamic Range Overload Rating Maximum SWR
Impedance Pulse
RF Connector Continuous Frequency SWR
WIDE DYNAMIC RANGE DUAL DIODE POWER SENSORS
51075 500 kHz to 18 GHz -70 to +20 dBm 1 W for 1 µs 500 kHz to 2 GHz 1.15
50Ω 300 mW 2 GHz to 6 GHz 1.20
N(M) 6 GHz to 8 GHz 1.40
51077 500 kHz to 18 GHz -60 to +30 dBm 10 W for 1 µs 500 kHz to 2 GHz 1.15
50Ω 3 W 2 GHz to 6 GHz 1.20
N(M) 6 GHz to 18 GHz 1.40
51079 500 kHz to 18 GHz -50 to +40 dBm 100 W for 1 µs 500 kHz to 2 GHz 1.15
50Ω 25 W 2 GHz to 6 GHz 1.20
N(M) 6 GHz to 18 GHz 1.40
51071 10 MHz to 26.5 GHz -70 to +20 dBm 1 W for 1 µs 10 MHz to 2 GHz 1.15
50Ω 300 mW 2 GHz to 4 GHz 1.20
K(M) 4 GHz to 18 GHz 1.45
18 GHz to 26.5 GHz 1.50
51072 30 MHz to 40 GHz -70 to +20 dBm 1 W for 1 µs 30 MHz to 4 GHz 1.25
50Ω 300 mW 4 GHz to 38 GHz 1.65
K(M) 38 GHz to 40 GHz 2.00
Frequency calibration factors (NIST-traceable) and other data are
stored within all the Peak Power Sensors. Linearity calibration is
performed by the built-in calibrator of the peak power meter.
One five-foot long peak sensor cable is included per channel
except when one or more CW sensors are ordered with the
instrument. In this case a cable with data adapter will be
substituted for a peak sensor cable in each instance.
A five-foot long sensor cable is standard. Longer cables are
available at a higher cost. Effective bandwidth is reduced with
longer cables.
RF VOLTAGE PROBE KITS
Model Frequency Range Dynamic Range Overload Rating Maximum SWR
952063 10 kHz to 1.2 GHz 200 µV to 10 V 63 VDC or Peak AC N/A
952064 10 Hz to 100 MHz 200 µV to 10 V 63 VDC or Peak AC N/A
10 VRMS AC continuous
10 VRMS AC continuous
BOONTON ELECTRONICS (A Wireless Telecom Group Company) 6
P.O. Box 465, Parsippany, NJ 07054-0465 • Tel: (973) 386-9696 • Fax: (973) 386-9191 • E-mail: sales@boonton.com • Website: www.boonton.com
Page 8

ADDITIONAL PRODUCTS* AND SERVICES AVAILABLE
FROM BOONTON ELECTRONICS CORPORATION
• Model 4400A/4500A series RF Peak Power Meter/Analyzer 10 kHz to 40 GHz
• Model 4230A series RF Power Meter 10 kHz to 40 GHz
• Model 4730/5730 series VXI Power Meter 10 kHz to 40 GHz
• Model 9230 series RF Voltmeter 200 µV to 300 V, 10 Hz to 1.26 Hz
• Model 5230 series Universal RF Power Meter/Voltmeter 200 µV to 300 V, 10 Hz to 40 GHz
• Model 92EA RF Millivoltmeter 200 µV to 300 V, 10 Hz to 1.2 GHz
• Model 7200 Capacitance Meter 0 to 2000 pF, 1 MHz, Digital display
• Model 72B Capacitance Meter 1 pF to 3000 pF, 1 MHz, Analog display
• Model 8201 Modulation Analyzer 100 kHz to 2.5 GHz
• Model 8701 VXI Modulation Analyzer 100 kHz to 2.5 GHz
• Model 1121 Audio Analyzer 10 Hz to 140 kHz
*Check with factory for availability.
SERVICE AND SUPPORT YOU CAN COUNT ON
Boonton Electronics backs all of its
products with a full range of test,
repair, upgrade, and calibration services,
assuring that all your instrumentation
remains accurate, reliable, and conforms
to original factory specifications.
Services include:
• Certified Repairs (NIST Traceable)
• Repair Warranty (6 Months, Materials and Labor)
• Automatic Instrument/Software Upgrades*
• 10-day Turnaround
• Priority Service
• Flexible Service, Repair, and Calibration Contracts
Contact our Customer Service
Department at (973) 386-9696 for
details and pricing information.
*Available on most models
Your Local Representative:
BOONTON ELECTRONICS
(A Wireless Telecom Group Company)
25 Eastmans Road
P.O. Box 465
Parsippany, NJ 07054-0465
Telephone: (973) 386-9696
Fax: (973) 386-9191
E-mail: sales@boonton.com
©2001 Boonton Electronics (A Wireless Telecom Group Company). Printed in U.S.A.
For complete information about Boonton, new
product announcements, or your nearest Boonton
Representative, visit us on the Worldwide Web.
www.boonton.com
All trademarks are the property of their respective companies.
 Loading...