

Page 1

MODEL 4230A
RF POWER METER
INSTRUCTION MANUAL
BOONTON ELECTRONICS 25 EASTMANS ROAD PARSIPPANY, NEW JERSEY 07054-0465
TELEPHONE: (973) 386-9696 FAX: (973) 386-9191 E-MAIL: boonton@boonton.com
MANUAL P/N 98102400A
DATE 10/98
Page 2
SAFETY SUMMARY
The following general safety precautions must be observed during all phases of operation and maintenance of this
instrument. Failure to comply with these precautions or with specific warnings elsewhere in this manual violates safety
standards of design, manufacture, and intended use of the instruments. Boonton Electronics assumes no liability for the
customer's failure to comply with these requirements.
THE INSTRUMENT MUST BE GROUNDED.
To minimize shock hazard the instrument chassis and cabinet must be connected to an electrical ground. The instrument
is equipped with a three conductor, three prong AC power cable. The power cable must either be plugged into an approved
three-contact electrical outlet or used with a three-contact to a two-contact adapter with the (green) grounding wire firmly
connected to an electrical ground at the power outlet.
DO NOT OPERATE THE INSTRUMENT IN AN EXPLOSIVE ATMOSPHERE.
Do not operate the instrument in the presence of flammable gases or fumes.
KEEP AWAY FROM LIVE CIRCUITS.
Operating personnel must not remove instrument covers. Component replacement and internal adjustments must be made
by qualified maintenance personnel. Do not replace components with the power cable connected. Under certain conditions
dangerous voltages may exist even though the power cable was removed; therefore, always disconnect power and
discharge circuits before touching them.
DO NOT SERVICE OR ADJUST ALONE.
Do not attempt internal service or adjustment unless another person, capable of rendering first aid and resuscitation, is
present.
DO NOT SUBSTITUTE PARTS OR MODIFY INSTRUMENT.
Do not install substitute parts of perform any unauthorized modification of the instrument. Return the instrument to
Boonton Electronics for repair to ensure that the safety features are maintained.
This safety requirement symbol has been adopted by the International Electrotechnical
Commission, Document 66 (Central Office) 3, Paragraph 5.3, which directs that an
instrument be so labeled if, for the correct use of the instrument, it is necessary to refer
to the instruction manual. In this case it is recommended that reference be made to the
instruction manual when connecting the instrument to the proper power source. Verify
that the correct fuse is installed for the power available, and that the switch on the rear
panel is set to the applicable operating voltage.
The CAUTION sign denotes a hazard. It calls attention to an operation procedure,
CAUTION
WARNING
practice, or the like, which, if not correctly performed or adhered to, could result in
damage to or destruction of part or all of the equipment. Do not proceed beyond a
CAUTION sign until the indicated conditions are fully understood and met.
The WARNING sign denotes a hazard. It calls attention to an operation procedure.,
practice, or the like, which, if not correctly performed or adhered to, could result in
injury of loss of life. Do not proceed beyond a warning sign until the indicated conditions
are fully understood and met.
This SAFETY REQUIREMENT symbol has been adopted by the International
Electrotechnical Commission, document 66 (Central Office)3, Paragraph 5.3 which
indicates hazardous voltage may be present in the vicinity of the marking.
Page 3

WARRANTY
Boonton Electronics (Boonton) warrants its products to the original
Purchaser to be free from defects in material and workmanship for a
period of one year from date of shipment for instrument, and for one
year from date of shipment for probes, power sensors and accessories.
Boonton further warrants that its instruments will perform within all
current specifications under normal use and service for one year from
date of shipment. These warranties do not cover active devices that
have given normal service, sealed assemblies which have been opened
or any item which has been repaired or altered without Boonton's
authorization.
Boonton's warranties are limited to either the repair or replacement, at
Boonton's option, of any product found to be defective under the
terms of these warranties.
There will be no charge for parts and labor during the warranty period.
The Purchaser shall prepay shipping charges to Boonton or its
designated service facility and shall return the product in its original or
an equivalent shipping container. Boonton or its designated service
facility shall pay shipping charges to return the product to the Purchaser.
The Purchaser shall pay all shipping charges, duties and taxes if a
product is returned to Boonton from outside of the United States.
THE FOREGOING WARRANTIES ARE IN LIEU OF ALL OTHER
WARRANTIES, EXPRESSED OR IMPLIED, INCLUDING, BUT
NOT LIMITED TO, THE IMPLIED WARRANTIES OF
MERCHANTABILITY AND FITNESS FOR A PARTICULAR
PURPOSE. BE shall not be liable to any incidental or consequential
damages, as defined in Section 2-715 of the Uniform Commercial
Code, in connection with the products covered by the foregoing
warranties.
Page 4

TABLE OF CONTENTS
SECTION I — GENERAL INFORMATION
Paragraph Page
1-1 Introduction ................................................................................................................................................................. 1-1
1-3 Description................................................................................................................................................................... 1-1
1-5 Features ......................................................................................................................................................................... 1-1
1-6 Power Sensors .................................................................................................................................................... 1-1
1-10 Simple Instrument Setup and Operation ...................................................................................................... 1-1
1-11 Alphanumeric Displays.................................................................................................................................... 1-1
1-12 Selectable Ranging ........................................................................................................................................... 1-1
1-13 Selectable Filtering ........................................................................................................................................... 1-1
1-14 Zeroing ................................................................................................................................................................ 1-2
1-15 Built-In Precision Calibration ........................................................................................................................ 1-2
1-16 Chart Recorder Output ..................................................................................................................................... 1-2
1-17 Optional Interface .............................................................................................................................................. 1-2
1-18 Accessories ................................................................................................................................................................... 1-2
1-20 Options ......................................................................................................................................................................... 1-2
1-21 Option -01, Rear Input ................................................................................................................................... 1-2
1-22 Option -02, Rear Calibrator .......................................................................................................................... 1-2
1-23 Option -03, RS-232 ......................................................................................................................................... 1-2
1-24 Option -30, Extended Warranty ...................................................................................................................1-2
1-25 Specifications............................................................................................................................................................... 1-2
SECTION II — INSTALLATION
2-1 Introduction ................................................................................................................................................................. 2-1
2-2 Unpacking................................................................................................................................................................... 2-1
2-3 Mounting ..................................................................................................................................................................... 2-1
2-4 Power Requirements .................................................................................................................................................2-1
2-5 Connections ................................................................................................................................................................ 2-1
2-6 Sensor ................................................................................................................................................................. 2-1
2-7 Recorder............................................................................................................................................................. 2-2
2-8 GPIB.................................................................................................................................................................... 2-2
2-9 RS-232................................................................................................................................................................ 2-2
2-10 Preliminary Check..................................................................................................................................................... 2-2
SECTION III — OPERATION
3-1 Introduction ................................................................................................................................................................. 3-1
3-3 Operating Controls, Indicators and Connectors ................................................................................................... 3-1
3-5 Operating the Instrument .......................................................................................................................................... 3-1
3-7 Measurement Display ................................................................................................................................................ 3-1
3-9 Menu Structure............................................................................................................................................................ 3-1
3-13 Menu Key..................................................................................................................................................................... 3-7
3-16 Channel Menu.................................................................................................................................................... 3-7
3-18 Setup Menu ........................................................................................................................................................ 3-7
3-20 Programming Interfaces .................................................................................................................................... 3-11
3-21a IEEE Menu .......................................................................................................................................................... 3-11
3-21b RS-232 Menu ...................................................................................................................................................... 3-11
3-22 Diagnostics Menu ............................................................................................................................................. 3-13
3-23 Sensor Key ................................................................................................................................................................... 3-13
3-31 Edit Data Menu .................................................................................................................................................. 3-15
3-32 Linearity Factors ................................................................................................................................................ 3-15
3-33 FREQUENCY Calibration Factors ................................................................................................................... 3-16
i
Page 5

3-36 Save ..................................................................................................................................................................... 3-16
3-37 Freq Key ....................................................................................................................................................................... 3-16
3-40 Avg Key ....................................................................................................................................................................... 3-16
3-43 Zero/Cal Key ................................................................................................................................................................ 3-16
3-48 Ref Level Key............................................................................................................................................................... 3-18
SECTION IV — APPLICATION NOTES
4-1 Introduction ................................................................................................................................................................. 4-1
4-3 Sensor Calibration ...................................................................................................................................................... 4-1
4-4 General................................................................................................................................................................ 4-1
4-5 14-Point Linearity Data ................................................................................................................................... 4-1
4-7 High Frequency Calibration Points ............................................................................................................... 4-1
4-9 Zeroing ......................................................................................................................................................................... 4-1
4-16 Dynamic Range ...........................................................................................................................................................4-3
4-18 Filtering ........................................................................................................................................................................ 4-3
4-22 Noise ............................................................................................................................................................................. 4-4
4-23 Noise Reduction ................................................................................................................................................ 4-4
4-25 Error Computation ............................................................................................................................................4-5
4-27 Noise Error Examples ...................................................................................................................................... 4-5
4-28 Integration of Power......................................................................................................................................... 4-5
4-29 Clearing of Filter............................................................................................................................................... 4-5
4-30 Partial Results .................................................................................................................................................... 4-5
4-31 Measurement Time ..................................................................................................................................................... 4-5
4-32 Step Response.................................................................................................................................................... 4-5
4-33 Continuous Response ....................................................................................................................................... 4-5
4-34 Overhead Time .................................................................................................................................................. 4-5
4-36 Digital Filter ...................................................................................................................................................... 4-5
4-37 Default Filter Lengths ...................................................................................................................................... 4-5
4-38 Settled Measurement Time ............................................................................................................................. 4-5
4-39 Fast Mode Measurement Time ...................................................................................................................... 4-5
4-40 High Frequency Accuracy ......................................................................................................................................... 4-10
4-43 Waveform Sensitivity................................................................................................................................................. 4-10
4-48 Chart Recorder Operation .......................................................................................................................................... 4-13
4-50 Bar Graph Operation ................................................................................................................................................. 4-13
4-52 Watts Mode ........................................................................................................................................................ 4-13
4-53 dBm Mode .......................................................................................................................................................... 4-13
4-54 dBr Mode ............................................................................................................................................................ 4-14
4-55 Remote (GPIB) Operation ........................................................................................................................................... 4-14
4-56 Introduction........................................................................................................................................................ 4-14
4-58 Local Operation .................................................................................................................................................4-14
4-59 Remote Operation ............................................................................................................................................. 4-14
4-60 Bus Address ....................................................................................................................................................... 4-14
4-61 Terminating Characters ................................................................................................................................... 4-14
4-62 Listen Operation ................................................................................................................................................ 4-14
4-63 Talk Operation .................................................................................................................................................. 4-14
4-65 IEEE-488 Command Support ......................................................................................................................... 4-14
4-66 Number Formatting............................................................................................................................................ 4-15
4-67 String Format ...................................................................................................................................................... 4-17
4-68 Listen Parameter Commands ............................................................................................................................ 4-17
4-70 Listen Action Commands ................................................................................................................................. 4-17
4-71 Listen Array Commands ................................................................................................................................... 4-17
4-73 Talk Modes ......................................................................................................................................................... 4-18
4-77 Talk Mode 0 (Talk Measurement Floating Point) ...................................................................................... 4-18
4-78 Talk Mode 1 (Talk Measurement With Units) ............................................................................................ 4-18
4-79 Talk Mode 2 (Talk Error) ............................................................................................................................... 4-18
ii
Page 6

4-80 Talk Mode 3 (Talk Both Channels) .............................................................................................................. 4-18
4-81 Talk Mode 4 (Talk Channel Status) ................................................................................................................ 4-19
4-82 Talk Mode 5 (Talk Instrument Status) ......................................................................................................... 4-19
4-83 Talk Mode 6 (Talk Parameter) ....................................................................................................................... 4-19
4-86 Talk Mode 7 (Talk Array) ............................................................................................................................... 4-19
4-87 IEEE-488 Bus Only Commands.................................................................................................................................. 4-20
4-88 General................................................................................................................................................................. 4-20
4-89 Talk Mode (TM) Command.............................................................................................................................. 4-20
4-90 SI Command........................................................................................................................................................ 4-20
4-94 SO Command ...................................................................................................................................................... 4-21
4-98 FI Command ......................................................................................................................................................4-21
4-102 FO Command .................................................................................................................................................... 4-21
4-107 DF Command .................................................................................................................................................... 4-22
4-108 DN Command.................................................................................................................................................... 4-22
4-109 SM (SRQ Mask) Command ........................................................................................................................... 4-22
4-110 Measured and Triggered Operation And Settled Reading ................................................................................. 4-22
4-111 General................................................................................................................................................................ 4-22
4-112 Measure Normal (MN) ................................................................................................................................... 4-23
4-113 Measure Filtered (MF) ...................................................................................................................................... 4-23
4-114 Measure Settled (MS) ....................................................................................................................................... 4-23
4-115 Measure Fast Single (MFS) ............................................................................................................................ 4-23
4-116 Measure Fast Dual (MFD) .............................................................................................................................. 4-23
4-117 Trigger Normal (TN) ....................................................................................................................................... 4-23
4-118 Trigger Filtered (TF) ........................................................................................................................................4-23
4-119 Trigger Settled (TS) ......................................................................................................................................... 4-23
4-120 Trigger Fast Single (TFS) ............................................................................................................................... 4-23
4-121 Trigger Fast Dual (TFD) ................................................................................................................................. 4-23
4-122 IEEE Programming Examples ................................................................................................................................. 4-23
4-125 Example 1........................................................................................................................................................... 4-23
4-126 Example 2........................................................................................................................................................... 4-24
4-127 Error Messages ............................................................................................................................................................ 4-24
4-129 HP Bus Emulation ...................................................................................................................................................... 4-24
4-131 Turn-on Default Conditions ............................................................................................................................ 4-24
4-132 Sending the Data Message ............................................................................................................................ 4-25
4-133 Data Output Format .......................................................................................................................................... 4-24
4-134 Sending the Require Service Message .......................................................................................................... 4-25
4-135 Service Request Mask ...................................................................................................................................... 4-25
4-136 Sending the Service Request Mask Value.................................................................................................... 4-25
4-137 Event Status Register ....................................................................................................................................... 4-25
4-138 HP Emulation Codes .......................................................................................................................................... 4-26
4-139 Remote Operation, RS-232 Interface ...................................................................................................................... 4-26
4-140 General................................................................................................................................................................ 4-26
4-141 Entering the Remote Mode ............................................................................................................................. 4-26
4-142 Returning to Local Mode................................................................................................................................. 4-26
4-143 Talk Operations .................................................................................................................................................4-26
iii
Page 7

LIST OF FIGURES
Figures Page
1-1 Model 4230A Series RF Powermeter................................................................................................................... vi
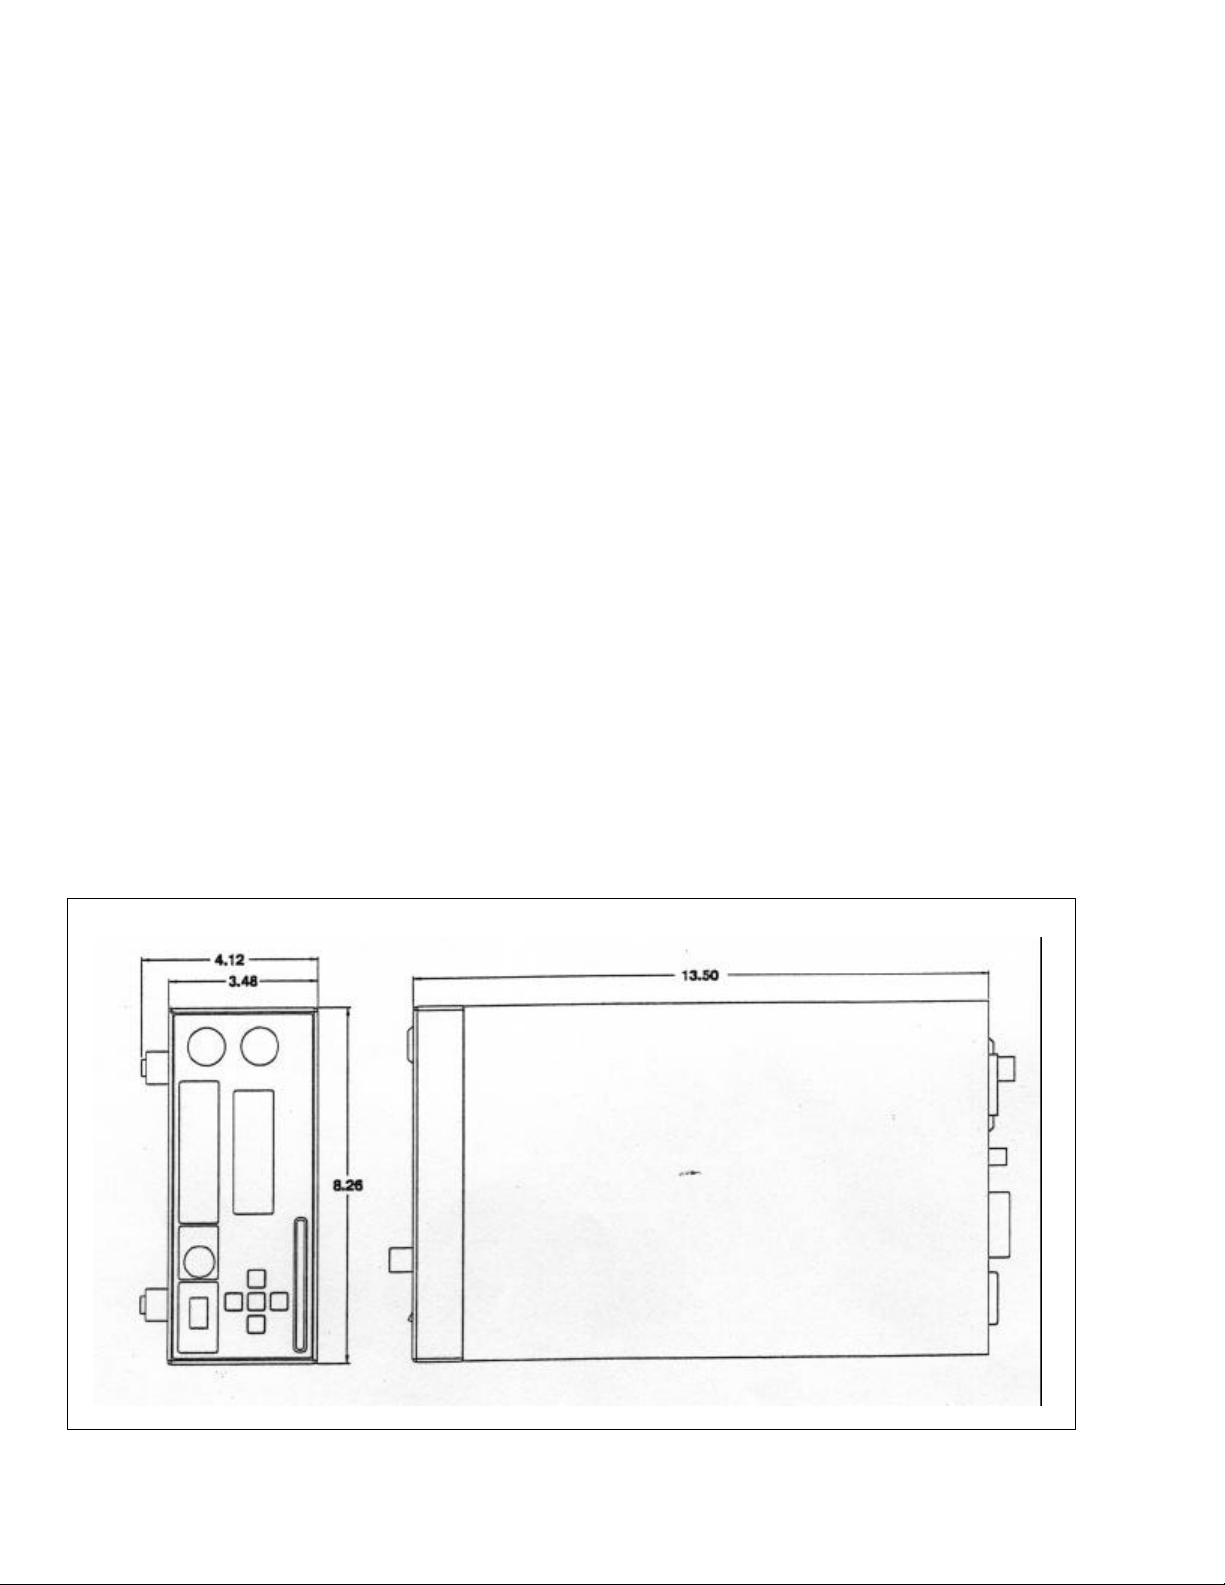
1-2 Outline Dimensions ................................................................................................................................................... 1-2
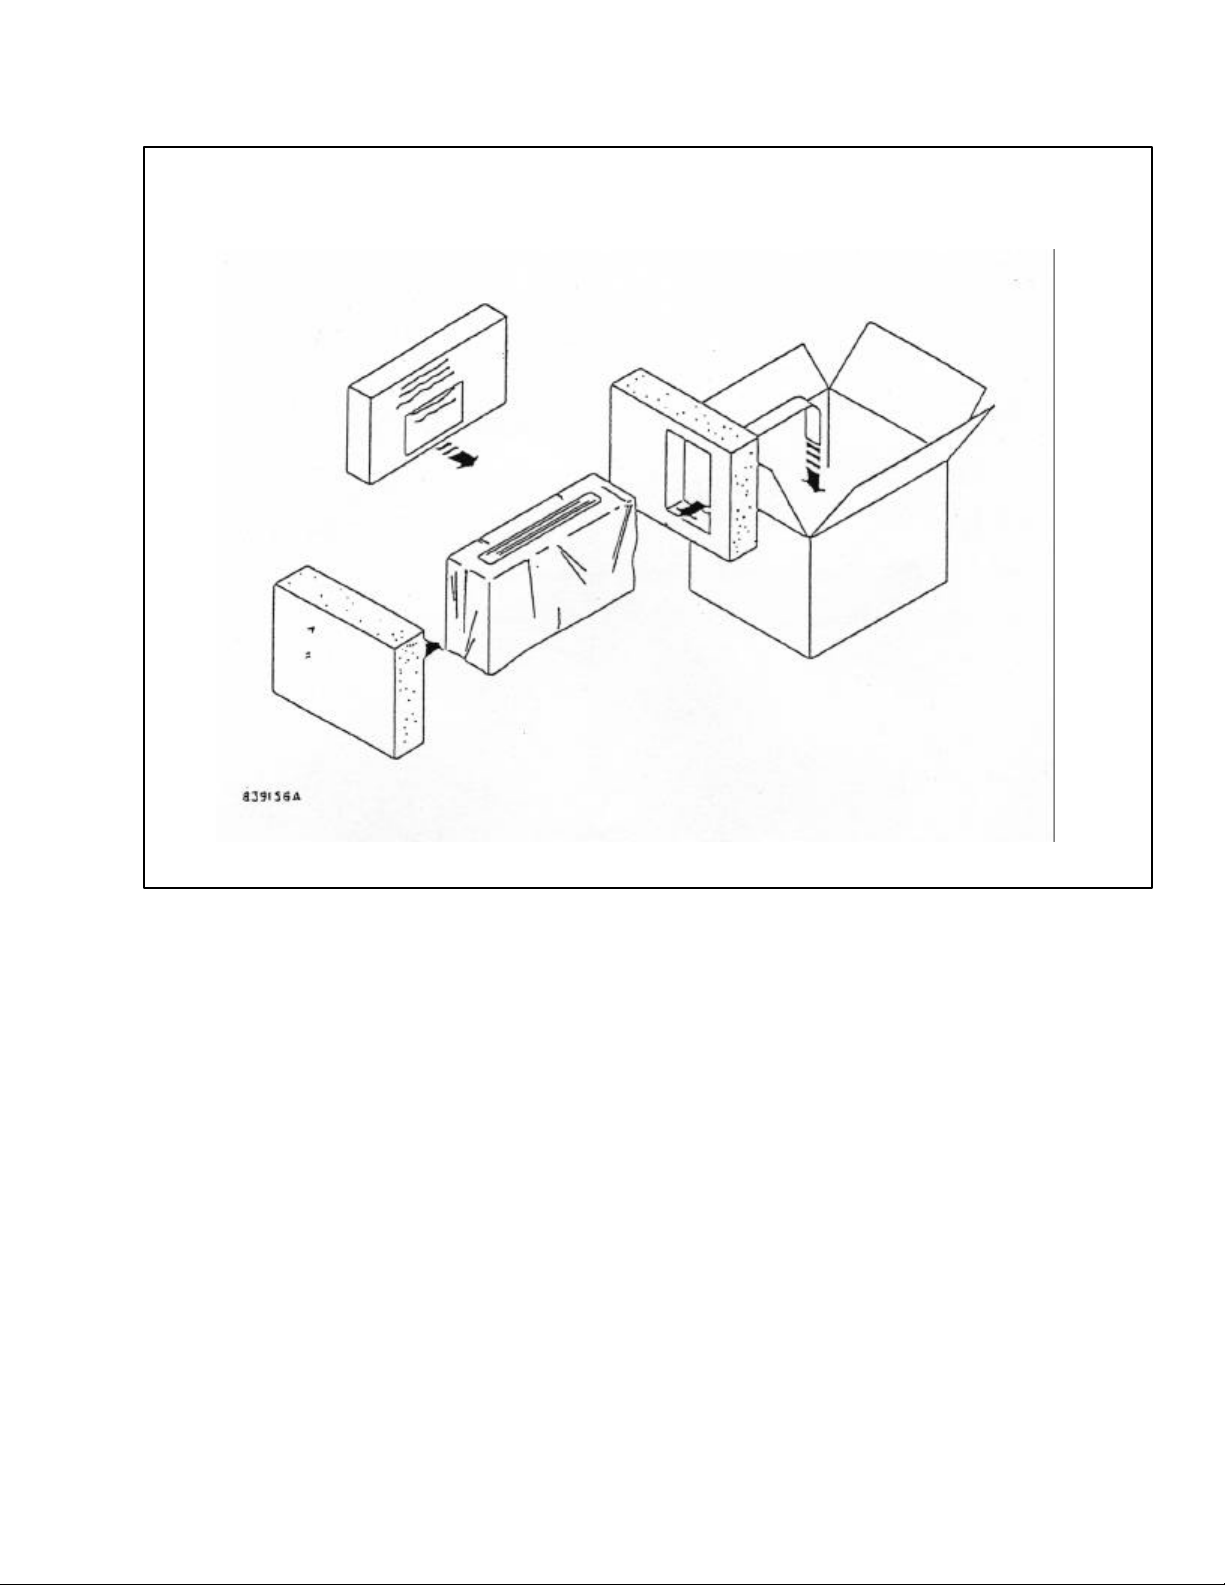
2-1 Packaging Diagram.................................................................................................................................................... 2-1
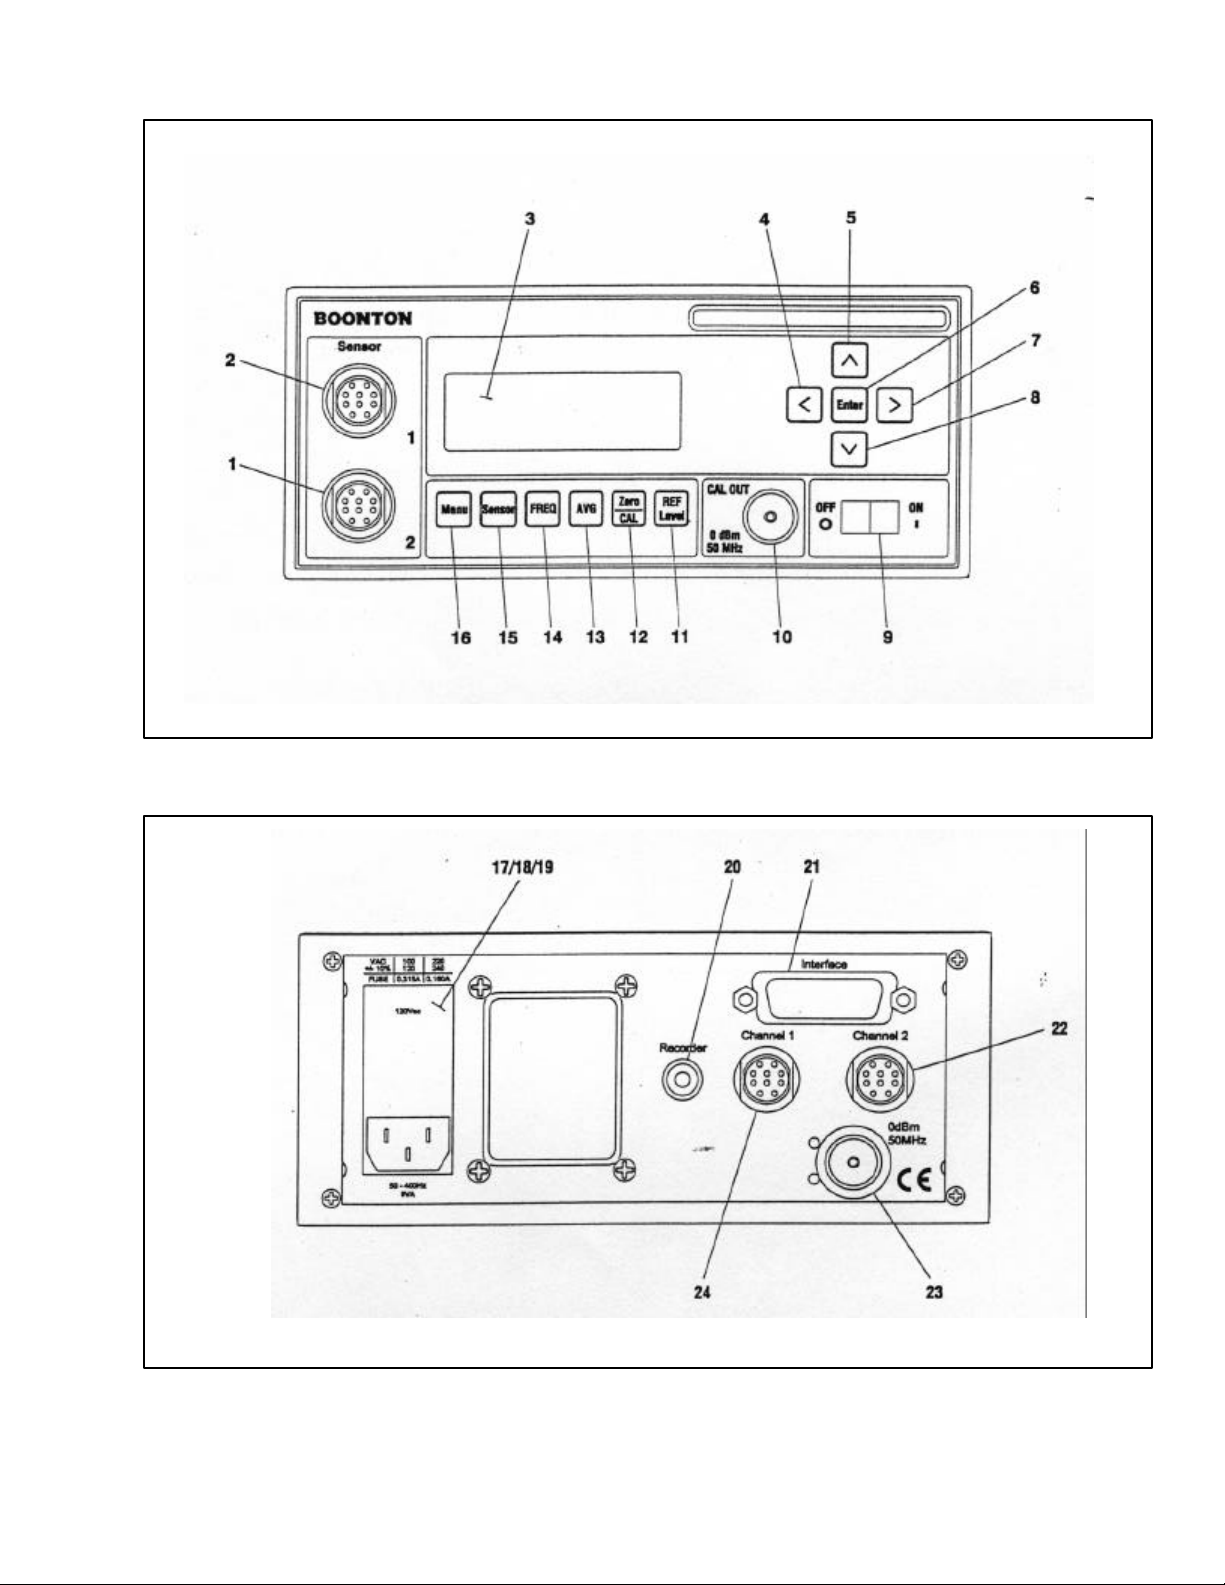
3-1 Model 4230A, Front Panel Controls and Connectors ............................................................................................ 3-3
3-2 Model 4230A, Rear Panel Controls and Connectors ............................................................................................. 3-3
3-3 Measurement Display, Local Mode ......................................................................................................................... 3-5
3-4 Measurement Display, Remote Mode...................................................................................................................... 3-5
3-5 Model 4230A, Command Set ..................................................................................................................................... 3-6
3-6 Main Menu Display .................................................................................................................................................... 3-7
3-7 Channels Menu Display............................................................................................................................................. 3-7
3-8 Setup Menu Display, IEEE Installed ........................................................................................................................ 3-9
3-9 Setup Menu Display, RS-232 Installed .................................................................................................................... 3-10
3-10 IEEE Menu Display ..................................................................................................................................................... 3-11
3-11 RS-232 Menu Display ................................................................................................................................................. 3-12
3-12 Diagnostics Menu Display ........................................................................................................................................ 3-13
3-13 Sensor Display Menu ................................................................................................................................................. 3-13
3-14 Access Code ............................................................................................................................................................... 3-14
3-15 Edit Data Menu Display ............................................................................................................................................. 3-14
3-16 Cal Factor Menu Display ........................................................................................................................................... 3-14
3-17 Calibration Data Example ............................................................................................................................................ 3-16
3-18 Save Display ................................................................................................................................................................ 3-17
3-19 Frequency Display ...................................................................................................................................................... 3-17
3-20 Averaging Time Display ............................................................................................................................................ 3-17
3-21 Zero and Calibration Display..................................................................................................................................... 3-17
3-22 Reference Level Display............................................................................................................................................. 3-17
4-1 14-Point Sensor Calibration ..................................................................................................................................... 4-2
4-2 Diode Sensor Decay ................................................................................................................................................... 4-2
4-3 Thermal Sensor Decay ............................................................................................................................................... 4-3
4-4 Extended Hold Range Mode..................................................................................................................................... 4-4
4-5 Noise Reduction .......................................................................................................................................................... 4-6
4-6 Typical Error Band Specifications .......................................................................................................................... 4-7
4-7 Probability of Falling within an Error Band ......................................................................................................... 4-7
4-8 Confidence Curves, 51013 Sensor with 2.8 Second Filter ................................................................................. 4-8
4-9 Confidence Curves, 51013 Sensor with 10 Second Filter .................................................................................. 4-9
4-10 Integration of Power ................................................................................................................................................... 4-10
4-11 Fast Mode Sampling Rate ......................................................................................................................................... 4-11
4-12 Mismatch Uncertainties Chart ................................................................................................................................. 4-12
4-13 Error Due to AM Modulation (51013 Diode Sensor) ...................................................................................... 4-13
iv
Page 8

LIST OF TABLES
Table Page
1-1 Performance Specifications ................................................................................................................................... 1-3
3-1 Operating Controls, Indicators, and Connectors .............................................................................................. 3-1
3-2 Channel Menu Functions .......................................................................................................................................... 3-8
3-3 Setup Menu Functions .............................................................................................................................................. 3-10
3-4 IEEE Menu Functions ................................................................................................................................................ 3-11
3-5 RS-232 Menu Functions ............................................................................................................................................ 3-12
3-6 Diagnostics Menu Functions ................................................................................................................................... 3-13
3-7 Edit Data Menu Functions ........................................................................................................................................ 3-15
3-8 Sensor Calibration Menu Functions ........................................................................................................................ 3-16
3-9 Reference Level Menu Functions ............................................................................................................................ 3-18
4-1 Listen Parameter Commands ................................................................................................................................... 4-15
4-2 Listen Action Commands ......................................................................................................................................... 4-16
4-3 Listen Array Parameter Commands........................................................................................................................ 4-17
4-4 Talk Array Commands ..............................................................................................................................................4-17
4-5 Talk Modes .................................................................................................................................................................. 4-17
4-6 Error Messages ........................................................................................................................................................... 4-20
4-7 SRQ Masks .................................................................................................................................................................. 4-22
4-8 Status Byte and Service Request Mask................................................................................................................... 4-25
4-9 Event Status Register................................................................................................................................................. 4-25
4-10 HP 437B Emulation GPIB Commands .................................................................................................................. 4-27
4-11 HP 438A Emulation GPIB Commands.................................................................................................................. 4-30
4-12 Boonton 4230A GPIB Commands............................................................................................................................. 4-32
v
Page 9
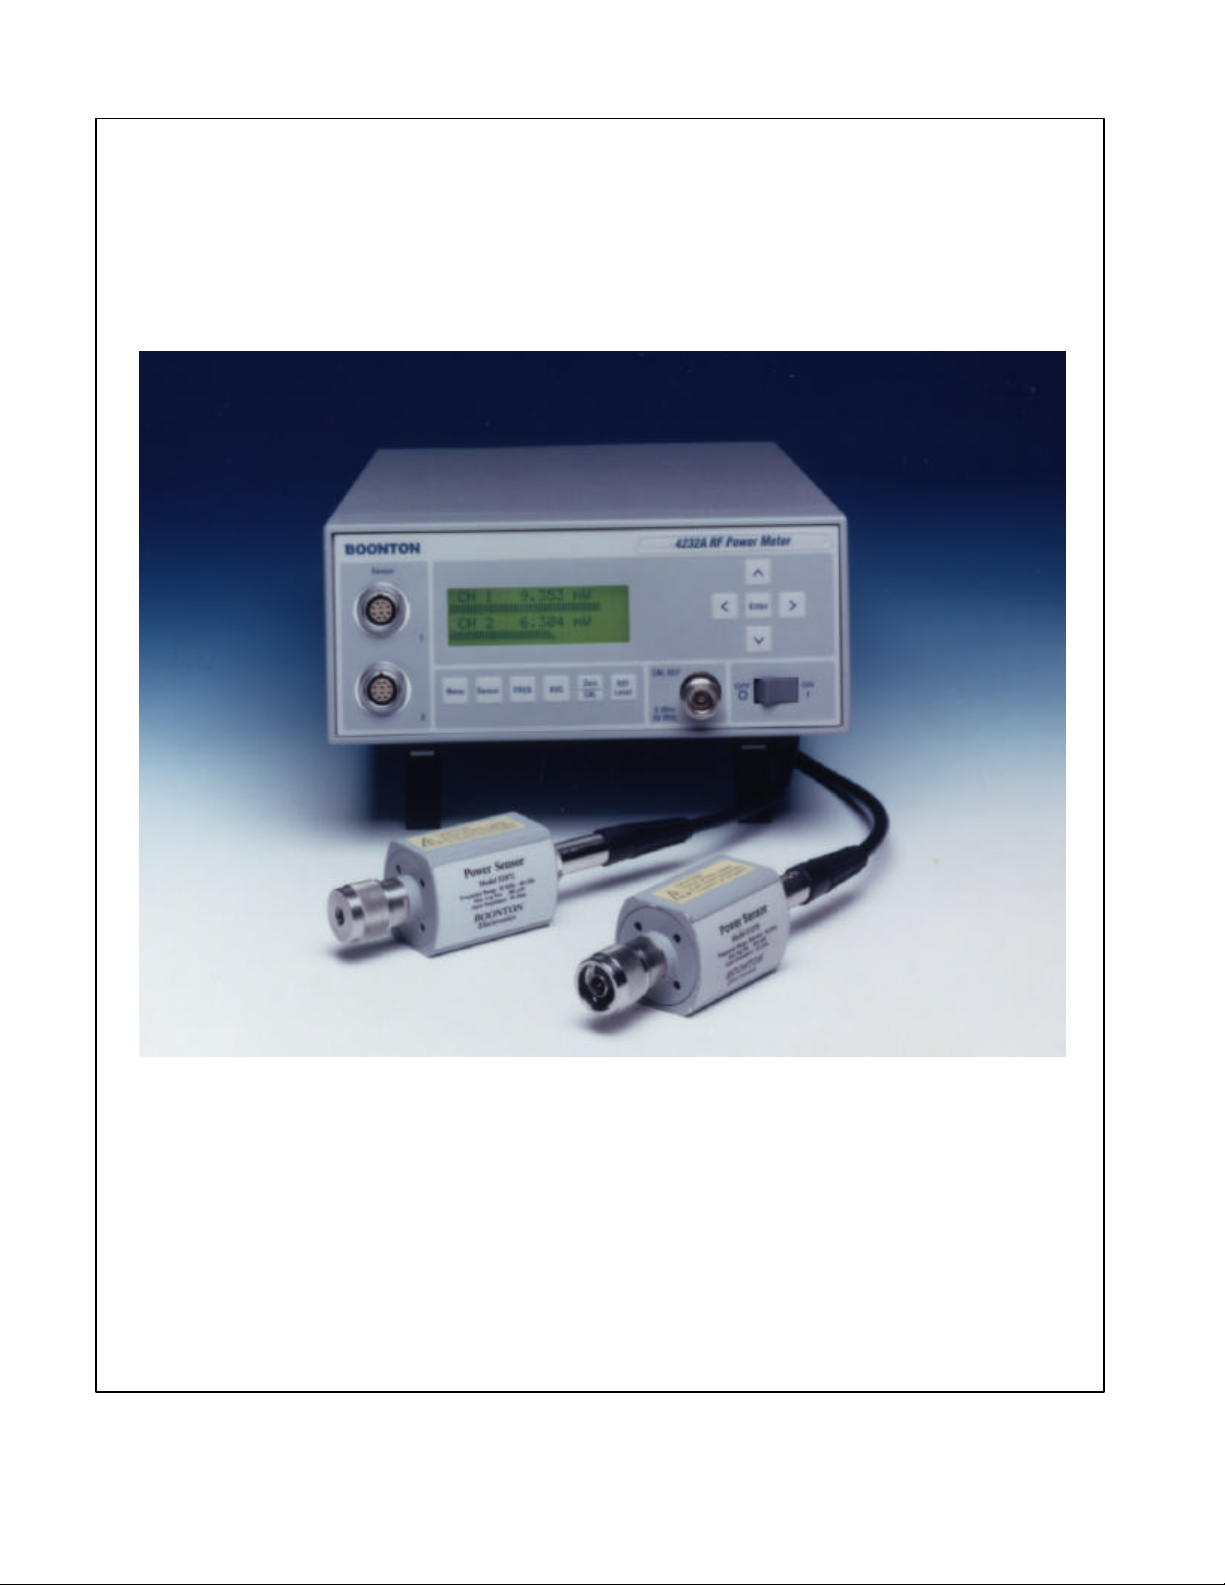
Figure 1-1. Model 4230A Series RF Powermeter
vi
Page 10

SECTION I
GENERAL INFORMATION
Section I
General Information
1-1. INTRODUCTION.
1-2. This instruction manual provides general information,
installation and operating instructions, and application notes
for the Model 4230A Series of RF power meters. This series
includes Model 4231A with a single measurement channel and
Model 4232A with two measurement channels. The terms
Model 4230A and 4230A used throughout this publication
refer to both models unless otherwise noted. See Figures 1-1
and 1-2.
1-3. DESCRIPTION.
1-4. The Model 4230A Series is a DSP (digital signal processor)
based family of single or dual channel, solid state RF power
meters. They are capable of measuring RF power levels from
-70 dBm to +44 dBm. The RF frequency range and power level
range are sensor dependent. Boonton 51000 series sensors
provide measurement capabilities for frequencies from 10 kHz
to 100 GHz.
1-5. FEATURES.
1-6. Power Sensors. A wide range of diode and thermocouple
power sensors for both coaxial and waveguide applications are
available for use with the Model 4230A. Sensor data adapters
are supplied with the Model 4230A, however, the power sensor
must be ordered separately.
1-7. Diode sensors measure the voltage across a precision
resistor, using specially selected diodes. Detection is square
law (true RMS) over approximately the lower two-thirds of the
sensor's dynamic range, and peak detecting over the upper
portion. Because the instrument is calibrated for sine waves
over the entire range, measurements at the top one-third of the
sensor's dynamic range are valid only for non-modulated
signals. In the RMS region, linearity is excellent, and any signal
type can be measured. The diode range has been extended into
the peak detecting region with the use of real time shaping for
the diode curve. When coupled with the high sensitivity of the
diode, such shaping allows a dynamic range of 90 dB. Diode
sensors are rugged and have an overload headroom of more
than 5 dB for continuous signals. The dynamic range in the
RMS region can be extended further through use of an external
attenuator.
1-8. Thermal sensors measure the voltage developed across
a dissimilar metal junction caused by the thermal gradient
generated by the RF power being measured. Because these
sensors are heat detecting, they provide true RMS response
over their entire range. Very high peak powers (15 to 30 watts)
can be accommodated for very short duty cycles and still
provide valid results. The dynamic range is 50 dB. Thermal
sensors are not as sensitive as diode sensors.
1-9. The sensor data adapter contains non-volatile memory for
storage of the calibration data. In addition, calibration data for
up to four sensors can be stored in the instrument's nonvolatile memory. The user can enter both the linearity and high
frequency sensor calibration correction data which are
supplied with each sensor. For sensors ordered with the Model
4230A, the calibration data is loaded into the sensor data
adapter prior to shipment. When the frequency of the RF signal
to be measured by one of these sensors is entered, the
instrument looks up the appropriate calibration factors,
interpolates as necessary, and automatically applies the
correction to the measured value. Calibration factors for
sensors ordered with the instrument are stored in the plastic
pouch attached to the inside of the instrument's top cover.
1-10. Simple Instrument Setup and Operation. In the
operating mode the functions: Frequency, Averaging Time,
Reference Level, Zeroing/Calibration are selected with a single
keystroke. Values for these parameters are displayed and can
be adjusted by using the arrow and enter keys. Additional
operating parameters can be modified through the menu driven
structure accessible via the <Menu> and <Sensor> keys.
1-11. Alphanumeric Display. The alphanumeric LCD
provides clear, unambiguous readouts of the instrument's
setup and measurement values. Simultaneous display of both
channels is available in dual channel mode. A bar graph
provides a display of the channel's measured value for nulling
and peaking applications.
1-12. Selectable Ranging. Any of seven measurement ranges,
or autoranging, can be selected during instrument setup. The
selection will be held until it is changed, or until the instrument
is turned off. When measuring signals with levels that fall
within a narrow range, selecting one specific instrument range
may reduce measurement time. Autoranging is useful if the RF
signal level is unknown, or if RF signals with widely varying
levels are to be measured.
1-13. Selectable Filtering. Measurement speed and display
stability can be optimized through the use of selectable
filtering. Filter times can be adjusted up to 20 seconds maximum
in 50 millisecond increments.
1-14. Zeroing. Automatic zeroing (nulling of offsets for the
1-1
Page 11
Section I
General Information
sensor and input channel) is done independently on each
range to eliminate zero carryovers.
1-15. Built-In Precision Calibrator. A built-in 50 MHz
calibrator provides an accurate, stable, and convenient power
source for calibration of the instrument to specified tolerances.
The calibrator may be toggled on or off from the Setup menu.
The connector is normally mounted for front panel access,
however option-02 changes this to rear panel access.
1-16. Chart Recorder Output. A 0 to 10 volt dc output,
proportional to the measurement values, is available for
application to a chart recorder.
1-17. Optional Interface. A RS-232 option enables full service
remote control of the Model 4230A. All instrument controls
and values, except power on and off, are accessible to a bus
controller in the remote operating mode.
1-18. ACCESSORIES.
1-19. A sensor data adapter, Model 95109001A, for each
installed channel and an AC line cord are supplied with each
instrument. One or more Boonton 51000 series power sensors
are required. The power sensors are not supplied as part of the
instrument, but must be ordered separately. A five-foot power
sensor cable, Model 41-2A, is supplied with each sensor
ordered. Additional available accessories include the
following:
a. Model 41-2A/10 Sensor/Probe Interconnecting Cable
(10 ft)
b. Model 41-2A/20 Sensor/Probe Interconnecting Cable
(20 ft)
c. Model 41-2A/50 Sensor/Probe Interconnecting Cable
(50 ft)
d. Model 41-2A/100 Sensor/Probe Interconnecting Cable
(100 ft)
e. Model 95004701A F/F Adapter, 41-2A (for connecting
Model 41-2A cables end to end)
f. Model 95004901A Bulkhead Connector F/F, 41-2A (for
connecting Model 41-2A cables end to end)
g. Model 95403001A Rack Mounting Kit
h. Model 95109001A Additional Sensor Data Adapters
1-20. OPTIONS.
1-21. Option-01. Input connectors moved to rear panel.
1-22. Option-02. Calibrator type N connector moved to rear
panel.
1-23. Option-03. Replaces the IEEE-488 Interface with a RS-
232 Interface. The baud rate, data size, stop and parity bits are
programmable.
1-24. Option-30. Warranty extended to 3 years.
1-25. SPECIFICATIONS. Performance specifications of the
Model 4230A are listed in Table 1-1.
1-2
Figure 1-2. Outline Dimensions.
Page 12

Section I
TABLE 1-1. PERFORMANCE SPECIFICATIONS
Parameter Specification
Frequency Range 10 kHz to 100 GHz, sensor dependent
Power Range -70 dBm to +44 dBm, sensor dependent
Power Sensors Accepts sensor data adapter and is compatible with all Boonton diode and
thermal sensors
Dynamic Range Up to 90 dB with diode sensors; up to 50 dB with thermal sensors
Inputs Front or Rear panel sensor connector; rear panel IEEE-488 connector or
optional RS-232 connector
Outputs Front panel or optional Rear panel PWR REF connector, 50 MHz, 0 dBm;
rear panel recorder BNC connector, 9.06 kilohm impedance, 0 to 10 volts
into 1 megohm (may be operated into 1 kilohm for 1V fs).
Display Menu-driven 20 character x 4 line LCD
Display Units MW, kW, W, mW, µW, nW, dBm, dBr, %
Display Resolution 0.001 (db,dBm, dBr) or 5 digits (nW, mW and W)
Display Offset -99.99 dB to +99.99 dB in 0.01 dB steps
Alarm Individual high and low limit thresholds, -99.99 dB to +99.99 dB
Peak Power Mode Programmable duty cycle from 0.01 to 100.00% in 0.01 steps
Ranging Autoranging or manual (7 ranges)
Filtering Filter times to 20.00 seconds in 0.05 second increments
Zeroing Automatic function; calculates, stores, and applies zero corrections to each
range
High Frequency Cal Factors +3 dB to -3 dB in 0.01 dB steps; cal factors for up to four power sensors
with up to 60 frequencies each may be stored in the instrument's non-
volatile memory; cal factors also stored in sensor data adapter
Reference Level -99.99 dB to +99.99 dB in 0.01 dB steps for dBr measurements
Power Reference:
Frequency 50 MHz + 1.5%
Output Level 0 dBm
Level Accuracy +0.7% (+0.03 dB) (23 degrees C) for 90 days; +0.9% (+0.04 dB) RSS,
+1.2% (+0.05 dB) worst case (0 to 55 degrees C) for 1 year
Source Impedance 50 +1 ohm
VSWR < 1.05
Harmonic Output < -50 dBc
Measurement Accuracy Sum of following uncertainties (errors are + worst case): instrument
uncertainty, noise/signal percentage, power reference uncertainty, sensor
shaping, temperature drift, mismatch, and high frequency calibration factors
Instrument Uncertainty .002% at full scale
Noise/signal Percentage Refer to Power Sensor Manual, Table 2-1
Power Reference Uncertainty Refer to Table 1-1 Power Reference: Level Accuracy and for Waveguide
sensors, refer to Power Sensor Manual, Table 2-2 Note 2
Sensor Shaping Refer to Power Sensor Manual, Tables 3-1 and 3-2
Temperature Drift Refer to Power Sensor Manual, Table 2-1
Power Requirements 100, 120, 220, or 240 VAC (±10%), 50-60 Hz or 400 Hz, 15 VA maximum
Ventilation Requirements 1 1/2" clearance after installation, top, side, rear
Temperature
Operating 0 to 55ºC
Non-operating -40 - +75ºC
General Information
1-3
Page 13

Section I
General Information
TABLE 1-1. PERFORMANCE SPECIFICATIONS (CONT.)
Parameter Specification
Altitude
Operating 10,000 ft.
CE Mark: Declares conformity to European Community (EC) Council Directives:
89/336/EEC//93/68/EEC, 73/23/EEC//93/68/
EEC & Standards: EN61326-1, EN55022, EN61000-4/ -2,3,4,5,6,11, ENG1010-1
Humidity 95% non-condensing
Weight 7 lb (3.2 kg)
Dimensions 8.26 in. (21.0 cm) wide 3.48 in. (8.9 cm) high, 13.5 in (34.3 cm) deep
1-4
Page 14

SECTION II
Section II
INSTALLATION
Installation
2-1. INTRODUCTION.
This section contains the installation instructions for the
Model 4230A Series RF Power Meter. It includes unpacking, mounting, power connections, cable connections and
priliminary checkout procedures.
2-2. UNPACKING. The instrument is shipped complete and
ready to use upon receipt. Unpack the instrument from its
shipping container and inspect it for damage that may have
occurred during shipment. Refer to figure 2-1.
NOTE
Save the packing material and container
for possible use in re-shipment of the
instrument.
2-3. MOUNTING. For bench use, choose a clean, dry and
uncluttered surface. For rack mounting, an accessory kit is
available which contains the necessary parts for mounting a
single half-width Model 4230A or two side-by-side halfwidth Model 4230A's (or a compatible product) in a single
19 inch rack.
2-4. POWER REQUIREMENTS. The Model 4230A has
a tapped transformer and a power entry module containing a
line voltage selector switch and two fuses. Operation is permitted from 100, 120, 220 and 240 Volt +-10%, 50 to 60
Hz, single phase AC power supplies.
CAUTION
so that when it is re-inserted into the module, the
desired voltage will appear in the small window in
the cover.
4. To remove the fuses, move the fuseholder tabs in
the direction of the arrow and pull the holder out.
Place a new fuse in the holder and put it back in the
slot, restoring the tab to its original position.
5. After all changes are completed, close the cover.
Make sure the alignment of the selector cylinder and
window is correct and that the cover snaps into place.
VOLTAGE FUSE IEC TYPE
100/120V 0.315A T
220/240V 0.160A T
2-5. CONNECTIONS. An AC power cable is supplied with
the instrument and a standard interconnecting cable or cable/
adapter combination is supplied with each RF Sensor. Longer
RF Sensor cables are available as accessories. All other
cables required must be supplied by the user.
2-6. Sensor. Connect the RF Sensor that is to be used for
measurement to the cable or Data Adapter-Cable combo supplied with the sensor. If the Data Adapter is a separate item,
also connect the cable to the adapter. Make sure that the
serial number on the Data Adapter matches the serial number
of the RF Sensor. Insert the 10-pin adapter plug into one of
the two sensor inputs. For Model 4231, only Sensor input
number 1 is active.
Always make cerain that the setting of the line voltage selector switch most nearly corresponds to the voltage of the AC
power source, and that fuses of the correct rating according
to the chart just above the power entry module, are installed.
To change the line voltage selector switch or the fuses, follow
this procedure:
1. REMOVE the power cable from the power entry
module.
2. To open the power entry module, place a small
screwdriver or coin in the slot at the top of the module and gently pry the cover open.
3. Using a small screwdriver gently pry the voltage
selector cylinder from the module. Turn the cylinder
2-7. Recorder. A data recorder or other similar device can
be connected to the Recorder BNC connector on the rear
panel. The output is a DC voltage proportional to the Channel 1 display value. The voltage range is 0 to 10 volts with an
output impedance of approximately 9 kohms.
2-8. GPIB. The standard instrument is equipped with an
IEEE-488 bus interface for remote operation. The connector is
located on the rear panel.
2-9. RS-232. The optional RS-232 interface can be supplied
in place of the standard IEEE-488 interface. This interface
also provides remote operation using the same command
strings. The DB-25 connector is located on the rear panel.
2-1
Page 15

Section II
Installation
2-10. PRELIMINARY CHECK.
2-11. The following preliminary check verifies that the
Model 4230A is operational. It should be performed before
the instrument is placed in service. Proceed as follows:
a. Ensure that the voltage selector switch and fuses correspond to the AC power source voltage to be used.
b. Connect the AC power cable to the instrument and to the
power source.
c. Connect one or two RF Sensors to the instrument as described above.
d. Set the front panel OFF/ON power switch to the ON position..
e. Verify that BOONTON ELECTRONICS
423XA RF POWER METER
Rev. X.XX
is momentarily displayed.
f. Verify that the measurement display showing "CH 1" only
for Model 4231 or "CH 1" and "CH 2" for Model 4232. Other
data on the display will depend upon previous settings.
g. Press the <MENU> key and select DIAGNOSTICS with the
down arrow key. Press <ENTER>. Verify the following submenu:
DIAGNOSTICS
RTN
SELFTEST <
SWITCHES
RECORDER
j. Use the <Down Arrow> key to select RECORDER and
press <ENTER>. This test will sequentially send a DC voltage in 1 volt steps to the recorder output BNC connector on
the rear panel. The test will continue until <MENU> is pressed.
Use a DC voltmeter to verify correct operation.
k. Press <MENU> to return to the measurement display.
l. Press the <Sensor> key and verify that the RF Sensor
serial number(s) appear under the channel heading(s). An
active channel with no sensor installed will report a table
number.
m. Press the <AVG> key and verify that the filter time and
number of samples appear for each active channel.
n. Press the <REF Level> key and verify that a reference level
and mode is shown for each active channel.
o. With each installed sensor connected to the reference
output, press the <ZERO/CAL> key and select ZERO/CAL
function for the active channel. Verify the ZERO/CAL operation completes successfully. Repeat this operation for
the other channel if installed.
p. For standard instruments equipped with the IEEE-488 interface, connect a GPIB controller to the Model 4230A.
Verify that the instrument can be addressed to Listen at its
IEEE bus address, and set to Remote. The display must show
the correct status on the bottom line of the display. For
message passing, the line terminators for the controller and
the Model 4230A must be compatible for both Listen and
Talk. Use <MAIN> <SETUP> <IEEE> to set address and
terminators for the 4230A. Address the Model 4230A to
Listen/Remote and send the command "?ID" or "*IDN?" EOL.
Then address the Model 4230A to Talk (controller to listen)
and verify that the correct identification string is returned.
h. Press <ENTER> to execute the selftest. The items tested
are:
1. Processor
2. SRAM Memory
3. EEPROM
Each test will display the OK message it it passed. When the
test is completed the menu will reappear.
i. Use the <Down Arrow> key to move the "<" cursor to
SWITCHES and press <ENTER>. Press each front panel key,
avoiding <MENU> until last. Each key press will result in an
identifying message; <MENU> will exit the test and return to
the MENU.
2-2
q. For instruments equipped with the optional RS-232 interface, connect a dumb terminal or PC serial terminal to the
Model 4230A. Use a null modem if the terminal is wired as
DCE. For message communication to take place, the parameters of the serial connection and message strings must
agree between the terminal and the Model 4230A. Use
<MAIN> <SETUP> <RS-232> to set parameters for the
4230A. Send the command "?ID" or "*IDN?" EOL and verify
that the correct identification string is returned.
Page 16
Section II
Installation
Figure 2-1. Packing and Unpacking Diagram
2-3
Page 17

SECTION III
OPERATION
Section III
Operation
3-1. INTRODUCTION.
3-2. This section contains operating instructions for the
Model 4230A. It is strongly recommended that the operator
become familiar with all the material in this section and with
the application notes in Section IV before attempting to
operate the instrument; otherwise, the full capabilities of the
instrument may not be realized.
3-3. OPERATING CONTROLS, INDICATORS, AND
CONNECTORS.
3-4. See Figures 3-1 and 3-2 for the location of the operating
controls and connectors. Refer to Table 3-1 for the function
of each of these items.
3-5. OPERATING THE INSTRUMENT.
3-6. Energize the instrument by setting the POWER switch
to the ON position. The instrument will perform a self test
routine and initialize the operating parameters to the powerup values.
TABLE 3-1. OPERATING CONTROLS, INDICATORS, AND CONNECTORS
Index and
Fig. No. Nomenclature Function
3-7. MEASUREMENT DISPLAY.
3-8. The measurement screen shown in Figure 3-3 can be
configured to display one or two channels along with the
corresponding bar graph. In alarm mode, the ∧ and the ∨
symbols are displayed before the channel mode to indicate
that the measured value is above or below the defined limits.
An asterisk is displayed before the channel mode when in the
manual range mode and the measured value is below the
lower range limit indicating an uncalibrated measurement.
The alarm indicators have precedence over the range limit
display. In peak pulse mode, the
the measurement unit. The ∆ symbol is displayed when the
measurement is associated with an offset. When the
instrument is configured for remote operations over the
IEEE-488 or RS-232 bus, the last line, as shown in Figure 34, is always used for the bus indicators.
3-9. MENU STRUCTURE.
P
symbol is displayed after
K
1, 3-1 Sensor Connector, Channel 2 Provides the means for connecting the power sensor to channel 2
of the instrument.
2 , 3-1 Sensor Connector, Channel 1 Provides the means for connecting the power sensor to channel 1
of the instrument.
3 , 3-1 Display LCD readout of the measurements and user interface for editing
of the instrument's operating parameters.
4 , 3-1 Left Arrow Key In entry mode, advances the cursor to the left.
5 , 3-1 Up Arrow Key In entry mode, advances the cursor upwards. In parameter entry
mode, scrolls forward through the parameter list. In numerical
entry mode, advances the value to the next higher digit.
6 , 3-1 Enter Key In entry mode, initiates the procedure to change a parameter. In
parameter entry mode, terminates the current command and
changes the parameter to the last displayed value.
7 , 3-1 Right Arrow Key In entry mode, advances the cursor to the right.
8 , 3-1 Down Arrow Key In entry mode, advances the cursor downwards. In parameter
entry mode, scrolls backwards through the parameter list. In
numerical entry mode, advances the value to the next lower digit.
9 , 3-1 Power Switch Turns the instrument off and on.
10, 3-1 0 dBm 50 MHz Connector Provides a 50 MHz, 0 dBm output for instrument calibration.
When the calibrator is off, the connector serves as a 50 Ω
termination to zero the instrument.
3-1
Page 18

Section III
Operation
Index and
Fig. No. Nomenclature Function
11, 3-1 <REF Level> Key Selects the reference level menu for relative measurements.
12, 3-1 <Zero/CAL> Key Selects the zeroing and 0 dBm reference level calibration
13, 3-1 <AVG> Key Selects the filter averaging display for the measurement value.
14, 3-1 <FREQ> Key Selects the operating frequency display.
15, 3-1 <Sensor> Key Displays the serial number of the installed sensors and allows
16, 3-1 <Menu> Key Displays and allows editing of the instrument's operating
17, 3-2 Power Receptacle Provides means for connecting the AC power cord to the
18, 3-2 Fuse Protects the power circuits from overload.
19, 3-2 Voltage Selector Switches Switches the power circuits of the instrument to accommodate
20, 3-2 Recorder Connector Provides a DC voltage proportional to the measured values
21, 3-2 GPIB Connector Provides means for connecting the instrument to the IEEE-
22, 3-2 Optional Location of Provides the means of connecting the power sensor to
23, 3-2 Optional Location of Provides 50 MHz, 0 dBm output for instrument calibration.
24, 3-2 Optional Location of Provides the means of connecting the power sensor to
TABLE 3-1. OPERATING CONTROLS, INDICATORS, AND CONNECTORS (CONT)
functions.
for editing of the sensor parameters.
parameters. Returns instrument to local mode when operating
in the bus remote mode. Escapes back to measurement screen
from any menu.
instrument.
100, 120, 220 or 240 volt AC power sources.
for use by an external recorder
or RS-232 Connector 488 or RS-232 bus for remote control
Sensor Connector, Channel 2 channel 2 of the instrument.
0 dBm 50 MHz Connector
Sensor Connector, Channel 1 channel 1 of the instrument.
3-2
Page 19
Section III
Operation
Figure 3-1. Model 4230A, Front Panel Controls and Connectors
Figure 3-2. Model 4230A, Rear Panel Controls and Connectors
3-3
Page 20

Section III
Operation
3-10. The Model 4230A can be configured for operation via the
six switches on the front panel; <Menu>, <Sensor>,
<FREQ>, <AVG>, <Zero/CAL> and <REF Level>.
Pressing a key will bring the instrument to the next submenu.
A flow chart of the instrument's command structure is shown
in Figure 3-5. The <Menu> key also serves as an ESCAPE
key to cancel the current operation from any point and return
to the measurement screen.
3-11. To change a value, use the arrow keys to position the
cursor to the desired parameter. Press the <Enter> key and
then use the up/down arrow keys to scroll through the
parameter list. When a number is to be entered, use the left/
right arrow keys to position the cursor under the number that
is to be changed, then use the up/down arrow keys to
increment/decrement the number. Holding the up/down
arrow key will initiate repeat mode to allow rapid movement
through the selections. The <Enter> key must be pressed to
accept the current selection.
3-12. Within a submenu, the ∧∨ indicators are displayed in
the upper right portion of the display when the current screen
has additional information that can be obtained by scrolling
with the up/down arrow keys. Three conditions are possible:
a.∧ Use the up arrow key to scroll the screen upward for
additional information.
b.∨ Use the down arrow key to scroll the screen downward
for additional information.
c.∧∨ Use the up/down arrow keys to scroll the screen
upward/downward for additional information.
3-4
Page 21

DUAL CHANNEL
Section III
Operation
Key:
L M M M M M ± D D D D D D U U U
( B A R G R A P H )
L M M M M M ± D D D D D D U U U
( B A R G R A P H )
SINGLE CHANNEL
L M M M M M ± D D D D D D U U U
( B A R G R A P H )
O = 0 through 9 or a decimal point
L = ∧ , ∨, (alarm mode), * (range hold-low)
MMMMM = CH1, CH2, CH1+2, CH1/2
UUU = nW, µW, mW, kW, MW, dBm, dBr, %
P
∆
K
P
∆
K
P
∆
K
Key:
Figure 3-3. Measurement Display, Local Mode
L M M M M M ± D D D D D D U U U
( B A R G R A P H )
L M M M M M ± D D D D D D U U U
R E M L S N T L K S R Q
REM = Remote mode enabled
LSN = Listen addressed
TLK = Talker addressed
SRQ = Service request activated
Figure 3-4. Measurement Display, Remote Mode
P
∆
K
P
∆
K
3-5
Page 22

Section III
Operation
3-6
Figure 3-5. Model 4230A, Command Set
Page 23

3-13. MENU Key.
3-14. The instrument's, CHANNELS, SETUP and
DIAGNOSTIC commands are accessed when the <Menu>
key is pressed.
3-15. Using the up/down arrow keys, the cursor can be
positioned to select from the three submenus.
3-16. Channel Menu. An example of the display for the
Channels menu, when two channels are installed in the
Model 4230A, is shown in Figure 3-7. Although the figure
shows eleven lines, the instrument can only display four at a
time. Therefore, it will be necessary to use the up/down arrow
keys to sequence through the commands. When viewing the
commands, the instrument will retain the first line as a header
and use the next three lines to scroll through the remaining
commands.
C H A N N E L S <
S E T U P
Section III
Operation
3-17. Table 3-2 gives a description of the commands
available from the Channels menu. The associated
parameters, and factory default settings are also given.
3-18. Setup Menu. An example of the display for the Setup
menu, when the Model 4230A is configured with an IEEE
interface, is shown in Figure 3-8. Figure 3-9 is an example
of the instrument when equipped with the RS-232 option. It
will be necessary to use the up/down arrow keys to sequence
through the commands since there are more than four lines of
information to be displayed. When sequencing through the
commands, the instrument will retain the first line as a header
and use the next three lines to scroll through the command
list.
D I A G N O S T I C S
Figure 3-6. Main Menu Display
R T N C H 1 C H 2 ∨ ∧
U N I T S > W A T T S d B m
R E S X X X X X . X X
D U T Y 1 0 0 . 0 0 1 0 0 . 0 0
B A R O F F O N
M O D E C H 2
O F F S E T 0 . 0 0 1 0 . 0 0
R A N G E A U T O 4
A L A R M O N O F F
H I L M T 1 0 . 0 0 0 . 0 0
L O L M T 1 . 0 0 0 . 0 0
Figure 3-7. Channels Menu Display
3-7
Page 24

Section III
Operation
TABLE 3-2. CHANNEL MENU FUNCTIONS
Function Description Parameters Default
RTN Returns the instrument to the n/a n/a
previous menu.
UNITS Units used for measurement dBm, WATTS dBm
display.
RES Display resolution X.X, X.XX, X.XXX dBm or/ X.XX
XXX, XXXX, XXXXX Watts
DUTY Duty cycle for pulse power 0.01 to 100.00% 100.00
applications; a value less than
100.00 enables pulse power
mode.
BAR Enables the bar graph on the ON, OFF ON
measurement display.
MODE Sets the display mode for CH2, CH1+2, CH1/2, CH2
channel 2; only available when OFF
two channels are installed. The
units for the sum and ratio
modes track the units selected for
Channel 2.
OFFSET Sets the offset added to the -99.99 to 99.99 dB 0.00
measured value.
RANGE Selects and holds the instrument's Auto, 0,1,2,3,4,5,6 AUTO
measurement range. If
repetitive measurements are to
be made over a narrow range of
levels, selecting the appropriate
instrument range may speed
measurements.
3-8
Page 25

Section III
Operation
TABLE 3-2. CHANNEL COMMANDS (CONT)
Command Description Parameters Default
ALARM Enables alarm mode; the ∨ or ON, OFF OFF
∧ symbol is displayed before
the channel mode designator on
the measurement display to
indicate when the upper or
lower threshold limit is
exceeded.
HI LMT Upper threshold limit for the -99.99 to 99.99 dBm 0.00
alarm function.
LO LMT Lower threshold limit for the -99.99 to 99.99 dBm 0.00
alarm function.
R T N ∨ ∧
R E C A L L > 1
S A V E 2
P O W E R - U P D E F A U L T
C A L I B R A T O R O F F
K E Y B E E P O F F
I E E E
I N S T R C A L
Figure 3-8. Setup Menu Display, IEEE Installed
3-9
Page 26

Section III
Operation
R T N ∨ ∧
R E C A L L 1
S A V E > 2
P O W E R - U P D E F A U L T
C A L I B R A T O R O F F
K E Y B E E P O F F
R S - 2 3 2
I N S T R C A L
Figure 3-9. Setup Menu Display, RS-232 Installed
3-19. Table 3-3 gives a description of the commands, parameters and default settings of the Setup menu.
TABLE 3-3. SETUP MENU FUNCTIONS
Command Description Parameters Default
RTN Returns the instrument to the n/a n/a
previous menu.
RECALL Recalls one of ten user Default, 1-10 Default
defined instrument
configurations or the factory
setup.
SAVE Saves the current instrument 1-10 1
configuration to one of ten
non-volatile memory
locations.
POWER-UP Instructs the instrument to power-up to Default, 1, 2, 3, 4 Default
the specified configuration.
CALIBRATOR Turns on/off the internal 50 ON, OFF ON
MHz 0 dBm calibrator.
KEY BEEP Turns on/off the key beep. ON, OFF ON
IEEE Brings the instrument to the see table 3-4 n/a
IEEE menu. (if installled)
RS-232 Brings the instrument to the see table 3-5 n/a
RS-232 menu. (if installed)
LINEFREQ Select line (mains) 50Hz, 60Hz n/a
frequency.
INSTRCAL Refer to Service Manual. n/a n/a
3-10
Page 27

Section III
Operation
3-20. Programming Interfaces. Either the IEEE-488 or RS-232
interface is installed, but not both. The appropriate setup menu
will appear in the list.
3-21a. IEEE Menu. The IEEE submenu is used to configure the
Model 4230A for communications over the GPIB. An example
of the menu is shown in Figure 3-10 and the description of the
commands, parameters and factory defaults is given in Table
3-4.
R T N ∨ ∧
A D D R E S S 1 5
E M U L A T I O N 4 2 3 0
E O S L S T N L F
E O S T A L K E R C R L F
E O I O F F
S R Q M A S K 0
Figure 3-10. IEEE Menu Display
3-21b. RS-232 Menu. The RS-232 menu is used to configure
the Model 4230A for serial communications over the RS-232
bus. An example of the submenu is shown in Figure 3-11 and
an explanation of the commands, parameters and factory
defaults is given in Table 3-5.
TABLE 3-4. IEEE MENU FUNCTIONS (if installed)
Command Description Parameters Default
RTN Returns the instrument to the n/a n/a
previous menu.
ADDRESS GPIB address assigned to the 0 to 30 n/a
instrument.
EMULATION GPIB emulation mode. NONE, HP437B, HP438A 4230A
EOS LSTN End of string indicator for LF, CR, CRLF, NONE LF
received messages. Where:
LF = Line Feed
CR = Carriage Return
CRLF = Carriage Return
and Line Feed
EOS TALKER End of string character sent LF, CR, CRLF, NONE CRLF
with transmitted messages.
EOI Enables/disables the end or ON, OFF OFF
identify hardware control line.
SRQ MASK Service request interrupt mask. 0 to 255 0
See Table 4-7 for bit Where:
descriptions. 255 enables all interrupts
3-11
Page 28

Section III
Operation
R T N < ∨ ∧
B A U D R A T E 9 6 0 0
D A T A B I T S 8
S T O P S B I T S 1
P A R I T Y N O N E
E O S L I S T E N E R L F
E O S T A L K E R C R L F
S R Q M A S K 0
Figure 3-11. RS-232 Menu Display
TABLE 3-5. RS-232 MENU FUNCTIONS (if installed)
Command Description Parameters Default
RTN Returns the instrument to the n/a n/a
previous menu.
BAUD RATE Rate at which data is 300, 1200, 2400, 9600 9600
transferred over the bus. 19200
DATA BITS Number of data bits in a message. 7, 8 8
STOP BITS Number of stop bits in a message. 1, 2 1
PARITY Parity bit mode in a message. ODD, EVEN, NONE NONE
EOS End of string indicator for LF, CR, CRLF, NONE LF
LISTENER received messages. Where:
LF = Line Feed
CR = Carriage Return
CRLF = Carriage Return
& Line Feed
EOS TALKER End of string character sent LF, CR, CRLF, NONE CRLF
with transmitted messages.
SRQ MASK Service request interrupt mask. 0 to 255 0
See Table 4-7 for bit Where:
descriptions. 255 enables all interrupts
3-12
Page 29

Section III
Operation
3-22. Diagnostics Menu. The Model 4230A can be directed
to perform self-tests from the diagnostics menu. The
Diagnostics menu is shown in Figure 3-12 and a description
of each command is given in Table 3-6.
3-23. SENSOR KEY.
3-24. Pressing the <Sensor> key brings the instrument to the
Sensor menu and facilitates viewing and editing of the power
sensor's parameters. An access code is required to enter the
editing mode (refer to Figure 3-14). A sample display of the
Sensor menu is shown in Figure 3-13.
R T N <
S E L F T E S T <
S W I T C H E S
R E C O R D E R
Figure 3-12. Diagnostics Menu Display
TABLE 3-6. DIAGNOSTICS MENU FUNCTIONS
Command Description Parameters Default
3-25. The instrument is capable of using sensor calibration
data from either the sensor data adapters or from any one of four
internal tables. The sensor calibration data contained within
the sensor data adapter is only accessible to the installed
channel. For example, Channel 1 can use the sensor calibration
data from any of the internal tables or the sensor data adapter
1. Similarly, Channel 2 can use the sensor calibration data from
any of the internal tables or the sensor data adapter 2.
3-26. Referring to Figure 3-13, the cursor can be positioned to
three fields. The two fields below the 'CH1' and 'CH2' indicate
the serial number of the sensor whose calibration data is
RTN Returns the instrument to the n/a n/a
previous menu.
SELF TEST Instructs the instrument to n/a n/a
perform internal diagnostics
and the display test.
SWITCHES Interactive test to verify proper n/a n/a
operation of the front panel
switches.
RECORDER The recorder output DAC is exercised n/a n/a
through its full range form 0 to 10 V.D.C.
in 1V steps continuously until the
<Menu> key is depressed.
C H 1 C H 2
S E R # > 5 0 1 4 0 4 2 9 1 0
E D I T D A T A 5 0 1 4 0
Figure 3-13. Sensor Display Menu
3-13
Page 30

Section III
Operation
selected for channels 1 and 2 respectively. The instrument uses
this data for the linearity and high frequency correction data and
automatically applies the correction to the measured value.
3-27. To change the current selection for channel 1, use the
arrow keys to move to the SER# command line and position the
cursor below the 'CH1' field. Press the <Enter> key and use the
up/down arrow keys to scroll through the parameter list. The
parameter list typically consists of serial numbers for each
power sensor. Scroll through the list until the desired serial
number is displayed and press <Enter> to accept. Move the
cursor below the 'CH2' field and follow the same procedure used
to change the table for channel 2.
3-28. The instrument detects the presence of the sensor data
adapter and automatically down-loads the sensor calibration
EDIT DATA ACCESS CODE
The access code to enter the Edit Data menu is as follows:
Press the front panel switches in the following order:
<FREQ> <AVG> <AVG> <FREQ> <Sensor> <Enter>
data. This occurs when the power to the unit is first applied
or after plugging the sensor data adapter into the instrument.
The power sensor and corresponding sensor data adapter
have matching serial numbers for maintaining them as a
matched pair.
3-29. The parameter list will show TBLn (where n = 1, 2, 3, 4)
when a serial number has not been entered for the
corresponding internal table. For example, TBL3 will be
displayed if the serial number has not been previously entered
for internal table 3. In addition, the parameter list will show
ADPTn (where n = 1, 2) if a serial number has not been entered
for the table contained within the sensor data adapter. For
Figure 3-14. Access Code
R T N ∨ ∧
M O D E L 5 1 0 7 5
S E R I A L # > 4 2 9 1 0
D A T E 0 7 / 2 9 / 9 6
U P S C A L E 0 : 4 0 6 5
D O W N S C A L E 0 : 0 0 0 0
F R E Q C . F .
M A X F R E Q 1 8 . 0 0
M I N F R E Q 0 . 0 3
M A X P O W E R + 2 0 . 0 0
M I N P O W E R - 7 0 . 0 0
Figure 3-15. Edit Data Menu Display
R T N F R E Q C A L ∨ ∧
0 > 0 0 0 . 0 3 + 0 0 . 0 0
3-14
1 0 0 2 . 0 0 + 0 0 . 0 1
2 0 0 3 . 0 0 + 0 0 . 0 4
Figure 3-16. Cal Factor Menu Display
Page 31

Section III
Operation
example, ADPT2 is displayed when the serial number has not
been previously entered for sensor data adapter 2.
3-30. To edit the sensor calibration data, move the cursor to
the EDIT DATA function and press <Enter>. Scroll through
the power sensor serial numbers until the desired selection is
displayed. Press <Enter> to proceed. Enter the access code to
edit or depress the <Menu> key to escape. (See Figure 3-14.)
3-31. Edit Data Menu. An example of the Edit Data menu is
shown in Figure 3-15. Table 3-7 contains a description of the
commands and associated parameters.
3-32. Linearity Factors. Seven upscale and downscale
TABLE 3-7. EDIT DATA MENU FUNCTIONS
Command Description Parameters Default
RTN Returns the instrument to the n/a n/a
previous menu
MODEL Power sensor model number 0 to 99999 0
SER # Power sensor serial number 0 to 99999 0
DATE Calibration date MM/DD/YY 01/01/01
UPSCALE Upscale linearity factors Range: Factor 5000
DOWNSCALE Downscale linearity factors Range : Factor 0
CAL FACTOR Brings the instrument to the n/a n/a
calibration factor menu
MAX FREQ Power sensor's maximum 0, 100.00 GHz 18
frequency
MIN FREQ Power sensor's minimum 0, 100.00 GHz 0.03
frequency
MAX POWER Power sensor's maximum [-99.99, 99.99] dBm 20
MIN POWER Power sensor's minimum [-99.99, 99.99] dBm -75
power input
linearity factors are assigned to each power sensor. These
values can be viewed or edited by moving the cursor to the
UPSCALE or DOWNSCALE command and pressing the
<Enter> key. The instrument will sequence through the
linearity factors by pressing the up/down arrow keys. If a value
is to be edited, scroll to the desired linearity factor, use the right
arrow key to move the cursor to the first digit in value field and
then use the up/down arrow keys to increment/decrement the
number. Set the remaining digits in the same manner. If another
value needs to be changed, move the cursor back to the range
field and use the up/down arrow keys to display the next value
to be modified. Press the <Enter> key when all of the changes
have been entered.
Where:
MM = 01 to 12
DD = 01 to 31
YY = 00 to 99
[0 to 6] : [0 to 9999]
[0 to 6] : [-999 to 999]
3-15
Page 32

Section III
Operation
3-33. FREQUENCY Calibration Factors. Up to 60 sensor
frequency calibration factors can be entered for each power
sensor. Position the cursor to the FREQ C.F. command. Press
the <Enter> key to advance to the Cal Factor menu. A sample
of the display is shown in Figure 3-16. A sample of the display
is shown in Figure 3-16 and an explanation of the commands is
shown in Table 3-8.
3-34. The up/down arrow keys are used to scroll through the
calibration factor table. Use the arrow keys to move to the
desired field and press the <Enter> key to change a value. The
up/down arrow keys increment/decrement the value and the
left/right arrows keys select the digits. Press the <Enter> key
when the desired value is displayed. Move the cursor to the
RTN field or depress the <Menu> key to return to the Sensor
menu.
3-35. The instrument scans the sensor calibration table for a
value that matches the operating frequency. Linear
interpolation is used if the operating frequency is between two
Factor # Frequency Cal Factor
(GHz) (dB)
0 1 0.00
1 2 0.08
2 3 -0.02
of the table entries. To ensure proper operation, the calibration
table must be entered in ascending order and terminated in the
last table entry with a zero (0) value for both the FREQ and CAL
FACTOR. In addition, new calibration values should be
entered while adhering to the chronological order of the table.
For example, to add the -0.01 dB calibration factor at 3.5 GHz to
the example shown in Figure 3-17, the calibration factors for
items four through six are re-entered.
3-36. Save. Exiting the EDIT DATA menu displays the
confirmation menu as shown in Figure 3-18. Move the cursor
to YES to save the edited parameters or NO to leave the data
unchanged.
3-37. FREQ Key.
3-38. The frequency of the signal being measured must be
entered in order to use the stored high frequency calibration
factors. The instrument will then compute, display and apply
the required correction factor to subsequent measurements.
3-39. The operating frequency is entered by pressing the
<FREQ> key. The instrument will advance to the Frequency
menu as shown in Figure 3-19. The frequency for Channel 1
is entered by positioning the cursor to the value field under the
CH1 heading and pressing the <Enter> key. A value between
0.01 GHz and 100 GHz can be entered. The power on default is
0.05 GHz. Once the frequency is entered, the corresponding Cal
Factor is displayed in dB beneath the frequency.
3 4 -0.15
4 5 -0.08
5 6 -0.08
Factor # Frequency Cal Factor
(GHz) (dB)
0 1 0.00
1 2 0.08
2 3 -0.02
3 3.5 -0.01
4 4 -0.15
5 5 -0.08
6 6 -0.08
Figure 3-17. Calibration Data Example
TABLE 3-8. Sensor Calibration Menu Functions
Command Description Parameters Default
3-40. AVG Key.
3-41. The averaging time may be adjusted to optimize
measurement speed and display stability. Averaging time, in
seconds, can be adjusted in 0.05 increments to a maximum of
20.00 seconds. The length of the filter in number of samples is
shown on the display.
3-42. To adjust the averaging time, press the <AVG> key and
the instrument will display the screen as shown in Figure 3-20.
Position the cursor under the desired channel heading and
press the <Enter> key. Use the arrow keys to set the desired
value and then press <Enter> to accept. Entering 00.00 selects
the auto filtering Mode. This menu can be accessed to show
the filter setting in the auto mode.
3-43. ZERO/CAL Key.
3-44. Zeroing should be performed when the unit is first
warmed-up, a sensor has been changed or the instrument has
drifted a significant amount with respect to the signal level
being measured. For large signals (measurements taken on
3-16
FREQ Frequency 0.01 to 100.00 GHz 0.05
CAL High frequency -3.00 to 3.00 dB 0.00
calibration factor
Page 33

C O N F I R M S A V E
> N O
Y E S
Figure 3-18. Save Display
F R E Q U E N C Y
C H 1 C H 2
G H z > 0 1 8 . 0 0 0 0 2 . 5 0
d B C F 0 0 0 . 1 0 - 0 0 . 0 2
Figure 3-19. Frequency Display
T I M E
Section III
Operation
C H 1 C H 2
S E C > 1 0 . 5 0 0 0 . 8 0
Figure 3-20. Averaging Time Display
C H 1 C H 2
Z E R O & C A L >
Z E R O
C A L
Figure 3-21. Zero and Calibration Display
R E F E R E N C E L E V E L
C H 1 C H 2
d B m + 0 0 . 0 0 + 2 5 . 0 0
M O D E L O A D S E T
Figure 3-22. Reference Level Display
3-17
Page 34

Section III
Operation
TABLE 3-9. REFERENCE LEVEL MENU FUNCTIONS
Command Description Parameters Default
dBm Reference level value in Preset -99.99 to 99.99 dBm 0
mode.
MODE Reference level mode. "LOAD" LOAD, SET, OFF OFF
makes the current channel
measurement as the reference level.
The Set mode is used to select the
entered reference level. The Off mode
disables the reference level
adjustment.
range 4, 5, or 6), this may be done once every several hours. For
small signals, (measurements taken on range 0, 1, 2, or 3),
zeroing should be done before each measurement for optimum
results. When zeroing is performed, the instrument calculates
and stores zero corrections for each range, and applies the
corrections to subsequent measurements.
3-45. The built-in 50 MHz calibrator provides a convenient
means for calibrating the instrument. Calibration can be
performed any time to assure accuracy.
3-46. The <Zero/CAL> key invokes three commands as shown
in Figure 3-21.
3-47. The cursor can be positioned in any of the six fields that
are indicated by the '>' symbol in Figure 3-21. To zero and
calibrate Channel 1 of the Model 4230A, connect the power
sensor to the internal 50 MHz 0 dBm calibrator, move to the
ZERO & CAL command and position the cursor in the CH1 field
and press <Enter>. The unit will display ZEROING:CHANNEL
1, Range #" followed by CALIBRATE:CHAN 1 and then return
to the measurement display when complete. If a power level is
detected during zeroing, the instrument will not zero and will
display the error message "ZERO ERROR:CHAN 1". If a 0 dBm
signal is not detected during the Calibrate function, the display
will indicate "CALIBRATOR:CHAN 1 -NOT CONNECTED-".
The Zero and Calibrate functions can also be invoked
individually with the ZERO and CAL commands.
3-50. To set a reference level, depress the <REF Level> key to
display the REFERENCE LEVEL sub-menu. Move the cursor
to the reference value for the appropriate channel. (Channel 1
is default.) Depress the <Enter> key to initiate the editing
process. Use the arrow keys to edit the reference value in dBm.
Once the desired value has been selected, depress the <Enter>
key to leave the editing function. To use this value as the
reference, depress the <Down> arrow key to MODE, depress
the <Enter> key for mode selection and using the <Up> or
<Down> arrow keys, select SET. Depressing the <Enter> key
will place the appropriate channel to the "dBr" mode of
operation using the set value as the reference.
The instrument cal also load the current measured value as the
reference level. To do this, depress the <REF Level> key to
display the REFERENCE LEVEL sub-menu. Navigate the
cursor using the arrow keys to the MODE selection of the
desired channel. Depress the <Enter> key for mode selection
and using the <Up> or <Down> arrow keys, select LOAD.
Depressing the <Enter> key will place the appropriate channel
to the dBr mode of operation using the measured value as the
reference level.
3-48. REF LEVEL Key.
3-49. Press the <REF Level> key to enter a value or to use the
current channel measurement for the reference level. The
measurement units will automatically change to dBr for
subsequent measurements. An example of the instrument's
display is shown in Figure 3-22.
3-18
Page 35

SECTION IV
APPLICATION NOTES
Section IV
Application Notes
4-1. INTRODUCTION.
4-2. This section provides detailed background information
on various aspects of operation of the Model 4230A. It is
assumed that the reader is familiar with the basic operating
procedures covered in Section III. This section covers the
following topics:
a. Sensor calibration
b. Zeroing
c. Filtering
d. Noise
e. Dynamic range
f. Measurement time
g. High frequency accuracy
h. Chart recorder operation
i. Waveform sensitivity
j. Remote operation
4-3. SENSOR CALIBRATION.
4-4. General. Two types of calibration are associated with
the Model 4230A - instrument calibration and sensor
calibration. The instrument (less sensors) must be calibrated
using a stable and accurate DC source, such as the Boonton
Model 2510, to ensure interchangeability of sensors.
Instrument calibration procedures are covered in the Model
4230A Service Manual. Sensor calibration data is of two types:
linearity and high frequency calibration factors. Sensor
calibration data for up to four sensors can be stored in nonvolatile EEPROM plus each sensor data adapter contains the
data matched to the corresponding power sensor.
4-5. 14-Point Linearity Data. Linearity data, also referred to
as AC reference frequency linearity data, is supplied with the
sensor and can be manually entered into the non-volatile
Tables or Adapters. For sensors ordered with the instrument,
linearity data is stored in the sensor data adapter before the
instrument is shipped.
4-7. High Frequency Calibration Points. In addition to
linearity data, there are high frequency calibration points.
Calibration points covering the entire sensor frequency range
are supplied with each sensor. Below 1 GHz, the sensor
response is flat, and frequency calibration points need not be
entered.
4-8. The Model 4230A provides space for up to 60 points for
each sensor table. Frequency calibration points need not be
in equal frequency increments; however, the entry of data
must be done in ascending order of frequency. For both diode
and thermal sensors, a calibration factor of 0 dB is implied at
0.00 GHz so that the instrument may be operated below the
first data point.
4-9. ZEROING.
4-10. The automatic zeroing routine of the instrument takes
measurements on the lowest five ranges and applies these as
correction factors on subsequent measurements. Offsets in
the sensor and input amplifiers are linearly corrected in the
internal software. Offsets on the highest ranges are below
0.02% of full scale, and do not need correction.
4-11. Input power to the sensor must be removed before the
zeroing function is executed or an error message will be
displayed. The instrument will perform zeroing, however, if
the signal is less than full scale on range 0. This feature
provides a great deal of offset capability for temperature
effects without rezeroing the input amplifier hardware.
4-12. For full accuracy at low signal levels, power must be
removed from the sensor several seconds before zeroing to
allow the sensor to settle. This is especially true if a large
signal had been applied to the sensor in the previous 20
seconds or so because of the dielectric absorption of the
capacitors in diode sensors, and because of thermal retention
in thermal sensors. The error resulting from different input
conditions can be determined from Figure 4-2 or 4-3, as
applicable. The curves in these figures show the decay of
measured power after a large signal has been applied. The
typical error that can be expected by zeroing too quickly after
application of a large signal is equal to the offset power at the
time of zeroing.
4-6. At the reference frequency (50 MHz, or 40, 60, or 94 GHz),
each sensor has two gain factors for each range: upscale and
downscale points. Refer to Figure 4-1. The upscale points
are in the range of 4000-7000, which is a gain correction
factor. Upscale points are calibrated at the factory at about
70% of full scale. The downscale number is an offset
correction at about 25% of full scale. Thus, for a diode sensor
(7 ranges), there are 14 points; for thermal sensors there are
eight points. Ranges 0 and 1 share the same data points.
4-13. The Model 4230A initiates zeroing when the ZERO &
CAL or ZERO commands are invoked. The user must delay
zeroing according to system requirements when the sensors
are used over a wide dynamic range. For example, if it is
determined from the application that five seconds are required from power off to the zeroing operation, then the user
should wait five seconds after removing power from the
sensor before executing the zero command.
4-1
Page 36

Section IV
Application Notes
4-2
Page 37

Section IV
Application Notes
Figure 4-3. Thermal Sensor Decay
4-14. The zeroing time on each range has been optimized for
speed and accuracy. Total zeroing time is approximately 30
seconds.
4-15. Zeroing should be done when the instrument is turned
on, the sensor has been changed, or the instrument has drifted
a significant amount with respect to the signal being measured. For large signals (range 4, 5, or 6), this may be once
every several hours, if at all. For very small signals (range
0, 1, 2, or 3), for optimum results, zeroing be done immediately before each measurement.
4-16. DYNAMIC RANGE.
4-17. The hold range mode is useful when it is known that
the signal will vary over a certain limited range. (The hold
range mode is active when a specific instrument range, other
than autorange, has been selected.) The dynamic range of
this mode is limited by the zero offset and the resolution, as
shown in Figure 4-4. It can be seen from this figure that the
useful dynamic range is 20 dB if the error is to be kept below
0.1 dB. An asterisk is displayed before the channel when the
measured value is below the lower range limit indicating an
uncalibrated measurement.
4-18. FILTERING.
4-19. The Model 4230A employs digital filtering (averaging of
measurements) to reduce the noise floor of the instrument
and to stabilize measurements. The default values are
optimized for speed and low noise under general conditions.
Default values for normal and fast modes are as follows:
Range Normal (sec.) Fast (sec.)
0 2.8 2.8
1 0.8 0.8
2 0.8 0
3 0.8 0
4 0.8 0
5 0.8 0
6 0.8 0
4-3
Page 38

Section IV
Application Notes
4-20. The filtering technique used is digital pipeline filtering,
also referred to as circular filtering or moving average filtering.
The displayed measurement is simply an equally weighted
average of the last x seconds worth of samples, where x is the
filter length in seconds. For purposes of noise and settling time,
the number of samples is not important, but the time is important. For example, if a three second filter is used, the noise is
the same whether 60 or 600 samples are taken in that interval,
provided that the samples are taken above a certain rate. For
this reason, filter selection in the Model 4230A is done on the
basis of seconds, rather than the number of samples.
4-21. The bottom end sensitivity of the instrument is limited
by sensor noise. An RMS noise specification is valid since
the sensor noise and the amplifier noise are band-limited and
Gaussian. The noise level, specified in picowatts at a certain
filter length, is sufficient to calculate the error due to noise
at any signal level, for any filter, as shown in the discussion of
noise that follows.
4-22. NOISE.
4-23. Noise Reduction. The amount of noise reduction that can
be realized has no theoretical limitation, except that drift enters
into the picture at filter lengths over 20 seconds. The digital
filter has a bandwidth and rolloff curve just as any filter does;
the bandwidth can be reduced arbitrarily. The effective noise
bandwidth is 0.469/t, where it is the filter length. For example,
with a filter length of 4 seconds, the equivalent noise bandwidth is 0.12 Hz.
4-24. Figure 4-5 is a nomograph showing the noise reduction
that applies for various filter lengths, given the sensor noise
with 2.8 second filtering. (This is the time for which diode
sensor noise is specified.) Noise power is inversely proportional to the square root of the filter length. Normally, noise
power varies directly with filter bandwidth; however, because power sensors are square-law devices (detected voltage is proportional to power), the noise power is proportional
to the square root of the bandwidth. This can be demonstrated
4-4
Figure 4-4. Extended Hold Range Mode
Page 39

Section IV
Application Notes
with noise measurements. At very low filter lengths (less than
150 milliseconds), however, the noise does not increase without bound for all sensors because the input amplifier noise is
restricted with hardware filters. This additional filtering is not
shown in the nomograph.
4-25. Error Computation. Since the noise is Gaussian, both
before and after filtering, statistics show the level of confidence
factor that can be associated with a given reading. (At medium
and high power levels, the confidence factor is essentially
unity.) Figure 4-6 shows a typical set of samples and a typical
error band specification of 2 sigma. Under these conditions,
95.4% of the readings will fall within +2 sigma.
4-26. Figure 4-7 shows the confidence factor for other error
bands. The error band is expressed in pW, regardless of the
power level. (The percentage error band can also be calculated as shown below.) The RMS noise is taken from the
sensor specifications and modified as necessary for filter
lengths other than 2.8 seconds. Knowing any two of the three
parameters (error band, RMS noise, and confidence factor),
the third can be computed. For example, if the sensor RMS
noise is 65 pW and the confidence factor is to be 95.4%, the
error band is 130 pW, single sided (+130 pW). If this were
the case, at a measurement level of 1300 pW the percent error
band would be 10%, corresponding to about +0.44 dB.
4-27. Noise Error Examples. Figures 4-8 and 4-9 show the
computed error for the 51013 diode sensor at different power
levels, for 2.8 and 10 second filters. To attain these results,
the sensor must be at a stable temperature, and zeroing must
be done immediately before the measurement is taken.
4-28. Integration of Power. With long filtering, instrument
readings may seem erroneous because the filter has not been
cleared. For example, with a 20 second filter, if a 2 second
RF pulse is applied, the instrument display will indicate a
nonzero level for 18 seconds after the pulse has terminated.
Additional pulses will be integrated along with the first until,
by the process of selective deletion, the pulses are removed
one at a time from the filter. Actually, measurement samples
are deleted, not the pulses, giving rise to a ramping effect at
the instrument display/output. This is shown in Figure 4-10.
In all senses, the filter is a simple integrator.
4-29. Clearing of Filter. When long filter times are used,
it may become troublesome at times to wait for the filter to
clear. If the Auto filter function is selected, the filter is
cleared after significant power changes, and filtering then
resumes. Clearing can also be accomplished by changing the
filter length to any different value and then resetting it using
the interface bus; however, with bus operation, most of the
trigger modes clear the filter at trigger time.
4-30. Partial Results. Measurement time is affected by the
filter since valid readings to within a certain error band can
be obtained only when the filter is full. If the filter has been
cleared, data is available at reduced accuracy immediately after
the first 50 millisecond sample period. The filter uses the
number of samples as a divisor when computing the average,
and the output/display does not ramp but homes in on the
result instead as the samples accumulate.
4-31. MEASUREMENT TIME.
4-32. Step Response. The measurement time from a power
input step is the sum of the overhead time and the length of
the digital filter, where the overhead time is defined as the
time delay due to sensor response time and measurement
software (processing). The overhead time is given in
paragraph 4-34 for certain conditions.
4-33. Continuous Response. Regardless of the overhead
time or the digital filter length, the Model 4230A will output
readings at a maximum rate of about 200/second with the
display operating. As the sensor and the digital filter settle,
readings will ramp up or down at that rate.
4-34. Overhead Time. Overhead time is <350 milliseconds
for diode sensors and <450 milliseconds for thermal sensors
under the following conditions:
a. Settling to 99% or 0.04 dB of final power
b. Power step of 10 dB
c. Range does not change
d. Digital filter set to minimum
4-35. The power step may be upward or downward. Smaller
power steps will decrease this time slightly; larger power
steps in the downward direction will increase the time
significantly. A 40 dB downward step, for example, will take
several seconds to settle to 0.04 dB.
4-36. Digital Filter. The digital filter is a moving average
or pipeline filter which simply integrates the readings over
the last x seconds, where x is the filter length. A step input
to the filter will produce a linear ramp at the output,
terminating when the filter is full.
4-37. Default Filter Lengths. Although any filter length
from 0 to 20 seconds may be chosen, default filter lengths are
programmed into the instrument for optimum general
conditions. (Refer to paragraph 4-19.) For diode sensors, the
range break-points are roughly in 10 dB steps, with the range
0 to 1 break-points at approximately -54 dBm.
4-38. Settled Measurement Time. In the free run settled
mode, output data updates are held off until the
measurements have settled.
4-39. Fast Mode Measurement Time. The Fast Mode can
be invoked over the bus to put the instrument into its fastest
sampling mode. Output data is taken after digital filtering
and achieves sample rates that are dependent on the applied
power level. Figure 4-11 shows this relationship.
4-5
Page 40

Section IV
Application Notes
4-6
Figure 4-5. Noise Reduction
Page 41

Figure 4-6. Typical Error Band Specifications
Section IV
Application Notes
Figure 4-7. Probability of Falling within an Error Band
4-7
Page 42

Section IV
Application Notes
4-8
Figure 4-8. Confidence Curves, 51013 Sensor with 2.8 Second Filter
Page 43

Section IV
Application Notes
Figure 4-9. Confidence Curves, 51013 Sensor with 10 Second Filter
4-9
Page 44

Section IV
Application Notes
Figure 4-10. Integration of Power
4-40. HIGH FREQUENCY ACCURACY.
4-41. Power measurements, particularly at high
frequencies, have a number of uncertainties which
generally arise from imperfect SWRs. If all power sources
and power meters had impedances that were resistive and
equal to Zo (the characteristic impedance of the measuring
system), most problems would disappear. The incident,
dissipated, and maximum available powers would all be
equal, and the indicated power would differ only by the
inefficiency of the power sensor in converting all
dissipated power to indicated power. Tuning eliminates
most of the SWR effects, but is cumbersome and is
therefore seldom done. The use of attenuator pads can
mask imperfect SWRs, as can the use of a directional
coupler to level the source and reduce its reflection
coefficient to a value equal to the directivity factor of the
directional coupler. Boonton 51015 and 51033 power
sensors have precision, built-in attenuators which
improve the SWR over that of other power sensors.
4-42. When the complex coefficients of both an imperfect
source and a power sensor are not known, but the maximum
actual SWRs of both are known, the maximum positive and
negative uncertainties of the measured power, Pm, can be
determined from Figure 4-12. For example, if the SWR of the
source is known to be 1.2 and the SWR of the power sensor
is 1.25, the uncertainty derived from Figure 4-12 is 2%.
4-44. Thermal sensors are insensitive to the waveform
because they average RF power over many tens of
milliseconds. Modulated signals, non-sinusoidal
waveforms, and even pulses can be detected without
distortion of the measurement. Thermal sensors are
referred to as RMS responding.
4-45. Diode sensors are also RMS responding below about
-20 dBm (-10 dBm and 0 dBm for attenuated models 51015
and 51033). This response characteristic is obtained
because the sensors are dual diode types, and diodes
respond in square-law fashion at low and medium levels.
This is not an approximation, but rather an inherent effect.
This effect results from the fact that the diodes do not turn
on and off as switches, but behave as signal dependent
resistors instead. Even with no signal input, the diodes
have a finite conductance, and this conductance is
modulated on a cycle by cycle basis to give a net DC offset
proportional to the power.
4-46. The square-law response can be seen in Figure 4-13,
where a 100% amplitude modulated signal is shown to have
virtually no effect on the measured power at low levels. Of
course, frequency modulated and phase modulated signals
can be measured at any level, since the envelope of these
modulated signals is flat. Frequency shift keyed (FSK) and
quadrature modulated signals also have flat envelopes and
can be measured at any power level.
4-43. WAVEFORM SENSITIVITY.
4-10
Page 45

Section IV
Application Notes
Figure 4-11. Fast Mode Sampling Rate
4-11
Page 46

Section IV
Application Notes
Figure 4-12. Mismatch Uncertainties Chart
4-47. At higher power levels (above approximately -10 dBm
for the 51013 sensor), the diodes operate as peak
detectors. The Model 4230A is software calibrated to
calculate the RF power based on a shaping transfer
function (RF to DC) for each sensor type. However, only
measurements of RF signals with flat envelopes (CW, FM,
PM, FSK, quadrature, etc.) are valid in this region and in
4-12
the transition region from -20 dBm to -10 dBm.
A special provision is made for the case of rectangular
pulses where the duty cycle (on-time percentage) is
known and the top level power of the pulse (pulse power)
is to be measured. The duty cycle in percent is set into the
DUTY entry in the CHANNELS menu. For example, if the
signal consists of pulses with a duty cycle of 25%, set
Page 47

Section IV
Application Notes
Figure 4-13. Error Due to AM Modulation (51013 Diode Sensor)
Only the display is affected by the duty cycle calculation. The
measurement process is subject to the same criteria discussed
above. For thermal sensor no correction is needed for level.
However, pulse periods on the order of tens of milliseconds
may result in unstable readings because of inadequate averaging. If the filter time constant is too short, it can be increased
by use of the AVG function and menu.
For diode sensors, the RMS power region extends up to -30
dBm with a gradual change to peak voltage response. For
accurate pulse power measurement, the power meter should
read an average power of -30 dBm or less. This is the power
indication when the duty cycle is set to 100%. Somewhat useful
measurements can be made up to -20 dBm average power, but
the uncertainty will typically be at least +-1dB.
Extra care should be taken when using the pulse power feature
to avoid overload damage to power sensors. Pulses with small
duty cycle have a very large peak to average power ratio. The
average responding power meter has a small indicated power,
but the peak signal at the sensor diode or thermal element may
easily exceed the maximum ratings.
4-48. CHART RECORDER OPERATION.
4-49. The chart recorder output is a DC voltage from 0 to 10
volts. In the Watts mode, the output voltage is equal to the
digits displayed on the main data display divided by 1100. In
the dBm or dBr modes, the output voltage is directly
proportional to the level of the RF signal being measured. 0 dBm
is at 8.0 volts with a sensitivity of 1.0 volt/10 dB overrange of
the sensor. The output impedance is 9.06 kilohms, which gives
the user the option of loading it with 1 kilohm, thereby reducing
the full scale output to 1 volt. The normal 12-bit resolution is
still maintained with this method. With a 1 megohm load, the
circuit is essentially open and the error is small. Absolute
accuracy is +3%.
4-50. BAR GRAPH OPERATION.
4-51. The meter presents the power proportionally in the
following manner.
4-52. Watts Mode. The meter follows the digital display as a
percentage of the full scale. The bar graph consists of 100
segments resulting in a 1% resolution. A main data display of
1100.0 µW drives the meter to 100 percent of full scale while a
display of 561.0 µW drives the meter to 51 percent of full scale.
The meter reads full scale at 10 dB increments.
4-53. dBm Mode. The meter follows the digital display as a
percentage of the full scale. The bar graph consists of 100
segments resulting in a resolution of 0.1 dB/segment. A main
4-13
Page 48

Section IV
Application Notes
DUTY to 25. This will add 6 dB to the displayed power and
turn on the "Pk" indicator following the units.
data display of 0.00 dBm (or any 10 dB increment) drives
the bar graph to zero percent of full scale while 5.00 dBm
and 9.99 dBm drives the meter to 45 percent and 90 percent
of full scale respectively. A value of –7 dBm would drive
the meter to 27 percent of full scale while a value of –2
dBm would drive the meter to 72 percent of full scale.
4-54. dBr Mode. Selecting the dBr mode positions the bar
graph to 50 percent of full scale when the digital display reads
0 dBr. The analog meter thereafter reads 100 percent of full
scale at +5 dBr or more and zero percent of full scale at –5dBr
or less.
4-55. REMOTE (GPIB) OPERATION.
4-56. Introduction. If the Model 4230A is equipped with the
IEEE-488 option, the instrument can be operated remotely
through an IEEE-488 interface. The IEEE-488 is a hardware
standard which describes the communication and
handshaking across the 8-bit parallel bus between a bus
controller and up to 15 instruments.
4-57. The Model 4230A IEEE-488 capabilities are as follows:
the bus controller, by turning off power to the instrument,
or by pressing the front panel <Menu> key. The third
method can be disabled by a local lockout (LLO)
command issued by the bus controller.
4-59. Remote Operation. In the remote mode, all front
panel key closures are ignored except for the <Menu> key
(which may also be disabled by a LLO command from the
bus controller). When the instrument is in the remote
mode, the front panel REM annunciator is activated.
4-60. Bus Address. The IEEE-488 listen/talk address
(MLTA) of the instrument can only be altered from the
MENU-Setup-IEEE menu. Refer to paragraph 3-20.
4-61. Terminating Characters. To inform the instrument
that a message has been completed, the bus controller must
end all messages with a terminating character or EOI
control signal. The Model 4230A can be programmed for
several combinations of terminating characters as
required by the controller employed. Selection of
terminating characters is accomplished via the MENUSetup-IEEE menu. There the instrument can be
programmed for individual end of string characters in
both listener and talker modes as well as independently
enabling the end or initiate control signal.
C0 NO CONTROLLER Capability
SH1 SOURCE HANDSHAKE Complete capability
AH1 ACCEPTOR HANDSHAKE Complete capability
RL1 REMOTE LOCAL Complete capability
DC1 DEVICE CLEAR Complete capability
DT1 DEVICE TRIGGER Complete capability
RL1 REMOTE LOCAL Complete capability
DC1 DEVICE CLEAR Complete capability
DT1 DEVICE TRIGGER Complete capability
PP0 PARALLEL POLL No capability
TE0 EXTENDED TALKER No capability
T6 BASIC TALKER Complete capability
except for talker only
LE0 EXTENDED LISTENER No capability
L4 BASIC LISTENER Complete capability
except for listener
only
DMA Not supported
4-58. Local Operation. This is the front panel operation of
the instrument. The instrument initializes to the local mode on
bus power on, and the remote mode becomes active only when
the instrument is remote addressed by the bus controller. Once
in the remote mode, the instrument can be returned to the local
mode in any of three ways: by a GTL (go to local) command from
4-62. Listen Operation. The instrument may be
addressed as a listener without regard for remote or local
mode. When the listener state is set by the bus controller,
the instrument will receive bytes over the bus and place
them in its input buffer. For listen operation, the input
buffer is 150 characters long. Only one message can be
entered into the input buffer at a time. A second message
cannot be sent until the instrument has processed the
previous message.
4-63. Talk Operation. When the instrument is requested
to talk, the instrument response will depend on how it has
been set up. The setup is either through talk modes or talk
array commands. Talk modes are associated with making
measurements; talk array commands are associated with the
downloading of calibration data and instrument states. Refer
to paragraph 4-73 for setup of the talk mode.
4-64. Only one instrument at a time can be addressed to talk,
but many instruments can be addressed to listen
simultaneously. When the Model 4230A is in the talk mode, the
front panel TLK annunciator is illuminated. The format for each
talk message is different and is explained in the paragraphs that
follow.
4-65. IEEE-488 Command Support. The Model 4230A
supports the following standard IEEE-488 commands:
a. Interface Clear Command. The interface clear (IFC)
command forces all devices on the bus to clear their
interfaces, and the bus to an initialized state, clearing the error
condition. This command can only be issued by the bus
controller in charge. The Model 4230A responds by clearing
4-14
Page 49

Section IV
Application Notes
the interface.
b. Device Clear. For this instrument, the device clear
(DCL) command operates the same way as the IFC command
described above.
c. Group Execute Trigger. The group execute trigger
(GET) command allows the bus controller to issue a trigger
to all instruments on the bus simultaneously. The Model
4230A will save the current reading at the time of the GET
command and return it at the time of the next talk message mode.
This is in essence a bus latch. The instrument must be set to
one of its trigger modes. See paragraph 4-116.
d. SRQ. The service request (SRQ) allows an instrument
to inform the bus controller that some special event has
occurred. The instrument then expects the bus controller to
TABLE 4-1. LISTEN PARAMETER COMMANDS
Mnemonic Function and Limits Description Parameter No.
perform a serial poll to determine what event has occurred.
Events that generate service requests include instrument error,
measurement error, measurement is ready, and zeroing or
calibration is completed. When the instrument SRQ is active,
the front panel SRQ annunciator is illuminated.
e. Serial Poll. The serial poll (SP) command on the bus
allows the bus controller to check the SRQ status byte of each
instrument to determine which instrument is requesting
service. The byte returned by the Model 4230A is composed
of multiple bits that represent different status and error
conditions. These conditions are individually maskable, as
shown in Table 4-7.
f. Parallel Poll. The parallel poll (PP) command is not
supported.
4-66. Number Formatting. Number formatting is shown
CH# Channel select Sets channel 12, N
# 1, 2
DY# Duty cycle Sets duty cycle percent (sets pulse power
# 0.01 to 100.00 in 0.01 steps mode when not=100%) 13, N
FL# Filter time select Corresponds to AVG-Sec data entry 3, N
# 0 to 20.00 in 0.05 steps (AUTO FILTER MODE when set to 0)
(see FA command)
FD# dB calibration factor Changes the frequency CAL FACTOR 10, N
# -3.00 to 3.00 in 0.01 steps to # . Original CAL FACTOR is restored
by entering the frequency
FR# Frequency select Corresponds to FREQ-GHz 4, N
# 0 - 100.00 data entry
LH# High limit select Corresponds to Menu -Channels-Hi Lmt 14, N
# -99.99 to 99.99 in 0.01 steps data entry
(or 0 to 99999 in Watts mode)
LL# Low limit select Corresponds to Menu-Channels-Lo Lmt 15, N
# -99.99 to 99.99 to 0.01 steps data entry
(or 0 to 99999 in Watts mode)
LM# Alarm select Corresponds to Menu-Channels- 17, N
# 0 disable Alarm command
# 1 enable
OS# Offset select Corresponds to Menu-Channels-Offset 16, N
# -99.99 to 99.99 in 0.01 steps data entry
RS# Range select Corresponds to Menu-Channels-Range 5, N (-1 = RA)*
# 0 to 6 selection
SM# SRQ Mask Corresponds to the Menu-Setup- 11, N
# 0 - 255 IEEE-SRQ Mask data entry
SR# Set dBr reference Corresponds to REF Level-dBm 6, N
# -99.99 to 99.99 in 0.01 steps data entry with Mode=Set
4-15
Page 50

Section IV
Application Notes
TABLE 4-1 LISTEN PARAMETER COMMANDS (Continued)
Mnemonic Function and Limits Description Parameter No.
SS# Sensor data source Corresponds to Sensor-Ser# 1, N
# 1 - 6 selection
Where:
# 1 - 4 are internal tables
# 5 is the sensor data
adapter for channel 1
# 6 is the sensor data
adapter for channel 2
TM# Talk Mode Sets talk mode for IEEE-488 bus 8, N
# 0 to 6 operation.
TABLE 4-2. LISTEN ACTION COMMANDS
Mnem- Function Description
onic
CF Calibrator off Turns off 50 MHz
calibrator
CL Clear Clears error number and
error
CN Calibrator on Turns on 50 MHz
calibrator
CP Calibrate Corresponds to Zero/
CAL-CAL selection
DB dBm select Corresponds to Menu--
Channel-Units-dBm
selection
DF Display off Turns off instrument
display
DN Display on Turns on instrument
display
DR dBr select Corresponds to REF-
Level-Mode equal to SET
using the previous
reference level
FA Auto filter Sets instrument to auto
filter
LR Load Reference Loads the current
measurement as the
reference level.
Corresponds to REF
Level-Mode equal to
LOAD.
Menum- Function Description
onic
MFD Measure Fast Sets fast dual channels
Dual measurement mode
MFS Measure Fast Sets fast single channel
Single (CH1 only) measurement
mode
MN Measure Normal Sets normal free run
(free run) measurement mode
MS Measure Settled Sets settled measurement
mode
TF Trigger Filtered Selects filtered trigger mode
TFD Trigger Fast Dual Selects fast dual channels
trigger mode
TFS Trigger Fast Single Selects fast single channel
(CH1 only) trigger mode
TN Trigger Normal Selects normal trigger mode
TR Bus trigger Bus trigger command
TS Trigger Settled Selects settled trigger mode
ZR Instrument zero Corresponds to Zero/CAL-
ZERO selection
?ID Talk instrument ID Calls up instrument
identification
*IDN? Talk instrument ID Calls up instrument
identification
MF Measure Filtered Sets filtered measurement
Mode
4-16
Page 51

TABLE 4-3. LISTEN ARRAY PARAMETER COMMANDS
Mnemonic Function Description
SI Sensor ac calibration data in Refer to paragraph 4-90
FI Sensor high frequency
calibration data in Refer to paragraph 4-98
TABLE 4-4. TALK ARRAY COMMANDS
Mnemonic Function Description
SO Sensor calibration data out Refer to paragraph 4-94
FO Sensor high frequency
calibration data out Refer to paragraph 4-102
Section IV
Application Notes
TABLE 4-5. TALK MODES
Talk Mode Description
0 Talk measurement floating point
1 Talk measurement with units
2 Talk error
3 Talk both channels
4 Talk channel status
5 Talk instrument status
6 Talk parameter
7 Talk array
8 Not used
for each of the commands in the paragraphs that follow,
but general rules are as follows:
a. Fixed or floating formats are accepted.
b. The optional + or - may precede the mantissa and/
or the exponent.
c. An optional decimal point may appear at any
position within the mantissa. A decimal point in the
exponent is ignored.
d. The optional “E” for exponent may be upper or lower
case.
e. All ASCII characters below and including “;”
(3Bh) are considered command delimiters. The ASCII
characters “ “ (20h), “,” (2Ch), “;” (3Bh), and “:” (3Ah) are
considered numeric delimiters.
4-67. String Format. String formatting is as follows:
a. The programming sequence is in natural order, that
is, a function mnemonic is sent first, followed by the
argument value (parameter), if applicable.
sensitive. This means lower case and upper case are the
same.
c. Spurious numbers occurring in the listen string are
ignored.
d. All block modes have formatted data arrays or ASCII
strings. See Tables 4-3 and 4-4 for commands and
paragraphs 4-88 thru 4-112 for format.
4-68. Listen Parameter Commands. Listen parameter
commands are listed in Table 4-1. These are commands,
received by the instrument, that expect one numerical value to
follow for setting a particular operating condition. Except as
noted in the table, these commands correspond to specific
front panel commands. Key commands correspond to single
keystrokes; non-key commands are submodes or menu types
of data entry.
4-69. The numeric value (parameter) can be sent in the next
listen string if the listen parameter command was the last
value of the previous string. If, for any reason, a command
is sent without a parameter following the command, the CL
command can be used to clear the active command, or a new
command can be used. The parameter number listed in Table
4-1 is the number returned when the talk parameter mode
(talk mode 6) is exercised.
4-70. Listen Action Commands. Listen action commands
are listed in Table 4-2. These commands initiate an action
without any parameters being sent.
4-71. Listen Array Commands. Listen array commands
listed in Table 4-3 transfer arrays of data (more than one
parameter) to the instrument. Sensor data and DC calibration
data are typical data. The data array is formatted as in
paragraphs 4-93, 4-100, and 4-110. The actual amount of
data depends on the specific command being used. Listen
b. The data strings sent to the instrument are not case
4-17
Page 52

Section IV
Application Notes
array commands are only operable over the bus, and have
no application from the front panel.
4-72. The talk array commands listed in Table 4-4 build a
talk string in the talk buffer for transmission. Not for general
purpose measurement (the talk modes are used for that), the
talk array commands are used for transmitting arrays of data
(more than one parameter), such as sensor data and DC
calibration data. The buffer contents are discarded at the time
of the next instrument talk request. These commands
automatically change the talk mode to talk mode 7, then
reset the Model 4230A to its previously selected talk
mode. This is the only time that the instrument uses the talk
buffer or talk array mode. Talk array commands are
operable only over the bus.
4-73. Talk Modes. When the Model 4230A is requested
to talk, it responds according to how it has been set up. The
talk setup is either through talk array commands or talk
modes. Talk modes are associated with making measurements; talk array commands are associated with downloading of calibration data and instrument states. The talk
modes are described in the following paragraphs.
4-74. The Model 4230A supports eight talk modes of
operation, as listed in Table 4-5. Once the talk mode has
been set, the bus controller need only tell the Model 4230A
to talk and it will respond according to the talk mode.
4-75. Talk modes 0 through 6 can be set directly by use of
the talk mode (TM) command. For these modes, the
instrument will remain in the selected mode until the talk
mode is changed or until a talk array command is received.
Talk mode 7 is a temporary talk mode that is automatically
enabled in response to a talk array command. This mode
cannot be set by the bus controller directly. This temporary talk mode is disabled when the talk array operation is
complete.
4-76. The default condition for the talk mode is 0. The talk
modes are described individually in paragraphs 4-77 through
4-86.
4-77. Talk Mode 0 (Talk Measurement Floating Point).
The talk mode 0 format is as follows:
#1,#2
where:
#1 is the error flag (1 = error, data invalid).
#2 is the measurement in floating point notation in
the units selected (dBm, dBr, or milliwatts). In
watts mode, the unit is fixed at mW.
Examples:
0,0.00E00 - No error, power is 0.00 dBm
1,0 - Under range error at -75.00 dBm
0,98.9E-6 - No error, power is 98.9 nW
4-78. Talk Mode 1 (Talk Measurement with Units). The
format for talk mode 1 is as follows:
#1,$1
where:
#1 is the error flag (1 = error).
$1 is the measurement. The format is fixed point
followed immediately by a three character string
that indicates the unit of measurement. Possible
units are “dBm”, “dBr”, “nW”, “uW”, “mW”,
and “W”, "kW", and "MW". If needed, the string
can be parsed externally into a number and a
three character message.
Examples:
0,0.00dBm - No error at 0.00 dBm
1,0dBm - Under range error at -75.00 dBm
0,98.9uW - No error at 98.9 microwatts
4-79. Talk Mode 2 (Talk Error). The talk mode 2 format
is as follows:
#1,#2,#3
where:
#1 is the instrument error number. A 0 will always
be reported in this position.
#2 is the measurement error, from 0 to 99. A 0
indicates no error. Refer to Table 4-6 for error
messages.
#3 is the channel reporting errors. A 1 is reported for
channel 1 and a 2 is reported for channel 2.
Execution of this talk mode automatically clears the
measurement error after it has been reported. If more than
one error occurs, the instrument will indicate the first one that
occurred.
Examples:
0,0,1 - No error is reported for channel 1
0,3,2 - Power level is underrange for channel 2
4-80. Talk Mode 3 (Talk Both Channels). The talk mode
3 format is as follows:
#1, #2, #3, #4
where:
#1 is the error flag for channel 1
(1 = error, data invalid)
4-18
#2 is the measurement in floating point notation in
Page 53

Section IV
Application Notes
the units selected (dBm, dBr, mW). In watts mode,
the unit is fixed at mW.
#3 is the error flag for channel 2 (1 = error, data
invalid)
#4 is the measurement in floating point notation in
the units selected (dBm, dBr, mW). In watts mode,
the unit is fixed at mW.
Examples:
0,0.00E00,0,1.00E00 - No error, power is 0.00 dBm
on channel 1 and 1.00 dBm on channel 2.
1,0,0,1.00E00 - Channel 1 under range at -75 dBm
and 1.00 dBm on channel 2.
0,90.1E-6,0,1.00E1 - No error, power is 90.1 nW on
channel 1 and 10.00 dBm on channel 2.
4-81. Talk Mode 4 (Talk with Channel Status). The format
for talk mode 4 is as follows:
#1,#2,#3,#4,#5,#6,#7
where:
#1 is always 1 in the 4230A
#2 is always 1 in the 4230A
#3 is the measurement units that the channel is set;
0 Power in watts, milliwatts, microwatts, or
nanowatts
1 Power in dBm
2 Power in dBr
#4 indicates the trigger mode of operation;
0 Measure Normal (also known as free-run)
1 Measure Filtered
2 Measure Settled
3 Trigger Normal
4 Trigger Filtered
5 Trigger Settled
6 Reserved
#7 is the software version number.
4-82. Talk Mode 5 (Talk Instrument Status). The format for
talk mode 5 is as follows:
#1,#2,#3,#4
where:
#1 is always 0 in the 4230A
#2 indicates calibrator status;
0 off
1 on
#3 is always 0 in the 4230A
#4 is always 0 in the 4230A
4-83. Talk Mode 6 (Talk Parameter). The format for talk
mode 6 is as follows:
#1,#2
where:
#1 is the active parameter number (0 = no
parameter selected).
#2 is the active parameter value, for example
“frequency”. The units are defaulted.
4-84. This command returns two numbers which describe
the current “opened” or selected parameter in the instrument
and its value. For example, the frequency to which the
instrument is set can be read over the bus. To read a
parameter, it must be “opened” first as described in
paragraph 4-85. A parameter in the Model 4230A is defined as
a front panel or bus command that allows or requires a numerical
value to be entered into it. The parameters and parameter
numbers are listed in Table 4-1. The data sent over the bus is
the same as the data that would appear on the instrument's
displays when the parameter is selected.
4-85. To use this talk mode, the instrument is first placed in talk
mode 6 and a parameter is then opened (made active) by
sending the bus command. No numeric value should follow
and the clear command should not be used. Then, while the
parameter is active, a talk command is issued to the
instrument and the data for that parameter is sent out on the
bus. A parameter can be deactivated by simply entering a
number or sending another command.
7 Measured Fast Single
8 Measured Fast Dual
9 Reserved
10 Trigger Fast Single
11 Trigger Fast Dual
#5 is always 0 in the 4230A
#6 is always 0 in the 4230A
Examples:
0,0 No parameter is active and the second
value should be ignored
10,-3.00 The dB cal factor is currently set to
-3.00 dB.
5,1 Range 1 is set.
4,1.23 The frequency is set to 1.23 GHz
4-19
Page 54

Section IV
Application Notes
Error Message
Code Description
0 No Errors
1 Number entry out of range for parameter set.
2 Unused
3 -LO- indication on display. Is caused by
4 -HI- indication on display. Is caused by
5 Occurs when input channel attempts to autorange below the range 0. Caused by incorrect
6 Unable to zero instrument because power is applied to the sensor, the sensor is damaged,
7 thru 23 Unused
24 Frequency out of range of entry. This error applies to sensors not calibrated at the
25 thru 29 Unused
30 The message string has exceeded 150 characters. All commands sent are ignored.
31 The command string sent has not been recognized by the instrument. If more than one
32 thru 38 Unused
39 Calibration attempted when power exceeds +3 dB of the 0 dBm reference, or when
TABLE 4-6. ERROR MESSAGES
a. Power level below amount allowed in dBm display during autorange
b. Power level below amount allowed for range set in watts or dBm display.
a. Power level above amount allowed in dBm display during autorange.
b. Power level above amount allowed for range set in watts or dBm display.
zeroing of channel or a sensor which is damaged or not connected.
or the sensor is not connected.
frequency entered.
command has been sent, the commands occurring before the unrecognized command have
been executed, while subsequent commands will be ignored.
calibration is attempted at +3 dB from -10 dBm, +10 dBm or +20 dBm.
4-86. Talk Mode 7 (Talk Array). Each of the different talk
array commands has a different format. (Refer to the
applicable section of paragraph 4-75.) This talk mode is not
directly settable by the bus controller; it is set automatically
by execution of one of the talk array commands. Talk mode
7 builds a data string in the talk buffer for a one time
transmission. It is used to send an array of numerical data or
a string of character data, such as sensor and/or calibration
data. Once executed, this mode is automatically cleared to
its previously selected value or default condition.
4-87. IEEE-488 BUS ONLY COMMANDS.
4-88. General. The following paragraphs cover commands
that are available only under remote control on the bus.
4-89. Talk Mode (TM) Command. The talk mode command is
used to change to a selected talk mode. The range of data for
this command is from 0 to 6. Talk mode 7 can only be set
indirectly by execution of a talk array command. The talk mode
command is classified as a listen parameter command.
4-20
Example:
TM1 - Set talk mode 1 which is talk measurement
with units.
4-90. SI Command. Used in conjunction with the SO
command, this command is used to send a portion of the
sensor calibration data to the Model 4230A in the form of an
array of numeric data. In this way, sensor data can be
transferred from one instrument to another, or stored on a disk.
4-91. The data is the sensor model, sensor S/N, and the 14 point
linearity data (AC calibration data) for a selected sensor.
This command complements the SO command over the
bus, and the SO command would normally be the source of
the data string for this command. The SI command is
classified as a listen array command.
4-92. In addition to the 14 point linearity data, each sensor
has high frequency calibration data, which is loaded with
the FI command. (See paragraph 4-98.)
4-93. The format for the SI command is as follows:
Page 55

Section IV
Application Notes
SI sensor model, sensor serial number,
U0,U1,U2,U3,U4,U5,U6,D0,D1,D2,D3,D4,D5,D6
where:
Sensor model is a number in the form 51XXX,
where XXX is a three digit number sent to the
instrument. Sensors must be resident in the
instrument firmware.
Sensor serial number is from 0 to 99999, representing
the last 5 digits of the sensor’s full serial number.
U0 through U6 are the upscale gain factors (1000 to
9999, nominally 5000).
D0 through D6 are the downscale factors (-999 to
+999).
Each numeric value must be separated by a valid delimiter.
Example:
SI13,1234,5012,5003,5032,5013,4995,5005,4891,
-20,-21,2,-3,-14,15,6
4-94. SO Command. Used in conjunction with the SI
command, this command is used to send sensor 14 point
linearity data out to the bus controller. (Refer to the SI
command description for the general use of these
commands.) Sensor data also includes high frequency
calibration data, but this data is handled with the FI
command. See paragraph 4-98.
4-95. When executed, the SO command instructs the
instrument to build an array of numeric data in the talk buffer
for transmission by the next talk request. The array consists
of sensor model, sensor S/N, and numeric data representing the
14 point linearity data (AC calibration data) for a selected
sensor. This command complements the SI command over
the bus, and the SI command would normally be the
destination of the data string of this command. The SO
command is classified as a talk array command.
4-96. The talk mode is set temporarily to talk mode 7 (talk
array) when this command is executed. After execution, the
talk mode is reset to the previous setting. A clear command
will also reset the talk mode.
From the instrument in the next talk string:
51013,1234,5023,5001,5012,5010,4997,5005,
5003,10,13,-2,-23,14,-15,6
4-98. FI Command. Used in conjunction with the FO
command, this command is used to send sensor high frequency
calibration data to the Model 4230A for a selected sensor in the
form of an array. In this way, sensor data can be transferred from
one instrument to another, or stored on a disk. In addition to
the high frequency calibration data, there is 14 point calibration
data for the sensor, but this is handled by the SI command.
4-99. The data is for a selected sensor. This command
complements the FO command over the bus, and the FO
command would normally be the source of the data string for
this command. This command is classified as a listen array
command. Data is loaded in blocks from 1 to 12 pairs.
4-100. The command format is as follows:
FI n, FRn, CRn, FRn+1, CFn+1, .... FRN+11, CFn+11
where:
n is the table number pointer, from 0 to 59.
FRn is the first frequency of this group, from 0.00 to
100 GHz in 0.01 GHz increments. It is sensor
dependent.
CFn is the first dB cal factor for this group, from -3.00
to +3.00 dB in 0.01 dB increments.
Each numeric value must be separated by a valid delimiter.
4-101. The total number of frequency points is limited to 60
for sensor tables 1 through 6. The table number pointer is the
beginning location for the frequency/dB cal factor pairs.
Frequency cal points must be in numerical order of
frequency. Generally, the first point is at 0 GHz, with a cal
factor of 0.
Example:
FI0,0.00,0.00,1.00,-0.05,2.00,-0.07,3.00,0.10,4.00,
-0.06,5.00,-0.05,6.00,0.00,7.00,0.13,8.00,0.42,
9.00,0.34,10.00,0.00,11.00,0.15,
FI12,12,.12,13,-.13,14,1.14,15,.85
4-97. Formats are as follows:
a. To the instrument in a listen string: SO
b. From the instrument in the next talk string: sensor
model, sensor serial number,
U1,U2,U3,U4,U5,U6,D0,D1,D2,D3,D4,D5,D6, where the
format descriptions are the same as in paragraph 4-93. Each
numeric value must be separated by a valid delimiter.
Example:
To the instrument in a listen string: SO
4-102. FO Command. Used in conjunction with the FI
command, this command is used to send sensor high
frequency calibration data out to the controller. Refer to the
FI command description for the general use of these
commands. Data points are loaded in blocks of 12.
4-103. When executed, this command instructs the
instrument to build an array of numeric data in the talk buffer
for transmission by the next talk request. The array consists
of numeric data representing the dB cal factor information
for a selected sensor table. The FO command is classified as
4-21
Page 56

Section IV
Application Notes
TABLE 4-7. SRQ MASKS - NATIVE MODE
Bit Description
0 Set bit indicates LO LIMIT alarm in Channel 1
1 Set bit indicates that a measurement error has occurred
2 Set bit indicates that either a Trigger Filtered or Trigger Settled measurement is ready
3 Set bit indicates that a CAL/Zeroing command is complete
4 Set bit indicates HI LIMIT alarm in Channel 1
5 Set bit indicates LO LIMIT alarm in Channel 2
6 Set bit indicates that an SRQ is active; this is a summary bit used in serial poll, not a masked bit
7 Set bit indicates HI LIMIT alarm in Channel 2
a talk array command.
4-104. The talk mode is temporarily set to talk mode 7 (talk
array) when this command is executed. After the command
has been executed, the talk mode is reset to the previous
setting. A clear command will also reset the talk mode.
4-105. The format for the FO command is as follows:
a. To the instrument in the listen string: FO n
b. From the instrument in the next talk string: FRn, CRn,
FRn+1, CRN+1, .... FRn+11, CFn+11
where:
n is the table number pointer, from 0 to 60.
FRn is the first frequency of this group, from 0.00
to 100 GHz in 0.01 GHz increments. It is
sensor dependent.
CRn is the first dB cal factor for this group, from
-3.00 to +3.00 dB in 0.01 dB increments.
Each numeric value will be separated by a comma.
4-106. Refer to the FI command for limitations on the pointer
and starting frequencies, and for general use of this
command.
Example:
listen action command. Its functions are to blank the front
panel display for secure ATE applications and to speed up
operations by reducing the number of tasks that have to be
performed by the Model 4230A. When the display is turned off,
the display hardware is still functional, but it is not updated for
certain types of information.
4-108. DN Command. This command enables the front
panel display, complementing the DF command. This
command is classified as a listen action command.
4-109. SM (SRQ Mask) Command. This command is
used to set the SRQ mask which selectively enables
service requests generated by the Model 4230A. This
command is classified as a listen parameter command. The
range of numeric entry is from 0 to 255. The SRQ mask is
logically ANDed with the SRQ sources to determine if an
SRQ should be generated. The SRQ bit map is shown in
Table 4-7. For more information on SRQ and the related
serial poll, refer to paragraph 4-65.
Examples:
SM 0 - Disable all service requests
SM 2 - Enable SRQ only on measurement errors
SM 8 - Enable service request only when a zero-
ing operation is complete
Command sent to the instrument: FO 0
Numeric array built into the talk buffer:
0.00,0.00,1.00,-0.05,2.00,-0.07,3.00,-0.10,4.00,
-0.06,5.00,-0.05,6.00,0.00,7.00,0.13,8.00,0.42,
9.00,0.34,10.00,0.00,11.00,0.15
Command sent to the instrument: FO 3
Numeric array built into talk buffer:
3,00,-0.10,4.00,-0.06,5.00,-0.05,6.00,0.00,7.00,
0.13,8.00,0.42,9.00,0.34,10.00,0.00,11.00,0.15,
12.00,0.32,13.00,0.25,14.00,0.43
4-107. DF Command. This command is classified as a
4-22
4-110. MEASURED AND TRIGGERED OPERATION
AND SETTLED READING.
4-111. General. Five measurement modes and five trig-
gered modes are available over the bus. They are:
a. Measure Normal (also known as free-run)
b. Measure Filtered
c. Measure Settled
d. Measure Fast Single Channel
e. Measure Fast Dual Channels
f. Trigger Normal
g. Trigger Filtered
Page 57

Section IV
Application Notes
h. Trigger Settled
i. Trigger Fast Single Channel
j. Trigger Fast Dual Channels
The instrument must be in remote bus operation to invoke
these modes of operation. When in local operation, only
measure normal is available. The five measurement
modes are each self triggering (free running) while the
triggered modes require a bus trigger command. The
operation of each mode is modified by filter selection and
range selection. See paragraphs 4-16 and 4-18. The
modes are described below.
4-112. Measure Normal (MN). This is the mode to which
the instrument initializes at power up when the local
command is issued in bus operation or when returning
from a calibration mode.
4-113. Measure Filtered (MF). In this mode, the front
panel display is self triggered and continuously updated.
In response to a step change in power of approximately
0.02 dB or an internal range change, the front panel
displays the “——.——” (dashes) message until the
digital filter time constant has elapsed. This mode guarantees that the reading is filtered by holding off the display
of partially filtered readings.
4-114. Measure Settled (MS). In the MS mode, the front
panel display is self-triggered and continuously updated. In
response to a step change in power or an internal range
change, the front panel displays the "–––" (dashes) message until the settled condition occurs. The minimum time
for a settled reading is twice the selected filter time constant. The maximum time is unlimited, because the settled
condition may never occur for noisy signals or constantly
varying signals. This mode should not be used in a data
acquisition system because the unsettled condition may
holdoff the GPIB indefinitely.
4-115. Measure Fast Single (MFS). The measure fast
single channel mode of operation provides the
instrument's fastest measurement response when addressed to talk over the IEEE bus. Measurements at a rate
of 240 readings per second can be obtained (see Figure 4-
11). This mode only applies to channel 1 and will disable
channel 2 when executed. The fast hardware filter for
channel 1 is employed.
4-116. Measure Fast Dual (MFD). The measure fast dual
channel mode of operation provides the instrument's fastest
measurement response for both channels when addressed to
talk over the IEEE bus. Measurements at a rate of 120
readings per second for each channel can be obtained. In this
mode, the fast hardware filters for channel 1 and channel 2
are employed.
4-117. Trigger Normal (TN). In this mode, the front panel
displays the -TRIG- message until the 4230A is triggered by a
bus command. The instrument continuously measures
power as in the measure normal mode but does not display the
reading. When triggered, the instrument captures the most
recent measurement and displays the reading until another
trigger command changes the display. This mode provides a quick response to trigger and the capability to hold
a reading until required. However, the user is required to
assure stability of the reading at the time of trigger.
4-118. Trigger Filtered (TF). When entering this mode, the
front panel displays the "-TRIG-" message. When a bus
trigger command is received, the instrument begins the
measure filtered mode. The 4230A displays the "-TRIG-"
message until the digital filter time constant has elapsed. The
instrument displays and holds the filtered reading until another
bus trigger command is received. In this mode, the digital filter
guarantees a filtered reading upon trigger and the capability to
hold a reading until required.
4-119. Trigger Settled (TS). When this mode is entered, the
front panel displays the "-TRIG-" message. The measure
settled mode begins when a bus trigger command (GET) is
received. The "-TRIG-" message will continue to be displayed
until the settled condition occurs. The minimum time for a
settled reading is twice the selected filter time constant. The
maximum time is unlimited, because the settled condition may
never occur for noisy signals or constantly varying signals. In
a data acquisition system this mode should be used only in
connection with a bus service request (SRQ) to signal the
controller when the measurement is complete. This allows the
user's program to limit the time allowed for settling and take
appropriate action if it is not achieved. Otherwise, an unsettled
condition may holdoff the GPIB indefinitely.
4-120. Trigger Fast Single (TFS). When the TFS command
is executed, the front panel displays the "-TRIG-" message.
Once a bus trigger command is received, the instrument
begins the fast single channel measurement mode of operation. The "-TRIG-" message is displayed until the completion of the measurement. Triggered response times of 5 ms
may be obtained (see Figure 4-11). This mode only applies
to channel 1 and will disable channel 2 when executed. The
fast hardware filter for channel 1 is employed.
4-121. Trigger Fast Dual (TFD). When the TFD command
is executed, the front panel displays the "-TRIG-" message.
Once a bus trigger command is received, the instrument
begins the fast single channel measurement mode of operation. The "-TRIG-" message is displayed until the completion of the measurement. Triggered response times of 10 ms
may be obtained. In this mode, the fast hardware filters for
channel 1 and channel 2 are employed.
4-122. IEEE PROGRAMMING EXAMPLES.
4-123. The following programming examples demonstrate,
bus operation of the 4230A. The examples are written in a
general format of BASIC and are not an example of any
specific implementation of the language. The examples
assume that the 4230A is the only instrument connected to the
bus so that all commands address the 4230A.
4-23
Page 58

Section IV
Application Notes
4-124. In the examples, “INPUT” refers to the case where
the instrument is addressed as the talker; “OUTPUT”
indicates that the controller is the talker.
4-125. Example 1. Zero the instrument and take a reading
with channel 1 from a signal generator.
Setup conditions : Select channel 1 sensor data adapter
Frequency of 5 Gigahertz
Reading in milliwatts and also dBm
Filter of 3 seconds
Generator output is -17 dBm
OUTPUT "CH1": Select channel 1
OUTPUT “SS5” : use sensor data adapter
OUTPUT “FR5” : set frequency to 5 GHz
OUTPUT “FL3” : set filter to 3 seconds
OUTPUT “TM0” : set TALK MODE to “0”
disconnect sensor from generator
WAIT 1000 : wait one second
OUTPUT “ZR” : zero instrument
Setup channel 1
OUTPUT "CH1" : select channel 1
OUTPUT “SS5” : use sensor data adapter
OUTPUT “FR18” : set frequency to 18 GHz
OUTPUT “PW” : set WATTS display
OUTPUT “FA” : set filter to Autofilter
Setup channel 2
OUTPUT "CH2" : select channel 2
OUTPUT "SS6" : use sensor data adapter
OUTPUT "FR5" : set frequency to 5 GHz
OUTPUT "PW" : set Watts display
OUTPUT "FA" : set filter to Autofilter
Setup trigger mode
OUTPUT "TM3" : set TALK MODE to 3
OUTPUT "TS" : set Trigger Settled operation
Connect sensor to generator
TRIGGER : send Group Execute Trigger
WAIT 30000 : wait for zero to complete
Reconnect sensor to generator
WAIT 3000 : the filter time constant
INPUT A,B : get reading from 4230A
PRINT A : print “0” which is the error code
PRINT B : print “.01995” which is the power in
milliwatts
Change talk mode and take another reading in dBm
OUTPUT “TM1” : set TALK MODE to “1”
OUTPUT “DB” : set 4230A to dBm display
WAIT 3000 : the filter time constant
INPUT A$ : get a reading from the 4230A
PRINT A$ : print string variable “0,-17.00dBm”
4-126. Example 2. Take triggered readings with Channel 1 and
2 from signal generators.
Setup conditions : Select sensor data adapters
Channel 1 power = 100 microwatts
Channel 2 power = 350 microwatts
Channel 1 frequency = 18 GHz
INPUT A,B,C,D : get reading from Model 4230A
PRINT A,B : print channel 1 "0,100.00E-3"
PRINT C,D : print channel 2 "0,350.00E-3"
4-127. ERROR MESSAGES.
4-128. The error messages returned over the bus are described
in Table 4-6. They are in numerical order as would be sent out
over the IEEE-488 bus.
4-129. HP 437B and 438A BUS EMULATION.
4-130. The Model 4230A native mode is a superset of the
mnemonics used for the Boonton Model 4220A RF Power
Meter. Additional commands have been added to support
dual channel operation, sensor data adapters and the high
speed sampling modes. The Model 4230A is equipped to
emulate the HP 437B and 438A bus mnemonics. These
modes are available for users wanting to use the Model 4230A
in existing systems who cannot re-write their application
programs. Refer to paragraph 3-20 for configuring the
Model 4230A for these modes of operation. The IEEE-488
capabilities in the HP emulation mode are the same as the
native mode as described in paragraphs 4- 55 through 4- 65.
4-131. Turn-on Default Conditions. Several emulation
parameters are reset at turn-on. The parameters and their
default conditions are listed below.
4-24
Channel 2 frequency = 5 GHz
Reading in milliwatts
Autofilter
Bus emulation mode = 4230A (factory default)
GPIB Local Mode
Unaddressed
Page 59

Section IV
Application Notes
Service Request Mask cleared
Status Byte cleared
Free Run Trigger Mode
GT2 (Trigger with Delay) response to Trigger message
Event Status Enable Mask = 0
4-132. Sending the Data Message.
4-133. Data Output Format. The output data is usually
formatted as a real constant in exponential form. That is; first
the sign, then a 5 digit number with the decimal point
appropriately located followed by the letter E (signifying that
an exponent follows). The letter E is followed by a signed
power-of-ten multiplier. The string is terminated by the EOS
character set via the Menu-Setup-IEEE-EOS talker/
listener commands (refer to paragraph 3-20).
Exceptions to this format are the data output for the
following functions:
Identification
Read Service Request Mask Value
Read Event Status Register Mask Value
Read Event Status Register Value
Identification. This function is used to identify the Power
Meter's model number and the firmware version. After
receiving the *IDN? or ID (437B) or the ?ID (438A)
mnemonic and when addressed to talk, the Power Meter
sends the following string:
BOONTON ELECTRONICS, 4230A,,X.XX
4230A is the instrument model number and X.XX is the firmware
version number.
Measurement Error: When the power applied to the
sensor is incorrect for the current instrument
configuration.
Event Status Register: When a specified condition in the
Event Status Register occurs and the corresponding bit in the
Event Status Enable Register is enabled (via *ESE), this bit
will be set true.
4-135. Service Request Mask. This mask determines which
bits can set the Status Byte's SRQ bit true (see Table 4-8).
When this bit becomes true, the SRQ line is also true. To set
the mask, use the *SRE or "@1" mnemonic followed by an
argument between the values of 0 and 255. The argument is
determined by summing the weights of each bit to be checked.
4-136. Sending the Service Request Mask Value. The
program mnemonics "*SRE?" and "RV" will cause the
Power Meter to respond when addressed to talk, with the
present value of the Service Request Mask. This value is the
summed weights of the bits that are set true. The bit pattern can
be interpreted with the information in Table 4-8.
TABLE 4-8. STATUS BYTE AND SERVICE
REQUEST MASK (HP437B and 438A ONLY)
Bit Value Description
(decimal) (hexadecimal)
0 1 1 Data Ready
1 2 2 Cal/Zero Complete
2 4 4 Entry Error
3 8 8 Measurement Error
4 16 10 Not supported
5 32 20 Event Status Register
4-134. Sending the Require Service Message. The Power
Meter sends the Require Service message by setting the
Service Request (SRQ) bus control line true. The front panel
SRQ annunciator is enabled when the Status Byte has been
set. The Require Service message is cleared when a serial
poll is executed by the controller or when a "CS" (clear status
byte) or "*CLS" (clear all status bytes) mnemonic is received
via a Data message.
There are five conditions that can be enabled to cause the
Require Service message to be sent. These conditions, which
are enabled by the Service Request Mask, are as follows:
Data Ready: When the Power Meter has a data point
requested by a trigger command.
Cal/Zero Completed: When the Power Meter has
completed a calibration or zeroing cycle.
Entry Error: When a number is entered via GPIB that is out
of the allowable range for the selected parameter.
6 64 40 Require Service (RQS)
7 128 80 Not used; always zero
4-137. Event Status Register. This register is a second status
byte which extends the use of the Service Request Status Byte
(see Table 4-9). The bits are set true when the specified event
occurs provided the enable mask has been previously set. The
mask is set by sending the "*ESE" mnemonic followed by an
argument, the summed value of the bits of the desired condition
to request service.
When a bit in the Event Status Register is set true, bit 5 of the
Status Byte will also be sent if so enabled. The value of this
register can be read via the "*ESR?" program code. After the
instrument receives this command, the next time it is
addressed to talk a number will be sent representing the
weighted value of the bits set.
4-25
Page 60

Section IV
Application Notes
TABLE 4-9. EVENT STATUS REGISTER
(HP437B and HP438A ONLY)
Bit Value Description
0 1 Not used; always zero
1 2 Not used; always zero
2 4 Not used; always zero
3 8 Device Dependent Error
4 16 Execution Error
5 32 Command Error
6 64 Not used; always zero
7 128 Power On
Device Dependent Error: This bit is set when a
measurement error occurs.
Execution Error: This bit is set when improper data has
been received by the instrument. For example, sending a
negative value for frequency is considered an execution
error.
Command Error: This bit is set when the instrument
parses a GPIB mnemonic which is not recognized. For
example, the program code "XX" would produce a
command error.
key which serves as the return to local function. The display
will show the REM indicator on the last line and enable the
TLK, LSN and SRQ as appropriate.
4-142. Returning to Local Mode. The instrument will
return to the local state when;
a. The <Menu> key is pressed.
b. The ASCII "SO" character (hexadecimal 0E/CTRL N)
is received.
NOTE
The instrument must be placed in the remote state for it to
respond to data messages. It is not possible to store data in
the local state for execution in the remote state.
4-143. Talk Operations. The Model 4230A can be requested
to talk in two ways. The "??" mnemonic is available for
requesting data via the RS-232 port. Immediately after
receiving this mnemonic, the instrument responds by
transmitting data based on the current talk mode. For
example, the following interactive sequence causes the
Model 4230A to transmit the measurement with the associated
units:
Terminal Sends Model 4230A Response
O (CTRL O/hexadecimal 0F) REM annunciator illuminates,
indicating remote operation.
Power On. This bit is set in the instrument's initialization
sequences when the power is toggled from OFF (0) to ON (1).
4-138. HP Emulation Codes. The Model 4230A has the ability
to emulate many of the HP 437B and HP 438A remote
programming modes. Tables 4-10 and 4-11 summarizes the
HP menumonic set. In cases where the Model 4230A cannot
execute the HP code, it is noted with the comment "NOT
SUPPORTED". The Emulation Mode can be enabled either
by the Menu-SETUP-IEEE-EMULATION command (437B
or 438A option) or by sending the "HPS" or "HPD" program
code via the bus. This mode is disabled by setting the MenuSETUP-IEEE-EMULATION command to the "4230A" option
or sending the "BN" mnemonic over the bus. The Boonton
4230A command set is listed in Table 4-12.
4-139. REMOTE OPERATION, RS-232 INTERFACE.
4-140. General. RS-232 interface is available for the
Model 4230A in lieu of the IEEE-488. The command set
and data transfer protocol are nearly identical to those for
the GPIB option. The Menu-SETUP-RS-232 commands
are used to configure the RS-232 interface to comply with
the terminal in use. Setting the end-of-string character and
SRQ Mask is accomplished by using the EOS Talker/
Listener and SRQ Mask commands respectively.
4-141. Entering the Remote Mode. The Model 4230A
enters the remote mode when the ASCII "SI" character
(hexadecimal 0F/CTRL O) is received. In the remote state,
the front panel keyboard is disabled, except for the <Menu>
4-26
DB TM1 ??<ENTER> Set measurement to dBm, set the
talk mode to 1 (talk
measurement with units), talk.
0,-3.00 dBm - No error at -3
dBm
NOTE
<ENTER> means transmit end-of-string as defined via the
Menu-SETUP-RS 232-EOS Listener parameter (typically
CR).
4-144. Additionally, the ASCII "DC2" character
(hexadecimal 12/CTRL R) will cause the instrument to
immediately transmit data based on the current talk mode.
Continuing the above example:
Terminal Sends Model 4230A Response
TM0 <ENTER> Set the talk mode to send
Floating Point
Measurements.
R (CTRL R/hexadecimal 12) Talk the error flag and the
measurement in floating
point notation.
0,-3.00 - no error, power is
-3 dBm
4-145. The rules for number and data strings are the same
as for the IEEE-488 interface. Number formats are free
form and data strings are case insensitive.
Page 61

Section IV
Application Notes
TABLE 4-10. HP 437B EMULATION GPIB COMMANDS
437B Code Description Comments
CL 0 dBm Calibration
*CLS Clear the status register
1
3
CS Clear the status byte
CT0 - CT9 Clear sensor data tables 0 - 9
1
NOT SUPPORTED
DA All display segments on
DC0 Duty cycle on ('DY' ARG # 100) NOT SUPPORTED
DC1 Duty cycle off ('DY' ARG = 100) NOT SUPPORTED
DD, DF Display disable
DE Display enable
DN Down arrow key
DU Display user message
DY Duty cycle value
1
EN ENTER
ERR? Device error query
*ESE Set event status enable mask
*ESE? Event status register query
*
ESR? Event status register (ESR) query
ET0 - ET9 Edit sensor calibration factor table 0 - 9
3
3
3
1
EX EXIT
FA Automatic filter selection
FH Filter hold
FM Manual filter selection
FR Frequency entry
1
1
GT0 Ignore group execute trigger (GET) bus command
GT1 Trigger immediate response to GET command
GT2 Trigger with delay response to GET command
GZ Gigahertz
HZ Hertz
ID GPIB identification query
*IDN? GPIB identification query
KB calibration factor
1
in percent
2
NOT SUPPORTED
4-27
Page 62

Section IV
Application Notes
TABLE 4-10. HP 437B EMULATION GPIB COMMANDS (CONT)
437B Code Description Comments
KZ Kilohertz
LG Log display
LH High limit
LL Low limit
1
1
LM0 Disable limits checking function
LM1 Enable limits checking function
LN Linear display
LP Learn Mode NOT SUPPORTED
LT Left arrow key
MZ Megahertz
OC0 Reference oscillator off
OC1 Reference oscillator on
OD Output display text NOT SUPPORTED
OF0 Offset off
OF1 Offset on
OS Offset value
4
4
1
NOT SUPPORTED
NOT SUPPORTED
PCT Percent
PR Preset
RA Autorange
RC RECALL
RE Resolution
RF0 - RF9 Enter sensor reference calibration factor
1
1
1
1 - 4
1 - 3
NOT SUPPORTED
RH Range hold
RL0 Exit REL mode
RL1 Enter REL mode using new REL value
RL2 Enter REL mode using old REF value
RM Set range
1
*RST Soft reset
RT Right arrow key
RV Read Service Request Mask value
SE Sensor number
1
4-28
1-6 only
Page 63

Section IV
Application Notes
TABLE 4-10. HP 437B EMULATION GPIB COMMANDS (CONT)
437B Code Description Comments
SM Status message NOT SUPPORTED
SN0 - SN9 Enter sensor serial number
2
NOT SUPPORTED
SP - N0P SPECIAL NOT SUPPORTED
*SRE Set the service request mask
*SRE? Service request mask query
ST STORE
1
3
3
1 - 4
*STB? Read the status byte
TR0 Trigger hold
TR1 Trigger immediate
TR2 Trigger with delay
TR3 Trigger-free run
*TST? Self test query
3
UP Up arrow key
ZE ZERO
@1 Set the service request mask
@2 Learn mode prefix NOT SUPPORTED
% Percent
1 A numeric entry is required by these GPIB codes, followed by the code EN (ENTER).
2 This GPIB code uses the next 6 characters (0 - 9, A - Z, or an underscore) as input data.
3 The * must be included as part of the GPIB command string.
4 Offset value is always applied. Set the offset value to 0 dB for off condition. Any other value the offset is on.
4-29
Page 64

Section IV
Application Notes
TABLE 4-11. HP 438A EMULATION GPIB COMMANDS
438A Code Description Comments
AD Measure A-B
AE Set A
AP Measure sensor A
AR Measure A/B
BD Measure B-A
BE Set B
BP Measure sensor B
BR Measure B/A
CL CAL ADJ
CS Clear status byte
DA Display all
DD Display disable
DE Display enable
1,2
1
1
1
1
DO Measured offset entry
EN ENTER
1
FA Set auto average filtering (precede with AE or BE)
FH Hold present average number (precede with AE or BE)
FM Set filter number
GT0 Group execute trigger cancel
GT1 Group execute trigger single measurement
GT2 Group execute trigger full measurement with settling
GZ Gigahertz
HZ Hertz
?ID Ask of ID
1
1
1
KB Calibration factor
KZ Kilohertz
1
LG Set log units (dB or dBm)
LH High limit
LL Low limit
1,2
LM0 Disable limit checking
LM1 Enable limit checking
LN Set linear units (Watts or %)
1,2
1
1
1,2
1,2
1
1
(precede with AE or BE)
1
1
1
LP1 Set learn mode #1 NOT SUPPORTED
LP2 Set learn mode #2 NOT SUPPORTED
4-30
Page 65

Section IV
Application Notes
TABLE 4-11. HP 438A EMULATION GPIB COMMANDS (CONT)
438A Code Description Comments
1,2
1
1
1
1
1
1,2
1
1
1
1
1,2
1
1
1,2
1
1
1
1
1-4 only
1-4
MZ Megahertz
OC0 Turn off calibrator source
OC1 Turn on calibrator source
OS Offset
PR Preset instrument to a known state
RA Resume autorange
RC RECALL
RH Range hold
RL0 Relative mode off
RL1 Relative mode on
RL2 Relative mode with old REL value
RM Set manual range
RV Ask for status request mask
SM Ask for status message
ST STORE
TR0 Trigger hold mode
TR1 Trigger single measurement
TR2 Trigger full measurement with settling
TR3 Free run trigger mode
ZE Zero sensor (precede with AE or BE)
@1 Prefix for service request mask
1
1
1 These commands are fully compatible with the HP437B Power Meter command codes.
2 Requires numeric entry followed by program code EN.
4-31
Page 66

Section IV
Application Notes
TABLE 4-12. BOONTON 4230A GPIB COMMANDS
Code Description Comments
AM Measure A-B
AP Measure A + B
AR Measure A/B
BD Measure B - A
BR Measure B/A
BN 4230A Native mode NO EMULATION
CH Channel select 1 - 2
CF Calibrator off
CL Clear
CN Calibrator on
CP Calibrate
DB dBm select
DF Display off
DN Display on
DR dBr select
DU Display user message
DY Duty cycle value 0.01 - 100.00 in 0.01 steps
FA Auto filter
FD dB calibration factor -3.00 to 3.00 in 0.01 steps
FI Send high frequency calibration data to instrument
FL Filter time select 0 to 20.00 in 0.05 steps
FO Get high frequency calibration data from instrument
FR Frequency select
HPS Enable HP 437B emulation mode
HPD Enable HP 438A emulation mode
?ID Talk instrument ID
*IDN? Talk instrument ID
LH High limit -99.99 to 99.99 in 0.01 steps
LL Low limit -99.99 to 99.99 in 0.01 steps
LM0 Disable limits checking function
LM1 Enable limits checking function
LR Load reference
4-32
Page 67

Section IV
Application Notes
TABLE 4-12. BOONTON 4230A GPIB COMMANDS (CONT)
Code Description Comments
MF Measure filtered
MFD Measure Fast Dual Channels
MFS Measure fast single channel
MN Measure normal, free run
MS Measure settled
OS Offset value -99.99 to 99.99 in 0.01 steps
PW Watts select
RA Autorange
RB Recorder bottom
RC Recall instrument configuration 1 - 4
RE Resolution 1 - 3
RN Recorder normal
RS Range select 0 - 6
RT Recorder top
SI Send linearity data to instrument
SM Service request (SRQ) mask 0 - 255
SO Get linearity data from instrument
SR Set dBr reference -99.99 to 99.99 in 0.01 steps
SS Sensor select 1 - 6
ST Store instrument configuration 1 - 4
TF Trigger filtered
TFD Trigger fast dual channels
TFS Trigger fast single channel
TN Trigger normal
TM Talk mode 0 - 6
TR Bus trigger
TS Trigger settled
ZR Instrument zero
1 A numeric entry is required by these GPIB codes, followed by the code EN (ENTER).
2 This GPIB code uses the next 6 characters (0 - 9, A - Z, or an underscore) as input data.
3 The * must be included as part of the GPIB command string.
4-33
 Loading...