

Page 1

INSTRUCTION SHEET
WIDEBAND POWER SENSOR
MODEL 5012
©Copyright 2008 by Bird Electronic Corporation
Instruction Book P/N 920-5012 Rev. C
Page 2

Description
The Bird 5012 Wideband Power Sensor (WPS) is a Thruline sensor
that can measure average, peak, or burst power, VSWR, crest factor,
and Complementary Cumulative Distribution Function (CCDF). It
can be used with the Bird 5000-EX Digital Power Meter (DPM) and
the Bird Virtual Power Meter Software (VPM).
NOTE: Firmware upgrades extending the WPS’s capabilities may
be periodically released. For the latest firmware upgrade, contact
Bird Customer Service at (440) 248-1200 or visit our website at
http://www.bird-electronic.com
Connections
WARNING
Never attempt to connect or disconnect RF equipment from the
transmission line while RF power is being applied.
Leaking RF energy is a potential health hazard.
To connect the WPS to the Digital Power Meter, use the serial cable
provided. Connect the male end of the cable to the DPM and the
female end to the WPS. A separate power supply for the WPS is not
required when using a DPM.
There are two ways to connect the WPS to a PC running the Virtual
Power Meter Software:
y To connect using the serial port, first connect a 12V DC power
supply to the WPS. Once the STATUS LED turns on and begins
blinking, use the serial cable provided and connect the female end
of the cable to the computer and the male end to the WPS. The
WPS must be powered up before connecting to the PC.
y To connect using the USB port, connect the USB cable to the
computer and to the WPS. A separate power supply is not required
when using the USB port.
NOTE: When using the optional serial to USB adapter, connect
the WPS serial port to the adapter’s serial port, and the adapter’s
USB connector to the PC.
Page 3
Zeroing Sensor
Average Power
Peak Envelope Power
0 W
50 W
100 W
Over time, the sensor’s “zero value” (reading with no applied RF
power) can drift, making all readings inaccurate by this value. For
example, if the zero value is –0.02 W, measuring a 50 W signal will
give a reading of 49.98 W, a 0.04% error. Measuring a 1 W signal will
give a reading of 0.98 W, a 2% error. If the drift would be a significant
error, rezero the sensor:
y Make sure the sensor has reached a stable operating temperature.
y Make sure no RF power is applied to the sensor.
y Press “Zero”. Calibration will begin.
y Calibration will take about 30 seconds. Do not interrupt the
calibration! A bar on the screen will display calibration progress.
y After successful calibration, “Cal Pass” or “Calibration Complete”
will be displayed. Press any key to return to normal operation.
y If calibration fails, “Cal Fail” will be displayed. Press a key to
return to normal operation, then check that the WPS is properly
connected, and that the RF is off. Rezero.
Function Descriptions
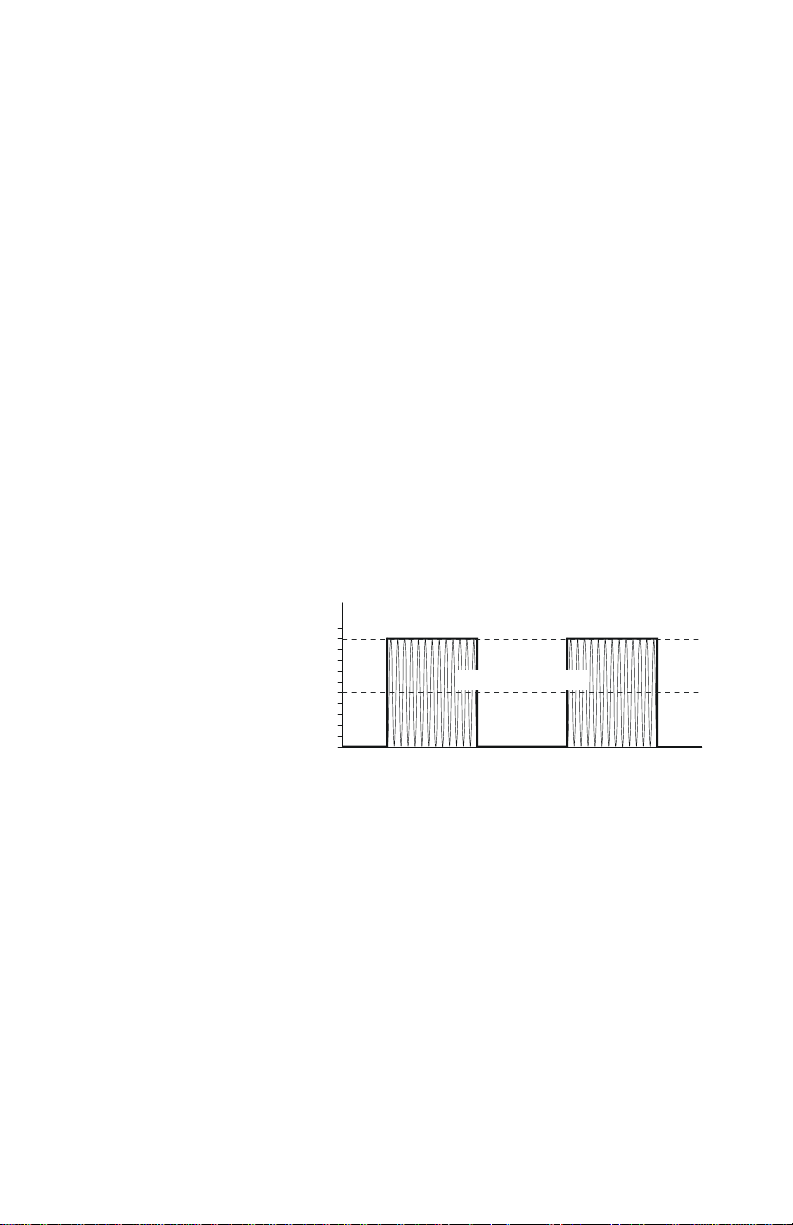
Figure 1
Average and Peak
Envelope Power
Square Wave Signal
Average Power
Average power is a measure of the equivalent “heating” power of a
signal, as measured with a calorimeter. It measures the total RF
power in the system, and does not depend on number of carriers or
modulation scheme. The WPS is a broadband sensor that measures
power across its entire frequency range. Its diodes operate in their
‘square law’ region so that the detector output is directly proportional
to the average power, without any additional error correction.
Average power is the most important measurement of any
transmission system since the average power is normally specified on
the operating license. It is also valuable as a maintenance tool,
showing overall system health, and for calibration.
Page 4
VSWR
Rho (µ) = PRP
F
⁄
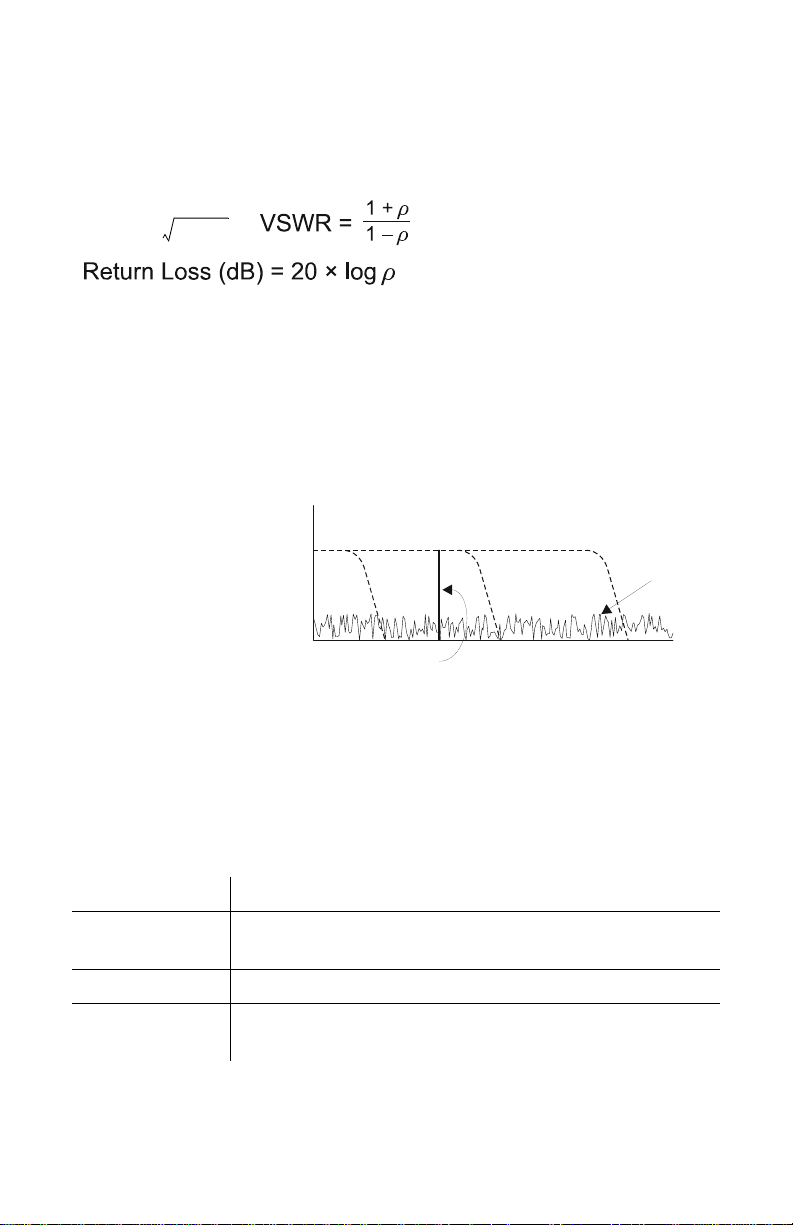
Filter
Too Small
Filter
Too Wide
Correct
Filter
Noise
Signal
VSWR measures the relation between forward and reflected average
power. The Bird Wideband Power Sensor calculates the VSWR from
the Forward and Reflected Average Power measurements. Rho and
Return Loss are also the same measurement, but in different units:
, , and
The health of the feedline and antenna systems can be monitored
using VSWR measurement under full power operating conditions.
High VSWR is an indicator of feed line damage, overtightened cable or
feed line clamps, or antenna changes/damage due to weather
conditions, icing, or structural damage to the tower.
Video Filter
Figure 2
Video Filter Settings,
300 kHz Signal
Except for average power and VSWR measurements, all WPS
measurements rely on a variable video filter to improve accuracy. This
filter can be set to either 4.5 kHz, 400 kHz, or full bandwidth. It should
be as narrow as possible while still being larger than the demodulated
signal bandwidth (video bandwidth). Narrowing the filter limits the
noise contribution caused by interfering signals. Listed below are some
common modulation schemes and the appropriate video filter.
Video Filter Modulation Type
4.5 kHz CW Burst (Burst width > 150 µs), Voice Band AM,
400 kHz CW Burst (b.w. > 3 µs), GSM, 50 kHz AM, DQPSK
Full
Bandwidth
FM, Phase Modulation, Tetra
CW Burst (b.w. > 200 ns), CDMA, WCDMA,
DQPSK, DAB/DVB-T
Page 5

Peak Envelope Power
Average Power
Burst Average Power
Peak Envelope Power
0 W
100 W
50 W
Burst Width
Period
Peak power measurements detect amplitude changes as a signal
modulates the carrier envelope. The WPS operates in an asynchronous cycle: 300 ms of waveform sampling followed by a 50 ms reset
period. The peak power is then displayed and the cycle repeats. The
display therefore updates about three times per second.
Transmitter overdrive can be detected with peak measurements.
Common problems are overshoot at the beginning of burst packets,
amplitude modulation, and excessive transients. These damage
system components with excessive peak power and also cause data
degradation, increasing the Bit Error Rate. For TDMA applications,
Peak and Burst Power measurements are used to detect overshoot in
single timeslots. Other timeslots must be turned off for this test.
Burst Average Power
Figure 3
Burst Average
Power
Burst width (BW) is the duration of a pulse. Period (P) is the time from
the start of one pulse to the start of the next pulse. Duty cycle (D) is
the percentage of time that the transmitter is on. To calculate the duty
cycle simply divide the burst width by the period (D = BW / P). Low
duty cycles mean that the burst width is much less than the period; a
large amount of dead time surrounds each burst. For low duty cycles,
the burst average power will be much larger than the average power.
After peak power is measured, a threshold of ½ the peak is set. The
sampled power crosses that threshold at the beginning and end of
each burst. The time between crossings is used to calculate the duty
cycle. Burst Average Power is calculated by dividing the Average
Power by the Duty Cycle.
Burst power measurements provide accurate, stable measurements in
bursting applications such as TDMA and radar. Accurately measuring
the output signal strength is essential for optimizing radar coverage
patterns. Actual transmitted power in a single timeslot can be determined in TDMA. The other timeslots must be off during this test.
Page 6

Crest Factor
Average Power
Peak Envelope Power
0 W
100 W
50 W
80 W
0 W
50 W
100 W
Figure 4
Crest Factor
10 dB CDMA Signal
100 W Peak
10 W Ave
Crest factor (CF) is the ratio of the peak and average powers, in dB.
The WPS calculates the Crest Factor from the Forward Peak and
Average Power measurements.
Crest factor is becoming one of the most important measurements as
communication systems move into the digital age. For CDMA and
similar modulation types the CF may reach 10 dB. If the crest factor is
too large, the transmitter will not be able to handle the peak powers
and amplitude distortion will occur. Crest factor can also detect
overdrive and overshoot problems. Knowing the CF allows end-users
to more accurately set base station power and lower operating costs.
Complementary Cumulative Distribution Function (CCDF)
Figure 5
CCDF
100 W Signal
80 W Threshold
20% CCDF
CCDF measures the amount of time the power is above a threshold.
Equivalently, it is the probability that any single measurement will be
above the threshold. The WPS samples the power over a 300 ms
window and compares it to a user-specified threshold, in Watts. The
time above the threshold relative to the total time is the CCDF.
CCDF measurements are most useful for pseudo-random signals, such
as WCDMA, where a high CCDF means that the transmitter is being
overdriven. CCDF can also detect amplitude distortion within an
envelope caused by unwanted modulating signals. In TDMA systems,
CCDF indicates the health of power amplifier stages and their ability
to sustain rated power over an appropriate timeframe. As a troubleshooting aid, CCDF allows tracking of trends such as amplifier
overdrive (which can cause dropped calls and high bit error rates).
Page 7

Specifications
Sensor Characteristics
Frequency Range 350 MHz to 4 GHz
RF Power Range 0.15 W – 150 W Average, 4 – 400 W Peak
Maximum Power See Figure 7 on page 9
Impedance, Nominal 50 ohms
Insertion Loss, Max:
0.35 – 1 GHz
1 – 4 GHz
Input VSWR, Max:
0.35 – 2.5 GHz
2.5 – 4 GHz
Directivity, Min:
0.35 – 3 GHz
3 – 4 GHz
RF Connectors N Female
Interface:
DPM
PC Serial Port
PC USB Port
Power Supply:
DPM
USB Port
DC Connector
0.05 dB
0.1 dB
1.05:1
1.10:1
30 dB
28 dB
Male DB-9, EIA-232, 9600 Baud, no
parity, 8 data bits, 1 stop bit
Female DB-9, EIA-232, 9600 Baud, no
parity, 8 data bits, 1 stop bit
USB 1.1 interface
From host instrument via cable
less than one low-power USB load
7 – 18 Vdc, < 100 mA
Average Power
RF Power Range 2 – 150 W
RF Power Range 0.15 – 2 W
Peak/Average Ratio, Max 12 dB
Measurement Uncert. ± (4% of reading)
*
Measurement Uncert. ± (7% of reading ± 0.05 W)*
* Above 35 °C or below 15 °C add 3%
Page 8

Match Measurement
0–5–10
–15
–20
–25
Return Loss (dB)
4
2
0
–2
–4
–6
Uncertainty (dB)
Above 3 GHz
Below 3 GHz
Match Measurement Uncertainty
Measurement Range:
Return Loss
Rho (ρ)
VSWR
0 to 23 dB
0.07 to 1.0
1.15 to 99.9
Forward Power, Min 0.5 W
Measurement Uncert. See Figure 6 on page 8
Figure 6
Match
Measure
Uncertainty
Peak Envelope Power
RF Power Range 4.0 – 400 W
Measurement Uncert.:
burst width > 200 µs
1 µs < b.w. < 200 µs
burst width < 1 µs
burst width < 0.5 µs
* Max. power depends on frequency and system VSWR. See Figure 7 on page 9
† Above 35 °C or below 15 °C add 3%
For D < 0.1 add 0.1 W
For period > 0.1s add (1.5% + 0.15 W)
*
± (7% of reading + 0.2 W)
± (10% of reading + 0.4 W)
± (15% of reading + 0.4 W)
± (20% of reading + 0.4 W)
†
†
†
†
Page 9

Figure 7
Frequency (GHZ)
41
0.3
Peak Power (Watts)
1000
400
100
VSWR = 1
VSWR = 1.5
VSWR = 3
Maximum Peak Power
Max. Peak
Power
Burst Average Power
Power Range 10 – 150 W average
Burst Width 1 µs – 50 ms
Repetition Rate, Min 15 Hz
Duty Cycle (D) 0.001 – 1 (D = Burst Width / Period)
Measurement Uncert. ± (6% of reading + 0.05/D W)
*
* Above 35 °C or below 15 °C add 3%
Crest Factor
RF Power Range 4 – 150 W
Measurement Uncert. Linear sum of peak and average power
Complementary Cumulative Distribution Function (CCDF)
uncertainty
Measurement Range 0.1 – 100%
Measurement Uncert. ± 0.2%
Threshold Level Range 4 – 400 W
Level Set Accuracy As peak power uncert. + 2%
Page 10

Physical and Environmental Specifications
Temp, Operating –10 to +50 °C (+14 to +122 °F)
Temp, Storage –40 to +80 °C (–40 to +176 °F)
Mechanical Shock and
Vibration
Humidity, Max 95% (non-condensing)
Altitude, Max 15,000 ft. (4,500 m)
Dimensions, Nominal 4.75” x 4.6” x 1.3” (121 x 117 x 33 mm)
Weight, Max 1.2 lb. (0.55 kg)
MIL-PRF-28800F class 3
Page 11

WIDEBAND POWER SENSOR
MODEL 5012
350 – 4000 MHz
STATUS
12VDC
RS232 USB
METER
INPUT
OUTPUT
RF POWER
4.6"
(116 mm)
TO PC
RS-232
TO DPM
3.8"
(96 mm)
1.3"
(33 mm)
 Loading...