

Page 1

Media Processing Server System Operator’s
Guide
(Software Release 2.1)
Avaya Business Communications Manager
Release 6.0
Document Status: Standard
Document Number: P0602484
Document Version: 02.07
Date: June 2010
Page 2

© 2010 Avaya Inc.
All Rights Reserved.
Notices
While reasonable efforts have been made to ensure that the information in this document is complete and accurate at the time of printing,
Avaya assumes no liability for any errors. Avaya reserves the right to make changes and corrections to the information in this document
without the obligation to notify any person or organization of such changes.
Documentation disclaimer
Avaya shall not be responsible for any modifications, additions, or deletions to the original published version of this documentation
unless such modifications, additions, or deletions were performed by Avaya. End User agree to indemnify and hold harmless Avaya,
Avaya’s agents, servants and employees against all claims, lawsuits, demands and judgments arising out of, or in connection with,
subsequent modifications, additions or deletions to this documentation, to the extent made by End User.
Link disclaimer
Avaya is not responsible for the contents or reliability of any linked Web sites referenced within this site or documentation(s) provided by
Avaya. Avaya is not responsible for the accuracy of any information, statement or content provided on these sites and does not
necessarily endorse the products, services, or information described or offered within them. Avaya does not guarantee that these links will
work all the time and has no control over the availability of the linked pages.
Warranty
Avaya provides a limited warranty on this product. Refer to your sales agreement to establish the terms of the limited warranty. In
addition, Avaya’s standard warranty language, as well as information regarding support for this product, while under warranty, is
available to Avaya customers and other parties through the Avaya Support Web site: http://www.avaya.com/support
Please note that if you acquired the product from an authorized reseller, the warranty is provided to you by said reseller and not by Avaya.
Licenses
THE SOFTWARE LICENSE TERMS AVAILABLE ON THE AVAYA WEBSITE, HTTP://SUPPORT.AVAYA.COM/LICENSEINFO/
ARE APPLICABLE TO ANYONE WHO DOWNLOADS, USES AND/OR INSTALLS AVAYA SOFTWARE, PURCHASED FROM
AVAYA INC., ANY AVAYA AFFILIATE, OR AN AUTHORIZED AVAYA RESELLER (AS APPLICABLE) UNDER A
COMMERCIAL AGREEMENT WITH AVAYA OR AN AUTHORIZED AVAYA RESELLER. UNLESS OTHERWISE AGREED TO
BY AVAYA IN WRITING, AVAYA DOES NOT EXTEND THIS LICENSE IF THE SOFTWARE WAS OBTAINED FROM ANYONE
OTHER THAN AVAYA, AN AVAYA AFFILIATE OR AN AVAYA AUTHORIZED RESELLER, AND AVAYA RESERVES THE
RIGHT TO T AKE LEGAL ACTION AGAINST YOU AND ANYONE ELSE USING OR SELLING THE SOFTWARE WITHOUT A
LICENSE. BY INSTALLING, DOWNLOADING OR USING THE SOFTWARE, OR AUTHORIZING OTHERS TO DO SO, YOU,
ON BEHALF OF YOURSELF AND THE ENTITY FOR WHOM YOU ARE INSTALLING, DOWNLOADING OR USING THE
SOFTWARE (HEREINAFTER REFERRED TO INTERCHANGEABLY AS "YOU" AND "END USER"), AGREE TO THESE
TERMS AND CONDITIONS AND CREATE A BINDING CONTRACT BETWEEN YOU AND AVAYA INC. OR THE
APPLICABLE AVAYA AFFILIATE ("AVAYA").
Copyright
Except where expressly stated otherwise, no use should be made of the Documentation(s) and Pr oduct( s) p rovided by Avaya. All content
in this documentation(s) and the product(s) pr ov id ed by Avaya including the selection, arrangement and design of the content is owned
either by Avaya or its licensors and is protected b y copyright and other intellectual property laws including the sui generis rights relating
to the protection of databases. You may not modify, copy, reproduce, republish, upload, post, transmit or distribute in any way any
content, in whole or in part, including any code and software. Unauthorized reproduction, transmission, dissemination, storage, and or
use without the express written consent of Avaya can be a criminal, as well as a civil offense under the applicable law.
Third Party Components
Certain software programs or portions thereof included in the Product may contain software distributed under third party agreements
("Third Party Components"), which may contain terms that expand or limit rights to use certain portions of the Product ("Third Party
Terms" ). Information regarding distributed Linux OS source code (for those Products that have distributed the Linux OS source code),
and identifying the copyright holders of the Third Party Components and the Third Party Terms that apply to them is available on the
Avaya Support Web site: http://support.avaya.com/Copyright.
Trademarks
The trademarks, logos and service marks ("Marks") displayed in this site, the documentation(s) and product(s) pr ovided by Avaya are the
registered or unregistered Marks of Avaya, its affiliates, or other third parties. Users are not permitted to use such Marks without prior
written consent from A vaya or such third party which may own the Mark. Nothing contained in this site, the documentation(s) and
product(s) should be construed as granting, by implication, estoppel, or otherwise, any license or right in and to the Marks without the
express written permission of Avaya or the applicable third party. Avaya is a registered trademark of Avaya Inc. All non-Avaya
trademarks are the property of their respective owners.
Downloading documents
For the most current versions of documentation, see the Avaya Support. Web site: http://www.avaya.c om/support
Contact Avaya Support
Avaya provides a telephone number for you to use to report problems or to ask questions about your product. The support telephone
number is 1-800-242-2121 in the United States. For additional support telephone numbers, see the Avaya Web site: http://
www.avaya.com/support
Page 3

Table of Contents
Preface . . . . . . . . . . . . . . . . . . . . . . . . . . . . . . . . . . . . . . . . . . . . . . . . . . . . . . . . . . . 7
Introduction. . . . . . . . . . . . . . . . . . . . . . . . . . . . . . . . . . . . . . . . . . . . . . . . . . . . . 15
Table of Contents
Scope . . . . . . . . . . . . . . . . . . . . . . . . . . . . . . . . . . . . . . . . . . . . . . . . . . . . . . . . . . 8
Intended Audience . . . . . . . . . . . . . . . . . . . . . . . . . . . . . . . . . . . . . . . . . . . . . . . . 8
How to Use This Manual . . . . . . . . . . . . . . . . . . . . . . . . . . . . . . . . . . . . . . . . . . . 9
Organization of This Manual . . . . . . . . . . . . . . . . . . . . . . . . . . . . . . . . . . . . . . . 10
Conventions Used in This Manual . . . . . . . . . . . . . . . . . . . . . . . . . . . . . . . . . . . 12
Solaris and Windows 2000 Conventions . . . . . . . . . . . . . . . . . . . . . . . . . . . . . . 13
Trademark Conventions . . . . . . . . . . . . . . . . . . . . . . . . . . . . . . . . . . . . . . . . . . . 13
Copyright Information . . . . . . . . . . . . . . . . . . . . . . . . . . . . . . . . . . . . . . . . . . . . 14
HylaFAX Facsimile Software . . . . . . . . . . . . . . . . . . . . . . . . . . . . . . . . . . . 14
System Operator Tasks . . . . . . . . . . . . . . . . . . . . . . . . . . . . . . . . . . . . . . . . . . . 17
System Terminology . . . . . . . . . . . . . . . . . . . . . . . . . . . . . . . . . . . . . . . . . . . . . 18
System Configurations . . . . . . . . . . . . . . . . . . . . . . . . . . . . . . . . . . . . . . . . . . . . 19
Single Media Processing Server . . . . . . . . . . . . . . . . . . . . . . . . . . . . . . . . . 19
Multiple Media Processing Servers . . . . . . . . . . . . . . . . . . . . . . . . . . . . . . . 20
PeriView . . . . . . . . . . . . . . . . . . . . . . . . . . . . . . . . . . . . . . . . . . . . . . . . . . . 21
Toolkit . . . . . . . . . . . . . . . . . . . . . . . . . . . . . . . . . . . . . . . . . . . . . . . . . . 21
Workstation Node . . . . . . . . . . . . . . . . . . . . . . . . . . . . . . . . . . . . . . . . . 21
System Startup, Monitoring and Shutdown . . . . . . . . . . . . . . . . . . . . . . 23
TMS Startup/Shutdown . . . . . . . . . . . . . . . . . . . . . . . . . . . . . . . . . . . . . . . . . . . 25
Automatic Shutdown and Restart . . . . . . . . . . . . . . . . . . . . . . . . . . . . . . . . 27
Routine Media Processing Server Startup . . . . . . . . . . . . . . . . . . . . . . . . . . 28
Starting/Restarting PeriView . . . . . . . . . . . . . . . . . . . . . . . . . . . . . . . . . . . . 30
System Monitoring . . . . . . . . . . . . . . . . . . . . . . . . . . . . . . . . . . . . . . . . . . . . . . 30
MPS 500 Indicators and Controls . . . . . . . . . . . . . . . . . . . . . . . . . . . . . . . . 30
Ethernet Hub Indicators . . . . . . . . . . . . . . . . . . . . . . . . . . . . . . . . . . . . . . . 32
MPS 1000 Indicators and Controls . . . . . . . . . . . . . . . . . . . . . . . . . . . . . . . 33
Fan Speed Monitor Panel . . . . . . . . . . . . . . . . . . . . . . . . . . . . . . . . . . . 34
Front Control Panel . . . . . . . . . . . . . . . . . . . . . . . . . . . . . . . . . . . . . . . . 35
VRC Rear Panel . . . . . . . . . . . . . . . . . . . . . . . . . . . . . . . . . . . . . . . . . . 36
TMS Front Panel . . . . . . . . . . . . . . . . . . . . . . . . . . . . . . . . . . . . . . . . . . 37
AUDIO Monitor Jack . . . . . . . . . . . . . . . . . . . . . . . . . . . . . . . . . . . 38
Ethernet Hub Indicators . . . . . . . . . . . . . . . . . . . . . . . . . . . . . . . . . 38
Alarm Viewer . . . . . . . . . . . . . . . . . . . . . . . . . . . . . . . . . . . . . . . . . . . . . . . 39
Statistics Data Collection and Reporting . . . . . . . . . . . . . . . . . . . . . . . . . . 39
Logging off a Node . . . . . . . . . . . . . . . . . . . . . . . . . . . . . . . . . . . . . . . . . . . . . . 40
System Shutdown . . . . . . . . . . . . . . . . . . . . . . . . . . . . . . . . . . . . . . . . . . . . . . . 41
Command Line Functions . . . . . . . . . . . . . . . . . . . . . . . . . . . . . . . . . . . . . . . 45
Command Line Interaction . . . . . . . . . . . . . . . . . . . . . . . . . . . . . . . . . . . . . . . . 47
Command Line Editing . . . . . . . . . . . . . . . . . . . . . . . . . . . . . . . . . . . . . . . . 48
Command Control . . . . . . . . . . . . . . . . . . . . . . . . . . . . . . . . . . . . . . . . . . . . 50
Issuing Commands to a Component . . . . . . . . . . . . . . . . . . . . . . . . . . . 50
# P0602484 Ver: 2.7 Page 3
Page 4

Media Processing Server System Operator’s Guide
Foreground and Background Commands . . . . . . . . . . . . . . . . . . . . . . . 51
Online Documentation . . . . . . . . . . . . . . . . . . . . . . . . . . . . . . . . . . . . . . . . . . . . 52
Status Monitoring. . . . . . . . . . . . . . . . . . . . . . . . . . . . . . . . . . . . . . . . . . . . . . . . 53
The Alarm Viewer . . . . . . . . . . . . . . . . . . . . . . . . . . . . . . . . . . . . . . . . . . . . . . . 54
Status Monitoring . . . . . . . . . . . . . . . . . . . . . . . . . . . . . . . . . . . . . . . . . . . . . . . 56
System Date/Time . . . . . . . . . . . . . . . . . . . . . . . . . . . . . . . . . . . . . . . . . . . . 56
Solaris Management Console . . . . . . . . . . . . . . . . . . . . . . . . . . . . . . . . . . . 56
SRP Status . . . . . . . . . . . . . . . . . . . . . . . . . . . . . . . . . . . . . . . . . . . . . . . . . . 57
Component Status . . . . . . . . . . . . . . . . . . . . . . . . . . . . . . . . . . . . . . . . . . . . 57
From the Command Line . . . . . . . . . . . . . . . . . . . . . . . . . . . . . . . . . . . 58
Using PeriView . . . . . . . . . . . . . . . . . . . . . . . . . . . . . . . . . . . . . . . . . . . 58
To Monitor Components . . . . . . . . . . . . . . . . . . . . . . . . . . . . . . . . . 59
Phone Line Status . . . . . . . . . . . . . . . . . . . . . . . . . . . . . . . . . . . . . . . . . . . . 60
Using PeriView . . . . . . . . . . . . . . . . . . . . . . . . . . . . . . . . . . . . . . . . . . . 60
Span Status . . . . . . . . . . . . . . . . . . . . . . . . . . . . . . . . . . . . . . . . . . . . . . . . . . 62
From the Command Line . . . . . . . . . . . . . . . . . . . . . . . . . . . . . . . . . . . 63
Using PeriView . . . . . . . . . . . . . . . . . . . . . . . . . . . . . . . . . . . . . . . . . . . 63
CCM Status . . . . . . . . . . . . . . . . . . . . . . . . . . . . . . . . . . . . . . . . . . . . . . . . . 69
Application Status . . . . . . . . . . . . . . . . . . . . . . . . . . . . . . . . . . . . . . . . . . . . 69
From the Command Line . . . . . . . . . . . . . . . . . . . . . . . . . . . . . . . . . . . 69
Using PeriView . . . . . . . . . . . . . . . . . . . . . . . . . . . . . . . . . . . . . . . . . . . 69
VMM Status . . . . . . . . . . . . . . . . . . . . . . . . . . . . . . . . . . . . . . . . . . . . . . . . . 71
MultiMedia Format (MMF) File Status . . . . . . . . . . . . . . . . . . . . . . . . . . . . 72
From the Command Line . . . . . . . . . . . . . . . . . . . . . . . . . . . . . . . . . . . 72
Using PeriView . . . . . . . . . . . . . . . . . . . . . . . . . . . . . . . . . . . . . . . . . . . 72
Host Status . . . . . . . . . . . . . . . . . . . . . . . . . . . . . . . . . . . . . . . . . . . . . . . . . . 74
Using PeriView . . . . . . . . . . . . . . . . . . . . . . . . . . . . . . . . . . . . . . . . . . . 74
System Statistics Reports . . . . . . . . . . . . . . . . . . . . . . . . . . . . . . . . . . . . . . . . . . 78
Voice Processing Applications. . . . . . . . . . . . . . . . . . . . . . . . . . . . . . . . . . . . 83
Application Memory Requirements . . . . . . . . . . . . . . . . . . . . . . . . . . . . . . . . . . 85
Additional Memory Considerations . . . . . . . . . . . . . . . . . . . . . . . . . . . . . . . 86
Activating Playback MMF Files . . . . . . . . . . . . . . . . . . . . . . . . . . . . . . . . . . . . 87
System Wide Playback MMF Files . . . . . . . . . . . . . . . . . . . . . . . . . . . . . . . 88
Application-Specific Playback MMF Files . . . . . . . . . . . . . . . . . . . . . . . . . 90
Assigning and Starting Application Programs . . . . . . . . . . . . . . . . . . . . . . . . . . 93
Start and Restart Line Order . . . . . . . . . . . . . . . . . . . . . . . . . . . . . . . . . . . . 95
Terminating and Unassigning Application Programs . . . . . . . . . . . . . . . . . . . . 97
Deactivating MMF Files . . . . . . . . . . . . . . . . . . . . . . . . . . . . . . . . . . . . . . . . . . 98
Updating or Replacing Playback MMF Files . . . . . . . . . . . . . . . . . . . . . . . . . . 102
Updating/Replacing a Playback MMF Playback File . . . . . . . . . . . . . . . . 102
Updating Elements in an Active Playback MMF File . . . . . . . . . . . . . . . . 107
Synchronizing MMF Files Across Nodes (ZAP Utility) . . . . . . . . . . . . . 110
ZAP and MMF files on the MPS . . . . . . . . . . . . . . . . . . . . . . . . . . . . 111
ZAP by Proxy (Using Groups) . . . . . . . . . . . . . . . . . . . . . . . . . . . . . . 112
Updating a Specific Element . . . . . . . . . . . . . . . . . . . . . . . . . . . . . . . . 113
Caller Message Recording . . . . . . . . . . . . . . . . . . . . . . . . . . . . . . . . . . . . . . . . 117
Creating a File for Caller Message Recording . . . . . . . . . . . . . . . . . . . . . . 117
Page 4 # P0602484 Ver: 2.7
Page 5

Table of Contents
Activating Record MMF Files . . . . . . . . . . . . . . . . . . . . . . . . . . . . . . . . . 119
Backing up and Restoring Files . . . . . . . . . . . . . . . . . . . . . . . . . . . . . . . . . 121
Directory and File Manipulation . . . . . . . . . . . . . . . . . . . . . . . . . . . . . . . . . . . 122
Working with Directories . . . . . . . . . . . . . . . . . . . . . . . . . . . . . . . . . . . . . 122
File Listing . . . . . . . . . . . . . . . . . . . . . . . . . . . . . . . . . . . . . . . . . . . . . . . . 124
File Removal . . . . . . . . . . . . . . . . . . . . . . . . . . . . . . . . . . . . . . . . . . . . . . . 124
Backup Devices and Options . . . . . . . . . . . . . . . . . . . . . . . . . . . . . . . . . . . . . . 125
Guidelines for Backup . . . . . . . . . . . . . . . . . . . . . . . . . . . . . . . . . . . . . . . . . . . 126
Command Summary . . . . . . . . . . . . . . . . . . . . . . . . . . . . . . . . . . . . . . . . . 126
. . . . . . . . . . . . . . . . . . . . . . . . . . . . . . . . . . . . . . . . . . . . . . . . . . . . . . . . . . 126
Determining Directory Size . . . . . . . . . . . . . . . . . . . . . . . . . . . . . . . . . . . 127
Backup Tips . . . . . . . . . . . . . . . . . . . . . . . . . . . . . . . . . . . . . . . . . . . . . . . . 127
Backup/Restore Methods . . . . . . . . . . . . . . . . . . . . . . . . . . . . . . . . . . . . . . . . . 128
Disk to Disk Backup Procedure . . . . . . . . . . . . . . . . . . . . . . . . . . . . . . . . . . . . 128
Preparation for Solaris Backup . . . . . . . . . . . . . . . . . . . . . . . . . . . . . . . . . 128
Execution . . . . . . . . . . . . . . . . . . . . . . . . . . . . . . . . . . . . . . . . . . . . . . . . . . 131
Configure . . . . . . . . . . . . . . . . . . . . . . . . . . . . . . . . . . . . . . . . . . . . . . . . . . 132
Logging . . . . . . . . . . . . . . . . . . . . . . . . . . . . . . . . . . . . . . . . . . . . . . . . . . . 133
Backing Up with tar . . . . . . . . . . . . . . . . . . . . . . . . . . . . . . . . . . . . . . . . . . . 134
Displaying the Contents of a tar Backup . . . . . . . . . . . . . . . . . . . . . . . . . . . 135
Restoring with tar . . . . . . . . . . . . . . . . . . . . . . . . . . . . . . . . . . . . . . . . . 136
Backing up with ufsdump . . . . . . . . . . . . . . . . . . . . . . . . . . . . . . . . . . . . . . . 136
Backing up partitions with ufsdump . . . . . . . . . . . . . . . . . . . . . . . . . . . . . . . 140
Displaying the Contents of a ufsdump Backup . . . . . . . . . . . . . . . . . . . . . . . 141
Restoring with ufsrestore . . . . . . . . . . . . . . . . . . . . . . . . . . . . . . . . . . . . 142
Backing Up with cp (Copy) . . . . . . . . . . . . . . . . . . . . . . . . . . . . . . . . . . . . . . 143
Backing Up and Restoring MultiMedia Elements . . . . . . . . . . . . . . . . . . . . . . 143
Backing Up and Maintaining a Mirrored System Drive . . . . . . . . . . . . . . . . . 144
Preparation . . . . . . . . . . . . . . . . . . . . . . . . . . . . . . . . . . . . . . . . . . . . . . . . 144
Execution . . . . . . . . . . . . . . . . . . . . . . . . . . . . . . . . . . . . . . . . . . . . . . . . . . 145
Sample Mirrorbu Screen Output . . . . . . . . . . . . . . . . . . . . . . . . . . . . . 146
Sample Log Output . . . . . . . . . . . . . . . . . . . . . . . . . . . . . . . . . . . . . . . 147
Troubleshooting . . . . . . . . . . . . . . . . . . . . . . . . . . . . . . . . . . . . . . . . . . . . . . . . 151
Fault Categories . . . . . . . . . . . . . . . . . . . . . . . . . . . . . . . . . . . . . . . . . . . . . . . . 152
Isolating and Resolving Specific Problems . . . . . . . . . . . . . . . . . . . . . . . . . . . 154
MMF (Vocabulary) File Troubleshooting . . . . . . . . . . . . . . . . . . . . . . . . . 154
File Synchronization Troubleshooting. . . . . . . . . . . . . . . . . . . . . . . . . . . . 156
Host Communication Troubleshooting . . . . . . . . . . . . . . . . . . . . . . . . . . . 158
Telephone Line Troubleshooting . . . . . . . . . . . . . . . . . . . . . . . . . . . . . . . 159
Application Software Troubleshooting . . . . . . . . . . . . . . . . . . . . . . . . . . . 160
SRP Log File . . . . . . . . . . . . . . . . . . . . . . . . . . . . . . . . . . . . . . . . . . . . . . . . . . 161
Printer and Modem Setup . . . . . . . . . . . . . . . . . . . . . . . . . . . . . . . . . . . . . . 163
Printer Setup . . . . . . . . . . . . . . . . . . . . . . . . . . . . . . . . . . . . . . . . . . . . . . . . . . 164
Modem Setup . . . . . . . . . . . . . . . . . . . . . . . . . . . . . . . . . . . . . . . . . . . . . . . . . . 165
The Administration Tool . . . . . . . . . . . . . . . . . . . . . . . . . . . . . . . . . . . . . . . . . 165
# P0602484 Ver: 2.7 Page 5
Page 6

Media Processing Server System Operator’s Guide
Alternate Console . . . . . . . . . . . . . . . . . . . . . . . . . . . . . . . . . . . . . . . . . . . . . . . 166
MPS Directory Structure . . . . . . . . . . . . . . . . . . . . . . . . . . . . . . . . . . . . . . . 167
Solaris Directory Structure . . . . . . . . . . . . . . . . . . . . . . . . . . . . . . . . . . . . . . . . 170
. . . . . . . . . . . . . . . . . . . . . . . . . . . . . . . . . . . . . . . . . . . . . . . . . . . . . . . . . . . . . 170
System software home directory $MPSHOME (/opt/vps) . . . . . . . . . . . . . . . . 172
common . . . . . . . . . . . . . . . . . . . . . . . . . . . . . . . . . . . . . . . . . . . . . . . . . . . 172
fmIcons . . . . . . . . . . . . . . . . . . . . . . . . . . . . . . . . . . . . . . . . . . . . . . . . . . 172
lib . . . . . . . . . . . . . . . . . . . . . . . . . . . . . . . . . . . . . . . . . . . . . . . . . . . . . . 172
mpsN . . . . . . . . . . . . . . . . . . . . . . . . . . . . . . . . . . . . . . . . . . . . . . . . . . . . . 172
pbin . . . . . . . . . . . . . . . . . . . . . . . . . . . . . . . . . . . . . . . . . . . . . . . . . . . . . 172
plib . . . . . . . . . . . . . . . . . . . . . . . . . . . . . . . . . . . . . . . . . . . . . . . . . . . . . 172
tmscommN . . . . . . . . . . . . . . . . . . . . . . . . . . . . . . . . . . . . . . . . . . . . . . . . 172
PERI<name> . . . . . . . . . . . . . . . . . . . . . . . . . . . . . . . . . . . . . . . . . . . . . . 172
User-Specified Distribution Directory (usually /opt/vps) . . . . . . . . . . . . . . . . 174
packages . . . . . . . . . . . . . . . . . . . . . . . . . . . . . . . . . . . . . . . . . . . . . . . . 175
aseX.X.X . . . . . . . . . . . . . . . . . . . . . . . . . . . . . . . . . . . . . . . . . . . . . 175
brdgeX.X.X . . . . . . . . . . . . . . . . . . . . . . . . . . . . . . . . . . . . . . . . . . . 175
cmpatX.X.X . . . . . . . . . . . . . . . . . . . . . . . . . . . . . . . . . . . . . . . . . . . 175
distX.X.X . . . . . . . . . . . . . . . . . . . . . . . . . . . . . . . . . . . . . . . . . . . . 175
docX.X.X . . . . . . . . . . . . . . . . . . . . . . . . . . . . . . . . . . . . . . . . . . . . . 175
fftX.X.X . . . . . . . . . . . . . . . . . . . . . . . . . . . . . . . . . . . . . . . . . . . . . 175
PERIfw . . . . . . . . . . . . . . . . . . . . . . . . . . . . . . . . . . . . . . . . . . . . . . . 176
globlX.X.X . . . . . . . . . . . . . . . . . . . . . . . . . . . . . . . . . . . . . . . . . . . 176
hostpX.X.X . . . . . . . . . . . . . . . . . . . . . . . . . . . . . . . . . . . . . . . . . . . 176
htmlsX.X.X . . . . . . . . . . . . . . . . . . . . . . . . . . . . . . . . . . . . . . . . . . . 176
jsbX.X.X . . . . . . . . . . . . . . . . . . . . . . . . . . . . . . . . . . . . . . . . . . . . . 176
mpsX.X.X . . . . . . . . . . . . . . . . . . . . . . . . . . . . . . . . . . . . . . . . . . . . . 176
pdpX.X.X . . . . . . . . . . . . . . . . . . . . . . . . . . . . . . . . . . . . . . . . . . . . . 177
perlX.X.X . . . . . . . . . . . . . . . . . . . . . . . . . . . . . . . . . . . . . . . . . . . . 177
plicX.X.X . . . . . . . . . . . . . . . . . . . . . . . . . . . . . . . . . . . . . . . . . . . . 177
pproX.X.X . . . . . . . . . . . . . . . . . . . . . . . . . . . . . . . . . . . . . . . . . . . . 177
prptX.X.X . . . . . . . . . . . . . . . . . . . . . . . . . . . . . . . . . . . . . . . . . . . . 177
pstuX.X.X . . . . . . . . . . . . . . . . . . . . . . . . . . . . . . . . . . . . . . . . . . . . 177
rdbX.X.X . . . . . . . . . . . . . . . . . . . . . . . . . . . . . . . . . . . . . . . . . . . . . 177
snmpX.X.X . . . . . . . . . . . . . . . . . . . . . . . . . . . . . . . . . . . . . . . . . . . . 178
tlktX.X.X . . . . . . . . . . . . . . . . . . . . . . . . . . . . . . . . . . . . . . . . . . . . 178
tmsX.X.X . . . . . . . . . . . . . . . . . . . . . . . . . . . . . . . . . . . . . . . . . . . . . 178
viewX.X.X . . . . . . . . . . . . . . . . . . . . . . . . . . . . . . . . . . . . . . . . . . . . 178
xmlcX.X.X . . . . . . . . . . . . . . . . . . . . . . . . . . . . . . . . . . . . . . . . . . . . 178
Index . . . . . . . . . . . . . . . . . . . . . . . . . . . . . . . . . . . . . . . . . . . . . . . . . . . . . . . . . . . 181
Page 6 # P0602484 Ver: 2.7
Page 7

Preface
Page 8

Media Processing Server System Operator’s Guide
Scope
The A vaya Media Processing Server (MPS) Series System Operator’s Guide provides
information and procedures related to the daily operation, monitoring, and
maintenance of the Media Processing Server Series system.
Intended Audience
The audience for this manual consists of people responsible for the monitoring and
maintenance of the Media Processing Server Series system. A user of this class is
referred to as a system operator. System operators must be familiar with
telecommunications and computer equipment, their functions, and associated
terminology. In addition, they must be familiar with site-specific telephone systems,
power systems, computer systems, and peripheral components such as terminals,
modems, printers, etc.
This guide assumes that the Media Processing Server Series system operators have
completed an on-site system briefing program as part of the initial system installation.
In addition, they should be familiar with other site-specific operating procedures
relating to the Media Processing Server Series that are due to specific application
functions performed by that platform and with any other equipment to which the
Media Processing Server Series is connected. This may include a PBX/ACD and/or a
host computer system, etc.
It is further assumed that the reader is already familiar with the following
publications: PeriView Reference Manual, PeriReporter User’s Guide, PeriStudio
User’s Guide, and Media Processing Server Developer User’s Guide.
In addition, the following publications should be consulted, as needed: MPS System
Reference Manual, MPS Telephony Reference Manual, and MPS COMMGR
Reference Manual.
Page 8 # P0602484 Ver: 2.7
Page 9

How to Use This Manual
This manual uses many standard terms relating to computer system and software
application functions. However, it contains some terminology that can only be
explained in the context of the Media Processing Server system. Refer to the Glossary
of Media Processing Server Series Terminology for definitions of product- specific
terms.
It is recommended that initially , this manual be read at least once, from start to finish.
Later, use the Table of Contents and Index to locate topics of interest for reference
and review.
If reading the online version of this document, use cross-reference links to quickly
locate related topics. <L
positioned over a cross-reference link to move to the target page. Click any Table of
Contents entry to move to that topic. Click on the page number of any Index entry to
access that page.
To become familiar with various specialized textual references within the manual see Conventions Used in This Manual on page 12.
Preface
EFT> click once with the mouse while the pointer is
Periphonics is part of Avaya. The name Periphonics, and variations thereof, appear in
this manual only where it is referred to in a product (As examples, a MPS Developer
application, the PERImps package, the perirev command, etc.).
# P0602484 Ver: 2.7 Page 9
Page 10

Media Processing Server System Operator’s Guide
Organization of This Manual
This manual contains separate chapters that describe one or more related tasks for the
operation, monitoring, and basic maintenance of the Media Processing Server Series
system. References are also provided to outside sources of more detailed information
as applicable.
Chapter 1 - Introduction
This chapter discusses the general characteristics of the Media Processing Server
Series system and outlines general activities performed by that system’s operator.
See Introduction on page 16
Chapter 2 - System Startup, Monitoring and Shutdown
This chapter describes startup operation, system-level monitoring capabilities, and
shutdown commands. Included are an overview of system hardware and PeriView
activities relevant to such activities. See System Startup, Monitoring, and
Shutdown on page 24
Chapter 3 - Command Line Functions
This chapter describes interaction with the system from a command line
perspective. It also discusses the basics of using the PeriView VSH Tool and the
on-line documentation system. See Command Line Functions on page 46.
Chapter 4 - Status Monitoring
This chapter discusses monitoring of individual aspects of the Media Processing
Server Series system. Included are instructions on using and interpreting the
results of the PeriView Alarm Viewer and PeriReporter statistics tool. See Status
Monitoring on page 54
Chapter 5 - Voice Processing Applications
This chapter discusses application related prerequisites, assigning and starting
applications, activating vocabularies, working with MultiMedia Format (MMF)
files, and using Caller Message Recording (CMR). See Voice Processing
Applications on page 84
Page 10 # P0602484 Ver: 2.7
Page 11

Chapter 6 - Backing up and Restoring Files
This chapter describes commands and procedures used for routine backup and
restore operations. See Backing up and Restoring Files on page 122.
Chapter 7 - Troubleshooting
This chapter discusses how to use various monitoring functions to identify
problems with system operation, their possible causes, and suggested remedial
actions. See Troubleshooting on page 152.
Chapter 8 - Printer and Modem Setup
This appendix covers setup and changes to the peripheral components of the
Media Processing Server Series system. See Printer and Modem Setup on page
164.
Chapter 9 - MPS Directory structure
This appendix shows the Media Processing Server Series file hierarchy and
explains the intended usage and functions of various directories and associated
files. See MPS Directory Structure on page 168.
Preface
# P0602484 Ver: 2.7 Page 11
Page 12

Media Processing Server System Operator’s Guide
Conventions Used in This Manual
This manual uses different fonts and symbols to differentiate between document
elements and types of information. These conventions are summarized in the
following table.
Conventions Used in This Manual
Notation Description
Normal text
important term
system command
command,
condition
and alarm
file name /
directory
on-screen field
<KEY NAME>
Book Reference
cross reference
Normal text font is used for most of the document.
The Italics font is used to introduce new terms, to highlight meaningful words or phrases, or to
distinguish specific terms from nearby text.
This font indicates a system command and/or its arguments. Such keywords are to be entered
exactly as shown (i.e., users are not to fill in their own values).
Command, Condition and Alarm references appear on the screen in magenta text and
reference the Command Reference Manual, the Media Processing Server Developer User’s
Guide, or the Alarm Reference Manual, respectively. Refer to these documents for detailed
information about
This font is used for highlighting the names of disk directories, files, and extensions for file
names. It is also used to show displays on text-based screens (e.g., to show the contents of a
file.)
This font is used for field labels, on-screen menu buttons, and action buttons.
A term that appears within angled brackets denotes a terminal keyboard key, a telephone
keypad button, or a system mouse button.
This font indicates the names of other publications referenced within the document.
A cross reference appears on the screen in blue text. Click on the cross reference to access
the referenced location. A cross reference that refers to a section name accesses the first
page of that section.
Commands, Conditions, and Alarms.
The Note icon identifies notes, important facts, and other keys to understanding.
The Caution icon identifies procedures or events that require special attention. The icon
!
a. Windows 2000 and the flying Window logo are trademarks or registered trademarks of the Microsoft Corpora-
tion.
indicates a warning that serious problems may arise if the stated instructions are improperly
followed.
The flying Window icon identifies procedures or events that apply to the Windows 2000
operating system only.
The Solaris icon identifies procedures or events that apply to the Solaris operating system
b
only.
a
Page 12 # P0602484 Ver: 2.7
Page 13

Preface
b. Solaris is a trademark or registered trademark of Sun Microsystems, Inc. in the United States and other coun-
tries.
Solaris and Windows 2000 Conventions
This manual depicts examples (command line syntax, configuration files, and screen
shots) in Solaris format. In certain instances, Windows 2000-specific commands,
procedures, or screen shots are shown where required. The following table lists
examples of general operating system conventions to keep in mind when using this
manual with either the Solaris or Window s 200 0 operating system.
Solaris Windows 2000
Environment $MPSHOME %MPSHOME%
Paths $MPSHOME/common/etc %MPSHOME%\common\etc
Command <command> & start /b <command>
Trademark Conventions
The following trademark information is presented here and applies throughout for
third-party products discussed within this manual. Trademarking information is not
repeated hereafter.
Solaris is a trademark or registered trademark of Sun Microsystems, Inc. in the United
States and other countries.
Microsoft, Windows, Windows 2000, Internet Explorer, and the Flying W indows lo go
are either trademarks or registered trademarks of Microsoft Corporation.
Netscape
®
and the Netscape N® and Ship's Wheel® logos are registered trademarks of
Netscape Communications Corporation in the U.S. and other countries. Netscape
Navigator is also a trademark of Netscape Communications Corporation and may be
registered outside the U.S.
Common Desktop Environment (CDE) is a copyright © of Sun Microsystems, Inc.,
Hewlett-Packard Company, International Business Machines Corp., and Novell, Inc.
# P0602484 Ver: 2.7 Page 13
Page 14

Media Processing Server System Operator’s Guide
Copyright Information
HylaFAX Facsimile Software
Copyright (c) 1990-1996 Sam Leffler
Copyright (c) 1991-1996 Silicon Graphics, Inc.
HylaFAX is a trademark of Silicon Graphics, Inc.
Permission to use, copy, modify, distribute, and sell this software and its
documentation for any purpose is hereby granted without fee, provided that
(i) the above copyright notices and this permission notice appear in all copies of the
software and related documentation, and
(ii) the names of Sam Leffler and Silicon Graphics may not be used in any advertising
or publicity relating to the software without the specific, prior written permission of
Sam Leffler and Silicon Graphics.
THE SOFTWARE IS PROVIDED "AS-IS" AND WITHOUT WARRANTY OF
ANY KIND, EXPRESS, IMPLIED OR OTHERWISE, INCLUDING WITHOUT
LIMITATION, ANY WARRANTY OF MERCHANTABILITY OR FITNESS FOR
A PARTICULAR PURPOSE.
IN NO EVENT SHALL SAM LEFFLER OR SILICON GRAPHICS BE LIABLE
FOR ANY SPECIAL, INCIDENTAL, INDIRECT OR CONSEQUENTIAL
DAMAGES OF ANY KIND, OR ANY DAMAGES WHATSOEVER RESULTING
FROM LOSS OF USE, DATA OR PROFITS, WHETHER OR NOT ADVISED OF
THE POSSIBILITY OF DAMAGE, AND ON ANY THEORY OF LIABILITY,
ARISING OUT OF OR IN CONNECTION WITH THE USE OR PERFORMANCE
OF THIS SOFTWARE.
Page 14 # P0602484 Ver: 2.7
Page 15

Introduction
This chapter covers:
1. Introduction
2. System Operator Tasks
3. System Terminology
4. System Configurations
Page 16

Media Processing Server System Operator’s Guide
Introduction
The Avaya Media Processing Server (MPS) Series product lines consist of hardware
and software for performing Interactive Voice Response (IVR) and media processing
functions in call processing environments. More precisely , MPS systems integrate call
processing components with speech, telephony, data communications, and transaction
processing functions.
The heart of the MPS system is the Avaya Telephony Media Server (TMS), which
provides high phone port densities with user flexibility, scalability, and extensibility.
The basic TMS assembly provides resources for telephony media management
including switching/bridging, digital signal processing, voice and data memory, and
network interfaces. A variety of IVR applications are accommodated easily, from
simple information delivery services to complex multimedia (voice/fax/data/web) call
processing implementations with local databases, multiple services, and considerable
transaction processing functions.
The MPS supports a wide variety of telephony and host computer interfaces, and
easily integrates with equipment already in place at any data-processing/
communications environment. MPS systems employ industry standards and
distributed processing in an open architecture, allowing plug-in integration of future
technological developments. In addition, the MPS supports multiple LAN/WAN
interfaces, providing an environment ready for distributed computing.
The MPS is available in the following configurations:
• Media Processing Server 100
A single rack-mounted unit for use with the Windows 2000 platform. The typical
system contains two spans, but can support up to eight. It has a single Digital
Communications Controller (DCC) card. Bridging outside of the TMS is not
supported.
• Media Processing Server 500
The MPS 500 consists of one Telephony Media Server (TMS) which supports 8
T1/E1 spans (up to 240 ports) or comparable capacity VoIP channels. The MPS
500 is capable of providing full IVR functionality including fax, caller message
recording, conferencing, speech recognition and text-to-speech (using OSCAR
resource servers), SQL database access, host screen scrape access, CTI
integration, and supports building and running of an application to control a given
call
• Media Processing Server 1000
A cabinet-enclosed, networked configuration, available only on the Solaris
platform. It supports four TMS units per chassis, with up to four chassis per
cabinet. The MPS can support up to ten thousand ports with the ability to bridge
between any two ports regardless of their location.
The MPS also includes a set of easy-to-use, objected-oriented, GUI tools. These tools
are used for:
Page 16 # P0602484 Ver: 2.7
Page 17

• Application and vocabulary development
• System configuration, control, and monitoring
• Collecting and reporting of statistical data
• Access to online documentation
The Media Processing Server Developer application development environment
provides a complete graphical medium for the entire application life cycle. It also
allows telephony-based applications to be ported over to Internet-based Web usage.
System Operator Tasks
The primary task of the MPS system operator is to ensure the smooth daily operation
of the system. System operator tasks include:
• Keeping records and monitoring system usage and status
• Backing up and restoring system, application, and MultiMedia Format (MMF)
vocabulary/fax files
Introduction
• Manipulating applications
• Occasional shutting down and restarting of the system (in cases of power failure
or other system maintenance needs) if it fails to recover automatically
• Performing speech/vocabulary updates (as required)
• Performing initial problem analysis and service requests
• Working with Certified Avaya service personnel or others during hardware
upgrade and maintenance
To accomplish these tasks, an understanding of the fundamentals of the MPS is
required. This includes knowing the terminology associated with the system and the
various configurations a system can have.
Certified Avaya field service engineers normally perform the initial site preparation
and system installation. The installation includes configuring appropriate system and
application-execution parameters.
# P0602484 Ver: 2.7 Page 17
Page 18

Media Processing Server System Operator’s Guide
System Terminology
The following is a basic presentation of the terminology associated with MPS
systems. For additional information about terminology, see the Glossary of Media
Processing Server Series Terminology.
Component A unit within the system that performs a particular function (see
System Configurations on page 19).
Media Processing
Server (MPS)
Node A physical workstation in a Media Processi ng Server Series network.
Telephony Media
Server (TMS)
Application
Services
Environment (ASE)
Call Control
Manager (CCM)
MultiMedia Format
(MMF)
PeriView The suite of tools designed to administer MPS network activity in a
Startup and
Recovery Process
(SRP)
An Interactive Voice Response system comprised of various
components that provides telephony and call processing services
between a call center and the calling community.
The main component within a MPS system. It provides most essential
functions for telephony and media management. It replaces the CPS1000 used in the previous generation VPS and VPS/is systems.
The group of software processes used to develop and execute voice
and media applications.
The primary interface between applications and the VOS services. It
is the gateway for communication with the telephony hardware
platform.
A proprietary format for storing and retrieving audio elements and/or
fax data in data files. A single MMF file is physically stored as two
files. The data file (.mmd extension) contains raw audio recordings,
such data for voice, fax, TDD tones, etc. The index file (.mmi
extension) contains the attributes and pointers that differentiate the
elements in the data fil e.
GUI environment (see Toolkit on page 21)..
The software process that spawns (i.e., starts up) and monitors all
other MPS processes. SRP can also be used to stop and restart
these processes if they’ve been abnormally terminated.
Voice Memory
Manager (VMM)
Voice Operating
Software (VOS)
Voice Processing
Series (VPS)
$MPSHOME The home directory environment variable, set to /opt/vps by
A VOS software subcomponent that provides audio and media
management services within the VOS.
The main software processes that provide the lower-level operating
functions of the MPS system.
The predecessor product to the MPS. By design, a number of the
MPS path names, software processes, environment variables, and
file fields use the term VPS. This terminology is functionally
equivalent to MPS nomenclature. In other words, wherever file or
software names show the term VPS, it is relevant to the MPS.
default. This directory contains the operating system software,
subdirectories for the various installed software packages
subdirectory, symbolic links to these packages, and other software
necessary for MPS operations. For more information, (see System
software home directory $MPSHOME (/opt/vps) on page 172).
Page 18 # P0602484 Ver: 2.7
Page 19

System Configurations
A MPS system setup can be a single MPS or contain multiple networked MPS
systems. PeriView Workstations can be added, as needed, to allow monitoring of the
system from remote locations. The MPS also supports functions between systems with
different operating system releases.
Single Media Processing Server
Introduction
A Media Processing Server node is the basic building
block of a MPS network. A single MPS component
consists of the TMS hardware, and ASE and VOS
MPS
Node A
(Solaris node)
software groups running on a Solaris node. (A node is a
physical workstation in the MPS network.)
The single MPS configuration is intended for
environments with low to moderately high call volumes.
MPS 1
ASE
VOS
This system is monitored directly by PeriView. Generated
statistics are available via PeriReporter.
TMS
Each workstation in a MPS network is identified by a node name. In the above
diagram, it is shown as “Node A.” Each MPS component is identified by a unique
component number. In the diagram, it is shown as “MPS 1.” A component number
must be unique across all nodes. The convention for naming MPS network
components is component_type.component_number/node_name. Thus, “mps.1/A” is
the designation of the MPS in this diagram,
# P0602484 Ver: 2.7 Page 19
Page 20
Media Processing Server System Operator’s Guide
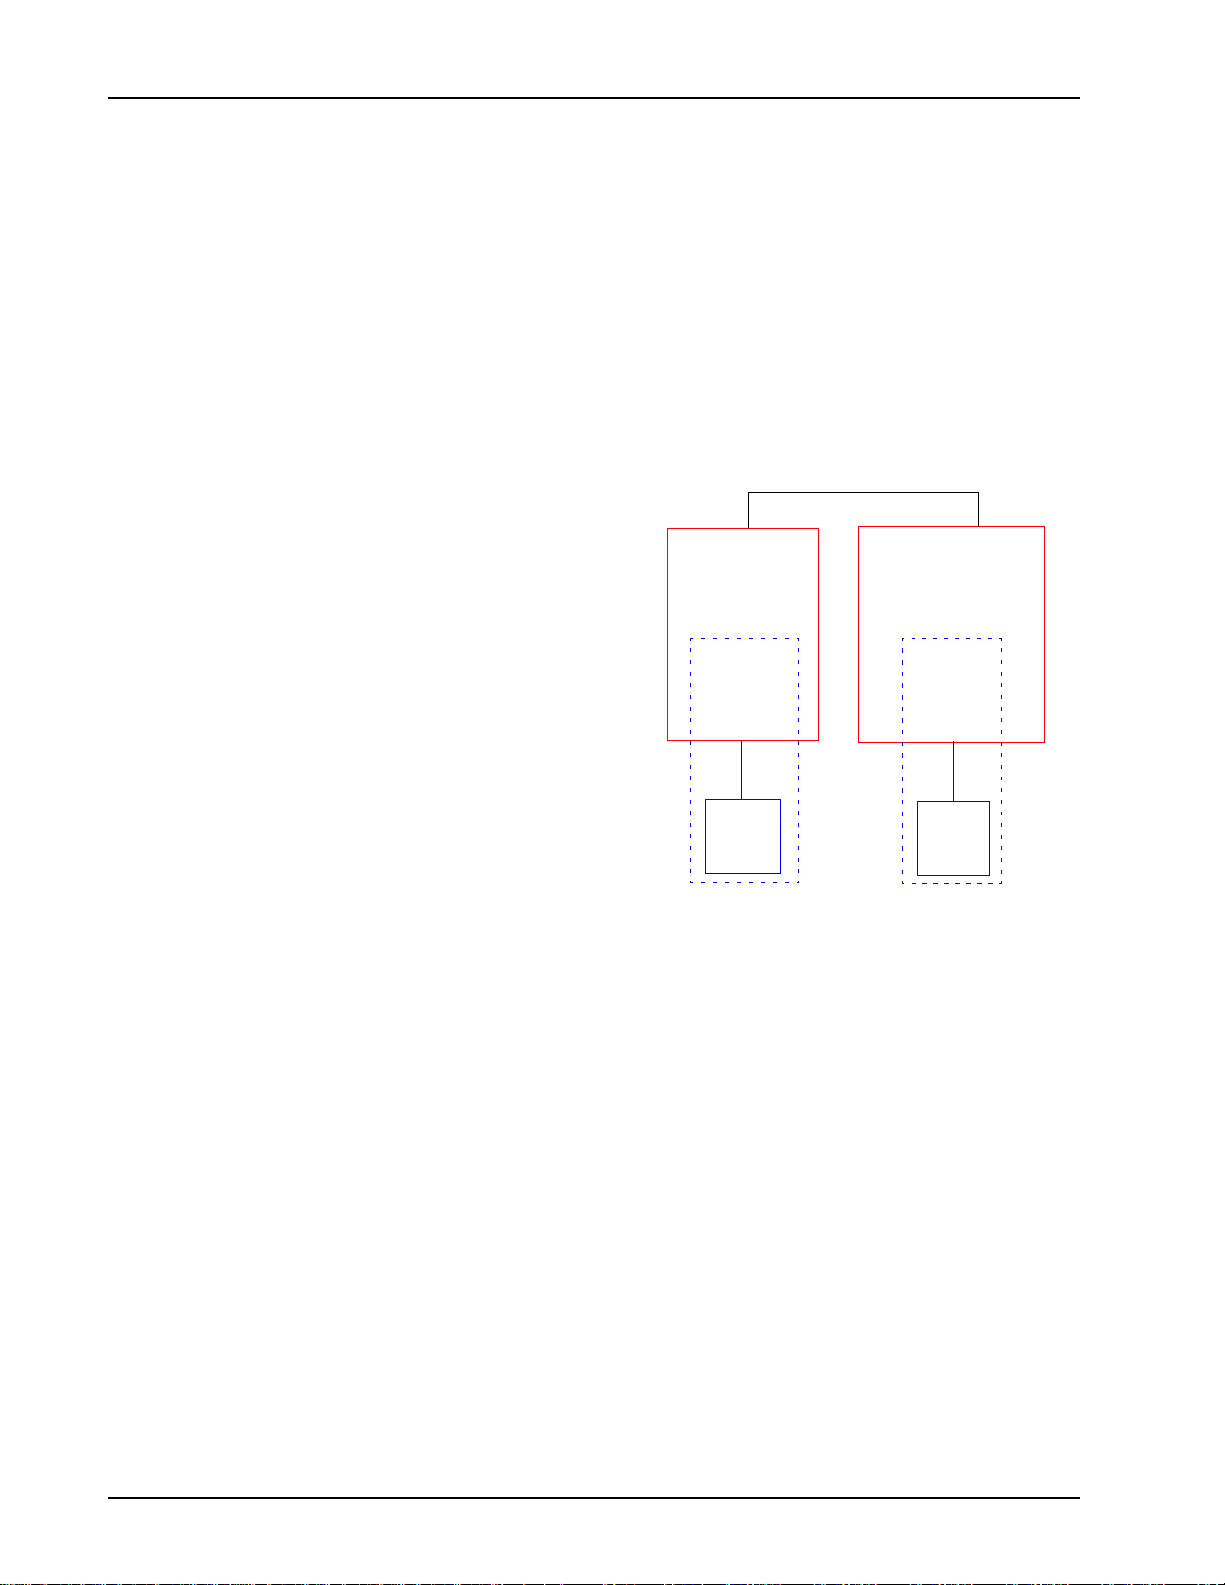
Multiple Media Processing Servers
In a Media Processing Server Series network, each MPS can process calls only on its
own phone lines. Networking the systems increases the total number of available
phone lines, permits flexibility in assigning different types of applications to particular
segments of the network, and allows component monitoring from multiple nodes.
The following diagram illustrates the basic concepts of a MPS network. Although
networks can have a different components in various configurations, for illustration
purposes, this example shows a two-node Media Processing Server Series network.
PeriV iew tools reside on every
Media Processing Server Series Network
node. However, PeriReporter
tools resides only on the
statistics node (shown as node
“B” in this diagram). The nodes
are networked (either on a LAN
or WAN) thus allowing
statistics collected from node
MPS
Node A
(PeriView)
MPS 1
PeriReporter Tools)
MPS
Node B
(PeriView &
MPS 2
“A” to be consolidated on node
“B” (along with the statistics
from node “B”). Also, either
ASE
VOS
ASE
VOS
node can be monitored through
the other node’s PeriView tools.
(For more information about
PeriReporter Tools, see the
TMS
TMS
PeriReporter User’s Guide.)
The example shows each MPS node identified by a node name (“A” and “B”) and
each MPS component identified by a unique number (“1” and “2”). Thus, “mps.1/A”
and “mps.2/B” are the designations of the MPS systems in this network.
Page 20 # P0602484 Ver: 2.7
Page 21
Introduction
PeriView
Toolkit
PeriView is a suite of GUI tools designed to administer Media Processing Server
Series network activity.
PeriView performs the following various functions:
• Defines the Media Processing Server Series network as a hierarchy of entities and
designate network perspectives from which to manipulate and v iew network
activity.
• Launch PeriView tools to configure user accounts and privileges, manage
applications, monitor phone lines, view and log alarms, and monitor system
activity.
• Customize operations by selecting and specifying PeriView properties.
See the PeriView Reference Manual for detailed information about PeriView.
Workstation Node
A PeriV iew Workstation node is a management resource for remote monitoring of the
# P0602484 Ver: 2.7 Page 21
Page 22
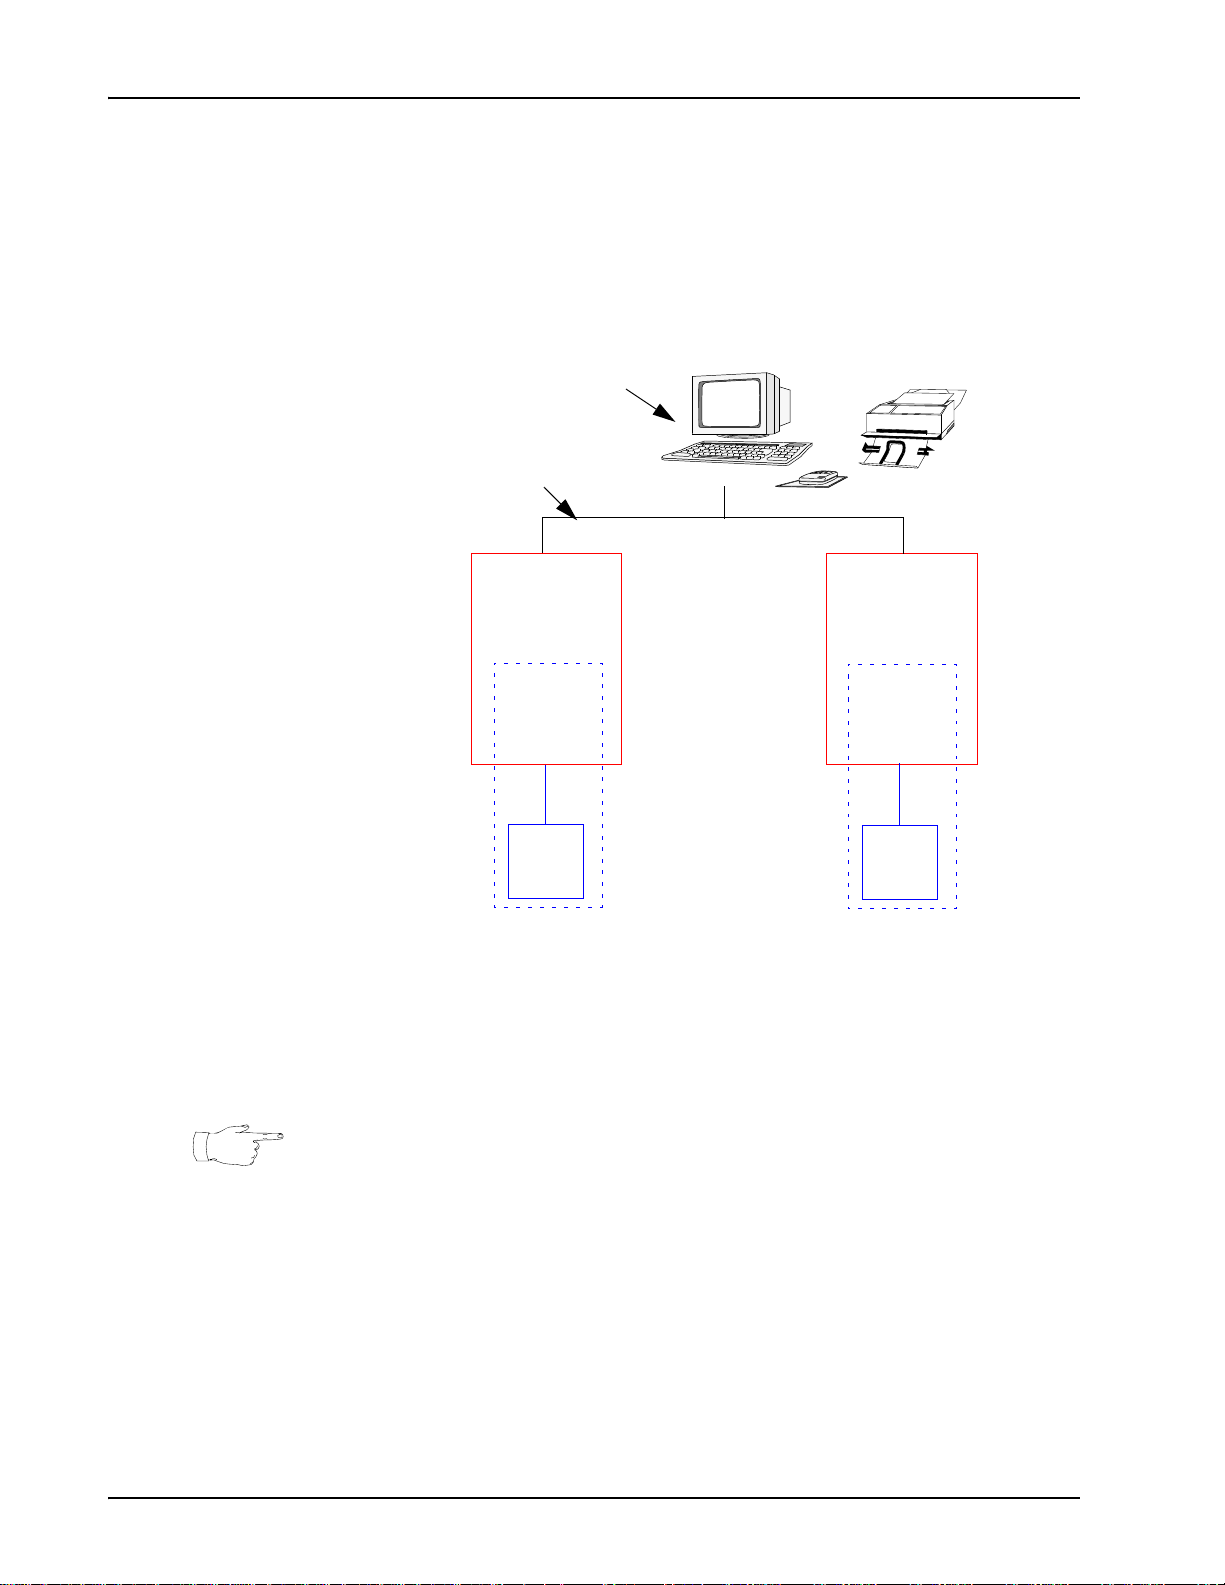
Media Processing Server System Operator’s Guide
MPS systems in the network. A PeriView node does not have MPS components. It
contains only the software necessary to run the PeriView GUI tools, but none of the
software or hardware needed for telephony functions. A PeriView Workstation can be
physically located anywhere on a network with component-based nodes.
Media Processing Server Series Network — with Media
Processing Server and PeriView Workstation
PeriView Workstation
LAN
MPS
Node A
MPS
Node B
PeriReporter
Tools
MPS 1
ASE
VOS
TMS
MPS 2
ASE
VOS
TMS
In this example configuration, PeriView can be launched from any node in the
network. PeriReporter tools, however, can only be used only on node “B.” The
PeriView Workstation can be used to monitor both nodes, but statistics reports can
only be generated through PeriReporter on node “B.” If desired, the PeriView
Workstation could also be designated as the statistics node.
The PeriView Workstation node does not normally appear in the on-screen PeriView
workspace. To obtain a visual representation of this node, it has to be added to the
.xtrahostsrc file. For information about this file, see the PeriView Reference
Manual.
Page 22 # P0602484 Ver: 2.7
Page 23

System Startup,
Monitoring and
Shutdown
This chapter covers:
1. TMS Startup/Shutdown
2. System Monitoring
3. Logging off a Node
4. System Shutdown
Page 24

Media Processing Server System Operator’s Guide
System Startup, Monitoring, and Shutdown
Occasionally, the Avaya Media Processing Server Series has to be shut down and
restarted for maintenance or to recover from a power failure. Also, the TMS might
occasionally require recycling, which can be done without having to stop the entire
system. The following sections contain details on these procedures, as well as those
for overall system monitoring. There are three ways to monitor the system: indicators
and controls, the Alarm Viewer, and PeriReporter.
Page 24 # P0602484 Ver: 2.7
Page 25

TMS Startup/Shutdown
Power to the TMS can be applied or removed either manually via a switch on the unit
or by issuing system commands. Refer to the following table to determine the best
method to use in a given situation. (see Alarm Viewer on page 39).,for information on
using the Alarm Viewer as cited below and refer to the Alarm Reference Manual for
detailed description of the Alarm conditions.
Command/Function Use to... Why?
System Startup, Monitoring and Shutdown
TEST / ON / OFF switch
located on the Front Control
Panel (FCP, see page 18) or
Variable Resource Chassis
(VRC) Rear Panel (see
page 19).
S20vps.startup start
(preferred command)
S20vps.startup stop
(preferred command)
Manually turn power to the
TMS on or off
Start SRP (including VOS)
and TMS hardware
“gracefully” (that is, through
the most efficient means as
determined by Avaya)
Stop SRP (including VOS)
and TMS hardware
“gracefully” (that is, through
the most efficient means as
determined by Avaya)
Use when completely
shutting down system or
performing service on the
TMS (see (see System
Shutdown on page 41). and to
reapply power when finished
with these steps.
Use after the stop option
(see below) has been
invoked, or to restart the
TMS if its startup terminated
abnormally (use the Alarm
Viewer to check for causes)
Use when performing
maintenance on the system
that requires all Media
Processing Server Series
processes or the TMS to be
down (for example,
modifying the Media
Processing Server Series
network), or to stop Media
Processing Server Series
processes and the TMS if
their startup terminated
abnormally (use the Alarm
Viewer to check for causes)
srp vos.# -stop Stop VOS processes and
TMS
srp vos.# -start Start VOS processes and
TMS
srp vos.# -restart Stop and then restart the
VOS and TMS. Can be used
as an alternative to the
-stop and -start
commands
Use if VOS processes have
crashed or recycled during
an attempt to load the TMS.
Use the Alarm Viewer to
check for causes.
Use to start the VOS and
TMS after having issued the
-stop option (see above).
Use for same reasons as the
previous two commands
when there is no need to see
the relevant alarms.
a
1
1
# P0602484 Ver: 2.7 Page 25
Page 26

Media Processing Server System Operator’s Guide
a. In these examples, # represents the Media Processing Server with which the TMS is
associated.
Page 26 # P0602484 Ver: 2.7
Page 27

System Startup, Monitoring and Shutdown
Automatic Shutdown and Restart
If the TMS Configuration and Alarm Daemon (TCAD) detects a CONFIG or
SHUTDOWN state when TMS is started, it shuts down and restarts the TMS
hardware. All VOS processes return to the stage in the startup sequence where
attempts are made to establish connections to the hardware ports.
State Indication Cause Status
CONFIG Another VOS is
loading the TMS
VOS crashed/
recycled while
attempting a prior
configuration
SHUTDOWN TMS was stopped/
shut down manually
Severe configuration
error
Interruption of normal
loading processes
due to an unexpected
condition within the
system (i.e. software
or hardware fault, or
loss of power)
Operator issued a
command line order
Contact Certified Avaya
support personnel
immediately
TMS is in an unknown
configuration since prior
commands may not have
completed successfully
Hardware is detected in
an unexpected state by
TCAD when system is
still up and running
Alarms are generated after TCAD successful corrects error conditions to signify that
such actions have occurred. Use the PeriView Alarm Viewer to examine these alarms
(see Alarm V iewer on page 39).) and refer to the Alarm Refer ence Manual for detailed
description of the Alarm conditions.
# P0602484 Ver: 2.7 Page 27
Page 28

Media Processing Server System Operator’s Guide
Routine Media Processing Server Startup
Media Processing Server configuration files automate the routine startup of each
system in the Media Processing Server Series network. During on-site installation,
Avaya staff customize these configuration files for each system. These configuration
files are used to:
• activate application programs
• activate MultiMedia Format (MMF) (vocabulary) files
• configure host interaction
• configure the default startup environment
How to ... Perform a Media Processing Server Startup
1. On each Media Processing Server, turn the main power switch
on.
2. Power up each TMS.
For locations of their power switches, see (see Front Control Panel
on page 35). and (see VRC Rear Panel on page 36)..
3. Return to the node that acts as the PeriView Workstation.
The system automatically starts a monitoring Alarm Viewer in which
it displays startup messages.
4. Enter the login name and select Session from the Options
menu button. Select either Common Desktop Environment
(CDE) or OpenWindows Desktop from the pulldown menu.
This is the desktop environment. At the next time log in, the desktop
defaults to the previous selection (as indicated by the red dot at
User’s Last Desktop). The default login name is peri. The name
of the node to log into (in this example MPS) appears in the “Welcome” prompt.
Page 28 # P0602484 Ver: 2.7
Page 29

System Startup, Monitoring and Shutdown
5. Click the OK button (or press <R
ETURN>), then enter the pass-
word and repeat.
The default password is peri;). The selected desktop environment
should now be displayed.
The initial Alarm Viewer becomes iconified and a cmdtool window
opens. The menu buttons on this startup Alarm Viewer are inactive.
To view alarms after startup, launch a separate Alarm V iewer (see Alarm
Viewer on page 39)..
6. Wait for each Media Processing Server to boot up. Use the Alarm
Viewer to watch the system load vocabularies, start processes, and
initialize the TMS on each one. After several minutes, each unit generates a “Media Processing Server UP” alarm.
7. Start PeriView. (see Starting/Restarting PeriView on page 30)..
Configuration files load all the necessary software. After startup, the Media
Processing Server is ready for call processing.
# P0602484 Ver: 2.7 Page 29
Page 30
Media Processing Server System Operator’s Guide
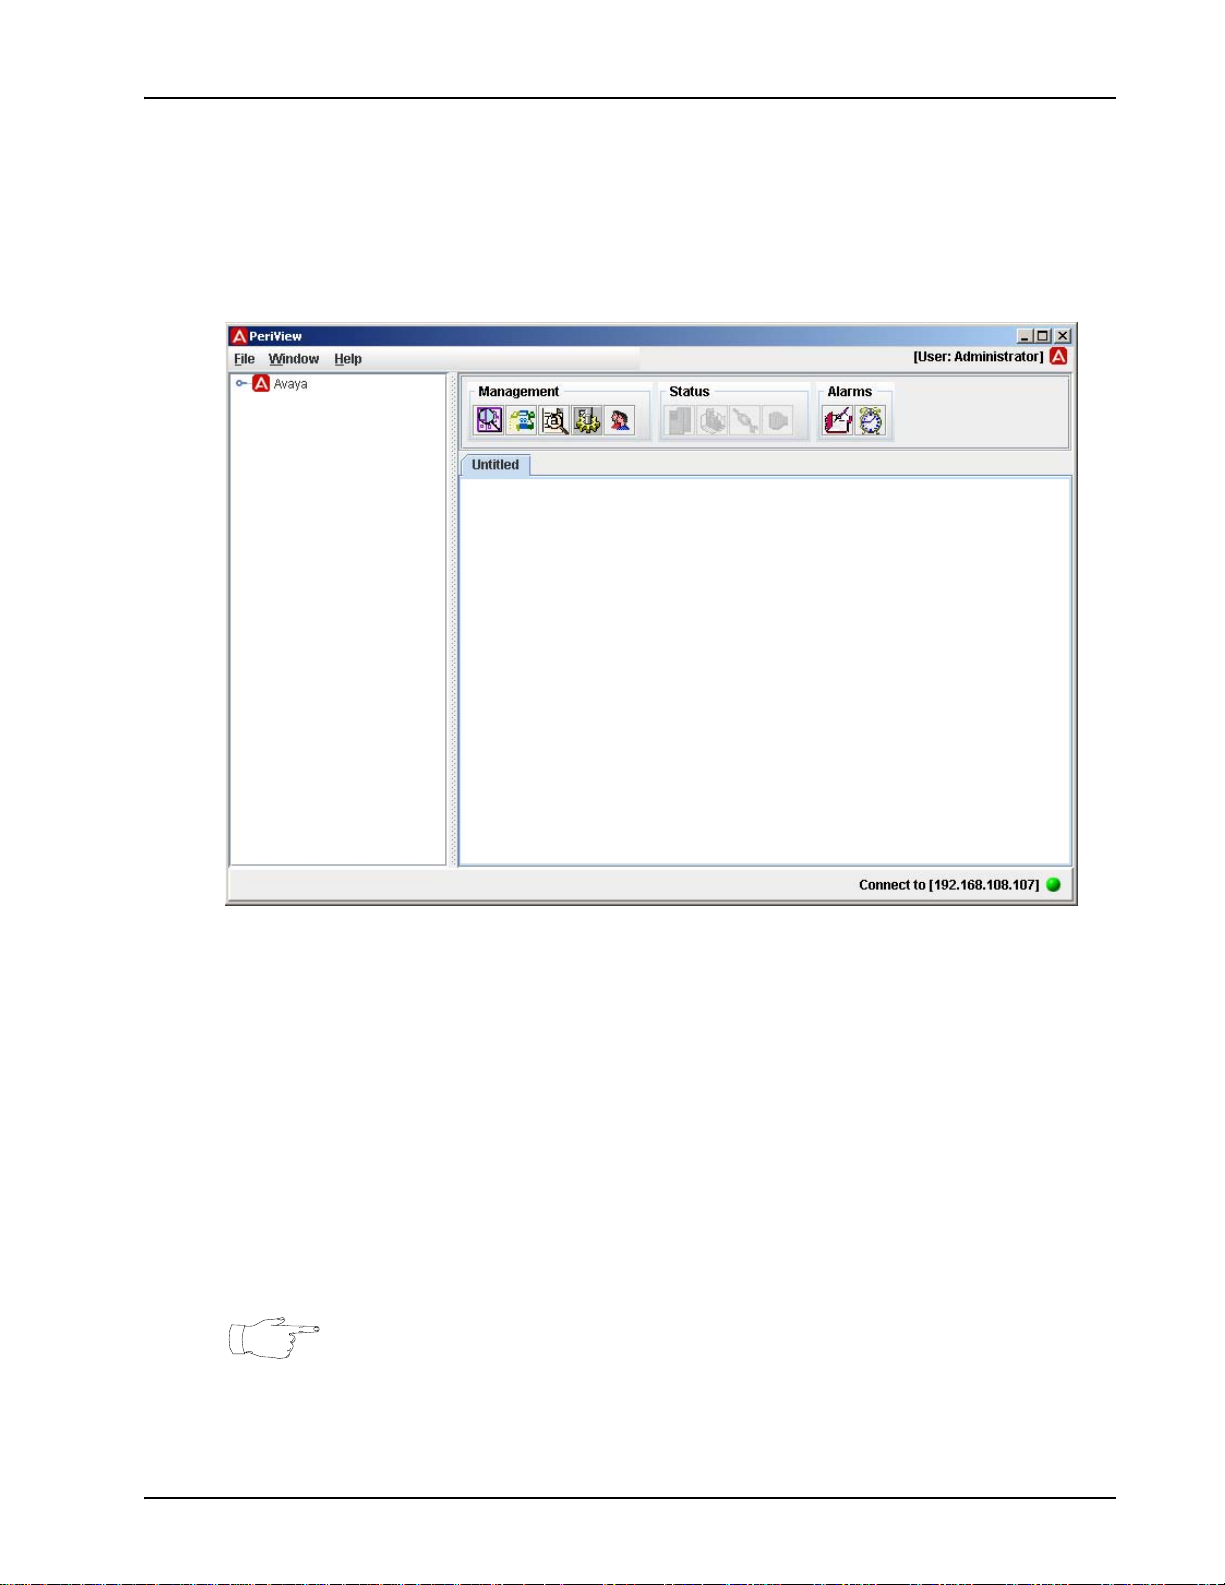
Starting/Restarting PeriView
PeriView is used to complete system startup and interact with the Media Processing
Server.
If PeriView is exited for any reason, it can be restarted without rebooting the system.
How to ... Start/Restart PeriView
1. <RIGHT> click the desktop to display the Workspace menu.
2. <R
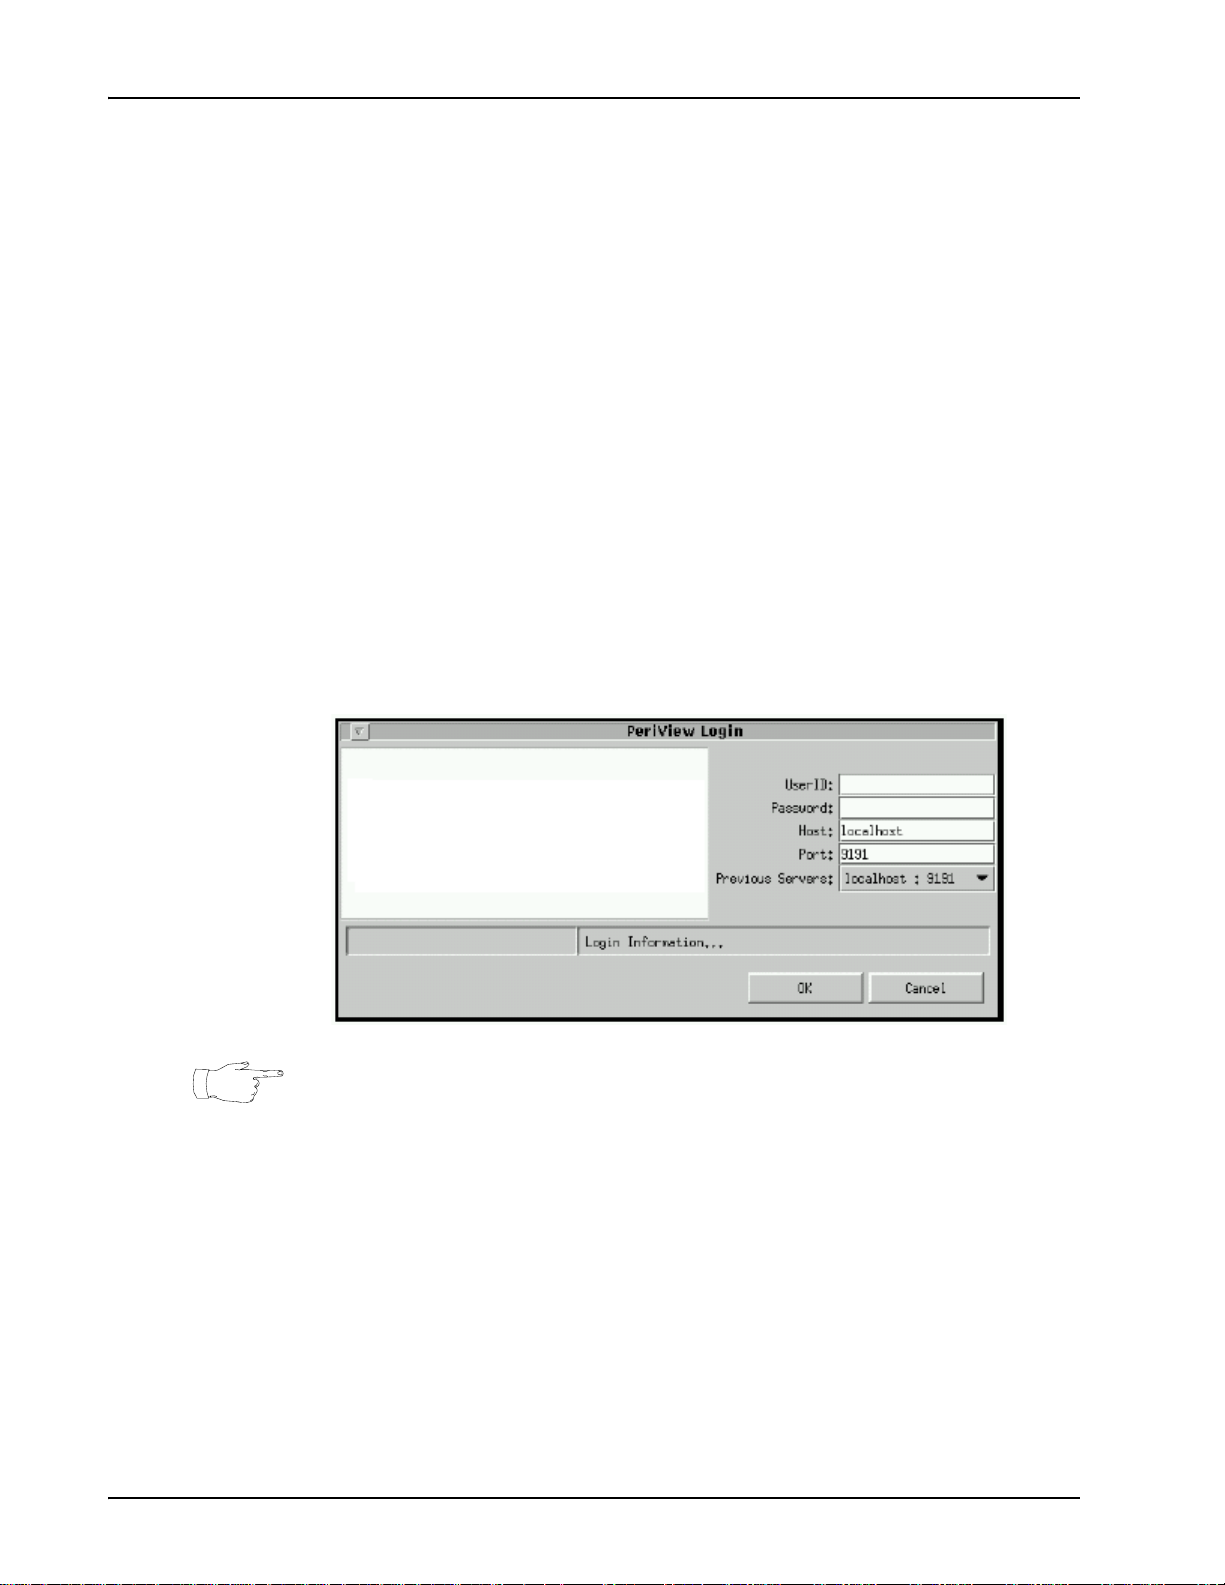
3. From the Avaya menu, select PeriView....
The system displays the PeriView Login screen.
IGHT> click *Avaya* in the Workspace pop-up menu.
This menu is user-defined and its contents may vary. To define the
items on this menu, and which ones can otherwise be launched from a
command line, edit the .openwin-menu-avaya file for the OpenWindows Desktop or the .dt/dtwmrc file for CDE, using any textbased editor. These files are typically found in a user’s /home directory.
PeriView can also be started by entering periview & at any command line. A
cmdtool window opens upon initialization of the system (see Routine Media
Processing Server Startup on page 28).).
System Monitoring
MPS 500 Indicators and Controls
Front Panel
The chassis front panel contains no controls, connectors or visible indicators.
TMS Front Panel
In addition to front panel indicators, the system components have internal indicators
Page 30 # P0602484 Ver: 2.7
Page 31

System Startup, Monitoring and Shutdown
useful for system maintenance and fault isolation. Located on the front panel of the
TMS are connections to a diagnostic console for troubleshooting, LED indicators for
TMS health checks, and the span input/output connector.
DCC VOIP Combination
RJ11 connector
(for handset)
Remote terminal connectors
123 4
Diagnostic
LEDs
Microswitches
TMS Front Panel Connectors and Indicators
DCC PLI Combination
Ethernet Hub
Status Indicators
RJ48M connector
(up to 8 digital spans)
Extractor (2)
Item Description
AUDIO connector RJ11 jack for connecting a telephone handset to audibly monitor an MPS 500 line.
CONSOLE connectors RS232 (9-pin DIN) port for connecting a debug terminal. Used for boot ROM and
diagnostics.
LEDs 0 - 15 Provide diagnostic indications on startup.
Microswitches Reserved for future enhancement.
HUB A LEDs
HUB B LEDs
EXT Indicates condition on external port of HUB A.
SL2 Indicates condition on slot 2 port of HUB A.
SL1 Indicates condition on slot 1 port of HUB A.
MP Indicates condition on microprocessor port of HUB A.
COL Indicates errors or collisions in HUB A.
EXT Indicates condition on external port of HUB B.
SL4 Indicates condition on slot 4 port of HUB B.
SL3 Indicates condition on slot 3 port of HUB B.
MP Indicates condition on microprocessor port of HUB B.
COL Indicates errors or collisions in HUB B.
DCC Front Panel
# P0602484 Ver: 2.7 Page 31
Page 32

Media Processing Server System Operator’s Guide
Item Description
Span connector RJ48M 50-pin connector connects up to eight digital spans (T1 or E1) to PSTN.
Remote terminal
connector
Other connectors and
indicators
Indicator/Control Function
Steady green
Blinking green (@~ 4Hz) Transmit packet (N/A)
Steady red Reversed polarity Collision
Blinking red (@~ 4Hz) Receive packet (N/A)
Alternating red and green (@~
5Hz) P
RS232 (9-pin DIN) port for connecting a debug terminal. Used for boot ROM and
diagnostics.
Reserved for future enhancement.
Ethernet Hub Indicators
The dual (green and red) LED indicators for HUB A and HUB B on the front of the
TMS can display five separate conditions of the item to which they apply. The LEDs
will be on steady, or blinking in the following combinations to indicate the respective
condition:
Receive link pulse FIFO error
artitioned out (N/A)
Page 32 # P0602484 Ver: 2.7
Page 33
System Startup, Monitoring and Shutdown
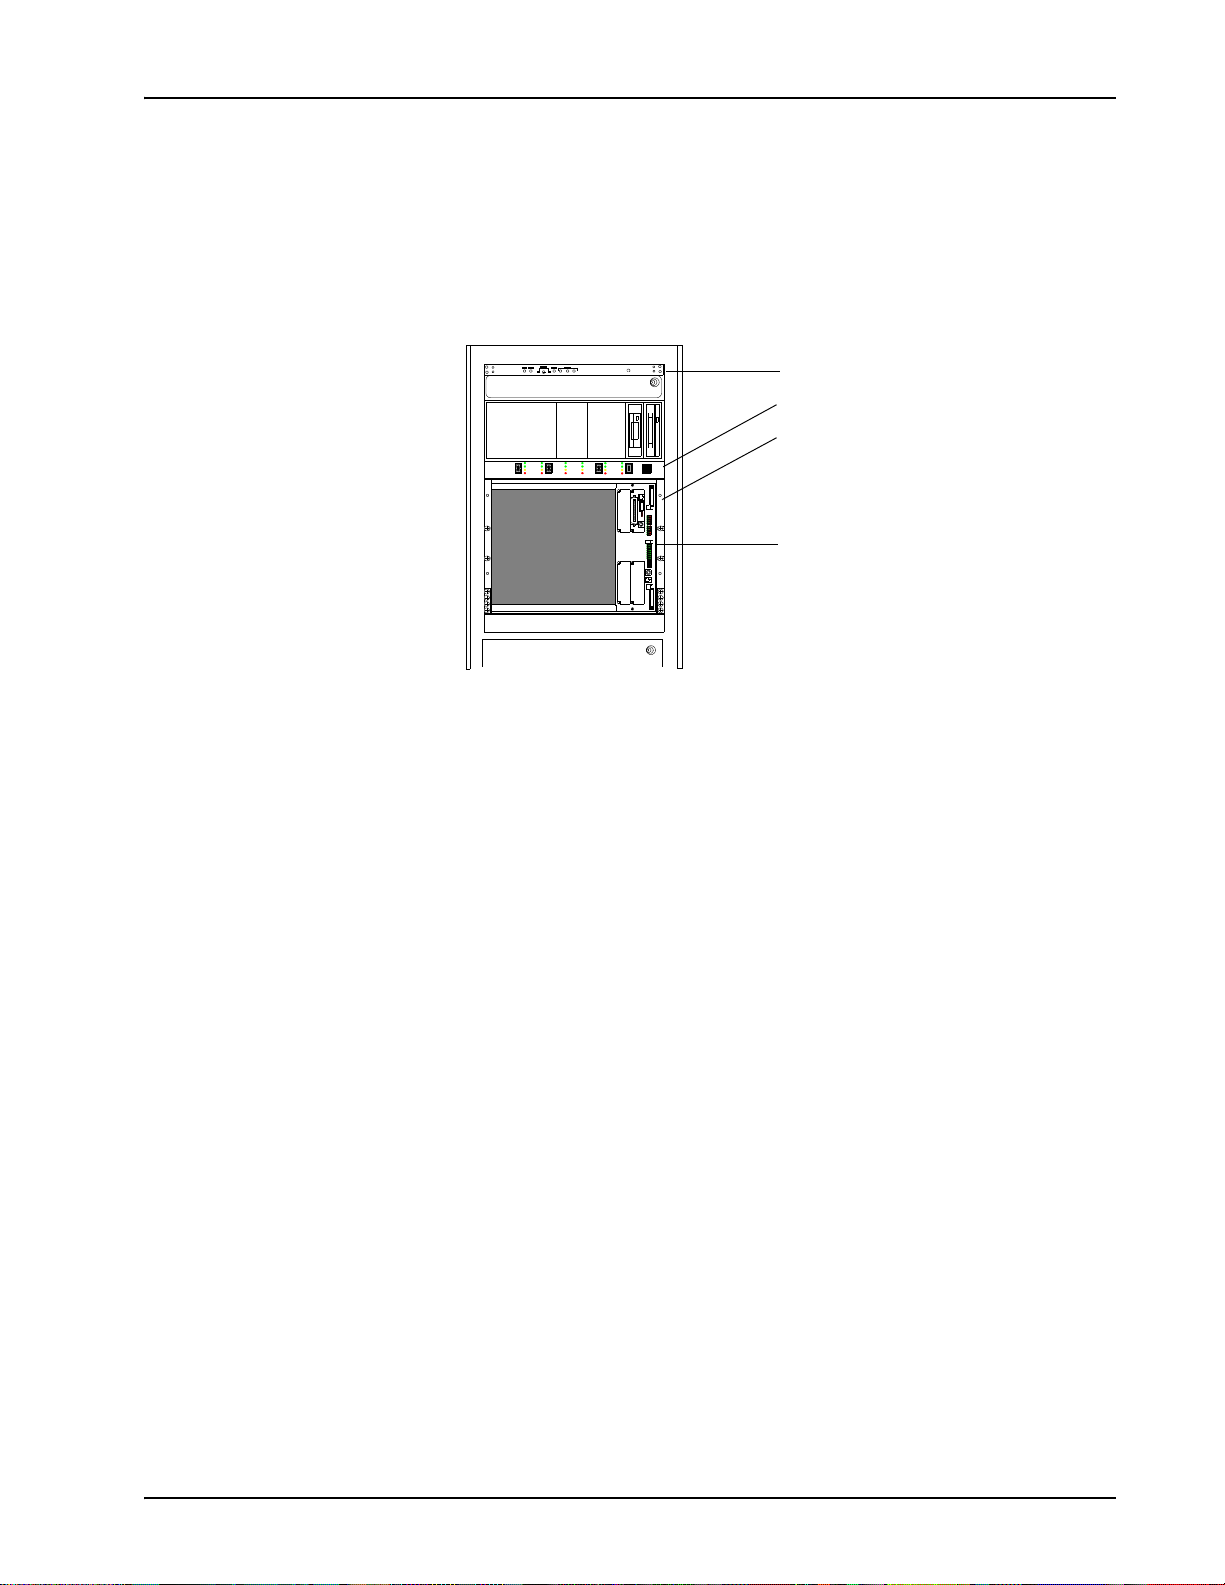
MPS 1000 Indicators and Controls
The Media Processing Server Series systems provide a number of indicators on
various panels. The indicators give a visual status of system operation.
Fan Speed Monitor Panel
Front Control Panel
VRC Rear Panel (behind unit)
POWER ON
POWER ON
POWER ON
TEST
TEST
NORMAL
MINOR ALARM
MAJOR ALARM
1
NORMAL
ON
MINOR ALARM
OFF
MAJOR ALARM
2
5
ON
OFF
SLOT
TEST
TEST
NORMAL
ON
ON
MINOR ALARM
OFF
OFF
MAJOR ALARM
6
RESET
3
4
COL
M
P
1
S
L
SL2
T
E
X
L
C
O
M
P
SL3
4
S
L
HUB BHUB A
EXT
SLOT 4
SLOT 3
0
1
2
3
4
5
6
7
8
9
10
11
12
13
14
15
SLOT 1
SLOT 2
AUDIOCONSOLE
TMS Front Panel
# P0602484 Ver: 2.7 Page 33
Page 34

Media Processing Server System Operator’s Guide
Fan Speed Monitor Panel
This panel provides information and control for overall cabinet cooling. Normal
cooling is maintained automatically , but this can be overridden in the event of an over
temperature (overtemp) condition (i.e., a state in which a preset temperature limit is
exceeded).
Fan Speed Monitor Panel
Indicator/Control Function
(Fuse)
OVER TEMP indicator Illuminates if the cabinet exceeds the predetermined safe operating temperature of 35°C
(95°F).
FAULT/MAN HS
indicator
FAN SPEED switch Two-position switch used to set cooling fan speed for cabinet airflow.
MANUAL HIGH
SPEED
AUTO TEMP CNTRL This setting is normally used to cool the cabinet enclosure. Fan speed is automatically
SYSTEM OK indicator Illuminates when all predetermined cooling and temperature parameters have been met. An
FAN SPEED indicators Illuminates in conjunction with the FAN SPEED AUTO TEMP CNTRL setting to indicate the
Fuse Replaceable fuse for cooling system over voltage protection. Replace with a 3 amp fast
Illuminates when a cooling system fault has been detected and the fan has been switched to
MANUAL HIGH SPEED (see next).
Use this setting when an overtemp condition is present and continued maximum cooling
effectiveness is required. Placing the FAN SPEED switch to this setting also causes the
FAULT/MAN HS indicator to illuminate. Caution should be exercised and service
immediately performed to alleviate the overtemp condition.
adjusted for the optimum cooling capacity. The actual fan speed when in this setting is
shown by the FAN SPEED indicators.
OVER TEMP or FAULT/MAN HS condition causes this indicator to go out.
actual fan speed. Indicators are self-explanatory.
5x20mm cartridge fuse only. Check system for cause if fuse is blown or call Avaya service
department.
Page 34 # P0602484 Ver: 2.7
Page 35

System Startup, Monitoring and Shutdown
Front Control Panel
The cabinet front panel contains a standard 3.5 inch floppy disk drive, a 4mm DAT
tape drive, and an FCP (Front Control Panel) for each VRC in the system. The FCP
provides separate power controls and status indicators for each TMS (by chassis slot).
Indicator/Control Function
TEST / ON / OFF switch
(slots 1, 2, 3, and 4)
Three-position rocker switch used to turn power to the TMS on or off, or to test the
associated power supply. (The TEST / ON / OFF switches for slots 5 and 6 are on the VRC
rear panel. (see VRC Rear Panel on page 36)..)
POWER ON indicator
Illuminates green when power is applied to TMS.
(all slots)
NORMAL indicator (all
Illuminates green when TMS is operating properly and there are no alarms or system faults.
slots)
MINOR ALARM
indicator (all slots)
Flashes yellow when a minor alarm is active, accompanied by an audible indication (beep).
To reset, press the RESET switch. Use as a troubleshooting aid by viewing alarms in the
Alarm Viewer (see Alarm Vi ewer on page 39)..
MAJOR ALARM
indicator (all slots)
Flashes red when a major alarm is active, accompanied by an aud i bl e indi ca ti o n (b ee p ) . To
reset, press the RESET switch. Use as a troubleshooting aid by viewing alarms in the Alarm
Viewer (see Alarm Viewer on page 39).).
TEST
OFF
SLOT
Front Control Panel
ON
POWER ON
NORMAL
MINOR ALARM
MAJOR ALARM
3
TEST
ON
OFF
4
RESET
RESET switch Push-button switch for resetting visual and audible alarm indications.
# P0602484 Ver: 2.7 Page 35
Page 36
Media Processing Server System Operator’s Guide
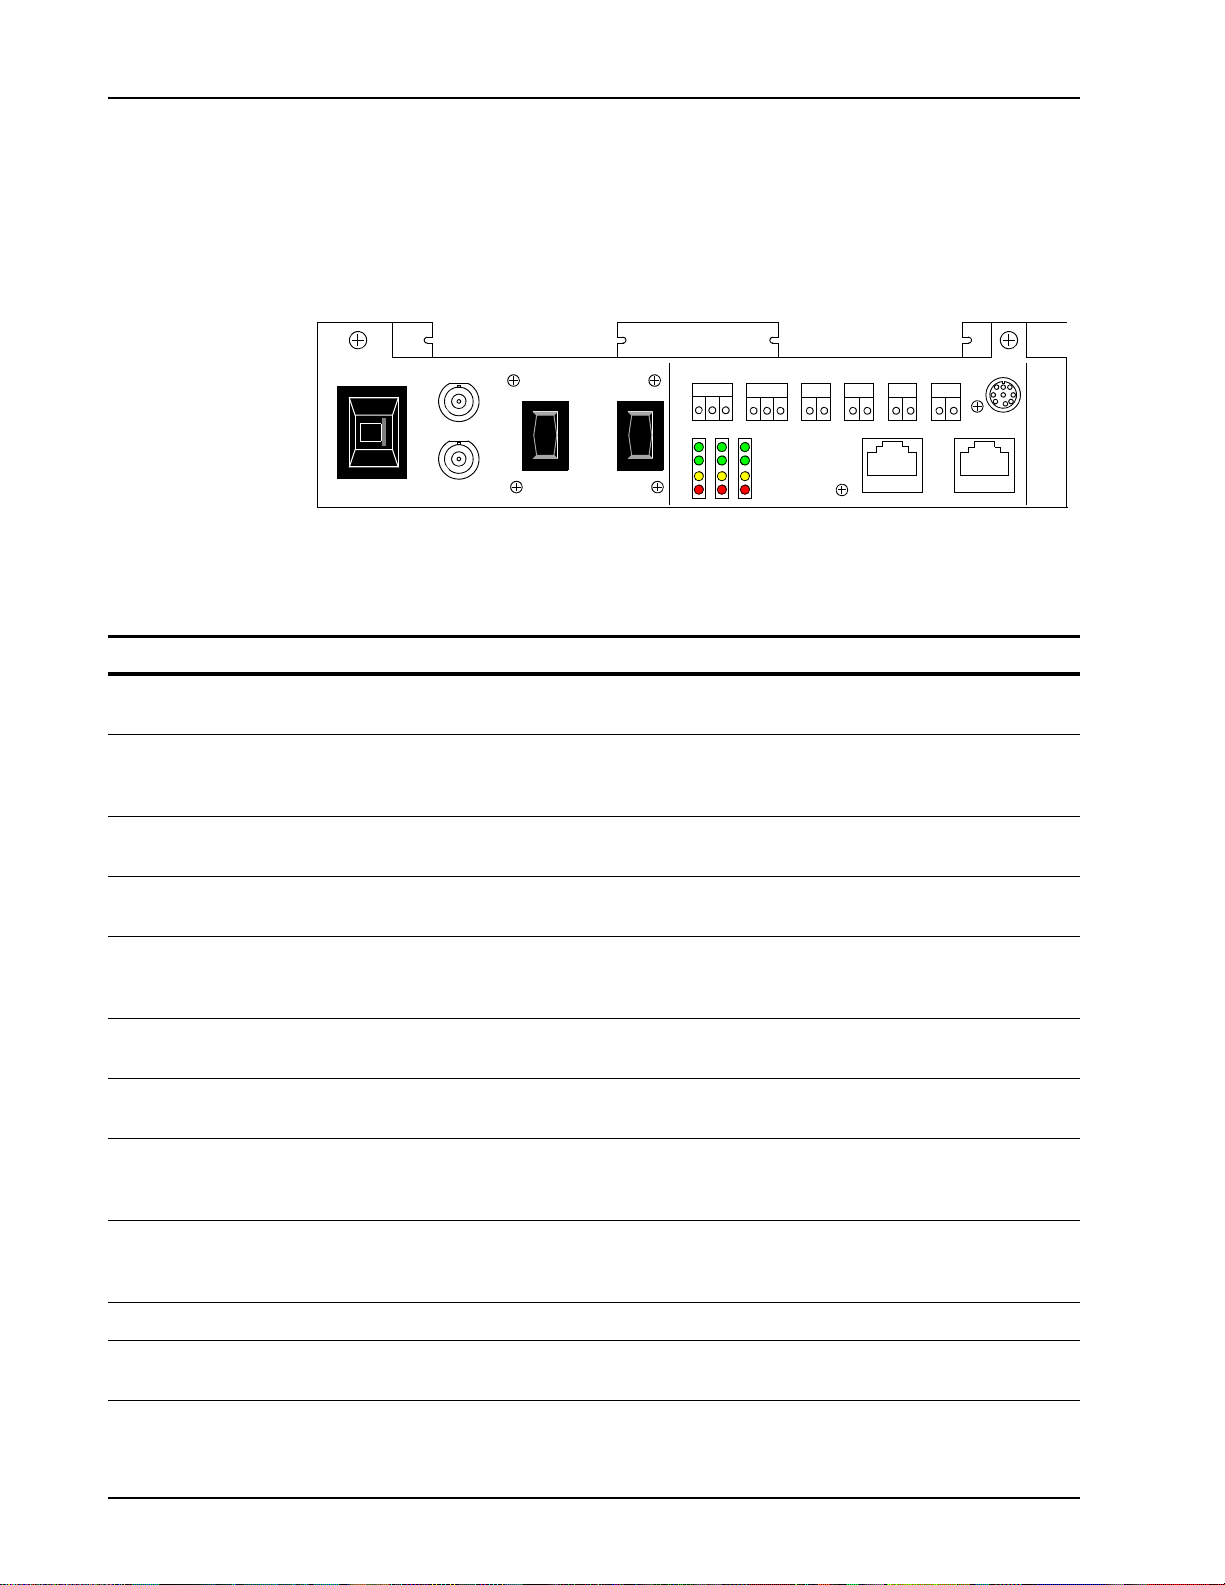
VRC Rear Panel
The rear panel of the VRC contains indicators, switches, and connectors for
maintenance, configuration, and connection to other system components. The
following illustration shows the VRC rear panel.
0
CHASSIS ID
EXT CLK A
EXT CLK B
MC1 IN
TEST
ON
OFF
6
SLOT
5
MC1 OUT
ALARM
MAJ MIN
NC C NO
NC C NO
NIC
S5 S6
PWR ON
NORMAL
MIN ALARM
MAJ ALARM
EXTERNAL SENSORS
A
BCD
ENET-B
CSL
ENET-A
VRC Rear Panel
Item Function
CHASSIS ID selector
switch
EXT CLK A and EXT
CLK B connectors
Used to assign the chassis number. Each chassis in the system is assigned a unique
number, starting at 0 and running consecutively.
BNC connectors used to obtain synchronization reference clocks for the CT bus from an
external source. The CT bus is the means by which voice and audio data is transmitted
throughout the TMS.
TEST / ON / OFF
switches (slots 5 and 6)
Three position rocker switch used to turn power to the slot on or off, or to test the associated
power supply.
ALARM relays Used to connect to external indicators for major and minor alarms. Common (C), normally
closed (NC), and normally open (NO) contact connections are provided.
EXTERNAL SENSORS
relays
Can be used to connect to external sensors for system indication of up to four separate
events (A,B,C,D). CAUTION: Voltage and current limitations. Do not connect to line
level signals.
PWR ON indicators
Illuminates green when power is applied to slot or NIC.
(S5, S6, and NIC)
NORMAL indicators
(S5, S6, and NIC)
MINOR ALARM
indicators (S5, S6, and
NIC)
MAJOR ALARM
indicators (S5, S6, and
NIC)
Illuminates green when the module in the associated slot or NIC is operating properly and
there are no alarms or system faults.
Flashes yellow when a minor alarm is active for the slot or NIC. Accompanied by audible
indication (beep). To reset, press the RESET switch on the FCP. Use as a troubleshooting
aid - alarms are promulgated to the Alarm Viewer (see Alarm Viewer on page 39).
Flashes red when a major alarm is active for the slot or NIC. Accompanie d by a udi bl e
indication (beep). To reset, press the RESET switch on the FCP. Use as a troubleshooting
aid - alarms are promulgated to the Alarm Viewer (see Alarm Viewer on page 39).
CSL connector Console connector, reserved for future enhancement.
ENET A and ENET B
RJ45 connectors used to connect the dual rail chassis Ethernet to the LAN.
connectors
Page 36 # P0602484 Ver: 2.7
Page 37
System Startup, Monitoring and Shutdown
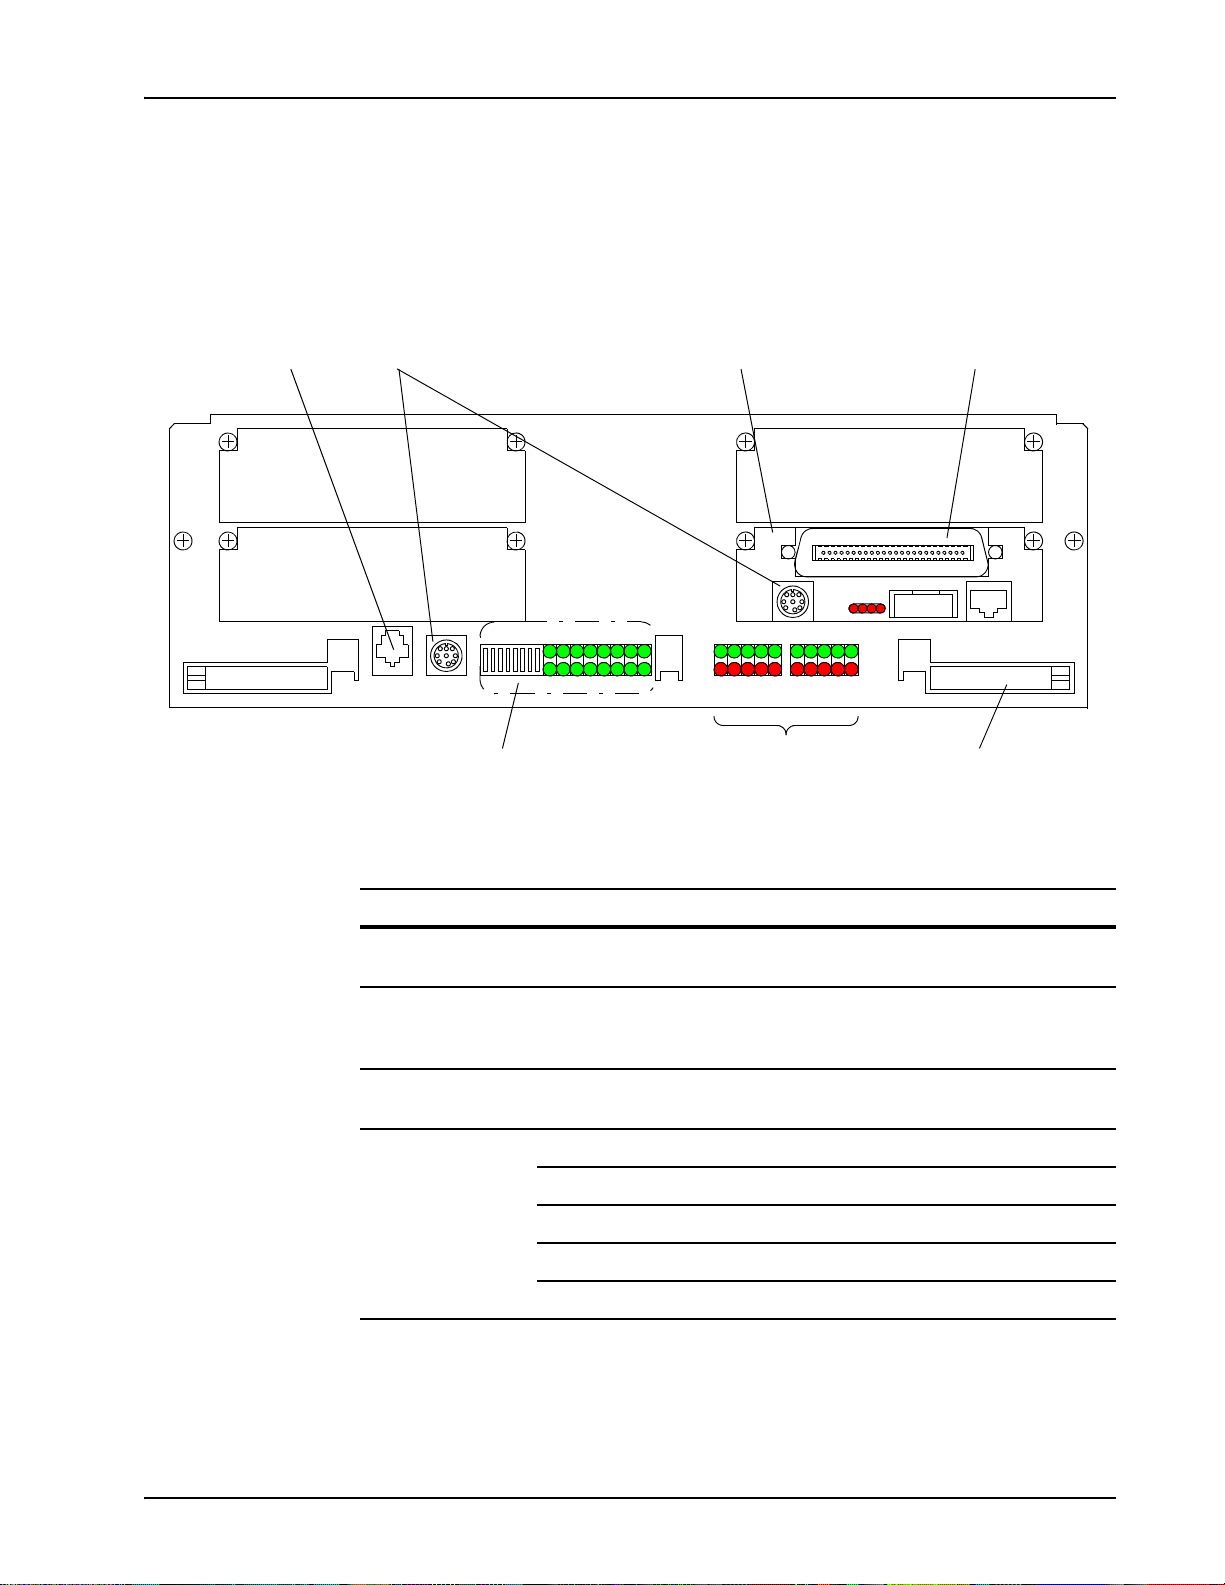
TMS Front Panel
In addition to front panel indicators, the system components have internal indicators
useful for system maintenance and fault isolation. Located on the front panel of the
TMS are connections to a diagnostic console for troubleshooting, LED indicators for
TMS health checks, and the span input/output connector.
RJ11 connector
(for handset)
Remote terminal
connectors
SLOT 1
SLOT 2
AUDIOCONSOLE
15
(Reserved for future enhancement) Extractor (2)
DCC Card
installed in slot 4
SLOT 3
SLOT 4
01234567891011121314
(Rotated View)
HUB B HUB A
E
S
S
MPC
E
S
X
L
L
T
4
3
S
O
X
L
L
L
T
2
1
Ethernet Hub
Status Indicators
MPC
O
L
TMS Front Panel Connectors and Indicators
Item Description
RJ48M connector
(up to 8 digital spans)
AUDIO jack RJ11 jack for connecting a telephone handset for monitoring
a phone line. (see AUDIO Monitor Jack on page 38).
CONSOLE jack RS232 (9-pin DIN) port for connecting a debug terminal.
Used for boot ROM and diagnostics (procedures which are
typically handled by certified Avaya Field Engineers).
LEDs 0 - 15 and
Reserved for future enhancement.
microswitches
HUB A/B LEDs
(see Ethernet Hub
Indicators on page
38).
EXT Indicates condition on external port of hub A or B.
SL1/2 Indicates condition on slot 1 or 2 port of hub A.
SL3/4 Indicates condition on slot 3 or 4 port of hub B.
MP Indicates condition on microprocessor port of hub A or B.
COL Indicates errors or collisions in hub A or B.
# P0602484 Ver: 2.7 Page 37
Page 38
Media Processing Server System Operator’s Guide
TMS Front Panel Connectors and Indicators (Continued):
Item Description
DCC Front Panel
Span connector RJ48M 50-pin connector connects up to eight digital spans
(T1 or E1) to PSTN.
Remote terminal connector RS232 (9-pin DIN) port for connecting a debug terminal.
Used for boot ROM and diagnostics.
Other connectors and
indicators
Reserved for future enhancement.
AUDIO Monitor Jack
The AUDIO monitor jack is used to monitor a single phone line. A
telephone handset is connected and the desired line can be monitored using the ccm
listen command (see the Avaya Media Processing Server Series System Reference
Manual for more information). Only one side of the
conversation can be monitored at a time.
Use call monitoring (listening to actual calls) only to confirm
that caller/Media Processing Server interaction is going
smoothly and that the Media Processing Server is operating
properly. Check applicable laws relating to privacy of
conversations before listening to calls.
Ethernet Hub Indicators
The dual green and red LED indicators for HUB A and HUB B on the front of the
TMS can display five separate conditions. The LEDs can either
be lit continuously or blinking in the following combinations to
indicate a particular condition.
Ethernet Hub Status Indicators
Indication
Steady green Receive link pulse FIFO error
Blinking green (@~ 4Hz) Transmit packet (N/A)
Steady red Reversed polarity Collision
Blinking red (@~ 4Hz) Receive packet (N/A)
Alternating red and green (@~ 5Hz) Partitioned out (N/A)
Conditions
EXT, SLx, MP COL
Page 38 # P0602484 Ver: 2.7
Page 39

System Startup, Monitoring and Shutdown
Alarm Viewer
Media Processing Server Series software, applications, and components generate text
alarm messages to indicate their status or to alert users to possible problems. Each
component in the network stores its alarms in its default alarm log file. This allows
viewing of “live” alarms on any component as the system generates them and viewing
the alarm log file of any component.
Use the Alarm Viewer tool to monitor alarms. Filtering and Properties of alarm log
files can be applied using the corresponding buttons at the top of the Alarm Viewer
window or via the new daemon level filtering functions. Multiple alarm viewers, in
any form (live or logged), can be launched at one time. This allows comparisons
amongst components to be made.
For information on launching and using the Alarm Viewer (see Alarm Viewer on page
39). See the PeriView Reference Manual for a complete description of the Alarm
Viewer. See the Avaya Media Processing Server Series System Reference Manual for
information on the alarm daemons and corresponding filtering capabilities and refer to
the Alarm Reference Manual for detailed description of the Alarm conditions.
Statistics Data Collection and Reporting
Typically, a single node in a Media Processing Server Series network is designated to
collect and report statistical data. This statistical data can be used to monitor system
and application level functions and to interpret various performance parameters and
milestones (such as when and how calls are taken and handled or whether certain
systems have experienced down time). PeriReporter is installed and resides on the
node designated for statistics consolidation. Use PeriReporter to view and generate
statistics reports.
System statistics are collected from each Media Processing Server by its VSTAT
process. One VSTAT process exists for each Media Processing Server, and resides in
that component’s VOS subcomponent. System variables (used in defining system
reports) are predefined.
Application statistics are generated during an application’s execution cycle and
collected by each node’s VSUPD process. One VSUPD process exists for each node,
and resides in the GEN subcomponent of the common component on the node.
For details on how to configure report parameters, see the PeriReporter User’s Guide
and (see System Statistics Reports on page 78).
# P0602484 Ver: 2.7 Page 39
Page 40

Media Processing Server System Operator’s Guide
Logging off a Node
One can log off a Solaris node by exiting the X-Windows environment. After log off,
software operations cannot be changed, however, the Media Processing Server Series
network continues to run without any manual input.
How to ... Log Off/Back Onto a Node
1. Close any tools that are running.
2. Click <M
3. For OpenWindows systems, select Exit...
For CDE systems, select Log out...
4. The system prompts to confirm the exit. Select Exit on OpenWin-
dows systems, OK on CDE systems.
The system returns to the desktop login screen.
To log back onto the Solaris node X-Windows environment:
5. Select the desired desktop environment from the Options menu
button of the desktop login screen, or click OK to return to the previ-
ous environment setup. (For more information, see the related subordinate steps on page 13).
Avaya ships Solaris Media Processing Server Series systems with a Sun station as the
node. OpenWindows and CDE are trademarked products presently used by Sun to
simulate an X-Windows environment. If the environment is not a Sun workstation,
events may vary from the above descriptions.
ENU> on the desktop to pull up the Workspac e menu.
Page 40 # P0602484 Ver: 2.7
Page 41

System Shutdown
System Startup, Monitoring and Shutdown
After the Certified A vaya personnel starts the system for the first time, there is rarely a
need to shut down or restart the system. Most changes to the applications and
MultiMedia files can be made while the system is in normal operation. However, the
MPS may have to be shut down to upgrade the hardware or software, or relocate th e
system.
Use PeriView to stop the applications, then stop the TMS and Central Processing Unit
(CPU).
How to ... Shut down the Media Processing Server
1. Select all the Media Processing Servers. Select the domain, then
select the Application Manager (APPMAN).
2. Select Terminate from the Action list. Select the Terminate (soft
terminate by default) and/or Unassign checkbox(es) in the Action
item list. This allows any calls in progress to terminate normally or
continue up until the value of the kill timer has expired.
Failure to terminate the applications softly can cause the IVR to hang up
on callers currently dialed into the system.
3. Select the APPLY button. Wait for the Terminate/Unassign Lines
Progress window to reach 100%.
4. Close all tools that are running.
5. Shut down power to the TMS systems. For locations of their power
switches, Front Control Panel on page 35 and VRC Rear Panel on
page 36
# P0602484 Ver: 2.7 Page 41
Page 42

Media Processing Server System Operator’s Guide
6. In any command tool, log in as “root.”
a. From the command line enter su.
b. Enter the root password (____________).
7. Enter halt. This command has been m od ified by Avay a to perform
a controlled shutdown, taking down system processes and functions
in the proper sequence and timing.
8. Wait for the ROM prompt (ok>).
If the halt command has been executed and the system does not
respond, execute the halt.orig command instead.
9. Toggle off the main power switches.
Before powering off the system, if it is desired to restart it, enter boot at the ROM
prompt and press <E
off a Node on page 40. Remember to power up the TMS units if they’ve been shut
down.
NTER>. Proceed with the login instructions outlined at Logging
To restart the system after power down, see Routine Media Processing Server
Startup on page 28. Normally and by default the Media Processing Server Series
system is designed to automatically boot when powered up. If the system does not
perform in this manner and stops at the ROM prompt:
• log in as “root.”
•enter su.
• enter the root password (____________).
•enter the reboot command.
Avaya has altered the reboot command to first perform a controlled shutdown,
then bring the system up gracefully. A message will be displayed that the original
Solaris reboot command has been renamed to reboot.orig.
The system memory can be “flushed” before rebooting by entering the reset
command from the ROM prompt. This ensures that there are no processes still in
memory prior to the system coming back up.
If there is a fire or some other emergency , and time allows, damage to the Media
Processing Server can be limited by following step 5. through step 9. above and
unplugging the unit. If the situation does not allow time for all the above (it can take
up to five minutes), the system can simply be unplugged. If the emergency persists, it
is wise to leave the area.
Page 42 # P0602484 Ver: 2.7
Page 43

System Startup, Monitoring and Shutdown
This page has been intentionally left blank.
# P0602484 Ver: 2.7 Page 43
Page 44

Media Processing Server System Operator’s Guide
Page 44 # P0602484 Ver: 2.7
Page 45

Command Line Functions
This chapter covers:
1. Command Line Interaction
2. Online Documentation
Page 46

Media Processing Server System Operator’s Guide
Command Line Functions
This chapter provides the information needed to interact with the Avaya Media
Processing Server, use the documentation package, and locate reference material.
Although most interaction with the system is through GUI tools like PeriV iew or MPS
Developer, command line interaction is needed to issue certain status and call
monitoring commands and to interact with the operating system. This section
describes these command tool operations.
Page 46 # P0602484 Ver: 2.7
Page 47

Command Line Interaction
A command line is the system command interpreter. It reads commands and interprets
them as requests to execute tasks. Commands can be entered in the Media Processing
Server VSH command line. Access a VSH command line by opening a command/
shell tool on the Solaris desktop. The PeriView Reference Manual contains details
about using the VSH Command Line.
Access is available to several command lines. The two most important are:
Type Default Prompt Description Use for:
Command Line Functions
Media
Processing
Server
shell
Command
Tool
vsh#<component_type>.
<component_number>/
<node_name> {N} ->
<username>@node_name {N}
(or, if $HOME for user is not
set...)
node_name%
Avaya
command shell
Solaris
command shell
(csh)
• all Solaris
commands to the
local node
• all component/
Media Processing
Server Series
commands
• all Solaris
commands to the
local node
• starting component
tools
See the Media Processing Server Series Command Reference Manual for a detailed
explanation of the MPS command shell, and the Solaris system documentation for a
detailed explanation of the Solaris command shell.
It is possible to move between command windows at any time. For information see
Command Control on page 50.
If a Media Processing Server Series command is entered in a Solaris command tool,
the system sends an error message and returns to the prompt. For example, if ccm
shake status is entered at a Solaris command shell, the following results:
# P0602484 Ver: 2.7 Page 47
Page 48

Media Processing Server System Operator’s Guide
Command Line Editing
The Media Processing Server Series uses standard C-shell (csh) conventions for
command line editing. This section is a quick look at some common command line
editing techniques. See a Solaris guide for a comprehensive discussion of these
conventions.
In the default configuration mode, the Media Processing Server shell prompt is:
vsh#<component_type>.<component_number>/<nodename>{N}->
where <component_type> is the current component type,
<component_number> is the current component number, <nodename> is the
local node, and N is an up to three-digit number the system increments for each
command entered, if no prompt is visible, press <R
Media Processing Server to display a prompt (unless the system is already performing
some other action and is not available for immediate command processing).
The following information pertains to command line editing:
• The system only receives and executes console commands after the
<R
ETURN> key is used.
ETURN>. This should cause the
• The system maintains a command history buffer that contains the last 100
commands executed. Display this buffer to the console by entering history
at any command line.
• Commands can be executed from the history buffer by using the number of
the command preceded by an “!”. The command number is in the prompt
within the “{ }” braces. For example, !95 repeats command number 95.
• The command number increments for each new command entered at the
console. After more than 100 commands have been entered, the system
removes the oldest command from the history buffer.
• Repeat the last command executed by entering !!.
• Change any character string in a previous command to a different string by
entering ^oldstring^newstring at the command prompt. If the last
character in newstring is a space, use a concluding ^. For example,
^24^25 changes the first occurrence of string 24 in the last command to 25
and re-executes the command with the new value. Also, if the command
cp<oldname> <newname> is entered (note the missing space), enter
^cp^cp ^ to correct the command.
Page 48 # P0602484 Ver: 2.7
Page 49
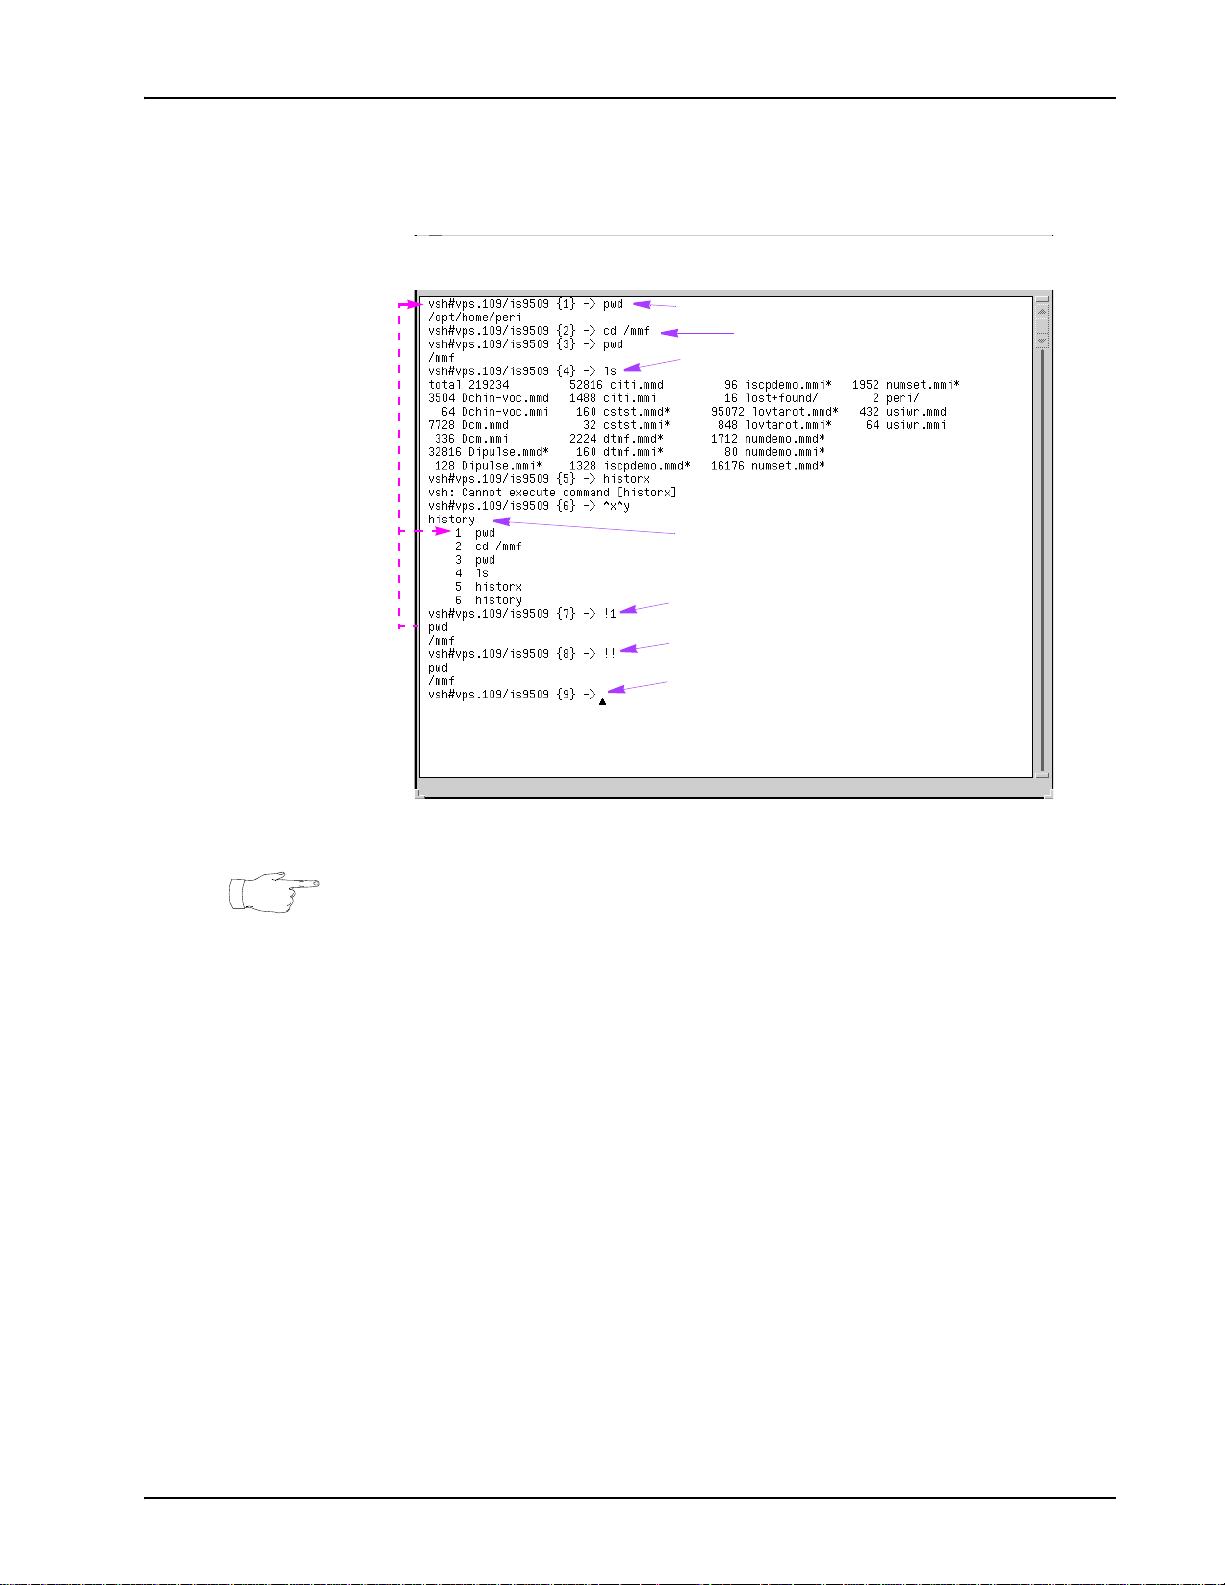
Command Line Functions
The following is a sample console interaction that uses the basic command editing
functions. If viewing this manual on-line, click on a description below to find out
more about the corresponding command.
Present working directory
Move to another directory (in this case /mmf)
List all files except hidden ones in the
present working directory (pwd)
Result of incorrectly spelled (hence unknown)
command, and correction using re-execution shortcut.
}
Lists up to the last 100 commands executed in the window.
Repeats and executes the specified numbered command (as
identified by the window {} display or history command
}
list) and returns the current result.
Repeats the previously entered command.
Prompt ready for command processing.
Commands can be entered in the Media Processing Server shell using the VSH
Command Line. For information about using the VSH Command Line, see the
PeriView Reference Manual.
# P0602484 Ver: 2.7 Page 49
Page 50
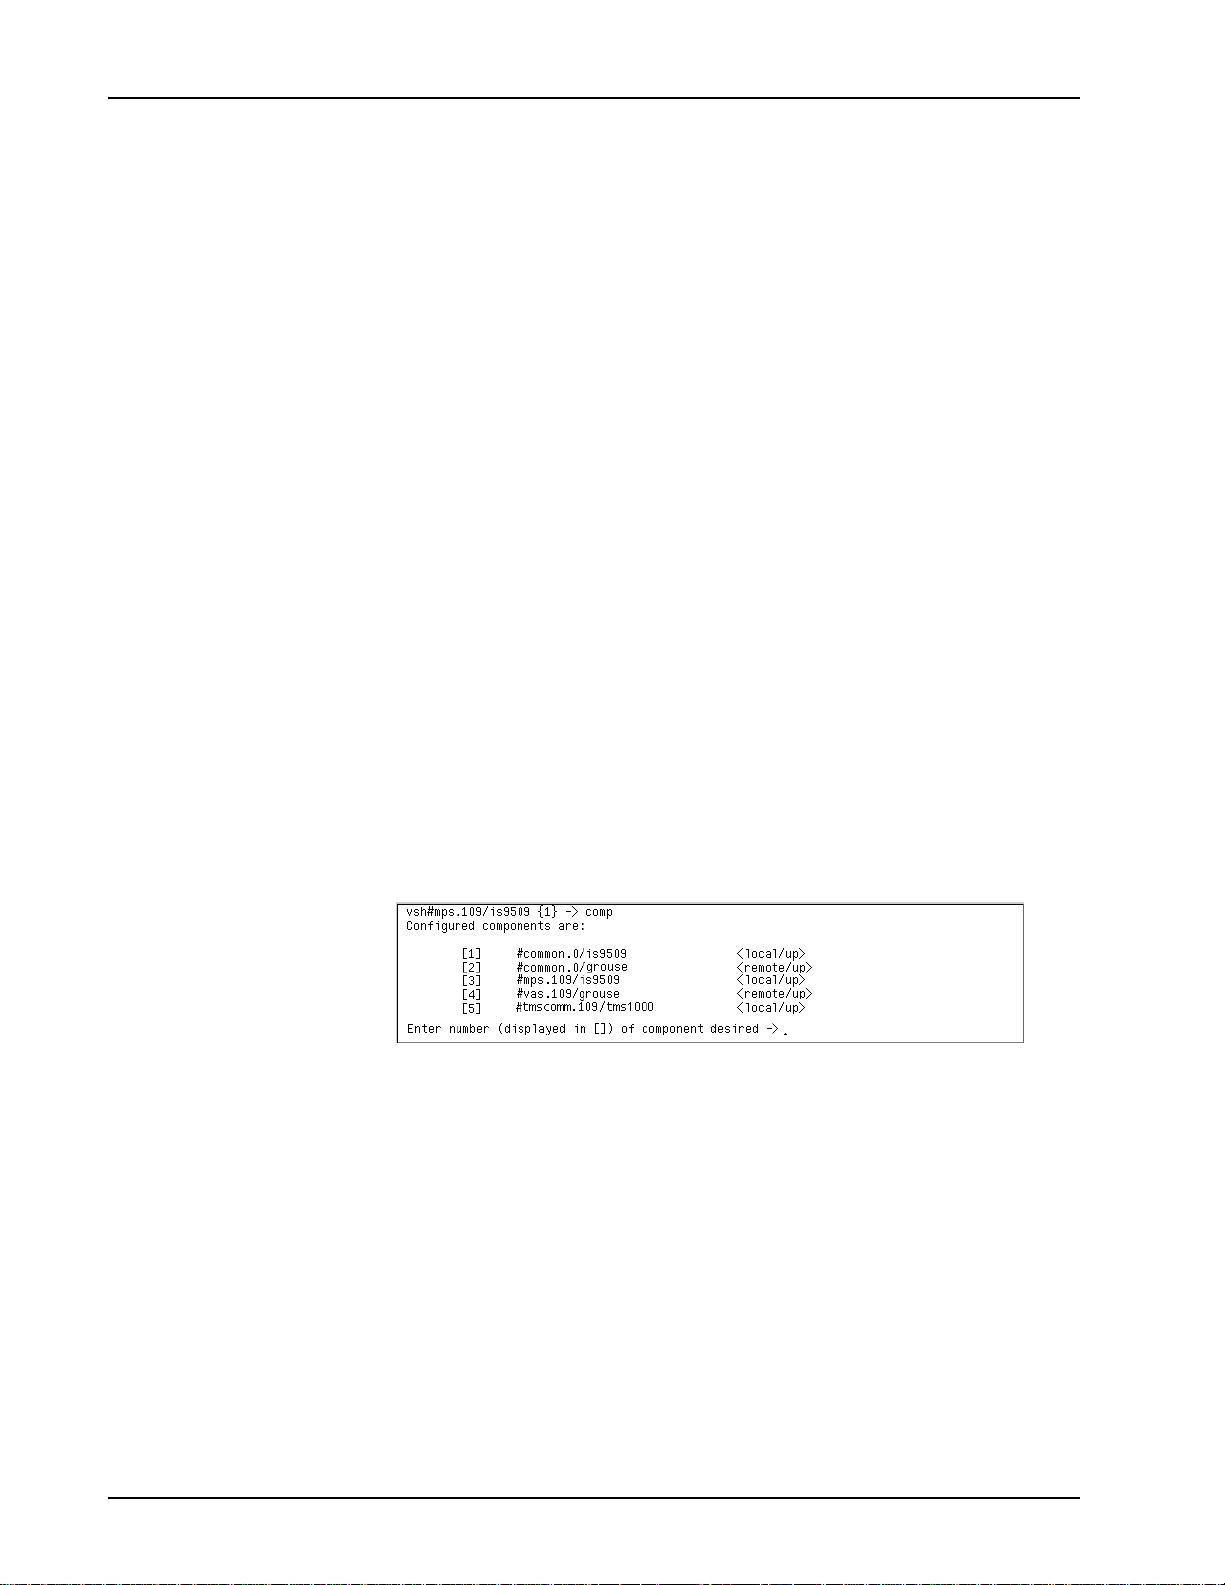
Media Processing Server System Operator’s Guide
Command Control
Individual control can be exercised over each component in the network, as well as
over how each component executes the commands entered. Components are outlined
at see System Configurations on page 19..
Issuing Commands to a Component
Issue commands to any component in the network through the command line for that
component. The Media Processing Server shell command line may be accessed in one
of two ways: through the VSH Command Line.
To access the Media Processing Server shell from a Solaris shell, rsh to any
component node, then enter vsh and press <R
Processing Server node, the shell prompt of the lowest numbered component displays.
Select the desired component to elicit its shell prompt.
The default Media Processing Server shell prompt indicates the current component
type and component number (that is, the component that is local to the node) as well
as the node from which the tool was launched. If more than one component is
configured for the node, the initial prompt displays the component with the lowest
number. For example, if the prompt is vsh#mps.109/is9509 {1} ->, then
mps.109 is the current component and is9509 is the name of the node.
ETURN>. If this is done at a Media
The comp command identifies the currently configured compon ents along with their
status. “Local” indicates the component is connected to this node. “Remote”
indicates the component is connected to another node in the network. See the Media
Processing Server Series System Reference Manual for a detailed discussion of the
Media Processing Server Series network.
All Solaris commands entered in a Media Processing Server shell are issued to the
local node regard less of the current component. For example, if the current
component is vas.1 and grouse is the name of the current node, but the VSH
Command Line was launched on node is9509, ls lists the files in the directory on
is9509, not on grouse. T o identify the local node when connected to a component
remote to that node, enter the hostname command at the prompt.
Page 50 # P0602484 Ver: 2.7
Page 51
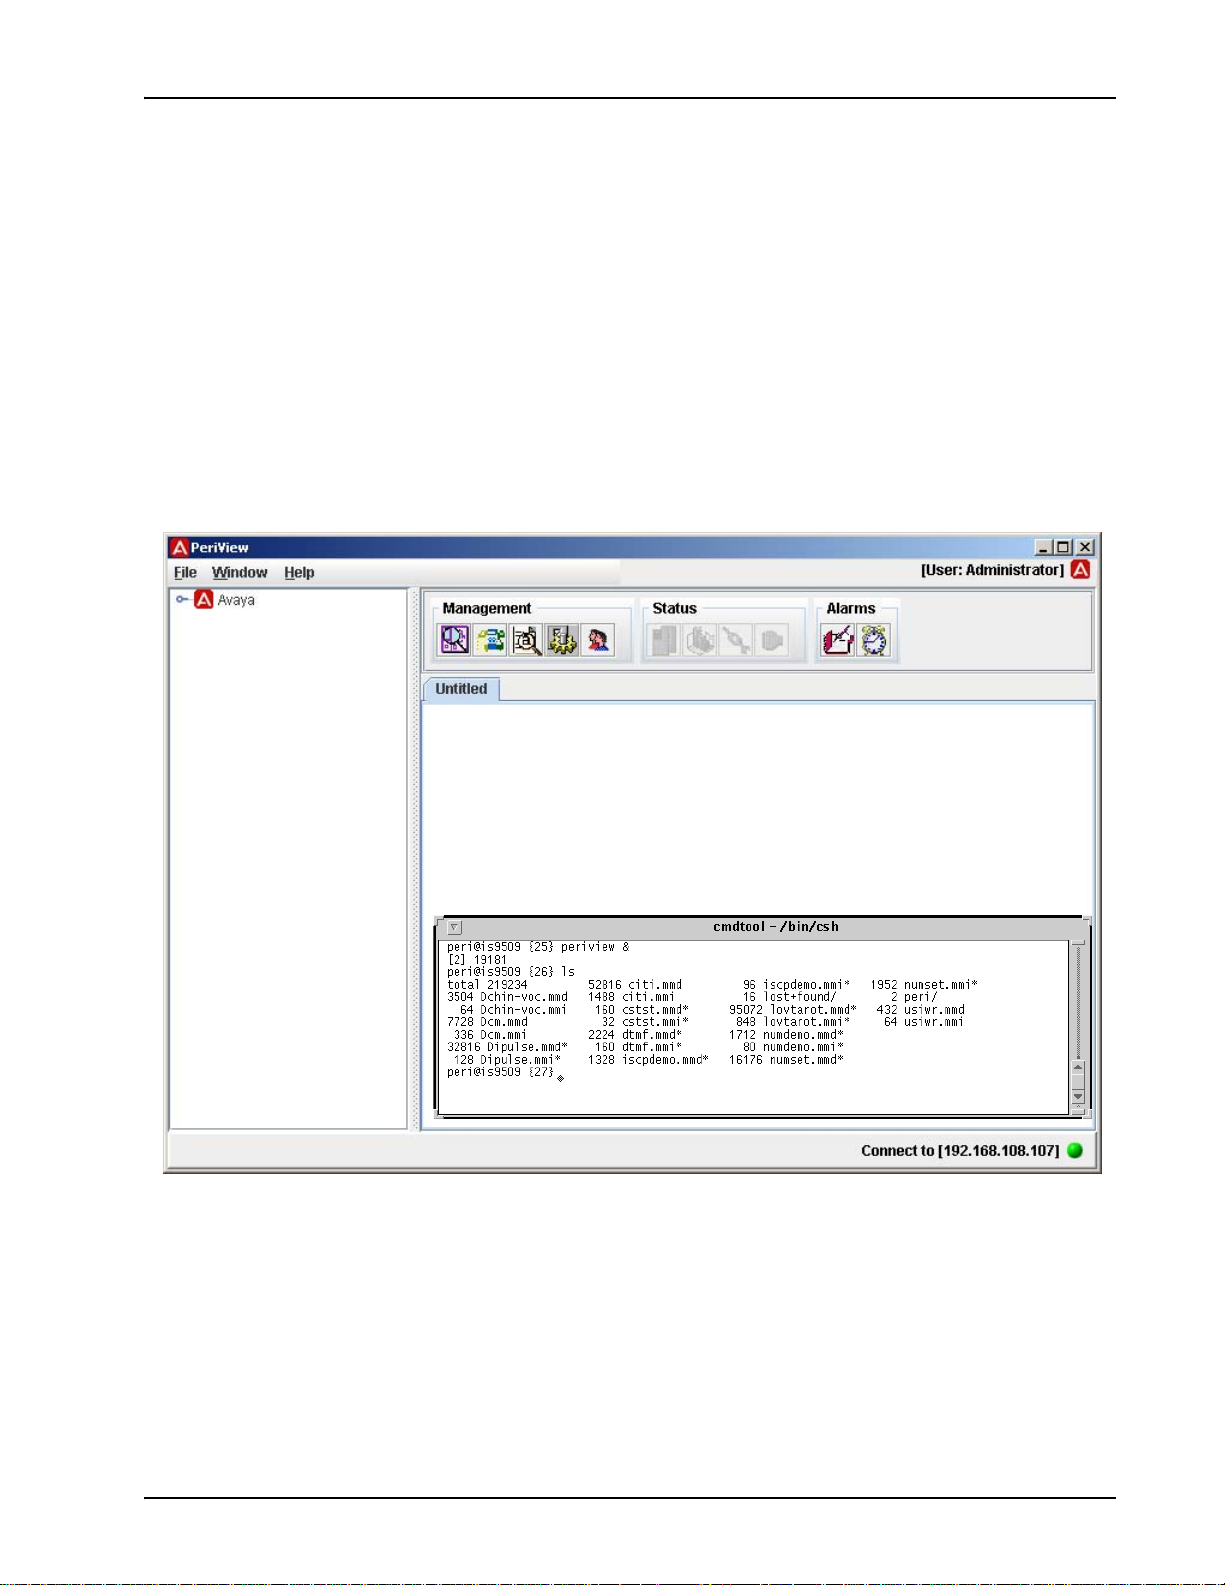
Command Line Functions
Foreground and Background Commands
The Media Processing Server handles command execution like a standard operating
system. That is, the system executes commands in the order they are entered. When
entering standard commands, the Media Processing Server runs each command to
completion before it displays a prompt for the next command.
Commands can also be executed in the background by following the command with
“&”. In this mode, the Media Processing Server takes the input and begins processing,
but does not wait for the command to complete. Instead, it immediately displays a
prompt. For example, PeriView can be launched in the background and then another
command can be immediately issued.
# P0602484 Ver: 2.7 Page 51
Page 52
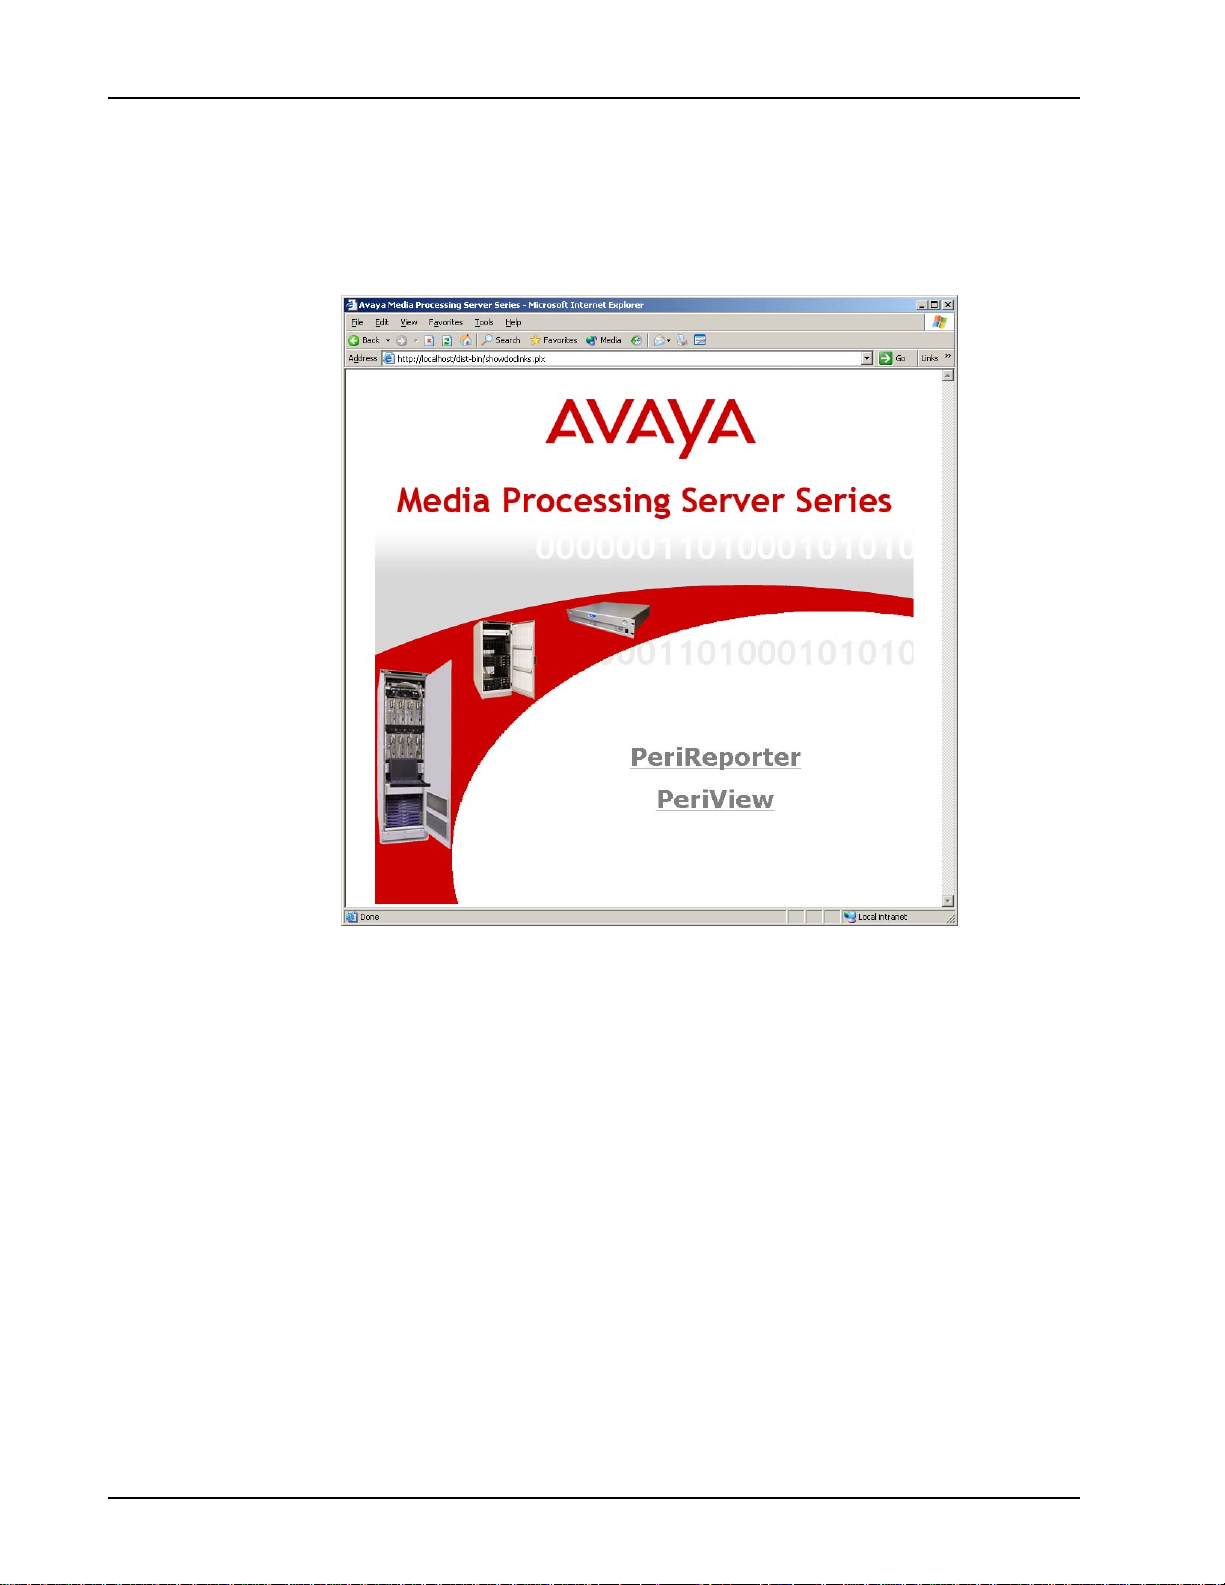
Media Processing Server System Operator’s Guide
Online Documentation
Avaya documentation is available on-line in PDF format. This documentation is
accessed via a Web browser by entering the address, http://localhost and
clicking on the Documentation hyperlink.
Page 52 # P0602484 Ver: 2.7
Page 53

Status Monitoring
This chapter covers:
1. The Alarm Viewer
2. Status Monitoring
3. System Statistics Reports
Page 54

Media Processing Server System Operator’s Guide
Status Monitoring
This chapter provides the information needed to:
• Audit overall system performance
• Monitor component functionality
• Monitor phone line events
• Report system statistics
Although most interaction with the system is through GUI tools like PeriV iew or MPS
Developer, command line entries are needed to issue some status and call monitoring
commands. This section also describes these operations. For specifics concerning
interaction with the system as a whole, see Command Line Interaction on page 47..
The Alarm Viewer
The system software processes of the Avaya Media Processing Server Series generate
text alarm messages that indicate their status or alert users to possible problems. Each
component in the network stores its alarms in its default Alarm Log File. This allows:
• viewing of alarms on any component as the system generates them (live alarms),
and
• viewing of the alarm log file of any component.
The following steps explain how to use the Alarm Vi ewer tool to monitor alarms.
How to ...View Alarms
1. Start PeriView.
Before launching the Alarm Viewer, use the Alarm Filter to determine which alarms
to view.
2. Start the Alarm Filter.
a. <LEFT> click on the Alarm Filter icon.
Define the alarms that actually display in the Alarm Viewer by setting the filtering
properties. Alternatively, load a previously saved viewer configuration file (contains
filter definitions). See the PeriView Reference Manual for a complete description of
the Alarm Filter.
Page 54 # P0602484 Ver: 2.7
Page 55
Status Monitoring
b. Select Choose Log in the Alarm Filter window to select user
defined Historical Alarm Log files.
Specific alarm log files must be selected before they can be displayed in the Alarm
Viewer.
3. Start the Alarm Viewer.
a. <L
Live alarms display as the generated alarms are received by the Alarm Viewer from
alarm daemons.
EFT> click on the Alarm Viewer icon.
Default alarm log files display in the order in which they are selected in the Logged
Alarms Filter. See the PeriView Reference Manual for a complete description of the
Alarm Viewer.
Alarms are generated by the alarmd daemon. If alarm filtering has been instituted at
this level or that of alarmf (an intermediate filter daemon), the Alarm Viewer only
receives those alarms that pass the filtering criteria. For detailed information see the
Media Processing Server Series System Reference Manual.
see To Monitor Components on page 59.
The log file for each component can also be accessed from the Media Processing Server shell. Both the default log file and its backup are in the
directory $MPSHOME/common/log, where the files for the specific
components are identified in the format
alarm.component_type.component_number.log. The
default log is .log and its backup is .log.bak. The .log file is created when the system boots. The .log.bak file is created when the preconfigured file size is exceeded. Use standard commands or editors to
view and/or edit these files.
Refer to the Alarm Reference Manual for detailed description of the
Alarm conditions, error causes, and remedial actions.
The alarms that the Media Processing Server generates can be customized
by modifying records in the alarm database, located in $MPSHOME/
common/etc. Additional information concerning the alarm database
can also be found in the PeriView Reference Manual.
# P0602484 Ver: 2.7 Page 55
Page 56

Media Processing Server System Operator’s Guide
Status Monitoring
The Media Processing Server has many built-in functions for monitoring system and
line status. With these functions, the status of components, spans, external host(s),
phone lines, MMF files, applications, the Call Control Manager (CCM), the Voice
Memory Manager (VMM), and the Startup and Recovery Process (SRP) can be easily
monitored. Standard commands can also be used to display and/or modify the system
date and time.
System Date/Time
To check the system date and time, enter date at any Solaris or Media Processing
Server shell command line. The super-user can use date to modify the system date
and time. See the Solaris system documentation for more information.
Although it is not necessary to alter the system date for daylight savings time, users
are often unaware of this. In this regard, it is not recommended to change the system
time by issuing the date command directly. If the time is set back by issuing the
date command, cron will have difficulty performing scheduled tasks, all of
which will become queued up until cron itself terminates. Evidence of this can
usually be detected in the /var/cron/log file. If the system time is adjusted to a
point prior to the start time of cron, its jobs are not resched uled correctly. The correct
method to alter the system date is to stop cron, issue the date command, and
restart cron as shown below:
/etc/rc2.d/S75cron stop
date <new_date/time>
/etc/rc2.d/S75cron start
If the time or date on the system was recently changed, be sure that the clocks on all
the communicating systems are synchronized. Non-synchronized system times can
adversely affect statistics collection.
Solaris Management Console
Solaris Management (SMC) Console provides a scheduler GUI. This allows to set up
cron jobs through the use of a GUI instead of editing the crontabs file manually.
Follow the below steps to edit a list of existing crons:
• On the console, (as any valid user such as peri or root) open a command
window and execute: /usr/sadm/bin/smc
• Allow several minutes for the SMC to initialize and configure itself.
• At the welcome screen, expand “this computer” icon.
• Select the “services” option.
• Enter the user in the login prompt (this is the cron user you plan to mana ge—
peri or root)
• The existing crons will be listed and you can add/delete/modify the jobs as
Page 56 # P0602484 Ver: 2.7
Page 57
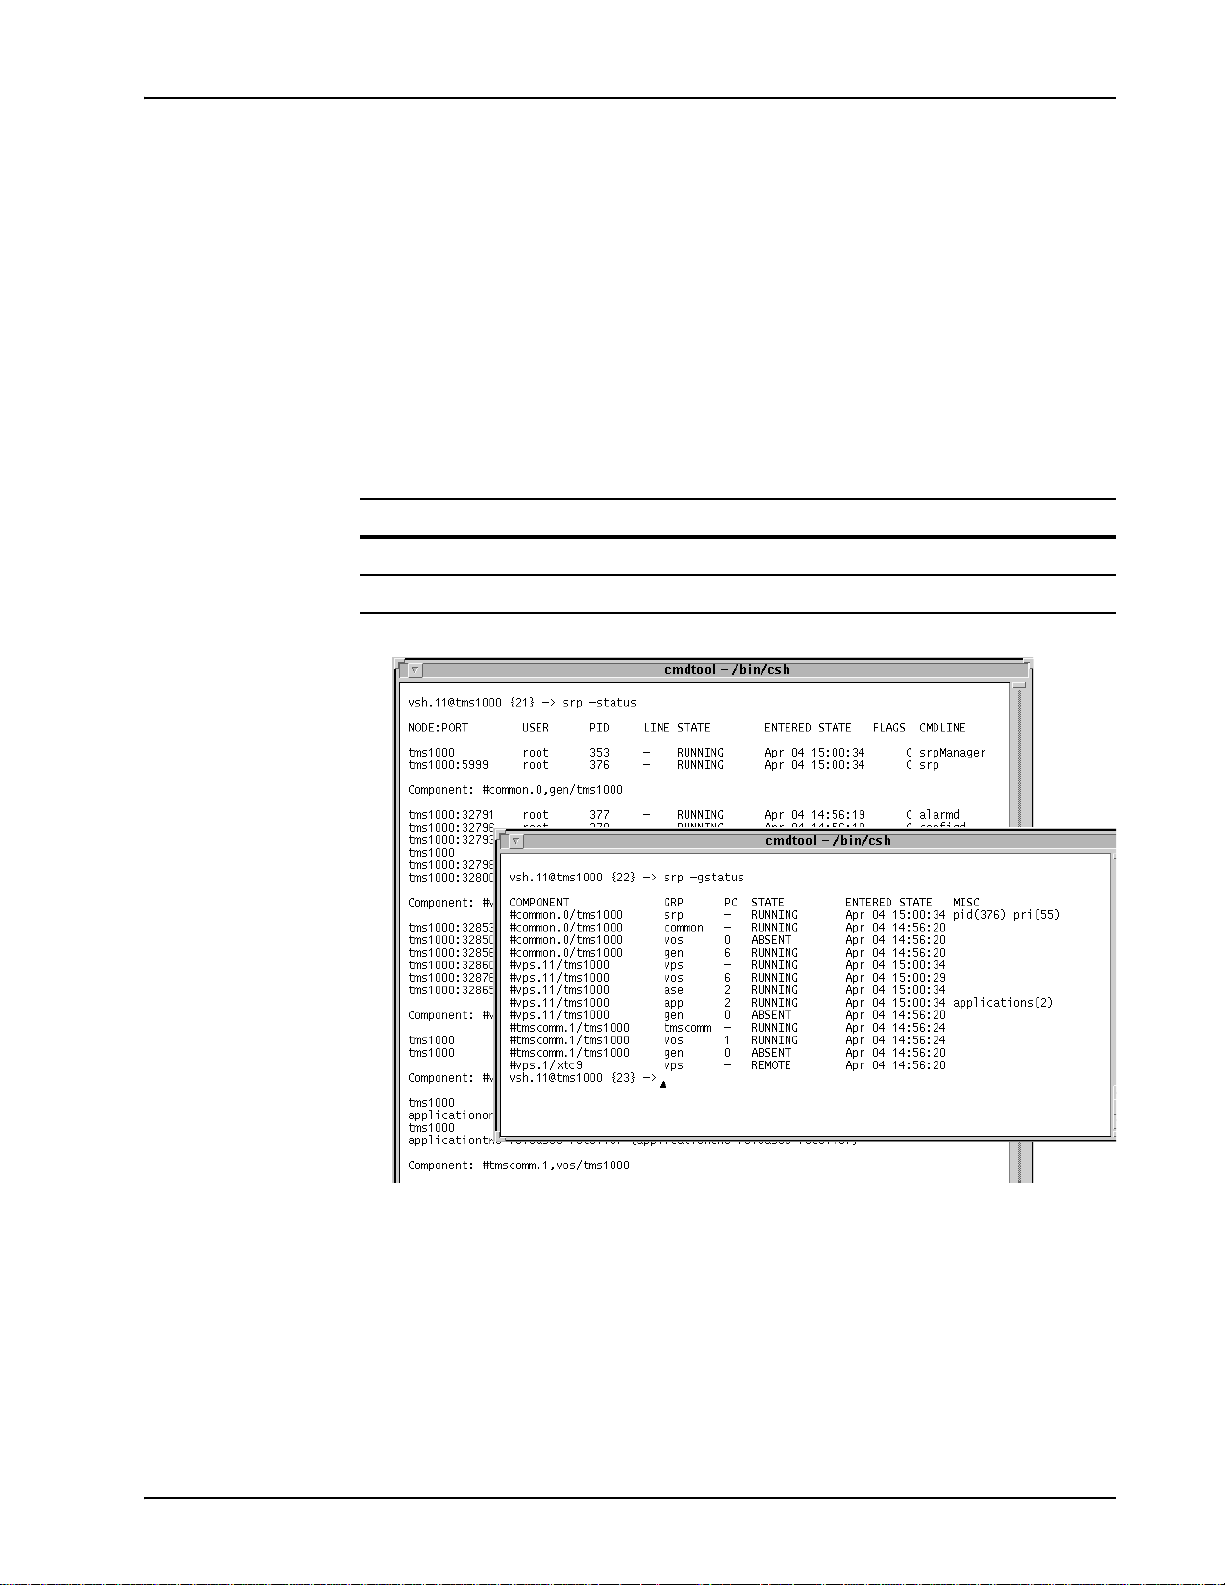
Status Monitoring
desired.
SRP Status
The Startup and Recovery Process (SRP) functions as the parent of all MPS system
processes. SRP spawns the relevant programs at system startup, performs watchdog
duties for each TMS and VOS process, acts as a topology database server; spawns and
terminates VENGINE applications, and restarts abnormally terminated programs.
The status of SRP can be obtained (as well as that of other processes and applications)
or process groups and applications at a VSH command line (on a particular node) with
the following commands:
Command syntax Report
srp -status SRP status for the (specified) node
srp -gstatus SRP group status for the specified node
The PeriView Reference Manual contains details about using the VSH Command
Line. See the Media Processing Server Series System Reference Manual for detailed
descriptions and examples.
Component Status
The status of components can be considered the highest level of overall system
monitoring. A component status of “down” can be indicative of more serious
problems somewhere within the system. These problems can then be located using
# P0602484 Ver: 2.7 Page 57
Page 58

Media Processing Server System Operator’s Guide
more specific means (see the paragraphs that follow as well as the PeriView Refer ence
Manual.
How to ... Monitor Component Status
From the Command Line
The most generalized means of checking overall component status is through use of
the VSH command line.
• rsh to the node that contains the component(s) to be monitored (use the vsh
command to access the VSH command line).
•Enter comp and press <R
configured components along with their status.
Using PeriView
Components supported by PeriView include MPS, OSCAR, MTS, CCSS, CSS,
VAPI, RTR, SNTRY, DCS, CTXCOMM, and TMSCOMM (for an overview of these
components see the PeriView Reference Manual). The means of monitoring each
varies, however.
Basic information that applies to monitoring of all components in PeriView includes
interpretation of colors resident on component icons in relation to component state.
State is a representation of a PeriView tool attempting to contact some Media
Processing Server Series process. In the case of tree objects, PeriView tools
(Application Manager and Status tools) attempt to contact SRP (S tartup and Recovery
Process). Until contact is confirmed, the state of the component is defined as
Unreachable, as no information is available. Unreachable components display as
black objects in the workspace (assuming the tree is expanded to display its
components). A component will be considered Unreachable for the window of time
that it takes to return a response to the tool requesting either initial contact or any
contact after contact is lost.
ETURN>. This command identifies the currently
Components acknowledge contact with the tool on an individual basis. A component
is no longer considered Unreachable when it returns information to the tool about its
state, which will be either Up or Down according to SRP. Components in an Up state
(identified by SRP as RUNNING) display as green objects. Components in a Down
state (identified by SRP as anything other than RUNNING) display as red objects.
Page 58 # P0602484 Ver: 2.7
Page 59

Status Monitoring
Components are represented by icons at the tree level. The following are examples of
these icons:
MPS tmscomm OSCAR
For complete information on how colors, icons, and states apply to PeriView, and for
further information regarding SRP, see the PeriView Reference Manual.
To Monitor Components
1. Select the Desired Component. <R
<RIGHT> click on
icon, then select
property.
IGHT> click on the icon
next to a component to display various properties. Properties are different depending on the component type selected. The following represents a list of properties for an MPS.
# P0602484 Ver: 2.7 Page 59
Page 60

Media Processing Server System Operator’s Guide
Multiple pieces of information about a component can also be displayed. For example,
selecting a components span, then the spans lines in use, then the lines attributes
produces the following output.
For complete information on this and other items concerning PeriView, see the
PeriView Reference Manual.
Phone Line Status
The status of the phone lines can be displayed with the Line Status tool.
How to ... Monitor Phone Line Status
Using PeriView
Launch the Line Status tool. Select a node or component from the PeriView
navigation pane, then select the Line Status tool.
The Line Status tool, shown below, displays the physical state of phone lines for a
Page 60 # P0602484 Ver: 2.7
Page 61

Status Monitoring
specific period of time. Phone line status indicates what is actually happening on the
line during a time period. The current phone line status for MPSs and applications can
be monitored.
Phone line status is defined by seven color coded activity states, which display along
the y-axis of each graph.
The Line Status tool quantifies and displays each the following phone line states:
Connected, Ready, Referral, Busy, Down, No Answer, and Unreachable. These
six phone line states are defined in the following table.
# P0602484 Ver: 2.7 Page 61
Page 62

Media Processing Server System Operator’s Guide
Table 1:
Phone Line State Color Des cription
Connected Green The monitor detects ongoing interaction
Ready Yellow The monitor detects the or MPS’s phone lines
Referral Orange Detected activity is dependent upon the type of
Hook Flash Referral The monitor detects the MPS’s phone lines are
Digital Referral Activity can be in one of the two following
between the or MPS’s phone lines and callers,
indicating calls are in progress on these lines.
are in service and ready to take calls.
referral method that has been instituted—either
a hook flash or digital referral method.
in the process of referring the call to an
operator.
states:
• The lines are in the process of referring to
operators.
• The callers are interacting with operators
Busy Purple The monitor detects the MPS’s phone lines are
in an in-service-busy state and not able to take
calls.
Down Red The monitor is able to contact the or MPS’s
phone lines, but detects the lines are not able to
receive calls, indicating that these lines can be
faulty.
No Answer Blue The line is Idle and the state is set to no
answer.
Unreachable Black Phone line status has been queried for its state
and no message has been received by the
Monitor (basically, a missed response).
Also, it could mean that SRP did not respond to
information about the phone line from the
Monitor. The Monitor needs to query SRP
about how it should contact the CCM (Call
Control Manager) process, before it can
actually contact CCM.
Span Status
Span status can be monitored from the command line. Monitoring can also be
accomplished through the PeriView Span Status tool, which provides graphical
representations of various aspects of a digital span.
Page 62 # P0602484 Ver: 2.7
Page 63

Status Monitoring
How to ... Monitor Span Status
From the Command Line
T o determine span status from the command line, first switch to the node on which the
component that contains the span(s) to be checked is located (see Issuing Commands
to a Component on page 50.). Next, enter the command dlt and select the
component that contains the span(s) from the list of configured components (this list
only displays if there is more than one local component other than common or
tmscomm configured on the node). After the node has connected to both tcad and
trip (two processes needed to develop the information), enter spanstatus <n>,
<n-n>, or <all>, where <n> is the number of the span in question, <n-n> is a
series of spans, and <all> is all spans configured on that node. The span status
report displays as follows:
Using PeriView
Span Status is available for each digital Media Processing Server defined for the
domain in the Activity Monitor’s workspace. A Span Status tool can be launched for a
single Media Processing Server or for multiple Media Processing Servers; a window
# P0602484 Ver: 2.7 Page 63
Page 64
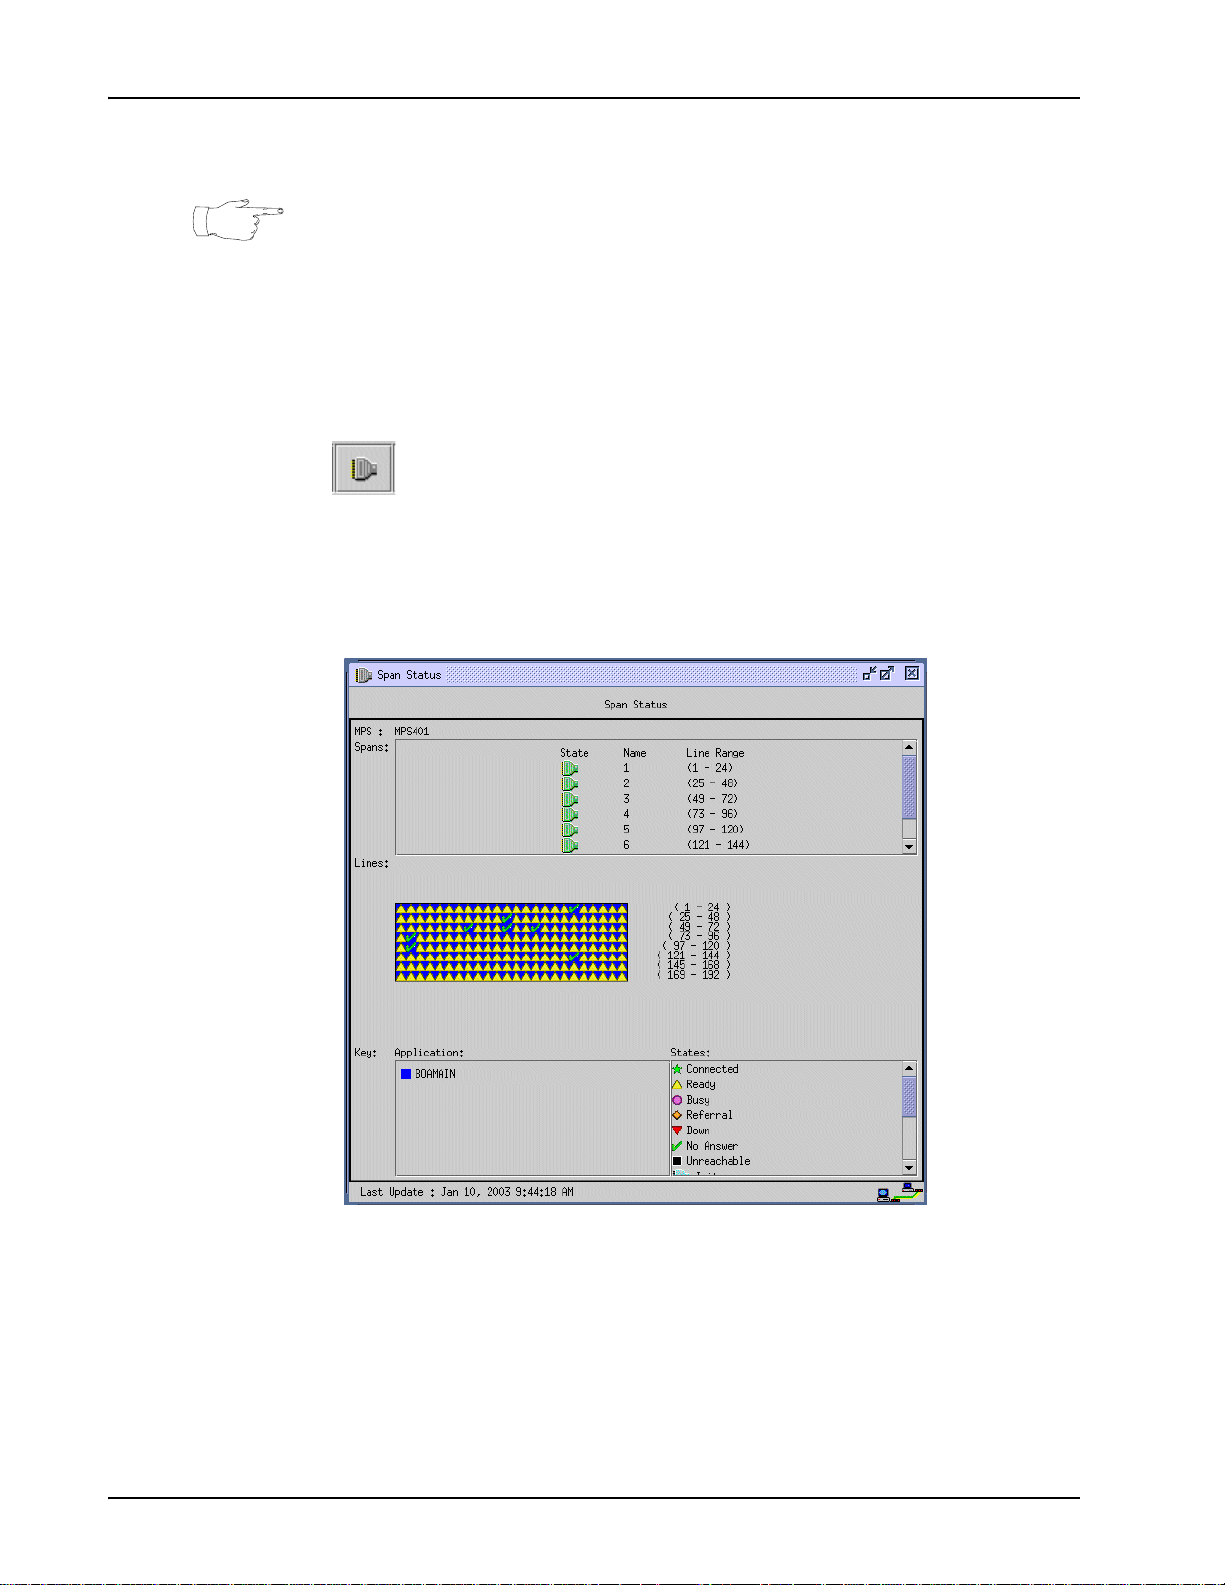
Media Processing Server System Operator’s Guide
opens for each selected.
The information applies to digital phone lines only and is available for Media
Processing Servers with either all digital lines, or a combination of digital and analog
lines. However, the information does not apply to the analog phone lines.
To launch the Span Status tool:
Launch the Span Status tool. Select a component from the PeriView navigation
pane, then select the Span Status tool.
Use the Span Status tool to display the state of digital spans (physical phone lines),
graphically, on a per component basis. Span Status is available for each component
defined for the domain. This is a display tool only.
Span status is updated, by default, at 15 second intervals. This interval is specified by
the PeriV iew Data Provider software.
Span status displays only for (digital) physical phone (call processing) lines, which are
capable of processing calls. Span status does not display for logical (administrative)
phone lines, which are unable to process calls and to which administrative
applications are, typically, assigned. Therefore, administrative applications are not
Page 64 # P0602484 Ver: 2.7
Page 65

Status Monitoring
listed in the Applications scrolling window, unless they are assigned to physical lines,
which are digital.
The Span Status displays the component name and state; the name of the spans (A, B,
C, etc.) and their states; and the phone lines and applications that are associated with
each span.
Span dividers are lines that identify the boundaries between individual spans in the
Lines display area. When you position the cursor over a line, the phone line number
displays under the Lines display area.
The date and time of the last update of information to this window displays in the
lower left corner of the Component Span Status window.
The Component Span Status tool displays the following information.
• Component:
The node name and component number of the component used to launch the
Component Span Status tool displays in the format nodename:comp_number.
In this example, is9501:101 (MPS 101 on node is9501) was used to
launch the tool. The current state of the component (Up, Down, Unreachable) is
identified by the color coded symbols defined in Key area of the window, labeled
States.
When you launch Component Spans status with a component configured only
with analog phone lines, the Span Status window indicates some information
about the component. However, the message in the Spans display area indicates
that no spans have been detected. In the following illustration, the Span S tatus tool
was launched with an analog MPS (is7501:1).
• Spans:
Span information indicates the span state, span name, and phone line range
associated with the span. The current state of the span (Red Alarm, Purple Alarm,
Blue Alarm, Yellow Alarm, Unreac hable, Up, Disabled, Unknown) is identified
by the color coded symbols defined in Key area of the window, labeled States.
•Lines:
The Lines display area identifies information about the spans that are associated
with phone lines. Span dividers are the black lines that define the boundaries
between the individual spans. When the cursor is over an line, the line number
displays under the Lines display area.
The current phone line state is indicated by the color coded symbols defined in
Key area of the window and labeled States.
# P0602484 Ver: 2.7 Page 65
Page 66
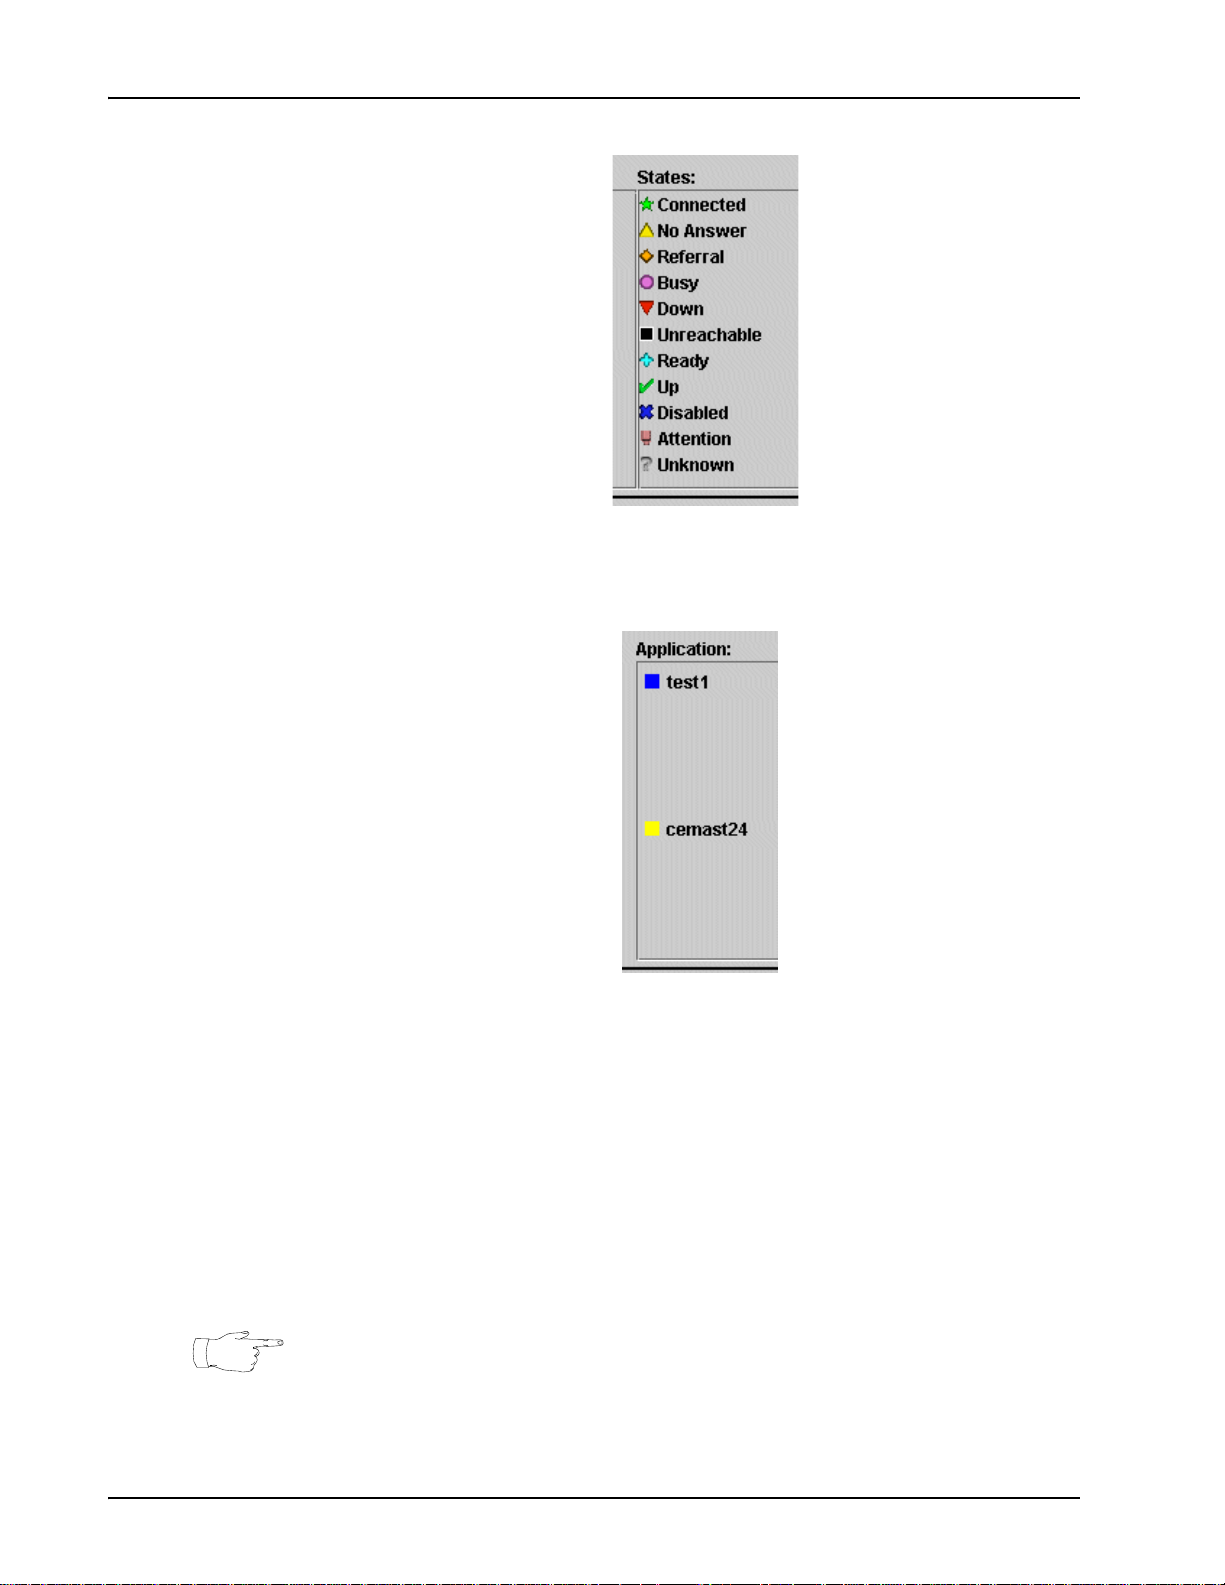
Media Processing Server System Operator’s Guide
The applications associated with a line (if any) are also identified by color coded
symbols defined in the Key area of the window, labeled Applications.
•Key:
The Key display area is used to associate the color coded symbols for
Applications and States with the Span Status display.
• Applications:
The Applications display scrolling window identifies all applications (if any)
that have been assigned to the component. Each application is associated with
a specific color. Each line to which an application is assigned displays with a
colored background, which matches one of the application colors displayed in
the Applications scrolling window . The application names and the phone lines
to which they are assigned can be identified by matching the color sets.
Because span status displays only for (digital) physical phone lines,
administrative applications are not listed in the Applications scrolling
window, unless they are assigned to (digital) physical lines.
Page 66 # P0602484 Ver: 2.7
Page 67

Status Monitoring
• States:
The States display scrolling window identifies the range of possible
component, Span, and Phone Line states. These symbols are used to indicate
the current state of the component, each span, and each of the digital, physical
phone lines associated with the spans in the Lines display area. Phone Line,
Span, and component states are defined in the following table.
Table 2:
Component Span Status States Sheet 1 of 2
Symbol State Applies To Description
Connected Phone Line Phone line state in which interaction is
detected between the MPS’s phone lines
and callers, indicating that calls are in
process on these lines.
No Answer Phone Line The line is Idle and the state is set to no
answer.
Referral Phone Line Detected activity is dependent upon the
type of referral method that has been
instituted (hook flash or digital).
Busy Phone Line Phone line state in which the MPS’s
phone lines are in an in-service-busy
state and not able to take calls.
Down MPS
Phone Line
Unreachable Span
MPS
Phone Line
Ready Phone Line Phone line state in which the MPS’s
One or more component-specific
processes have either been interrupted
or are not yet fully operational.
Phone line state in which the MPS’s or
MPS’s phone lines are not able to
receive calls.
The state of the span is unknown
because the span is unreachable.
The state of the MPS is unknown. No
information is available. Once information
is available, the state of the MPS is either
Down or Up.
Phone line state in which the MPS
cannot be contacted therefore, phone
line state cannot be determined.
phone lines are in service and ready to
take calls.
# P0602484 Ver: 2.7 Page 67
Page 68

Media Processing Server System Operator’s Guide
Component Span Status States Sheet 2 of 2
Symbol State Applies To Description
Table 2:
Up Span
MPS
Disabled Span The span has been intentionally disabled
Yellow Alarm Span The span is in a yellow alarm state. The
Red Alarm Span The span is in a red alarm state, which
The Span is in service.
All MPS-specific processes are fully
operational.
from the MPS.
span is receiving a yellow alarm from the
remote end.
This indicates that the far end is not able
to receive your signal but you are
receiving a signal from the remote end.
The span requires attention.
indicates that the span is out of sync.
A red alarm indicates the span has lost
the ability to synchronize with the remote
equipment. The span has, effectively,
lost the incoming signal.
The span requires attention.
Blue Alarm Span The span is in a blue alarm state. The
span is receiving a blue alarm from the
remote end. This means you are
receiving a pattern of all ones.
Typically, a blue alarm indicates that the
remote end is in a maintenance mode.
Purple Alarm Span The span is in a purple alarm state. The
span is receiving a purple alarm from the
remote end. This means you are
receiving a pattern of all ones on channel
16).
Typically, a purple alarm indicates that
the remote end is in a maintenance
mode.
Unknown Span The state of the span is unrecognized. It
does not comply with the definition of any
other State listed in this scrolling window.
Page 68 # P0602484 Ver: 2.7
Page 69

Status Monitoring
CCM Status
The Call Control Manager (CCM) is the primary interface between applications and
VOS services and is the gateway for communication with the telephony hardware. A
status report for the system, a line, or a range of lines on a Media Processing Server
VSH command line can be obtained using the following commands:
Command syntax Report
ccm status
ccm st
ccm {phone:<line#>} status
c<line#> st
ccm {phone:<line#-line#>} status
c<line#-line#> st
Overall CCM status for the system, including
process startup, work thread statuses, and
the state of each line CCM knows about.
CCM status for the specified line, including
line states, CCM related configuration
parameters, and queue sizes.
Replicates CCM line status reports as above
for each of the specified range of lines
These commands can be entered in the Media Processing Server shell using the VSH
Command Line. For information about using the VSH Command Line, see the
PeriView Reference Manual.
The version of CCM that is running on the system can be obtained by entering the
command ccm version in a Media Processing Server VSH command line.
Application Status
Use the APPMAN (Application Management) Status tool to check the status of any
application assigned to a Media Processing Server. For information about working
with applications, see Voice Processing Applications on page 84..
How to ... Check the Status of Applications
From the Command Line
The status of applications is obtained by entering the command vmm appstatus
at a VSH command line.
Using PeriView
1. Launch the Application Management Tool.
# P0602484 Ver: 2.7 Page 69
Page 70
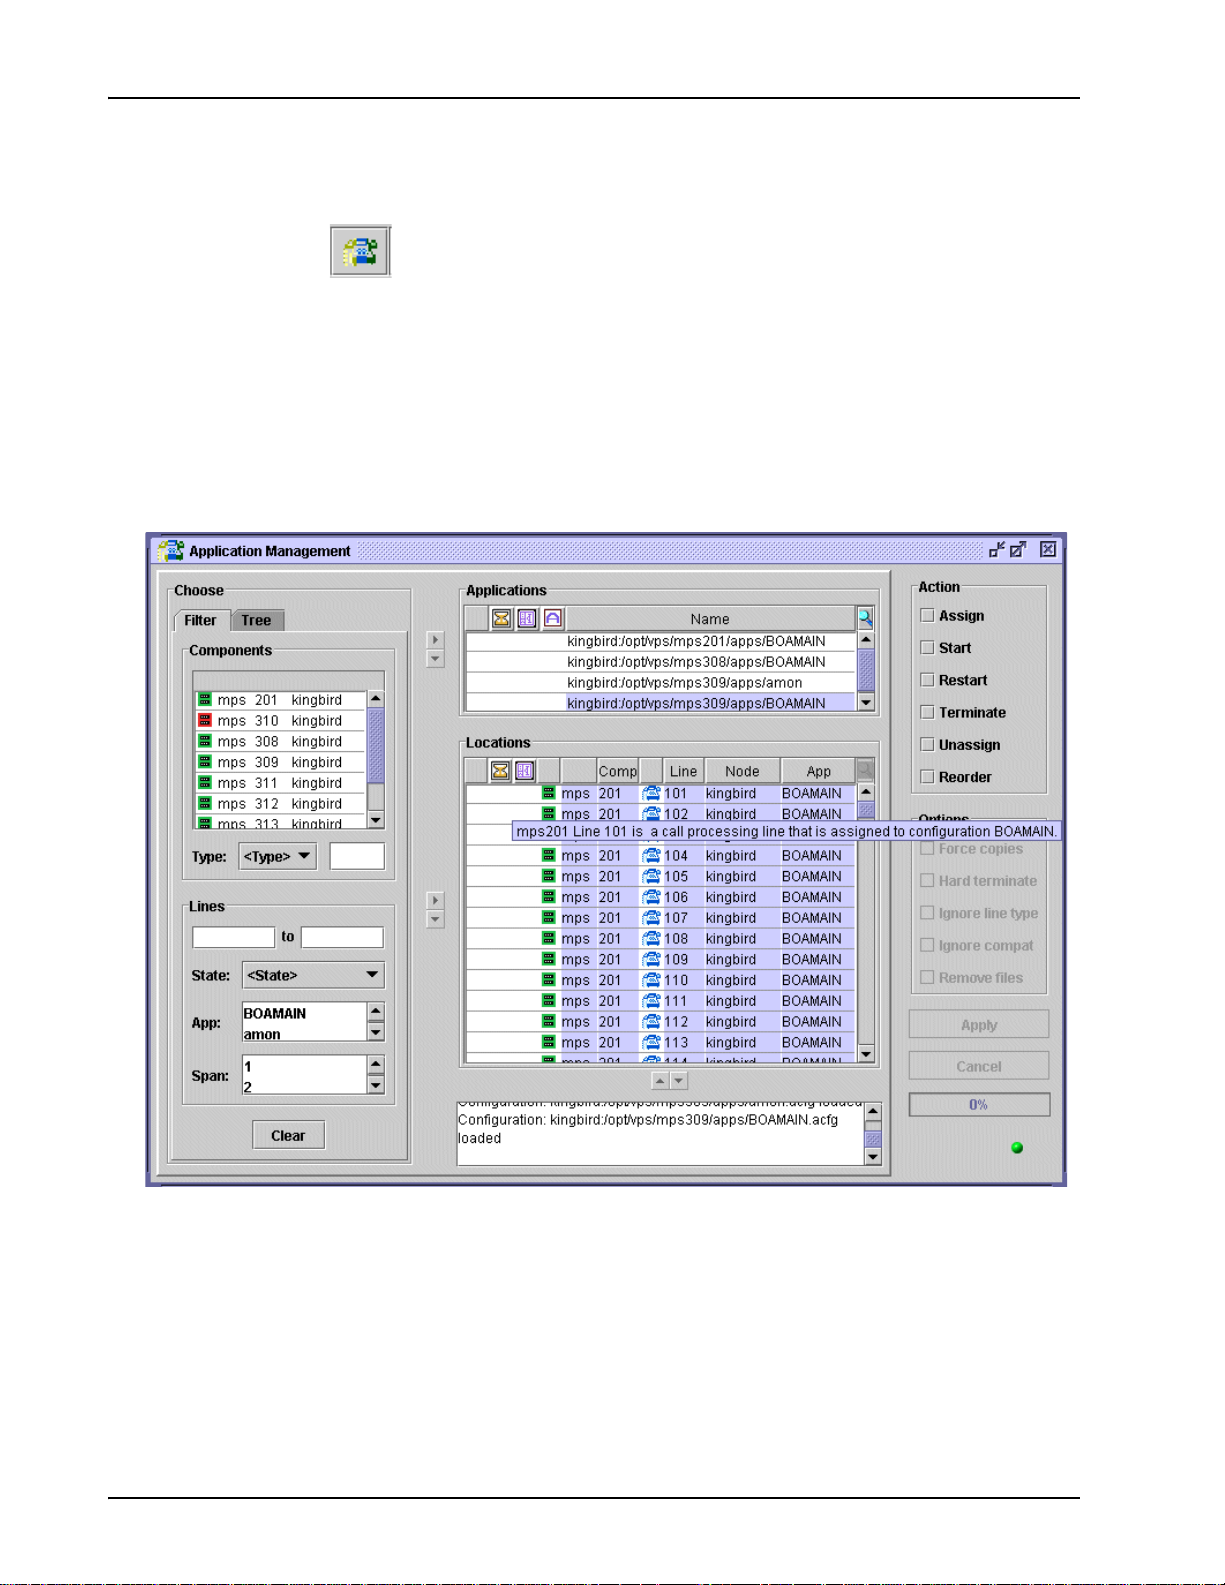
Media Processing Server System Operator’s Guide
Select a component from the PeriView navigation pane, then select the Application
Management tool.
Icons displayed in the Applications and Locations scrolling windows are cues to
application, phone line, and component information. These icons symbolize:
administrative applications that are configured to execute completely before other
applications are started; linked applications; applications configured not to start at
reboot; coded components; and, coded call processing and administrative phone lines.
The color of component and application icons indicate their state.
The shape of phone line icons indicates phone line type. The color of phone line icons
indicate the state of the application. This information is summarized in the following
tables.
Page 70 # P0602484 Ver: 2.7
Page 71

Status Monitoring
Table 3:
Shape Description
Call Processing (Physical) Line; capable of processing calls.
Call processing applications are assigned to these lines.
Administrative (Logical) Line; incapable of processing calls.
Administrative applications are assigned to these lines.
Table 4:
Color Description
Green An application is assigned to a phone line and is in the process of executing
(running).
Blue An application was assigned to a phone line but it is not currently executing
(not running). The application:
• was assigned but not started,
• has completed its execution cycle, or
• has terminated but has not been un-assigned from the phone line.
Yellow The phone line has been selected, but no application has been assigned to
the phone line.
The Locations window lists all configuration options for the lines associated with the
selected component(s). Placing the cursor over a particular location, indicates the
status of the parameters for the application. In addition, the following icons may
appear to indicate configuration selections.
Table 5:
Shape Description
Administration applications that are configured to Wait for Exit display with
an initialization icon. Wait for Exit is an Execution option that is configured by
the Configure Application tool.
Applications that are configured not to restart during reboot display with a
blue (no restart) application icon. Start on Reboot is an Execution option
configured by the Configure Application tool.
See the PeriView Reference Manual for specific details regarding the Application
Management and Application Configuration tools.
VMM Status
The Voice Memory Manager (VMM) is a process that resides in the VOS
subcomponent of the Media Processing Server component and provides media
# P0602484 Ver: 2.7 Page 71
Page 72

Media Processing Server System Operator’s Guide
management services for the VOS. The VMM status report indicates initialization and
connection states and static and dynamic thread configurations, if any. This report can
be obtained from a VSH command line with the following command:
Command syntax Report
vmm status or vmm st Overall VMM status for the system
The version of VMM running on the system can be obtained by entering the command
vmm version at a VSH command line.
MultiMedia Format (MMF) File Status
The Media Processing Server uses MMF files to store audio elements and fax data.
The audio elements can be:
• Vocabularies (i.e., spoken prompts in applications)
• Items recorded by an application (i.e., the Caller Message Recording [CMR]
feature - see Caller Message Recording on page 117.)
How to ... Check the Status of Audio Elements
From the Command Line
Enter the following commands in a Media Processing Server VSH Command Line to
display a variety of status reports for MMF files.
Command syntax Report
vmm mmfstatus Status of all activated (loaded) MMF files,
including the system-wide record file
vmm refstatus <mmf_file> Element play statistics for <mmf_file>,
including outstanding play/record requests
The PeriView Reference Manual contains details about using the VSH Command
Line.
Using PeriView
1. Launch the MPS Control Center Tool.
Page 72 # P0602484 Ver: 2.7
Page 73
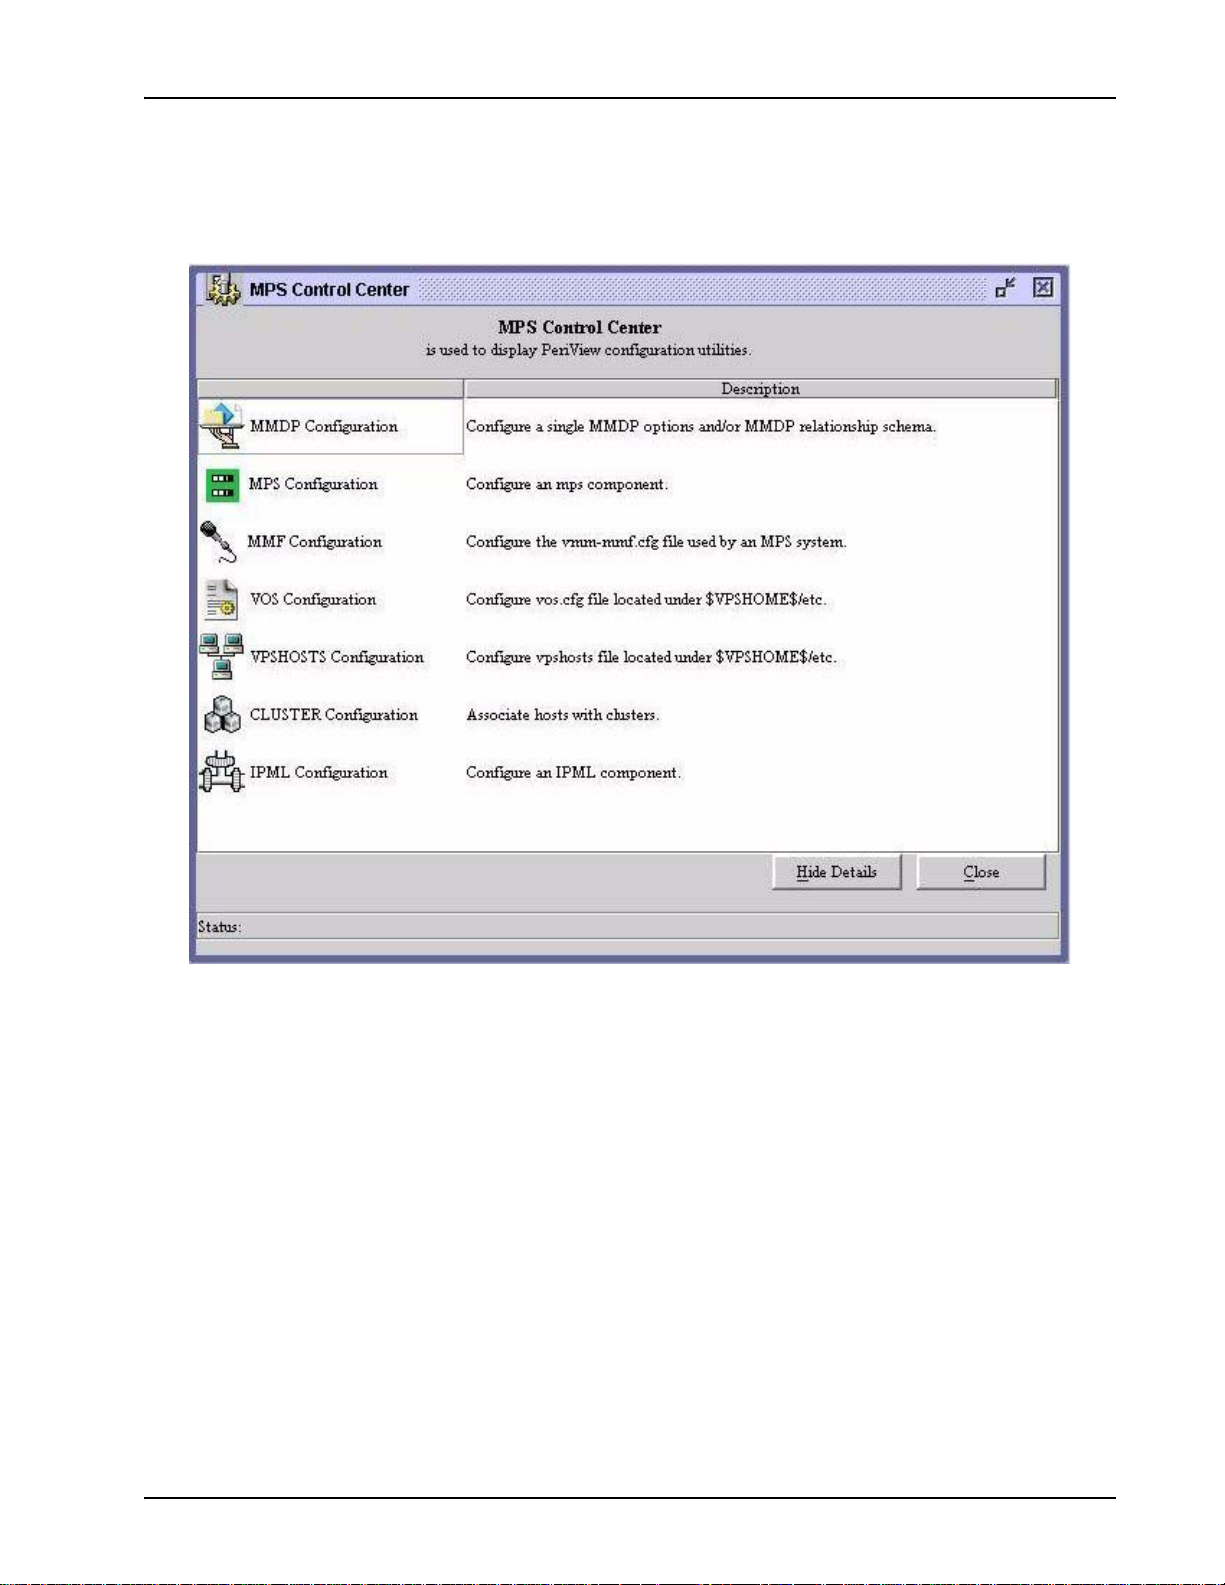
Status Monitoring
2. Select the MMF Configuration Tool. Double <L
EFT> click on
MMF Configuration and select the desired Node and Component to
view the MMF status.
The status of the MMFs are displayed. For more information about the MMF
Configuration tool, see the PeriView Reference Manual.
# P0602484 Ver: 2.7 Page 73
Page 74

Media Processing Server System Operator’s Guide
Host Status
The Host Status tool can be used to display the state of any communication link to a
host. Information about the state of phone lines configured to use a host’s Virtual
Terminals, as well as the terminals themselves is also available.
How to ... Monitor Host Status
Using PeriView
1. Select a Component. Select a component from the PeriView naviga-
tion pane.
2. Select the Host Status tool.
The state of the hosts, as well as their (numerical) “name” and protocol being used,
can be determined in the Hosts: field of the tool. State is a representation of a
PeriV iew tool attempting to contact some Media Processing Server Series process: the
Host Status Tool attempts to contact the commgr (Communications Manager)
Page 74 # P0602484 Ver: 2.7
Page 75

process.
Status Monitoring
# P0602484 Ver: 2.7 Page 75
Page 76

Media Processing Server System Operator’s Guide
Host states can be one of the following as indicated by a colored icon, shown in the
table below and which appears in the State field shown above. VT states are also
indicated by a colored icon: in this case they are shown in the VTs: field when the
Host Status tool Index By: selection is set to VT.
Table 6:
Component Host Status States
Symbol State
Up Host
Down Host
Unreachable Host
Applies
To
VT
VT
VT
Description
Media Processing Server Series protocol
software has determined that the remote host is
available for communication.
Media Processing Server Series protocol
software has determined that a given VT can be
used to establish a session with the remote host.
Media Processing Server Series protocol
software has determined that the remote host is
not available for communication.
Media Processing Server Series protocol
software has determined that a given VT can not
be used to establish a session with th e re mot e
host.
The state of the host is not known, as it is
unreachable.
The state of the VT is not known, as it is
unreachable.
Unassigned VTVT The phone li ne is not currently associated with a
VT. However, at some other point in time it can
be associated with a VT as a result of pooling.
For information about pooling VT s, see the Media
Processing Server Series COMMGR Reference
Manual.
Unknown Host
VT
The state of the host is unrecognized. It does not
comply with the definition of any other state listed
in this scrolling window.
The state of the VT is unrecognized. It does not
comply with the definition of any other state listed
in this scrolling window.
Page 76 # P0602484 Ver: 2.7
Page 77

Status Monitoring
# P0602484 Ver: 2.7 Page 77
Page 78

Media Processing Server System Operator’s Guide
System Statistics Reports
The Media Processing Server automatically gathers system statistics for monitoring
activity on a single MPS or across the entire MPS network.
Use PeriReporter Tools to display system statistics reports (see Generate System
Statistics Reports on page 78.)
PeriReporter Tools run on a single node within a network, but can collect and report
statistics network-wide.
How to ... Generate System Statistics Reports
Statistics reports can be generated and viewed on demand. This report can
also be printed as a hard copy or printed to a file.
To generate the report:
1. Launch PeriReporter. Select PeriReporter from the Start menu on a
Windows 2000 platform or by entering PeriReporter on a UNIX
or Windows 2000 command line.
Page 78 # P0602484 Ver: 2.7
Page 79

Status Monitoring
2. From the PeriReporter window, open a file. Use the File Open
icon or the menu path File—Open Report (use the Report Defini-
tion... option to select predefined reports). The Report Definition
window displays.
3. From the Report Definition window, select the desired report.
This can be one of the seven predefined system reports or a report that
has been defined and saved by someone else. Click OK.
# P0602484 Ver: 2.7 Page 79
Page 80

Media Processing Server System Operator’s Guide
Report (File) Name Definition
PhoneDetail.prd Detail Phone Line Statistics Report. Phone line usage is
reported for selected or all Media Processing Servers and
phone lines, for a specified date range. Totals reflect usage
per individual Media Processing Server.
PhoneSum.prd Summary Phone Line Statistics Report. Data is collectively
summarized for selected or all phone lines, then reported for
selected or all Media Processing Servers, for a specified date
range. Data for each Media Processing Server is summarized
on a single line. Totals reflect usage inclusive of all Media
Processing Servers.
PhoneAcc.prd Accumulated Summary Phone Line Statistics Report. Data is
summarized collectively for the time period specified by the
user for selected or all phone lines, then reported for selected
or all Media Processing Servers for the specified date–time
range.
SpanDetail.prd Detail Span Statistics Report. Data is reported for each span
on selected or all Media Processing Servers, for a specified
range.
SpanSum.prd Summary Span Statistics Report. Data is collectively
summarized for all spans, for selected or all Media Processing
Servers, then reported for a specified date range. Data for
each Media Processing Server is summarized on a single
line. Totals reflect span activity inclusive of all Media
Processing Servers.
HostDetail.prd Detail System Statistics Report. Data is reported for selected
or all Media Processing Servers and external hosts for a
specified date range.
HostSum.prd Summary System Statistics Report. Data is cumulatively
summarized for each external host for selected or all Media
Processing Servers, then reported for a specified date range.
Data for each Media Processing Server is summarized on a
single line. Totals reflect system activity inclusive of all Media
Processing Servers.
4. Set the scope of the report. Use the Report Scope icon or the menu
path Setup—Report Scope... . Enter the requirements in the
Report Scope window.
Page 80 # P0602484 Ver: 2.7
Page 81
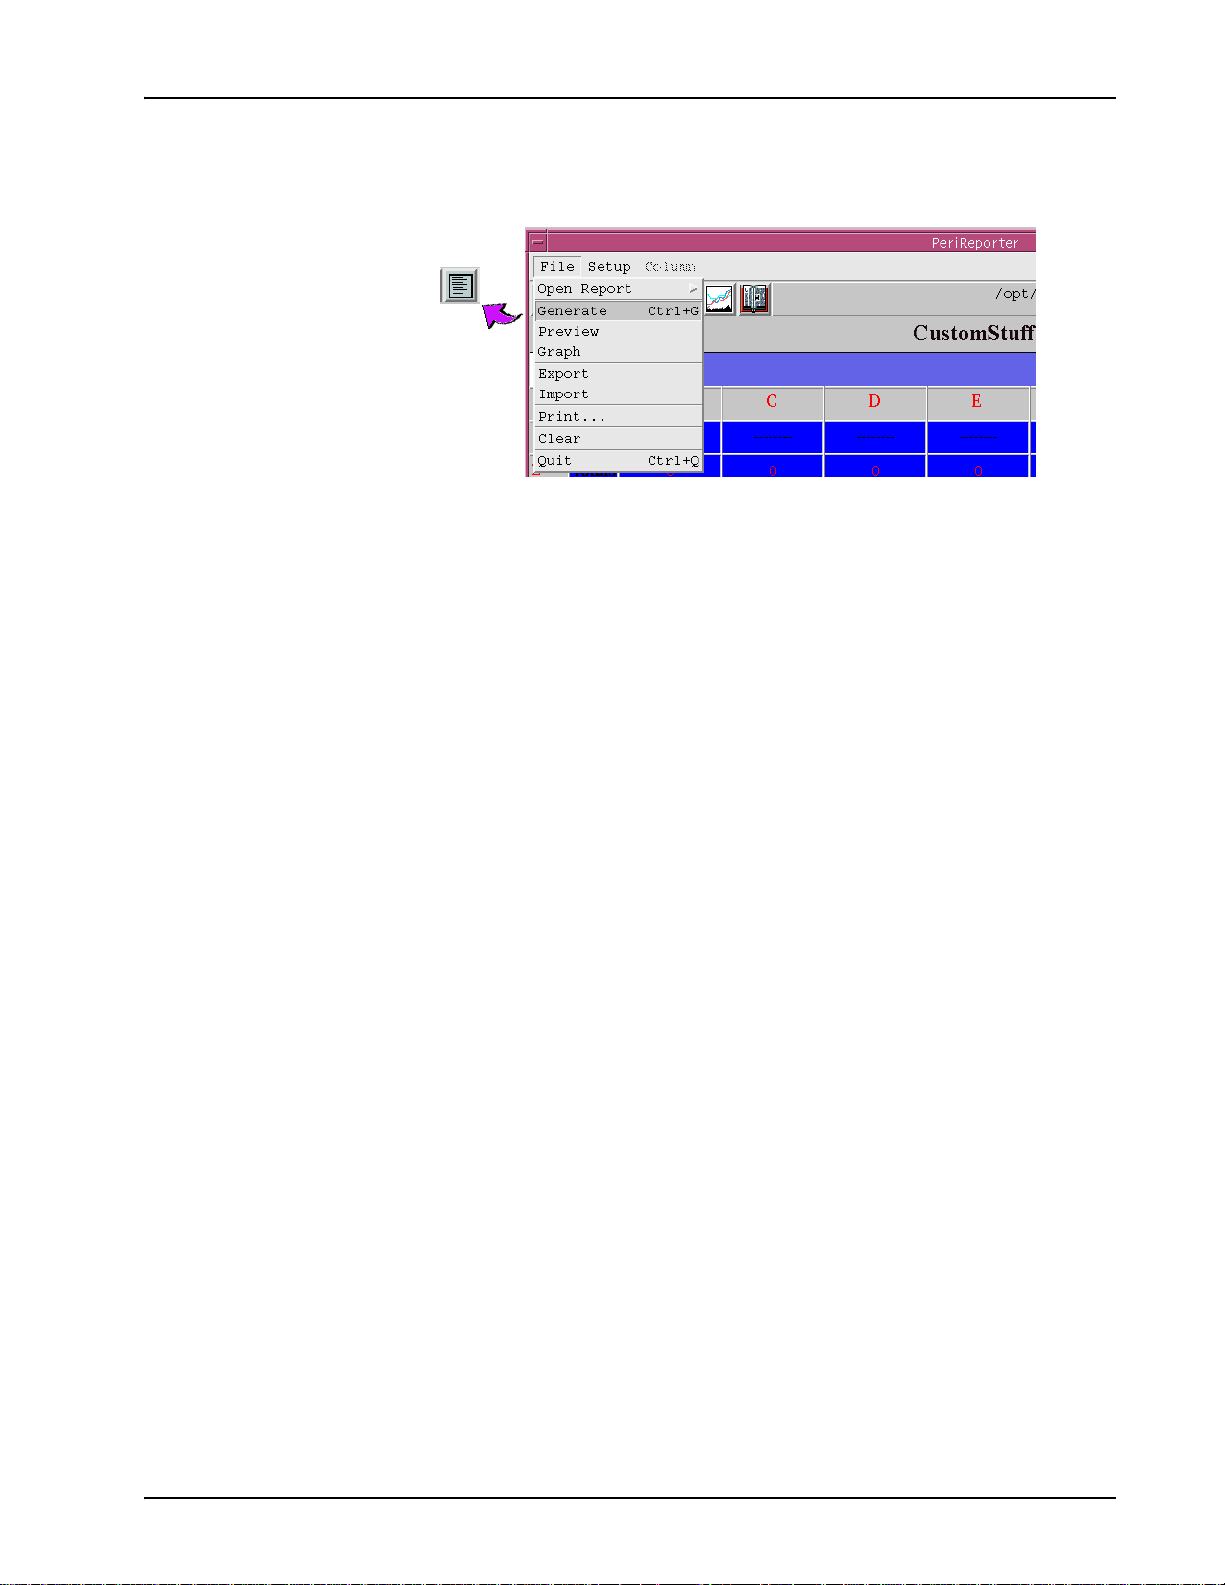
Status Monitoring
5. Generate the report. Use the Generate icon or the menu path File—
Generate.
# P0602484 Ver: 2.7 Page 81
Page 82

Media Processing Server System Operator’s Guide
This page has been intentionally left blank.
Page 82 # P0602484 Ver: 2.7
Page 83

Voice Processing
Applications
This chapter covers:
1. Application Memory
Requirements
2. Activating Playback MMF
Files
3. Assigning and Starting
Application Programs
4. Terminating and
Unassigning Application
Programs
5. Deactivating MMF Files
6. Updating or Replacing
Page 84

Media Processing Server System Operator’s Guide
Voice Processing Applications
This chapter provides the information needed to:
• Start and stop applications
• Work with vocabularies
• Set up Caller Message Recording (CMR)
Although most interaction with the system is through GUI tools like PeriV iew or MPS
Developer, a command line is needed to issue some commands and to perform
system-related application maintenance. This section also describes these operations.
For specifics concerning interaction with the system as a whole, see Command Line
Interaction on page 47.
For information on monitoring application and MultiMedia Format (MMF) file status,
see Status Monitoring on page 56.
Page 84 # P0602484 Ver: 2.7
Page 85

Application Memory Requirements
An important consideration to make before assigning and running applications is their
impact on overall system performance. One of the greater aspects of this impact is the
amount of memory an application requires during its execution. The following
formula accurately calculates an application’s memory requirements.
This formula only addresses application overhead and does not include other system
components or custom features that are part of the native operating system (OS)
software.
The total memory requirements to run N instances of an application, which uses
Indexed Sequential Access Method (ISAM) databases (ISAM significantly reduces
memory requirements), is calculated as follows:
(150K + WS) * N + (APP)
Voice Processing Applications
where WS is the total length in Kbytes of all W
N is the N
APP
If the application does not use ISAM databases, the memory requirements formula
changes as follows:
(200K + WS) * N + (APP) + 500K
To determine the amount of memory needed for an application’s Working Storage
(WS), use the following vexdump command:
vexdump -v appname | grep Values
umber of phone lines running the application, and APP is the size of the
lication .vex file in Kbytes.
orking Storage items in the application,
# P0602484 Ver: 2.7 Page 85
Page 86

Media Processing Server System Operator’s Guide
Additional Memory Considerations
If an application uses Shared Memory, the above memory requirements increase by
150K + total length of all shared memory items.
If an application uses Hashed Sequential Access Method (HSAM) databases, the
actual file size in bytes of each HSAM file must be added to the total size of the .vex
file. Adding memory to HSAM applications improves overall performance.
If an application executes the LINK command, the total length of all linked-to .vex
files which can be in memory simultaneously, must be added to the total size of the
.vex file.
Example:
An application with a 300K .vex file, running on 48 lines, not using ISAM and
linking to two different 100K size applications, with a total of 20K working storage
requires:
(200 + 20) * 48 + (300 + 100 + 100) + 500 = 12M
Use this worksheet as a guide to computing application memory requirements:
(If ISAM) (If HSAM) (If no ISAM)
150K
(
~~~~+WS)
200K
(If no ISAM) (If LINK)
* #_of_lines_running_app + (.vex_file_size
+ @ HSAM_files’_size
~~~~
+ @ linked-to_files’_size
) + 500K
Page 86 # P0602484 Ver: 2.7
Page 87

Activating Playback MMF Files
A playback MMF file can be activated either for a particular application or for all
applications in the system. Normally, commands in the VMM-MMF configuration
file ($MPSHOME/mpsN/etc/vmm-mmf.cfg) activate the MMF files when the
system boots. MMF files can also be activated from the MPS command shell. This is
useful for testing new applications and configurations. MMF files activated from a
command shell are not reactivated if the system is restarted.
See the Media Processing Server Series System Reference Manual for configuration
details and an explanation of MMF files and hash tables.
There are two methods for activating MMF files:
• For backward compatibility, the activation of MMF files during system
initialization is done by processing the vmm-mmf.cfg configuration file and
activating each listed MMF file in the specified manner (record, system-wide,
application-specific, etc). This activation method has several drawbacks.
When running with a secondary node backing up se veral non-homogeneous
nodes, VMM has to activate the same MMF files that were active on the
primary system. Keeping these files up to date on the secondary node is
difficult due to the fact that, the files can be located anywhere on the primary
system. Another drawback is that anytime a new MMF file is added, a
configuration file must be modified to ensure that on restart the MMF will be
loaded.
Voice Processing Applications
• The newer method is introduced in MPS software release 2.1. It requires all
MMF files to be in the $MEDIAFILEHOME directory (or one of its
subdirectories—see the diagram on the next page). Upon initialization, VMM
activates all MMF files in the $MEDIAFILEHOME/mpsN directory. Each
mpsN directory contains a system subdirectory, which stores the MMF files
to be activated system-wide. There is also a subdirectory for each application
for application-specific MMF files. Both the system and application
directories have two subdirectories named record and default. The
record subdirectory stores the MMF file into which data is recorded by
default. (This should be the only file in that subdirectory.) The default
subdirectory contains the default MMF (for playing) if one is needed. This
eliminates the need for the vmm-mmf.cfg configuration file and provides a
well-defined location from which a secondary node can periodically update
its MMF files. To ensure backward compatibility , VMM still attempts to
process the vmm-mmf.cfg file after activating any files in
$MEDIAFILEHOME. The processing of the vmm-mmf.cfg file is not
supported for systems with secondary nodes.
The Nx1 redundancy configuration does not support the use of vmm-mmf.cfg.
# P0602484 Ver: 2.7 Page 87
Page 88

Media Processing Server System Operator’s Guide
$MEDIAFILEHOME
system AppName1 AppName2 AppNameN
record default record defaultrecord defaultrecord default
VMM loads all files in $MEDIAFILEHOME/mpsN/ and its subdirectories. In the
case that there is more than one file in the record/default directory, the last file
activated in the directory will be designated as the default record/play MMF. After
activating all files, VMM attempts to process the vmm-mmf.cfg file (if one is
present). VMM is informed about which MPS it is running on by TRIP, so that when a
secondary node is taking over for a primary, the correct file is loaded.
mpsN
When adding a new file inside of $MEDIAFILEHOME, the file does not become
active until the system is restarted. Use the vmm mmfload command to activate the
file immediately without restarting.
System Wide Playback MMF Files
A playback MMF file can be activated such that all applications on the system can
access it.
How to ...Activate System-Wide Playback MultiMedia Files
1. Open a shell on the Media Processing Server that will be running
the applications. see Command Control on page 50..
2. Assign the applications to the desired lines and start them. see
Assigning and Starting Application Programs on page 93.
3. Change location (cd) to the directory where the desir ed MMF file
exists (see Working with Directories on page 122.). Alternatively,
the path to this location can be supplied in the vmm mmfload command shown in the next step.
4. Allow the applications to access the MMF file using the vmm
mmfload command. Use the syntax vmm mmfload
<mmfname>[,system], where <mmfname> is either the name of
the file to be loaded (if in its directory) or the path to the file. Special
permissions or privileges are not needed to use this command. (It is
Page 88 # P0602484 Ver: 2.7
Page 89

Voice Processing Applications
not necessary to specify the “system” parameter as this is the
default.)
# P0602484 Ver: 2.7 Page 89
Page 90

Media Processing Server System Operator’s Guide
Application-Specific Playback MMF Files
An MMF file can be activated such that only a specific application can access it.
Included in this procedure is the creation of a hash table. A hash table is a data
structure which resides in system memory (as opposed to voice data memory). When
the MMF file is activated, VMM enters the names of all vocabulary elements in that
file into a hash table. When an application references an element by name (instead of
referencing the element by index number), VMM uses the hashing scheme to locate
the recorded contents of that element. A hash table can function for the entire system
or just one application.
It takes several steps to activate a playback MMF file for a particular application:
• create the hash table for the application (that is, initialize the application)
• activate the MMF file for the application
• assign the application to phone lines and start it (using APPMAN)
How to ...Activate Application-Specific Playback MultiMedia
Files
1. Place the MMF file in a directory under $MEDIAFILEHOME.
2. Open a shell on the Media Processing Server that will be running
the application. see Command Control on page 50.
3. Create the application-specific hash table using the vmm
appinit <appname> command. See the Media Processing
Server Series System Reference Manual for a detailed description of
hash tables.
a. To have the application look in the application-specific hash table
before the system hash table, use the syntax vmm hashfirst
<appname>,local
b. To have the application look in the system hash table before the
application-specific hash table, use the syntax vmm
hashfirst <appname>,system
System hash tables are used in relation to applications to contain such common
and frequently accessed elements as DTMF tones (dtmf) and numeric elements
(numset), and therefore reduce the size of the application hash table (large tables
can negatively impact system performance).
4. Allow the application to access the MMF file by using the vmm
mmfload command. Use vmm mmfload <mmfname>,<appname> to activate an MMF file in the application-specific hash
table. Use vmm mmfload <mmfname>,system to activate an
MMF file in the system hash table.
When loading an MMF for a specific application, if the application has not already
been initialized, VMM will initialize it using the default setting for hashfirst (which is
Page 90 # P0602484 Ver: 2.7
Page 91

local).
Voice Processing Applications
# P0602484 Ver: 2.7 Page 91
Page 92

Media Processing Server System Operator’s Guide
5. Assign the application to the desired lines and start it. see Assign-
ing and Starting Application Programs on page 93.
The vmm hashfirst command can be used to change the hashfirst
sequence after an MMF file is activated (that is, without deactivating the
MMF file). For example, if the command vmm hashfirst <app-
name>,local was used, the command vmm hashfirst <appname>,system can be used to change the hashfirst sequence. For all
systems, hashfirst commands must be placed in the vmm-mmf.cfg
file.
The following information is for backward compatibility on non Nx1 systems:
The command vmm mmfload <mmfname> loads the specified MMF file
into the system hash table. To load the MMF into an application hash table,
specify the application name in the command vmm mmfload
<mmfname>,<appname>. In a development environment, the application
can be started, and then the command vmm mmfload <mmfname> can be
applied. In a production environment, the mmfload commands should be
placed in the file $MPSHOME/mpsN/etc/vmm-mmf.cfg.
!
Do not place any mmfload commands in the VMM configuration file
$MPSHOME/mpsN/etc/vmm.cfg. Be sure they are placed into the proper file
(VMM-MMF configuration file) as outlined above!
For additional information, see the Media Processing Server Series System Reference
Manual.
Page 92 # P0602484 Ver: 2.7
Page 93

Assigning and Starting Application Programs
T o run an application program, first assign it to a phone line (i.e., bind the application)
and then start the application. In most circumstances, use the APPMAN (Application
Management) tool to assign and start applications. APPMAN allows setting up the
applications and saving the current configuration. If the system shuts down, the
applications return to this configuration.
Applications can be assigned to MPS components. For information about
components, see System Configurations on page 19.
APPMAN automatically creates a default configuration for each application. The
applications run-time environment can be customized using the Application
Configuration tool.
See the PeriView Reference Manual for information about creating and using custom
configurations.
Voice Processing Applications
How to ... Assign and Start Application Programs
1. Launch the Application Management Tool.
2. Select the Application. Either select an existing application (#1 and
#2) from the Tree Choose list or add a new application (#3) to the
Applications window of the APPMAN tool.
# P0602484 Ver: 2.7 Page 93
Page 94

Media Processing Server System Operator’s Guide
2
1
3
3. Select the Location(s). Select individual or multiple node(s) and/or
component(s)
(#4) and add them (#5) to the Locations window.
4. Assign and Start the Application. Select the application (#6), the
location(s) (#7) and the Assign and Start checkboxes (#8). Select the
Apply button.
Page 94 # P0602484 Ver: 2.7
Page 95

Voice Processing Applications
6
5
4
7
8
After the system assigns and starts the application, the phone line icons turn green.
See the PeriView Reference Manual for a complete description of PeriView and the
Application Management tool.
Applications can also be assigned and started from a MPS command sh ell. See the
Command Reference Manual, for a detailed command descriptions.
Start and Restart Line Order
Phone lines are assigned, started, and restarted, in the order listed under Locations in
the Assign/(Re)Start Lines window. This list can be reordered, if necessary, by using
the up and down arrows below the Locations window.
How to ... Reorder Selected Application Locations
1. Select one or more locations in the Locations window. <LEFT>
click to select an entry. <R
to clear all selected entries before selecting individual locations.
IGHT> click the Select—None menu path
# P0602484 Ver: 2.7 Page 95
Page 96
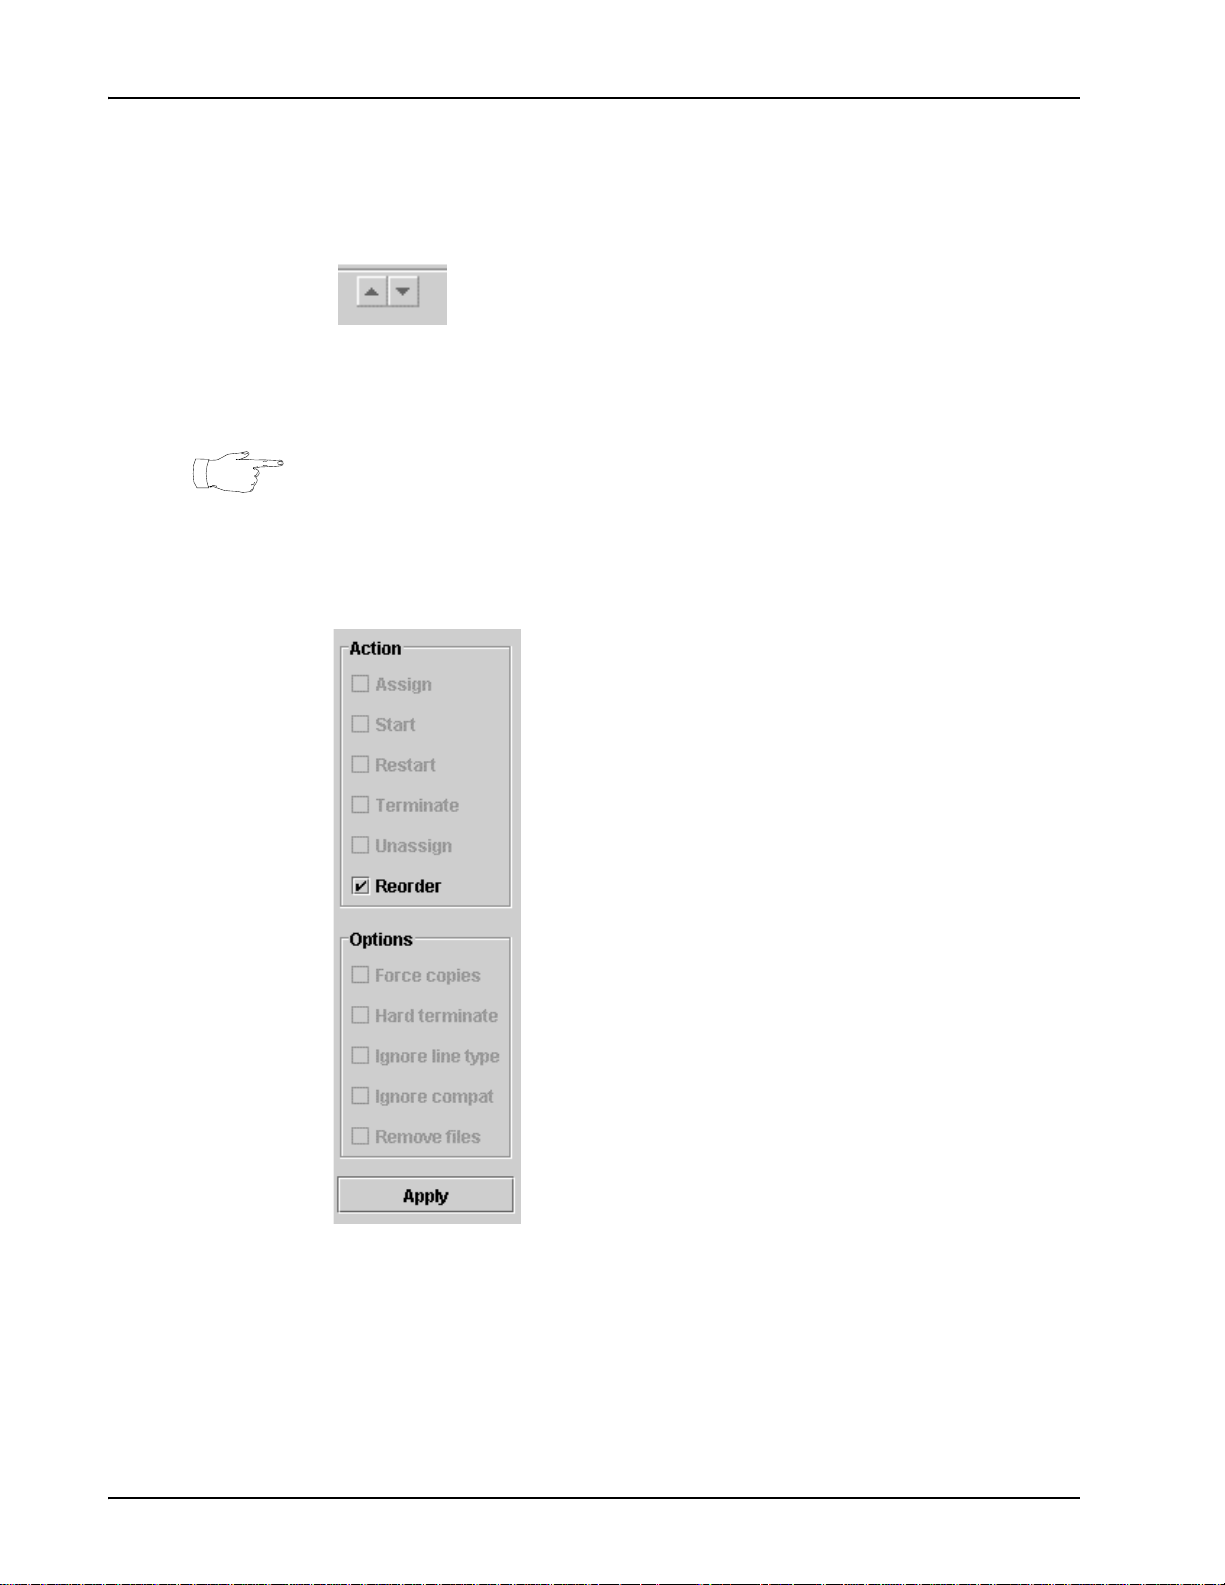
Media Processing Server System Operator’s Guide
2. Use the up and down arrows to reorder selected listings. Items
move one position with each <L
tions move up or down together.
Repeat the previous steps for any items that have to be moved within the
Locations window.
Do not perform step #3 to modify the line start order for the current session only. To
define a default line start order for future system bootups, continue with step #3.
3. Select the Reorder checkbox and click Apply. This applies the
reorder changes for future system bootups.
EFT> mouse click. Multiple selec-
Page 96 # P0602484 Ver: 2.7
Page 97
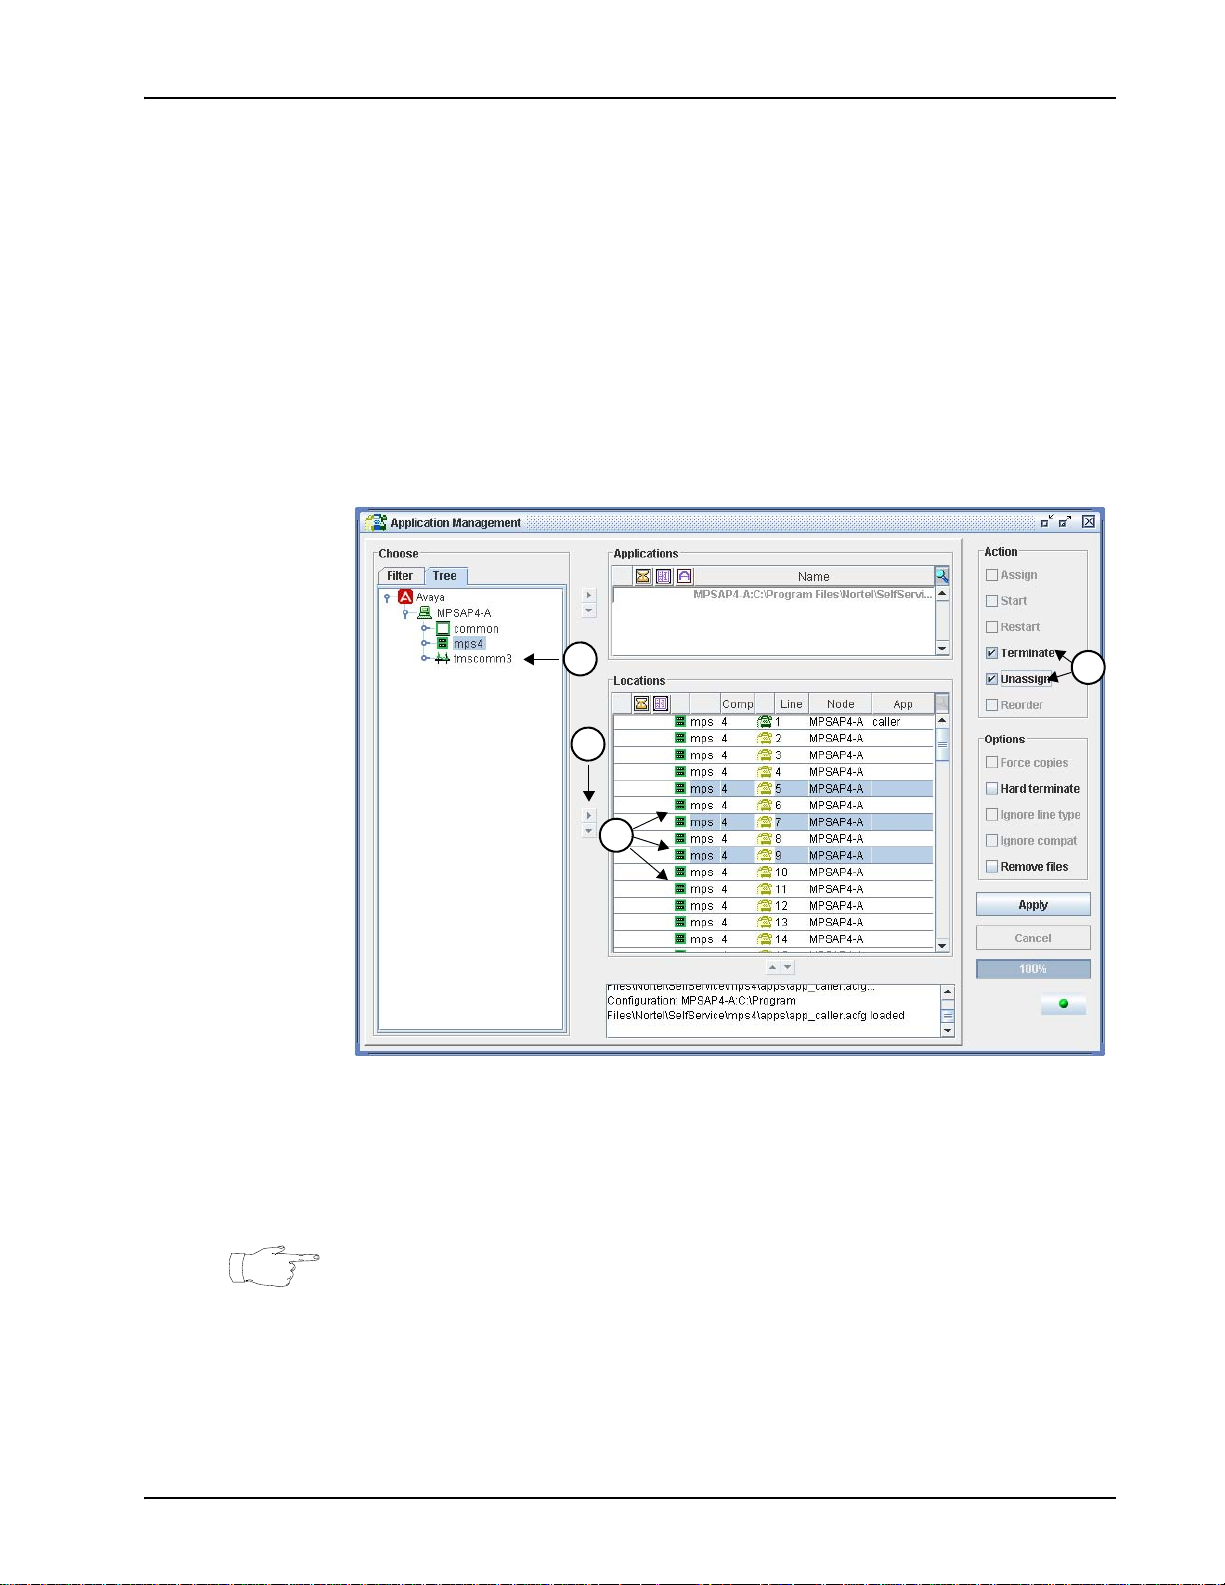
Terminating and Unassigning Application Programs
In most circumstances, use APPMAN to terminate and unassign applications.
However, applications can also be terminated from a Media Processing Server shell.
See tappman in the
Command Reference Manual, for command description.
How to ...Terminate and Unassign Application Programs
1. Launch the Application Management Tool.
2. Select the Location(s). Select individual or multiple node(s) and/or
component(s)
(#1) and add them (#2) to the Locations window.
Voice Processing Applications
1
2
3
4
3. Choose the Lines to Terminate. Select the locations for termination
in the Locations window (#3).
4. Terminate and Unassign. Select the Terminate and Unassign
checkboxes (#4) and click the Apply button.
By default, the Media Processing Server uses a soft termination. A soft termination
waits for callers to hang up before terminating each application.
See the PeriView Reference Manual for a complete description of PeriView, the
Application Management Tool, and Terminating/Un-Assign i ng Lines.
# P0602484 Ver: 2.7 Page 97
Page 98

Media Processing Server System Operator’s Guide
Deactivating MMF Files
When activated, MPS MMF files (both playback and record) take up space in Voice
Data Memory (VDM). Since this space is limited, applications should be deactivated
when they are no longer required. VDM status can be obtained from the VMM Cache
Status Report, which is displayed by entering the command vmm cachestatus
either in an MPS shell or the VSH Command Line.
The vmm repconfig command can be used to display configuration information
for VDM (as well as how much VDM is in the system) however, it does not indicate
usage. The vmm cachestatus command is preferred because it shows how much
VDM is actually in use (as well as other useful information).
If an attempt is made to deactivate a file currently being accessed by one or more
applications, VMM does not deactivate the file immediately. Instead, VMM places the
file in a deactivation queue. If any application tries to make any new references to an
MMF file in the deactivation queue, the reference fails and VMM generates an alarm.
When all prior references to elements in the file have completed, VMM deactivates
the file.
While outstanding references to an MMF file are being satisfied, it is possible to
deactivate another MMF file.
How to ...Deactivate MultiMedia Format Files using the MMF
Configurator Tool
1. Launch the MPS Control Center.
Page 98 # P0602484 Ver: 2.7
Page 99
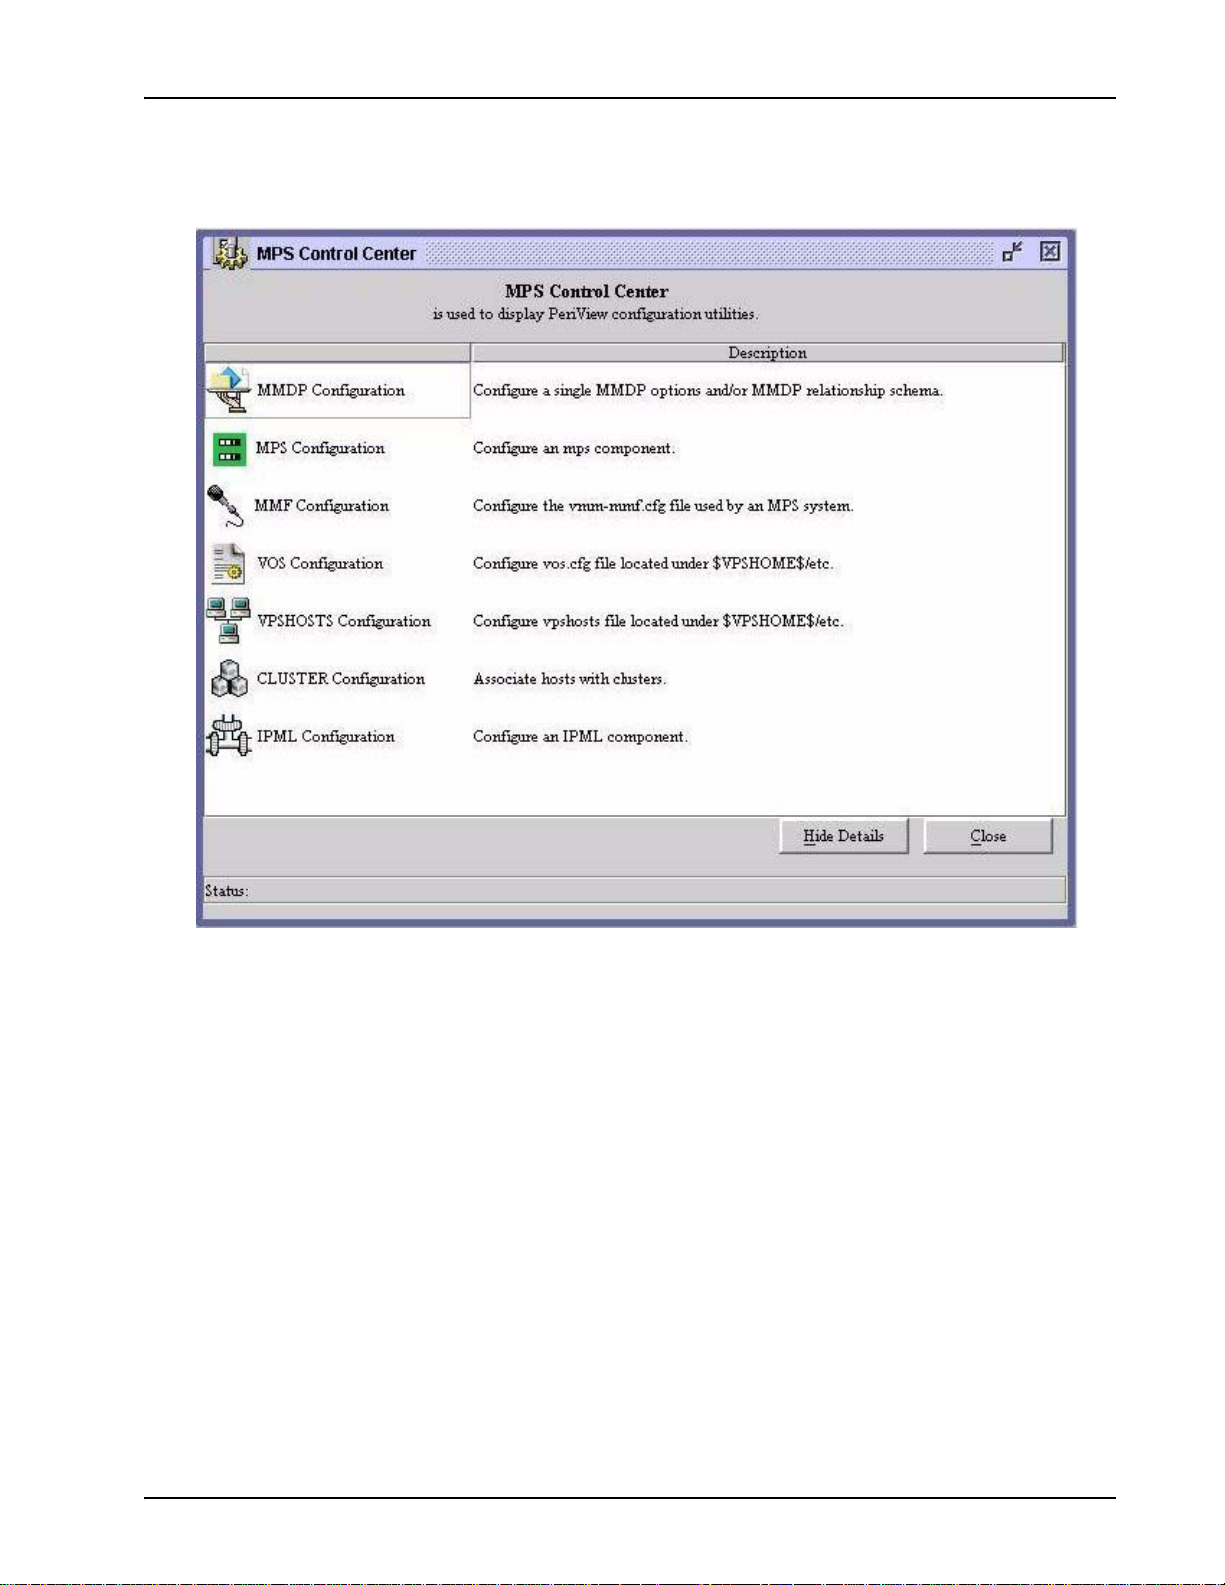
Voice Processing Applications
2. Select the Node and Component. Double <L
Configuration in the MPS Control Center.
EFT> click on MMF
In the Component Selector window, select the Node: and the Component:
containing the MMF file(s) to Unload. Select OK to start the MMF Configurator Tool.
3. Select the MMF file(s) to Unload. Select the file(s) and <L
EFT>
click on Unload MMF(s). To prevent them from loading on startup,
uncheck the box Load At Start.
# P0602484 Ver: 2.7 Page 99
Page 100
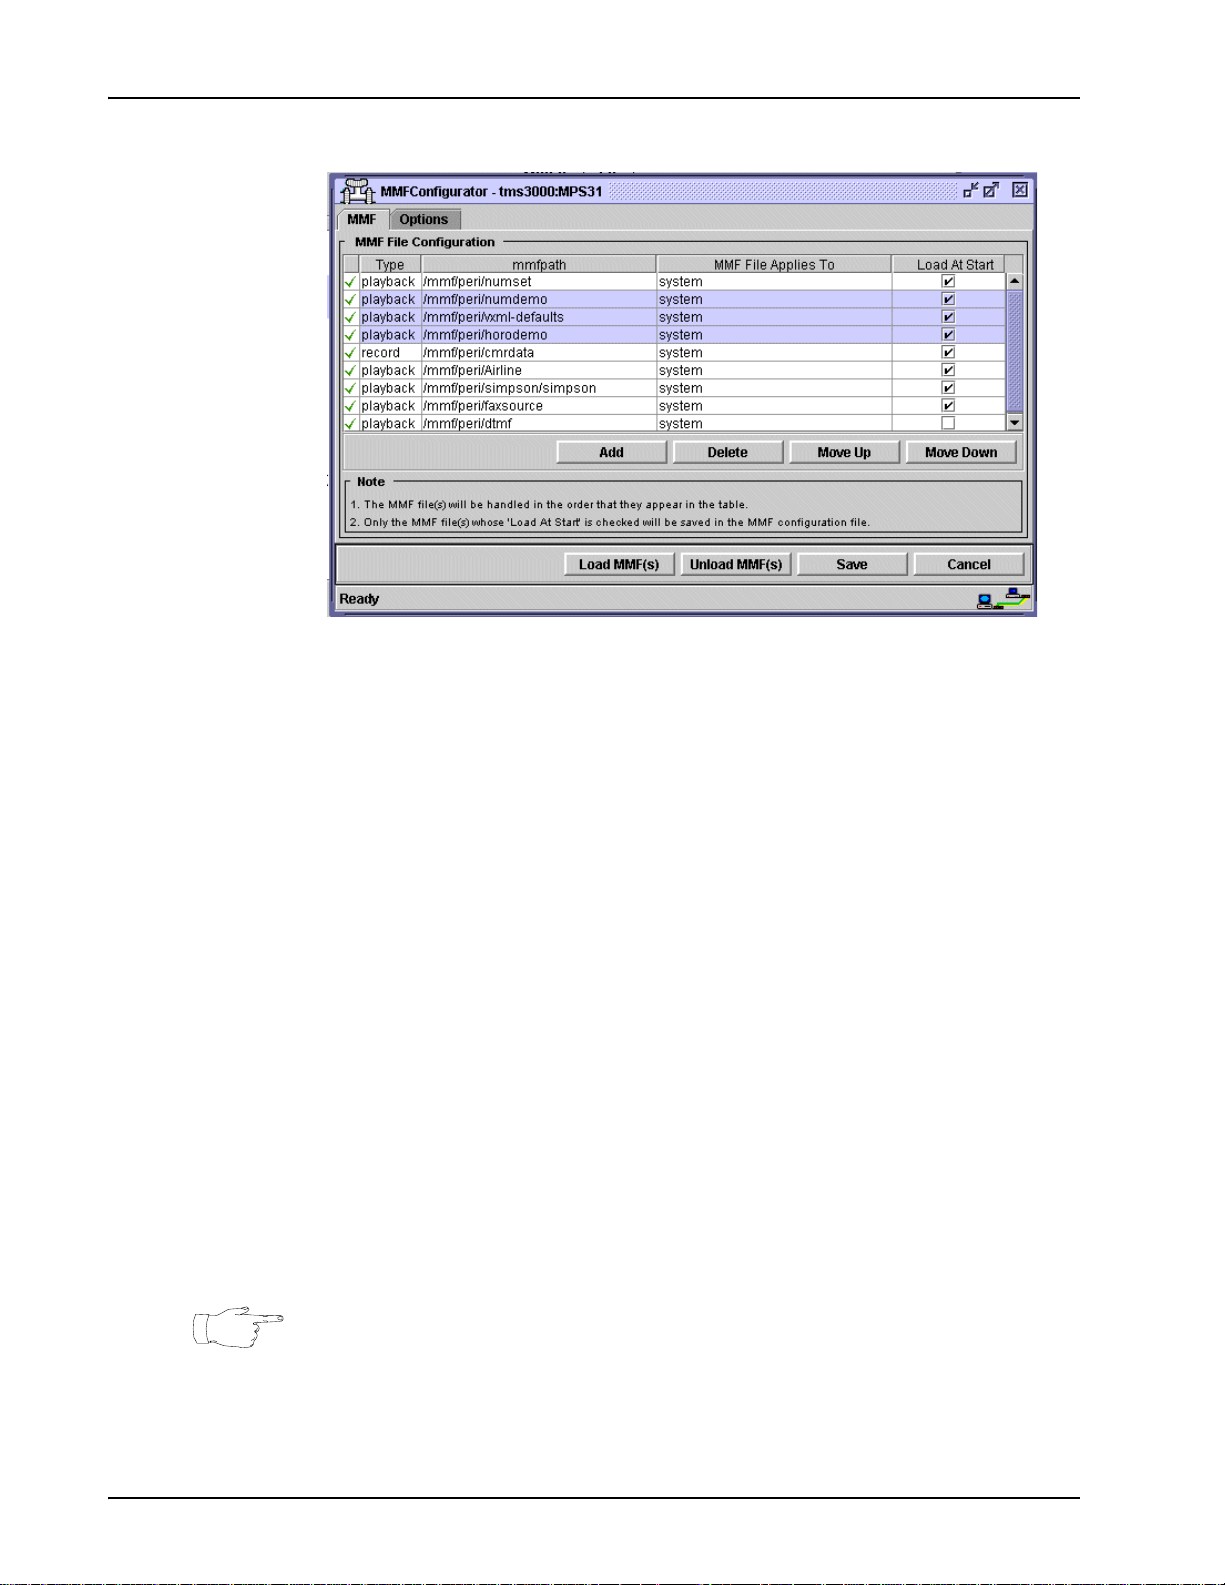
Media Processing Server System Operator’s Guide
How to ...Deactivate MultiMedia Format Files using the Com-
mand Line
1. Open a Media Processing Server shell on the Media Processing
Server that contains the unneeded MMF file, see Command Con-
trol on page 50.
2. Enter the vmm mmfunload command.
• To unload an MMF file that was available to all applications in
the system-wide hash table, use the syntax vmm mmfunload
<mmfname>,system (It is not necessary to specify the
“system” parameter as this is the default.)
• To unload the MMF file from a particular application (application-specific hash table), use the syntax vmm mmfunload
<mmfname>,<appname>
• To unload all MMF files available system wide or to a specific
application, use the applicable prior command and substitute the
option all for <mmfname>
3. Move the file out of $MEDIAFILEHOME or it will be activated next
time the system is (re)started. Also, remove its name from the vmm-
mmf.cfg file (if this file is used).
When unloading an MMF, if only the MMF name is specified, the MMF will be
unloaded from the system hash table by default.
To determine if an MMF has been deployed system-wide or for a particular
application, issue the vmm mmfstatus command in an MPS VSH command line.
Page 100 # P0602484 Ver: 2.7
 Loading...