

Avaya P580, P882, Cajun P120 Device SMON User Manual

Avaya P120 SMON
User Guide
April 2002

Avaya P120 SMON User Guide
Copyright 2002 Avaya Inc. All Rights Reserved
The products, specifications, and other technical information regarding the products contained
in this document are subject to change without notice. All information in this document is
believed to be accurate and reliable, but is presented without warranty of any kind, express or
implied, and users must take full responsibility for their application of any products specified in
this document. Avaya disclaims responsibility for errors which may appear in this document,
and it reserves the right, in its sole discretion and without notice, to make substitutions and
modifications in the products and practices described in this document.
Avaya™, Cajun™, P550™, LANstack™, CajunView™, and SMON™ are trademarks of
Avaya Inc.
ALL OTHER TRADEMARKS MENTIONED IN THIS DOCUMENT ARE PROPERTY OF THEIR
RESPECTIVE OWNERS.
Release 1.002

Avaya P120 SMON User Guide iii
Table of Contents
Preface . . . . . . . . . . . . . . . . . . . . . . . . . . . . . . . . . . . . . . . . . . . . . . . . . .vi
The Purpose of this Guide . . . . . . . . . . . . . . . . . . . . . . . . . . . . . . . . . vi
Who Should Use this Guide . . . . . . . . . . . . . . . . . . . . . . . . . . . . . . .vii
Organization of this Guide . . . . . . . . . . . . . . . . . . . . . . . . . . . . . . . .vii
Chapter 1 — SMON Overview . . . . . . . . . . . . . . . . . . . . . . . . . . . . . . . 1
What is RMON . . . . . . . . . . . . . . . . . . . . . . . . . . . . . . . . . . . . . . . . . .1
What is SMON . . . . . . . . . . . . . . . . . . . . . . . . . . . . . . . . . . . . . . . . . .2
Overview of SMON . . . . . . . . . . . . . . . . . . . . . . . . . . . . . . . . . . . . . .2
SMON Devices . . . . . . . . . . . . . . . . . . . . . . . . . . . . . . . . . . . . . . .3
Filtering Options . . . . . . . . . . . . . . . . . . . . . . . . . . . . . . . . . . . . .3
Device SMON Tools . . . . . . . . . . . . . . . . . . . . . . . . . . . . . . . . . . . . . .4
Switch Statistics Overview . . . . . . . . . . . . . . . . . . . . . . . . . . . . . .4
Port Statistics Overview . . . . . . . . . . . . . . . . . . . . . . . . . . . . . . . .5
VLAN Statistics Overview . . . . . . . . . . . . . . . . . . . . . . . . . . . . . .5
Alarms and Events Overview . . . . . . . . . . . . . . . . . . . . . . . . . . .6
Chapter 2 — Device SMON . . . . . . . . . . . . . . . . . . . . . . . . . . . . . . . . . . 8
Accessing Device SMON . . . . . . . . . . . . . . . . . . . . . . . . . . . . . . . . . . .8
The Device SMON User Interface . . . . . . . . . . . . . . . . . . . . . . . . . . . .9
Application Tabs . . . . . . . . . . . . . . . . . . . . . . . . . . . . . . . . . . . . . . . .10
Device SMON Toolbar . . . . . . . . . . . . . . . . . . . . . . . . . . . . . . . .10
Dialog Area . . . . . . . . . . . . . . . . . . . . . . . . . . . . . . . . . . . . . . . .12
Desktop . . . . . . . . . . . . . . . . . . . . . . . . . . . . . . . . . . . . . . . . . . .12
Status Bar . . . . . . . . . . . . . . . . . . . . . . . . . . . . . . . . . . . . . . . . .12
Status Line . . . . . . . . . . . . . . . . . . . . . . . . . . . . . . . . . . . . . . . . .13
Working with Device SMON Tools . . . . . . . . . . . . . . . . . . . . . . . . . .13
Mouse Actions . . . . . . . . . . . . . . . . . . . . . . . . . . . . . . . . . . . . . .14
Using Dialog Box Options . . . . . . . . . . . . . . . . . . . . . . . . . . . . .14
Generating Reports . . . . . . . . . . . . . . . . . . . . . . . . . . . . . . . . . .15
Chapter 3 — Switch Statistics. . . . . . . . . . . . . . . . . . . . . . . . . . . . . . . 16
Using Switch Statistics . . . . . . . . . . . . . . . . . . . . . . . . . . . . . . . . . . .16
Gauges and Pie Charts in the Switch Statistics Window . . . . . .17
Traffic Graph in the Switch Statistics Window . . . . . . . . . . . . .18

iv Avaya P120 SMON User Guide
Table of Contents
Chapter 4 — Port Statistics . . . . . . . . . . . . . . . . . . . . . . . . . . . . . . . . . 20
Using Port Statistics . . . . . . . . . . . . . . . . . . . . . . . . . . . . . . . . . . . . .20
Selecting Ports to Display . . . . . . . . . . . . . . . . . . . . . . . . . . . . . .20
Port Statistics Variables . . . . . . . . . . . . . . . . . . . . . . . . . . . . . . .21
The Port Statistics Window . . . . . . . . . . . . . . . . . . . . . . . . . . . .23
Chapter 5 — VLAN Statistics. . . . . . . . . . . . . . . . . . . . . . . . . . . . . . . . 24
Using VLAN Statistics . . . . . . . . . . . . . . . . . . . . . . . . . . . . . . . . . . . .24
Selecting VLANs to Display . . . . . . . . . . . . . . . . . . . . . . . . . . . .25
VLAN Statistics Variables . . . . . . . . . . . . . . . . . . . . . . . . . . . . . .25
VLAN Statistics Window . . . . . . . . . . . . . . . . . . . . . . . . . . . . . .26
Chapter 6 — Alarms and Events. . . . . . . . . . . . . . . . . . . . . . . . . . . . . 27
Using Alarms and Events . . . . . . . . . . . . . . . . . . . . . . . . . . . . . . . . .27
Alarms Table . . . . . . . . . . . . . . . . . . . . . . . . . . . . . . . . . . . . . . . . . . .28
Alarms Table Fields . . . . . . . . . . . . . . . . . . . . . . . . . . . . . . . . . .28
Tooltips . . . . . . . . . . . . . . . . . . . . . . . . . . . . . . . . . . . . . . . . . . .30
Editing Alarms . . . . . . . . . . . . . . . . . . . . . . . . . . . . . . . . . . . . . .31
Alarm Wizard . . . . . . . . . . . . . . . . . . . . . . . . . . . . . . . . . . . . . . . . . .32
Overview of the Alarm Wizard . . . . . . . . . . . . . . . . . . . . . . . . .32
Activating the Alarm Wizard . . . . . . . . . . . . . . . . . . . . . . . . . . .32
Alarm Wizard Screens . . . . . . . . . . . . . . . . . . . . . . . . . . . . . . . .33
Device Event Log . . . . . . . . . . . . . . . . . . . . . . . . . . . . . . . . . . . . . . .40

Avaya P120 SMON User Guide v
Table of Contents
Appendix A — SMON Dialog Boxes. . . . . . . . . . . . . . . . . . . . . . . . . . 43
Using the General Options Dialog Box . . . . . . . . . . . . . . . . . . . . . . .43
Polling Interval . . . . . . . . . . . . . . . . . . . . . . . . . . . . . . . . . . . . .44
Display Mode . . . . . . . . . . . . . . . . . . . . . . . . . . . . . . . . . . . . . . .44
Report Setting . . . . . . . . . . . . . . . . . . . . . . . . . . . . . . . . . . . . . .45
Using the Report Now Dialog Box . . . . . . . . . . . . . . . . . . . . . . . . . .46
Using the Auto Report Dialog Box . . . . . . . . . . . . . . . . . . . . . . . . . .46
Using the Switch Options Dialog Box . . . . . . . . . . . . . . . . . . . . . . . .48
Samples Per Screen . . . . . . . . . . . . . . . . . . . . . . . . . . . . . . . . . .49
Samples To Store . . . . . . . . . . . . . . . . . . . . . . . . . . . . . . . . . . . .49
Logarithmic Display . . . . . . . . . . . . . . . . . . . . . . . . . . . . . . . . . .49
Level Indicators . . . . . . . . . . . . . . . . . . . . . . . . . . . . . . . . . . . . .49
Using the Port/VLAN Options Dialog Box . . . . . . . . . . . . . . . . . . . .50
Items Per Screen . . . . . . . . . . . . . . . . . . . . . . . . . . . . . . . . . . . .50
Using the Find Dialog Box . . . . . . . . . . . . . . . . . . . . . . . . . . . . . . . .51
Finding a VLAN . . . . . . . . . . . . . . . . . . . . . . . . . . . . . . . . . . . . .52
Finding a Port . . . . . . . . . . . . . . . . . . . . . . . . . . . . . . . . . . . . . .52
Finding a LAG . . . . . . . . . . . . . . . . . . . . . . . . . . . . . . . . . . . . . .52
Using the Define Port Filter Dialog Box . . . . . . . . . . . . . . . . . . . . . .53
Using the Define VLAN Filter Dialog Box . . . . . . . . . . . . . . . . . . . . .55
Using the Define TopN Filter Dialog Box . . . . . . . . . . . . . . . . . . . . .57
Using the Find Top5 Peaks Dialog Box . . . . . . . . . . . . . . . . . . . . . . .58
Using the Sort Dialog Box . . . . . . . . . . . . . . . . . . . . . . . . . . . . . . . .59
Appendix B — Setting Up the SMON License . . . . . . . . . . . . . . . . . . 60
SMON Embedded License . . . . . . . . . . . . . . . . . . . . . . . . . . . . . . . .60
Index. . . . . . . . . . . . . . . . . . . . . . . . . . . . . . . . . . . . . . . . . . . . . . . . . . . 61

Avaya P120 SMON User Guide vi
Preface
Welcome to A vaya P120 SMON. This chapter provides an introduction to
the structure and assumptions of the guide. It includes the following
sections:
• The Purpose of this Guide - A description of the intended
purpose of this guide.
• Who Should Use this Guide - A description of the intended
audience of this guide.
• Organization of the Guide - A brief description of the subjects
covered in each chapter of this guide.
The Purpose of this Guide
This guide contains the information needed to operate Avaya P120
SMON switch monitoring application efficiently and effectively.
The following table provides information about where to find
documentation about Enterprise SMON and Device SMON for other
devices.
Table 1. SMON Documentation
Application Document
Enterprise SMON Avaya MultiService SMON User Guide
SMON for Avaya M770 Devices Avaya M770 and M-MLS SMON User
Guide
SMON for Avaya P130 Devices
Avaya P130 SMON User Guide
SMON for Avaya P330 Devices
Avaya P330 SMON User Guide
SMON for Avaya P580/P882
Devices
Avaya P580/P882 SMON User Guide

Avaya P120 SMON User Guide vii
Preface
Who Should Use this Guide
This guide is intended for use by network managers familiar with network
management and its fundamental concepts. It is assumed that the user
has the basic responsibility for monitoring A v aya Technologies’ intelligent
switching devices and the network traffic.
Organization of this Guide
This guide is structured to reflect the following conceptual divisions:
• Preface - This chapter describes the guide’s purpose, intended
audience, and organization.
• Overview - This chapter provides an overview of the RMON
standard and Avaya Inc’s SMON concepts and an introduction to
the SMON tools.
• Device SMON - This chapter describes how to launch
Avaya P120 SMON and the Device SMON tools. It also describes the
Device SMON user interface.
• Switch Statistics - This chapter describes the Switch Statistics
tool in detail, including sample screens and filtering options.
• Port Statistics - This chapter describes the Port Statistics tool in
detail, including sample screens and filtering options.
• VLAN Statistics - This chapter describes the VLAN Statistics tool
in detail, including sample screens and filtering options.
• Alarms and Events - This chapter describes the Alarms Table,
Alarms Wizard, and Device Event Log in detail, with instructions
on how to define and activate alarms.
The following Appendices are included at the end of this guide:
• Appendix A - Dialog boxes that appear in SMON tools.
• Appendix B - How to set up the SMON license so that SMON will
work with Avaya P120 Devices.

Avaya P120 SMON User Guide 1
1
SMON Overview
This chapter describes SMON, A vaya Inc.’ s switched network monitoring
system. This chapter includes the following s:
• What is RMON - A brief description of the RMON standard.
• What is SMON - A general description of SMON switch
monitoring technology.
• Overview of SMON - An introduction to SMON.
• Device SMON Tools - The Device SMON tools and how they
function.
What is RMON
RMON is the internationally recognized and approved standard for
detailed analysis of shared Ethernet and Token Ring media. It ensures
consistency in the monitoring and display of statistics between different
vendors.
RMON’s advanced remote networking capabilities provide the tools
needed to monitor and analyze the behavior of segments on a network.
In conjunction with an RMON agent, RMON gathers details and logical
information about network status, performance, and users running
applications on the network.
An RMON agent is a probe that collects information about segments,
hosts, and traffic, and sends it to a management station.
The network administrator uses software tools to view the information
collected by the RMON agent on the management station.

Avaya P120 SMON User Guide 2
SMON Overview
RMON has two levels:
• RMON I analyzes the MAC layer (Layer 2 in the OSI seven-layer
model).
• RMON II analyzes the upper layers (Layers 3 and above).
RMON is an industry standard that Avaya Inc. and other companies have
adopted in their network management applications. SMON takes the
RMON standard and extends it to the switching environment.
What is SMON
SMON is an extension of the RMON standard. SMON adds to the
monitoring capabilities of RMON in the following ways:
• It provides additional tools and features for monitoring in the
switch environment.
• It provides a global view of traffic flow in a network with multiple
switches.
Device SMON extends RMON I for the MAC layer, and AnyLayer SMON
extends RMON II for the network layer and above. SMON monitoring
collects and displays data in real-time.
Using SMON monitoring, you can get:
• A global view of traffic for all switches on the network.
• An overall view of traffic passing through a specific switch.
• Detailed data about the hosts transmitting packets through a
switch.
• An analysis of traffic passing through each port connected to a
switch.
• A view of traffic between various hosts connected to a switch.
Overview of SMON
SMON is an RMON-compliant network management suite that
implements the SMON extensions to RMON. SMON works with the other
components of Avaya MultiService Network Manager to provide a full
spectrum of in-depth monitoring of switch traffic and network
performance.

Chapter 1
3 Avaya P120 SMON User Guide
SMON consists of a software console application on a workstation and
remote monitoring probes in network devices that support SMON.
The SMON console communicates constantly with the SMON devices on
your network. The console uses the SNMP protocol to gather information
from the devices. SMON provides a suite of powerful graphic display tools
to view this information.
SMON gives you detailed analysis of the traffic flow on your switched
network, from a global view down to a specific host, and from total MAC
layer traffic down to a specific application protocol - all in real-time.
In addition, SMON allows you to set alarms based on traffic thresholds.
When an alarm is triggered, a trap can be sent to the device’s manager
and the event that triggered the alarm can be entered in SMON’s Event
Log.
SMON Devices
SMON provides monitoring capabilities for Avaya Inc’s network devices
that support the SMON extensions of the RMON standard.
Filtering Options
SMON tools provide different methods of filtering the information
displayed on the screen. These method include:
• Specific filtering
• TopN filtering
For information on how to use filters, refer to Appendix A, SMON Dialog
Boxes.
Specific
Filtering
Specific filtering options provide the ability to specify the switches,
VLANs, or ports for which you want to view SMON information.
TopN
Filtering
TopN filtering provides the ability to filter information based on the
amount of a particular type of traffic being monitored. When using TopN
filtering, specify the number of switches, VLANs, or ports for which you
want to view SMON information. Then select a statistic which will be
used as the basis for the filtering.
Using TopN filtering you can, for example, view information on only the
top 5 most active ports, or on the 8 switches generating the most error
traffic.

Avaya P120 SMON User Guide 4
SMON Overview
T opN filtering is powerful in that it allows you to focus on the information
that is important to you.
Device SMON Tools
The Device SMON tools for Avaya P120 Devices include:
• Switch Statistics - Detailed information on traffic passing
through the switch fabric.
• VLAN Statistics - Detailed information on switch traffic
associated with a VLAN.
• Port Statistics - Detailed information on port traffic to help
determine the precise cause of a problem.
• Alarms and Events - Notification of user defined Events that
help monitor a rise or fall of the rate of specified packets on
selected ports.
Switch Statistics Overview
The Switch Statistics tool provides details of the traffic passing through
the switch fabric and allows you to detect problems on the switch. Once a
problem has been detected, you can use VLAN or Port Statistics to
determine more precisely the cause of the problem.
The display includes two sections:
• Pie charts and gauges showing traffic breakdown.
• A traffic graph that describes the characteristics of the traffic
passing through the device.
You can use the Switch Statistics tool for the following purposes:
• Gaining an overall view of the switched traffic over a specific time
period. This can help in discovering problems and analyzing traffic
trends.
• Discovering whether the device is being utilized efficiently or not.
• Monitoring the load distribution among VLANs.
• Detecting a large number of broadcast messages sent. This indicates
there may be a problem with a station on the network.

Chapter 1
5 Avaya P120 SMON User Guide
• Treating any variable with abnormal behavior as an issue that
should be investigated further using other SMON tools.
In general, the Switch Statistics tool can help you spot problems that only
become apparent from a high-level view over time. By periodically
viewing Switch Statistics, you can detect normal and abnormal behavior
of the specific switch configuration.
SMON collects and displays all information in real-time. In addition,
information collected during a session can be saved in a report.
Port Statistics Overview
The Port Statistics tool measures the traffic travelling through each port
on the selected device. For each port, SMON summarizes the traffic, such
as packets into the device and packets from the device. You can sort by
port name or by any of the packet types. You can see, for example, the
ports generating the most errors.
If you notice that a particular port displays a disproportionate amount of
errors, this may suggest that a device connected to the port is responsible
for the problem.
You select the most active ports by using a rate base. SMON measures the
rate base for all the ports to find the most active ports and then displays
these ports and their statistics. This process is called Port TopN.
Using the Port Statistics tool in conjunction with VLAN Statistics and
Switch Statistics makes it straightforward to discover the cause of a
problem. For example, using Switch Statistics you may discover that there
are too many errors on a specific switch. Y ou could then use Port Statistics
to help indicate the port from which the problem originates.
VLAN Statistics Overview
The VLAN Statistics tool measures the switched traffic travelling through
VLANs on the selected switch. A VLAN consists of stations connected
logically rather than physically. A VLAN can be used, for example, to
distribute network resources by department, even if the department’s
stations are not all located in the same area. Therefore, a VLAN can
incorporate stations from different devices.
By comparing the load of each VLAN you can discover which VLANs are:
• Utilizing their full capacity.
• Under capacity.
Avaya P120 SMON User Guide 6
SMON Overview
• Over-extended and probably causing a degradation in performance
to the users.
VLAN Statistics represents the information as a horizontal bar chart. Using
this tool in conjunction with Port Statistics and Switch Statistics makes it
straightforward to discover the cause of a problem. For example, using
VLAN Statistics you may discover that there are too many broadcast
errors on a specific VLAN. You could then use Port Statistics to help
indicate from which port the problem originates.
Alarms and Events Overview
The Alarms and Events tool reports when a specified counter on selected
ports, or on a device, cross user defined thresholds. The Alarm Wizard
provides a simple method for defining upper and lower thresholds of a
counter on selected ports or on the device. This definition of the
thresholds is an Alarm.
An Event is the crossing of a defined threshold in the direction it was
defined. For example, a Rising Event is when the rate of a specified
counter on a selected port rises above the defined Rising (upper)
Threshold. A Falling Event is when the rate of a specified counter on a
selected port falls below the defined Falling (lower) Threshold.
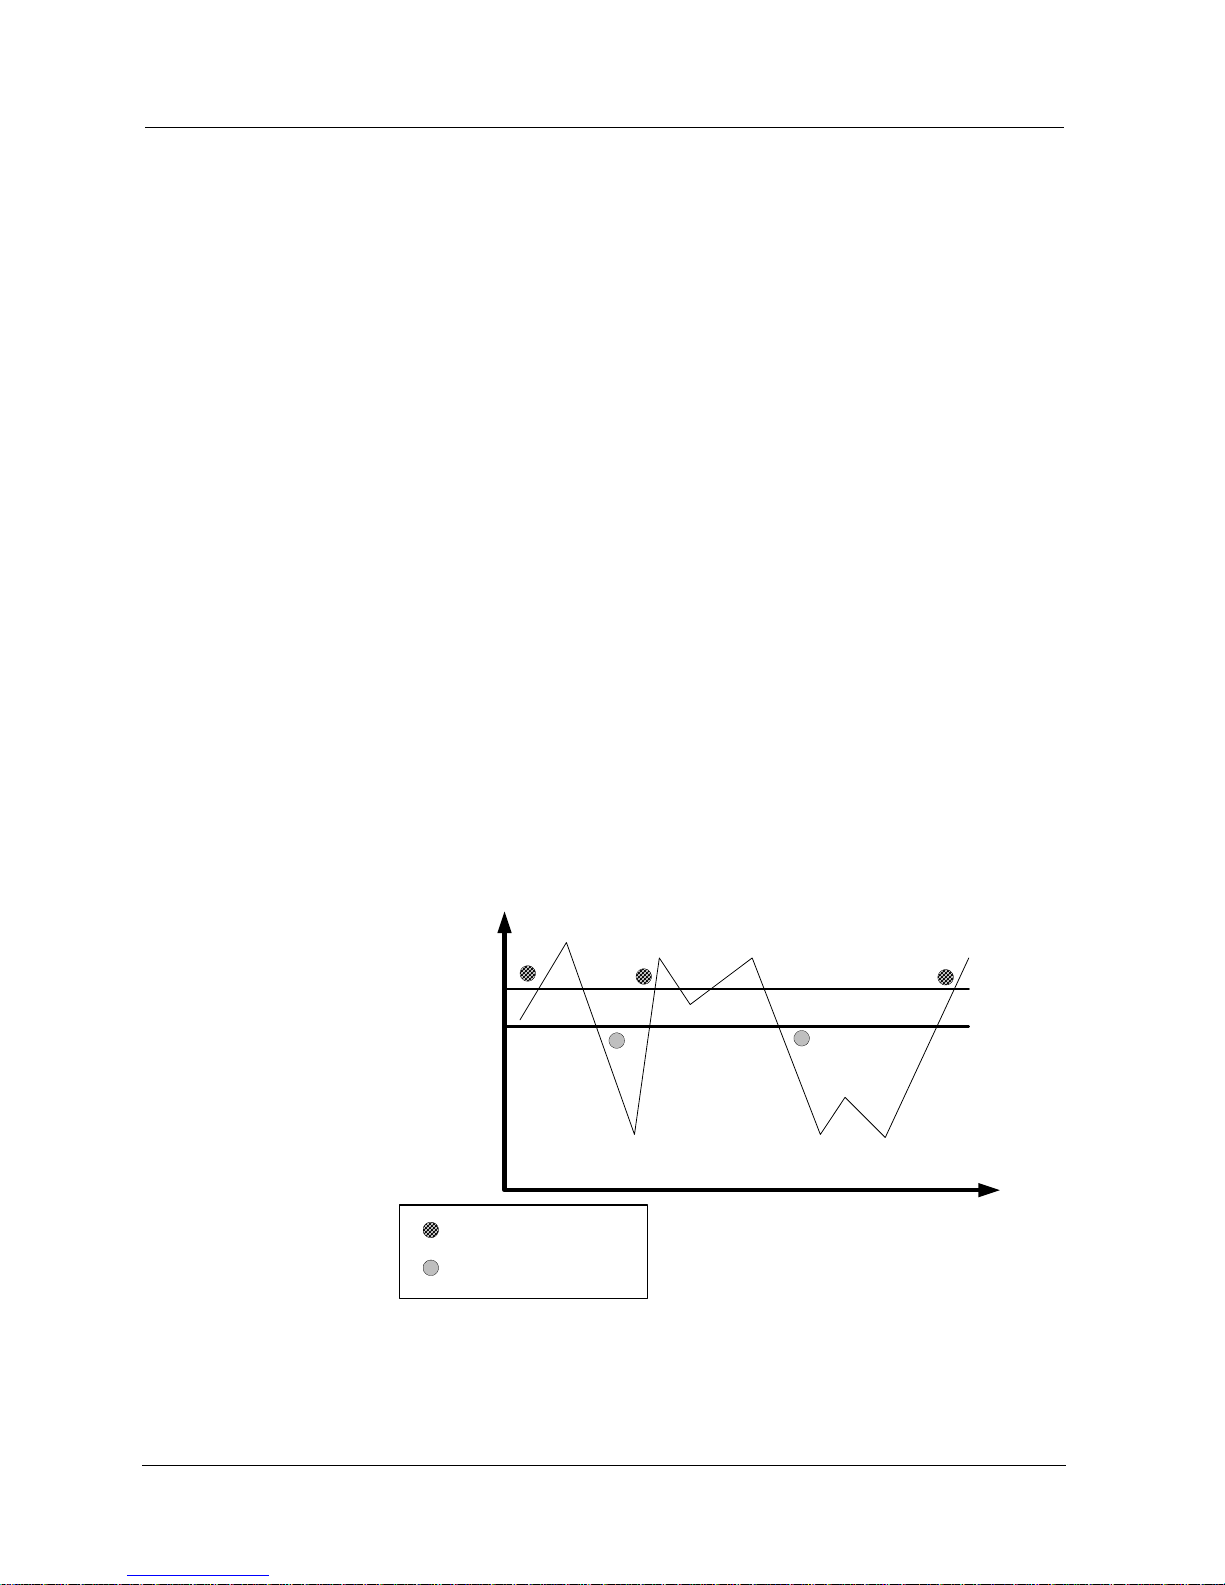
The following figure shows the scheme used to generate Events.
Figure 1-1. Events Overview
Counter
Rate
Rising Threshold
Falling Threshold
Time
u
- Rising Event
- Falling Event

Chapter 1
7 Avaya P120 SMON User Guide
The first Event is a Rising Event, caused by the counter rate rising above
the Rising Threshold. The second Event is a Falling Event, caused by the
counter rate falling below the Falling Threshold. The third Event is a
Rising Event. Note, that although the rate falls below the Rising Threshold
and then rises above it again, no Event is generated. A new Rising Event
can only be generated after the rate falls below the Falling Threshold.
Similarly, after the fourth Event, although the rate rises above the Falling
Threshold and then falls below it again, no Event is generated. A new
Falling Event can only be generated after the rate rises above the Rising
Threshold.
If you want to be informed of the rise or fall of the rate of a particular type
of packet on a port, you could use the Alarm Wizard to define thresholds
for the packet type on the port. You co uld then specify whethe r an Even t
causes a trap to be sent to the device’s manager, or is listed in SMON’s
Device Event Log, or both.
If you suspect a problem on a port, you can use Alarms and Events to
notify you when a problem occurs. You could then use the Port History
tool to identify the duration and frequency of the problem. This can help
you locate the cause of the problem.

Avaya P120 SMON User Guide 8
2
Device SMON
This chapter provides information about SMON for Avaya P120 Devices,
and contains the following sections:
• Accessing Device SMON - Instructions on accessing the Device
SMON window.
• The Device SMON User Interface - A detailed description of
the user interface for Avaya P120 SMON.
• Working with Device SMON Tools - Techniques for using
Device SMON more effectively.
Accessing Device SMON
To access SMON for the Avaya P120 Devices, click the Device SMON tab
in the Avaya P120 Manager.
Or
1. Open Avaya MultiService SMON Manager Enterprise Switch
Statistics.
2. Double-click on the bar corresponding to an Avaya P120 Device.
Or
Right-click on the bar corresponding to an Avaya P120 Device
and select
Execute Device SMON. SMON for the selected Avaya
P120 Device opens.
Chapter 2
9 Avaya P120 SMON User Guide
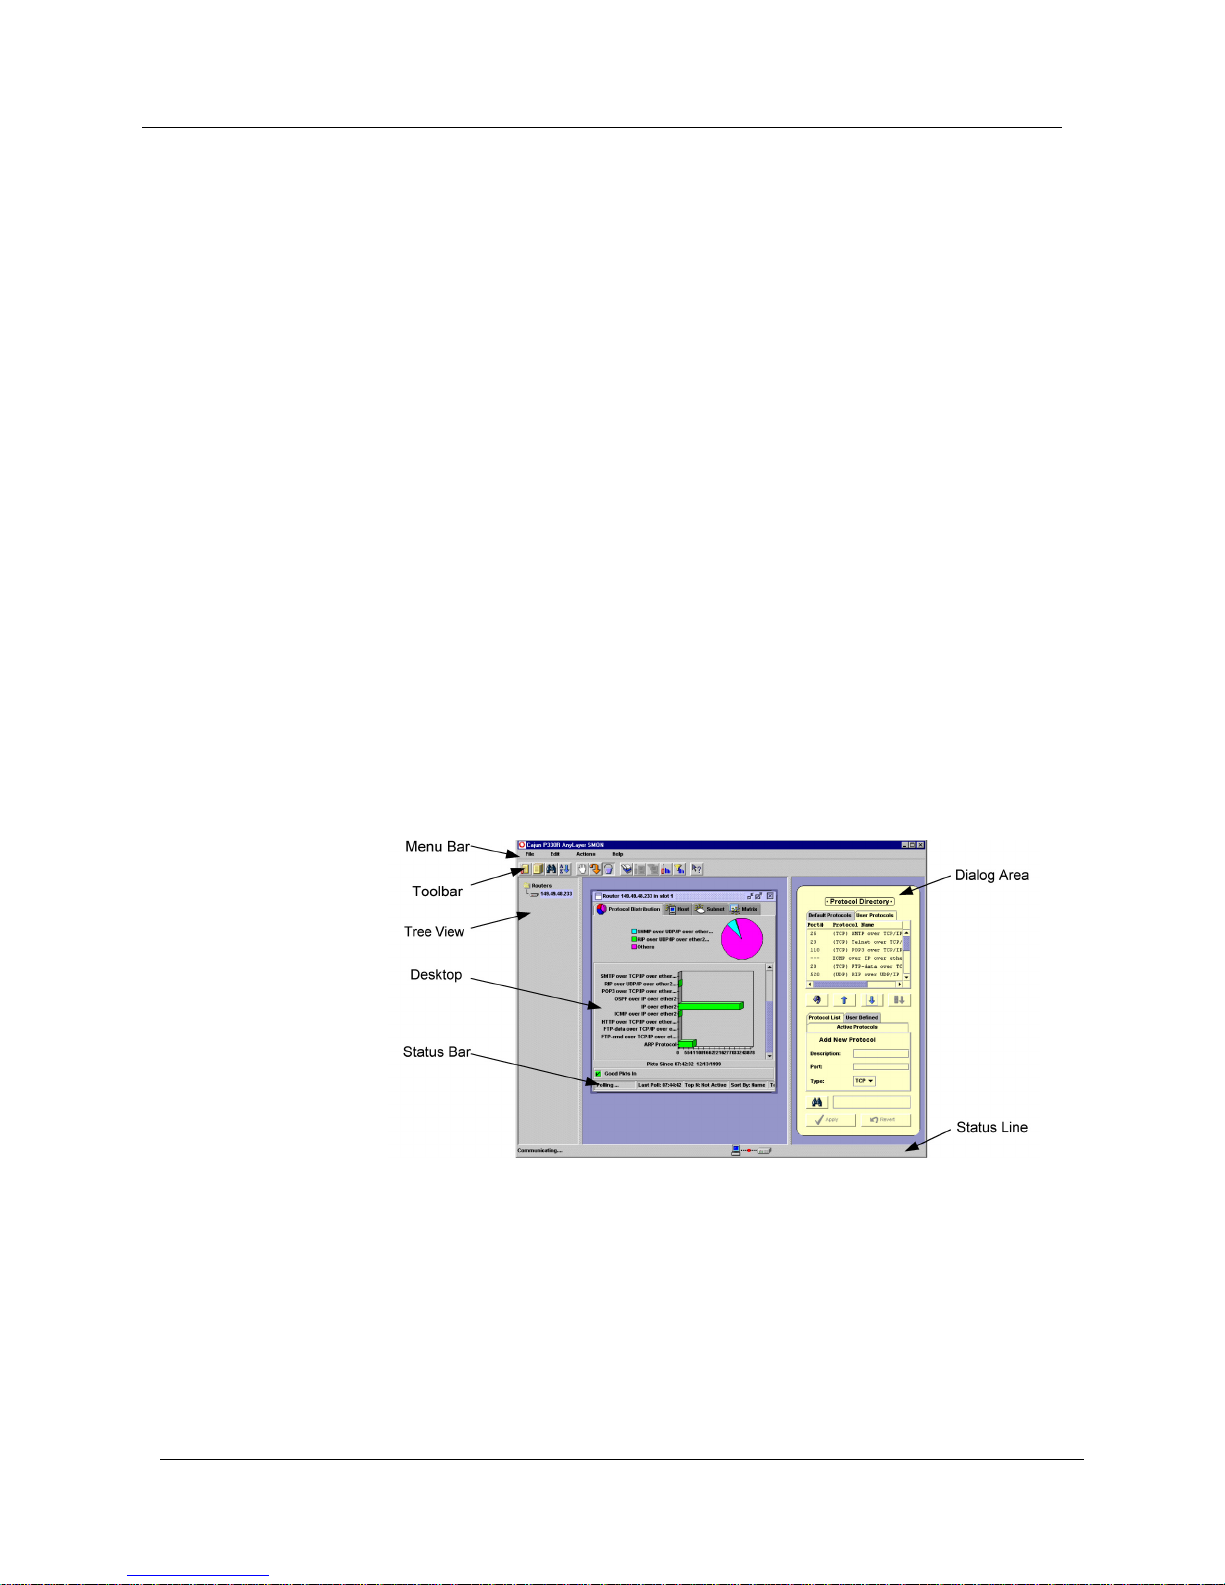
The Device SMON User Interface
The user interface consists of the following elements:
• Application Tabs - Tabs for switching between the different
views of the Avaya P120 Device.
• Menu Bar - Menus for accessing SMON functions.
• Device SMON Toolbar - Buttons providing shortcuts to
important functions in SMON tools.
• Dialog Area - A resizeable window where all dialog boxes appear.
• Desktop - A resizeable window where SMON windows are
displayed.
• Status Bar - An area at the bottom of each application window
where information about the current application is displayed.
• Status Line - An area at the bottom of the SMON window where
the communication status between Avaya P120 SMON
and the
Avaya P120 Device is displayed.
The figure below shows the user interface, with its various parts labeled.
Figure 2-1. Avaya P120 SMON User Interface
Avaya P120 SMON User Guide 10
Device SMON
Application Tabs
The Application Tabs provide a method for selecting the view of the
device.
To switch to the device management view of the Avaya P120, click
Device Manager. The Avaya P120 Device Manager opens.
To switch to the Device SMON view of the Avaya P120, click
Device SMON. Avaya P120 SMON opens.
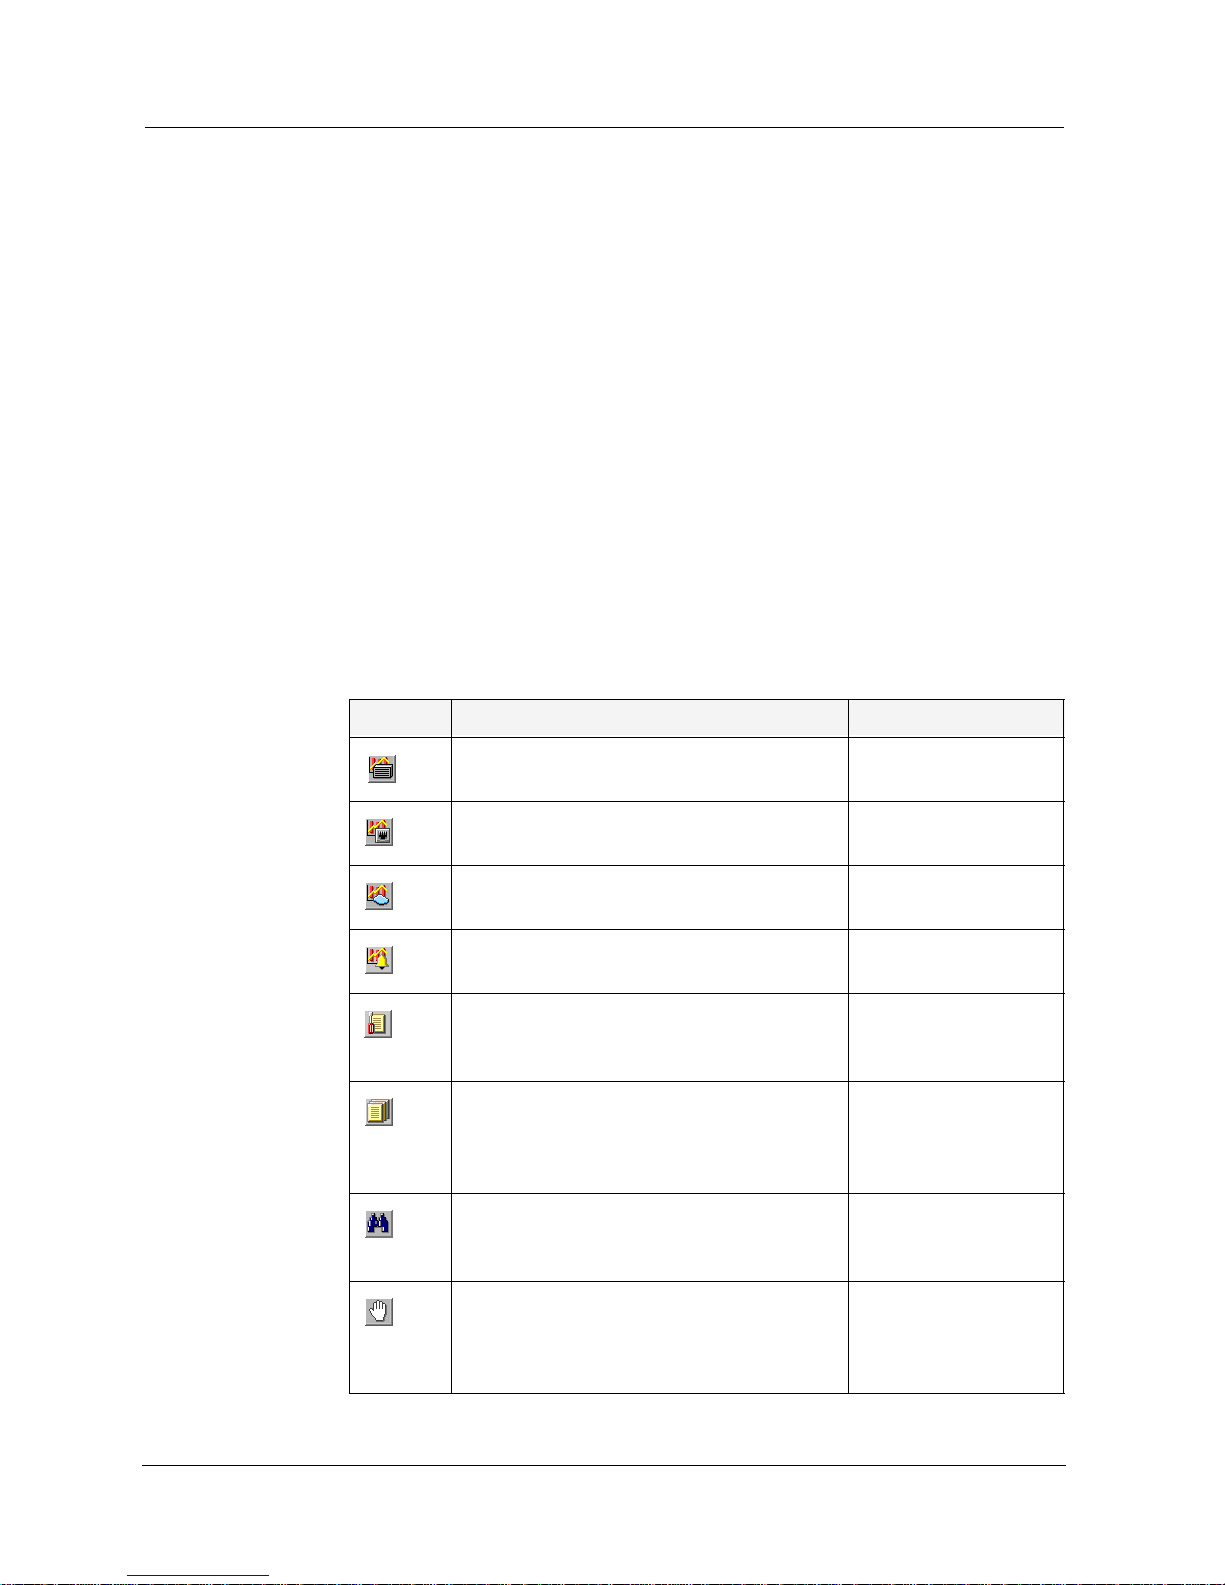
Device SMON Toolbar
The Toolbar provides shortcuts to the main Device SMON functions and
tools. The following table describes the buttons on the toolbar and lists the
equivalent menu options.
Table 2-1. Toolbar Buttons
Button Description Menu
Activates the Switch Statistics tool. View > Switch
Statistics
Activates the Port Statistics tool. View > Port
Statistics
Activates the VLAN Statistics tool. View > VLAN
Statistics
Opens the Alarms Table. Tools >
Alarms
Table
Opens the General Options dialog box.
For more information, refer to Appendix
A, Using the General Options Dialog Box.
File > Options
Produces a report file for importing to a
spreadsheet or word processor. For more
information, refer to Appendix A, Report
Setting.
File > Report Now
Searches for a specific item. For more
information, refer to Appendix A, Using
the Find Dialog Box.
Edit > Find
Temporarily stops and then restarts
collection of SMON data. When the
collection of SMON data is paused, the
background of the chart appears white.
Actions > Pause
Chapter 2
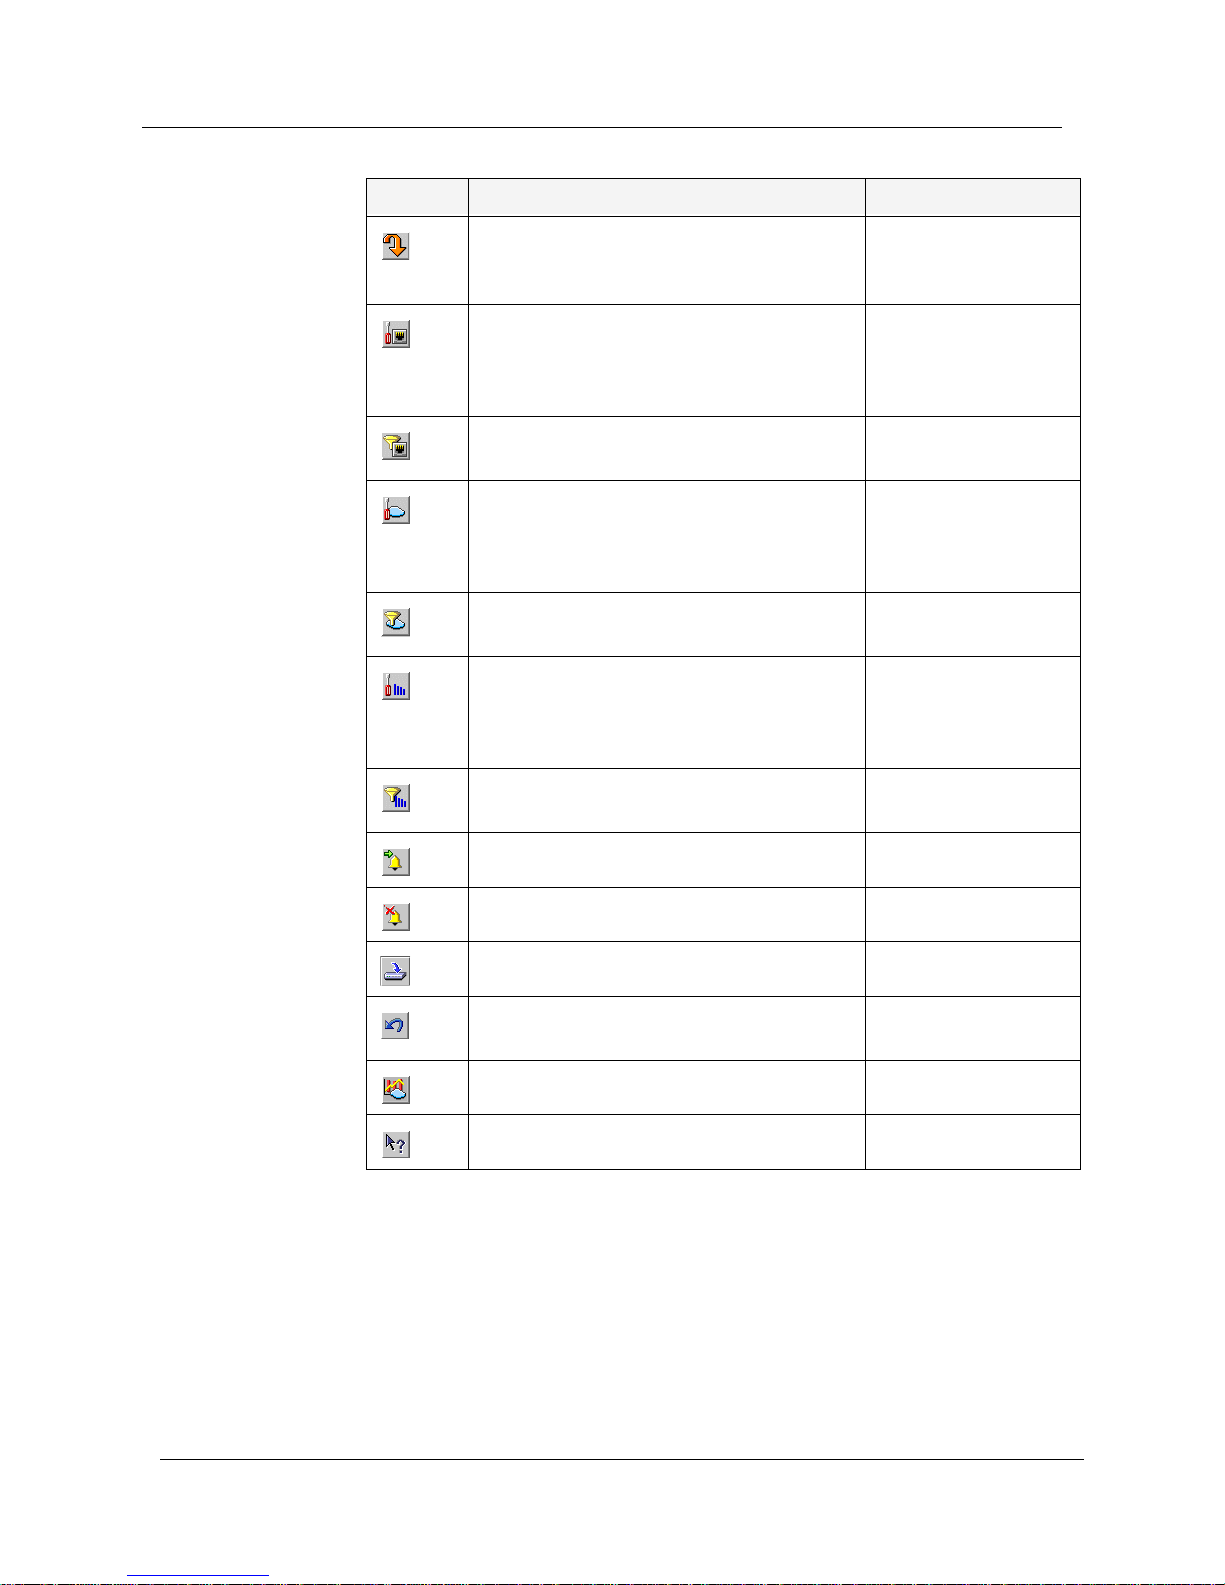
11 Avaya P120 SMON User Guide
If a tool is not active, clicking the corresponding Device SMON toolbar
button launches the tool. If a tool is already active, clicking the
corresponding Device SMON toolbar button brings the tool to the
foreground. For more information about the individual tools, refer to
Chapter 1, Device SMON Tools.
Updates the data immediately rather than
at the next specified polling time. Resets
the polling interval timer.
Actions > Poll Now
Selects a specific list of ports for display
and analysis. For more information, refer
to Appendix A, Using the Define Port Filter
Dialog Box.
Actions > Define
Port Filter
Activates or deactivates the filter specified
in Define Port Filter.
Actions > Activate
Port Filter
Selects a specific list of VLANs for display
and analysis. For more information, refer
to Appendix A, Using the Define VLAN
Filter Dialog Box.
Actions > Define
VLAN Filter
Activates/Deactivates the filter specified
in Define VLAN Filter.
Actions > Activate
VLAN Filter
Selects the criterion and number of items
for TopN filtering. For more information,
refer to Appendix A, Using the Define TopN
Filter Dialog Box.
Actions > Define
TopN Filter
Activates/Deactivates the filter specified
in Define TopN Filter.
Actions > Activate
TopN Filter
Starts the Alarm Wizard. Edit > Add Alarm
Deletes the selected Alarm. Edit >
Delete Alarm
Saves all changes to the Alarms Table. Edit >
Apply
Undoes all unsaved changes to the Alarms
Table.
Edit >
Undo
Opens the Device Event Log. View >
Event Log
Opens the online-help. Help > Contents
Table 2-1. Toolbar Buttons (Continued)
Button Description Menu

Avaya P120 SMON User Guide 12
Device SMON
Dialog Area
The area on the right side of the user interface is where all dialog boxes
appear. This area can be resized by dragging the vertical splitter bar with
the mouse. When a dialog box opens it replaces the current dialog box
open in the Dialog Area.
Desktop
The left side of the application window is the Desktop. This area can be
resized by dragging the vertical splitter bar with the mouse. Device SMON
application windows can be resized and minimized. Minimized windows
are shown at the bottom of the Desktop.
Status Bar
The Status Bar provides important information about the current
window. The table below describes the items found in the status bar.
* Note: The table below describes all the items that can appear on
Avaya P120 SMON window status bars. Only some of the
items appear in the status bar for each individual window.
Table 2-2. Status Bar Items
Item Description
Graph Status Status of the display. Possible statuses are: frozen, alive.
Last Poll Time when the last poll was made.
Next Poll Time remaining before the next poll.
Session Start Date and time at which this session started.
Sort By The active sort options (port or VLAN).
T opN The active TopN variable, or TopN is not active.
Total Number of
Items
Total number of items in the collection.
Total Number of
Samples
Total number of samples in the collection.
Chapter 2
13 Avaya P120 SMON User Guide
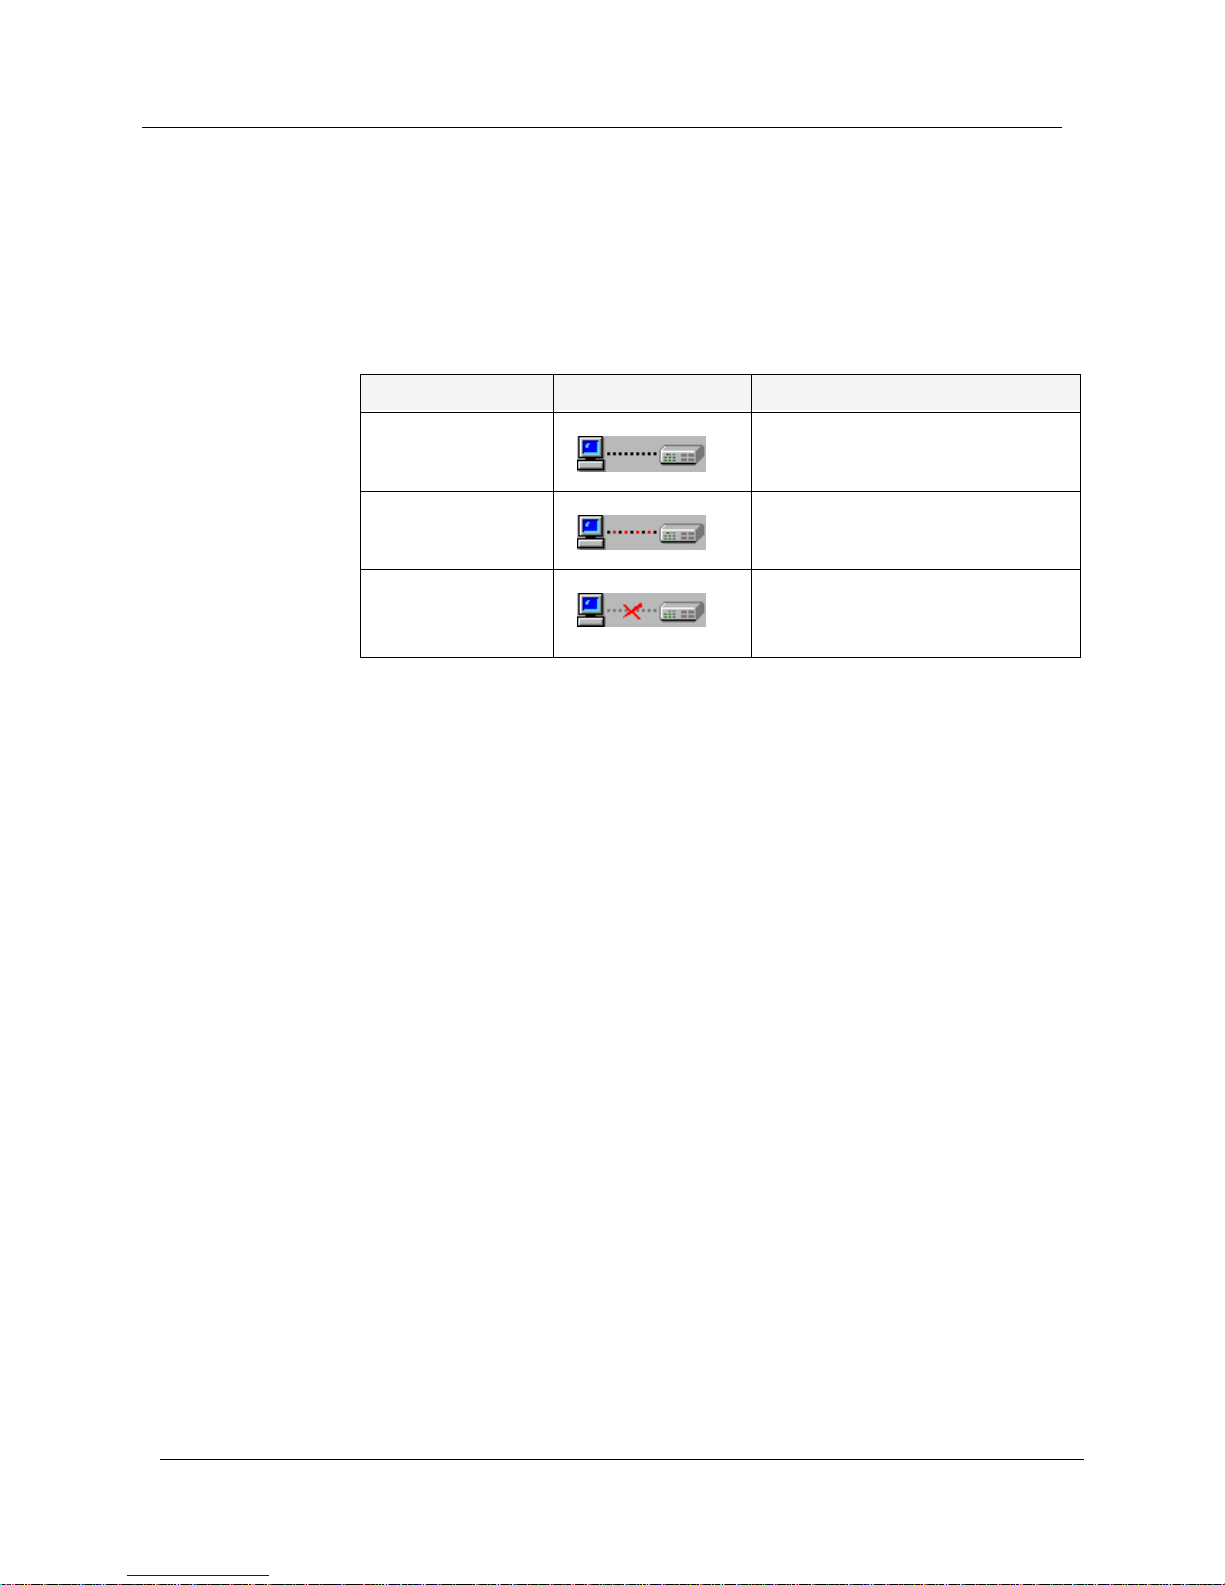
Status Line
The Status Line provides important information about the
communication status between the application and the Avaya P120
Device. The following table shows the messages and icons that can appear
in the Status Line with a description of their meaning.
Working with Device SMON Tools
The following sections describe techniques that can help you use
Avaya P120 SMON tools more effectively. The topics include:
• Mouse Actions - Information on the application’s response to
various mouse actions.
• Using Dialog Box Options - Instructions on using the dialog box
options.
• Generating Reports - Instructions on how to generate reports.
Table 2-3. Status Line Items
Message Icon Description
Ready The application is ready to
communicate with the device.
Communicating The application is currently
communicating with the device.
Error The last attempted
communication with the device
was not successful.

Avaya P120 SMON User Guide 14
Device SMON
Mouse Actions
The mouse actions that can be performed in Avaya P120 SMON windows
allow you added flexibility when using the applications. The table below
describes some of the mouse actions available in some of the SMON
applications.
Using Dialog Box Options
Information entered in a dialog box is not saved until you click the Apply
button. If you want to undo all changes made to the information in the
dialog box, click
Revert. The information in the dialog box reverts to what
it was when the dialog box was first opened. If you have already sent
information to the device from the dialog box and you click
Revert, the
information in the dialog box will revert to what it was when it was last
saved.
* Note: When clicking
Revert, the application does not poll the device
for information. It is therefore possible that the dialog box
may not reflect the true state of the device.
To apply the changes made in the dialog box, click
Apply.
To undo all changes made in the dialog box, click
Revert.
Table 2-4. Mouse Actions
Action Description
Movement on a
graph, bar, or pie
The Info Box is displayed.
Double-click in a
graph
The graph freezes and is compressed to show all of
the traffic on the device from the time the application
was opened until now.
Press SHIFT and
select a portion of the
graph using the
mouse
The graph freezes, zooms in, and shows only the
portion of the graph that was selected.
Left-click in a graph Unfreezes the graph.

Chapter 2
15 Avaya P120 SMON User Guide
Generating Reports
SMON allows you to produce two types of reports:
• Report Now
• Auto Report
Generated reports are text files that can be imported into spreadsheets
such as Excel and database programs such as Access. The reports can be
generated in a tab delimited format or a comma separated format. Whe n a
report is generated, it is saved to the directory specified in the
Reports
Directory
field in the General Options dialog box.
Data in a Report Now includes only the statistics collected during the last
polling interval.
For more information on selecting a format and a default directory for
reports, refer to Appendix A, Using the General Options Dialog Box.
For more information on generating a Report Now, refer to “Using the
Report Now Dialog Box” on page 46. For more information on generation
Auto Reports, refer to “Using the Auto Report Dialog Box” on page 46.
 Loading...