

Page 1

CentreVu
Version 8
Reports
Supervisor
585-210-929
Comcode 108502188
Issue 1
December 1999
Page 2

Copyright 1999, Lucent Technologies
All Rights Reserved
Printed in U.S.A.
Notice
Every effort was made to ensure that the information in this book was
complete and accurate at the time of printing. Howev er, information is
subject to change.
Your Responsibility for Your System’s Security
Toll fraud is the unauthorized use of yo u r te lecommunications system by
an unauthori zed party, for example, persons other than your company’s
employees, agents, subcontractors, or persons working on your company’s
behalf. Note that there ma y be a risk of toll fraud associated wit h your
telecommunication s system and, if toll fraud occur s, it can result in substantial additional charges for your telecommunications services.
You and your system manager are responsible for the security of your system, such as programming and configuring your equipm ent to prevent
unauthorized use. The system ma na ger is also responsible for reading al l
installation, instruction, and system admi nist ra tion documents provided
with this product in order to full y understand the features tha t c an int roduce risk of toll fraud and the steps that can be taken to reduce that risk.
Lucent Technologies does not warrant that this product is immune from or
will prevent unauthoriz ed use of common-carrier tele communication services or facilities accessed through or connected to it. Lucent Technologies will not be responsible for any charges th at resul t fr om such
unauthorized use.
Part 15: Personal Computer Statement. This equipment has been certified to comply with the limits f or a Class B comput ing dev ice, p ursuan t to
Subpart J of Part 15 of FCC Rules. Only pe rip herals (computing input/
output devices, term inal s, print ers, e tc. ) certi fied to co mply with the Cl ass
B limits may be attached to this computer. Operation with noncertified
peripheral s is likely to res ult in interference to radio and televi s io n reception.
Part 68: Answer-Supervision Signaling. Allowing this equi p ment to be
operated in a manner that does not provide proper answer-supervision signaling is in violation of Part 68 rules. Th is equipment returns answersupervision signals to the public switche d network when:
• Answered by the called station
• Answered by the attendan t
• Routed to a recorded announcement that can be administered
by the CPE user
This equipment returns an sw er-supervision signals on all DID calls forwarded back to the public switched telephone network. Permissible
exceptions are:
• A call is unanswered
• A busy tone is received
• A reorder tone is received
Canadian Department of Communications (DOC)
Interference Information
This digital apparatus does not exce ed the Class A limits for radio noise
emissions set out in the radio interfere nc e regulations of the Canadian
Department of Communi cations.
Lucent Technologies Fraud Intervention
If you suspect that you are being vi ct imized by toll fraud and you need
technical support or assistance, call Technical Service Center Toll Fraud
Intervention Hotline at 1-800-643-2353.
Federal Communications Commission Statement
Part 15: Class A Statement. This equipment has been tested and found to
comply with the limits for a Class A digital device, pursuant to Part 15 of
the FCC Rules. These limits are designed to provide reasonable protection
against harmful in ter feren ce when the equi pmen t is opera ted in a comme rcial environment. This equipment gene rat es, uses, and can radiate radio
frequency energy and, i f not installed and used in accordance with the
instruction manual, may ca use harmful interference to radi o communications. Operation of this eq ui pment in a residential area is li ke ly t o cause
harmful interfer ence, in which ca se the u ser will be requ ired to corre ct t he
interference at his own expense.
Part 15: Class B Statement. This equipment has been tested and found to
comply with the limits for a Class B di git a l de vi ce, pursuant to Part 15 of
the FCC Rules. These limits are designed to provide reasonable protection
against harmful interference in a residential installation. This equipment
generates, uses, and can ra diate radio-frequency energy an d, if not
installed and used in accordance with the instr u ctions, may cause har mful
interfere nc e t o ra di o co mmu ni cati on s. H ow ever, the re is no g uar ant ee t ha t
interferen ce will not occur in a particul ar installation . I f this equipment
does cause harmful interference to radio or television reception, which can
be determined by turnin g the equi pment of f and on , the use r is encou raged
to try to corre ct the interfe rence b y one or mo re of th e fol lowing measure s:
• Reorient th e r eceiving television or rad io antenna wher e this
may be done safely.
• T o the extent possible, re lo cate the receiver wit h resp ect to the
telephone equipment.
• Where the telephone equipment requires ac pow er, plug the
telephone into a different a c out le t so tha t th e te le phone equipment and receiver ar e on di ffer ent branch circuits.
Le Présent Appareil Noméri que n’émet pas de bruits radioé le ctriques
dépassant les limites applicables aux appareils numériques de la class A
préscrites dans le reglement su r le brouillage radioélectrique édi cté par le
ministére des Communications du Canad a.
Trademarks
●
DEFINITY is a registered trademark of Lucent Technologies.
●
CentreVu is a registered tr ademark of L ucent Technologies.
●
CONVERSANT is a registered trademark of Lucent Technologies.
●
Informix is a registered trademark of Informix Software, Inc.
●
Intel is a registered trademark of Intel.
●
Microsoft, MS, MS-DOS, Windows, Windows 95, Windows NT, and
Access are registered trademarks of Microsoft Corporation.
●
OpenLink is a trademark of OpenLink Software.
●
Crystal Reports is a trademark of SeaGate Software.
●
Solaris is a trademark of Sun Microsystems, Inc.
●
SPARC trademarks, including the SCD compliant logo, are
trademarks or registered trademarks of SPARC International, Inc.
SPARCstation, SPARCserver, SPARCengine, SPARCworks, and
SPARCompiler are licensed exclusively to Sun Microsystems, Inc.
Products bearing SPARC trademarks are based upon an architecture
developed by Sun Microsystems, Inc.
●
Sun and Sun Microsystems are trademarks or registered trademarks
of Sun Microsystems, Inc.
●
Ultra Enterprise 3000 and Ultra 5 are trademarks of Sun
Microsystems, Inc.
●
UNIX is a registered trademark in the United States and other
countries, licensed exclusiv ely through X /Open Company Limited.
●
All other products mentioned herein are the trademarks of their
respective owners.
Page 3

Ordering Information
Call: Lucent Technologies Publications Center
Voice: 1-800-457-1235
International Voice: 317-322-6416
Fax: 1-800-457-1764
International Fax: 317-322-6699
Write: Lucent Technol ogies BCS Publ ications Center
2855 N. Franklin Road
Indianapolis, IN 46219
Order: Document No. 585-210-92 9
Comcode
108502188
Issue 1, December 19 99
You can be placed on a Standing Order list for this and other documents
you may need. Standing Order will enable you to automatically receive
updated versions of individual documents or document sets, bille d to
account information that you provide. For more information on Standing
Orders, or to be put on a list to receive future issues of this document,
please contact the Luc en t Technologies Publi ca tions Center.
Warranty
Lucent Technologies provides a limited warranty on this product. Refer to
the “Limited use Softwar e Lic ense Agreement” card provi de d w it h your
package.
European Union Declaration of Conformity
Lucent Technologies Business Communi cations Systems declares th at
XXX equipment specified in this document conforms to the referenced
European Union (EU) Directives and Harmonized Standards listed below:
EMC Directive 89/336/EEC
Low Voltage Directive 73/23/EEC
The “CE” mark affixed to the equipment
means that it conforms to the above
Directives.
Heritage Statement
Lucent Technologies—formed as a result of AT&T’s planned restructuring—designs, builds, and delivers a wide range of public and private net works, communication systems and software, consumer and business
telephone systems, and microele ct ronics components. The worldrenowned Bell Laborator ie s is the rese arch and development ar m fo r the
company.
Comments
To comment o n thi s docu ment, retu rn the co mme nt card at the f ront o f the
document.
Acknowledgment
This document was devel oped by Lucent Technologies Global Learning
Solutions O rganization.
Page 4

Page 5

.........................................................................................................................................................................................................................................................
.........................................................................................................................................................................................................................................................
CentreVu®
Supervisor Version 8 Reports
iii
CentreVu
®
Supervisor Version 8
Reports
Table of Contents
Preface P-1
Conventions used P-1
Report examples P-2
1 Introduction 1-1
Overview 1-1
About CentreVu CMS and Supervisor 1-1
Interactions with switch features 1-5
How CentreVu CMS tracks ACD data 1-5
Things to Know About the System 1-6
Overview 1-6
Organization 1-6
Terminology 1-7
Terms 1-7
Prerequisite System Administration 1-9
Dictionary 1-9
Call Center Administration 1-9
User Permissions 1-9
System Setup 1-9
Relationships to Other Subsystems 1-10
Timetable 1-10
CMS 1-10
Dictionary 1-10
Exceptions 1-10
Scripting 1-10
User Permissions 1-11
Things to Know About CentreVu Supervisor Reports 1-12
Overview 1-12
Organization 1-12
Agent and Trunk States 1-13
Page 6

.........................................................................................................................................................................................................................................................
CentreVu®
CMS R3V8 Upgrades and Migration
Agent states 1-13
Trunk states 1-15
Refresh Rate for Real-Time and Integrated Reports 1-16
Fastest allowable refresh rate 1-16
Default refresh rate 1-16
Shortest refresh rate 1-16
Historical Data in Integrated Reports 1-16
2 Using CentreVu Supervisor Reports 2-1
Overview 2-1
How to access reports 2-1
How this chapter is organized 2-1
Selecting and Running Reports 2-2
Overview 2-2
Report Designer 2-2
Using the Scripting feature 2-3
CentreVu Supervisor Controller toolbar 2-3
Report Selector 2-3
Report output window 2-3
Script buttons 2-3
Selecting a Report 2-4
Running a Report 2-6
Types of input 2-6
Selecting Report Run Dates 2-8
Selecting Dates 2-8
Browse Date 2-8
Browse Dates 2-9
Browse Month 2-9
Browse Months 2-10
Selecting Report Run Times 2-11
Selecting times 2-11
Browse Time 2-11
Exiting and Restarting Reports 2-12
How to exit a report 2-12
How to restart a report 2-12
iv
Report Menu Bar 2-13
Overview 2-13
Report 2-14
Report menu 2-14
Menu item functions 2-15
Page 7

Save as HTML 2-17
Browsers 2-17
Selecting Save as HTML location 2-17
Output files 2-19
Templates 2-19
Not using templates 2-19
Using existing templates 2-20
Save as HTML template tags 2-20
Fonts 2-20
Print Preview 2-21
Access Print Preview 2-21
Print Preview dialog box 2-21
Print Preview fields 2-22
Edit 2-24
Edit menu 2-24
Menu item functions 2-24
Format 2-26
Format menu 2-26
Menu item functions 2-26
Tools 2-27
Tools menu 2-27
Menu item functions 2-27
Options 2-28
Options menu 2-28
Menu item functions 2-28
CentreVu®
CMS R3V8 Upgrades and Migration
v
Editing and Viewing Reports 2-29
Overview 2-29
Organization 2-29
Report Layouts 2-30
Report types 2-30
What constitutes a report? 2-30
Tables 2-30
Charts 2-31
Formatting Table Reports 2-32
Accessing the Table Format Options window 2-32
General tab 2-32
General ta b parameters 2-33
Sort tab 2-33
Using the Sort tab 2-34
Formatting Chart Reports 2-35
Accessing the Chart Format Options window 2-35
General tab 2-36
General tab input fields 2-36
Page 8

3D Effects tab 2-37
3D Effects tab input fields 2-38
Axis tab 2-39
Axis tab input fields 2-39
Type tab 2-40
Type tab input fields 2-40
Title tab 2-41
Title tab input fields 2-41
Legend tab 2-42
Legend tab input fields 2-42
Data Labels tab 2-43
Data Labels tab input fields 2-43
Minimizing Report Output Windows 2-45
Icons associated with minimized report windows 2-45
Icons associated with minimized report thresholds 2-46
Right mouse button pop-up menus 2-47
Menus displayed 2-47
Rotating a 3D chart 2-49
Exporting Report Data 2-50
Defaults 2-50
Report format 2-50
Copying Chart Reports 2-53
Resizing Report Windows and Columns 2-54
Resizing a window 2-54
Standard Supervisor report window 2-54
Graphical report window 2-54
Changing a column width 2-54
Selecting a Printer 2-55
Print setup options 2-55
Setting Up a Page 2-57
Page setup options 2-57
Setting Report Threshold Highlights 2-59
Reports 2-59
Entities 2-59
Turn highlights on and off 2-59
Example 2-59
Set Report Threshold Highlights 2-60
Before you start 2-60
Tips for Setting Report Threshold Highlights 2-63
Tips for setting report threshold highlights 2-63
Available Agent Threshold Settings 2-65
Agent threshold settings 2-65
Available Split/Skill Threshold Settings 2-68
Split/skil l threshold se ttings 2-68
CentreVu®
CMS R3V8 Upgrades and Migration
vi
Page 9

.........................................................................................................................................................................................................................................................
CentreVu®
CMS R3V8 Upgrades and Migration
Available VDN Threshold Settings 2-71
VDN threshold settings 2-71
Report Options 2-73
Functions 2-73
Options General Tab 2-74
Options general tab 2-7 4
Options Report Colors Tab 2-76
Options report colors tab 2-76
Options Threshold Colors Tab 2-78
Options threshold colors tab 2-78
Options Name Format Tab 2-79
Options name format ta b 2-79
Create a New Report Color Scheme 2-81
Procedure 2-81
Create a New Threshold Color Scheme 2-84
Procedure 2-84
Create a New Name Format 2-87
Procedure 2-87
vii
3 Real-Time Reports 3-1
Overview 3-1
Introduction 3-1
Organization of Real-Time Reports 3-1
Presentation 3-2
Diagram of Real-Time reporting system 3-2
Agent reports 3-4
Overview 3-4
Organization 3-4
General Information About Agent Reports 3-5
What an Agent report contains 3-5
Organization of Agent reports 3-5
Agent report selector window 3-5
Agent Report Input Windows 3-6
Agent report input fields 3-6
3-6
Agent Group Report 3-7
Things to know about this report 3-7
Agent Group report example 3-7
Agent Group report input fields 3-7
Agent Group report description 3-8
Agent Report 3-10
Page 10

Things to know about this report 3-10
Agent report example 3-10
Agent report input fields 3-10
Agent report description 3-11
Agent Information Report 3-13
Things to know about this report 3-13
Agent Information report example 3-14
Agent Information report description 3-14
Graphical Information Report 3-17
Things to know about this report 3-17
Graphical Information report example 3-18
Graphical Information report description 3-18
Other Reports 3-22
Overview 3-22
Organization of this section 3-22
General Information About Othe r Report s 3-23
What Other reports contain 3-23
Organization of Other reports 3-23
Other report selector window 3-23
Event Count Summary Report 3-24
Things to know about this report 3-24
Relationships to other subsystems 3-24
Event Count Summary input window 3-24
Event Count Summary input fields 3-25
Event Count Summary report example 3-25
Event Count Summary report description 3-26
Multi-ACD Report 3-27
Things to know about this report 3-27
Multi-ACD report input window 3-28
Multi-ACD report Input Fields 3-29
Multi-ACD report example 3-30
Multi-ACD report description 3-30
Multi-ACD Top Agent Report 3-35
Things to know about this report 3-35
Multi-ACD Top Agent report input window 3-36
Multi-ACD Top Agent report Input Fields 3-36
Multi-ACD Top Agent report example 3-37
Multi-ACD Top Agent report description 3-38
CentreVu®
CMS R3V8 Upgrades and Migration
viii
Queue/Agent Reports 3-41
Overview 3-41
Organization of this section 3-41
General Information About Queue/Age n t Repor ts 3-42
Page 11

What Queue/Agent reports contain 3-42
Organization of Queue/Agent reports 3-42
Queue/Agent Report Select or Window and Input Fields 3-43
Queue/Agent report selector window 3-43
Queue/Age nt report inpu t fields 3-44
Queue/Top Agent Status Report 3-45
Things to know about this report 3-45
Queue/Top Agent Status report example 3-45
Queue/Top Agent Status re port description 3-46
Queue/Agent Status Report 3-50
Things to know about this report 3-50
Queue/Agent Status report example 3-50
Queue/Agent Status report description 3-51
Queue/Agent Summary Report 3-55
Things to know about this report 3-55
Queue/Agent Summary report example 3-55
Queue/Agent Summary report description 3-56
CentreVu®
CMS R3V8 Upgrades and Migration
ix
Split/Skill Reports 3-58
Overview 3-58
Organization of this section 3-58
General Information About Spli t/ Ski ll Report s 3-59
Organization of split/skill reports 3-59
Split/Skill Report Selector Window and Input Fields 3-60
Split/Skill report selector window 3-60
Split/skill report input fields 3-60
Split/Skill Call Profile Report 3-62
Things to know about this report 3-62
Split/Skill Call Profile report example 3-62
Split/Skill Call Profile report description 3-63
Real-Time Graphical Active Agents Report 3-65
Things to know about this report 3-65
Graphical Active Agents report example 3-66
Graphical Active Agents report description 3-66
Real-Time Graphical Allocated Agents Report 3-69
Things to know about this report 3-69
Graphical Allocated Agents report example 3-70
Graphical Allocated Agents report description 3-71
Split/Skill Graphical AUX Agents Report 3-73
Things to know about this report 3-73
Report formats 3-73
Split/Skill Graphical AUX Agents report example 3-74
Split/Skill Graphical AUX Agents report description 3-74
Split/Skill Graphical AUX Top Agents Report 3-76
Page 12

Things to know about this report 3-76
Split/Skill Graphical AUX Top Agents report example 3-77
Split/Skill Graphical AUX Top Agents report description 3-77
Split/Skill Graphical Call Profile Report 3-79
Things to know about this report 3-79
Split/Skill Graphical Call Profile report example 3-80
Split/Skill Graphical Call Profile report description 3-80
Split/Skill Graphical EWT Report 3-83
Things to know about this report 3-83
Split/Skill Graphical EWT report example 3-84
Split/Skill Graphical EWT report description 3-84
Split/Skill Graphical Queue Report 3-86
Things to know about this report 3-86
Split/Skill Graphical Queue report example 3-87
Split/Skill Graphical Queue report description 3-87
Split/Skill G raphical Skill Overload R eport 3-89
Things to know about this report 3-89
Split/Skill Graphical Skill Overload report example 3-90
Split/Skill G raphical Skill Overload report description 3-90
Split/Skill Graphical Staffing Profile Report 3-91
Things to know about this report 3-91
Split/Skill Graphical Staffing Profile report example 3-92
Split/Skill Graphical Staffing Profile report description 3-92
Split/Skill Graphical Status Report 3-95
Things to know about this report 3-95
Split/Skil l Graphical S tatus report example 3-96
Split/Skill Graphical Status report description 3-96
Split/Skill Graphical Top Skill Status Report 3-99
Things to know about this report 3-99
Split/Skill Graphical Top Skill Status report example 3-100
Split/Skill Graphical Top Skill Status report description 3-101
Reserve1 AUX Agents Report 3-104
Things to know about this report 3-104
Reserve1 AUX Agents report example 3-105
Reserve1 AUX Agents report description 3-105
Reserve2 AUX Agents Report 3-108
Things to know about this report 3-108
Reserve2 AUX Agents report example 3-109
Reserve2 AUX Agents report description 3-109
Skill AUX Report 3-112
Things to know about this report 3-112
Skill AUX report example 3-112
Skill AUX report description 3-113
Skill Status Report 3-114
CentreVu®
CMS R3V8 Upgrades and Migration
x
Page 13

Things to know about this reports 3-114
Skill Status report example 3-116
Skill Status report description 3-116
Skill Top Agent Report 3-120
Things to know about this report 3-120
Skill Top Agent report example 3-120
Skill Top Agent report description 3-121
Split Status Report 3-125
Things to know about this report 3-125
Split Status report example 3-127
Split Status report description 3-127
Split/Skill Report 3-130
Things to know about this report 3-130
Split/Skill report example 3-131
Split/Skill report description 3-131
Split/Skill by Location Report 3-134
Things to know about this report 3-134
Split/Skill by Location report example 3-134
Split/Skill by Location report description 3-135
Split/Skill Top Agent Status Report 3-136
Things to know about this report 3-136
Split/Skill Top Agent Status report example 3-136
Split/Skill Top Agent Status report description 3-137
Split/Skill Agent Status by Location Report 3-140
Things to know about this report 3-140
Split/Skill Agent Status by Location report example 3-141
Split/Skill Agent Status by Location report description 3-141
CentreVu®
CMS R3V8 Upgrades and Migration
xi
Trunk Group Report 3-144
Overview 3-144
Organization of this section 3-144
Trunk Group Report Selector Window and Input Fields 3-145
Trunk Group report selector window 3-145
Trunk Group report input fields 3-145
Trunk Group Report 3-146
Things to know about this report 3-146
Trunk Group report example 3-146
Trunk Group report description 3-146
VDN Reports 3-148
Overview 3-148
Organization of this section 3-148
General Information About VDN Reports 3-149
Organization of VDN reports 3-149
Page 14

VDN Report Selector Window and Input Fields 3-150
VDN report selector window 3-150
VDN report input fields 3-150
VDN Call Profile Report 3-152
Things to know about this report 3-152
Prerequisite System Administration 3-152
VDN Call Profile report example 3-153
VDN Call Profile report description 3-153
VDN Graphical Call Profile Report 3-156
Things to know about this report 3-156
VDN Graphical Call Profile report example 3-157
VDN Graphical Call Profile report description 3-157
VDN Skill Preference Report 3-159
Things to know about this report 3-159
VDN Skill Preference report example 3-159
VDN Skill Preference report description 3-160
VDN Report 3-161
Things to know about this report 3-161
VDN report example 3-161
VDN report description 3-162
CentreVu®
CMS R3V8 Upgrades and Migration
xii
Vector Report 3-164
Overview 3-164
Organization of this section 3-164
Vector Selector Window and Input Fields 3-165
Vector report selector window 3-165
Vector report input fields 3-165
Vector Report 3-166
Things to know about this report 3-166
Vector report example 3-166
Vector report description 3-166
Drill-Down Reports 3-168
Overview 3-168
Organization of this section 3-168
General In formation About Drill-D own Reports 3-169
Drill-down report access 3-169
Location ID as a report field 3-169
Finding dr ill-down inf ormation 3-169
Drill-Down report types 3-169
Modifying drill-down reports 3-169
Drill-Down Top Agent Work State Report 3-170
Accessing the report 3-170
Report contents 3-170
Page 15

.........................................................................................................................................................................................................................................................
CentreVu®
CMS R3V8 Upgrades and Migration
Report use 3-170
Database items 3-170
Drill-down Top Agent Work State report example 3-171
Drill-down Top Agent Work State report description 3-172
Drill-Down Work State Report 3-174
Accessing the report 3-174
Report contents 3-174
Report Use 3-174
Database Items 3-174
Drill-down Work State report example 3-175
Drill-down Work State report description 3-176
4 Historical Reports 4-1
Overview 4-1
Introduction 4-1
Organization of Historical Reports 4-1
Presentation 4-1
Diagram of historical reporting system 4-2
Presentati on of report information 4-3
How long does CMS store data? 4-3
xiii
Agent Reports 4-4
Overview 4-4
Organization 4-4
General Information About Agent Reports 4-5
What an Agent report contains 4-5
Organization of Agent reports 4-5
Agent Report selector window 4-6
Agent Report Input Fields 4-7
Agent report input fields 4-7
Agent AUX Report 4-9
Things to know about this report 4-9
Agent AUX report examp le 4-9
Agent AUX report description 4-10
Agent Attendance Report 4-11
Things to know about this report 4-11
Agent Attendance report example 4-11
Agent Attendance report description 4-12
Agent Event Count Report 4-14
Things to know about this report 4-14
Agent Event Count report example 4-14
Agent Event Count report description 4-15
Agent Graphical Time Spent Daily Report 4-16
Page 16

Things to know about this report 4-16
Agent Graphical Time Spent Daily report example 4-17
Agent Graphical Time Spent Daily report description 4-17
Agent Group Attendance Report 4-20
Things to know about this report 4-20
Agent Group Attendance report example 4-20
Agent Group Attendance report description 4-21
Agent Group AUX Report 4-23
Things to know about this report 4-23
Agent Group AUX report example 4-23
Agent Group AUX report description 4-24
Agent Group Summary Report 4-25
Things to know about this report 4-25
Agent Group Summary report example 4-25
Agent Group Summary report description 4-26
Agent Inbound/Outbound Report 4-29
Things to know about this report 4-29
Agent Inbound/Outbound report example 4-29
Agent Inbound/Outbound report description 4-30
Agent Login/Logout (Skill ) Report 4-33
Things to know about this report 4-33
Agent Login/Logout (Skill ) report example 4-34
Agent Login/Logout (Skill) report description 4-34
Agent Login/Logout (Split ) Report 4-35
Things to know about this report 4-35
Agent Login/Logout (Split ) report example 4-35
Agent Login/Logout (Split) report description 4-36
Agent Split/Skill Report 4-37
Things to know about this report 4-37
Agent Split/Skill report example 4-37
Agent Split/Skill report description 4-38
Agent Summary Report 4-40
Things to know about this report 4-40
Agent Summary report example 4-40
Agent Summary report description 4-40
Agent Trace by Location Report 4-44
Things to know about this report 4-44
Agent Trace by Location report example 4-44
Agent Trace by Location report description 4-44
CentreVu®
CMS R3V8 Upgrades and Migration
xiv
Other Reports 4-47
Overview 4-47
Organization 4-47
General Information About Othe r Report s 4-48
Page 17

What an Other Report contains 4-48
Organization of Other reports 4-48
Other report selector window 4-48
Call Records Report 4-49
Things to know about this report 4-49
Call Records report input fields 4-50
Call Records report example 4-50
Call Records report description 4-51
Call Work Code Report 4-54
Things to know about this report 4-54
Prerequisite system administration 4-54
Call Work Code report input fields 4-55
Call Work Code report example 4-55
Call Work Code report description 4-56
Split/Skill Reports 4-57
Overview 4-57
Organization 4-57
General Information About Spli t/ Ski ll Report s 4-58
What a Split/Skill Report contains 4-58
Organization of Split/Skill reports 4-58
Split/Skill report selector window 4-58
Split/Skill Report Input Fields 4-59
Split/Skill report input fields 4-59
Split/Skill Call Profile Report 4-61
Things to know about this report 4-61
Split/Skill Call Profile report example 4-61
Split/Skill Call Profile report description 4-62
Split/Skill Graphical ASA Report 4-64
Things to know about this report 4-64
Split/Skill Graphical ASA report example 4-65
Split/Skill Graphical ASA report description 4-65
Split/Skill Graphical Average Positions Staffed Report 4-66
Things to know about this report 4-66
Split/Skill Graphical Average Positions Staffed report example 4-67
Split/Skill Graphical Average Positions Staffed report description 4-67
Split/Skill Graphical ASA Daily Report 4-68
Things to know about this report 4-68
Split/Skill Graphical ASA Daily report example 4-69
Split/Skill Graphical ASA report description 4-69
Split/Skill Graphical Call Profile Report 4-70
Things to know about this report 4-70
Split/Skill Graphical Call Profile report example 4-71
Split/Skill Graphical Call Profile report description 4-71
CentreVu®
CMS R3V8 Upgrades and Migration
xv
Page 18

Split/Skill Graphical Multi-ACD Service Level Report 4-73
Things to know about this report 4-73
Split/Skill Graphical Multi-ACD Service Level report input window 4-73
Split/Skill Graphical Multi-ACD Service Level report input fields 4-74
Split/Skill Graphical Multi-ACD Service Level report example 4-75
Split/Skill Graphical Multi-ACD Service Level report description 4-75
Split/Skill Graphical Service Level Report 4-76
Things to know about this report 4-76
Split/Skill Graphical Service Level report example 4-76
Split/Skill Graphical Service Level report description 4-77
Split/Skill G raphical Skill Overload R eport 4-78
Things to know about this report 4-78
Split/Skill Graphical Skill Overload report example 4-78
Split/Skill G raphical Skill Overload report description 4-79
Split/Skill Graphical Time Spent Report 4-80
Things to know about this report 4-80
Split/Skill Graphical Time Spent report example 4-81
Split/Skill Graphical Skill Time Spent report description 4-81
Split/Skill Outbound Report 4-83
Things to know about this report 4-83
Split/Skill Outbound report example 4-83
Split/Skill Outbound Report Description 4-84
Split/Skill Report 4-86
Things to know about this report 4-86
Split/Skill report example 4-86
Split/Skill report description 4-87
Split/Skill by Location Report 4-90
Things to know about this report 4-90
Split/Skill by Location report example 4-90
Split/Skill report description 4-91
Split/Skill Summary Report 4-95
Things to know about this report 4-95
Split/Skill Summary report example 4-96
Split/Skill Summary report description 4-96
CentreVu®
CMS R3V8 Upgrades and Migration
xvi
System Reports 4-101
Overview 4-101
Organization 4-101
General Information About System Reports 4-102
What a System report contains 4-102
Organization of System reports 4-102
System Report selector window 4-102
System Graphical Maximum Delay Report 4-103
Things to know about this report 4-103
Page 19

Graphical Maximum Delay report input window 4-103
System report input fields 4-104
System Graphical Maximum Delay report example 4-105
System Graphical Maximum Delay report description 4-105
System Multi-ACD by Split/Skill Report 4-107
Things to know about this report 4-107
Multi-ACD by Split/Skill report input w indow 4- 108
Multi-ACD by Split/Skill report input fi elds 4-109
System Multi-ACD by Split/Skill report example 4-110
System Multi-ACD by Split/Skill report description 4-110
System Multi-ACD Report 4-113
Things to know about this report 4-113
Multi-ACD report input window 4-113
Multi-ACD re port input fields 4-114
System Multi-ACD report example 4-115
System Multi-ACD report description 4-115
System Report 4-118
Things to know about this report 4-118
System report input window 4-118
System report input fields 4-119
System report example 4-120
System report description 4-120
CentreVu®
CMS R3V8 Upgrades and Migration
xvii
Trunk/Trunk Group Reports 4-124
Overview 4-124
Organization 4-124
General Information About Trunk/Trunk Group Reports 4-125
What a Trunk/Trunk Group report contains 4-125
Organization of Trunk/Trunk Group reports 4-125
Trunk/Trunk Group report selector window 4-125
Trunk/Trunk Group Report Input Fields 4-126
Trunk Group report input fields 4-126
Trunk/Trunk Group Busy Hour Report 4-128
Things to know about this report 4-128
Trunk/Trunk Group Busy Hour report example 4-129
Trunk/Trunk Group Busy Hour report description 4-129
Trunk Report 4-131
Things to know about this report 4-131
Trunk report example 4-132
Trunk report description 4-132
Trunk Group Report 4-134
Things to know about this report 4-134
Trunk Group report example 4-135
Trunk Group report description 4-135
Page 20

Trunk Group Summary Report 4-137
Things to know about this report 4-137
Trunk Group Summary report example 4-138
Trunk Group Summary report description 4-138
VDN Reports 4-141
Overview 4-141
Organization 4-141
General Information About VDN Reports 4-142
What a VDN Report contains 4-142
Organization of VDN reports 4-142
VDN report selector window 4-143
VDN Report Input Fields 4-144
VDN report input fields 4-144
VDN Busy Hour Report 4-145
Things to know about this report 4-145
VDN Busy Hour report example 4-145
VDN Busy Hour report description 4-146
VDN Call Profile Report 4-147
Things to know about this report 4-147
Prerequisite system administration 4-147
VDN Call Profile report example 4-148
VDN Call Profile report description 4-148
VDN Graphical Busy/Abandon/Disconnect Comparison Report 4-151
Things to know about this report 4-151
VDN Graphical Busy/Abandon/Disconnect
Comparison report example 4-152
VDN Graphical Call Profile report description 4-153
VDN Graphical Call Profile Report 4-154
Things to know about this report 4-154
VDN Graphical Call Profile report example 4-155
VDN Graphical Call Profile report description 4-155
VDN Graphical Service Level Report 4-158
Things to know about this report 4-158
VDN Graphical Service Level report example 4-159
VDN Graphical Service Level report description 4-159
VDN Multi-ACD Flow Report 4-161
Things to know about this report 4-161
VDN Multi-ACD Flow report example 4-161
VDN Multi-ACD Flow report description 4-162
VDN Report 4-164
Things to know about this report 4-164
VDN Report example 4-164
VDN Report description 4-165
CentreVu®
CMS R3V8 Upgrades and Migration
xviii
Page 21

.........................................................................................................................................................................................................................................................
CentreVu®
CMS R3V8 Upgrades and Migration
VDN Skill Preference Report 4-168
Things to know about this report 4-168
VDN Skill Preference report example 4-168
VDN Skill Preference report description 4-169
Vector Report 4-172
Overview 4-172
Organization 4-172
General Information About the Vector Report 4-173
Organization of the Vector Report 4-173
Vector Report selector window 4-173
Vector Report Input Fields 4-174
Vector report input fields 4-174
Vector Report 4-175
Things to know about this report 4-175
Vector report example 4-175
Vector report description 4-176
xix
5 Integrated Reports 5-1
Overview 5-1
Introduction 5-1
Definition of integrated reports 5-1
How this chapter is organized 5-1
Diagram of integrated reporting system 5-1
Presentation of repor t information 5-1
Presentation of repor t information 5-2
Historical Data in Integrated Reports 5-2
Agent Reports 5-3
Overview 5-3
Organization of this section 5-3
General Information About Agent Reports 5-4
Organization of Agent reports 5-4
Agent Report Selector Window and Input Fields 5-5
Agent report selector window 5-5
Agent report input fields 5-6
Agent Graphical Information Report 5-7
Things to know about this report 5-7
DEFINITY ECS R5 and later information 5-8
Agent Graphical Information repor t example 5-8
Agent Graph ical Inform ation report description 5-8
Agent Information Report 5-13
Page 22

.........................................................................................................................................................................................................................................................
CentreVu®
CMS R3V8 Upgrades and Migration
Things to know about this report 5-13
Agent Information report example 5-14
Agent Information report description 5-14
Split/Skill Reports 5-17
Overview 5-17
General Information About Spli t/ Ski ll Report s 5-18
Organization of this section 5-18
Organization of Split/Skill reports 5-18
Split/Skill Reports Selector Window and Input Fields 5-19
Split/Skill reports selector window 5-19
Split/Skill report input fields 5-19
Split/Skill Comparison Report 5-21
Things to know about this report 5-21
Split/Skill Comparison report example 5-21
Split/Skill Comparison report description 5-22
Graphical Skill Overload Report 5-24
Things to know about this report 5-24
Graphical Skill Overload report example 5-24
Graphical Skill Overload report description 5-25
Graphical Split/Skill View Report 5-26
Things to know about this report 5-26
Graphical Split/Skill View report example 5-26
Graphical Split/Skil l View report description 5-27
xx
VDN Report 5-30
Overview 5-30
Organization of this section 5-30
General Information About the VDN Report 5-31
VDN Report selector window 5-31
VDN Report input fields 5-32
VDN Graphical Call Handling Report 5-33
Things to know about this report 5-33
VDN Graphical Call Handling report example 5-34
VDN Graphical Call Handling report description 5-34
Appendix A:Database Items and Calculations A-1
Overview A-1
Page 23

.........................................................................................................................................................................................................................................................
.........................................................................................................................................................................................................................................................
GL Glossary GL-1
IN Index IN-1
CentreVu®
CMS R3V8 Upgrades and Migration
xxi
Page 24

CentreVu®
CMS R3V8 Upgrades and Migration
xxii
Page 25

Preface
CentreVu®
Supervisor Version 8 Reports
P-1
Preface
Purpose This book describes the Call Center reports that are generated through the
CentreVu
The book includes:
• A description of each
• An example of each
• Definitions of all report fields
• Tips for customizing specific
Supervisor software.
CentreVu
CentreVu
Supervisor report
Supervisor report
CentreVu
Supervisor reports.
Reason for reissue This document is being rei ssued to comply with
System (CMS) Release 3 Version 8 (R3V8) and
Release 8 (R8).
Safety labe ls The following icon signifies a caution, warning, or danger condition.
Intended-Audience The
written for users who analyze t he available r eports and use the m to ef ficiently
run their call centers.
How to use this
document
The following list describes the contents of each chapt er and appendix in this
document:
CentreVu
Supervisor Version 8 Reports (585-210-929) document is
• Chapter 1, Introduction
• Chapter 2, Using
CentreVu
Supervisor reports
• Chapter 3, Real-time reports: show snapshots of call center acti vity
throughout the day
• Chapter 4, Historical reports: compile call center inf ormatio n in 15- , 30-,
or 60-minute intervals. The interval information is then converted into
daily, weekly, and monthly summary data.
• Chapter 5, Integrated reports: compile call cent er information from a
specified start time in the past 24 hours up to and including the current
interval.
• Appendix A, Database items and calculations
CentreVu
CentreVu
Call Management
Supervisor
Conventions used The following conventions are used throughout this document:
• A Book Title is italicized.
• An Informix table name is in monospaced type.
• A “Chapter Name” is always surrounded by quotes.
Page 26

Preface
CentreVu®
Supervisor Version 8 Reports
P-2
• A
File name
is in monospaced type.
• A Subsystem Reference is a lwa y s in in it ia l ca p i ta l le tt e rs .
• A Window Title is always in initial capital letters.
Related documentation The following documents can help you use the CentreVu
to its maximum capability. Those most closely related to this document
are the Administration and Report Designer documents.
•
CentreVu Call Management System Release 3 Vers ion 8
Administration (585-210-910)
•
CentreVu Advocate User Guide (585-210-927)
•
CentreVu CMS R3V5 Custom Reports (585-215-822, Issue 2)
•
CentreVu CMS R3V8 External Call History Interface (585-210-912)
•
CentreVu CMS R3V8 Upgrades and Migrations (585-210-913)
•
CentreVu CMS R3V6 Sun Microsystems, Inc. Sun Sun
Microsystems, Inc.Enterprise
and Setup (585-215-873, Issue 2)
•
CentreVu CMS R3V6 Sun Enterprise Computers Connectivity
Diagram (585-215-877, Issue 2)
•
CentreVu Supervisor Version 8 Installation and Getting Started
(585-210-928)
•
Lucent Call Center Change Description (585-210-925)
•
CentreVu CMS R3V8 Database Items and Calculations (585-210-
939)
•
CentreVu Report Designer Version 8 User Guide (585-210-930)
•
CentreVu CMS R3V8 Documentation CD-ROM (585-210-926)
Computers Hardware Installation
CMS software
Report examples The report examples included in this document were taken from test lab
machines and are not intended t o emulate real data. Report data will vary
dependent on your individual site.
Page 27

Introduction
Overview 1-1
CentreVu®
Supervisor Version 8 Reports
1 Introduction
Overview
........................................................................................................................................ .................................................................................................................
Purpose This chapter is written for any
About CentreVu
CMS and Supervisor
CentreVu
accesses the Real-T ime, Historical, and Integrated reports subsystems. It
outlines how reporting works and the reports that are available.
Call Center reports are generat ed throu gh the
CentreVu
The
data from the switch. This data is then organized into reports that help you
manage Call Center facilities and pers onnel. These reports may be di splayed
in real time, print ed immediat ely, stored in a file, or schedul ed for pr inting at a
later time.
The data tracked includes caller identification, service parameters, internal
call transfers, outgoing calls, and agent sales. Real-time reports can be
updated as often as every three seconds and summarized as often as every
15 minutes. Historical reports are available in intervals of 15, 30, or 60
minutes; daily; weekly; and monthly summaries. Integrated reports include
data for a specified start time in the past 24 hours up to and including the
moment the report is generated.
CentreVu
One
pairs in up to eight switches Automatic Call Directories (ACDs) at different
locations. This permits you to add agents in new locat ions while maintaining
centralized supervision to control costs.
You can use
Supervisor software monitors the operations of and collects
CMS can manage up to 10,000 agent/split/skill or agent/skill
CentreVu
reports to do the following:
Supervisor Release 8 user who
CentreVu
Supervisor software.
• Determine how many agents are needed
• Manage call volume fluctuations
• Configure the software to make changes automatically and to meet
unexpected demands
• Change agent skill assignments
• Move agents between skills and/or initiate agent audit trails.
• Change Vector Directory Numbers (VDNs) to vector associations.
About CentreVu CMS and Supervisor (1-1)“ lists the CentreVu Super visor
“
reports that are available. The remaining chapters of this document giv e you
an overview and an example of each report. The reports you see depend on
your switch type, permissions, and system performanc e.
Page 28

Introduction
Overview 1-2
CentreVu®
Supervisor Version 8 Reports
Table 1-1
CentreVu
Reports
Report Name Real-Time Historical Integrated
Agent Attendance •
Agent AUX •
Agent Event Count •
Agent Graphical Information •
Agent Graphical Time Spent •
Agent Group Attendance •
Agent Group AUX •
Agent Group Summary •
Agent Group Report •
Agent Inbound/Outbound •
Agent Information •
Agent Login/Logout (Skill) •
Agent Login/Logout (Split) •
Agent Split/Skill •
Agent Status by Location •
Agent Summary •
Agent Report •
Agent Trace by Locat ion •
Busy Hour by Trunk Group •
Busy Hour by VDN •
Call Record •
Call Work Code •
Event Count Summary •
Graphical Active Agents •
Graphical Allocated Agents •
Graphical AUX Reserve1 Agents •
Graphical AUX Reserve2 Agents •
Graphical Average Positions Staffed •
Page 29

Introduction
Overview 1-3
CentreVu®
Supervisor Version 8 Reports
Report Name Real-Time Historical Integrated
Graphical Busy/Abandon/ Disconnect •
Graphical Maximum Delay •
Graphical Multi-ACD Service Level Daily •
Graphical Queue •
Graphical Split/Skill Call Profile •
Graphical Staffing Profile •
Graphical VDN Call Profile •
VDN Call Handling •
Graphical Skill Overload •
Graphical Split/Skill V iew •
Multi-ACD • •
Multi-ACD by Split/Skill •
Multi-ACD Call Flow by VDN •
Multi-ACD Top Agent •
Outbound Split/Skill •
Queue/Agent Status •
Queue/Top Agent Status •
Queue/Agent Summary •
Reserve1 AUX Agents •
Reserve2 AUX Agents •
Skill AUX Report •
Skill Status •
Skill Top Agent Report •
Split Status •
Split/Skill Report • •
Split/Skill Average Speed of Answer •
Split/Skill by Location •
Split/Skill Call Profile • •
Split/Skill Comparison •
Page 30

Introduction
Overview 1-4
CentreVu®
Supervisor Version 8 Reports
Report Name Real-Time Historical Integrated
Split/Skill Graphical AUX Agents •
Split/Skill Graphical AUX Top Agents •
Split/Skill Graphical Call Profile • •
Split/Skill Graphical EWT •
Split/Skill Graphical Service Level •
Split/Skill Graphical Status •
Split/Skill Graphical Time Spent •
Split/Skill Graphical Top Skill Status •
Split/Skill Outbound •
Split/Skill Queue •
Split/Skill Service Level •
Split/Skill Status •
Split/Skill Summary •
System •
System Multi-ACD •
System Multi-ACD by Split/Skill •
Top Agent Status •
Trunk •
Trunk Group • •
Graphical Split/Skill •
Trunk Group Summary •
VDN Multi-ACD Flow •
VDN Report • •
VDN Call Profile • •
VDN Service Level •
VDN Skill Preference • •
Vector • •
Work State Report for Reserve1 Agents •
Work State Report for Reserve2 Agents •
Page 31

Introduction
Overview 1-5
CentreVu®
Supervisor Version 8 Reports
Interactions with switch
features
CentreVu
How
tracks ACD data
CMS
See the
Calculations
System R3V8 Administration (585-210-910)
interactions with switch features.
Using the data in the real-time and historical databases,
can generate standard reports which allow you t o track your call center’s
activities.
group, vector, and VDN activities at different points in the call process.
See Chapter 1 in the
Administration (585-210-910)
CentreVu® Call Management System R3V8 Database Items and
(585-210-939) document or the
CentreVu
CMS tracks the various agent, split/skill, trunk, trunk
CentreVu Call Management
document for the
CentreVu
CMS
CentreVu Call Management System R3V8
document for more information.
Page 32

Introduction
Things to Know About the System 1-6
CentreVu®
Supervisor Version 8 Reports
Things to Know About the System
Overview
.........................................................................................................................................................................................................................................................
Purpose This section introduces concepts and requirements that are relevant to
reports.
Organization This section contains the following information:
• Terminology
• Prerequisite system administration
• Relationship to other subsystems
Page 33

Introduction
Terminology 1-7
CentreVu®
Supervisor Version 8 Reports
Terminology
........................................................................................................................................ .................................................................................................................
Overview The following terms are used throughout this book. For additional
CentreVu
CMS terms, see the Glossary.
Terms Current Interval
or 60 minutes. The current interval is part of the real-time
database.
Custom Reports See the CentreVu CMS R3V5 Custom Reports
document, Lucent Technolo gies (585-215-822), Issue 2, for more
information.
Designer Reports Real-time or historical reports that have been
customized from existing repo rts or designed according to your
needs from Report Wizard or Report Designer. See the CentreVu
Version 8 Report Designer (585-210-930) document for more
information.
Daily Data Interval data that have been converted to a 1-day
summary .
Exception Reports Display occurrences of unusual call-handling
events.
Historical Database Contains intr ahour reco rds for up to 62 days in
the past, daily records for up to 5 years in the past, and weekly or
monthly records for up to 10 years for each
measured agent, split/skill, trunk, trunk group, vector, and Vector
Directory Number (VDN).
The current intrahour interval which can be 15, 30,
CentreVu
CMS-
Historical Reports Display past Automatic Call Distribution (ACD)
data for various agent, spl it/skill, trunk, trun k group, vect or, or VDN
activities.
Integrated Reports Compile call center information from a
specified start time in the past 24 hours up to and including the
current interval.
Page 34

Introduction
Terminology 1-8
Monthly Data Daily data that have been converted to a monthly
CentreVu®
Supervisor Version 8 Reports
summary.
Multiuser Mod e Any administered
CentreVu
CMS user can log into
CentreVu CMS. Data continues to be collected if data collection is
“on.”
Previous Interval One intrahour interval. At the end of each
intrahour interval, the contents of the current intrahour interval are
copied to the previous intrahour interval portion of the real-time
database.
Real-Time Da ta b ase Current and previous intrahour data on each
CentreVu
CMS-measured agent, split/skill, trunk, trunk group,
vector, and VDN.
Real-Time Reports Display current ACD call activity on agents,
splits/skills, trunks, trunk groups, vectors, and VDNs.
Single-User Mode Only one person can log into CentreVu CMS.
Data continues to be collected if data collection is “on.” This mode
is required to change some
Subsystem Each
CentreVu
CentreVu
CMS administration.
Supervisor Controller selection. For
example, Reports is referred to as a subsystem.
Weekly Data Daily data that has been converted to a weekly
summary.
Page 35

Introduction
Prerequisite System Administration 1-9
CentreVu®
Supervisor Version 8 Reports
Prerequisite System Administration
.........................................................................................................................................................................................................................................................
Overview The following system administration must be performed before you can
fully use the real-time and historical reports subsystem.
Dictionary If you want names to appear on split/ skill, trunk group, agent group, ACD,
call work code, VDN, and vector reports, the names must firs t be entered
in the Dictionary subsystem. If names are not assigned in the Dictionary
subsystem, numbers appear as the default.
Call Center
Administration
User Permissions For a report to display data, you must have read permission for th e spli t/
System Setup You need to specify how much of the data to save for later use by
To get Split/Skill Call Profile or VDN Call Profile reports, you must first
define your acceptable service level and ser vice level increments for the
split(s)/skill(s) and VDN(s) in the Split/Sk ill Call Profile Setup and VDN
Call Profile Setup window in the Call Center Administration subsystem.
To get an Agent Trace report, you must fi rst start collecting agent trace
data.
See the “Call Center Administration” chapter of the
R3V8 Administration
setting call profiles and activating agent trac es.
skill, trunk group, ACD, vect or, or VDN. For example, if you have read
permission for Splits 1, 2, and 4, and try to run a report on Spl its 1, 4, and
5, you receive data for Splits 1 and 4 but not for Split 5, because you do
not have read permission for that split.
For more information, see the “User Permissions” chapter of the
CentreVu® CMS R3V8 Administration
historical reports.
For more information, see the “System Setup” chapter of the
CMS R3V8 Administration
(585-210-910) document for more information on
(585-210-910) document.
(585-210-910) document.
CentreVu® CMS
CentreVu®
Page 36

Introduction
Relationships to Other Subsystems 1-10
CentreVu®
Supervisor Version 8 Reports
Relationships to Other Subsystems
.........................................................................................................................................................................................................................................................
Overview Real-Time reports have the following relationships to other
CMS subsystems.
Timetable Y ou cannot put a r eal-time repor t on a timetabl e. You can use shortcuts t o
display real-time report s. Scri pting i s used in R3V8 Supervi sor. Y ou must
use the CMS terminal to use Timetable.
See Appendix D, “Ti metable,” in the
Administration
CMS If you cancel a report in
report do not cancel in CMS. Therefore, the report continues to run on the
CMS side, even though it is canceled in
data requests clear,
result.
Dictionary For split/skill, VDN, vector, and ACD names to appear on reports, names
must be defined and entered in the Dictionary subsystem.
See Chapter 6, “Dictionary,” in the
(585-210-910) document.
Exceptions When an exception occurs,
(585-210-910) document.
CentreVu
CentreVu
Supervisor and CMS may slow down as a
CentreVu
CentreVu® CMS R3V8
Supervisor, the data requests for the
CentreVu
Supervisor. Until the
CentreVu® CMS R3V8 Administration
CMS notifies you in three ways:
CentreVu
• The terminal beeps unless you have disabled the beep through the
Supervisor Controller.
• You can see information about exception conditions by looking at
appropriate Real-Time reports.
• The Commands: Exceptions menu item in
allows you to view a running count of exceptions for Real-Tim e,
Agents, Splits/Skills , VDNs, Vectors, and Trunk Groups. To be
notified of these exceptions, you must have exception permission
turned on for the specific spli t/skill, trunk group, ACD, VDN, and
vector. Exception permissions are assigned through the
Supervisor Tools: User Permissions menu item.
CentreVu
Supervisor
CentreVu
• The exception is entered in the real-time exceptions log.
For more information, see the “Exceptions” and “User Permissions”
chapters of the
document.
CentreVu® CMS R3V8 Administration
(585-210-910)
Scripting The Scripting feature lets you create a script to run a specified report or
run a report and export the data on schedule. The scripts requi re a
customer-provided scheduler to be run at a later time.
For more information on the Scr ipting fea tur e, see Chapt er 3, “Scri pting, ”
in the
CentreVu® CMS R3V8 Administration
(585-210-910) document.
Page 37

Introduction
Relationships to Other Subsystems 1-11
CentreVu®
Supervisor Version 8 Reports
User Permissions The default real-time and integrated reports r efresh rate i s determined by
your CMS System Administrator. The administrator then assigns each
user a minimum refresh rate through the
CentreVu
Supervisor User
Permissions menu item. If you enter a refresh rate that is less than your
administrator-assigned refresh rate, an error message displays.
For more information, see the “User Permissions” chapter of the
CentreVu® CMS R3V8 Administration
(585-210-910) document.
Page 38

Introduction
Things to Know About CentreVu Supervisor Reports 1-12
CentreVu®
Supervisor Version 8 Reports
Things to Know About
CentreVu
Supervisor Reports
Overview
.........................................................................................................................................................................................................................................................
Purpose This section describes things to know about all
reports.
Organization This section contains the follow ing topics:
• Agent and Trunk States
• Refresh Rate for Real-Time and Integrated Reports
• Current Interval
• Service Level Increments for Call Profile Reports
• Items That Can Affect Real-Time and Integrated Report Data
CentreVu
Supervisor
Page 39

Introduction
Agent and Trunk States 1-13
CentreVu®
Supervisor Version 8 Reports
Agent and Trunk States
.................................................................. ................................... ...................................... ...................................................................... ................................... .....
Overview Status changes of all ACD data (for splits/skills, trunk groups, vector s,
VDNs, agents, and trunks) are sent from the switch. As a result, the
states of agent extensions and trunks are what all other data are based
on. Agent states appear on real-time reports as
the current status of the ACD, and trunk states appear on the
CMS real-time trunk report . T he f ollowi ng li st of agent states i ncludes the
default agent states. The names can be changed in the Dictionary.
CentreVu
CMS records
CentreVu
Agent states ACD
agent call. For Generic 2.1 switches (not supported with R3V5,
R3V6, or R3V8 CMS), the agent state is also ACD when a call is
waiting on hold.
Available (AVAIL) The extension is able to accept an ACD call. An
extension is AVAIL in AUTO-IN (AI) or MANUAL-IN (MI) work
modes any time a station does not have a call active or on hold.
After Call Work (ACW) The age nt is en gag ed in bookkeeping, data
entry, or other work relate d to the pr evious ca ll, an d is not ava ilable
to receive another call. The extension enters ACW after an ACD
call in the MANUAL-IN mode completes. On the Enterprise
Communications Se rve r (E C S) , th e age nt can select the state with
the ACW key. If the agent presses the ACW button while on an
ACD call, then the agent goes into ACW mode when the call is
released. This ACW time is tracked as call-associated ACW. If the
agent presses the ACW button while the agent is not on an ACD
call, then the agent will be placed into the ACW mode, but this
ACW will not be tracked as call-associated ACW. An agent’s time
in ACW includes t i me an agent is on incoming or outgoing calls
while in ACW, as well as time in ACW when the agent is not
connected to any calls.
The agent logged into this extension is on a split/skill or direct
Page 40

Introduction
Agent and Trunk States 1-14
Auxiliary Work (AUX) The agent is engaged in non-ACD work, is
CentreVu®
Supervisor Version 8 Reports
on break, in a meeting, at lunch, and so on. The ag en t p r esses th e
AUX WORK key when the agent wants
CentreVu
CMS to recognize
the extension as staffed, but does not want the ACD to distribute
calls to the voice terminal . An agent’s time in AUX includes time an
agent is on in coming or o utgoing call s while in AUX, as we ll as time
in AUX when the agent is not connected to any calls. Agents also
accrue AUX time when they make or receive extension calls from
AUTO-IN or MANUAL-IN mode. Reason codes describe the
reasons you are in the AUX work mod e (for example, you are on
break).
Direct Agent ACD (DACD) The agent is on a direct agent ACD call.
Direct Agent ACW (DACW) The agent is in the after call work state
for a direct agent ACD call.
OTHER The agent is doing other wor k. Th i s ma y r ep res en t th at a n
agent is in multiple splits or with multiple skills and is doing work for
a split or skill other th an this on e, or that the a gent has put a call on
hold, or that the agent is dialing to place a call or activate a feature.
UNKNOWN
CentreVu
CMS does not recognize the current state.
UNKNOWN remains until the conditi on is cleared (corrected) and/
or the agent completes the current ACD call and any associated
ACW, or a current agent state message is sent to
CentreVu
CMS
from the switch.
UNSTAF Unstaffed The agent is not logged in and is not being
tracked by
RINGING The time a call rings at an agent’s voice terminal after
CentreVu
CMS.
leaving the queue and before the ag ent answers the call. With this
state, you can actually determine how long a call rings before an
agent answer s, and thereby determine the act ual time a caller
waits in queue and waits while the call is ringing to better analyze
your call center’s performance.
Page 41

Introduction
Agent and Trunk States 1-15
CentreVu®
Supervisor Version 8 Reports
Trunk states IDLE
CONN The caller and agent are conn ected on a call.
QUEUED An ACD call has seized a trunk and is queued to a split
or skill waiting for an agent to answer.
SEIZED A call is using the trunk, either incoming or outgoing.
MBUSY The trunk is maintenance busy, or out of service for
maintenance purposes.
HOLD The agent has put the caller on this trunk on hold.
UNKNOWN
trunk.
DABN The caller abandoned the call. The trunk quickly goes to
idle.
FBUSY Forced busy. The caller receives forced busy signal if you
have an ECS or Generic 2 s witch with Call Vectoring. For the ECS,
you can receive busy calls if there is no call in queue for the split
and no agents are available.
The trunk is waiting for a call.
CentreVu
CMS does not recognize the state of the
FDISC The caller receives a fo rced disconnect. This appears only
if you have the Vectoring feature.
RINGING A call is ringing at the agent’s voice terminal.
Page 42

Introduction
Refresh Rate for Real-Time and Integrated Reports 1-16
CentreVu®
Supervisor Version 8 Reports
Refresh Rate for Real-Time and Integrated Reports
.........................................................................................................................................................................................................................................................
Overview When you order a real-time or integrated report, you must specify a
refresh rate for the report. This rate determines how often the report is
updated to display new data.
Fastest allowable refresh
rate
Default refresh rate The default refresh rate when you bring up the report input window is
Shortest refresh rate If you want to c alculate the shortest refresh r ates you can ge t in
Historical Data in
Integrated Reports
Your fastest allowable refresh rate is defined in the User Permissi ons—
User Data window as minimum refresh rate; see “User Permissions” in
CentreVu® CMS R3V8 Administration
the
any user, the fastest rate that may be defined is every 3 seconds .
However, the actual speed at which a report refreshes may be slower
than the defined speed, since the number of active te rminals, the number
of active windows, and the number of real-time reports can have an
impact on refresh rates.
your minimum refresh rate (defined by the CMS System Administrator)
plus 15 seconds. You can change the refresh rat e from the d efaul t at any
time, with the minimum allowable refresh rate being three seconds. The
minimum default refresh rate when a report is run as a script is userdefined.
CMS real-time reports for your configurat ion, go to the cmsadm Menu.
The Real-Time Refresh program calculates the best (shortest) refresh
rates you can get in
Once the historical CMS database is quer ied f or an int egrated repor t, t he
historical data in the report will not refresh unless you request the report
again. The real-time data will continue to refresh at the end of each
interval. Therefore, to see new historical data on an integr ated report, you
must request the report again to update the data.
CentreVu
CMS reports.
(585-210-910) document. For
CentreVu
Page 43

Using CentreVu Supervisor Reports
Overview 2-1
CentreVu®
Supervisor Version 8 Reports
2 Using
CentreVu
Supervisor Reports
Overview
.........................................................................................................................................................................................................................................................
Purpose This chapter gives you general information about how to use
How to access
reports
Supervisor reports.
summarize the performance of any measured subset of the Automatic Call
Directory (ACD), including agents, splits/skills, trunks/trunk groups, Vector
Directory Numbers (VDNs), and vectors.
No matter where you run a report from, the way you select, run, edit, and
view a report is the same.
You will find reports available under the following menus and tabs:
• Commands | Reports | Real-Time, Historical, or Integrated tab
• Commands | Dictionary | Reports tab
• Commands | Exceptions | Reports tab
• Commands | Agent Administration | Reports tab
• Commands | Call Center Administration | Reports tab
• Tools | Maintenance | Reports tab.
CentreVu
Supervisor reports display, report, and
CentreVu
How this chapter is
organized
More information
Procedures that apply to reports that are located in a specific Command or
Tool are located in the appropriate chapter in the
Administration
The chapter is divided into the followi ng sections:
• Selecting and running reports
• Report menu bar
• Editing and viewing reports
(585-210-910) guide.
CentreVu® CMS R3V8
Page 44

Using CentreVu Supervisor Reports
Selecting and Running Reports 2-2
CentreVu®
Supervisor Version 8 Reports
Selecting and Running Reports
Overview
.........................................................................................................................................................................................................................................................
Purpose This section describes how to select and run reports through
Supervisor.
Report Designer If you have Report Designer and want to easily generate a new
customized report, select the Report Wizard button in the Contr oller
toolbar.
More information
For more information about the Report Desi gner, see the
Report Designer Version 8 User Guide
(585-210-930).
CentreVu
CentreVu
Page 45

Using CentreVu Supervisor Reports
Using the Scripting feature 2-3
CentreVu®
Supervisor Version 8 Reports
Using the Scripting feature
.........................................................................................................................................................................................................................................................
Overview The Scripting feature lets you create a script to run a specified report or
run a report and export the data on schedule. The report can run in the
current
can run in the background.
More information
For more information on the Scripti ng featur e, see Chapt er 3 , “Scri pting, ”
in the
CentreVu
CentreVu® CMS R3V8 Administration
Supervisor session and be displayed on the PC, or it
(585-210-910) document.
CentreVu
Controller toolbar
Supervisor
The
CentreVu
scripting and organizing your scripts, as follows:
Supervisor Controller toolbar lets you set options for
• Options/Scripting — selecting the Scripting tab in the Options
window lets you set script execution as minimum, normal, or
maximum. This window also lets you specify a name for the log file
and view the contents of the log file.
• Scripts/Organize Scripts — selecting the Organize Scripts option
from the Scripts drop-down menu displays the Organize Scripts
window. This window displays all the logged-in user's scripts and
script folders. Using these lists, you can add a new folder, move a
script, delete a script, or rename a script.
Report Selector The Report Selector window lets you create a new script, as follows:
Save as Script button—selecting this button in the Report Selector
window displays the Save as Script dialog box, which enables you to
create a new script for the selected repor t, but does not run the report.
The script type is set to interactive and cannot be changed.
Report output window The Report Output Window menu bar lets you create a new script, as
follows:
Report/Script—selecting the Script option from the Report drop-down
menu displays the Save as Script window (only in run mode), which
enables you to create a new script for the selected report and run the
report. The script can be interactive or automatic.
Script buttons The Script button on the Data Export window displays th e Save as Script
dialog box, which lets you create a scr ipt, export the data f rom the report,
and then exit the report.
The Script button on the Save as HTML window displays the Save as
Script dialog box, which lets you created a new script for the selected
report, run the report, and save it in HTML format. The report will exit
after the save is complete.
Page 46

........................................
........................................
E
.......................................................................
........................................
........................................
Using CentreVu Supervisor Reports
Selecting a Report 2-4
CentreVu®
Supervisor Version 8 Reports
Selecting a Report
.........................................................................................................................................................................................................................................................
Displaying the Report
selector window
To display the Report Selector window, do the following:
................................................................................................................................
1 In the Controller toolbar, select Commands to display the Commands
drop-down menu.
................................................................................................................................
2 Select one of the following windows:
• Commands | Reports | Real-Time, Historical, or Integrated tab
• Commands | Dictionary | Reports tab
• Commands | Exceptions | Reports tab
• Commands | Agent Administration | Reports tab
• Commands | Call Center Administration | Reports tab
• Tools | Maintenance | Reports tab.
Making selections In the Select a Report window, do the following:
ND OF STEPS
..........................................................................................................
Result:
A window displays from which you can select a report.
................................................................................................................................
1 Select a category from the Category box.
................................................................................................................................
2 Select a report from the Report box.
Page 47

........................................
........................................
........................................
E
.......................................................................
Using CentreVu Supervisor Reports
Selecting a Report 2-5
................................................................................................................................
CentreVu®
Supervisor Version 8 Reports
3 Select the ACD for which you want to run the report from the Run
Report for ACD box.
................................................................................................................................
4 Select OK , or double-click on the report you want to run.
Result: A report input window displays.
................................................................................................................................
5 Go to Completing the Report Input Window.
ND OF STEPS
..........................................................................................................
Page 48
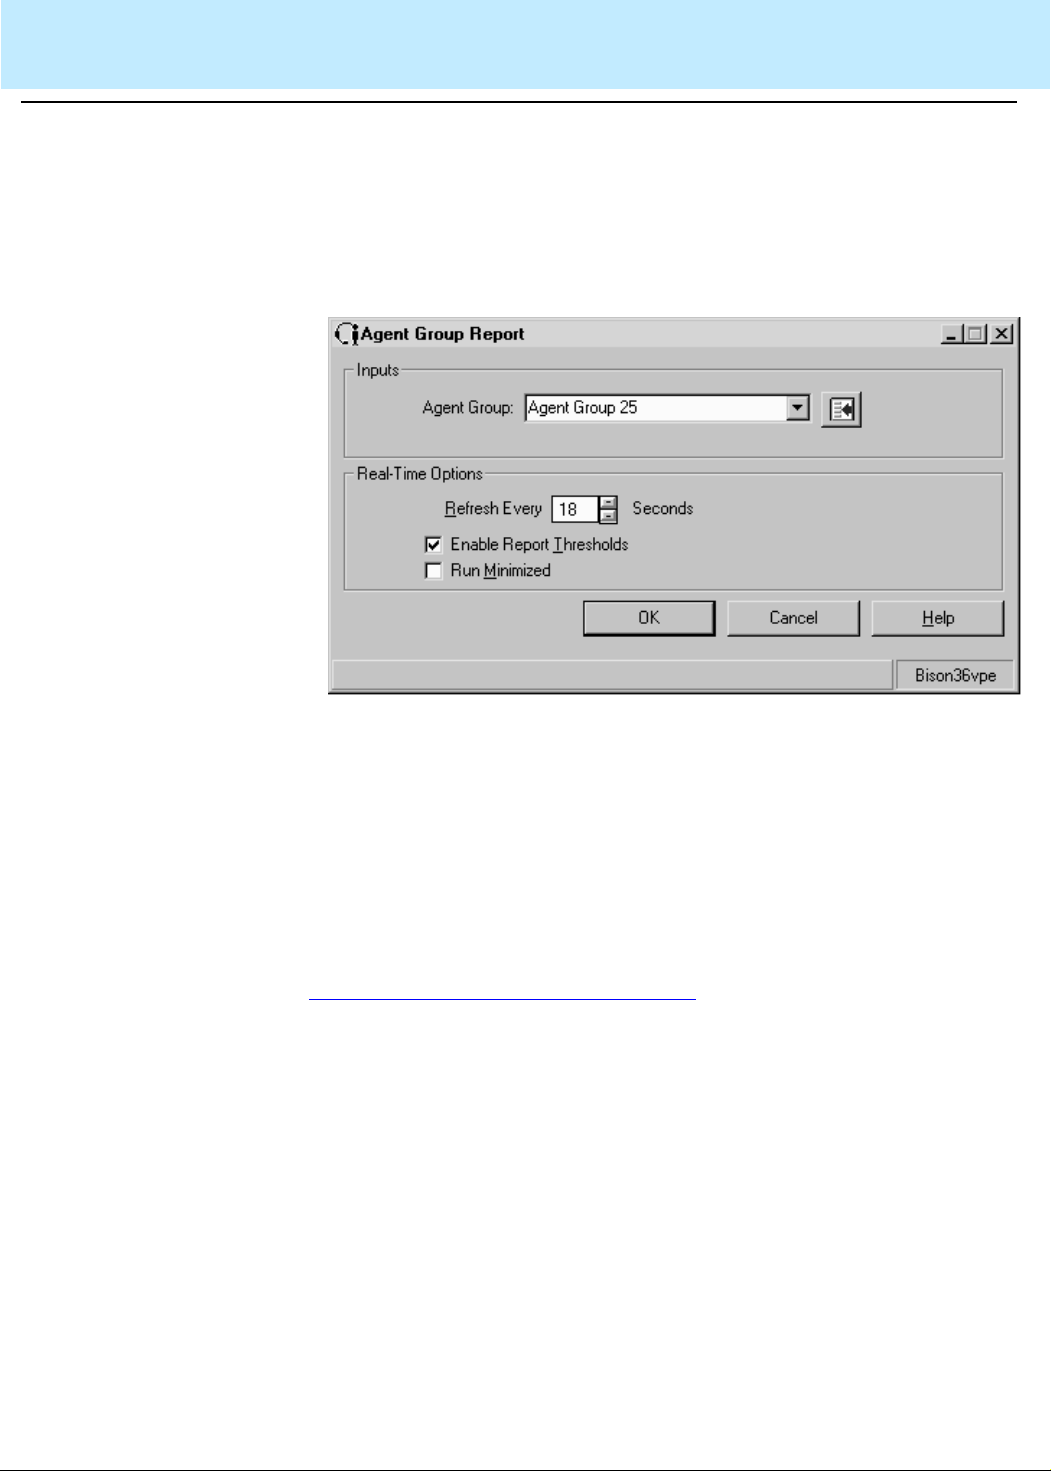
........................................
........................................
Using CentreVu Supervisor Reports
Running a Report 2-6
CentreVu®
Supervisor Version 8 Reports
Running a Report
.........................................................................................................................................................................................................................................................
Types of input The following example shows possible types of input that might be
required to run a report. The inputs required will vary, depending on
which report you are running.
Completing the report
input window
Follow these steps in completing an input window:
................................................................................................................................
1 Veri fy that the c orrect ACD is select ed. The current ACD (selected on
the selector window) is displayed at t he bottom-right of the input
window .
If the wrong ACD is displayed, press the Cancel button and then retu rn to
Displaying the Report selector window (2-4) to begin the report selection
procedure again to select the correct ACD.
................................................................................................................................
2 Fill in the input fields. For the Split /Skill Ou tbound Inter val repor t input
window, the input fields are: Split/Skill, Date, and Times.
To fill in an input field, do any of the followi ng:
• Type in the name or number of the input requested
• Use the history list (pull-down menu)
• Press the Browse button to the right of the input field. This button
will allow you to view all of the available inputs.
Page 49

........................................
........................................
E
.......................................................................
Using CentreVu Supervisor Reports
Running a Report 2-7
................................................................................................................................
CentreVu®
Supervisor Version 8 Reports
3 For all reports other than Commands | Reports Real-Time and
Integrated tabs, select the report destination. Reports can be viewed
on screen or printed on any printer to which your PC is connected.
To select the report destination, do one of the following:
• Select the View Report on Screen destination.
• Select the Print Report on: destination and choose a printer (if you
want to print on a printer other than the one displayed).
................................................................................................................................
4 Press the OK button.
Result: The report runs.
ND OF STEPS
..........................................................................................................
Page 50
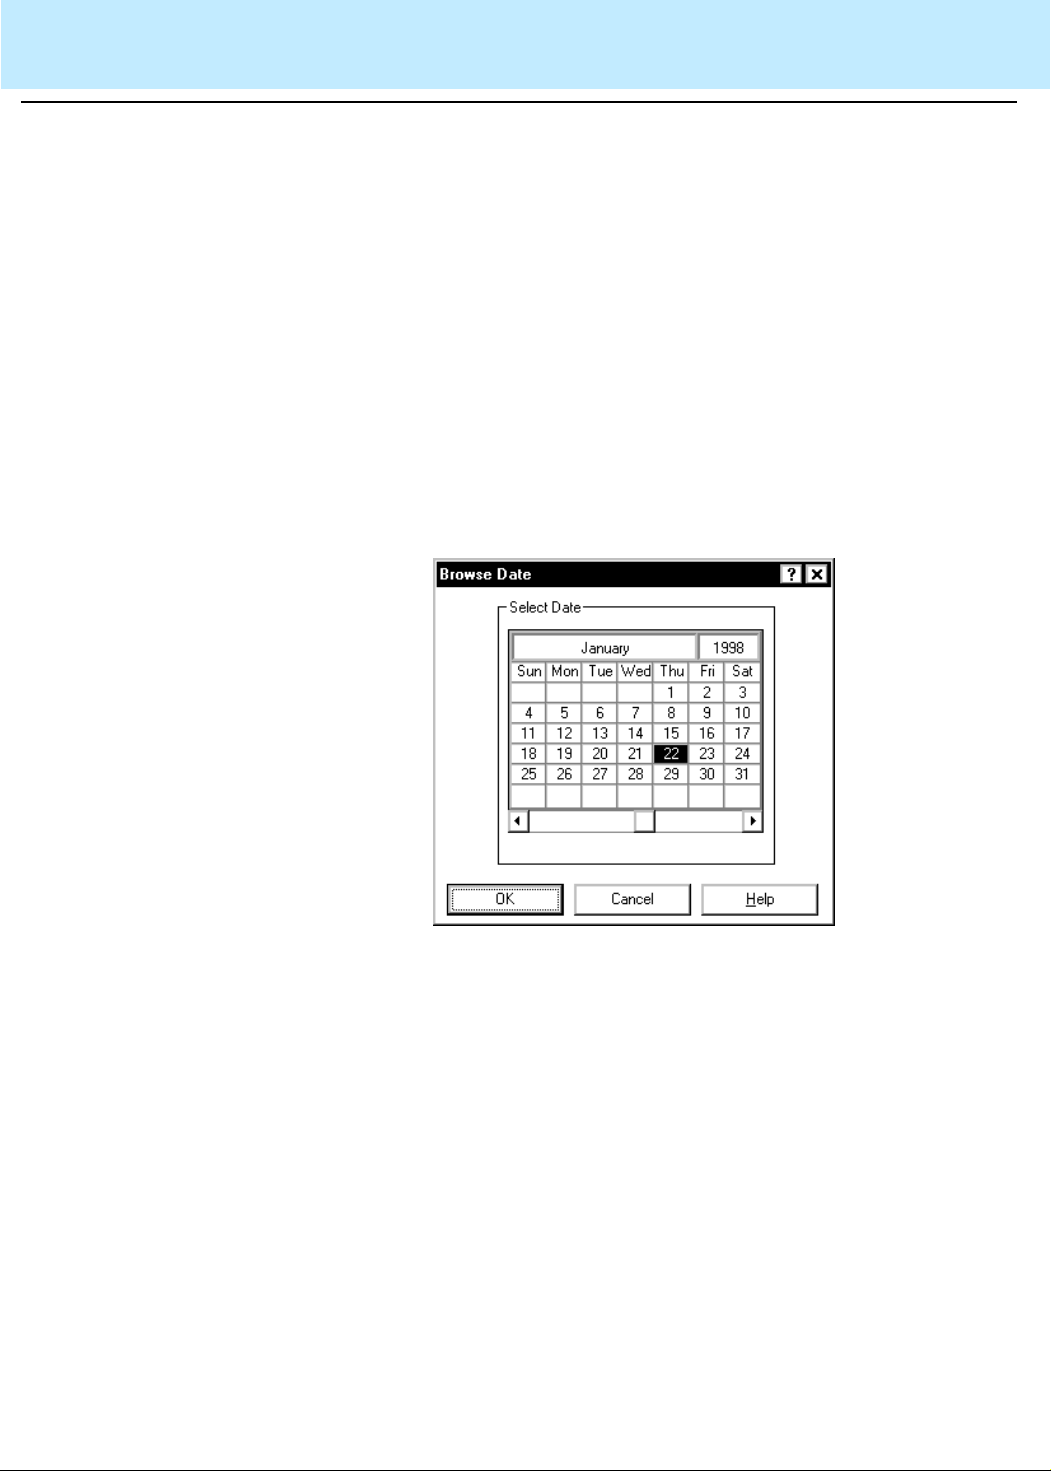
Using CentreVu Supervisor Reports
Selecting Report Run Dates 2-8
CentreVu®
Supervisor Version 8 Reports
Selecting Report Run Dates
.........................................................................................................................................................................................................................................................
Selecting Dates When you run historical reports, you need to select the date or dates for
which to run the report.
To do this, you can do any of the following:
• Type the date or date range in the Date(s): input field.
• Type a relative date (for example, -2 for two days ago).
• Select the date(s) from the history list of previousl y u sed date(s) for
this report.
• Select the Browse button. .
Browse Date If you press the Browse button and the input needed is a single date, the
Browse Date window displays.
To select a specific date, use your mouse to p oint at a day and click. The
day is highlighted.
If you want to choose a date that is not in the current month, use the
arrow keys at the bottom of the window to scroll through the months.
Page 51

Using CentreVu Supervisor Reports
Selecting Report Run Dates 2-9
CentreVu®
Supervisor Version 8 Reports
Browse Dates If the input needed is for more than one date, the Browse Dates window
displays.
To select specific dates, use your mouse to point at a day and click. The
day highlights. You can select as many days as you want.
To select a range of dates, select the Range button, point- and-click on
the first day of the desired range, then point- and-click on the last day of
the desired range. The dates selected highlight. You can select as many
ranges as you want to, but you must select the Range button in order to
define each range.
If you want to choose a date that is not curr ently disp layed, us e the arrow
keys at the bottom of the window to scroll through the months.
To clear your current selections, select Clear.
Browse Month If the input needed is for one month, the Browse Month window displays.
This window is used in monthly reports where the data is for a single
month. The form is initialized to the values in the input field or to the
month previous to the current mont h when th e i nput f ield is empty. Select
a single month and year for the report. The minimum date is January
1980 and the maximum date is December 2037.
Page 52

Using CentreVu Supervisor Reports
Selecting Report Run Dates 2-10
CentreVu®
Supervisor Version 8 Reports
Browse Months If the input needed is for more than one month, the Browse Months
window displays.
This window is available in monthly reports where the data is for one or
more months. The report runs, beginning with the month entered in the
First Month: field and going through as many months as are specified in
the Number of Months: field.
The months are in calendar order in the drop-down box, with the
minimum date being January 1980 and the maximum date December
2037.
Page 53

Using CentreVu Supervisor Reports
Selecting Report Run Times 2-11
CentreVu®
Supervisor Version 8 Reports
Selecting Report Run Times
.........................................................................................................................................................................................................................................................
Selecting times When you run interval historical reports, you need to select the time
period for which to run the report.
To do this, do any of the following:
• Type the time range in the Times: input field.
• Select the times from the history list of previous ly used time s for this
report.
• Select the Browse button next to the Times input field.
Browse Time If you select the Browse button, the Browse Time window displays.
Complete the following fields:
• Starting Interval: select the time you want the report to begin with
from the drop-down list. The report data will begin with the interval
that begins immediately after the time you enter.
• Ending Interval: select the time y ou want the report to end with from
the drop-down list. The repor t data will go through the interval dur ing
which the time you enter falls.
Page 54

Using CentreVu Supervisor Reports
Exiting and Restarting Reports 2-12
CentreVu®
Supervisor Version 8 Reports
Exiting and Restarting Reports
.........................................................................................................................................................................................................................................................
How to exit a report To exit a report (ret urn to the Controller), do one of the following:
• Double click the System button.
• Select Close from the System button menu.
• Select Exit from the Report menu.
If the system shuts down d ue t o an err or, any changes you have made to
the report(s) you are running are saved.
How to restart a report To restart a report (return to the report input window), do the following:
• Select Restart from the Report menu.
Work State drill-down reports and unsaved reports created in Report
Wizard cannot be restarted.
Page 55

Using CentreVu Supervisor Reports
Report Menu Bar 2-13
CentreVu®
Supervisor Version 8 Reports
Report Menu Bar
Overview
.........................................................................................................................................................................................................................................................
Purpose When you run a report, the menu bar at the top of the window has the
following options:
• Report
• Edit
• Format
• Tools
• Options
• Help
This section describes the menu items that are avail able in each of these
menus.
Page 56

Using CentreVu Supervisor Reports
Report 2-14
CentreVu®
Supervisor Version 8 Reports
Report
..................................................................................................................................... ....................................................................................................................
Report menu The Report menu has options that relate specifically t o the report yo u are
running.
Page 57

Using CentreVu Supervisor Reports
Report 2-15
CentreVu®
Supervisor Version 8 Reports
Menu item functions This table describes the action that each menu item performs:
Menu Item Action
Restart Closes the current report output window and
displays the input window f or the cu rrent repor t.
This allows you to run the same report,
changing inputs as needed. This i s disabled for
Drill-Down reports and if the report is an
unsaved report created using the Report
Wizard (this item is reenabled when the report
is saved).
Page Setup Displays the Page Setup window. See the
Setting Up a Page (2-57) in this chapter for more
information on Page Setup.
Print Displays the Print window. See
Printer (2-55) for more information on the Print
Selecting a
window . When you select Print from the Report
menu, the report that is active will be printed
according to the opt ions y ou choose i n the Pri nt
window . If the report is a real-time report, only
one refresh of the report will be printed.
Print Preview Displays the report so th at you can see i t before
printing. See
Print Preview (2-21) for more
information on the Print Preview window. Once
you have selected Print Preview, you may print
the report.
Design If you have purchased the Report Designer
software and your
CentreVu
CMS User ID is
authorized to use the Report Designer, you can
access the Report Designer Design Mode
window from any report using this menu item.
When you select Design from the Report menu,
the report that is currently running remains
visible, but you are placed in the Design Mode,
where you can edit the report. For more
information on the Design Mode, see the
CentreVu Report Designer Version 8 User
Guide
(585-210-930). The Design menu item
will be grayed out if you are currently running a
drill-down report.
Save Saves the report that you edited.
Save as Saves the report you edited under a different
file name.
Page 58

Using CentreVu Supervisor Reports
Report 2-16
CentreVu®
Supervisor Version 8 Reports
Menu Item Action
Save as HTML Displays the Save as HTML window, which lets
you save a snapshot of the report output as an
HTML file. Selecting the Script button in this
window displays the Save as Script dialog box,
which lets you create a script to run the
specified report and save the output as an
HTML file.
Script Displays the Save as Script dialog box, which
enables you to create a script to run a spec if ied
report on schedule and display it on your
computer. The script can be interactive or
automatic.
Exit Closes the active report output window. The
location of the report output window is saved
when the report is exited, and that is where the
report will display the next time you run it.
Page 59
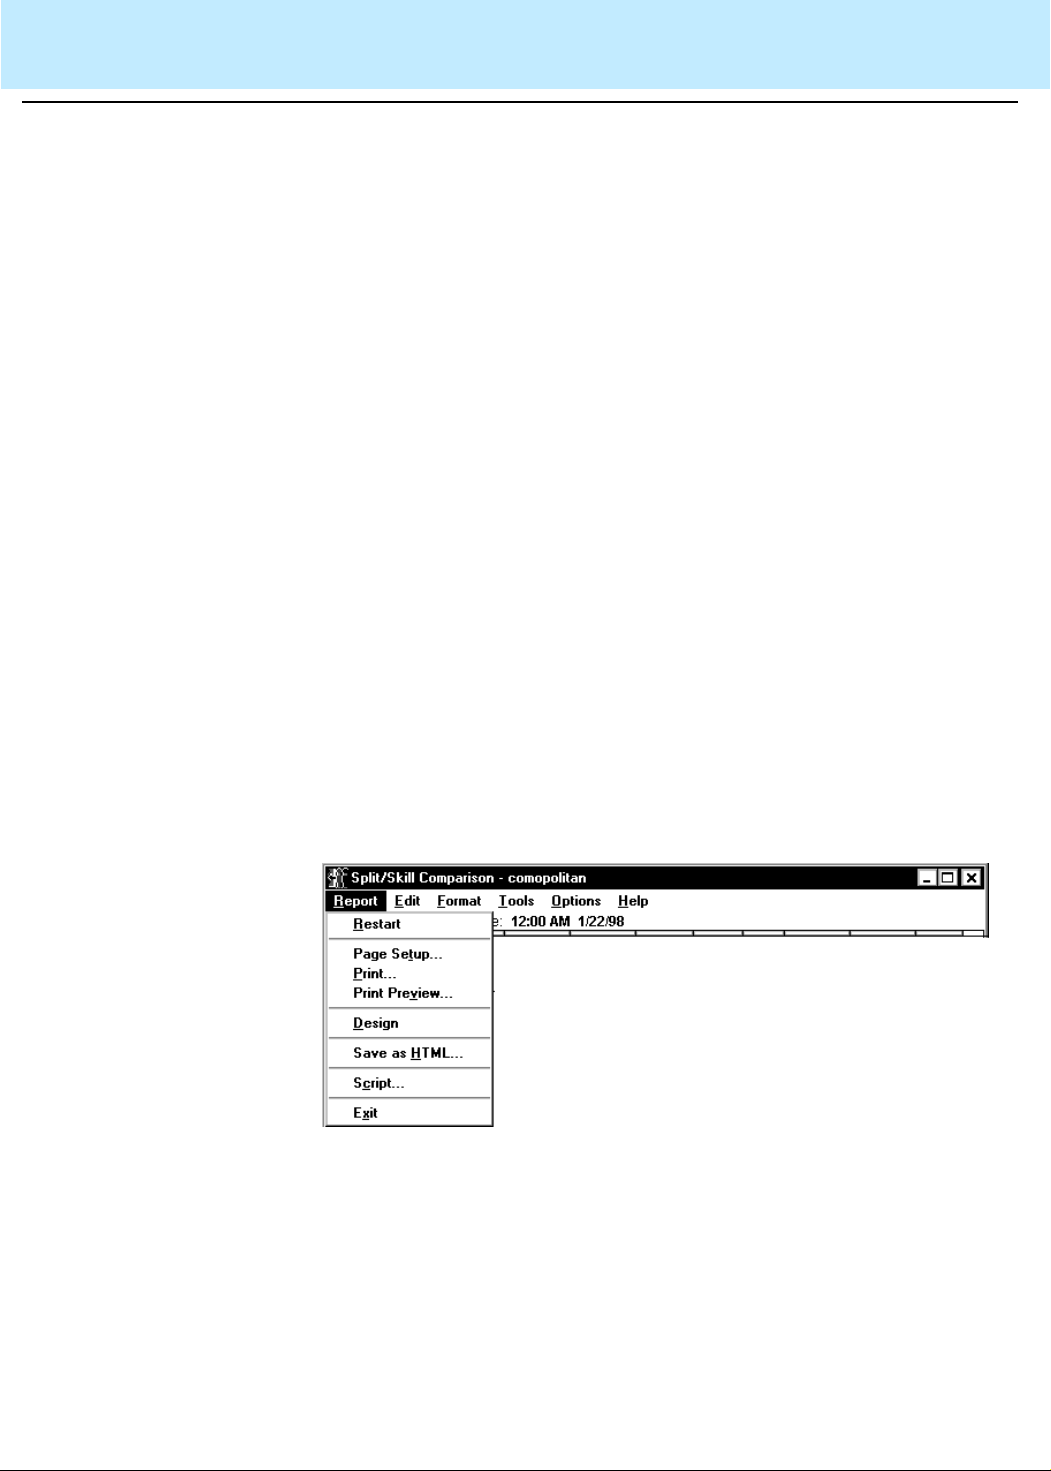
Using CentreVu Supervisor Reports
Save as HTML 2-17
CentreVu®
Supervisor Version 8 Reports
Save as HTML
.........................................................................................................................................................................................................................................................
Overview The Save as Hypertext Markup Language (HTML) function av ailable wi th
CentreVu
report running in
report generated in
file. This file can then be stored on a web server for viewing on the
Internet or an Intranet.
Things to note:
• Save as HTML does not automatically save the HTML file onto a
• Save as HTML does not automatically update the HTML for real-
• Save as HTML is found in the report pull-down menu on an open
• Save as HTML does not support 32-bit color mode for graphics
Supervisor Version 8 allows the user to export a snapshot of a
CentreVu
CentreVu
web server. You must copy the HTML file and any associated
graphics to the Internet server you want to use.
time reports.
report.
saved using Save as HTML.
Supervisor and save it as an HTML file. Any
Supervisor can be converted to an HTML
Browsers T o vi ew the HTML fil e, your Int er net browser must support t ables and .g if
Selecting Save as HTML
location
graphic files. For example,
Internet Explorer 3.0, or later versions of either, support tables and .gif
graphic files.
Save as HTML function can be found in the Report pull-down menu.
Netscape
Navigator 3.0 or
Microsoft
TM
Page 60

........................................
........................................
........................................
Using CentreVu Supervisor Reports
Save as HTML 2-18
CentreVu®
Supervisor Version 8 Reports
When you select Save as HTML, the Save as HTML dialog box displays.
Using Save as HTML To save a report as an HTML file, use the following steps:
................................................................................................................................
1 While running the report you want to save, s elect Save as HTML from
the Report menu.
................................................................................................................................
2 Select a template option.
• Type the template fi le name in the template fiel d, select the templat e
from the pull-down history list, or select the Browse button and
browse for a template.
• If you do not want to use a tem plate, select the Do not use a
template radio button.
................................................................................................................................
3 Select an output option.
• Selecting Use
report fonts as you see them in
CentreVu
Supervisor report fonts preserves the
CentreVu
Supervisor.
• Selecting Use the web browser default fonts displays the output file
using Internet browser default fonts.
Page 61

........................................
........................................
E
.......................................................................
Using CentreVu Supervisor Reports
Save as HTML 2-19
................................................................................................................................
CentreVu®
Supervisor Version 8 Reports
4 Type the name of the output file in the file name field, select the file
name from the pull-down history list, or select the Browse button and
browse for a file name.
................................................................................................................................
5 Select the OK button to save the report in HTML file format.
ND OF STEPS
..........................................................................................................
Results:
The report is now saved as an HTML file for viewing with an Internet
browser.
The HTML file that has been generated can be modified to fit your
specific need using an HTML or text editor.
Output files You must select a name for the HTML file you are creating. You must
specify the full file path (for example, c:\temp\myrpt.htm) to save the file
in a directory other than the current directory.
If there are charts associated wi th the fi le, they are converted into .gi f files
and numbered in the order created. For example, c:\temp\myrpt1.gif and
c:\temp\myrpt2.gif.
The output file is created using the templates and fonts you have
specified. After the HTML is saved, you can move or copy it and all
associated graphics files to a web server directory for viewing on the
Internet or an Intranet.
Templates A template can be used to provide company logos, background color,
Not using templates If you choose not to use existing templates, Save as HTML generates
specific fonts, or surrounding te xt to the HTML file. If you do not select a
template, the HTML file displays only the report.
Note the following:
• Templates are HTML files that can be created or edited using an
HTML or text editor.
• The templates are limited by what your web browser supports.
basic HTML tags in order for your report to be converted to HTM L.
Note the following:
• The standard surround tags <HTML> and <BODY> are generated.
• The background color is set to white and font color is set to black.
• The title of the page is the same as the report title.
Page 62

Using CentreVu Supervisor Reports
Save as HTML 2-20
CentreVu®
Supervisor Version 8 Reports
Using existing templates
Save as HTML template
tags
CentreVu
found in the samples directory of the
where the executable files were installed. Use these installed templates
when saving a report as an HTML file.
The following describes the tags used by Save as HTML and which can
be used to create templates:
Supervisor provides you with Sample templates which can be
CentreVu
HTML Tag Description
<CVSUP_TITLE> This tag is replaced with the title of report in
the HTML file. If this tag is used within the
<TITLE> tags, the title of the report will be
used as a heading to the page. Multiple uses
of this tag are allowed.
<CVSUP_BODY> This tag is replaced by the report body in the
HTML file. However, only the first occurrence
of this tag is replaced. If a template is used
and the <CVSUP_BODY> tag is not in the
template, an error occurs, and the Save as
HTML operation is aborted.
Supervisor directory
Fonts If you choose to use the
size are preserved in the HTML file.
• The fonts used in
Times New Roman.
CentreVu
• In the event these fonts are not available on the computer viewing
the HTML file, backup fonts are used. The backup fonts are
Helvetica for Arial, Courier for Courier New, and Times for Times
New Roman.
• If you choose to use the web browser’s default fonts, the HTML file
will not specify any fonts.
• Note the following:
– If you choose not to preserve the
the appearance of the report in the HTML file may change.
– If you choose to use a template, do not preserve the
Supervisor fonts if the template specifies the fonts.
CentreVu
Supervisor fonts, the font face and
Supervisor are Arial, Courier New and
CentreVu
Supervisor fonts,
CentreVu
Page 63

Using CentreVu Supervisor Reports
Print Preview 2-21
CentreVu®
Supervisor Version 8 Reports
Print Preview
.........................................................................................................................................................................................................................................................
Overview Print Preview displays the printed layout of a report on screen so that
printed components, such as page breaks and heade rs an d foot ers, may
be viewed prior to actual printing.
Access Print Preview Print Preview is accessed from the Report menu of the output window of
all generated reports. Select Print Previ ew to open the Print Preview
dialog box
Print Preview dialog box The print preview dialog box displays one physical pag e of the generated
report at a time.
Page 64

Using CentreVu Supervisor Reports
Print Preview 2-22
CentreVu®
Supervisor Version 8 Reports
Print Preview fields The following table describes the fiel ds and it ems on the Print Preview
dialog box:
Field/Item Description
Scroll bars If the page does not fit within the Print Preview
dialog box, scroll bars are available to view the
entire page.
Status bar A status bar at the bottom of the page lists which
page of the report is being viewed; for example,
“page 1 of 3.”
Next button If the generated report has more than one page in
its final, printable version, the Next button moves
you forward through the report a page at a time.
Back button If the generated report has more than one page in
its final, printable version, the Back button moves
you backward through the report a page at a time.
Zoom In/Out The Zoom In/Out drop-down li st allows you to
zoom in or out on a report in the Print Preview
dialog box by a series of percen tages in 25 percent
increments. for example, you may view a report
output in Print Preview at 100 percent, 125
percent, 150 percent, and so on. The default is
based on screen size.
Landscape/Portrait The Landscape check box allows you to view an
output in either landscape mode (11” x 8.5”) or in
portrait mode (8.5” x 11”) for printing purposes.
The default is based on your default printer
settings. To select Portrait mode, deselect the
Landscape box.
Print Select the Print button to display the Print Setup
dialog box. The report that is active will be printed
according to the options you choose on the Print
Setup dialog box. You may choose the printer , the
orientation, and the paper in this dialog box, or you
can select Options to display printer-s pecific
configuration information. If the report is a realtime report, only one refresh of the report will be
printed.
Page 65

Using CentreVu Supervisor Reports
Print Preview 2-23
CentreVu®
Supervisor Version 8 Reports
Field/Item Description
Help Select Help (or press F1 ) to display a standard
Windows
TM
Help page for the Print Preview dialog
box.
Close The Close button closes the Print Preview dialog
box.
Page 66
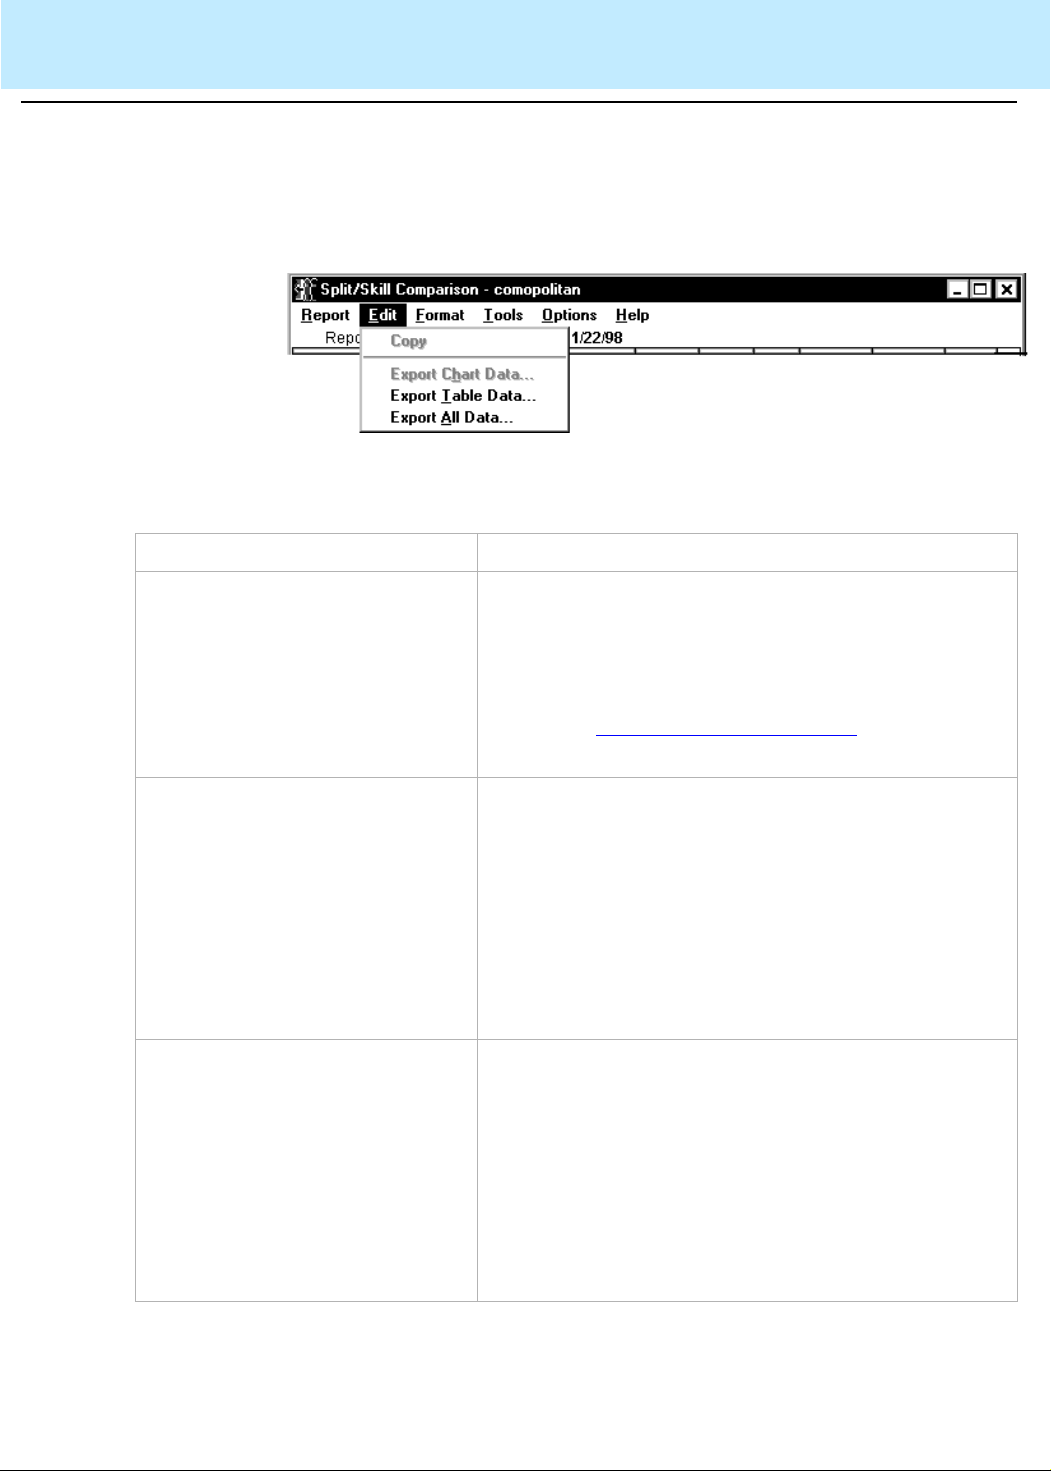
Using CentreVu Supervisor Reports
Edit 2-24
CentreVu®
Supervisor Version 8 Reports
Edit
..................................................................................................................................... ....................................................................................................................
Edit menu The Edit menu has standard
Menu item functions This table describes the action that each menu item performs.
Menu Item Action
Copy The image of the currently selected chart is copied to
the clipboard in
you to paste the chart picture into most
applications, such as a word processor. Y ou can also
access Copy from the right mouse button pop-up
menu. See
on using Copy.
Export Chart Data The Data Export Options window is shown to allow
you to export the data in t he currently selected ch art. If
the report is a real-time report, only one re fresh of the
data will be exported. You can also access the Data
Export Options window from the right mouse button
pop-up menu. If there is more than one chart on this
report, this option will be grayed out until you select a
chart. For more information on exp orting data, see t he
“Exporting Report Data” section in this chapter.
Windows
editing options.
Windows
metafile format. This allows
Windows
Copying Chart Reports (2-53) for instructions
Export Table Data The Data Export Options window is shown to allow
you to export the table dat a. If t he report is a real -ti me
report, only one refresh of the data will be exported.
You can also access the Data Export Options window
from the right mouse button pop-up menu. If there is
more than one table on the report, this option will be
grayed out until you select a table. For more
information on exporting data, see the “Exporting
report Data” section in this cha pter.
Page 67

Using CentreVu Supervisor Reports
Edit 2-25
CentreVu®
Supervisor Version 8 Reports
Menu Item Action
Export All Data The Data Export Options window is shown to allow
you to export all data in the report. You will also be
allowed to include labels and headers in the data that
are exported. If the report is a real-time report, only
one refresh of the data will be exported. You can also
access the Data Export Options window from the right
mouse button pop-up menu. For more information on
exporting data, see the “Exporting Report Data”
section in this chapter.
Page 68

Using CentreVu Supervisor Reports
Format 2-26
CentreVu®
Supervisor Version 8 Reports
Format
..................................................................................................................................... ....................................................................................................................
Format menu The Format menu contains actions for modifying the display format of the
currently selected obj ect. If one (or more) of the ac tions does not apply to
the selected object, it will be grayed out.
Menu item functions This table describes the action that each menu item performs.
Menu Item Action
Chart Allows you to format a chart. You
can also access the Format Chart
window from the right mouse
button pop-up menu.
Table Allows you to format a table. You
can also access the Format Table
window from the right mouse
button pop-up menu.
Sort By Allows you to sort the table by
several parameters specific to
the information in the selected
table. You can also access the
Sort by window from the right
mouse button pop-up menu.
Page 69
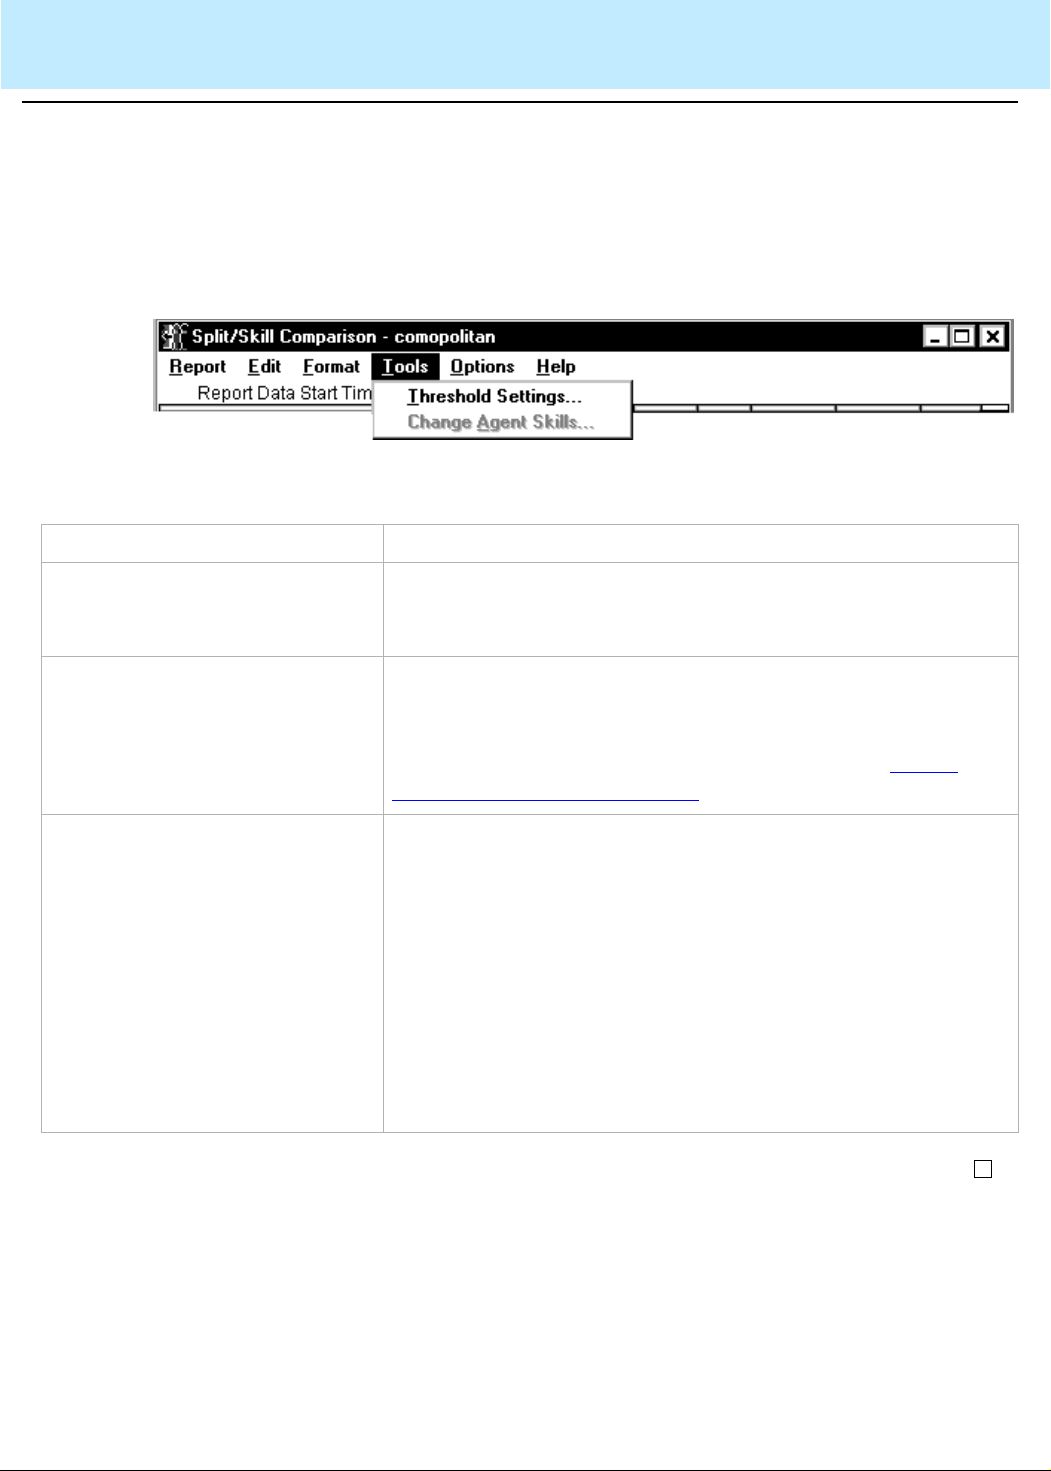
Using CentreVu Supervisor Reports
Tools 2-27
CentreVu®
Supervisor Version 8 Reports
Tools
........................................................................................................................................ .................................................................................................................
Tools menu The Tools menu contains additional actions that affect the currentl y
selected object. You can also access the Tools actions from the right
mouse button.
Menu item functions This table describes the action that each menu item performs.
Menu Item Action
Available Drill-Down reports If you are running a report that allows you to access one or
more drill-down reports, the available drill-down reports will be
accessible from the Tools menu.
Threshold settings Opens a window that allows you to view or modify threshold
highlight settings. Threshold highlight settings apply only to
some real-time data items in real-time and integrated reports.
For information on setting threshold highlights, see
Report Threshold Highlights (2-59).
Change Agent Splits/Skills If the current ACD supports Expert Agent Selecti on (EAS), this
menu item reads Change Agent Skills; otherwise, it reads
Change Agent Splits. This menu item is enabled only when the
selected table cell in a report is an agent name or agent login
ID; otherwise, it is disabled. If you do no t have write permission
for Agent Administration, then this menu item is not shown. This
action opens the Change Agent Skills window (EAS) or Change
Agent Split Assignments window (non-EAS) for the selected
agent. You can then modify the split/skill assignments for the
agent. See the
guide for more information.
910)
CentreVu® CMS R3V8 Administration (585-210-
Setting
Page 70
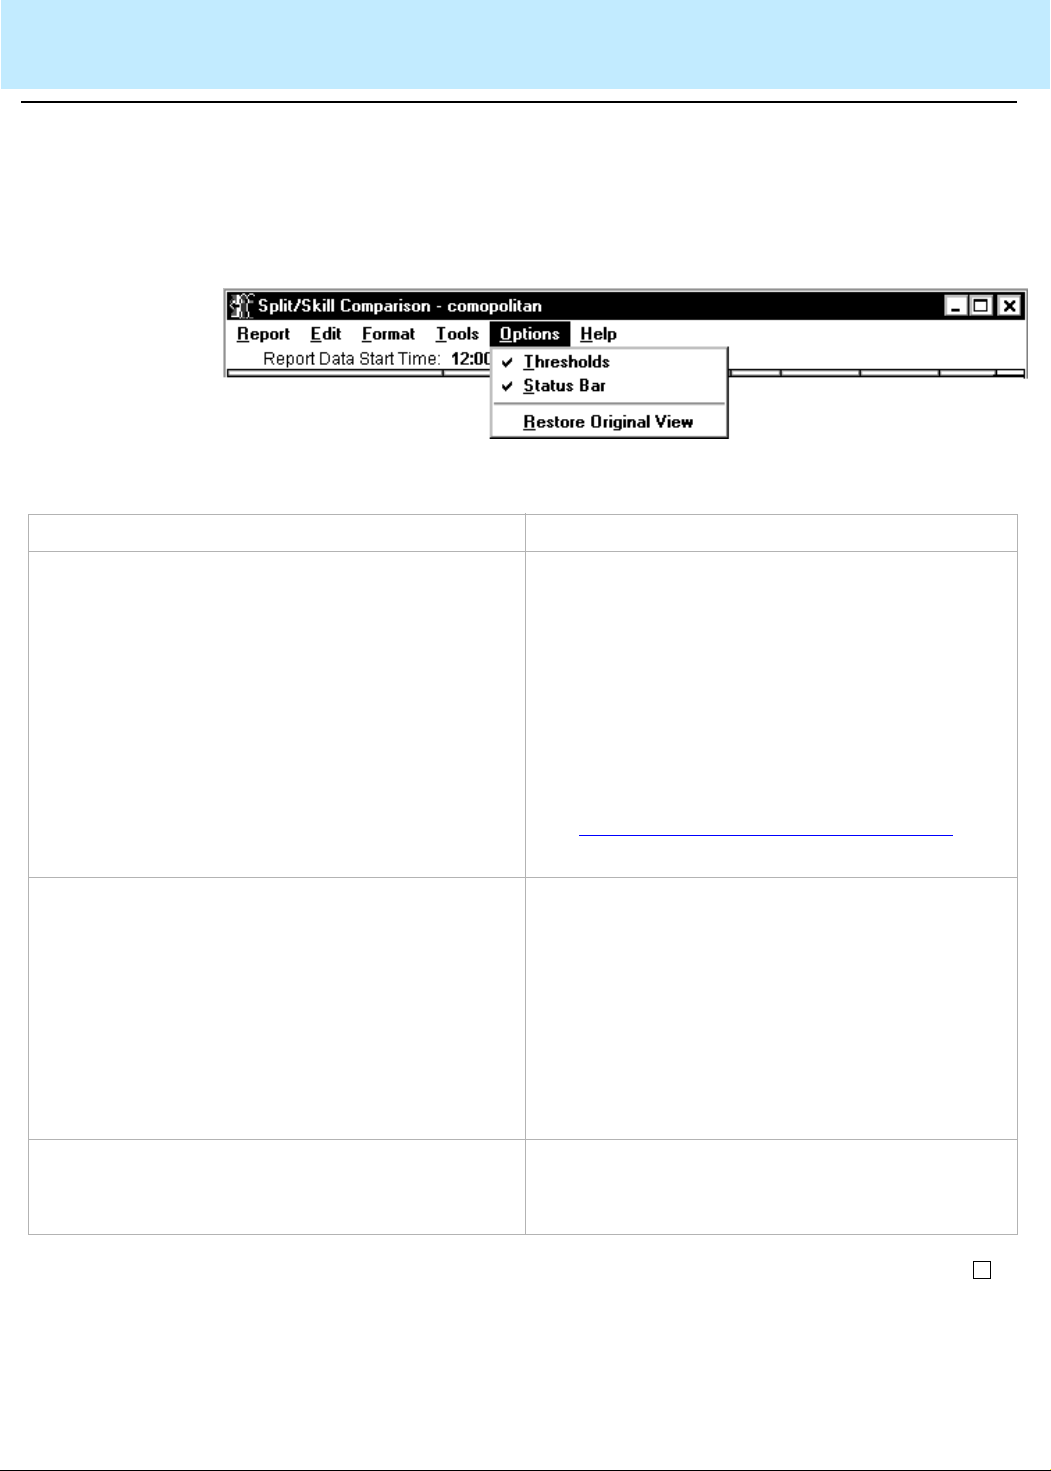
Using CentreVu Supervisor Reports
Options 2-28
CentreVu®
Supervisor Version 8 Reports
Options
..................................................................................................................................... ....................................................................................................................
Options menu The Options menu contains actions that affect the basic display of the
report.
Menu item functions This table describes the action that each menu item performs.
Menu Item Action
Thresholds Turns threshold highlighting on or off for this real-
time report. When threshold highlight ing is on
(there is a check by the menu item), the report
shows the colors (icons if the report is minimize d)
specified in the Threshold Settings window.
When threshold highlighting is off (there is no
check by the menu item), the report shows none
of the threshold highlight s (or icons if t he report is
minimized).
Setting Report Threshold Highlights (2-59) for
See
additional information on Threshold Highlights.
Status bar Shows or hides the status bar. When the status
bar is hidden, the window remains the same size
but the contents are resized to fill the window.
You would choose this to get a larger viewing
area for the report. When the status bar is made
visible, the window remains the same size but
the contents are resized to fil l the smaller window
area. The status bar setting i s saved in the rep ort
view .
Restore Original View Restores the Report View to the ori ginal setti ngs.
All changes made to the format of thi s report are
discarded.
Page 71

Using CentreVu Supervisor Reports
Editing and Viewing Reports 2-29
CentreVu®
Supervisor Version 8 Reports
Editing and Viewing Reports
Overview
.........................................................................................................................................................................................................................................................
Purpose This section describes the various formatting and display options for
reports. It also includes some procedures for manipulating reports.
Organization The following topics are covered:
• Report layouts
• Formatting table reports
• Formatting chart reports
• Minimizing report output windows
• Right mouse-button pop-up menus
• Rotating a 3D chart
• Exporting report data
• Copying chart reports
• Resizing report windows
• Selecting a printer
• Setting Report Threshold Highlights
• Using Report Options
Page 72
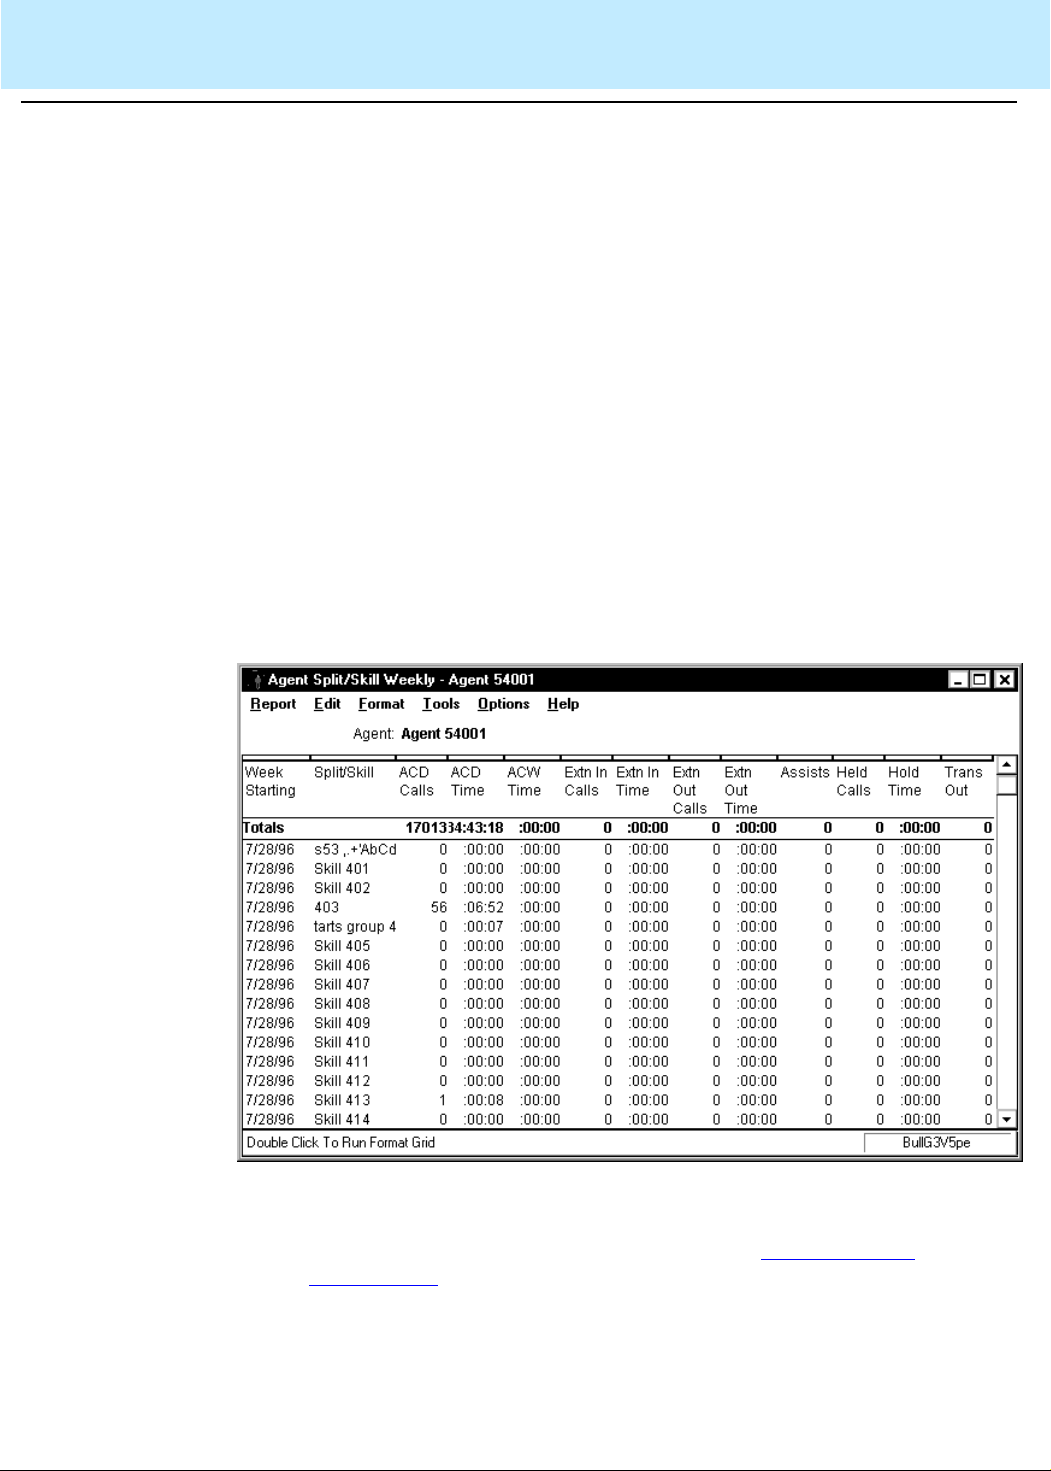
Using CentreVu Supervisor Reports
Report Layouts 2-30
CentreVu®
Supervisor Version 8 Reports
Report Layouts
.........................................................................................................................................................................................................................................................
Report types There are two types of report layouts in
What constitutes a
report?
Tables Most standard
• Tables — the
• Charts — th e
reports.
A report can consist of only a table/tables, only a chart /charts, or a
combination of tables and charts.
In addition to the tables and charts that make up the main body of
reports, reports can include tex t and fi eld names that are followed by
single data items. Text and data fields are used on both table and chart
reports.
prefaced by "graphical") are displayed in tables.
The information on a st andard report window is organized as follows:
CentreVu
CentreVu
CentreVu
Supervisor reports (reports that are not
CentreVu
Supervisor presentation of standard reports.
Supervisor presentation of graphical
Supervisor:
More information
Standard real-time reports can be sorted. See Formatting Table
Reports (2-32).
Page 73

Using CentreVu Supervisor Reports
Report Layouts 2-31
CentreVu®
Supervisor Version 8 Reports
Charts The graphical
CentreVu
Supervisor reports are displayed in charts.
More information
There are several options for formatting the appearance of the charts
(graphical reports). See
Formatting Chart Reports (2-35) for more
information.
Page 74

Using CentreVu Supervisor Reports
Formatting Table Reports 2-32
CentreVu®
Supervisor Version 8 Reports
Formatting Table Reports
.................................................................. ................................... ...................................................................... ................................... ................................... ........
Overview If you are in a report containing a table, you can format how the report is
displayed using the Table Format Options window.
The changes you make to a report’s format affect only your view of the
report. The changes do not affect how other
see the report.
CentreVu
Supervisor users
Accessing the Table
Format Options window
General tab The General tab allows you to make format changes to a table.
To access the Table Format Options window, use one of the following
steps:
• Double click on a column heading in the report.
• Select Format Table or Sort by from the Format menu or the right
mouse button pop-up menu.
If you select Sort by, the Table Format Options window displays with the
Sort tab active. If you select Format Table, the Table Format Options
window displays with the General tab active. Descriptions of these tabs
follow.
The Table Format Options window allows you to make layout changes to
a table. All changes you make are saved as part of the report view when
the report exits.
Page 75
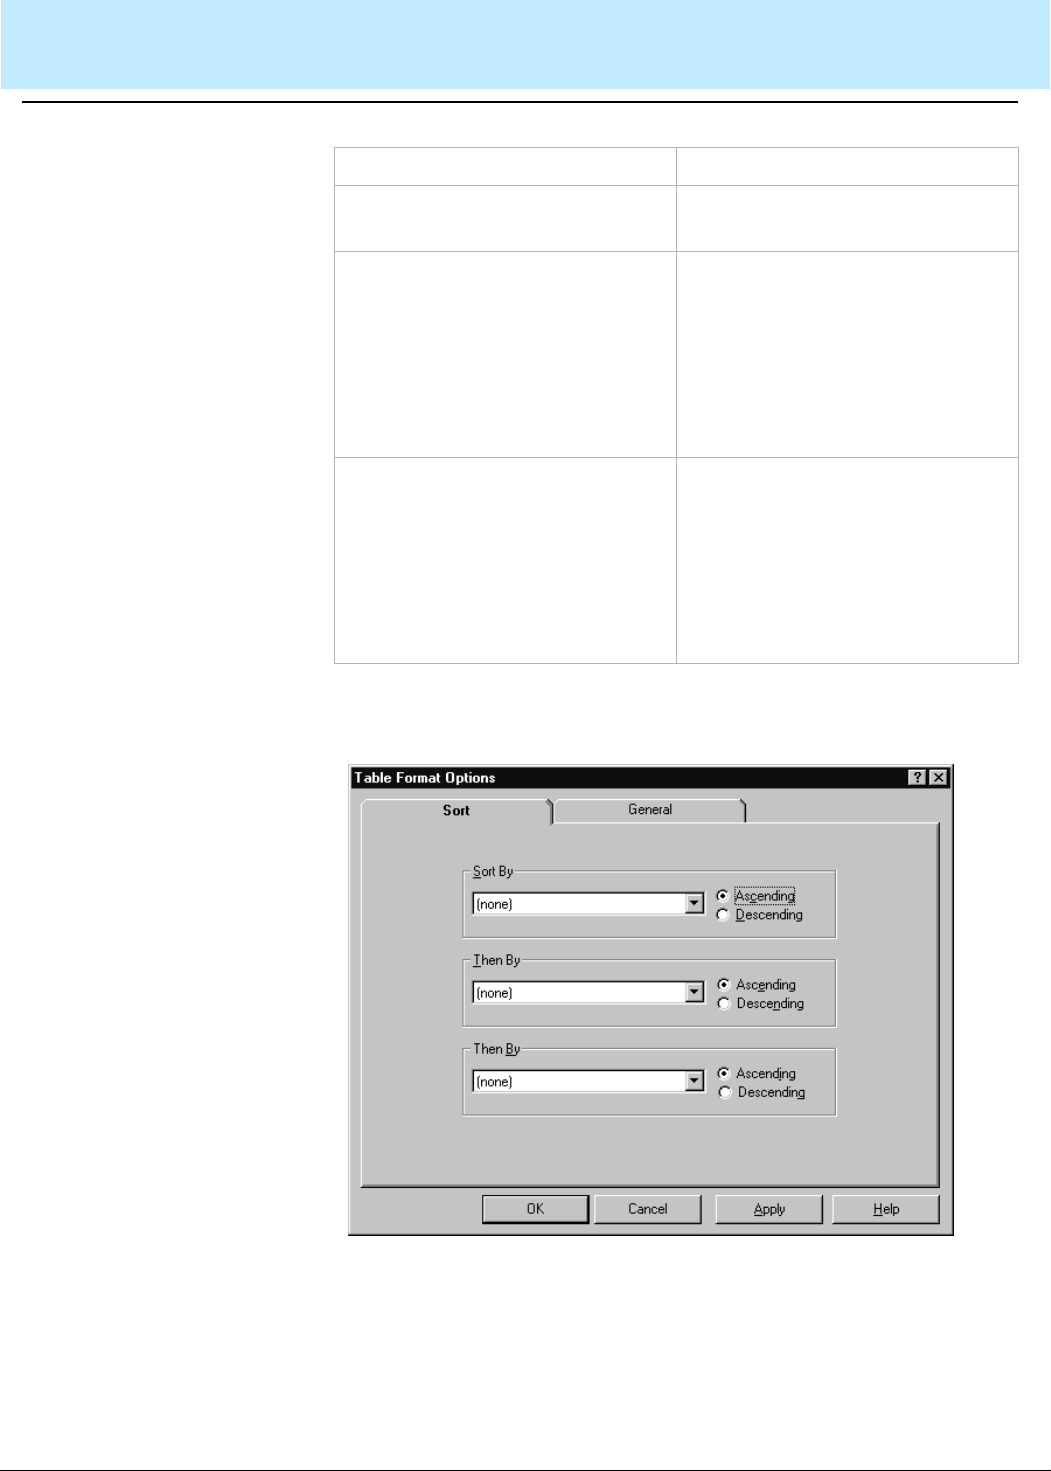
Using CentreVu Supervisor Reports
Formatting Table Reports 2-33
CentreVu®
Supervisor Version 8 Reports
General tab parameters The following table parameters can be changed:
Parameter Function
Show Gridlines Specifies whether or not table
lines are to be shown in the table.
Fixed Region, Columns Specifies the number of columns
from the left of the table that are
fixed in place and do not scroll.
Valid values are in the range of 0
through 99. You can use the spin
boxes to select a valid value or
type the value in.
Fixed Region, Rows Specifies the number of rows
from the top of the table that are
fixed in place and do not scroll.
Valid values are in the range of 0
through 99. You can use the spin
boxes to select a valid value or
type the value in.
Sort tab The Sort tab allows you to specify the order in which the information on
the real-time table report is displaye d.
Page 76

Using CentreVu Supervisor Reports
Formatting Table Reports 2-34
CentreVu®
Supervisor Version 8 Reports
Using the Sort tab When you are setting up display order for a real-time report, specify the
sort column ( Sort By) and t he sort order ( Ascending or Descendi ng). The
drop-down list for the Sort By lists all of the database table and item
names used in the report.
Sorting may cause report refreshes to take longer. If you wish to speed
up the refresh rate, tu rn off the sort options by selecting "(none)" for al l of
the Sort By criteria.
Examples
Here are two examples of how you might use the Sort tab:
• Viewing a list of agents alphabetically — select "Agent Name" from
the first Sort By drop-down list, selec t Ascending as the sort order,
and leave the other two Then By boxes set to "(none)."
• Searching for agents who have been in a certain state for too long
— select "State" from the first Sort By drop-down list, then select
"Time" f rom the second Then By drop-down list, and then select
Descending as the sort order for the second Then By.
Page 77

Using CentreVu Supervisor Reports
Formatting Chart Reports 2-35
CentreVu®
Supervisor Version 8 Reports
Formatting Chart Reports
.................................................................. ................................... ...................................... ................................... ................................... ................................... .....
Overview Charts (found in graphical reports) provide a graphical representation of
data. Values or data points are displayed in formats such as bars, lines,
filled areas, and pie charts. These data points are grouped into series
that are identified with unique color s.
In many chart types, one dat a point from each ser ies i s grouped t ogether
by category across an axi s. Categor ies are plott ed along t he x-axis, while
values are plotted along the y-axis. A two-di mensional chart shows serie s
next to each other, while a three-dimensional chart plots series along the
z-axis. A chart can also have a title and a legend.
If you are in a graphical (chart) report, you can format how the report is
displayed.
The changes you make to a report’s format affect only your view of the
report. The changes do not affect how other
see the report.
In general, if there is no value returned from the database by the query
for a chart, the legends are displayed as dashes.
CentreVu
Supervisor users
Accessing the Chart
Format Options window
To format a chart report, selecting Format Chart or Sort by from the
Format menu list or the right mouse button pop-up menu. The Chart
Format Options window appears.
The Chart Format Options window has seven tabs:,,,,,, and. Descri ptions
of these tabs follow.
• General tab input fields (2-36)
• 3D Effects tab input fields (2-38)
• Axis tab input fields (2-39)
• Type tab input fields (2-40)
• Title tab input fields (2-41)
• Legend tab input fields (2-42)
• Data Labels tab input fields (2-43).
Page 78

Using CentreVu Supervisor Reports
Formatting Chart Reports 2-36
CentreVu®
Supervisor Version 8 Reports
General tab The General tab allows you to specify several general options that apply
to the chart.
General tab input fields The following parameters can be changed:
Parameter Function
Background Color Specifies whether the backdrop
of the chart is a solid color or
whether it is displayed as a
gradient, a smooth transition from
one color to another. The
gradient transition can be one of
the following: Horizontal, V erti cal,
Rectangle, or Oval. The quality of
the gradient effect will vary
depending on the video card
installed in the PC, or the
capabilities of the printer for
printed reports.
Page 79

Using CentreVu Supervisor Reports
Formatting Chart Reports 2-37
CentreVu®
Supervisor Version 8 Reports
Parameter Function
Real-Time If the chart is a rolling chart, you
can specify the number of data
points to be displayed in the
chart. Permitted values are 2
through 100, with 10 being the
default. A rolling chart is a line
chart that is initially displayed
with no data points. For each
refresh of the report, a data point
is added. As data points are
added, the chart “rolls” from left
to right. When enough refreshes
have occurred so that the chart is
displaying the number of
specified data points, at the next
refresh, the oldest data point is
dropped from the display and the
newest data point is displayed.
3D Effects tab The 3D Effects tab allows you to control the 3D appearance of the chart.
If the current chart is a 2D chart, this tab is disabled.
More information
See Rotating a 3D chart (2-49) for an easy way to change the elevation and
rotation of a chart using the mouse.
Page 80

Using CentreVu Supervisor Reports
Formatting Chart Reports 2-38
CentreVu®
Supervisor Version 8 Reports
3D Effects tab input
fields
The following parameters can be changed:
Parameter Function
Elevation A number from 0 through 90
degrees that describes the
relative height from which a chart
is viewed. An elevation of 90
looks directly down on the top of
the chart, while an elevation of 0
looks directly at the side of the
chart. The example charts
throughout this document use an
elevation of 30 degrees.
Rotation A number from -360 through 360
degrees that specifies the angle
that the chart is turned relative to
the viewing position. The
example charts throughout this
document use a rotation of 60
degrees. Rotation does n ot apply
to 3D pie charts.
Projection Selects one of three
mathematical algorithms used to
give a 3D appearance on a 2D
sheet of paper or computer
screen.
You can choose the following
values:
•
Oblique
but the X-Y plane does not
change when the chart is rotated
or elevated.
•
Orthogonal
applied to the chart, resulting in
less of a 3D effect. The
advantage of using this type of
projection is that vertical lines
remain vertical, maki ng som e
charts easier to read.
•
Perspective
most realistic 3D appearance.
Objects farther away from you
converge toward a vanishing
point.
— The chart has depth
— Perspective is not
— This provides the
Page 81

Using CentreVu Supervisor Reports
Formatting Chart Reports 2-39
CentreVu®
Supervisor Version 8 Reports
Parameter Function
Viewing Distance A number from 50 through 1000
that represents the distance from
which the ch art is viewed a s a
percentage of the depth of the
chart.
Width to Height a number from 5 through 2000
that represents the percentage of
the chart’s height that is used to
draw the chart’s width.
Depth to Height A number from 5 through 2000
that represents the percentage of
the chart’s height that is used to
draw the chart’s depth.
Axis tab The Axis tab allows you to specify the title that will di splay on each axis of
the chart report.
Axis tab input fields The following parameters can be changed:
Parameter Function
Axis Display Makes each of the axes visible or
invisible. The choic es are X Axis,
Y Axis, 2nd Y Axis, and Z Axis.
Page 82

Using CentreVu Supervisor Reports
Formatting Chart Reports 2-40
Type tab The Type tab lets you change the chart type.
CentreVu®
Supervisor Version 8 Reports
Type tab input fields The following parameters can be changed:
Parameter Function
2D and 3D Changes the chart between 2-
dimensional and 3- dimensional views.
2D charts update faster than 3D
charts, so if the drawing speed seems
too slow, you may want to display
charts as 2D.
Chart Type Specifies how the data is presented.
You choose a chart type from the list.
The types of charts available vary
slightly depending on whether a 2D or
3D chart has been selected.
All possible chart types are as follows:
• Bar Chart (2D and 3D)
• Line Chart (2D and 3D)
• Area Chart (2D and 3D)
• Step Chart (2D and 3D)
• Horizontal Bar Chart (2D and 3D)
• Clustered Bar Chart (3D only)
• Pie Chart (2D and 3D)
Page 83
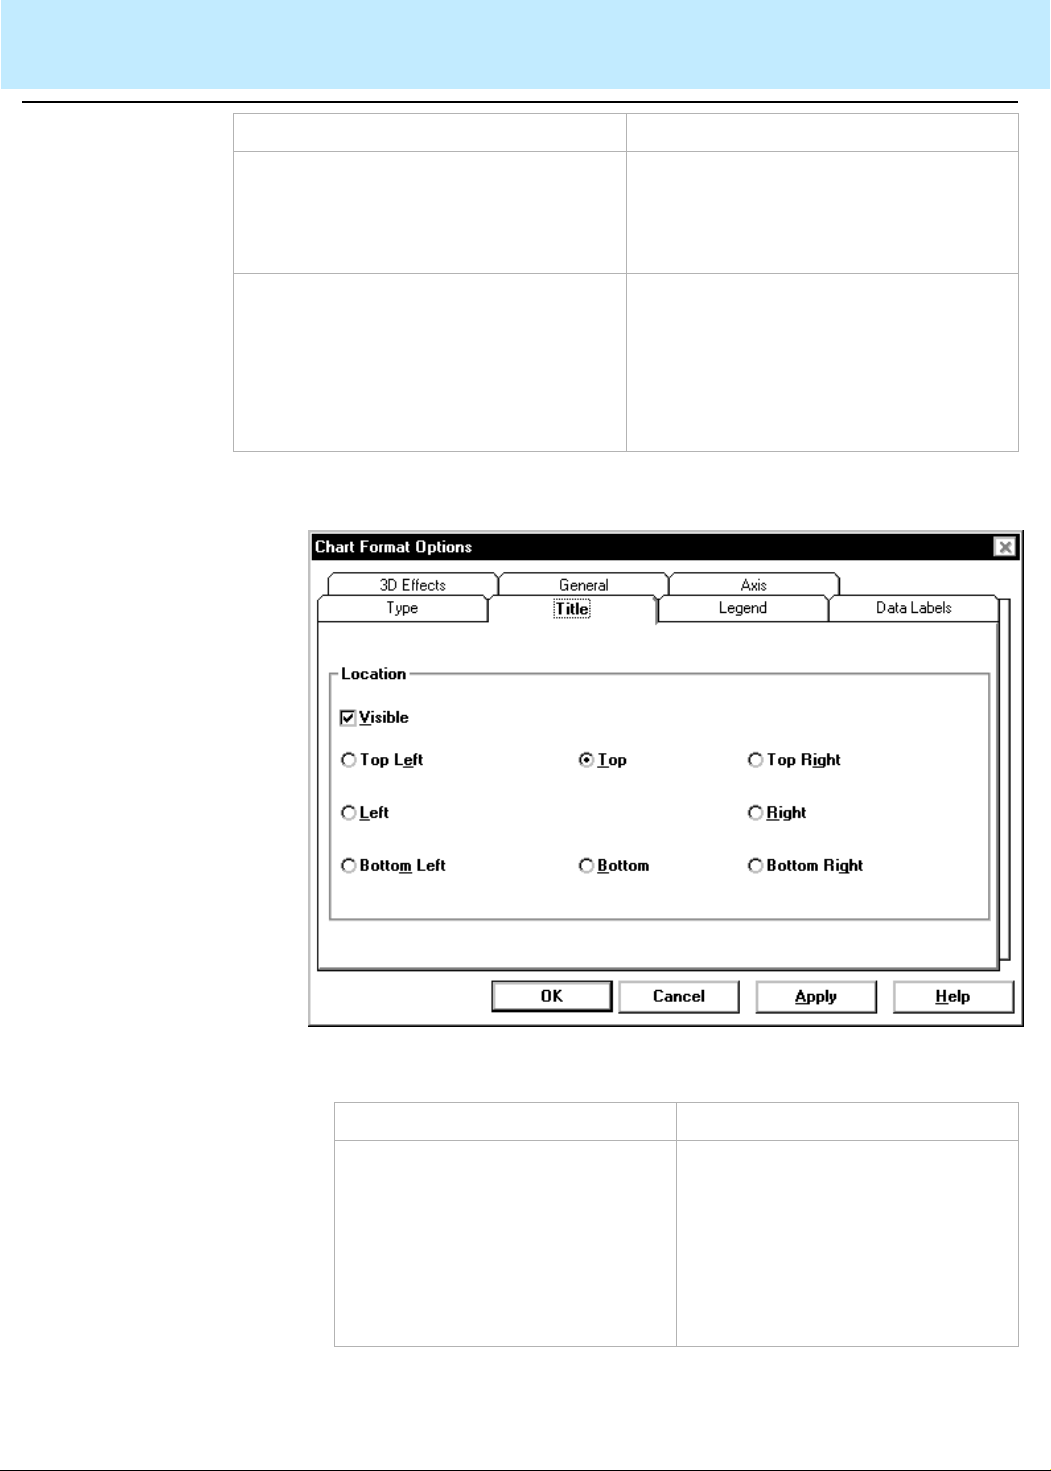
Using CentreVu Supervisor Reports
Formatting Chart Reports 2-41
CentreVu®
Supervisor Version 8 Reports
Parameter Function
Stacked check box Causes the data for all series to be
stacked rather than shown separately.
This check box is disabled for pie
charts.
% Axis check box Causes the value axis (y-axis) to be
displayed as percentages rather than
as actual data values. This can be
combined with the stacked check box
to produce a percentage stacked
chart.
Title tab The Title tab allows you to control the location of the chart title.
Title tab input fields The following parameters can be changed:
Parameter Function
Visible check box Allows you to display or not
display report titles. Sinc e the title
takes up space, the drawn chart
will be smaller if you have
selected Visible. If you wish to
increase the size of the chart, do
not select the Visib le option.
Page 84

Using CentreVu Supervisor Reports
Formatting Chart Reports 2-42
CentreVu®
Supervisor Version 8 Reports
Parameter Function
Location of title If you elect to have report titles
visible, you can select where the
titles display. The available
options are Top left , Top (center),
Top right, Left , Right, Bottom left ,
Bottom (center), and Bottom
right.
Legend tab The Legend tab allows you to control the location of the chart legend.
Legend tab input fields The following parameters can be changed:
Parameter Function
Visible check box Allows you to display or not display report
legends. Since legends take up space, the
drawn chart will be smaller if you have select ed
Visible. If you wish to increase t he size of the
chart, do not select the Visible option.
Location of legend If you elect to have report legends visible, you
can select where the legend displays. The
available options are Top left , Top (center), Top
right, Left , Right, Bottom left, Bottom (center),
and Bottom right.
Page 85

Using CentreVu Supervisor Reports
Formatting Chart Reports 2-43
CentreVu®
Supervisor Version 8 Reports
Data Labels tab The Data Labels tab allows you to control the location of the data point
labels.
Data Labels tab input
fields
The position of data point labels can affec t the readability of the chart.
The label text may overlap in some situations, making it difficult or
impossible to read the labels.
Page 86
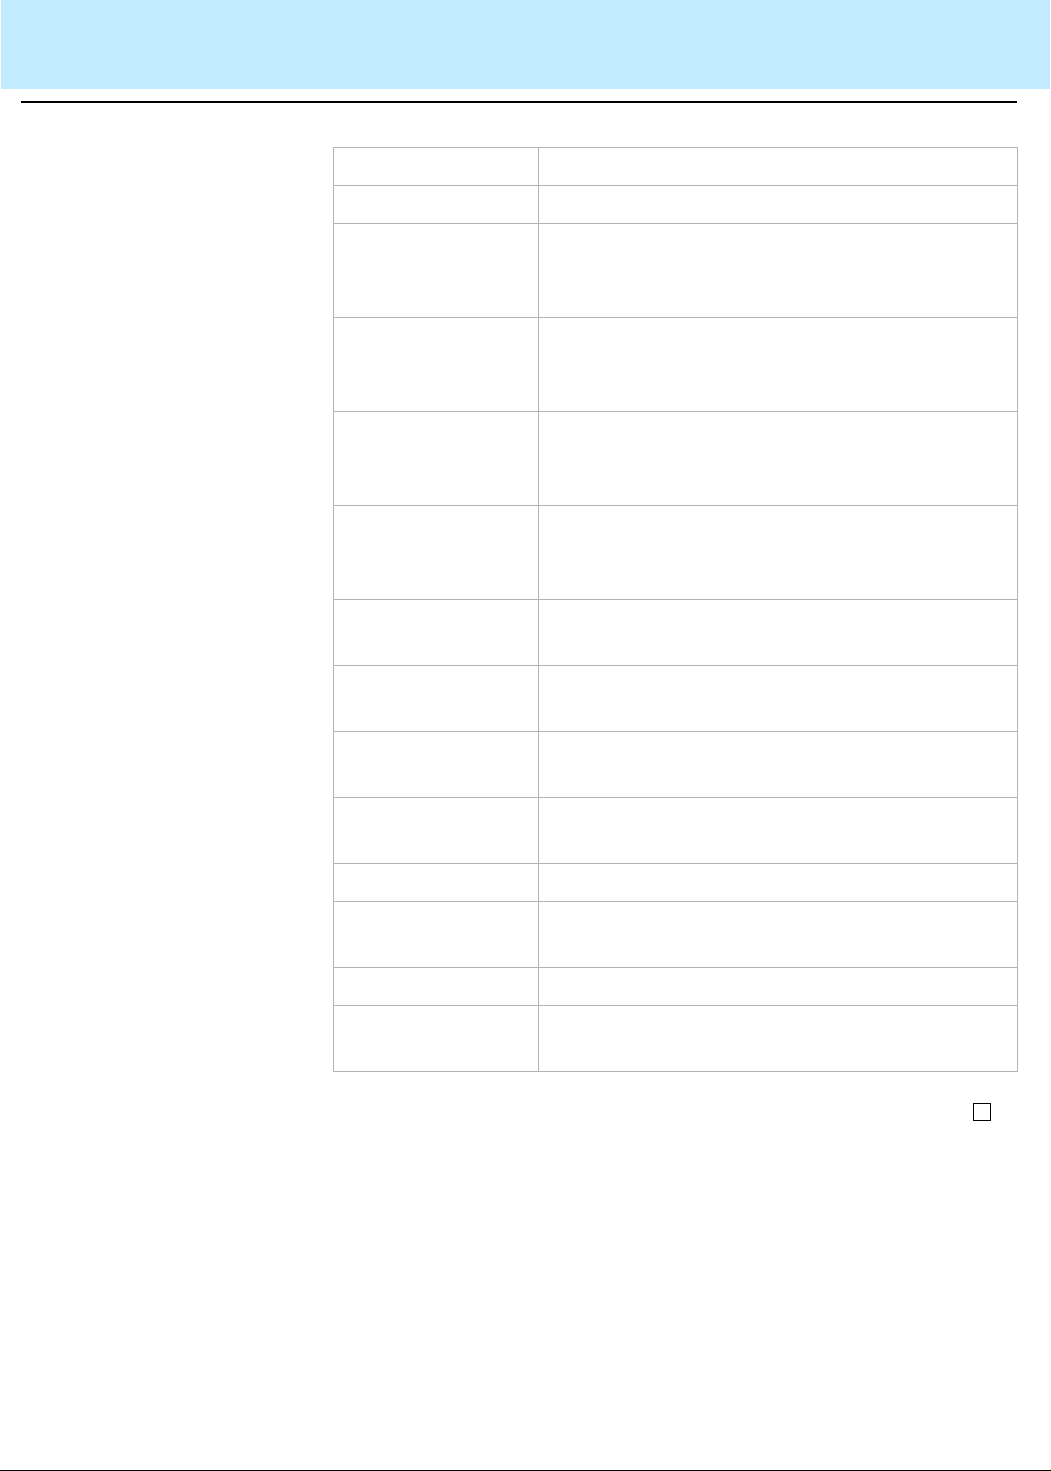
Using CentreVu Supervisor Reports
Formatting Chart Reports 2-44
CentreVu®
Supervisor Version 8 Reports
The following parameters can be changed:
Parameter Function
None Labels are not displayed.
Above Point Displays the label above the data point. This
location is valid only for bar, line, area, and step
charts.
Below Point Displ ays the label below the data point. This
location is valid only for bar, line, area, and step
charts.
Center Displays the label centered on the data point.
This location is valid onl y for bar, line, area, and
step charts.
Base Displa ys the label along the category axis,
directly beneath the data point. This location is
valid only for bar, line, area, and step charts.
Inside Displays the label inside a pie slice. This
location is valid only for pie charts.
Outside Displays the label outside a pie slice. This
location is valid only for pie charts.
Left Displays the label at the left of a pie slice. This
location is valid only for pie charts.
Right Displays the label at the right of a pie slice. This
location is valid only for pie charts.
Value The value of the data point appears in the label.
Percent The value of the data point appears in t he label
as a percentage.
Series Name The series name is used to label the data point.
Category Name The category name is used to label the data
point.
Page 87

Using CentreVu Supervisor Reports
Minimizing Report Output Windows 2-45
CentreVu®
Supervisor Version 8 Reports
Minimizing Report Output Windows
.........................................................................................................................................................................................................................................................
Overview To minimize a report window, select the minimize button which is located
in the upper right-hand corner of the window.
Icons associated with
minimized report
windows
When a report output window is minimized, the report’s icon is displayed.
Depending on the category of th e report, one of the followi ng icons will be
displayed:
Report Type Icon
Agent
administration
reports
Call Center
administration
reports
Agent real-time,
historical, and
integrated
reports
Dictionary
reports
Exceptions
reports
Maintenance
reports
Other, queue/
agent, and
custom real-time
and historical
reports
Page 88

Using CentreVu Supervisor Reports
Minimizing Report Output Windows 2-46
CentreVu®
Supervisor Version 8 Reports
Report Type Icon
Split/skill realtime, historical,
and integrated
reports
Trunk/trunk
group real-time
and historical
reports
VDN real-time,
historical, and
integrated
reports
Vector real-time
and historical
reports
Icons associated with
minimized report
thresholds
If Report Thresholds are enabled, real-time and integrated reports
continue to update while they are minimized. If no Caution or Warning
threshold condition is curren tly being met, the report’s normal icon, as
shown on the previous table, displays on the toolbar and in the system
tray. If thresholds are being met, the report’s icon on the toolbar remains
the same, but the Caution or Wa rning threshold symbol appears in the
system tray.
The threshold symbols are as follows:
Threshold Type Icon
Caution
Threshold
Warning
Threshold
Page 89
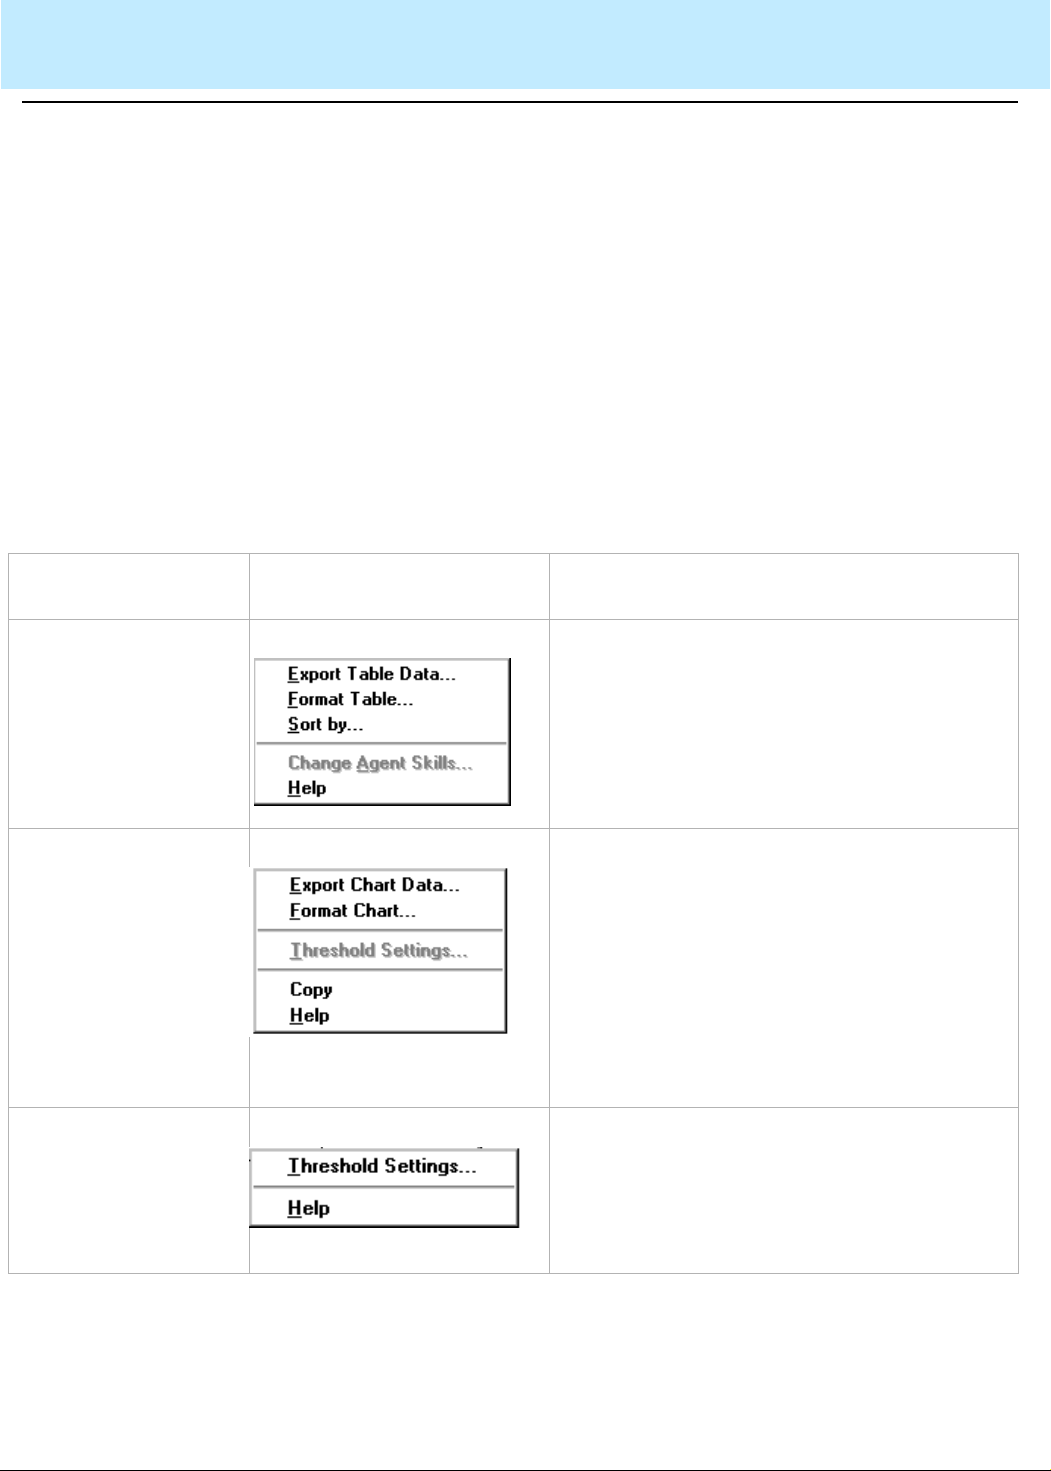
Using CentreVu Supervisor Reports
Right mouse button pop-up menus 2-47
CentreVu®
Supervisor Version 8 Reports
Right mouse button pop-up menus
.........................................................................................................................................................................................................................................................
Overview The right mouse button pop-up menu is available only in running report s.
When you click the right mouse button, a pop-up menu displays. The
menu that displays is dependent on where your cursor is located. It can
include options from the Edit, Format, and Tools menus on the Reports
menu bar. The appli cable menu items for the input field are enabled. If a
report object is not selected, a menu is not displayed when you hold
down the right mouse button.
To deselect a selected object, click anywhere else on the report.
The right mouse button pop-up menu is available when you do any of the
following actions.
Menus displayed
When you ... This pop-up menu
displays ...
Select a cell in a table
and hold down the
right mouse button.
Select an output field
or label and hold down
the right mouse button.
Select a data point in a
chart and hold down
the right mouse button.
And ...
A dotted border is drawn around the cell.
If you select a cell that displays an agent
name, agent number, or work mode, the
available drill-down report s for t hat c ell di spla y
at the top of the right mouse button menu. See
examples of these later in this section.
The data point is highlighted using sele ction
handles (dots along the edges of the data
point).
If you selected a data point that allows report
threshold highlighting to be set, the menu item
will not be grayed out.
A dotted border is drawn around the field.
The Threshold Settings menu item is enabled
if the highlighted field has related threshold
settings.
Page 90
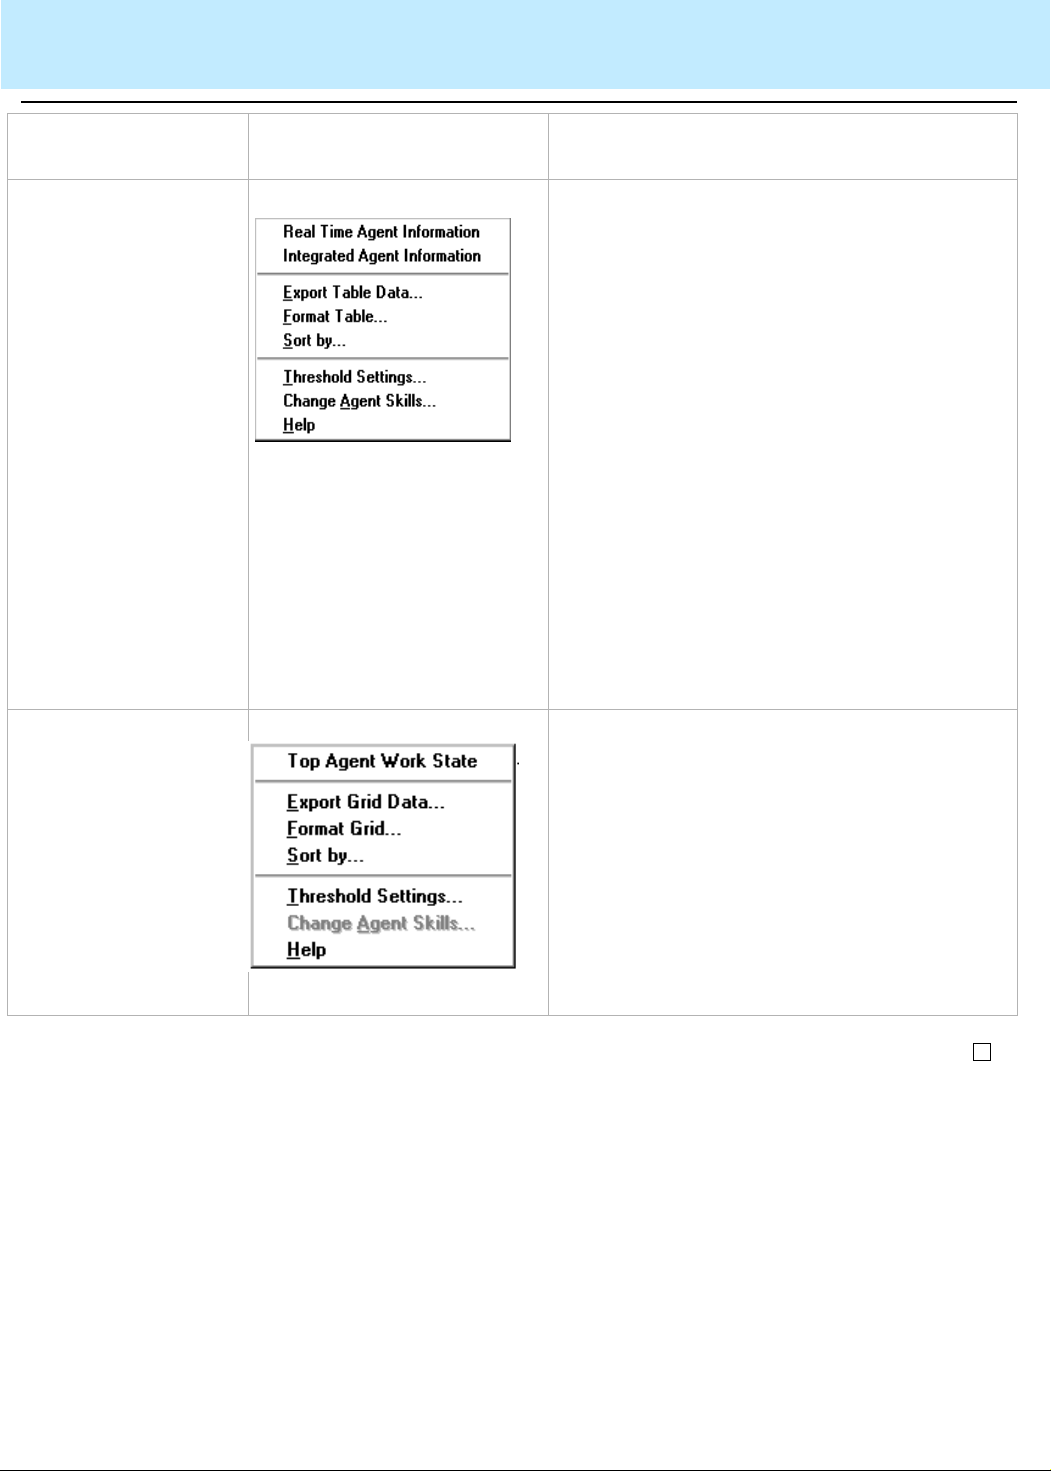
Using CentreVu Supervisor Reports
Right mouse button pop-up menus 2-48
CentreVu®
Supervisor Version 8 Reports
When you ... This pop-up menu
displays ...
Select an agent name
or agent number in a
table and hold down
the right mouse button.
And ...
A dotted border is drawn around the agent
name.
If you do not have the EAS feature on your
Enterprise Communications Server ( ECS) or
switch, the drill-down reports available will be
the Real-Time Agent Information report and
the Integrated Agent Information repor t.
From this menu, you can access either the
Real-Time or the Integrated Agent Graphical
Information report. If you double click on the
agent name and you are running a real-time
report, the default drill-down rep ort is the RealTime Agent Graphical Inf ormation report.
You can change an agent’s splits/skills while
you are in a report using this method of
selection. See the appropriate chapter in the
CentreVu® CMS R3V8 Administration
(585-210-910) guide for more information.
Select a cell on a table
or a point on a chart
that displays agent
work state information
and hold down the
right mouse button.
The data point is highlighted using selection
handles (dots along the edges of the data
point).
If you have the ECS or switch with the EAS
feature, the Real-Time AUX Agent drill-down
report will also be available.
From this menu, you can access the RealTime Split/Skill Top Agent Work State Report,
which also displays when you double click on
the work state in the report.
Page 91

........................................
........................................
........................................
........................................
........................................
E
.......................................................................
Using CentreVu Supervisor Reports
Rotating a 3D chart 2-49
CentreVu®
Supervisor Version 8 Reports
Rotating a 3D chart
.........................................................................................................................................................................................................................................................
Overview The rotation and elevation of any 3D chart can be changed interactively
using the mouse. This is easier than using t he 3D Eff ects tab of the Chart
Format window (see
using the 3D Effects tab).
How to rotate a 3D chart To change the rotation and elevati on of a 3D chart, do the foll owing steps:
................. ...... ... ..... ... ...... ... ...... ... ...... ... ...... .. ...... ... ...... ... ...... ... ...... ... ..... ... ...... ... ......
1 Place the pointer over a D chart.
................................................................................................................................
2 Press and hold the CTRL key. The pointer changes to indicate that the
chart can be rotated.
Formatting Chart Reports (2-35) for information on
................................................................................................................................
3 Click and hold the left mouse button. A dotted 3D outline appears
around the chart.
................................................................................................................................
4 Move the pointer up and down to change the chart elevation, and left
and right to change the chart r otation. The dotted 3D outline shows the
position of the chart as you move the mouse.
................................................................................................................................
5 When you find the rotati on and elevation you want, release the mouse
button. The chart is redrawn in the new position.
ND OF STEPS
..........................................................................................................
Result:
The 3D rotation and elevation of each chart is sav ed as part of the r eport
view .
Page 92

Using CentreVu Supervisor Reports
Exporting Report Data 2-50
CentreVu®
Supervisor Version 8 Reports
Exporting Report Data
.........................................................................................................................................................................................................................................................
Overview You can export the data from both standard (table) and graphical (chart)
reports, either to a file or to the
exported report data, you can copy the report information into another
application (for instance, a spreadsheet).
Defaults By default, only the data from the chart or table is exported. You can
select the Include Labels and Headers check box on the Export Data
window to include that information in the export of dat a.
Windows
clipboard. Once you have
Report form a t Reports are exported from
• Data is exported as ASCII characters.
• For table reports, each row of data is written as one line, termi nated
by a carriage return (ASCII value 13).
• The field separator character is written between fields.
• The field separator does not follow the last character in the line.
• Text strings are delineated according to the specified text delimiter.
CentreVu
Supervisor in the following format:
Page 93

........................................
........................................
........................................
Using CentreVu Supervisor Reports
Exporting Report Data 2-51
CentreVu®
Supervisor Version 8 Reports
How to export a data
report
To export the data from a report, do the following:
................................................................................................................................
1 Click on the table or chart within a report.
................................................................................................................................
2 Select Export Table Data or Export Chart Data or Export All Data, as
appropriate, from the Edit menu or the right m ouse button pop-up
menu.
Result: The Export Data window appears. The Export Data window
allows you to copy the data from a report to the clipboard or a file.
................................................................................................................................
3 Complete the following parts of the Export Data window:
• Destination selection box—choose to export the report to the
clipboard or to a file. If you are exporting the report to a file, you
need to type in a name for the file.
You can select the File button to browse the file s on y our PC, or use
the history list to select a file you previously used.
• Export Format selection box—define the export format of the report.
The character you choose from the drop- down list in the Field
Separator text box is what will be placed between each field in the
Page 94

........................................
........................................
E
.......................................................................
Using CentreVu Supervisor Reports
Exporting Report Data 2-52
CentreVu®
Supervisor Version 8 Reports
report. The character you choose for the Text Delimiter determines
what is used around text strings in th e exported file. If a text
delimiter is specified, no special checks are done to ensure that the
data does not contain that character and the data is written
unmodified.
If you want to export data to
Microsoft
ExcelTM, choose “Tab” as the
field separator and “None” as the text deli m iter.
• Export Null Values as Zero—select this check box to include data
that is null as a zero in the ex port of informat ion. This is hel pful if you
are exporting a table report because a null value that is not incl uded
in the export of the data could disrupt the order of the rows/columns
in the data.
• Include Labels and Headers check box—select this check box to
include the text information (such as co lumn headers in table
reports) in the export of the report's data.
• Export Time Durations in Seconds —select th is c heck bo x to incl ude
the time duration in the export of information.
................................................................................................................................
4 If you want to automatically export data on a schedule, select the
Script button to display th e Save as Script dialog box. This dialog box
will create a script to export data from the re port.
................................................................................................................................
5 Select OK in the Export Data window.
ND OF STEPS
..........................................................................................................
Page 95

........................................
........................................
........................................
E
.......................................................................
Using CentreVu Supervisor Reports
Copying Chart Reports 2-53
CentreVu®
Supervisor Version 8 Reports
Copying Chart Reports
.........................................................................................................................................................................................................................................................
Overview You can copy chart reports to the
How to copy chart
reports
Windows
selected chart report is copied to the clipboard in the
clipboard. The copy of the
Windows
metafile
(*.wmf) format. This allows you to paste the char t image into any
Windows
application that can read the metafile format. For i n stance, you
can copy chart reports and import the files into word processing files to
be used as viewgraphs.
To copy a chart report to the metafile format, do the following steps:
................................................................................................................................
1 Run a chart (graphical) report.
................................................................................................................................
2 Select the image that you want to copy by clicking on it.
................................................................................................................................
3 Select Copy from the Edit menu or use the right mouse button menu
to select Copy.
ND OF STEPS
..........................................................................................................
Results:
The chart you selected is copied to the clipboard.
Page 96

Using CentreVu Supervisor Reports
Resizing Report Windows and Columns 2-54
CentreVu®
Supervisor Version 8 Reports
Resizing Report Windows and Column s
.........................................................................................................................................................................................................................................................
Resizing a window You can resize report windows by moving the cursor to the edge of the
window and, when the resize arrow appears, hol ding down the left mouse
button and moving the mouse to size the window. When the window is
the size you want it, release the mouse button.
You can also use the maximize and minimize buttons at the top of the
window to size the window.
When you resize a
resulting eff ect depends on the type of report (standard or graphical ) you
are running. The following paragraph s outline the effects of resizing each
type of report window.
CentreVu
Supervisor report output window, the
Standard Supervisor
report window
Graphical report window When you resize the window of a graphical report, the contents of the
Changing a column
width
When you resize the window of a standard report, the contents of the
window do not change in size to reflect the new window size.
If you made the window small er than the size of the repor t, scrol l bars will
appear to allow you to view the entire contents of the report.
window will change in size to reflect the new window size.
If a window is made too small, some elements may shrink in such a way
to become unreadable. If this happens, resize the window to a more
appropriate size. You may also choose to turn chart legends or data
labels off to make more room for the chart itself.
The window size is saved as part of the report view.
You can change the width of an individual table column in a table or chart
report by positioning the mouse pointer between the column header s.
The pointer will change to indicate that a resize is possible, and you can
then drag the mouse to change the column size.
Page 97

........................................
Using CentreVu Supervisor Reports
Selecting a Printer 2-55
CentreVu®
Supervisor Version 8 Reports
Selecting a Printer
.........................................................................................................................................................................................................................................................
The Print setup window is a standard
Print setup options The following options are available in the Print setup window:
Windows
Print window.
• Default Printer — the default printer assigned by you in t he
Control Panel will be used.
• Specific Printer — you can choose any printer that has been
installed in the
included in the drop-down list. Depending on what printe rs are
installed, non-printer devi ces such as file s and fax may appear her e.
Other entries in this window will vary dependi ng on the capabi lit ies of t he
chosen printer. The
available here and what happens if the Properties button is selected.
These variations are not described here since
options.
How to select a printer To access the Print setup window, do the following:
................................................................................................................................
Windows
Windows
Control Panel. All installed printers are
system software determines what is
Windows
1 Select a report (from Reports, Dictionary, Exceptions, Agent
Administration, Call Center Administration, or Maintenance).
Windows
controls these
Page 98

........................................
E
.......................................................................
Using CentreVu Supervisor Reports
Selecting a Printer 2-56
................................................................................................................................
CentreVu®
Supervisor Version 8 Reports
2 On the report input window, select the Print setup button.
Result: The Print setup window displays.
ND OF STEPS
..........................................................................................................
Page 99

Using CentreVu Supervisor Reports
Setting Up a Page 2-57
CentreVu®
Supervisor Version 8 Reports
Setting Up a Page
.........................................................................................................................................................................................................................................................
Overview The Page Setup window allows you to specify how each page of a repor t
is positioned when printed. The changes you m ake in this window apply
only to printed reports and do not aff ect reports displayed on-screen.
The Page Setup window is a standard
Page setup options The following options are available in the Page Setup window:
Windows
• Margins — allows you to define the spaces at the edges of the page
where nothing will be printed.
• The margin settings are defined as follows:
– Top — the margin is measured from the top of the page. The
report is offset by this amount at the top of each page.
– Bottom — the margin is measured from the bottom of the page.
When a printed table reaches the bottom of the page, it will
continue printing at the top of the next page , with the table titl es
repeated. If a chart would overlap the bottom margin, it wil l be
scaled smaller so that it fits withi n the margin. Text that reaches
the bottom of the page will be printed on the next page.
– Left — the margin is measured from the left of the page. The
report is offset by this amount on the l eft of each page.
– Right — the margin is measured from the right of the page .
Tables and text that are too wide to fit on the printed page are
truncated at the right margin. Charts that would overlap the
right margin are scaled smaller to fit within the margin.
• Page Numbers — allows you to choose whether or not to display
page numbers.
• The following settings are valid:
– Yes — page numbers will be displayed.
– No — no page numbers will be displayed. This is equivalent to
the way
CentreVu
Supervisor currently prints reports.
• Box Around Tables — allows you to choose whether or not to
display a box around report tables when printed.
• The following settings are valid:
– Box — boxes will be displayed.
– No Box — boxes will not be displayed.
print window.
Page 100

........................................
........................................
........................................
........................................
E
.......................................................................
Using CentreVu Supervisor Reports
Setting Up a Page 2-58
CentreVu®
Supervisor Version 8 Reports
How to set up a page To access the Page Setup window, do the following steps:
................................................................................................................................
1 Select a report (from Reports, Dictionary, Exceptions, Agent
Administration, Call Center Administration, or Maintenance).
................................................................................................................................
2 Complete the report input window, selecting View Report On Screen
as the destination.
................................................................................................................................
3 Select OK to run the report.
................................................................................................................................
4 Once the report is running, select Page Setup from the Report menu.
ND OF STEPS
..........................................................................................................
Result:
The Page Setup window displays.
 Loading...