

Page 1
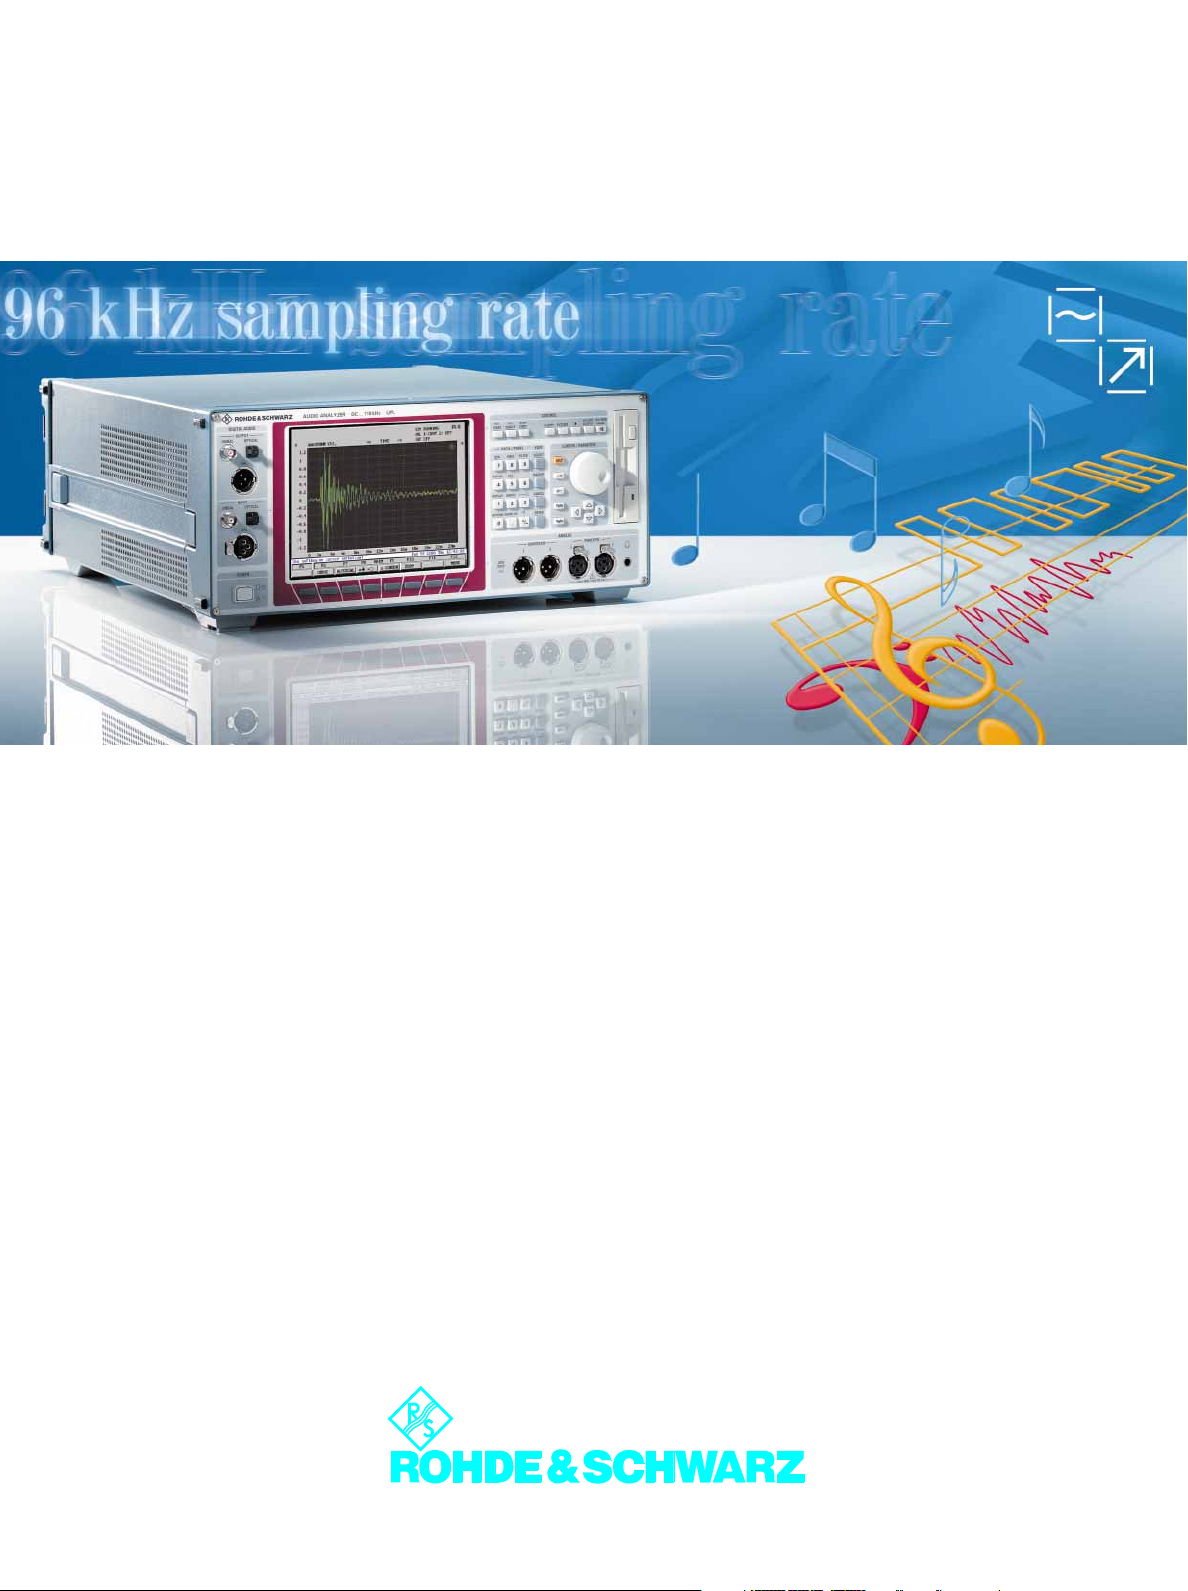
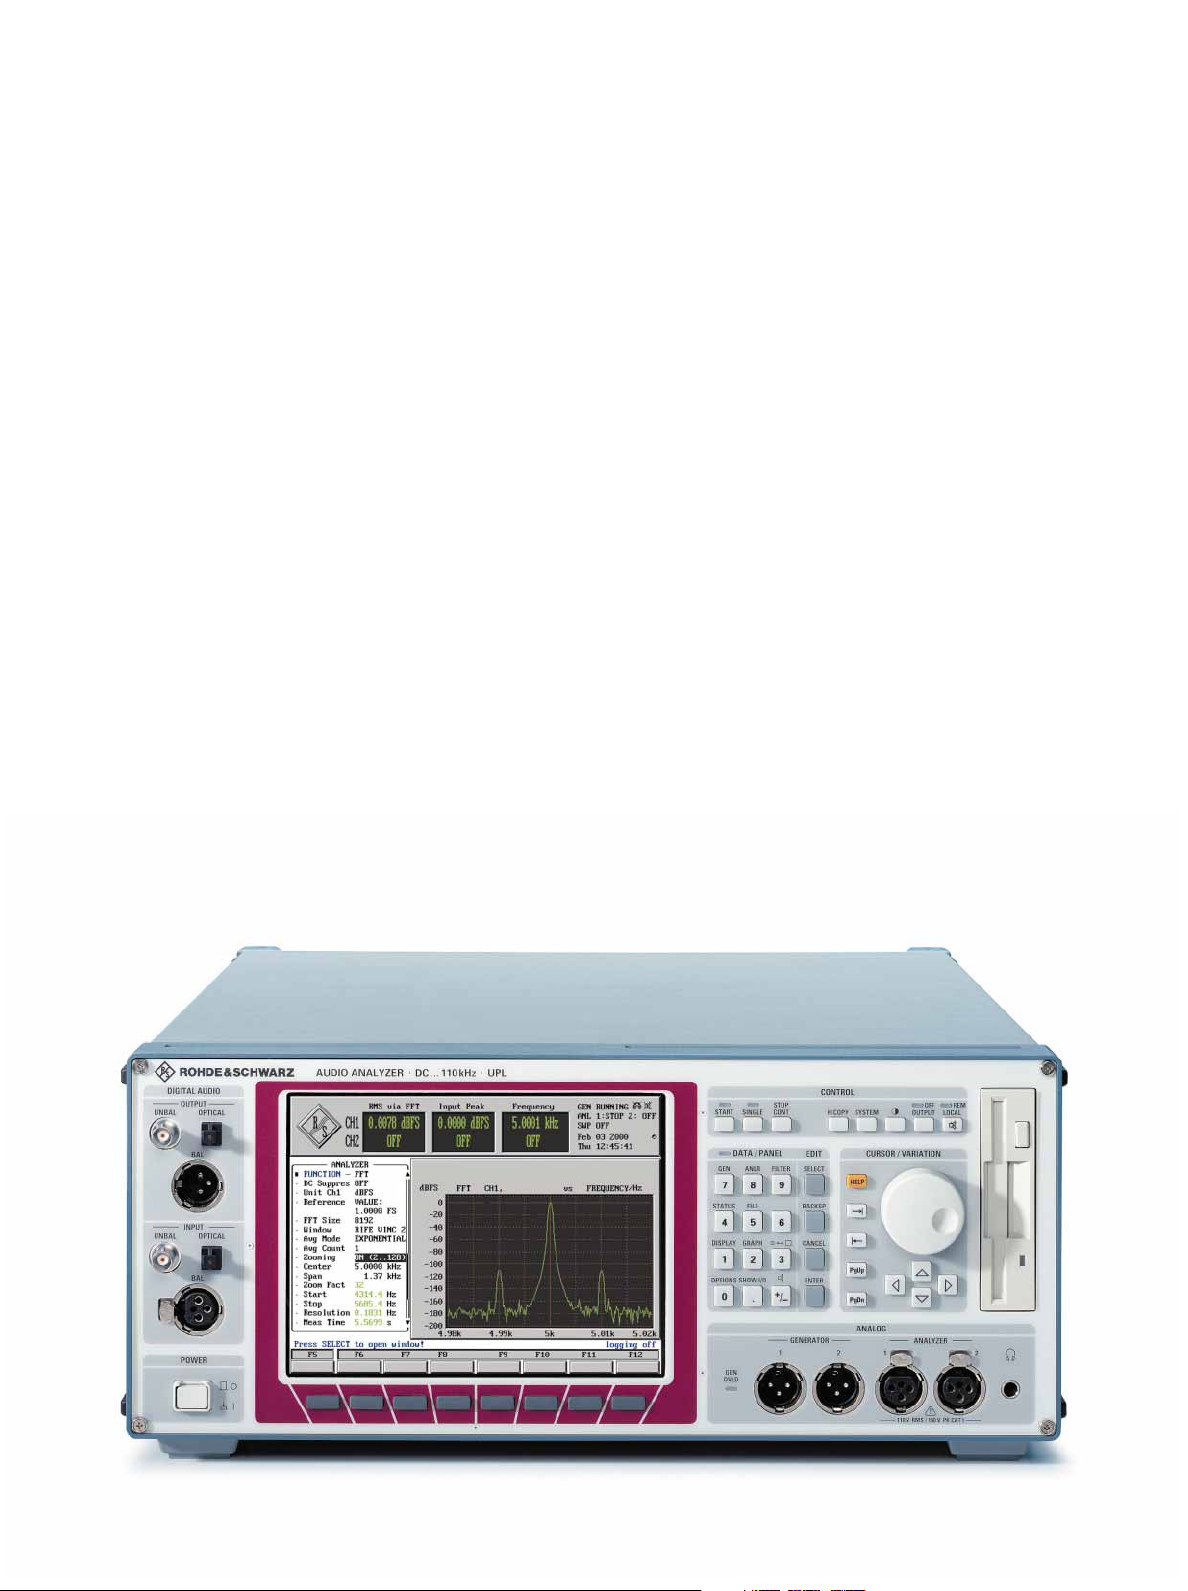
Audio Analyzer UPL
T h e solution for the budget-conscious
• For all interfaces:
analog, digital and combined
• Real dual-channel measurements
• Maximum dynamic range
• FFT analysis
• Jitter analysis
• Interface tester
• Freely programmable filters
• Versatile functions
• Compact unit with integrated PC
• Automatic test sequences
• Extensive online help
Page 2
Audio analysis today and tomorrow
Analog and digital
Audio signal processing is nowadays
no longer conceivable without the use
of digital techniques. Yet, analog technology continues to exist and undergoes constant improvement. State-ofthe-art measuring instruments must
therefore be able to handle both analog and digital signal processing.
Audio Analyzer UPL performs practically all types of analog measurement,
from frequency response measurements through to externally controlled
sweeps with reference traces, determination of 3rd-order difference frequency distortion, spectral display of
demodulated wow and flutter signals,
etc. In contrast to many other audio
analyzers, UPL is capable of performing real dual-channel measurements in
the audio-frequency range, ie there is
no need for switch-over between two
inputs and this type of measurement is
not limited to a few special cases.
The generator is every bit as versatile:
it supplies any conceivable signal from
sinewave and noise signals through to
multi-sinewave signals comprising up to
7400 frequencies.
In addition to all this, UPL features
excellent technical data: analog sinewave generation with harmonics of
typ. −120 dB, spectrum displays with
a noise floor below −140 dB for analog and −160 dB for digital interfaces,
FFT with a maximum frequency resolution of 0.05 Hz, etc.
UPL provides signal monitoring via
loudspeaker, jitter measurements on
digital audio signals, resynchronization of jittered digital audio signals by
means of a jitter-free clock signal, and
many more features.
Superior analysis concept
UPL performs all measurements using
digital signal processing. Analog signals to be tested undergo elaborate
preprocessing before they are digitized and measured by means of digital routines. For example, in THD
measurements, the fundamental is
attenuated by means of a notch filter
and the residual signal amplified by
30 dB before it is digitized. In this way,
the dynamic range can be extended
2 Audio Analyzer UPL
2 Audio Analyzer UPL
Page 3
beyond that offered by the internal
20-bit converter. This provides sufficient margin for measuring converters
of the future, which will be technically
more advanced than those of presentday technology (see graph below). This
concept guarantees performance and
flexibility by far superior to instruments
providing purely analog or digital
measurements.
Performance
Purely
digital
measurements measurements
Purely
analog
• The filters, too, are implemented
digitally, resulting in an infinite
number of filters as it were, and
this also for measurements on analog interfaces. Simply choose the
type of filter (eg highpass), cutoff
frequency and attenuation: that’s
all you have to do to loop a new
filter into the test path
Digital
analysis
and analog
preprocessing
A future-proof investment
Nobody can accurately predict today
what effects future developments in digital technology will have on the audio
world and what will be the resulting test
requirements. This is however no problem for Audio Analyzer UPL. Since all
test functions are implemented digitally,
UPL can be adapted to changing
requirements by simply loading the
necessary software – and this also for
the analog interfaces.
And one more thing: Rohde & Schwarz
is the only manufacturer to equip its
audio analyzers with 32-bit floatingpoint signal processors throughout,
thus offering plenty of reserves beyond
the limits of today’s common 24-bit
technology.
The intelligent combination of analog and digital measurement
techniques paves the way for future applications
The above measurement concept offers
many other advantages over merely
analog concepts:
• In intermodulation measurements,
spurious components are measured selectively for all frequencies
in accordance with the mathemati-
• The test routines for analog and
digital interfaces are identical. This
allows, for instance, the direct
comparison of IMD measurements
made ahead of and after a converter
• All test functions are available both
on the analog and the digital interfaces. This makes it possible to
measure at any point of a common
analog and digital transmission
path. Only this ensures efficient
and complete testing
cal formula of the relevant test
standards. This procedure avoids
the measurement of adjacent components along with the spuria,
which is usually inevitable with analog test methods
• Measurement speed is as a rule
higher than with analog techniques
since digital test routines can
adapt their speed to the input frequency. And – last but not least:
• Operation is the same for the analog and the digital interfaces. A
feature that should not be underestimated
Certified Quality System
ISO 9001
DQS REG. NO 1954-04
A competent partner
The name of Rohde & Schwarz stands
for excellent quality – thousands of
audio analyzers have proven records
at satisfied customers and have been in
operation successfully for many years.
After the purely analog UPA and UPD,
which still holds the top position in
today’s audio measurement technology,
Audio Analyzer UPL has been developed to complete the product line.
As a competent partner we shall be
pleased to advise you on the optimum
use of our instruments. Our representatives are available for you all over the
world, and our customer support center
and application engineers in Munich
help you find the right solution to your
measurement tasks. In addition, you
will find a wealth of proposals and
solutions in our application notes and
software.
Naturally, Rohde & Schwarz instruments are certified in compliance with
ISO 9001 and ISO 14001.
Audio Analyzer UPL 3
Page 4
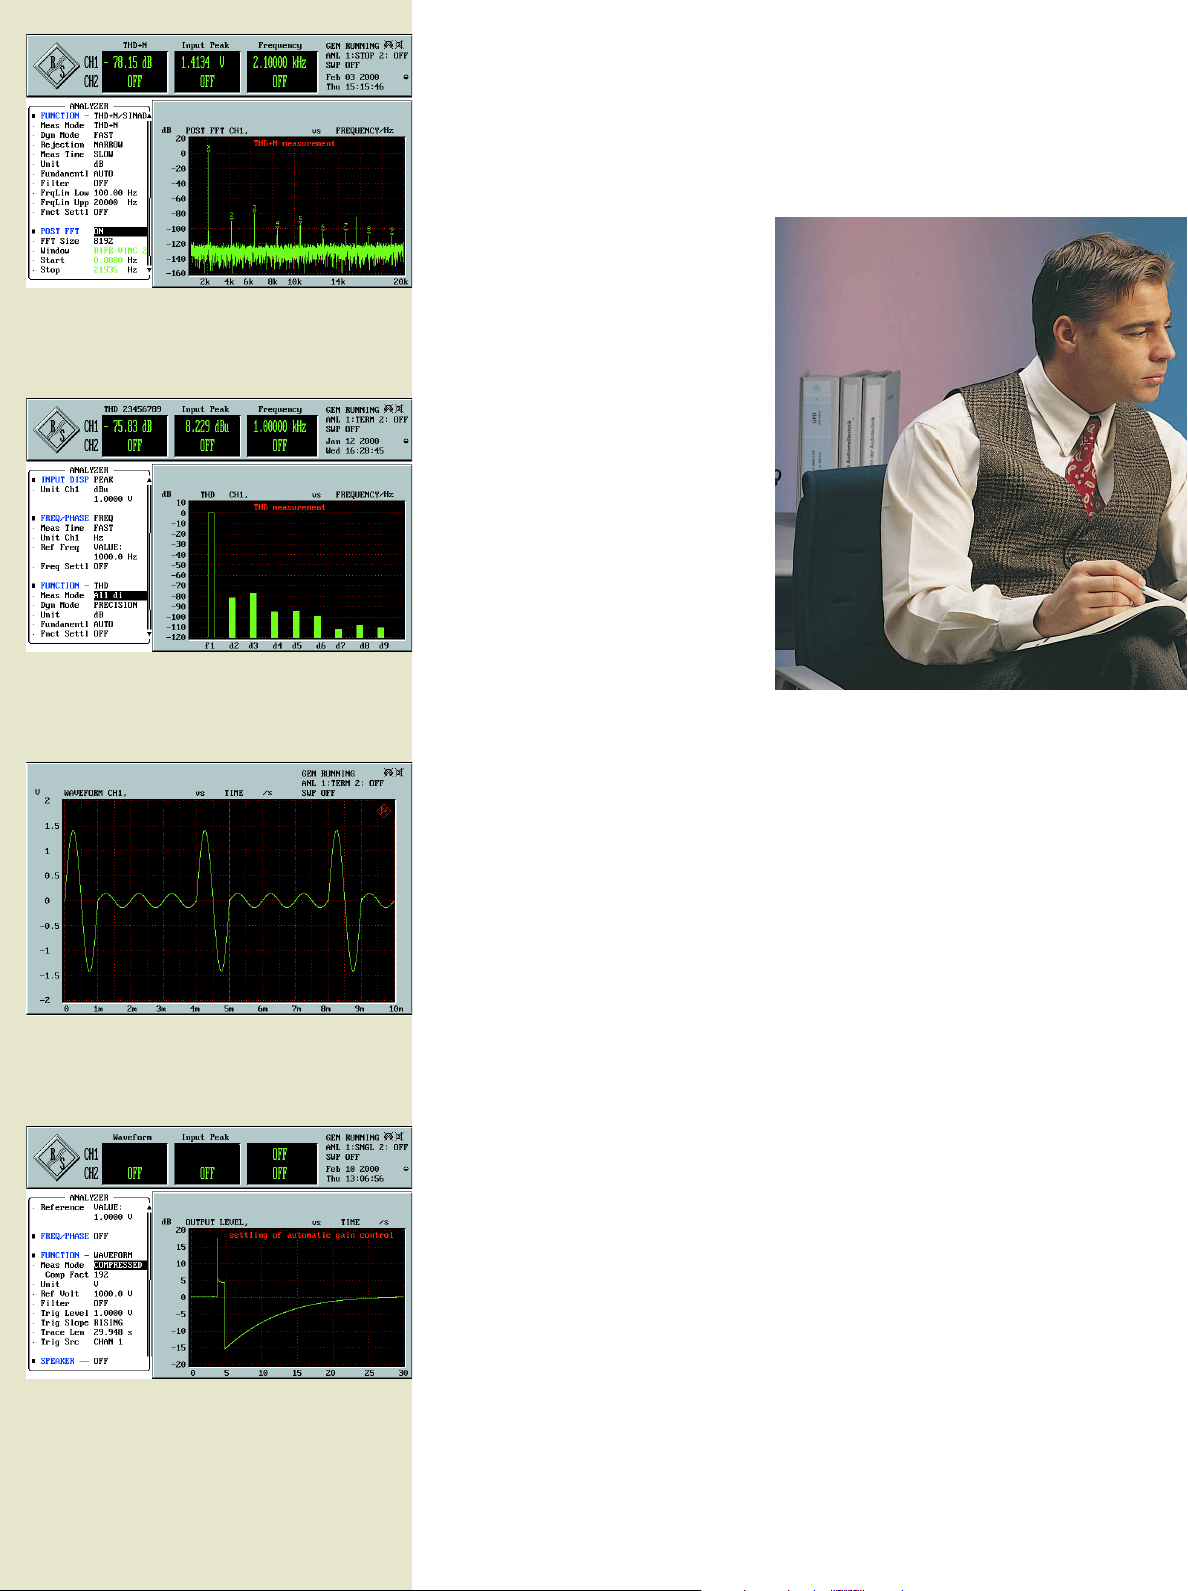
Fig. 1: Automatic marking of harmonics in THD+N measurements makes nonharmonics visible at a glance
Fig. 2: In THD measurements, single harmonics, all harmonics
or any combination of harmonics can be measured
Fig. 3: The waveform function displays the test signal in the
time domain. The example shows a sinewave burst
Fig. 4: The transient characteristics of an AGC play an important role in testing hearing aids or automatic volume control on
tape recorders
Test signals – as you like it
The generators of UPL supply an
extremely wide variety of analog and –
with options UPL-B2 or UPL-B29 –
digital test signals:
• Sinewaves
for level and harmonic distortion
measurements. The signal can be
applied to an equalizer with userselectable nominal frequency response, eg for compensating the
frequency response of the test assembly
• Two-tone signal
for modulation distortion analysis.
Various amplitude ratios can be selected and the frequencies are continuously adjustable
• Difference tone signal
for intermodulation measurements
with continuous setting of both frequencies
• Multitone signal
comprising up to 17 sinewaves of
any frequency and with the same
or different amplitude; setting the
phase is also possible with UPL-B6
• Sine burst signal
with adjustable interval and ontime as well as programmable low
level, eg for testing AGCs
2
• Sine
• Special multitone signal
burst
also with adjustable interval and
on-time, eg for testing rms rectifier
circuits
comprising up to 7400 frequencies
with selectable amplitude distribution. The frequency spacing can be
linked to the resolution used for the
fast Fourier transform, thus enabling rapid and precise singleshot measurements of the frequency response of a DUT
An allrounder
• Noise
with a variety of probability distributions, eg for acoustic measurements; setting of crest factor with
UPL-B6
• Arbitrary waveforms
for generating any voltage curve
of up to 16k points. Test signals
can be output in different file formats, eg voice and music signals
stored as WAV files
• Two-channel sinewave signals
for the two digital output channels
when UPL-B6 is used
• AM and FM
for sinewave signals
• DC
also with sweep function
Signals can be generated with an
offset. Moreover, digital audio signals
can be dithered with adjustable level
and selectable amplitude distribution.
4 Audio Analyzer UPL
Page 5
Versatile test functions
UPL offers a wealth of measurement
functions both for analog and – with
option UPL-B2/-B29 – for digital interfaces.
• Level or S/N
with rms, peak or quasi-peak
weighting;
high measurement speeds due to
automatic adaptation of integration times to input signal
• Selective level
The center frequency of the bandpass filter can be swept or coupled
to the generator frequency, to the
frequencies of a multitone signal (eg
for fast frequency response measurements) or to the input signal
• SINAD or THD+N
The sum of all harmonics and noise
is measured (Fig. 1)
• Total harmonic distortion (THD)
Individual harmonics, all the harmonics or any combination of harmonics can be measured (Fig. 2)
• Modulation distortion
to DIN-IEC 268-3. 2nd and 3rd order intermodulation is measured
• Intermodulation
using the difference tone method.
2nd and 3rd order intermodulation
is measured
• Wow and flutter
to DIN IEC, NAB, JIS or the
2-sigma method to DIN IEC where
the demodulated-signal spectrum is
also displayed
• DC voltage
• Frequency, phase and group delay
• Polarity
Signal paths are checked for
reversed polarity
• Crosstalk
• Waveform function
for representing the test signal in the
time domain (Fig. 3). Waveforms
can be smoothed by interpolation.
Slow sequences can be displayed
compressed, eg for analyzing the
transient response of compander or
AGC circuits (Fig. 4)
•
Extended Analysis Functions
UPL-B6:
coherence and transfer functions
for determining the transfer characteristics of complex test signals;
third octave analysis
mainly for
acoustic measurements;
rub & buzz
measurements in loud-
speaker production
Tests on hi-fi components call for increasingly complex measurement techniques. Results
obtained in the test lab must be verified in production, where as a rule not the whole range
of test functions is needed but economical solutions to cater for large batches. UPL is an
ideal choice for this task. It optimally complements its “bigger brother“, Audio Analyzer
UPD, which is mainly employed in development. The operating concept of the two units
based on the same IEC/IEEE-bus commands is identical, so there is no problem using them
jointly
Audio Analyzer UPL 5
Page 6
All-in package
Fig. 5: FFT spectrum of two-tone signal shown on full screen
Fig. 6: With the zoom FFT function, sidebands spaced only a
few hertz from the signal can be displayed
Fig. 7: Filters can be defined by entering just a few
parameters
Spectrum analysis
With its FFT analyzer, UPL is also capable of spectrum analysis. The number of
samples for fast Fourier transform can
be selected between 256 and 16k in
binary steps (Fig. 5). A special feature
is zoom FFT. The signal to be measured
is digitally preprocessed to increase the
frequency resolution by a factor of 2 to
128 over a selectable range. In this
way, a maximum resolution of 0.05 Hz
is attained. It should be emphasized
that this is not just a scale expansion
but the measurement is really made at
a higher resolution (Fig. 6).
Programmable filters
The filters of UPL are software-implemented so that the user can define any
number of filters. The most common
weighting filters are provided as
standard. Further filters can be programmed in a few seconds by entering the type (lowpass, highpass, bandpass, bandstop, notch, third octave or
octave), frequency and attenuation
(Fig. 7). The instrument’s open architecture shows its strength in particular
where special requirements have to be
met: special filters can be implemented using commercial filter design
programs. The data are transferred to
UPL and the created filter is looped
into the signal path.
A variety of sweep functions
For continuous variation of the test
signals, UPL offers amplitude and frequency sweeps and for bursts additionally sweeps of interval and ontime. Sweeps are defined either by
means of a table or via parameters
such as start value, number of steps,
linear/ log stepping or time interval. It
is also possible to sweep two variables simultaneously.
In measurements of external signals,
these can be used for analyzer sweeps
(external sweeps). Many different start
conditions can be set, allowing measurements to be triggered by a variety
of events. Results will be stable even
for DUTs with unknown or unstable
transient response thanks to the
settling function.
Fig. 8: Tolerance curves enable fast go/nogo tests
6 Audio Analyzer UPL
Page 7
The strengths of UPL
show up especially in
mobile use. The unit is
compact and lightweight and requires no
additional equipment.
Results are stored in the
built-in PC and thus
available for later use.
Routine measurements
can be repeated easily
using stored instrument
settings
Audio Analyzer UPL is a compact unit
with an integrated controller. It avoids
the disadvantages of external PC control, which is found in other audio analyzers.
The instrument is easy to transport as it
requires no external equipment such
as keyboard, monitor or other PC
peripherals.
UPL features elaborate screening such
as magnetically shielded power transformers and coated filter pane in front
of the display.
And a real boon: the price of UPL
includes the internal PC.
• Built-in hard disk and disk drive
• Connectors for keyboard, mouse,
monitor, printer and plotter
• Centronics interface for connecting
printer or network
• Drivers for commercial printers are
supplied as standard
• Remote control via IEC/IEEE bus or
RS-232-C interface
• Postprocessing of results directly in
UPL using standard software
• All results available in the common
data formats, making it easy to import graphics into documents, for
example
• Easy loading of function and software extensions via floppy disk
• Automatic test sequences and measurement programs with universal
sequence controller. Easy generation of programs with built-in program generator
UPL is supplied ready for use. Installation is nothing more than unpacking
the unit and switching it on for starting
the measurement. The user is not burdened with problems that cropped up
in the past with the installation of interface cards or PC software.
With audio analyzers controlled from
an external PC, interference may be
radiated from the PC, monitor or interface connections, which distorts measurement results. Not so with UPL: the
instrument has specified EMC characteristics which also include the internal
PC. In contrast to conventional PCs,
Audio
monitor
(option)
Balanced
Analog
pre-
processing
Analyzers
Disk
drive
Centronics
Digital
analysis
Hard disk
RS-232-C
Unbalanced
Optical
Balanced
Reference
Sync
Sync
Digital I/Os (option)
Software options:
- digital interface analysis
- digital protocol analysis
- automatic sequence controller
- extended analysis functions
External keyboard External monitor
RS-232-C
Reference
Optical
Unbalanced
Balanced
Digital
signal
generation
Block diagram of UPL
Balanced
Low distortion
Analog
outputs
Generators
generator
(option)
IEC/IEEE
bus
(option)
Audio Analyzer UPL 7
Page 8
Interfaces, protocol analysis, jitter
Fig. 9: Individual interference components can easily be
found with the aid of the jitter spectrum
Fig. 10: Display of jitter signal in time domain
Fig. 11: Complete measured-value tables can be output for
all functions
Fig. 12: UPL generates and analyzes additional data in digital data streams in line with all common standards. The data
are represented in binary form, as hexadecimal numbers, as
ASCII characters or evaluated in consumer or professional
format
Analog interfaces
• Balanced inputs with high commonmode rejection and various impedances commonly used in the studio.
Measurements can be made on
lines with phantom feed
• Balanced outputs, floating (eg to
prevent hum loops)
• The generator outputs can be internally connected to the analyzer
inputs so that different types of
measurement can be made without
the need for changing the cabling
Digital audio interfaces
(options UPL-B2 and UPL-B29)
• Balanced (XLR), unbalanced (BNC)
and optical (TOSLINK) inputs and
outputs for connecting consumer
electronics and professional studio
equipment
• The levels of the balanced and unbalanced outputs are adjustable so
that the sensitivity of digital audio
inputs can be determined
• The format of the generated channel status data may be professional or consumer irrespective of the
selected interface
• A reference (XLR) and a synchronization (BNC) input provided on the
rear panel allow both the analyzer
and the generator to be synchronized to the digital audio reference
signal (DARS) to AES 11, and the
generator in addition to wordclock, video sync signals (PAL/
SECAM/NTSC) and to 1024 kHz
reference clocks
• Both generator and analyzer can
be driven at clock rates of 35 kHz
to 106 kHz. The clock signal can
also be produced internally by the
generator
• The clock rates of the analyzer and
generator are independent of each
other. This allows measurements on
sample rate converters
• The word length can be selected
between 8 and 24 bits independently for generator and analyzer
Improvement of audio quality of sound cards and multi-
media equipment – a task for UPL
Digital protocol analysis and
generation (option UPL-B21)
This software option extends the functions of options UPL-B2 and UPL-B29 by
an in-depth analysis and generation of
additional digital data:
• Analysis of channel status and user
data. The data are output in binary
form, as hexadecimal numbers, as
ASCII characters or, in the case of
channel status data, evaluated in
the professional or consumer format to AES 3 or IEC 958 (Fig. 12)
8 Audio Analyzer UPL
Page 9

• Generation of channel status data, user data and validity bits.
Channel status data can be entered in binary form or via panel to
AES 3 or IEC 958 in the professional or consumer format
• Any bits can be combined under a
symbolic name. In this way, data
input and representation can easily
be adapted to customer’s requirements
• Simultaneous measurement of
clock rate and display of interface
errors (such as parity error)
Jitter and interface tests
(option UPL-B22)
With this option, the physical parameters of digital audio interfaces can be
examined. UPL-B22 extends the functions of options UPL-B2 and UPL-B29.
Digital components of various data formats and clock rates are the stock-in-trade of professional users. They call for a measuring instrument offering top performance at all interfaces
at high accuracy and over a wide dynamic range. Operation is identical for analog and
digital interfaces, which enhances operator convenience. Fast fault diagnosis is possible
by means of stored test routines, allowing the elimination of problems immediately before
transmission
Signal analysis:
• Measurement of jitter amplitude
and display of jitter signal in the
frequency and time domain (Figs 9
and 10)
• UPL generates bit- or word-synchronous sync signals that allow the
accurate display of digital audio
signals on an oscilloscope (preamble, eye pattern, signal symmetry,
superimposed noise, etc)
• Measurement of input pulse amplitude and sampling frequency
• Measurement of phase difference
between audio and reference input
signal
• Measurement of time difference
between output and input signal.
This allows delay times of equalizers, audio mixers, etc to be measured
• Analysis of common-mode signal
of balanced input (frequency,
amplitude, spectrum)
Signal generation:
• The clock of the output signal can
be “jittered“ by superimposing a
sinewave or noise signal of variable amplitude
• When generating digital audio
data – with option UPL-B1fitted –
jitter and common-mode interference may be added to the data
stream
• An input signal with jitter can be
output jitter-free
• A common-mode signal can be
superimposed on the balanced
output signal
• Long cables can be simulated by
means of a switchable cable simulator
• The phase shift between the digital
audio output and the reference output can be varied
Audio Analyzer UPL 9
Page 10

Efficient online help
UPL offers a variety of help functions to
provide optimum support for the user:
HELP function
HELP information in German or English
can be called for each input field.
SHOW I/O key
If no results can be displayed, eg
because no input signal or an incorrect
input signal is present, information on
possible causes will appear upon
pressing SHOW I/O. Moreover, the
input and output configuration will be
displayed.
Info boxes
These highlighted boxes inform the user
of any incorrect settings.
Online help
The permissible range of values is indicated for each menu item requiring the
entry of a numerical value. This range
takes into account any limitations resulting from related parameters, eg the
sample rate in the case of measurements on digital interfaces.
Protection against illegal entries
UPL will not accept entries outside the
permissible range. An alarm tone will
be issued and the value changed to
the permissible minimum or maximum
value.
Designed for convenience
A wealth of functions – yet easy to operate
• Related functions and settings are
combined in panels that can be
called at a keystroke. Up to three
panels can be displayed at a time
• The operator is not burdened with
unnecessary information. Only the
parameters and settings needed
for a given application are displayed – the others are available
in the background. (For example,
the sweep parameters are transferred to the generator panel and
displayed only when the sweep
function is activated.)
• Fast access to frequently used instrument setups and a comprehensive library of standard measurements simplify familiarization with
the instrument
• Uncomplicated entries: the user
simply needs to open a menu and
make an entry or selection
• Continuous status information on
generator, analyzer and sweep
• Rapid operating sequences through
the use of softkeys, eg for graphical
representations
• The user can choose between operation via mouse, external keyboard or front panel. This choice
makes sense since the working
space required by a mouse is not
always available
• Short learning time thanks to an
easy-to-understand operating concept treating analog and digital
measurements in the same way
10 Audio Analyzer UPL
Page 11

Results at a glance
• Real-time display of results for one
or both channels and several test
functions
• Simultaneous display of frequency
and phase
• With graphics, results can be read
off with vertical and horizontal cursors. Tolerance curves or stored
results can be added for comparison
• Sets of traces can be displayed,
stored and evaluated for both
channels
• Graphics modes range from traces
and bargraphs through spectrum
display to three-dimensional waterfalls
It is often the case that only a few
parameters need to be modified after
a measurement sequence has been
started. Therefore, entry lines can be
selected from the input panels for the
generator, analyzer, etc, by marking
them with a tick. They are then transferred to a status panel. The status
panel thus gives a summary of parameters for a measurement routine,
which offers the following advantages:
• Instrument settings can be displayed
together with graphical and numerical results
• All important information can be
printed on a single hardcopy
• Instrument settings can be modified
quickly without changing panels as
UPL can also be operated from the
status panel
Audio Analyzer UPL 11
Page 12

Fast and efficient
High measurement speed
In designing Audio Analyzer UPL,
particular emphasis was placed on
optimizing the measurement speed of
the test system as a whole:
• All operations involving elaborate computing are carried out by
digital signal processors. The PC
is merely used for control of the
unit and display of results
• UPL can perform even complex
test functions simultaneously on
both channels. This feature alone
reduces the time for stereo measurements by 50% compared with
most analyzers available on the
market
• The digital test routines adapt
their speed optimally to the input
frequency. This enhances measurement speed especially in the
case of frequency sweeps
• UPL performs harmonic distortion and IMD measurements using patented, digital test procedures that combine high accuracy with high measurement speed
• Digital signal processing reduces setting and transient times
achievable with purely analog
instruments. These times are also
taken into account in the test routines, yielding stable measurements without the need for activating settling functions (these
are understood to be repeated
measurements until results are
within a tolerance band)
• The user interface was tailored to
the requirements of a test, not of an
office environment
• Display windows not needed can
be switched off, which also cuts
down the processing time. When
all displays are switched off and
results are output via the IEC/IEEE
bus, more than 100 level measurements per second can be made
Use in production
Instruments to be used in production
tests must satisfy a variety of requirements:
• High measurement speed is vital
for achieving a high production
throughput. By making appropriate use of the instrument functions,
go/nogo decisions can be made
already in the audio analyzer, thus
reducing the run time of a DUT
(Fig. 8)
• Two-channel measurements allow
the simultaneous and thus timesaving determination of input and
output characteristics
• The use of FFT analysis provides a
decisive advantage especially in
the case of frequency response
measurements, which are particularly time-critical (example:
approx. 900 frequency values in
150 ms)
• Long calibration intervals, resulting
from the extensive use of digital
circuits, make for high availability
of the instrument
• Model UPL66 is specially tailored
to the requirements of production.
It comes without a display and keypad, thus saving purchasing costs.
Yet the unit can be operated manually by connecting a PC keyboard
and a VGA monitor, enabling fast
fault localization in the event of
production problems
UPL66 – special model for use in test systems,
with the full flexibility of the standard model
12 Audio Analyzer UPL
Page 13

High measurement speed, two-channel
measurements and remote-control
capability via the IEC/IEEE bus are a
must in production systems. The long
calibration intervals of UPL make for
high availability and reduce running
costs
• Remote-control capability via the
IEC/IEEE bus is a must in large-scale
production systems. In the design of
Audio Analyzer UPL, special importance was attached to data transfer
via the IEC/IEEE bus. The logging
mode can be used to speed up the
generation of control programs for
the IEC/IEEE bus. With the program
generator provided in UPL-B10, it is
no longer necessary to look up IEC/
IEEE-bus commands
Universal Sequence Controller
UPL-B10
allows measurement sequences to be
generated and executed, thus turning
UPL into an automatic test system. Programming of measurement sequences
is greatly facilitated by the built-in
program generator:
Each manual control step is recorded
in the logging mode and translated
into a complete line of the sequence
program with correct syntax, ie test
sequences can be programmed without a single line to be typed by the
user. The program thus generated
does not just give the sequence of keys
to be pressed but contains the instructions in easy-to-read IEC/IEEE-bus
syntax according to SCPI.
BASIC commands can then be used to
modify the program, eg for branching
or graphic outputs.
Complete application programs based
on the universal sequence controller
are available for measurements on CD
players, tuners, etc.
The universal sequence controller can
also be used for remote control of external equipment via the IEC/IEEE-bus or
the RS-232-C interface. Moreover, programs generated on UPL can be transferred to an external controller after
slight modifications for the remote control of UPL. This greatly facilitates the
generation of remote-control programs.
Test assemblies for electroacoustic converters frequently consist
of microphones and loudspeakers, whose frequency response
must be compensated. The equalizer function of UPL furnishes
tailor-made solutions for such tests. Comprehensive test routines
can be implemented with the aid of the universal sequence
controller
Audio Analyzer UPL 13
Page 14

Options and further applications
Fig. 13: Transfer and coherence function for determining the
transfer characteristic with the aid of complex test signals (eg
music or voice)
Fig. 14: Frequency response and rub & buzz function for quality assurance in loudspeaker production
Fig. 15: Third-octave analysis used mainly in acoustics
Low Distortion Generator UPL-B1
is essential for all applications requiring extremely pure analog signals or
an extended frequency range up to
110 kHz. Its inherent distortion is well
below that of the built-in universal generator which already has excellent
specifications.
When digital audio data are produced by the universal generator, the
low distortion generator may generate
an analog signal or be used for superimposing jitter or common-mode interference.
Digital Interfaces UPL-B2/-B29
contain the digital audio interfaces
(balanced, unbalanced and optical)
for the standard sampling rates
44.1 kHz and 48 kHz, UPL-B29 also
for the extended rates up to 96 kHz.
Either UPL-B2 or UPL-B29 can be fitted.
For further information on options and
associated software extensions
(Digital Audio Protocol UPL-B21 and
Jitter and Interface Test UPL-B22) refer
to pages 8 and 9.
Audio Monitor UPL-B5
adds a headphones output and a builtin loudspeaker to UPL. The input signal
of the analog and digital interfaces and
– with level, THD+N and rub & buzz
measurements – the filtered or
weighted signal can be monitored.
Extended Analysis Functions UPL-B6
In modern audio systems, the transfer
characteristics are dynamically
adapted to the input signals. With conventional, static test signals as input signals, the dynamic processes are not
activated and thus the signals cannot
be analyzed. Coherence and transfer
function are the solution to this problem: speech, music, noise, etc, are used
as test signals, and the transfer characteristic is represented by analyzing the
output spectrum referred to the input
spectrum (Fig. 13). The required complex test signals stored in various formats can be directly called from the
UPL hard disk using the standard generator function Arbitrary.
With the rub & buzz measurement,
manufacturing defects of loudspeakers
can be found in no time by measuring
the unwanted signals in the frequency
range above that of typical distortion
products (Fig. 14).
The third-octave analysis is an important measurement in acoustics. The levels of up to 30 third-octave bands are
simultaneously measured in compliance with class 0 of IEC1260
(Fig. 15).
In multitone signal generation, UPL-B6
allows also the phase and crest factor
to be set.
Fig. 16: Different signals for both channels may be generated
at the digital audio outputs
14 Audio Analyzer UPL
UPL-B6 is also required for generating
two-channel sinewave signals at the
digital outputs (Fig. 16).
Further functional extensions of UPL-B6
are under preparation.
Page 15

Hearing Aids Test Accessories UPL-B7
Audio Analyzer UPL with option
UPL-B7 forms a complete test system
for all standard measurements on
hearing aids. UPL needs merely be fitted with options UPL-B5 and UPL-B10.
UPL-B7 includes an acoustic test chamber as well as all accessories required
for measurements on hearing aids
such as battery adapters, connecting
cables and acoustic couplers. The
associated software allows complete
measurements to IEC60118 or
ANSI S3.22.
For further information on this application refer to data sheet PD 757.2696,
Test System UPL + UPL-B7 for Hearing
Aids.
Acoustic measurements on GSM mobile phones with Audio Analyzer UPL16
Acoustic measurements on GSM mobile
phones with UPL16 or option UPL-B8
The acoustic transmission and reproduction quality of a mobile phone is the most
important characteristic in every-day
use. Various test methods have been
standardized for determining acoustic
characteristics.
Audio Analyzer UPL16
was developed for conformance tests on
GSM mobiles. It performs all audio
measurements in line with chapter 30 of
GSM 11.10, phase 2. Access to the
Automatic Audio Line Measurement to
ITU-T O.33, UPL-B33
serves for automatic measurements of
all relevant parameters of broadcast
links according to ITU-T O.33. Generator and analyzer are normally
located at different sites. They are synchronized with the aid of FSK signals.
The operator may utilize the standard
sequences defined by ITU-T O.33 or
prepare his own. Option UPL-B10 is
needed for the use of UPL-B33.
internal digital signals of special test
mobile phones is via the standard digital
audio interface (DAI).
Remote Control UPL-B4
enables remote control of UPL via the
RS-232-C interface or IEC625/
GSM network operators, consumer test
institutes, etc, are particularly interested
in measuring and comparing acoustic
IEEE488 interface. The commands
employed largely meet SCPI stand-
ards.
characteristics of commercial mobiles.
A highly accurate test method is also
required for quality assurance and sampling inspection in the production of
GSM mobile phones.
Universal Sequence Controller UPL-B10
allows measurement sequences to be
generated and executed. For detailed
information see page 13.
Measurements on hearing aids
Mobile Phone Test Set UPL-B8
is now
available for these applications. With
the aid of this option all necessary audio
measurements can be performed on
GSM mobile phones without the DAI
interface.
For further information refer to data
sheet PD 757.5889, Acoustic Test of
GSM Mobiles.
150 Ω Modification UPL-U3
changes the source impedance of the
analog generator from 200 Ω to
150 Ω.
Audio Analyzer UPL 15
Page 16

Specifications
Data without tolerances are typical values.
Analog analyzers
For analog measurements two analyzers with different bandwidths, specifications and measurement functions are available:
Analyzer Frequency range
ANLG 22 kHz DC/10 Hz to 21.90 kHz
ANLG 110 kHz DC/20 Hz to110 kHz
Level measurements (rms)
Accuracy at 1 kHz
Frequency response ref. to 1 kHz)
20 Hz to 22 kHz
10 Hz to 20 Hz
22 kHz to 50 kHz
50 kHz to 110 kHz
0.05 dB
±
0.03 dB, typ. 0.003 dB (V
±
0.1 dB
±
0.1 dB
±
0.2 dB
±
Inputs
XLR connectors 2 channels, balanced (unbalanced
Voltage range 0.1 µV to 110 V (rms, sine)
Measurement ranges 18 mV to 100 V, in steps of 5 dB
Input impedance 100 k
Crosstalk attenuation
Common-mode rejection (V
<3 V)>100 dB at 50 Hz,
in
Generator output each input channel switchable to the
Typical frequency response, measured with internal generator/analyzer at
analog interfaces
measurements possible with XLR/BNC
Adapter UPL-Z1), floating/grounded
and AC/DC coupling switchable
1% shunted by 120 pF, each
Ω ±
pin against ground
300 Ω, 600 Ω, ±0.5% each, P
120 dB, frequency <22 kHz, 600
>
86 dB at 1 kHz, >80 dB at 16 kHz
>
other output channel, input impedance:
balanced 200 kΩ, unbalanced
100 k
Ω
Measurement functions
RMS value, wideband
Accuracy
Measurement speed
AUTO ±0.05 dB at 1 kHz, sine
AUTO FAST ±0.1 dB additional error
Integration time
AUTO FAST/AUTO 4.2 ms/42 ms, at least 1 cycle
VALUE 1 ms to 10 s
GEN TRACK 2.1 ms, at least 1 cycle
Noise (600 Ω)
with A filter 1 µV
with CCIR unweighting filter <2 µV, 1.6 µV typ. (ANLG 22 kHz)
Filter weighting filters and user-definable fil-
Spectrum post-FFT of filtered signal
1)
DC/AC coupling.
ters, up to 3 filters can be combined,
analog notch filter in addition (expansion of dynamic range by up to 30 dB)
16 Audio Analyzer UPL
1)
1)
<3 V)
in
max
1 W
Ω
RMS value, selective
Bandwidth (–0.1 dB) 1 %, 3%, 1/12 octave, 1/3 octave and
Selectivity 100 dB (80 dB) with analyzer ANLG
Frequency setting – automatic to input signal
Accuracy
Peak value with analyzer ANLG 22 kHz only
Measurement peak max, peak min, peak-to-peak,
Accuracy
Interval 20 ms to 10 s
2)
Filter
Quasi-peak with analyzer ANLG 22 kHz only
Measurement, accuracy to CCIR 468-4
Noise (600 Ω)
2)
Filter
DC voltage
Voltage range 0 V to ±110 V
Accuracy
Measurement ranges 100 mV to 100 V, in steps of 10 dB
S/N measurement routine available for measurement functions
user-selectable fixed bandwidth,
minimum bandwidth 20 Hz
22 kHz (110 kHz) bandpass or bandstop filter, 8th order elliptical filter, analog notch filter in addition
– coupled to generator
– fixed through entered value
– sweep in selectable range
0.2 dB + ripple of filters
±
peak absolute
0.2 dB at 1 kHz
±
weighting filters and user-definable
filters, up to 3 filters can be combined
V with CCIR weighting filter
<8 µ
weighting filters and user-definable
filters, up to 3 filters can be combined,
analog notch filter in addition
(1% of measured value + 0.1% of
±
measurement range)
– rms, wideband
–peak
– quasi-peak
indication of S/N ratio in dB,
no post-FFT
FFT analysis see FFT analyzer section
Total harmonic distortion (THD)
Fundamental 10 Hz to 22 kHz
Frequency tuning automatic to input or generator signal
Weighted harmonics any combination of d
Accuracy
Harmonics <50 kHz ±0.5 dB
Inherent distortion
Analyzer ANLG 22 kHz
Fundamental 20 Hz to 10.95 kHz
Analyzer ANLG 110 kHz
Fundamental 50 Hz to 20 kHz <–100 dB, typ. –105 dB
Spectrum bar chart showing signal and distortion
THD+N and SINAD
Fundamental 10 Hz to 22 kHz
Frequency tuning automatic to input or generator signal
Input voltage typ. >100 µV with automatic tuning
Bandwidth upper and lower frequency limit se-
<110 kHz ±0.7 dB
3)4)
10 Hz to 20 Hz <–100 dB
Accuracy
Bandwidth <50 kHz ±0.5 dB
Inherent distortion
Analyzer ANLG 22 kHz
Analyzer ANLG 110 kHz
Spectrum post-FFT of filtered signal
2)
3)
4)
5)
<100 kHz ±0.7 dB
3)
Bandwidth 20 Hz to 21.90 kHz
Bandwidth 20 Hz to 22 kHz <–95 dB + 2.5 µV, typ. –100 dB +1.75 µV
20 Hz to 110 kHz <–88 dB + 5 µV, typ. –95 dB + 3.5 µV
With UPL-B29 only in base rate mode.
Total inherent distortion of analyzer and generator (with option
UPL-B1), analyzer with dynamic mode precision.
>3.5 V: typ. 3 dB less; <0.5 V: sensitivity reduced by inherent noise
(typ. 0.25/1.25 µV with analyzers 22/110 kHz).
At full-scale level of measurement range (<–100 dB + 2 µV with auto range),
<–100 dB for input voltage >3.5 V.
or fixed through entered value
to d9,
up to 110 kHz
2
<–110 dB, typ. –115 dB
or fixed through entered value
lectable, one weighting filter in addition
typ. –110 dB at 1 kHz, 2.5 V
<–105 dB +2 µV
5)
typ. –108 dB +1.5 µV
Page 17

Modulation factor (MOD DIST)
Measurement method selective to DIN IEC 268-3
Frequency range lower frequency 30 Hz to 2700 Hz
Accuracy
Inherent distortion
Upper frequency 4 kHz to 15 kHz<–96 dB (–90 dB), typ. –103 dB
Spectrum bar chart showing signal and distortion
Difference frequency distortion (DFD)
Measurement method selective to DIN IEC 268-3 or 118
2)
15 kHz to 20 kHz <–96 dB (–85 dB)
Frequeny range difference frequency 80 Hz to 2 kHz
Accuracy
Inherent distortion
Spectrum bar chart showing signal and distortion
Wow and flutter with analyzer ANLG 22 kHz only
Measurement method DIN/IEC, NAB, JIS,
Weighting filter OFF highpass 0.5 Hz, bandwidth 200 Hz
Accuracy
4)
DFD d
2
DFD d
3
ON bandpass 4 Hz to IEC-386
Inherent noise
Spectrum post-FFT of demodulated signal
Time domain display (WAVEFORM)
Trigger rising/falling edge
Trigger level –200 V to +200 V, interpolated between
Trace length max. 7424 points
Standard mode 1- to 32-fold interpolation
Compressed mode 2- to 1024-fold compression
Frequency
Frequency range 20 Hz to 110 kHz
5)
upper frequency 8 x LF to 100 kHz
0.50 dB
±
center frequency 200 Hz to 100 kHz
0.50 dB, center frequency <20 kHz
±
–112 dB, typ. –125 dB
<
–96 dB, typ. –105 dB
<
2-sigma to IEC-386
3%
±
0.0005% weighted
<
0.001% unweighted
<
samples
(envelope for AGC measurement), with
analyzer ANLG 22 kHz only
Accuracy ±50 ppm
5)
Phase
with analyzer 22 kHz only
Frequency range 20 Hz to 20 kHz
Accuracy ±0.5°
Group delay
Frequency range 20 Hz to 20 kHz
Accuracy in seconds ∆ϕ/(∆f x 360), where ∆ϕ = phase accu-
Polarity test
Measurement polarity of unsymmetrical input signal
Display +POL, –POL
5)
with analyzer 22 kHz only
racy in °, ∆f = frequency step
Analog generators
1)
An 18-bit
teristics of the basic generator can be improved and extended with a lowdistortion RC oscillator (Low Distortion Generator UPL-B1):
– sine with reduced distortion
– frequency range up to 110 kHz
Outputs
XLR connectors, 2 channels, floating, balanced/unbalanced switchable, short-
3)
circuit-proof; max. current <120 mA with external feed
Balanced
Voltage 0.1 mV to 20 V (rms, sine, open-circuit)
Crosstalk attenuation
Source impedance typ. 10 Ω , 200 Ω(150 Ω with UPL-U3)
Load impedance
Output balance
Unbalanced
Voltage 0.1 mV to 10 V (rms, sine, open-circuit)
Crosstalk attenuation
Source impedance 5
Load impedance >200 Ω
Signals
Sine
Frequency range 2 Hz to 21.75 kHz
Frequency accuracy
Level accuracy
Frequency response (ref. to 1 kHz)
20 Hz to 20 kHz
Inherent distortion THD+N
Measurement bandwidth
20 Hz to 22 kHz
20 Hz to 100 kHz
Sweep parameters frequency, level
Sine (with low distortion generator option)
Frequency range 10 Hz to 110 kHz
Frequency accuracy
Level accuracy ±0.1 dB at 1 kHz
Frequency response (ref. to1 kHz)
20 Hz to 20 kHz ±0.05 dB
10 Hz to 110 kHz ±0.1 dB
Harmonics typ. <–115 dB (<–120 dB at 1 kHz),
Inherent distortion (THD)
Fundamental 1 kHz, 1 V to 10 V <–120 dB typ.
Inherent distortion (THD+N)
Fundamental 1 kHz, 2.5 V –110 dB typ. 22 kHz
Sweep parameters frequency, level
D/A converter is used for analog signal generation. The charac-
∆Σ
115 dB, frequency <20 kHz
>
0.5%, 600
±
400 Ω (incl. source impedance)
>
75 dB at 1 kHz, >60 dB at 20 kHz
>
115 dB, frequency <20 kHz
>
Ω
50 ppm
±
0.1 dB at 1 kHz
±
0.05 dB
±
–94 dB, typ. –98 dB
<
–86 dB
<
0.5% at 15°C to 30°C
±
±0.75% at 5°C to 45 °C
Ω ±
0.5%
measurement bandwidth 20 Hz to
20 kHz, voltage 1V to 5 V
20 Hz to 7 kHz <–105 dB
7 kHz to 20 kHz <–100 dB
6)
20 Hz to 20 kHz <–100 dB +2 µV 22 kHz
20 Hz to 20 kHz <–88 dB +5 µV 100 kHz
Meas. bandw.
1)
For upper frequency >20 kHz, the bottom limit of lower frequency is reduced.
2)
Input voltage >200 mV, typical values apply between 0.5 V and 3.5 V.
Lower frequency >200 Hz, values in ( ) for lower frequency <200 Hz.
Dynamic mode precision; level ratio LF:UF = 4:1.
3)
For center frequencies >20 kHz the bottom limit of the difference frequency is
reduced.
4)
Input voltage >200 mV, typical values apply between 0.5 V and 3.5 V,
dynamic mode precision (at DFD d2), center frequency 7 kHz to 20 kHz.
5)
With measurement functions RMS, FFT and THD+N only, accuracy applies to
8k FFT with zoom factor 2, Rife-Vincent-2 window; S/N ratio >70 dB.
6)
Total inherent distortion of analyzer and generator, analyzer with dynamic
mode precision.
Audio Analyzer UPL 17
Page 18

Typical spectrum of low distortion generator at 1 kHz, 1 V
MOD DIST for measuring the modulation distortion
Frequency range lower frequency 30 Hz to 2700 Hz
Level ratio (LF:UF) selectable from 10:1 to 1:1
Level accuracy
Inherent distortion
Sweep parameters upper frequency, level
DFD for measuring the difference tone
Frequency range difference freq. 80 Hz to 2 kHz
Level accuracy
Inherent distortion
Sweep parameters center frequency, level
Multi-sine
Frequency range 2.93 Hz to 21.75 kHz
Frequency spacing adjustable from 2.93 Hz
Frequency resolution <0.01% or matching FFT frequency
Dynamic range 100 dB, referred to total peak value
Characteristics
Mode 1 1 to 17 spectral lines
Mode 2 1 to 7400 spectral lines (noise in fre-
upper frequency 8 x LF to 21.75 kHz
0.5 dB
±
–94 dB (typ. –100 dB) at 7 kHz, 60 Hz
<
–84 dB (typ. –90 dB),
<
level ratio LF:UF = 4:1
center frequency 200 Hz to 20.75 kHz
1)
DFD d
2
DFD d
3
0.5 dB
±
–114 dB, typ.–120 dB
<
–92 dB, typ. –100 dB
<
spacing
– level and frequency selectable for
each line
– phase of each component optimized
for minimum crest factor
– phase of each component or
crest factor selectable (with UPL-B6)
quency domain), distribution: white,
pink, 1/3 octave, defined by file; crest
factor selectable (with UPL-B6)
2
Sine burst, sine
Burst time 1 sample up to 60 s, 1-sample resolu-
Interval burst time up to 60 s, 1-sample res.
Low level 0 to burst level, absolute or relative to
Bandwidth 21.75 kHz (elliptical filter)
burst
tion
burst level (0 with sine
2
burst)
Sweep parameters burst frequency, level, time, interval
Noise
Distribution Gaussian, triangular, rectangular
Arbitrary waveform loaded from file
File format
*.TTF (internal) memory depth max. 16 k
2)
*.WAV
Clock rate 48 kHz
Bandwidth 21.75 kHz (elliptical filter)
reproduction of audio files
(mono), duration approx. 10 s per
Mbyte RAM
Polarity test signal
2
Sine
burst with following characteristics:
Frequency 1.2 kHz
On-time 1 cycle (0.8333 ms)
Interval 2 cycles (1.6667 ms)
FM signal
Carrier frequency 2 Hz to 21.75 kHz
Modulation frequency 1 mHz to 21.75 kHz
Modulation 0% to 100%
AM signal
Carrier frequency 2 Hz to 21.75 kHz
Modulation frequency 1 mHz to 21.75 kHz
Modulation 0% to 100%
DC voltage
Level range 0 V to ±10 V (±5 V unbalanced),
Accuracy
3)
DC offset
Accuracy
Residual offset
sweep possible
2%
±
0 V to ±10.0 V (±5 V unbalanced)
2%
±
1% of rms value of AC signal
<
Digital analyzer (option UPL-B2 or -B29)
Frequency limits specified for measurement functions apply to a sampling rate
of 48 kHz. For other sampling rates limits are calculated according to the formula: f
= f
new
Inputs
Balanced input XLR connector, transformer coupling
Impedance 110
Level (V
Unbalanced input BNC, grounded
Impedance 75
Level (V
Optical input TOSLINK
Channels 1, 2 or both
Audio bits 8 to 24
Clock rate 35 kHz to 55 kHz with UPL-B2 or
Format professional and consumer format to
Measurement functions
All measurements at 24 bits, full scale
RMS value, wideband
Measurement bandwidth up to 0.5 times the clock rate
Accuracy
AUTO FAST ±0.1 dB
AUTO ±0.01 dB
FIX ±0.001 dB
Integration time
AUTO FAST/AUTO 4.2 ms/42 ms, at least 1 cycle
VALUE 1 ms to 10 s
GEN TRACK 2.1 ms, at least 1 cycle
Filter weighting filters and user-definable fil-
Spectrum post-FFT of filtered signal
RMS value, selective
Bandwidth (–0.1 dB) 1%, 3%, 1/12 octave, 1/3 octave
Selectivity 100 dB, bandpass or bandstop filter,
x sampling rate/48 kHz.
48 kHz
) min. 200 mV, max. 12 V
PP
) min. 100 mV, max. 5 V
PP
Ω
Ω
UPL-B29 in base rate mode
35 kHz to 106 kHz with UPL-B29 in
high rate mode
synchronous to DAI or DARS
AES3 or IEC-958 as well as user-definable formats at all inputs
ters, up to 3 filters can be combined
and user-selectable fixed bandwidth,
min. bandwidth 20 Hz
8th order elliptical filter
1)
Center frequency >5 kHz, difference frequency <1 kHz;
DFD d2 –100 dB (typ.) with DC offset.
2)
With UPL-B29 only in base rate mode.
18 Audio Analyzer UPL
3)
No DC offset for signal generation with Low Dist ON. With DC offset the AC
voltage swing will be reduced, specified inherent distortion values apply to
DC offset = 0.
Page 19

Frequency setting – automatic to input signal
Accuracy
Peak value
Measurement peak max, peak min, peak-to-peak,
Accuracy
Interval 20 ms to 10 s
1)
Filter
– coupled to generator
– fixed through entered value
– sweep in selectable range
0.2 dB + ripple of filters
±
peak absolute
0.2 dB at 1 kHz
±
weighting filters and user-definable filters, up to 3 filters can be combined
Quasi-peak
Measurement, accuracy to CCIR 468-4
1)
Filter
weighting filters and user-definable filters, up to 3 filters can be combined
DC voltage
Measurement range 0 to ±FS
Accuracy
S/N measurement routine available for measurement functions:
1%
±
– rms, wideband
–peak
– quasi-peak
indication of S/N ratio in dB,
no post-FFT
FFT analysis see FFT analyzer section
Total harmonic distortion (THD)
Fundamental 10 Hz to 21.90 kHz
Frequency tuning automatic to input or generator signal
Weighted harmonics any combination of d
Accuracy
Inherent distortion
Fundamental 42 Hz to 21.90 kHz<–130 dB
Spectrum bar chart showing signal and distortion
THD+N and SINAD
Fundamental 10 Hz to 21.90 kHz
Frequency tuning automatic to input or generator signal
2)
24 Hz to 42 Hz
12 Hz to 24 Hz
Stopband range fundamental ±28 Hz,
Bandwidth upper and lower frequency limit se-
Accuracy ±0.3 dB
Inherent distortion
Bandwidth 20 Hz to 21.90 kHz
Fundamental 28 Hz to 21.90 kHz <–126 dB
2)
24 Hz to 28 Hz <–109 dB
20 Hz to 24 Hz <–96 dB
or fixed through entered value
to d
2
up to 21.90 kHz
0.1 dB
±
–112 dB
<
–88 dB
<
9,
or fixed through entered value
max. up to 2nd harmonic
lectable, one weighting filter in addition
Spectrum post-FFT of filtered signal
Modulation factor (MOD DIST)
Measurement method selective to DIN IEC 268-3
Frequency range
Lower frequency 30 Hz to 2700 Hz
Upper frequency 8 x LF3) to 21.25 kHz
Accuracy ±0.2 dB
Inherent distortion
Level LF:UF 1:1 <–133 dB
Spectrum bar chart showing signal and distortion
Difference frequency distortion (DFD)
Measurement method selective to DIN IEC 268-3 or 118
Frequency range
Difference frequency 80 Hz to 2 kHz
Center frequency 200 Hz to 20.90 kHz
Accuracy ±0.2 dB
Inherent distortion
Spectrum bar chart showing signal and distortion
2)
4:1 <–123 dB
10:1 <–115 dB
2)
DFD d
DFD d
2
3
<–130 dB
<–130 dB
3)
3)
Wow and flutter
Measurement method DIN/IEC, NAB, JIS,
Weighting filter OFF highpass 0.5 Hz, bandwidth 200 Hz
Accuracy
Inherent noise
Spectrum post-FFT of demodulated signal
Time domain display (WAVEFORM)
Trigger rising/falling edge
ON bandpass 4 Hz to IEC-386
Trigger level –1 FS to +1 FS, interpolated between
Trace length max. 7424 points
Standard mode 1- to 32-fold interpolation
Compressed mode 32- to 1024-fold compression
Frequency
4)
2-sigma to IEC-386
3%
±
0.0003% weighted
<
0.0008% unweighted
<
samples
(envelope for AGC measurement)
Frequency range 20 Hz to 20 kHz
Accuracy
4)
Phase
Frequency range 20 Hz to 20 kHz
Accuracy
Group delay
Frequency range 20 Hz to 20 kHz
4)
Accuracy in seconds
Polarity test
Measurement polarity of unsymmetrical input signal
Display +POL, –POL
50 ppm
±
0.5°
±
f x 360), where ∆ϕ = phase
∆ϕ/(∆
accuracy in °, ∆f = frequency step
Digital generator (option UPL-B2 or -B29)
Frequency limits specified for the signals apply to a sampling rate of 48 kHz.
For other sampling rates limits are calculated according to the formula:
f
= f
new
Outputs
Balanced output XLR connector, transformer coupling
Unbalanced output BNC, transformer coupling
Optical output TOSLINK
Channels 1, 2 or both
Audio bits 8 to 24
Clock rate 35 kHz to 55 kHz with UPL-B2 or
Format professional and consumer format to
x sampling rate/48 kHz.
48 kHz
Impedance 110 Ω, short-circuit-proof
Level (V
into 110 Ω) 0 V to 8 V, in 240 steps
PP
Accuracy ±1 dB (rms)
Impedance 75 Ω, short-circuit-proof
Level (V
into 75 Ω) 0 V to 2 V, in 240 steps
PP
Accuracy ±1 dB (rms)
UPL-B29 in base rate mode
35 kHz to 106 kHz with UPL-B29 in
high rate mode
internal: generator clock or synchronization to analyzer
external: synchronization to word clock
input, video sync, DARS, 1024 kHz
AES3 or IEC-958 as well as userdefinable formats at all outputs
1)
With UPL-B29 only in base rate mode.
2)
Total inherent distortion of analyzer and generator.
3)
Fixed frequency, independent of sampling rate.
4)
Only for measurement functions RMS, FFT and THD+N, accuracy applies to
8k FFT with zoom factor 2, Rife-Vincent-2 window; S/N ratio >70 dB.
Phase and group delay in high rate mode only with RMS without filter.
Audio Analyzer UPL 19
Page 20

Signals
All signals with 24 bits, full scale
General characteristics
Level resolution 2
Audio bits 8 to 24 bits, LSB rounded off
Dither for sine, stereo sine, DFD and
Distribution Gaussian, triangular, rectangular
Level 2
Frequency accuracy
Frequency offset for sine, stereo sine, DFD and
DC offset 0 to ±1 FS adjustable
Sine
Frequency range 2 Hz
Total harmonic distortion (THD)
Sweep parameters frequency, level
MOD DIST for measuring the modulation distortion
Frequency range
Lower frequency 30
Upper frequency 8 x LF1) to 21.90 kHz
Level ratio (LF:UF) selectable from 10:1 to 1:1
Inherent distortion
Level LF:UF 1:1
Sweep parameters upper frequency, level
DFD for measuring the difference tone
Frequency range
Difference frequency 80 Hz to 2 kHz
Center frequency 200 Hz1) to 20.90 kHz
Inherent distortion
DFD d
DFD d
Sweep parameters center frequency, level
Multi-sine
Frequency range 2.93 Hz to 21.90 kHz
Frequency spacing adjustable from 2.93 Hz
Frequency resolution <0.01% or matching FFT frequency
Dynamic range >133 dB
Characteristics
Mode 1 1 to 17 spectral lines
2)
4:1
10:1
2)
2
3
Mode 2 1 to 7400 spectral lines (noise in fre-
2
Sine burst, sine
burst
Burst time 1 sample up to 60 s, 1-sample resolu-
Interval burst time up to 60 s, 1-sample res.
Low level 0 to burst level, absolute or referred to
Sweep parameters burst frequency, level time, interval
Noise
Distribution Gaussian, triangular, rectangular
Arbitrary waveform loaded from file
File format
*.TTF (internal) memory depth max. 16 k
3)
*.WAV
Clock rate sampling rate of generator
1)
Fixed frequency, independent of sampling rate.
2)
Total inherent distortion of analyzer and generator.
3)
With UPL-B29 only in base rate mode.
–24
MOD DIST in high rate mode for sine
only
–24
FS to 1 FS
50 ppm (internal clock),
±
1 ppm relative to clock rate
±
MOD DIST
0 or +1000 ppm
1)
to 21.90 kHz
–133 dB
<
1)
to 2700 Hz
–133 dB
<
–123 dB
<
–115 dB
<
–130 dB
<
–130 dB
<
1)
1)
spacing
– level and frequency selectable
for each line
– phase of each component
optimized for minimum crest factor
– phase of each component or
crest factor selectable (with UPL-B6)
quency domain), distribution: white,
pink, 1/3 octave, defined by file; crest
factor selectable (with UPL-B6)
tion
burst level (0 for sine
reproduction of audio files
(mono), duration approx. 10 s per
2
burst)
Mbyte RAM
Polarity test signal
2
Sine
burst with following characteristics:
Frequency 1.2 kHz
On-time 1 cycle
Interval 2 cycles
FM signal
Carrier frequency 2 Hz
Modulation frequency 1 mHz
1)
1)
to 21.9 kHz
1)
to 21.9 kHz
Modulation 0% to 100%
AM signal
Carrier frequency 2 Hz
Modulation frequency 1 mHz
Modulation 0% to 100%
DC voltage
Level range 0 to ±1 FS, can be swept
1)
to 21.9 kHz
1)
to 21.9 kHz
Digital audio protocol (option UPL-B21)
Generator
Validity bit NONE, L, R, L+R
Channel status data mnemonic entry with user-definable
User data loaded from file (max. 384 bits) or set
masks, predefined masks for professional and consumer format to
AES3 or IEC-958
to zero
Analyzer
Display validity bit L and R
Error indication block errors, sequence errors, clock
Clock rate measurement 50 ppm
Channel status display user-definable mnemonic display of da-
User bit display user-definable mnemonic display,
rate errors, preamble errors
ta fields, predefined settings for professional and consumer format to
AES3 or IEC-958,
binary and hexadecimal format
block-synchronized
Jitter and interface test (option UPL-B22)
Generator
Jitter injection
Waveform sine, noise
Frequency range 10 Hz to 21.75 kHz (sine to110 kHz
Amplitude (peak-to-peak) 0 to 5 UI (corresp. to 0 to 800 ns at
Common mode signal for balanced output
Waveform sine
Frequency range 20 Hz to 21.75 kHz (110 kHz with
Amplitude (V
Phase (output to reference) adjustable between −64 and +64 UI
) 0 V to 20 V
PP
Cable simulator 100 m typical audio cable
Analyzer
Input signal
Amplitude (V
Clock rate 35 kHz to 55 kHz with UPL-B2
) 0 V to 10 V
PP
Jitter measurement amplitude, frequency, spectrum
Measurement limit 200 ps (noise floor with 8k FFT)
Reclocking input signal sampled with low-jitter
Common mode test at balanced input
Amplitude (V
Frequency, spectrum 20 Hz to 110 kHz
Phase (input to reference) −64 to +64 UI (corresp. to ±50% of
) 0 V to 30 V
PP
Delay (input to output) 100 µs to 500 ms
with option UPL-B1)
f
= 48 kHz)
A
option UPL-B1)
(corresp. to ±50% of frame)
35 kHz to 106 kHz with UPL-B29
0 to 5 UI typ. for f <500 Hz, decreasing
to 0.5 UI for up to 50 kHz
clock signal and available at reference
output (XLR connector on rear)
frame)
20 Audio Analyzer UPL
Page 21

FFT analyzer
Frequency range
Digital 48/96 kHz DC to 21.9/43.8 kHz
ANLG 22/110 kHz DC to 21.9/110 kHz
Dynamic range
Digital
ANLG 22 kHz 120 dB/105 dB
ANLG 110 kHz 115 dB/85 dB
Noise floor
Digital –160 dB
ANLG 22 kHz –140 dB/110 dB
ANLG 110 kHz –120 dB/90 dB
FFT size 256, 512, 1k, 2k, 4k, 8k points
Window functions rectangular, Hann, Blackman-Harris,
Resolution from 0.05 Hz with zoom, from 5.86 Hz
Zoom 2 to 128 (2 to 16 mit ANLG 110)
Averaging 1 to 256, exponential or normal
135 dB
>
1)
1)
1)
1)
(16k with zoom factor 2)
Rife-Vincent 1-3, Hamming, flat top,
Kaiser (ß = 1 to 20)
without zoom
User-definable filters
8th order elliptical, type C (for highpass and lowpass filters also 4th order),
passband ripple +0/–0.1 dB, stopband attenuation approx. 20 dB to 120 dB
selectable in steps of approx. 10 dB (highpass and lowpass filters: stopband
attenuation 40 to 120 dB).
Highpass, lowpass filters limit frequencies (–0.1 dB) selectable,
Bandpass, bandstop filters passband (–0.1 dB) selectable,
Notch filter center frequency and width (–0.1 dB)
Third octave and octave filters center frequency selectable,
File-defined filters any 8th order filter cascaded from
Analog notch filter
For measurements on signals with high S/N ratio, this filter improves the dynamic
range of the analyzer by up to 30 dB to 140 dB for analyzer 22 kHz, or 120 dB
for analyzer 110 kHz (typical noise floor of FFT). The filter is also used for mea-
stopband indicated
stopband indicated
selectable, stopband indicated
bandwidth (–0.1 dB) indicated
4 biquads, defined in the z plane by
poles/zeroes or coefficients
suring THD, THD+N and MOD DIST with dynamic mode precision.
Characteristics available in analog analyzers
with measurement functions:
– rms, wideband
– rms, selective
– quasi-peak
Frequency range 10 Hz to 22.5 kHz center frequency (f
Frequency tuning – automatic to input signal
Stopband typ.
Passband typ. –3 dB at 0.77 x f
– FFT analysis
– coupled to generator
– fixed through entered value
30 dB, f
>
typ. +0/–1 dB outside 0.5 x f
±0.5%
c
and 1.3 x fc ,
c
to 2 x f
c
)
c
c
Typical noise floor of FFT analysis at analog inputs
Filter
For all analog and digital analyzers. Up to 3 filters can be combined as required. All filters are digital filters with a coefficient accuracy of 32 bit floating
point (exception: analog notch filter).
Weighting filters – A weighting
1)
With/without analog notch filter.
– C message
– CCITT
– CCIR weighted, unweighted
– CCIR ARM
– deemphasis 50/15, 50, 75, J.17
– rumble weighted, unweighted
– DC noise highpass
– IEC tuner
– jitter weighted
Sweep
Generator sweep
Parameters frequency, level,
Sweep linear, logarithmic, tabular,
Stepping – automatic after end of measurement
Analyzer sweep
Parameters frequency or level of input signal
Sweep single, continuous
Trigger – delayed (0 to 10 s) after input level or
Settling for level, frequency, phase, distortion
Sweep speed
Two-channel rms measurement 20 Hz to 20 kHz, 30-point generator sweep
logarithmic (frequency measurement switched off, Low Dist off).
with GEN TRACK 0.5 s
AUTO FAST 1 s
AUTO 2.5 s
with bursts also interval and duration,
one- or two-dimensional
single, continuous, manual
– time delay (fixed or loaded table)
input frequency variation, settling
function selectable
– time-controlled
measurements,
settling function: exponential, flat or
averaging
Audio Analyzer UPL 21
Page 22

Display of results
Audio monitor (option UPL-B5)
Units
Level (analog) V, dBu, dBV, W, dBm,
Level (digital) FS, %FS, dBFS, LSBs
Distortion % or dB, referred to signal amplitude,
Frequency Hz, difference (∆), deviation (∆%) and
Phase
Reference value (level):
Fixed value (entered or stored).
Current value of a channel or generator signal: permits direct measurement of
gain, linearity, channel difference, crosstalk. In sweep mode, traces (other
trace or loaded from file) can be used as a reference too.
Graphical display of results
Monitor (not UPL66) 8.4“ LCD, colour
Display modes – display of any sweep trace
Display functions – autoscale
Test re ports
Functions – screen copy to printer, plotter or file
– equalizer traces
Printer driver supplied for approx. 130 printers
Plotter language HP-GL
Interfaces 2 x RS-232-C, Centronics,
Storage functions – instrument settings, optionally with
Remote control via IEC 625-2 (IEEE 488) and RS-232;
difference (∆), deviation (∆%) and
ratio (without dimension, %, dBr)
to reference value
deviation (∆%) or ratio (dBr)
to reference value
THD and THD+N in all available level
units (absolute or relative to selectable
reference value)
ratio (as quotient f/f
octave or decade) to reference value
(entered or stored, current generator
frequency)
, rad, difference (∆) to reference value
°
(entered or stored)
– display of trace groups
– bargraph display with
min./max. values
– spectrum, also as waterfall display
– list of results
– bar charts for THD and
intermodulation measurements
– X-axis zoom
– full-screen and part-screen mode
– 2 vertical,1 horizontal cursor line
– search function for max. values
– marker for harmonics (spectrum)
– user-labelling for graphs
– change of unit and scale also
possible for loaded traces
(PCX, HPGL, Postscript)
– lists of results
– sweep lists
– tolerance curves
– list of out-of-tolerance values
IEC 625 (option UPL-B4)
measured values and curves
–spectra
– sweep results
– sweep lists
– tolerance curves
– equalizer traces
commands largely to SCPI
(option UPL-B4)
, 1/3 octave,
ref
Headphones connector 6.3 mm jack
Output voltage (U
Output current (I
Source impedance 10 Ω, short-circuit-proof
Recommended headphone impedance 600
) max. 8 V
P
) max. 50 mA
P
Ω
Extended analysis functions (option UPL-B6)
Coherence and transfer functions can be displayed simultaneously
Frequency range DC to 21.9 kHz
Frequency resolution from 5.86 Hz
Averaging 2 to 2048
FFT length 256, 512, 1k, 2k, 4k, 8k points
Rub & buzz measurement simultaneous measurement of frequency
Frequency range 10 Hz to 110 kHz
Tracking highpass filter 2 to 20 times fundamental
Lower/upper frequency limit selectable
Measurement time
(200 Hz to 20 kHz, 200 points log.) 2 s
Multi-sine generator function extended functions
Mode 1 crest factor or phase of each
Mode 2 crest factor selectable
Third octave analysis for analyzer ANLG 22 kHz
Number of third octaves 30
Frequency range 22 Hz to 22 kHz
Level accuracy
Center frequency
22 Hz to 22 kHz
Stereo sine in digital generator only
Frequency range 2 Hz
Frequency adjustable for each channel
Phase 0 to 360° (same frequency in both
Level adjustable for each channel or
Sweep parameters frequency and level of channel 1
Other functions under development
response, rub & buzz and polarity
component selectable
and digital 48 kHz
0.2 dB
±
1.0 dB (IEC 1260, class 0)
±
2)
to 21.9 kHz
channels)
channel ratio 2/1
1)
Hearing aids test accessories (option UPL-B7)
Consisting of acoustic test chamber, acoustic 2 cm³ coupler, various battery
adapters, connecting cables, software for measurements to IEC60118 and
ANSI S3.22
Additionally required options UPL-B5 and UPL-B10
Modification UPL-U3
Change of source impedance of analog generator to 150 Ω (instead of 200 Ω
set as standard) at the factory
22 Audio Analyzer UPL
1)
With UPL-B29 only in base rate mode.
2)
Fixed frequency independent of clock rate.
Page 23

General data
Operating temperature range 0 °C to +45 °C
Storage temperature range –20 °C to +60 °C
Humidity max. 85 % for max. 60 days,
EMI EN 50081-1
EMS EN 50082-1
Safety standards DIN EN 61010-1, IEC 1010-1,
Conformity marks VDE-GS, UL, cUL
Power supply 100/120/220/230 V ±10%,
Dimensions (W x H x D) 435 mm x 192 mm x 475 mm
Weight 12.6 kg
below 65% on average/year,
no condensation
UL 3111-1, CAN/CSA C 22.2
No. 1010-1
50 Hz to 60 Hz, 160 VA
Ordering information
Order designation
Audio Analyzer UPL 1078.2008.06
Audio Analyzer UPL16 1078.2008.16
(for conformance tests on
GSM mobile phones)
Audio Analyzer UPL66 1078.2008.66
(without display and keypad)
Accessories supplied power cable, operating manual, back-
Options
Low Distortion Generator UPL-B1 1078.4400.02
Digital Audio I/O 48 kHz UPL-B2 1078.4000.02
Digital Audio I/O 96 kHz UPL-B29 1078.5107.02
Digital Audio Protocol UPL-B21 1078.3856.02
Jitter and Interface Test UPL-B22 1078.3956.02
Remote Control UPL-B4 1078.3804.02
Audio Monitor UPL-B5 1078.4600.03
Extended Analysis Functions UPL-B6 1078.4500.02
Hearing Aids Test Accessories UPL-B7 1090.2704.02
Mobile Phone Test Set UPL-B8 1117.3505.02
Universal Sequence Controller UPL-B10 1078.3904.02
Line Measurement to ITU-T O.33 UPL-B33 1078.4852.02
XLR/BNC Adapter Set UPL-Z1 1078.3704.02
150 Ω Modification UPL-U3 1078.4900.02
Recommended extras
19“ Rack Adapter ZZA-94 0396.4905.00
Service manual 1078.2089.24
up system disks with MS-DOS operating system and user manual, backup
program disk with operating and measurement software
Audio Analyzer UPL 23
Page 24

Printed in Germany 0800 (Bi we)
ROHDE& SCHWARZ GmbH & Co. KG ⋅ Muehldorfstrasse 15 ⋅ 81671 Munich, Germany ⋅ P.O.B. 8014 69 ⋅ 81614 Munich, Germany
Telephone +49894129-0 ⋅ www.rohde-schwarz.com ⋅ CustomerSupport: Tel. +49180 5124242, Fax +4989 41 29-13777,
E-mail: CustomerSupport@rohde-schwarz.com
PD757.2238.24 ⋅ Audio Analyzer UPL ⋅ Trade names are trademarks of the owners ⋅ Subject to change ⋅ Data without tolerances: typical values
 Loading...