

Page 1

LMR Master™ S412E Specifications
Spectrum Analyzer
Measurements
Smart Measurements Field Strength (uses antenna calibration tables to measure dBm/m2 or dBmV/m)
Occupied Bandwidth (measures 99% to 1% power channel of a signal)
Channel Power (measures the total power in a specied bandwidth)
ACPR (adjacent channel power ratio)
AM/FM/SSB Audio Demodulation (wide/narrow FM, AM, upper/lower SSB)
C/I (carrier-to-interference ratio)
Emission Mask
Coverage Mapping (requires option 0431)
Setup Parameters
Frequency Center/Start/Stop, Span, Frequency Step, Signal Standard, Channel #, Channel Increment
Amplitude Reference Level (RL), Scale, Attenuation Auto/Level, RL Offset, Pre-Amp On/Off, Detection
Span Span, Span Up/Down (1-2-5), Full Span, Zero Span, Last Span
Bandwidth RBW, Auto RBW, VBW, Auto VBW, RBW/VBW, Span/RBW
File Save, Recall, Delete, Directory Management
Save/Recall Setups, Measurements, Limit Lines, Screen Shots Jpeg (save only), Save-on-Event
Save-on-Event Crossing Limit Line, Sweep Complete, Save-then-Stop, Clear All
Delete Selected File, All Measurements, All Mode Files, All Content
Directory Management Sort Method (Name/Type/Date), Ascend/Descend, Internal/USB, Copy, Format USB
Application Options Bias-Tee (On/Off), Impedance (50 Ω, 75 Ω, Other)
Sweep Functions
Sweep
Detection
Triggers
Trace Functions
Traces
Trace A Operations
Trace B Operations
Trace C Operations
Marker Functions
Markers Markers 1-6 each with a Delta Marker, or Marker 1 Reference with Six Delta Markers,
Marker Types Style (Fixed/Tracking), Noise Marker, Frequency Counter Marker
Marker Table 1-6 markers frequency and amplitude plus delta markers frequency offset and amplitude
Limit Line Functions
Limit Lines Upper/Lower, On/Off, Edit, Move, Envelope, Advanced, Limit Alarm, Default Limit
Limit Line Edit Frequency, Amplitude, Add Point, Add Vertical, Delete Point, Next Point Left/Right
Limit Line Move To Current Center Frequency, By dB or Hz, To Marker 1, Offset from Marker 1
Limit Line Envelope Create Envelope, Update Amplitude, Points (41 max), Offset, Shape Square/Slope
Limit Line Advanced Type (Absolute/Relative), Mirror, Save/Recall
Single/Continuous, Manual Trigger, Reset, Detection, Minimum Sweep Time, Trigger Type
Peak, RMS, Negative, Sample, Quasi-peak
Free Run, External, Video, Change Position, Manual
Up to three Traces (A, B, C), View/Blank, Write/Hold, Trace A/B/C Operations
Normal, Max Hold, Min Hold, Average, # of Averages, (always the live trace)
AB, BC, Max Hold, Min Hold
AC, BC, Max Hold, Min Hold, A – BC, B – AC, Relative Reference (dB), Scale
Marker Table (On/Off ), All Markers Off
Marker Auto-Position Peak Search, Next Peak (Right/Left), Peak Threshold %, Set Marker
to Channel, Marker Frequency to Center, Delta Marker to Span, Marker to Reference Level
Page 2 of 24
Page 2

LMR Master™ S412E Specifications
Spectrum Analyzer (continued)
Frequency
Frequency Range 100 kHz to 1.6 GHz, (6 GHz with Option 6)
Tuning Resolution 1 Hz
Frequency Reference Aging ± 1.0 ppm/year
Accuracy ± 1.5 ppm (25 °C ± 25 °C) + aging (< ± 50 ppb + aging with GPS on)
Frequency Span 10 Hz to 1.6 GHz including zero span (10 Hz to 6 GHz with Option 6)
Sweep Time 100 ms, 10 μs to 600 seconds in zero span
Sweep Time Accuracy ± 2% in zero span
Bandwidth
Resolution Bandwidth (RBW) 10 Hz to 3 MHz in 1–3 sequence ± 10% (1 MHz max in zero-span) (–3 dB bandwidth)
Video Bandwidth (VBW) 1 Hz to 3 MHz in 1–3 sequence (–3 dB bandwidth) (auto or manually selectable)
RBW with Quasi-Peak Detection 200 Hz, 9 KHz, 120 kHz (–6 dB bandwidth)
VBW with Quasi-Peak Detection VBW with Quasi-Peak Detection
Spectral Purity
SSB Phase Noise @ 1 GHz –100 dBc/Hz, –110 dBc/Hz typical @ 10 kHz offset
Amplitude Ranges
Dynamic Range > 95 dB (2.4 GHz), 2/3 (TOI-DANL) in 10 Hz RBW
Measurement Range DANL to +26 dBm
Maximum Continuous Input +33 dBm
Display Range 1 to 15 dB/div in 1 dB steps, ten divisions displayed
Reference Level Range –120 dBm to +30 dBm
Attenuator Resolution 0 to 55 dB, 5.0 dB steps
Amplitude Units Log Scale Modes: dBm, dBV, dBmv, dBµV
Amplitude Accuracy (single sine wave input < Ref level, and > DANL, auto attenuation)
–10 °C to 50 °C after 30 minute warm-up Typical: ± 0.5 dB, 100 kHz to 6 GHz
Displayed Average Noise Level (DANL)
(RBW Normalized to 1 Hz, 0 dB attenuation)
10 MHz to 2.4 GHz
> 2.4 GHz to 4 GHz
> 4 GHz to 5 GHz
> 5 GHz to 6 GHz
(RBW = 10 Hz, 0 dB attenuation)
10 MHz to 2.4 GHz
> 2.4 GHz to 4 GHz
> 4 GHz to 5 GHz
> 5 GHz to 6 GHz
Spurs
Residual Spurious < –90 dBm (RF input terminated, 0 dB input attenuation, > 10 MHz)
Input-Related Spurious < –75 dBc (0 dB attenuation, –30 dBm input, span < 1.7 GHz, carrier offset > 4.5 MHz)
Exceptions, typical <–70 dBc @ <2.5 GHz, with 2072.5 MHz Input
Third-Order Intercept (TOI) Preamp Off (–20 dBm tones 100 kHz apart, 10 dB attenuation)
800 MHz +16 dBm
2400 MHz +20 dBm
200-2200 MHz +25 dBm, typical
> 2.2 GHz to 5.0 GHz +28 dBm, typical
> 5.0 GHz to 6.0 GHz +33 dBm, typical
Second Harmonic Distortion Preamp Off, 0 dB input attenuation, –30 dBm input
50 MHz –56 dBc
> 50 MHz to 200 MHz –60 dBc, typical
> 200 MHz to 3000 MHz –70 dBc, typical
VSWR
–105 dBc/Hz, –112 dBc/Hz typical @ 100 kHz offset
–115 dBc/Hz, –121 dBc/Hz typical @ 1 MHz offset
Linear Scale Modes: nV, µV, mV, V, kV, nW, µW, mW, W, kW
Maximum: ± 1.3 dB, 100 kHz to 6 GHz
Preamp Off
(Reference level –20 dBm)
Maximum Typical Maximum Typical
–141 dBm –146 dBm –157 dBm –162 dBm
–137 dBm –141 dBm –154 dBm –159 dBm
–134 dBm –138 dBm –150 dBm –155 dBm
–126 dBm –131 dBm –143 dBm –150 dBm
–131 dBm –136 dBm –147 dBm –152 dBm
–127 dBm –131 dBm –144 dBm –149 dBm
–124 dBm –128 dBm –140 dBm –145 dBm
–116 dBm –121 dBm –133 dBm –140 dBm
<–68 dBc @ F1-280 MHz with F1 Input
<–70 dBc @ F1 + 190.5 MHz with F1 Input
<–52 dBc @ 7349-2F2 MHz, with F2 Input, where F2 < 2424.5 MHz
<–55 dBc @ 190.5 ± F1/2 MHz, F1 <1 GHz
2:1, typical
(Reference level –50 dBm)
Preamp On
Page 3 of 24
Page 3
DUT
Receiver
Port 1
Reference
Receiver
Port 2Port 1
Bridge/Coupler
Source
LO
S
11
S
21
LMR Master™ S412E Specifications
Vector Network Analyzer
Denitions
• All specifications and characteristics apply under the following conditions, unless otherwise stated:
• After 15 minutes of warm-up time, where the instrument is left in the ON state.
• Temperature range is 23 °C ± 5 °C.
• All specifications apply when using internal reference.
• All specifications subject to change without notice. Please visit www.anritsu.com for most current datasheet.
• Typical performance is the measured performance of an average unit.
• Recommended calibration cycle is 12 months.
Frequency
Frequency Range: 500 kHz to 1.6 GHz (500 kHz to 6.0 GHz with Option 16)
Frequency Accuracy: 2.5 ppm
Frequency Resolution: 1 Hz
Typical Test Port Power
LMR Master supports selection of either High (default)
or Low test port power. Changing power after calibration
can degrade the calibrated performance. Typical power by
bands is shown in the following table.
Frequency Range High Port Power Low Port Power
500 kHz to ≤ 3 GHz +3 dB –25 dBm
3 GHz to ≤ 6 GHz 0 dB –25 dBm
Transmission Dynamic Range
The transmission dynamic range (the difference between
test port power and noise floor) using 10 Hz IF Bandwidth
and High Port Power is shown in the following table.
Frequency Range Dynamic Range
2 MHz to ≤ 4 GHz 100 dB
4 GHz to ≤ 6 GHz 90 dB
Typical Sweep Speed
The typical sweep speed for IF Bandwidth of 100 Hz,
1001 data points, and single display is shown in the
following table. The two receiver architecture will
simultaneously collect S21 and S11 (or S12 and S22)
in a single sweep.
Frequency Range Typical Sweep Speed
500 kHz to 6 GHz 850 μs / point
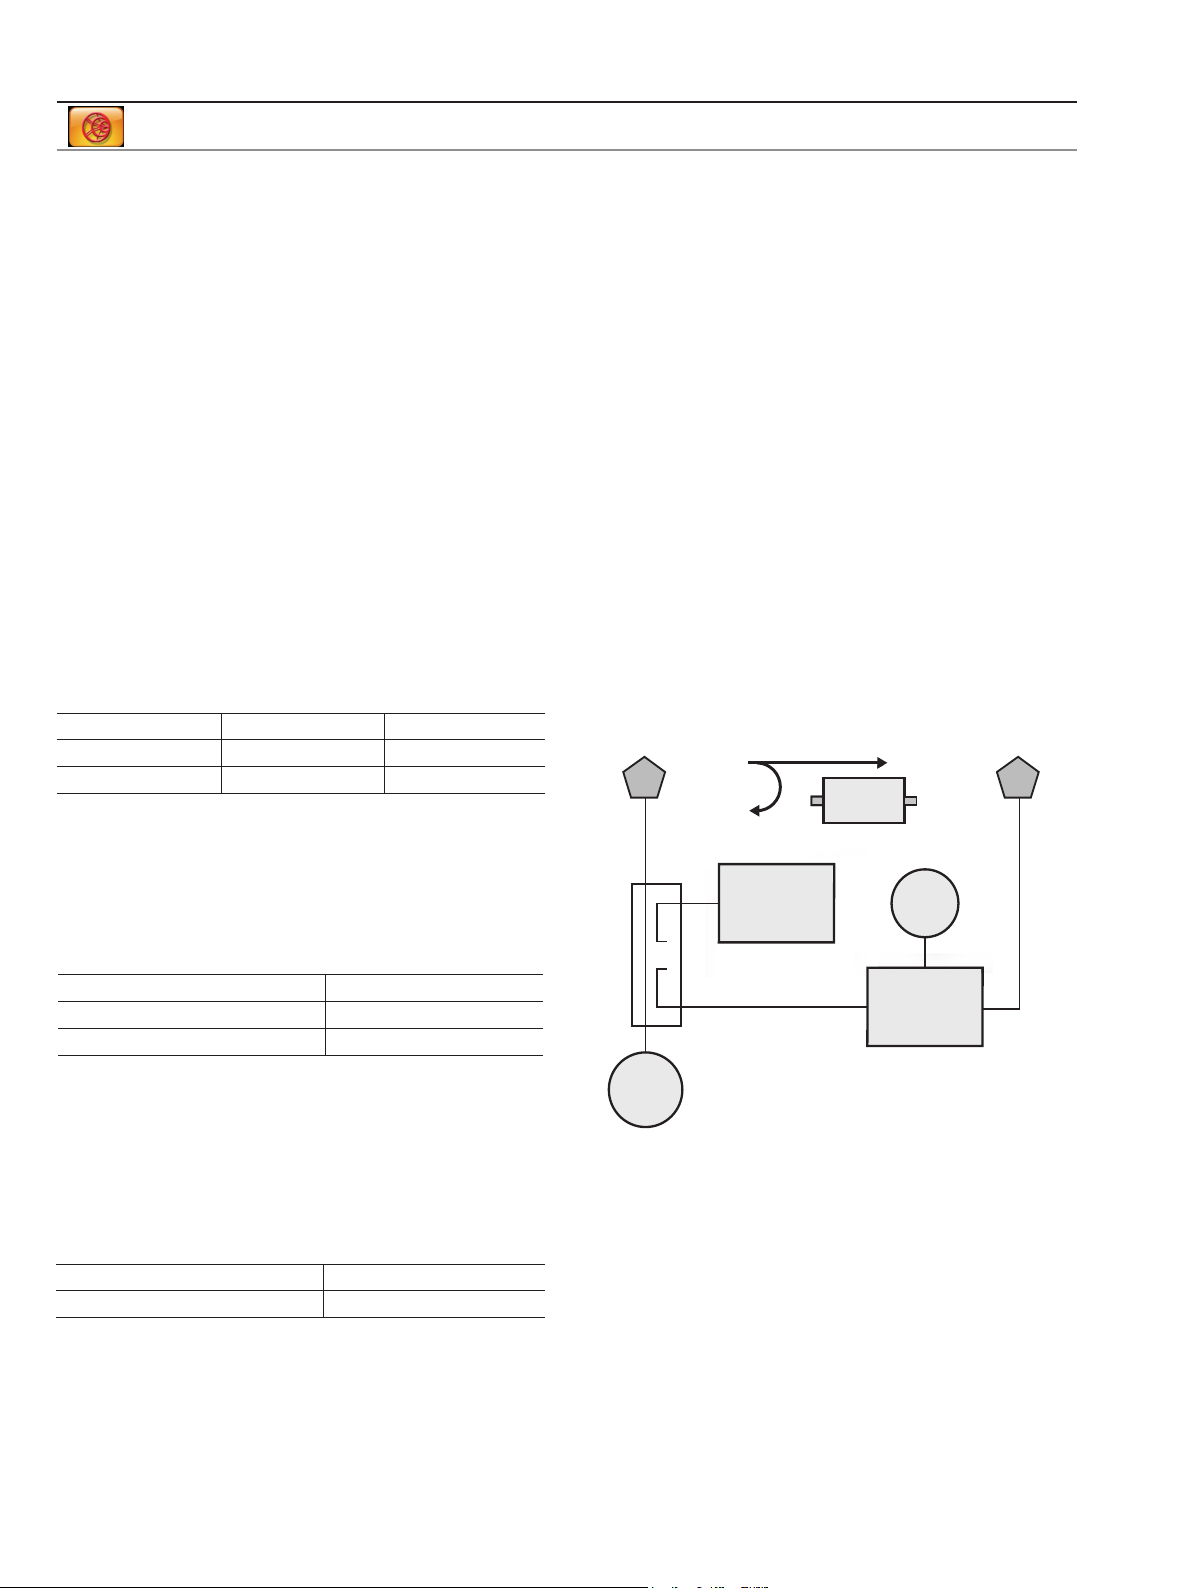
Block Diagram
As shown in the following block diagram, the LMR Master
has a 2-port, 1-path architecture that automatically
measures 2 S-parameters with error-correction precision
inherent to VNA operation.
The above illustration is a simplified block diagram of LMR Master’s
2-port, 1-path architecture. The magnitude and phase information
gained from vector network data enables the LMR Master to
make significant error corrections and provide improved field
measurements.
Page 4 of 24
Page 4
LMR Master™ S412E Specifications
S21 Magnitude
S11 Magnitude
Vector Network Analyzer
High Port Power
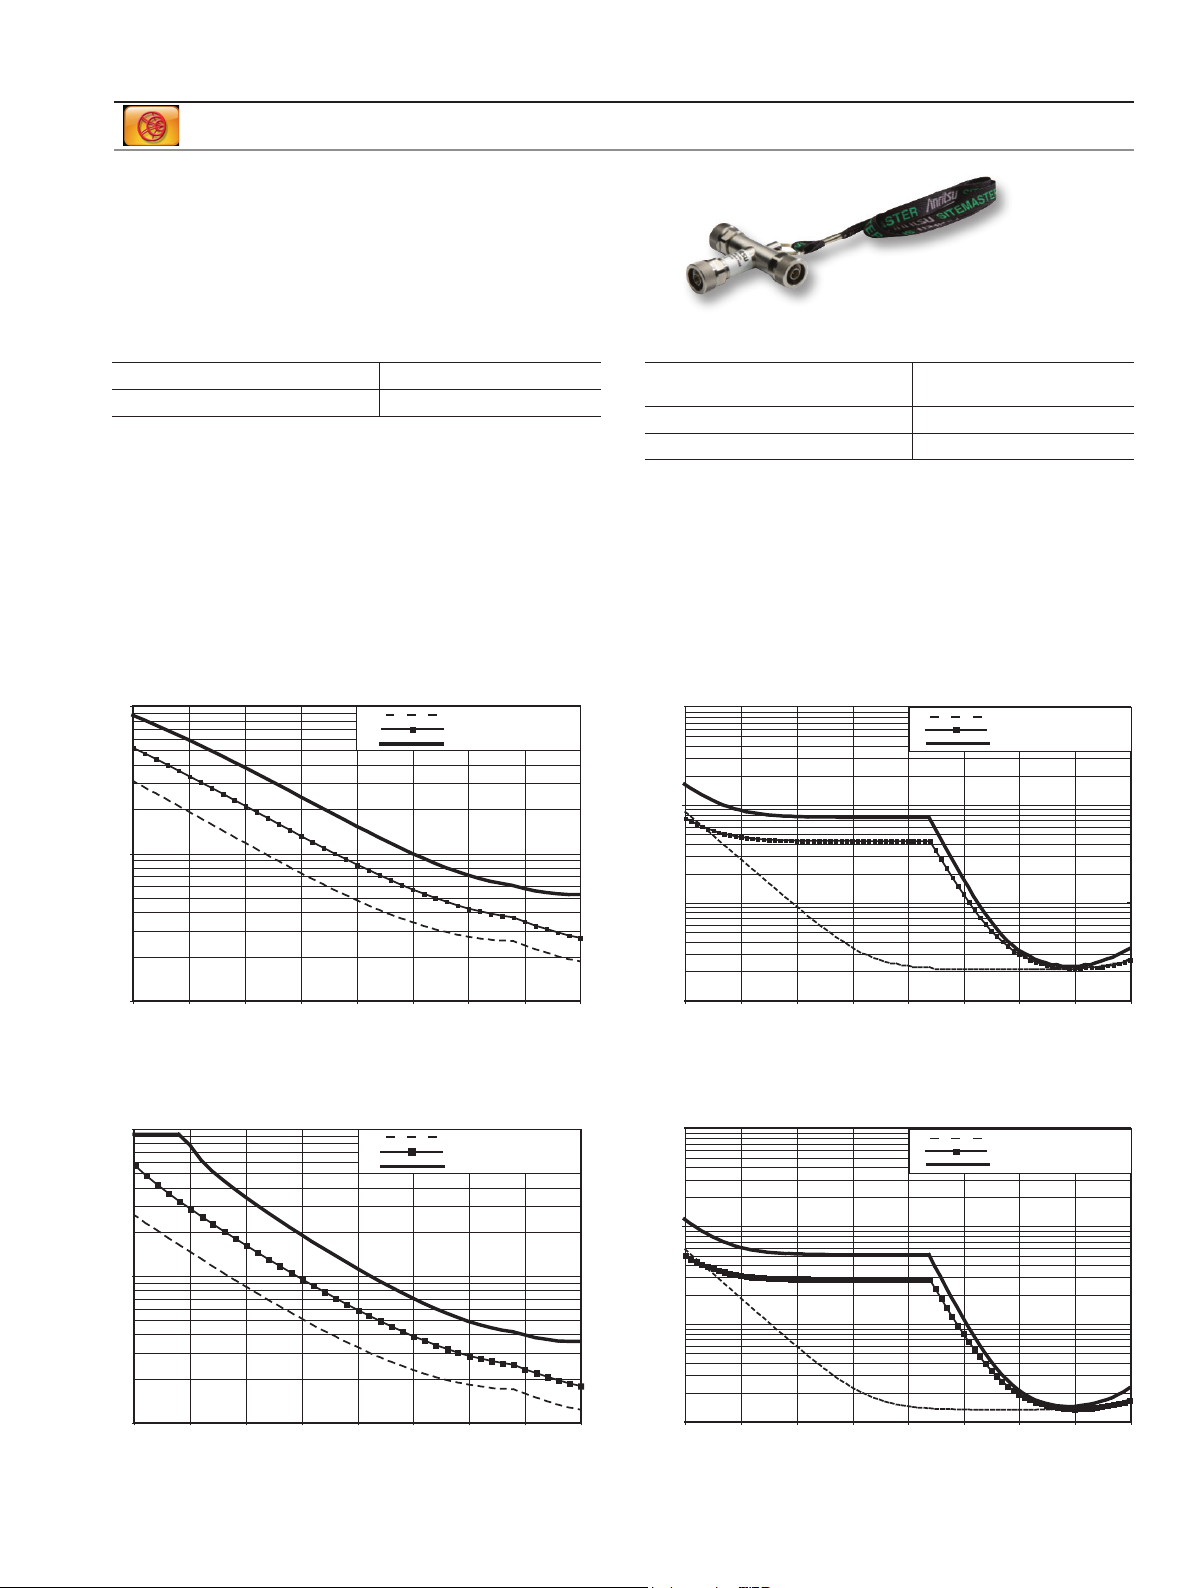
OSLxx50 Calibration Components (N-Connector)
Corrected System Performance and Uncertainties:
S412E with 1-path, 2-port calibration including
isolation using either OSLN50-1 & OSLNF50-1 Calibration Kits
Precision calibration standards come in a convenient
configuration for field work.
Frequency Range Directivity
≤ 6 GHz > 42 dB
Frequency Range Typical High Port
Power
≤ 3 GHz +3 dBm
≤ 6 GHz 0 dBm
Measurement Uncertainties
The following graphs provide measurement uncertainty at 23 ºC ± 5 ºC for the above indicated connector type and
calibration. Errors are worse-case contributions of residual directivity, source match, frequency response, network analyzer
dynamic range, and connector repeatability. For two-port measurements, transmission tracking, crosstalk, and physical load
match termination were added. Isolation calibration and an IF Bandwidth of 10 Hz is used.
10
1
Uncertainty 2 MHz to 20 MHz
Uncertainty 20 MHz to 3 GHz
Uncertainty 3 GHz to 6 GHz
10
1
0.1
Uncertainty 2 MHz to 20 MHz
Uncertainty 20 MHz to 3 GHz
Uncertainty 3 GHz to 6 GHz
0.1
-40-35 -30-25 -20-15 -10-50
S11 Phase
100
10
1
-40-35 -30-25 -20-15 -10-50
Uncertainty 2 MHz to 20 MHz
Uncertainty 20 MHz to 3 GHz
Uncertainty 3 GHz to 6 GHz
Page 5 of 24
0.01
-80-70 -60-50 -40-30 -20-10 0
100
10
1
0.1
-80-70 -60-50 -40-30 -20-10 0
S21 Phase
Uncertainty 2 MHz to 20 MHz
Uncertainty 20 MHz to 3 GHz
Uncertainty 3 GHz to 6 GHz
Page 5
S21 Magnitude
LMR Master™ S412E Specifications
Vector Network Analyzer
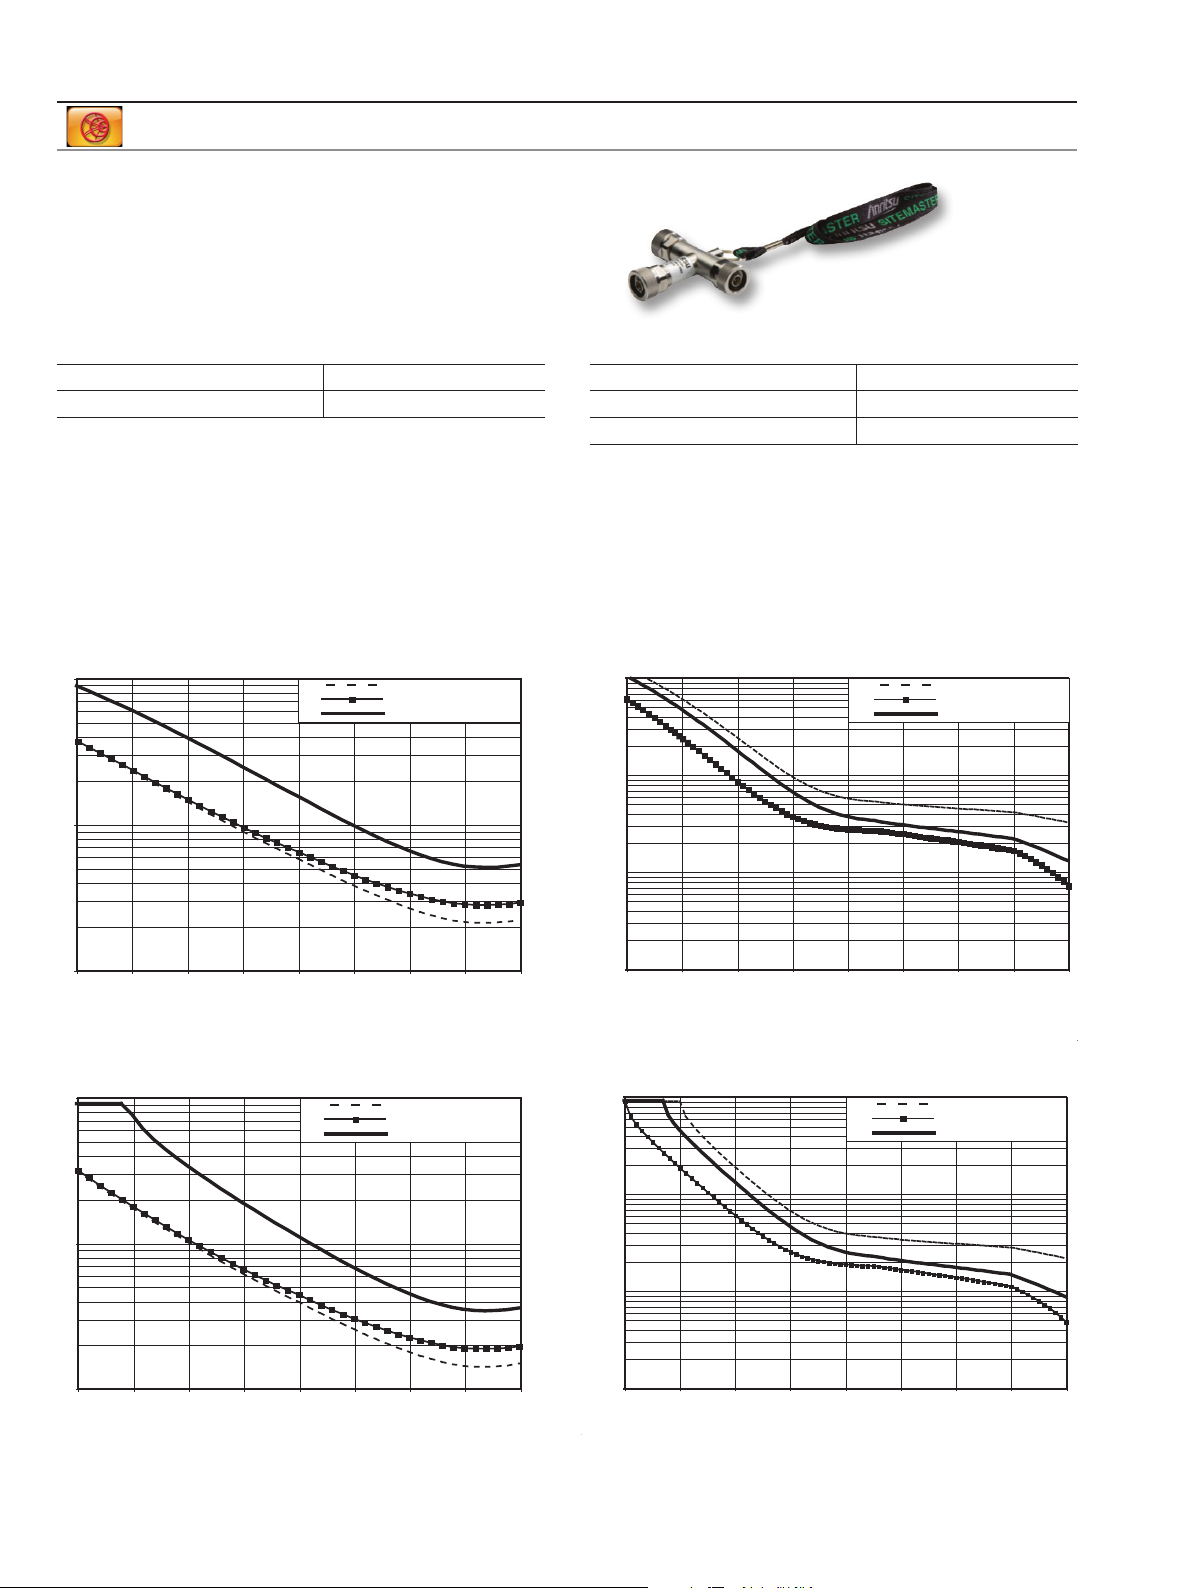
Low Port Power
OSLxx50 Calibration Components (N-Connectors)
Corrected System Performance and Uncertainties:
S412E Model with 1-path, 2-port calibration
including isolation using either OSLN50-1 or OSLNF50-1
Calibration Kits.
Precision calibration standards come in a convenient
configuration for field work.
Frequency Range Directivity
≤ 6 GHz > 42 dB dB
Measurement Uncertainties
The following graphs provide measurement uncertainty at 23 ºC ± 5 ºC for the above indicated connector type and
calibration. Errors are worse-case contributions of residual directivity, source match, frequency response, network analyzer
dynamic range, and connector repeatability. For two-port measurements, transmission tracking, crosstalk, and physical load
match termination were added. Isolation calibration and an IF Bandwidth of 10 Hz are used.
Frequency Range Typical Low Port Power
≤ 3 GHz -25 dBm
≤ 6 GHz -25 dBm
10
1
0.1
-40-35 -30-25 -20-15 -10-50
100
S11 Magnitude
S11 Phase
Uncertainty 2 MHz to 20 MHz
Uncertainty 20 MHz to 3 GHz
Uncertainty 3 GHz to 6 GHz
Uncertainty 2 MHz to 20 MHz
Uncertainty 20 MHz to 3 GHz
Uncertainty 3 GHz to 6 GHz
10
1
0.1
0.01
-80-70 -60-50 -40-30 -20-10 0
100
10
S21 Phase
Uncertainty 2 MHz to 20 MHz
Uncertainty 20 MHz to 3 GHz
Uncertainty 3 GHz to 6 GHz
Uncertainty 2 MHz to 20 MHz
Uncertainty 20 MHz to 3 GHz
Uncertainty 3 GHz to 6 GHz
10
1
-40-35 -30-25 -20-15 -10-50
Page 6 of 28
1
0.1
-80-70 -60-50 -40-30 -20-10 0
Page 6
LMR Master™ S412E Specifications
VNA Performance Capabilities
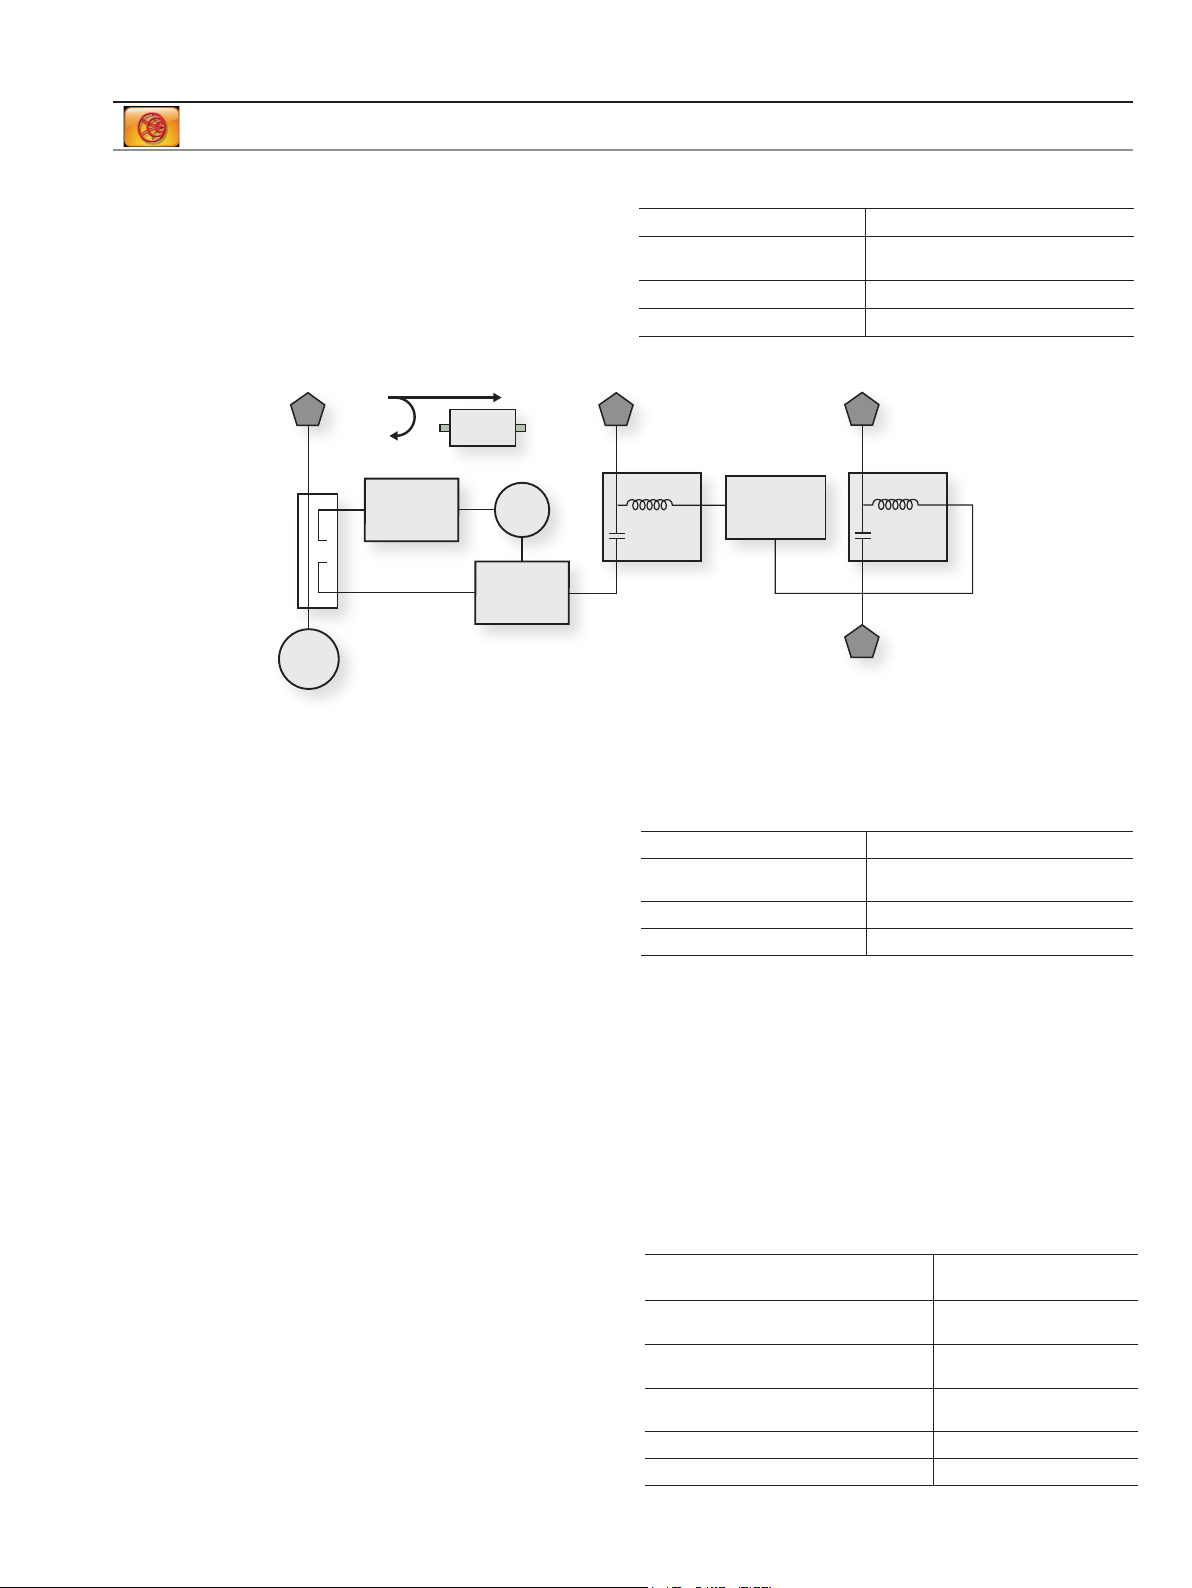
Bias Tee (Option 0010)
For tower mounted amplifier tests, the S412E with optional
internal bias tees can supply both DC and RF signals on the
center conductor of the cable during measurements. For
frequency sweeps in excess of 2 MHz, the LMR Master can
supply internal voltage control from +12 to +32 V in 0.1 V
steps up to 450 mA. Bias is available on VNA Port 2 and the
SPA Input (RF In).
Frequency Range 2 MHz to 4/6 GHz at VNA Port 2
Internal Voltage/Current +12 V to +32 V at 450 mA.
Steady state
Internal Resolution 0.1 V
Bias Tee Selections Internal, Off
S
21
S
11
Receiver
Port 1
Bridge/Coupler
Source
The Compact LMR Master offers optional integrated bias tee for supplying DC plus RF to the DUT as shown in this simplified block diagram.
DUT
LO
Reference
Receiver
Port 2Port 1
Internal
Bias Tee
Internal Bias
+12 to +32 V
450 mA Max
SPA Input
Internal
Bias Tee
SPA
Vector Voltmeter (Option 0015)
A phased array system relies on phase matched cables
for nominal performance. For this class of application, the
LMR Master offers this special software mode to simplify
phase matching cables at a single frequency. The similarity
between the popular vector voltmeter and this software
mode ensures minimal training is required to phase match
cables. Operation is as simple as configuring the display for
absolute or relative measurements. The easy-to-read large
fonts show either reflection or transmission measurements
using impedance, magnitude, or VSWR readouts. For
instrument landing system (ILS) or VHF Omni-directional
Range (VOR) applications, a table view improves operator
efficiency when phase matching up to twelve cables.
The S412E solution is superior because the signal source
is included internally, precluding the need for an external
signal generator.
CW Frequency Range 2 MHz to 6 GHz
Measurement Display CW, Table (Twelve Entries,
Plus Reference)
Measurement Types Return Loss, Insertion
Measurement Format dB/VSWR/Impedance
Distance Domain (Option 0501)
Distance-to-Fault Analysis is a powerful field test tool to
analyze cables for faults, including minor discontinuities
that may occur due to a loose connection, corrosion,
or other aging effects. By using Frequency Domain
Reflectometry (FDR), the Compact VNA Master exploits a
user-specified band of full power operational frequencies
(instead of DC pulses from TDR approaches) to more
precisely identify discontinuities. The Compact VNA Master
converts S-parameters from frequency domain into
distance domain on the horizontal display axis, using a
mathematical computation called Inverse Fourier Transform.
Connect a reflection at the opposite end of the cable and
the discontinuities appear versus distance to reveal any
potential maintenance issues. When access to both ends of
the cable is convenient, a similar distance domain analysis
is available on transmission measurements.
Option 0501 Distance Domain will improve your productivity
with displays of the cable in terms of discontinuities versus
distance. This readout can then be compared against
previous measurements (from stored data) to determine
whether any degradations have occurred since installation
Page 7 of 28
(or the last maintenance activity). More importantly, you
will know precisely where to go to fix the problem and
minimize or prevent downtime of the system.
Option 0501 Distance Domain also supports field
measurements for optical fiber diagnostics. Anritsu Model
ODTF-1 test module works directly with RF techniques and
converts optical DTF signals to display on the VNA Master.
Maximum Distance
(4001 data points, 1.6 GHz span)
Maximum Distance
(4001 data points, 6.0 GHz span)
Minimum Distance Resolution
(1.6 GHz span)
Minimum Distance Resolution
(6.0 GHz span)
Measurement Display Return Loss, VSWR
Measurement Format dB, VSWR
374.9 m (1,229.9 ft)
99.9 m (327.75 ft)
18.7 cm (7.36 in)
4.99 cm (1.97 in)
Page 7

LMR Master™ S412E Specifications
NBFM Analyzer and Coverage Mapping
Measurements
NBFM Analyzer NBFM Coverage
Carrier Power
Carrier Frequency
Frequency Error
FM Deviation
Modulation Rate
SINAD
Quieting
THD
Occupied Bandwidth (% Int Pwr or > dBc method)
Decoded CTCSS/DCS/DTMF
Interference Analyzer (Option 0025)
Measurements Spectrum
Field Strength
Occupied Bandwidth
Channel Power
Adjacent Channel Power (ACPR)
AM/FM/SSB Demodulation (Wide/Narrow FM, Upper/Lower SSB), (audio out only)
Carrier-to-Interference ratio (C/I)
Spectrogram (Collect data up to one week)
Signal Strength (Gives visual and aural indication of signal strength)
Received Signal Strength Indicator (RSSI) (collect data up to one week)
Gives visual and aural indication of signal strength
Signal ID (up to 12 signals)
Center Frequency
Bandwidth
Signal Type (FM, GSM, W-CDMA, CDMA, Wi-Fi)
Closest Channel Number
Number of Carriers
Signal-to-Nose Ratio (SNR) > 10 dB
Interference Mapping
Triangulate location of interference with on display maps
Application Options Bias-Tee (On/Off), Impedance (50 Ω, 75 Ω, Other)
(requires Option 0031 GPS and a suitable GPS antenna)
RSSI
SINAD
Outdoor measured values are overlayed on a geo-tagged map
and exportable to both KML and CSV text (requires option 0031
GPS and a suitable GPS antenna)
Indoor measured values are referenced by creating touchscreen
points on a floorplan.
Page 8 of 28
Page 8

LMR Master™ S412E Specifications
GPS Receiver Option (Option 0031) (Antenna sold separately)
Setup On/Off, Antenna Voltage 3.3/5.0 V, GPS Info
GPS Time/Location Indicator Time, Latitude, Longitude and Altitude on display
Time, Latitude, Longitude and Altitude with trace storage
High Frequency Accuracy Spectrum Analyzer, Interference Analyzer, CW Signal Analyzers
when GPS Antenna is connected < ± 50 ppb with GPS On, 3 minutes after satellite lock in selected mode
Connector SMA, Female
Coverage Mapping (Options 0431)
Measurements
Indoor Mapping Outdoor Mapping
RSSI
ACPR
Setup Parameters
Frequency Center/Start/Stop, Span, Freq Step, Signal Standard, Channel #, Channel Increment
Amplitude Reference Level (RL), Scale, Attenuation Auto/Level, RL Offset, Pre-Amp On/Off, Detection
Span Span, Span Up/Down (1-2-5), Full Span, Zero Span, Last Span
BW RBW, Auto RBW, VBW, Auto VBW, RBW/VBW, Span/VBW
Measurement Setup ACPR, RSSI
Point Distance / Time Setup Repeat Type Time Distance
Save Points Map Save KML, JPEG, Tab Delimited
Recall Points Map Recall Map, Recall KML Points only, Recall KML Points with Map, Recall Default Grid
RSSI
ACPR
Channel Scanner (Option 0027)
Number of Channels 1 to 20 Channels
Measurements Graph/Table, Max Hold (On/5 sec/Off), Freq/Channel, Current/Max, Single/Dual Color
Scanner Scan Channels, Scan Frequencies, Scan Customer List, Scan Script Master™
Amplitude Reference Level, Scale
Custom Scan Signal Standard, Channel, # of Channels, Channel Step Size, Custom Scan
Frequency Accuracy ± 10 Hz + Time base error
Measurement Range –110 dBm to +26 dBm
Application Options Bias-Tee (On/Off), Impedance (50 Ω, 75 Ω, Other)
Page 9 of 28
Page 9

LMR Master™ S412E Specifications
Power Meter
Frequency Center/Start/Stop, Span, Frequency Step, Signal Standard, Channel #, Full Band
Amplitude Maximum, Minimum, Offset, Relative On/Off, Units, Auto Scale
Average Acquisition Fast/Med/Slow, # of Running Averages
Limits Limit On/Off, Limit Upper/Lower
Frequency Range 10 MHz to 1.6 GHz (Standard), 10 MHz to 6 GHz (Option 6)
Span 1 kHz to 100 MHz
Display Range -140 dBm to +30 dBm, ≤ 40 dB span
Measurement Range -120 dBm to +26 dBm
Offset Range 0 dB to +100 dB
VSWR 2:1 typical
Maximum Power +35 dBm without attenuator
Accuracy Same as Spectrum Analyzer
Application Options Impedance (50 Ω, 75 Ω, Other)
High Accuracy Power Meter (Option 0019) (Requires external USB Power Sensor(s))
Amplitude Maximum, Minimum, Offset, Relative On/Off, Units, Auto Scale
Average # of Running Averages, Max Hold
Zero/Cal Zero On/Off, Cal Factor (Center Frequency, Signal Standard)
Limits Limit On/Off, Limit Upper/Lower
Power Sensor Model PSN50 MA24104A/05A MA24106A MA24108/18/26A
Description High Accuracy
RF Power Sensor
Frequency Range 50 MHz to 6 GHz 600 MHz to 4 GHz
Connector Type N(m), 50 Ω Type N(m), 50 Ω
Dynamic Range -30 dBm to +20 dBm
(.001 mW to 100 mW)
VBW 100 Hz 100 Hz 100 Hz 50 kHz
Measurand True-RMS True-RMS True-RMS True-RMS, Slot Power,
Inline High/Peak
Power Sensor
(MA24104A)
350 MHz to 4 GHz
(MA24105A)
(MA24104A)
Type N(f), 50 Ω
(MA24105A)
+3 dBm to +51.76 dBm
(2 mW to 150 W)
High Accuracy
RF Power Sensor
Microwave
USB Power Sensor
50 MHz to 6 GHz 10 MHz to 8 GHz
(MA24108A)
10 MHz to 18 GHz
(MA24118A)
10 MHz to 26 GHz
(MA24126A)
Type N(m), 50 Ω Type N(m), 50 Ω
(MA24108/18A)
Type K(m), 50 Ω
(MA24126A)
-40 dBm to +23 dBm
(0.1 µW to 200 mW)
-40 dBm to +20 dBm
(0.1 µW to 100 mW)
Burst Average Power
Measurement Uncertainty ±0.16 dB
(for complete specications)
Datasheet
Notes: 1) Total RSS measurement uncertainty (0 ºC to 50 ºC) for power measurements of a CW signal greater than -20 dBm
11410-00414 11410-00483
with zero mismatch errors.
2) Expanded uncertainty with K=2 for power measurements of a CW signal greater than +20 dBm with a matched load.
Measurement results referenced to the input side of the sensor.
3) Expanded uncertainty with K=2 for power measurements of a CW signal greater than -20 dBm with zero mismatch errors.
CW Signal Generator
Setup Parameters
Generator
Tx Output Level -120 dBm to 0 dBm
Tx Pattern CW
RF Characteristics
Power Level Accuracy 2.0 dB (CW Pattern, temperature range 15 °C to 35 °C, -120 to 0 dBm) Typical
Frequency Range
Frequency Accuracy
1
±0.17 dB
2
±0.16 dB
1
±0.18 dB
3
11410-00424 11410-00504
(MA24104A)
11410-00621
(MA24105A)
On/Off
500 kHz to 1.6 GHz
Same as Spectrum Analyzer
Page 10 of 28
Page 10

LMR Master™ S412E Specifications
P25 Analyzer and P25 Talk-Out Coverage (Options 0521, 0522)
Measurements
P25 Analyzer
(Option 0521)
Received Power
Frequency Error
Modulation Fidelity
NAC (hex)
Symbol Rate Error
BER (1011 Hz, O.153, Voice, and Control Channel)
Symbol Deviation
Graphs
P25 Analyzer
(Option 0521)
Constellation
Linear Constellation
Spectrum [Spans (kHz) = 25,50,100,500,1000,5000]
Histogram
Eye Diagram
Summary Display
Setup Parameters
Frequency Center Frequency
Amplitude Reference level, Scale, Ext Attenuation, Auto Range, Adjust Range
Setup Modulation Type (C4FM for P25 Phase 1, CQPSK for LSM)
Measurement P25 Analyzer, P25 Coverage
P25 Analyzer Active Graph, Maximize Active Trace, Graph Type, Symbol Span
Graph Type Constellation, Linear Constellation, Spectrogram, Histogram, Eye Diagram, Summary
Eye Diagram Symbol Span 2, 3, 4, 5
P25 Coverage
(Option 0522, requires Option 0031 GPS)
RF Measurements (Option 0521) (temperature range 15 °C to 35 °C)
Received Power dBm ± 1.25 dB, ± 0.5 dB typical
Frequency Error Hz ± 10 Hz + Frequency Reference
Modulation Fidelity %
BER/MER %
Symbol Deviation Hz
Network Access Code Hex
Symbol Rate Error MHz
Measurements (Option 0522)
BER pattern (1011 Hz, O.153, Voice, Control Channel)
USB Memory File Format .p25, .kml, both
Log data on / off
Measured values are overlayed on a geo-tagged map and exportable to both KML and CSV text
Measured values are overlayed on a geo-tagged map and exportable to both KML and CSV text
(Option 0522 , requires Option 0031 GPS)
P25 Talk-Out Coverage
BER
RSSI
Modulation Fidelity
P25 Talk-Out Coverage
(Option 0522 , requires Option 0031 GPS)
Outdoor measured values are overlayed on a geo-tagged map and
exportable to both KML and CSV text (Requires option 0031 GPS
and a suitable GPS antenna)
Indoor measured values are referenced by creating touchscreen
points on a floorplan
Signal Generator
Setup Parameters
RF Characteristics
Generator
Tx Output Level -120 dBm to 0 dBm
Tx Pattern
Power Level Accuracy 2.0 dB (CW Pattern, temperature range 15 °C to 35 °C, -120 to 0 dBm) Typical
Frequency Range
Mod Fidelity
Frequency Accuracy
On/Off
1011 Hz, 1011 Hz Cal, Intfr, Silence, Busy, Idle, High Dev, Low Dev, O.153 (v. 52), CW, AM and FM
500 kHz to 1.6 GHz
1.25 % max, 0.75 typical
Same as Spectrum Analyzer
Page 11 of 28
Page 11

LMR Master™ S412E Specifications
DMR2 Analyzer and DMR2 Talk-Out Coverage (Options 0591, 0592)
Measurements
DMR2 Analyzer
(Option 0591)
Received Power
Frequency Error
Modulation Fidelity
Color Code (hex)
RX & TX Timeslot
Symbol Rate Error
Symbol Deviation
BER Mobile Station: 1031 Hz, O.153, Voice, Silence, Idle and Control Channel
Base Station: 1031 Hz, 1031 Hz 1% BER, O.153, O.153 1% BER, Silence, TSCC
Graphs
DMR2 Analyzer
(Option 0591)
Constellation
Linear Constellation
Spectrum [Spans(kHz) = 25,50,100,500,1000,5000]
Histogram
Eye Diagram
Summary Display
Setup Parameters
Frequency Center Frequency
Amplitude Reference level, Scale, Ext Attenuation, Auto Range, Adjust Range
Setup Modulation Type (Base Station, Mobile Station), BER pattern (1031 Hz, O.153, Voice,
Measurement DMR2 Analyzer, DMR2 Coverage
DMR2 Analyzer Active Graph, Maximize Active Trace, Graph Type, Symbol Span
Graph Type Constellation, Linear Constellation, Spectrogram, Histogram, Eye Diagram, Summary
Eye Diagram Symbol Span 2, 3, 4, 5
DMR2 Coverage
(Option 0592, requires Option 0031 GPS)
RF Measurements (Option 0591) (temperature range 15 °C to 35 °C)
Received Power dBm ± 1.25 dB, ± 0.5 dB typical
Frequency Error Hz ± 10 Hz + Frequency Reference
Modulation Fidelity %
BER/MER %
Symbol Deviation Hz
Color Code Hex
Receive Timeslot
Transmit Timeslot
Symbol Rate Error mHz
Measurements (Option 0592)
Control Channel, Silence, Idle)
USB Memory File Format .dmr2, .kml, both
Log data on / off
Measured values are overlayed on a geo-tagged map and exportable to both KML and CSV text
Measured values are overlayed on a geo-tagged map and exportable to both KML and CSV text
(Option 0592, requires Option 0031 GPS)
DMR2 Talk-Out Coverage
BER
RSSI
Modulation Fidelity
DMR2 Talk-Out Coverage
(Option 0592, requires Option 0031 GPS)
Outdoor measured values are overlayed on a geo-tagged map and
exportable to both KML and CSV text (Requires option 0031 GPS
and a suitable GPS antenna)
Indoor measured values are referenced by creating touchscreen
points on a floorplan
Signal Generator
Setup Parameters
RF Characteristics
Generator
Tx Output Level -120 dBm to 0 dBm
Tx Pattern
Power Level Accuracy 2.0 dB (CW Pattern, temperature range 15 °C to 35 °C, -120 dBm to 0 dBm) Typical
Frequency Range
Mod Fidelity
Frequency Accuracy
On/Off
1031 Hz, O.153 (v. 52), Silence, 1031 Hz with 1% BER, O.153 (v. 52) with 1% BER,
TSCC (only available in Base Station Modulation Type), CW, AM and FM
500 kHz to 1.6 GHz
1.25 % max, 0.75 typical
Same as Spectrum Analyzer
Page 12 of 28
Page 12

LMR Master™ S412E Specifications
NXDN Analyzer and NXDN Talk-Out Coverage (Options 0531, 0532)
Measurements
NXDN Analyzer
(Option 0531)
Received Power
Frequency Error
Modulation Fidelity
RAN (hex)
Symbol Rate Error
BER (1031 Hz, O.153, Voice, and Control Channel)
Symbol Deviation
Graphs
NXDN Analyzer
(Option 0531)
Constellation
Linear Constellation
Spectrum [Spans (kHz) = 25,50,100,500,1000,5000]
Histogram
Eye Diagram
Summary Display
Setup Parameters
Frequency Center Frequency
Amplitude Reference level, Scale, Ext Attenuation, Auto Range, Adjust Range
Setup Modulation Bandwidth (6.25 kHz and 12.5 kHz),
Measurement NXDN Analyzer, NXDN Coverage
NXDN Analyzer Active Graph, Maximize Active Trace, Graph Type, Symbol Span
Graph Type Constellation, Linear Constellation, Spectrogram, Histogram, Eye Diagram, Summary
Eye Diagram Symbol Span 2, 3, 4, 5
NXDN Coverage
(Option 0532, requires Option 0031 GPS)
RF Measurements (Option 0531) (temperature range 15 °C to 35 °C)
Received Power dBm ± 1.25 dB, ± 0.5 dB typical
Frequency Error Hz ± 10 Hz + Frequency Reference
Modulation Fidelity %
BER/MER %
Symbol Deviation Hz
Radio Access Number Hex
Symbol Rate Error mHz
Measurements (Option 0532, requires Option 0031 GPS)
BER pattern (1031 Hz, O.153, Voice, Control Channel)
USB Memory File Format .nxdn, .kml, both
Log data on / off
Measured values are overlayed on a geo-tagged map and exportable to both KML and CSV text
Measured values are overlayed on a geo-tagged map and exportable to both KML and CSV text
(Option 0532, requires Option 0031 GPS)
NXDN Talk-Out Coverage
BER
RSSI
Modulation Fidelity
NXDN Talk-Out Coverage
(Option 0532, requires Option 0031 GPS)
Outdoor measured values are overlayed on a geo-tagged map and
exportable to both KML and CSV text (Requires option 0031 GPS
and a suitable GPS antenna)
Indoor measured values are referenced by creating touchscreen
points on a floorplan
Signal Generator
Setup Parameters
RF Characteristics
Mod Bandwidth
Generator
Tx Output Level -120 dBm to 0 dBm
Tx Pattern
Power Level Accuracy 2.0 dB (CW Pattern, temperature range 15 °C to 35 °C, -120 to 0 dBm) Typical
Frequency Range
Mod Fidelity
Frequency Accuracy
6.25 kHz, 12.5 kHz
On/Off
1031 Hz, O.153 (v. 52), High Dev, Low Dev, UDCH Pattern 10, CAC, CW, AM and FM
500 kHz to 1.6 GHz
1.25% max
Same as Spectrum Analyzer
Page 13 of 28
Page 13

LMR Master™ S412E Specifications
PTC Analyzer and PTC Talk-Out Coverage (Options 0721, 0722)
Measurements
PTC Analyzer
(Option 0721)
Received Power
Frequency Error
4FSK: BER, Modulation Fidelity, Symbol Deviation, Symbol Rate Error
∏/4 DQPSK: Error Vector Magnitude, BER, IQ Imbalance,
Phase Error, Magnitude Error, Symbol Rate Error
Graphs
PTC Analyzer
(Option 0721)
Constellation
Linear Constellation
Spectrum [Spans(kHz) = 25,50,100,500,1000,5000]
Histogram
Eye Diagram
Summary Display
Setup Parameters
Frequency Center Frequency
Amplitude Reference level, Scale, Ext Attenuation, Auto Range, Adjust Range
Setup
Measurement PTC Analyzer, PTC Coverage
PTC Analyzer Active Graph, Maximize Active Trace, Graph Type, Symbol Span
Graph Type Constellation, Linear Constellation, Spectrogram, Histogram, Eye Diagram, Summary
Eye Diagram Symbol Span
PTC Coverage
(Option 0532, requires Option 0031 GPS)
RF Measurements (Option 0721) (temperature range 15 °C to 35 °C)
Received Power dBm ± 1.25 dB, ± 0.5 dB typical
Frequency Error Hz ± 10 Hz + Frequency Reference
Modulation Fidelity %
Error Vector Magnitude %
Phase Error degrees
Magnitude Error %
IQ Imbalance dB
BER %
Symbol Deviation Hz
Radio Access Number Hex
Symbol Rate Error mHz
Measurements (Option 0722)
Modulation Type (4FSK, DQPSK) Symbol Rate (ksps) (6, 8, 12, 16)
TX pattern Preamble + PN9, PN9 Only, CW, AM 1 kHz tone, FM 1 kHz tone
2, 3, 4, 5
USB Memory File Format .mtd, .kml, both
Log data on / off
Measured values are overlayed on a geo-tagged map and exportable to both KML and CSV text
Measured values are overlayed on a geo-tagged map and exportable to both KML and CSV text
(Option 0722, requires Option 0031 GPS)
PTC Talk-Out Coverage
BER
RSSI
Modulation Fidelity
PTC Talk-Out Coverage
(Option 0722, requires Option 0031 GPS)
Measured values are overlayed on a geo-tagged map and
exportable to both KML and CSV text (Requires Option 0031 and a
suitable GPS antenna)
Signal Generator
Setup Parameters
Modulation Type (4FSK, ∏/4 DQPSK)
RF Characteristics
Symbol Rate (ksps) (6, 8, 12, 16)
Generator
Tx Output Level -120 dBm to 0 dBm
Tx Pattern
Power Level Accuracy 2.0 dB (CW Pattern, temperature range 15 °C to 35 °C, -120 to 0 dBm) Typical
Frequency Range
Mod Fidelity
Frequency Accuracy
On/Off
Preamble + PN9, PN9 Only, CW, AM 1 kHz tone, FM 1 kHz tone
500 kHz to 1.6 GHz
1.75 % max
Same as Spectrum Analyzer
Page 14 of 28
Page 14

LMR Master™ S412E Specifications
AM/FM/PM Signal Analyzers (Option 0509)
RF Spectrum
AM/FM/PM
Graphic
Display
Numerical
Displays
Setup Parameters
Specifications
Power (dBm)
vs. Frequency
Carrier Power
Carrier Frequency
Occupied
Bandwidth
Audio Spectrum
(AM)
Depth (%)
vs. Modulation
Frequency
AM Rate
RMS Depth
(Pk-Pk)/2 Depth
SINAD*
THD*
Distortion/Total
Vrms*
Frequency Center Freq, Span, Freq Step, Signal Standard, Channel, Channel Increment,
Amplitude Scale, Power Offset, Adjust Range
Setup Demod Type (AM, FM, PM), IFBW, Auto IFBW
Measurements RF Spectrum AM/FM/PM, Audio Spectrum (AM/FM/PM),
Marker On/Off, Delta, Peak Search, Marker Freq to Center, Marker to Ref Lvl, Marker Table,
IF Bandwidth 1 kHz to 300 kHz in 1-3 sequence
Frequency Span RF Spectrum: 10 kHz to 10 MHz
RBW/VBW 30
Span/RBW 100
Sweep Time 50 µs to 50 ms (Audio Waveform)
Audio Spectrum
(FM/PM)
Deviation
(kHz/rad) vs.
Modulation
Frequency
FM/PM Rate
RMS Deviation
(Pk-Pk)/2
Deviation
SINAD*
THD*
Distortion/Total
Vrms*
Set Carrier Freq
Audio Waveform (AM/FM/PM), Summary (AM/FM/PM), Average
All Markers Off
AM Modulation Rate: ± 1 Hz (< 100 Hz), ± 2% (> 100 Hz)
Depth: ± 5% for (Modulation rates 10 Hz to 100 kHz)
FM Modulation Rate: ± 1 Hz (< 100 Hz); ± 2% (100 Hz to 100 kHz)
Deviation Accuracy: ± 5% (100 Hz to 100 kHz)**
PM Modulation Rate: ± 1 Hz (< 100 Hz); ± 2% (100 Hz to 100 kHz)
Deviation Accuracy: ± 5% (deviation 0 to 93 Rad, rate 10 Hz to 5 kHz)**
Audio Spectrum: 2 kHz, 5 kHz, 10 kHz, 20 kHz
Measurements
Audio
Waveform
(AM)
Depth (%)
vs. Time
AM Rate
RMS Depth
(Pk-Pk)/2 Depth
SINAD*
THD*
Distortion/Total
Vrms*
Audio
Waveform
(FM/PM)
Deviation
(kHz/rad)
vs. Time
FM/PM Rate
RMS Depth
(Pk-Pk)/2 Depth
SINAD*
THD*
Distortion/Total
Vrms*
** IFBW must be greater than 95% occupied BW
Summary
(AM)
None None
RMS Depth (AM)
Peak + Depth
Peak – Depth
(Pk-Pk)/2 Depth
Carrier Power
Carrier
Frequency
Occupied
Bandwidth
AM Rate
SINAD*
THD*
Distortion/Total
Vrms*
* Requires Sinewave modulation
Summary
(FM/PM)
RMS Deviation
(FM/PM)
Peak + Depth
Peak – Depth
(Pk-Pk)/2 Depth
Carrier Power
Carrier
Frequency
Occupied
Bandwidth
AM Rate
SINAD*
THD*
Distortion/Total
Vrms*
Page 15 of 28
Page 15

LMR Master™ S412E Specifications
LTE Signal Analyzers (Options 0541, 0542, 0546)
Measurements
RF
(Option 0541)
Channel Spectrum
Channel Power
Occupied Bandwidth
ACLR
RF Summary
Setup Parameters
Measurement Summary Screens Overall Measurements, RF Measurements, Modulation Quality
RF Measurements (Option 0541) (requires Option 0031)
RF Channel Power Accuracy ± 1.5 dB, ± 1.0 dB typical, (RF input -50 dBm to +10 dBm)
Modulation (Option 0542) (requires Option 0031)
Residual EVM (rms) 2.0% typical (E-UTRA Test Model 3.1) (RF Input -50 dBm to +10 dBm)
Over-the-Air (OTA) Measurements (Option 0546) (requires Option 0031)
GPS Tagging and Logging Ye s
Constellation
Control Channel Power
Frequency E-UTRA bands 1 - 21 (tuneable 10 MHz to 4.0 GHz)
Bandwidth 10 MHz
Amplitude Scale/Division, Power Offset, Auto Range, Adjust Range
Save/Recall Setup, Measurement, Screen Shot (save only), to Internal/External Memory
Frequency Error ± 10 Hz + time base error, 99% condence level
Auto Save Yes
Modulation
(Option 0542)
Reference Signal Power
Sync Signal Power
EVM
Frequency Error
Carrier Frequency
Cell ID
Sector ID
Group ID
RS
P-SS
S-SS
PBCH
PCFICH
Modulation Summary
Center, Signal Standard, Channel #, Closest Channel, Decrement/Increment Channel
Span 1.4, 3, 5, 10, 15, 20, 30 MHz
Sweep Single/Continuous, Trigger Sweep
Scanner Six strongest Sync Signals
Synch Signal Power
(Six Strongest)
Power
Cell ID
Sector ID
Group ID
Dominance
Over-the-Air (OTA)
(Option 0546)
Pass/Fail
(User Editable)
Pass Fail All
Pass/Fail RF
Pass Fail Demod
Measurements
Channel Power
Occupied Bandwidth
ACLR
Frequency Error
Carrier Frequency
Dominance
EVM (peak)
EVM (rms)
RS Power
SS Power
P-SS Power
S-SS Power
PBCH Power
PCFICH Power
Cell ID
Group ID
Sector ID
Page 16 of 28
Page 16

LMR Master™ S412E Specifications
IEEE 802.16 Fixed WiMAX Signal Analyzers (Options 0046, 0047)
Measurements
RF
(Option 0046)
Channel Spectrum
Channel Power
Occupied Bandwidth
Power vs. Time
Channel Power
Preamble Power
Data Burst Power
Crest Factor
ACPR
Setup Parameters
Cyclic Prex Ratio (CP) 1/4, 1/8, 1/16, 1/32
Measurement Summary Screens Overall Measurements, RF Measurements, Signal Quality Measurements
RF Measurements (Option 0046) (temperature range 15 ºC to 35 ºC)
RF Channel Power Accuracy ± 1.5 dB, ± 1.0 dB typical, (RF input -50 dBm to +20 dBm)
Demodulation (Option 0047) (temperature range 15 ºC to 35 ºC)
Constellation
Spectral Flatness
EVM vs. Subcarrier/Symbol
Frame Length 2.5, 5.0, 10.0 msec
Save/Recall Setup, Measurement, Screen Shot (save only), to Internal/External Memory
Frequency Error 0.07 ppm + time base error, 99% condence level
Residual EVM (rms) 3% typical, 3.5% maximum (RF Input -50 dBm to +20 dBm)
Demodulation
(Option 0047)
RCE (RMS/Peak)
EVM (RMS/Peak)
Frequency Error
Carrier Frequency
Base Station ID
Adjacent Subcarrier Flatness
RCE
EVM
Frequency Error
Carrier Frequency
Base Station ID
Bandwidth 1.25, 1.50, 2.50, 3.50, 5.00, 5.50, 6.00, 7.00, 10.00 MHz
Span 5, 10, 15, 20 MHz
Frequency Center, Signal Standard, Channel #, Closest Channel, Decrement/Increment Channel
Amplitude Scale/Division, Power Offset, Auto Range, Adjust Range
Sweep Single/Continuous, Trigger Sweep
Over-the-Air (OTA) Pass/Fail
There are no additional OTA
Measurements.
RF Measurements and
Demodulation can be made OTA
Channel Power
Occupied Bandwidth
Burst Power
Preamble Power
Crest Factor
Frequency Error
Carrier Frequency
EVM
RCE
Base Station ID
(User Editable)
Page 17 of 28
Page 17

LMR Master™ S412E Specifications
IEEE 802.16 Mobile WiMAX Signal Analyzers (Options 0066, 0067, 0037)
Measurements
RF
(Option 0066)
Channel Spectrum
Channel Power
Occupied Bandwidth
Power vs. Time
Channel Power
Preamble Power
Downlink Burst Power
Uplink Burst Power
ACPR
Setup Parameters
DL-MAP Auto Decoding Convolutional Coding (CC), Convolutional Turbo Coding (CTC)
Cyclic Prex Ratio (CP) 1/8
Measurement Summary Screens Overall Measurements, RF Measurements, Signal Quality Measurements
RF Measurements (Option 0066) (temperature range 15 ºC to 35 ºC)
RF Channel Power Accuracy ± 1.5 dB, ± 1.0 dB typical, (RF input -50 dBm to +20 dBm)
Demodulation (Option 0067) (temperature range 15 ºC to 35 ºC)
Over-the-Air (OTA) Measurements (Option 0037)
Channel Power Monitor Over time (one week), measurement time interval 1 to 60 sec
Constellation
Spectral Flatness
EVM vs. Subcarrier/Symbol
DL-MAP (Tree View)
Bandwidths 3.50, 5.00, 7.00, 8.75, 10.00 MHz
Frame Lengths 5, 10 msec
Demodulation Auto, Manual, FCH
Save/Recall Setup, Measurement, Screen Shot (save only), to Internal/External Memory
Frequency Error 0.02 ppm + time base error, 99% condence level
Residual EVM (rms) 2.5% typical, 3.0% maximum, (RF Input -50 dBm to +20 dBm)
Preamble Scanner Six Strongest Preambles
GPS Logging Yes
Demodulation
(Option 0067)
RCE (RMS/Peak)
EVM (RMS/Peak)
Frequency Error
CINR
Base Station ID
Sector ID
Adjacent Subcarrier Flatness
RCE (RMS/Peak)
EVM (RMS/Peak)
Frequency Error
CINR
Base Station ID
Sector ID
Zone Type PUSC
Span 5, 10, 20, 30 MHz
Frequency Center, Signal Standard, Channel #, Closest Channel, Decrement/Increment Channel
Amplitude Scale/Division, Power Offset, Auto Range, Adjust Range
Sweep Single/Continuous, Trigger Sweep
Auto Save Yes
Over-the-Air (OTA)
(Option 0037)
Channel Power Monitor
Preamble Scanner (Six)
Preamble
Relative Power
Cell ID
Sector ID
PCINR
Dominant Preamble
Base Station ID
Pass/Fail
(User Editable)
Channel Power
Occupied Bandwidth
Downlink Bust Power
Uplink Burst Power
Preamble Power
Crest Factor
Frequency Error
Carrier Frequency
EVM
RCE
Sector ID
Page 18 of 28
Page 18

LMR Master™ S412E Specifications
All specications and characteristics apply under the following conditions, unless otherwise stated: 1) After 5 minutes of warm-up time, where
General Specifications
Setup Parameters
System Status (Temperature, Battery Info, Serial Number, Firmware Version, Options Installed)
System Options Name, Date and Time, Brightness, Volume
File Save, Recall, Delete, Directory Management
Save/Recall Setups, Measurements, Screen Shots Jpeg (save only)
Delete Selected File, All Measurements, All Mode Files, All Content
Directory Management Sort Method (Name/Type/Date), Ascend/Descend, Internal/USB, Copy, Format USB
Internal Trace/Setup Memory 2,000 traces, 2,000 Setups
External Trace/Setup Memory Limited by size of USB Flash drive
Mode Switching Auto-Stores/Recalls most recently used Setup Parameters in the Mode
Connectors
VNA Port 1, VNA Port 2, RF In, Signal Gen Type N, female, 50 Ω
VNA Port 1 Damage Level 23 dBm, ± 50 VDC
RF In Type N, female, 50 Ω
RF In Damage Level +33 dBm peak, ± 50 VDC, Maximum Continuous Input (≥ 10 dB attenuation)
GPS SMA(f)
External Power 5.5 mm barrel connector, 12.5 to 15 VDC, < 4.0 Amps
USB Interface (2) Type A, Connect USB Flash Drive and Power Sensor
USB Interface 5-pin mini-B, Connect to PC for data transfer
Headset Jack 3.5 mm mini-phone plug
External Reference In BNC, female, 50 Ω, Maximum Input +10 dBm
External Trigger/Clock Recovery BNC, female, 50 Ω, Maximum Input ± 50 VDC
Display
Type Resistive Touchscreen
Size 8.4” daylight viewable color LCD
Resolution 800 x 600
Battery
Type Li-Ion
Battery Operation 3.0 hours, typical
Electromagnetic Compatibility
European Union CE Mark, EMC Directive 2004/108/EC
Australia and New Zealand C-tick N274
Interference EN 61326-1
Emissions EN 55011
Immunity EN 61000-4-2/-4-3/-4-4/-4-5/-4-6/-4-11
Safety
Safety Class EN 61010-1 Class 1
Product Safety IEC 60950-1 when used with company supplied Power Supply
Environmental
Operating Temperature –10 °C to 55 °C
Maximum Humidity 95% RH (non-condensing) at 40 °C
Shock MIL-PRF-28800F Class 2
Storage –40 ºC to 71 °C
Altitude 4600 meters, operating and non-operating
ESD
RF Port Center Pin Withstands up to ± 15 kV
Size and Weight
Size 273 mm x 199 mm x 91 mm (10.7 in x 7.8 in x 3.6 in)
Weight 3.6 kg, (7.9 lbs)
the instrument is left in the ON state; 2) All specications apply when using internal reference; 3) All specications subject to change without
notice; 4) Typical performance is the measured performance of an average unit; 5) Recommended calibration cycle is 12 months.
Self Test, Application Self Test
GPS (see Option 0031)
Language (English, French, German, Spanish, Chinese, Japanese, Korean, Italian, User dened)
Reset (Factory Defaults, Master Reset, Update Firmware)
1 MHz, 5 MHz, 10 MHz, 13 MHz
Low Voltage Directive 2006/95/EC
Page 19 of 28
Page 19

LMR Master™ S412E Specifications
Master Software Tools (for your PC)
Database Management
Full Trace Retrieval Retrieve spectum analyzer traces from instrument into one PC directory
Trace Catalog Index all traces into one catalog
Trace Rename Utility Rename measurement traces
Group Edit Titles, subtitles, plot scaling, markers and limit lines, simultaneously on similar les
DAT File Converter Converts HHST les to MST le format and vice-versa
Data Analysis
Trace Math and Smoothing Compare multiple traces
Data Converter Convert from/to Return Loss, VSWR, Cable Loss, DTF and also into Smith Charts
Measurement Calculator Translates into other units
Report Generation
Report Generator Includes GPS, power level, and calibration status along with measurements
Edit Graph Change scale, limit lines, and markers
Report Format Create reports in HTML for PDF format
Export Measurements Export measurements to *.s2p, *.jpg or *.csv format
Notes Annotate measurements
Mapping (GPS Required)
Spectrum Analyzer Mode MapInfo, MapPoint
Folder Spectrogram (Spectrum Monitoring for Interference Analysis and Spectrum Clearing)
Folder Spectrogram – 2D View Creates a composite le of multiple traces
Peak Power, Total Power, Peak Frequency, Histogram, Average Power (Max/Min)
File Filter (Violations over limit lines or deviations from averages)
Playback
Video Folder Spectrogram – 2D View Create AVI le to export for management review/reports
Folder Spectrogram – 3D View Views (Set Threshold, Markers)
- 3D (Rotate X, Y, Z Axis, Level Scale, Signal ID)
- 2D View (Frequency or Time Domain, Signal ID)
- Top Down
Playback (Frequency and/or Time Domain)
List/Parameter Editors
Traces Add, delete, and modify limit lines and markers
Antennas, Cables, Signal Standards Modify instrument’s Antenna, Cable, and Signal Standard List
Product Updates Auto-checks Anritsu website for latest revision rmware
Firmware Upload Upload new rmware into the instrument
Languages Add up to two languages and modify non-English language menus
Display Modify display settings
Script Master™
Channel Scanner Mode Automate scan up to 1200 channels, repeat for sets of 20 channels, repeat all channels
GSM/GPRS/EDGE or W-CDMA/HSPA+ Mode Automate Signal Analysis testing requirements with annotated how-to pictures
Connectivity
Connections Connect to PC using USB
Download Download measurements and live traces to PC for storage and analysis
Upload Upload measurements from PC to instrument
Firmware Updates Create USB Flash Drive for rmware update
Page 20 of 28
 Loading...