

Page 1
Agilent
N1911A/N1912A P-Series Power
Meters and N1921A/N1922A
Wideband Power Sensors
Data Sheet
Page 2
LXI Class-C-Compliant Power Meter
A P-Series power meter is a LXI
Class-C-compliant instrument,
developed using LXI Technology. LXI,
an acronym for LAN eXtension for
Instrumentation, is an instrument
standard for devices that use the
Ethernet (LAN) as their primary communication interface.
Hence, it is an easy-to-use instrument especially with the usage of an
integrated Web browser that provides
a convenient way to configure the
instrument’s functionality.
Specification definitions
There are two types of product
specifications:
• Warranted specifications are
specifications which are covered
by the product warranty and apply
over a range of 0 to 55 ºC unless
otherwise noted. Warranted specifications include measurement
uncertainty calculated with a 95 %
confidence.
Characteristic information is
representative of the product. In
many cases, it may also be supplemental to a warranted specification.
Characteristic specifications are not
verified on all units. There are several
types of characteristic specifications.
They can be divided into two groups:
One group of characteristic types
describes ‘attributes’ common to all
products of a given model or option.
Examples of characteristics that
describe ‘attributes’ are the product
weight and ‘50-ohm input Type-N
connector’. In these examples,
product weight is an ‘approximate’
value and a 50-ohm input is ‘nominal’.
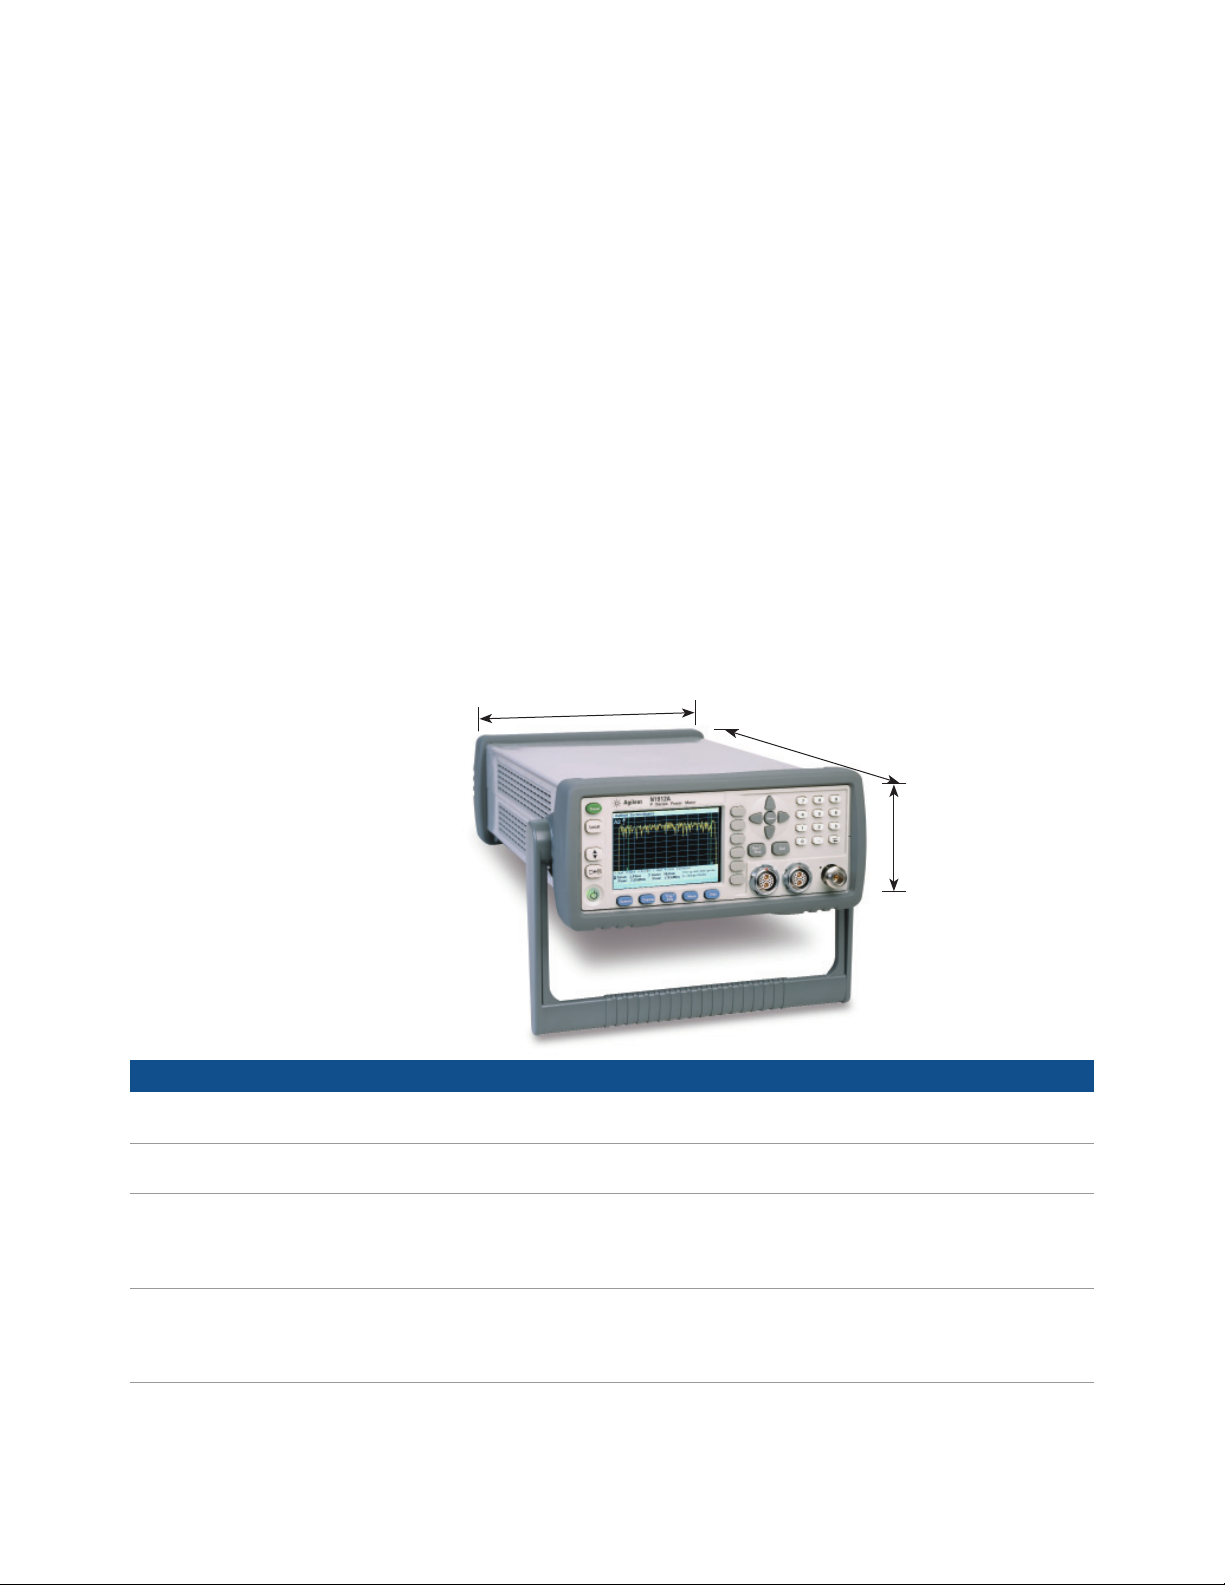
8.5 inch
These two terms are most widely
used when describing a product’s
‘attributes’.
Conditions
The power meter and sensor will
meet its specifications when:
• stored for a minimum of two hours
at a stable temperature within the
operating temperature range, and
turned on for at least 30 minutes
• the power meter and sensor are
within their recommended calibration period, and
• used in accordance to the information provided in the User’s Guide.
13.7 inch
3.5 inch
• Characteristic specifications
are specifications that are not
warranted. They describe product
performance that is useful in the
application of the product. These
characteristic specifications are
Physical dimensions
(does not include bumper)
shown in italics.
General features
Number of channels N1911A P-Series power meter, single channel
N1912A P-Series power meter, dual channel
Frequency range N1921A P-Series wideband power sensor, 50 MHz to 18 GHz
N1922A P-Series wideband power sensor, 50 MHz to 40 GHz
Measurements Average, peak and peak-to-average ratio power measurements are provided with free-run or time-gated
definitions.
Time parameter measurements of pulse rise time, fall time, pulse width, time-to-positive occurrence and
time-to-negative occurrence are also provided.
Sensor compatibility P-Series power meters are compatible with all Agilent P-Series wideband power sensors, E-Series sensors,
8480 Series sensors and N8480 Series sensors
be available free-of-charge in firmware release Ax.03.01 and above. Compatibility with N8480 Series power
sensors will be available free-of-charge in firmware release A.05.00 and above.
1. Information contained in this document refers to operations using P-Series sensors. For specifications relating to the use of 8480 and E-Series
sensors (except E9320A range), refer to publication number 5965-6382EN. For specification relating to the use of E932XA sensors, refer to publication number 5980-1469EN. For specifications relating to the use of N8480 Series sensors, refer to publication number 5989-9333EN. The E-Series,
8480 Series and N8480 Series power sensors require N1917A/ B/ C cables when connected to the P-Series power meters.
1
. Compatibility with the 8480 and E-Series power sensors will
2
Page 3
P-Series Power Meter and Sensor
Key system specifications and characteristics
Maximum sampling rate
Video bandwidth
Single-shot bandwidth
Rise time and fall time ≤ 13 ns (for frequencies ≥ 500 MHz)
Minimum pulse width
Overshoot
Average power measurement accuracy N1921A: ≤ ± 0.2 dB or ± 4.5 %
100 Msamples/sec, continuous sampling
≥ 30 MHz
≥ 30 MHz
50 ns
≤ 5 %
1
2
, see Figure 1
3
2
4
N1922A: ≤ ± 0.3 dB or ± 6.7 %
Dynamic range
–35 dBm to +20 dBm (> 500 MHz)
–30 dBm to +20 dBm (50 MHz to 500 MHz)
Maximum capture length
Maximum pulse repetition rate
1 second
10 MHz (based on 10 samples per period)
1. See Appendix A on page 9 for measurement uncertainty calculations.
2. Specification applies only when the Off video bandwidth is selected.
3. The Minimum Pulse Width is the recommended minimum pulse width viewable on the power meter, where power measurements are meaningful and
accurate, but not warranted.
4. Specification is valid over a range of –15 to +20 dBm, and a frequency range of 0.5 to 10 GHz, DUT Max. SWR < 1.27 for the N1921A, and a
frequency range of 0.5 to 40 GHz, DUT Max. SWR < 1.2 for the N1922A. Averaging set to 32, in Free Run mode.
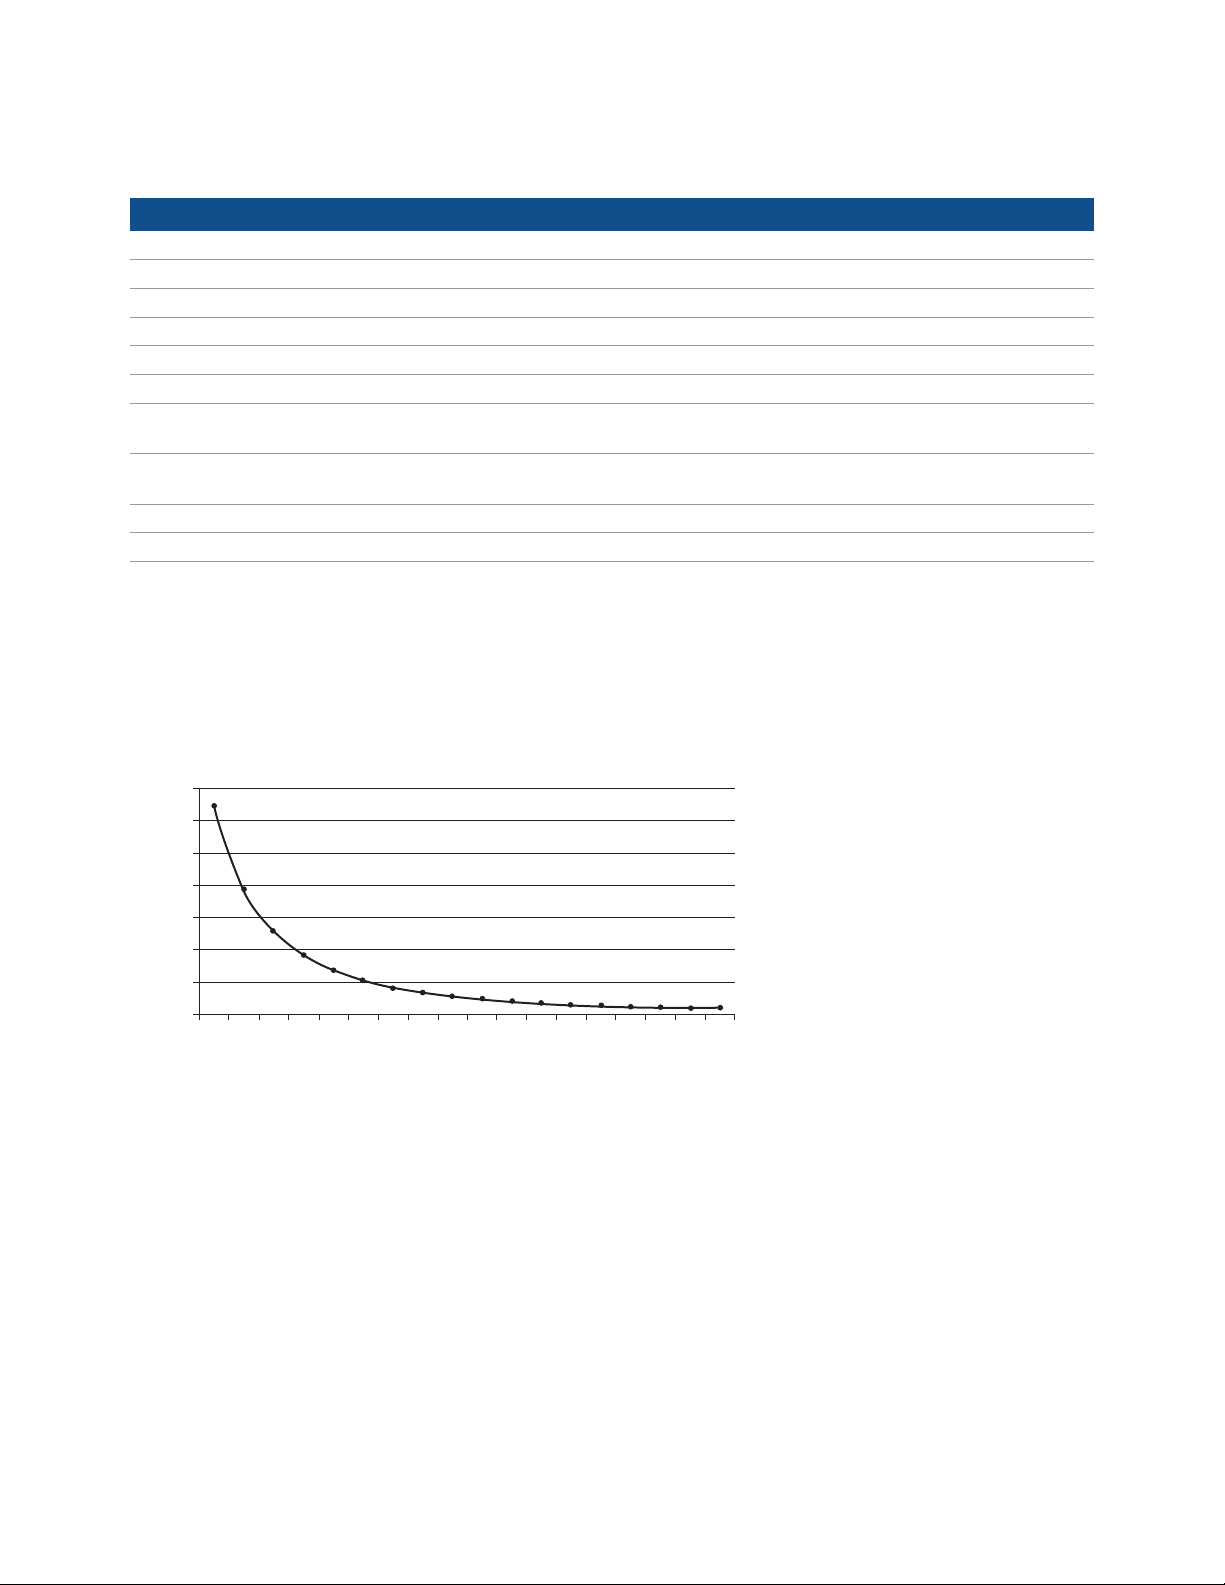
35
30
25
20
15
Percent error
10
5
0
15 20 25 30 35 40 45 50 55 60 65 70 75 80 85 90 95 100
Signal under test rise time (nS)
Figure 1. Measured rise time percentage error versus signal under test rise time
Although the rise time specification is ≤ 13 ns, this does not mean that the P-Series meter and sensor combination can
accurately measure a signal with a known rise time of 13 ns. The measured rise time is the root sum of the squares (RSS)
of the signal under test rise time and the system rise time (13 ns):
Measured rise time = √((signal under test rise time)3 + (system rise time)3)
and the % error is:
% Error = ((measured rise time – signal under test rise time)/signal under test rise time) x 100
3
Page 4

P-Series Power Meter Specifications
Meter uncertainty
Instrumentation linearity ± 0.8 %
Timebase
Timebase range
Accuracy ±10 ppm
Jitter
Trigger
Internal trigger
Range
Resolution
Level accuracy
1
Latency
Jitter
External TTL trigger input
High
Low
2
Latency
Minimum trigger pulse width
Minimum trigger repetition period
Maximum trigger voltage input
Impedance
Jitter
External TTL trigger output Low to high transition on trigger event
High
Low
3
Latency
Impedance
Jitter
Trigger delay
Delay range
Delay resolution
Trigger hold-off
Range
Resolution
Trigger level threshold hysteresis
Range
Resolution
1. Internal trigger latency is defined as the delay between the applied RF crossing the trigger level and the meter switching into the triggered state.
2. External trigger latency is defined as the delay between the applied trigger crossing the trigger level and the meter switching into the triggered state.
3. External trigger output latency is defined as the delay between the meter entering the triggered state and the output signal switching.
2 ns to 100 msec/div
≤ 1 ns
–20 to +20 dBm
0.1 dB
± 0.5 dB
160 ns ± 10 ns
≤ 5 ns rms
> 2.4 V
< 0.7 V
90 ns ± 10 ns
15 ns
50 ns
15 V emf from 50 Ω dc (current < 100 mA), or
60 V emf from 50 Ω (pulse width < 1 s, current < 100 mA)
50 Ω
≤ 5 ns rms
> 2.4 V
< 0.7 V
30 ns ± 10 ns
50 Ω
≤ 5 ns rms
± 1.0 s, maximum
1 % of delay setting, 10 ns maximum
1 μs to 400 ms
1 % of selected value (to a minimum of 10 ns)
± 3 dB
0.05 dB
4
Page 5

P-Series Wideband Power Sensor Specifications
The P-Series wideband power sensors are designed for use with the P-Series power meters only.
Sensor
model
N1921A 50 MHz to
N1922A 50 MHz to
Frequency
range Dynamic range Damage level
+23 dBm (average power);
+30 dBm (< 1 μs duration) (peak power)
+23 dBm (average power);
+30 dBm (< 1 μs duration) (peak power)
18 GHz
40 GHz
–35 dBm to +20 dBm (≥ 500 MHz)
–30 dBm to +20 dBm (50 MHz to 500 MHz)
–35 dBm to +20 dBm (≥ 500 MHz)
–30 dBm to +20 dBm (50 MHz to 500 MHz)
Maximum SWR
Frequency band N1921A N1922A
50 MHz to 10 GHz 1.2 1.2
10 GHz to 18 GHz 1.26 1.26
18 GHz to 26.5 GHz 1.3
26.5 GHz to 40 GHz 1.5
Sensor Calibration Uncertainty
Definition: Uncertainty resulting from non-linearity in the sensor detection and
correction process. This can be considered as a combination of traditional linearity, cal factor and temperature specifications and the uncertainty associated
with the internal calibration process.
1
Connector
type
Type N (m)
2.4 mm (m)
Frequency band N1921A N1922A
50 MHz to 500 MHz 4.5 % 4.3 %
500 MHz to 1 GHz 4.0 % 4.2 %
1 GHz to 10 GHz 4.0 % 4.4 %
10 GHz to 18 GHz 5.0 % 4.7 %
18 GHz to 26.5 GHz 5.9 %
26.5 GHz to 40 GHz 6.0 %
Physical characteristics
Dimensions N1921A
N1922A
Weights with cable Option 105
Option 106
Option 107
Fixed sensor cable lengths Option 105
Option 106
Option 107
1. Beyond 70 % humidity, an additional 0.6 % should be added to these values.
135 mm x 40 mm x 27 mm
(5.3 in x 1.6 in x 1.1 in)
127 mm x 40 mm x 27 mm
(5.0 in x 1.6 in x 1.1 in)
0.4 kg (0.88 Ib)
0.6 kg (1.32 Ib)
1.4 kg (3.01 Ib)
1.5 m (5 feet)
3.0 m (10 feet)
10 m (31 feet)
5
Page 6

1 mW Power Reference
Note: The 1 mW power reference is provided for calibration of E-Series, 8480 Series and N8480 Series sensors. The P-Series sensors are
automatically calibrated and therefore do not need this reference for calibration
Power output 1.00 mW (0.0 dBm). Factory set to ± 0.4 % traceable to the National Physical Laboratory
(NPL) UK
Accuracy (over 2 years) ±1.2 % (0 to 55 ºC)
±0.4 % (25 ± 10 ºC)
Frequency
SWR 1.08 (0 to 55 ºC)
Connector type Type N (f), 50 Ω
Rear-panel inputs/outputs
Recorder output Analog 0-1 Volt, 1 kΩ output impedance, BNC connector. For dual-channel instruments
GPIB, 10/100BaseT LAN and USB2.0 Interfaces allow communication with an external controller
Ground Binding post, accepts 4 mm plug or bare-wire connection
Trigger input Input has TTL compatible logic levels and uses a BNC connector
Trigger output Output provides TTL compatible logic levels and uses a BNC connector
Line power
Input voltage range
Input frequency range
Power requirement
50 MHz nominal
1.05 typical
there will be two recorder outputs.
90 to 264 Vac, automatic selection
47 to 63 Hz and 440 Hz
N1911A not exceeding 50 VA (30 Watts)
N1912A not exceeding 75 VA (50 Watts)
Remote programming
Interface GPIB interface operates to IEEE 488.2 and IEC65
10/100BaseT LAN interface
USB 2.0 interface
Command language SCPI standard interface commands
GPIB compatibility SH1, AH1, T6, TE0, L4, LE0, SR1, RL1, PP1, DC1, DT1, C0
Measurement speed
Measurement speed via remote
interface
≥ 1500 readings per second
Regulatory information
Electromagnetic compatibility Complies with the requirements of the EMC Directive 89/336/EEC
Product safety Conforms to the following product specifications:
EN61010-1: 2001/IEC 1010-1:2001/CSA C22.2 No. 1010-1:1993
IEC 60825-1:1993/A2:2001/IEC 60825-1:1993+A1:1997+A2:2001
Low Voltage Directive 72/23/EEC
6
Page 7

1 mW Power Reference (continued)
Physical characteristics
Dimensions The following dimensions exclude front and rear panel protrusions:
88.5 mm H x 212.6 mm W x 348.3 mm D (3.5 in x 8.5 in x 13.7 in)
Net weight
Shipping weight
Display 3.8 inch TFT Color LCD
Environmental conditions
General Complies with the requirements of the EMC Directive 89/336/EEC
Operating
Temperature
Maximum humidity
Minimum humidity
Maximum altitude
Storage
Non-operating storage temperature
Non-operating maximum humidity
Non-operating maximum altitude
N1911A ≤ 3.5 kg (7.7 lb) approximate
N1912A ≤ 3.7 kg (8.1 lb) approximate
N1911A ≤ 7.9 kg (17.4 lb) approximate
N1912A ≤ 8.0 kg (17.6 lb) approximate
0 °C to 55 °C
95 % at 40 °C (non-condensing)
15 % at 40 °C (non-condensing)
3,000 meters (9,840 feet)
–40 °C to +70 °C
90 % at 65 °C (non-condensing)
15,420 meters (50,000 feet)
System specifications and characteristics
The video bandwidth in the meter can be set to High, Medium, Low and Off. The video bandwidths stated in the table
below are not the 3 dB bandwidths, as the video bandwidths are corrected for optimal flatness (except the Off filter). Refer
to Figure 2 for information on the flatness response. The Off video bandwidth setting provides the warranted rise time and
fall time specification and is the recommended setting for minimizing overshoot on pulse signals.
Dynamic response - rise time, fall time, and overshoot versus video bandwidth settings
Video bandwidth setting
Parameter
Low: 5 MHz Medium: 15 MHz High: 30 MHz
Rise time/fall time
Overshoot
For Option 107 (10 m cable), add 5 ns to the rise time and fall time specifications.
1. Specified as 10 % to 90 % for rise time and 90 % to 10 % for fall time on a 0 dBm pulse.
2. Specified as the overshoot relative to the settled pulse top power.
1
2
< 56 ns < 25 ns ≤ 13 ns < 36 ns ≤ 13 ns
< 500 MHz > 500 MHz
< 5 % < 5 %
Off
Recorder output and video output
The recorder output is used to output the corresponding voltage for the measurement a user sets on the Upper/Lower
window of the power meter.
The video output is the direct signal output detected by the sensor diode, with no correction applied. The video output
provides a DC voltage proportional to the measured input power through a BNC connector on the rear panel. The DC voltage can be displayed on an oscilloscope for time measurement. This option replaces the recorder output on the rear panel.
The video output impedance is 50 ohm.
7
Page 8

Characteristic Peak Flatness
The peak flatness is the flatness of a peak-to-average ratio measurement for various tone separations for an equal magnitude two-tone RF input. Figure 2 refers to the relative error in peak-to-average ratio measurements as the tone separation
is varied. The measurements were performed at –10dBm with power sensors with 1.5m cable lengths.
0.5
0.0
-0.5
-1.0
-1.5
Error (dB)
-2.0
-2.5
-3.0
-3.5
0 5 10 15 20 25 30
Figure 2. N192XA Error in peak-to-average measurements for a two-tone input (High, Medium, Low and Off filters)
Low
Off
(< 500 MHz)
Input tone separation frequency (MHz)
Medium
High
Off
(> 500 MHz)
Noise and drift
Noise per
Sensor model Zeroing Zero set Zero drift
< 500 MHz > 500 MHz
N1921A /N1922A No RF on input 200 nW
RF present
550 nW
200 nW
100 nW 2 μW 50 nW
1
sample
Measurement noise
(Free run)
2
Measurement average setting 12481632641282565121024
Free run noise multiplier
1 0.9 0.8 0.7 0.6 0.5 0.45 0.4 0.3 0.25 0.2
Video BW setting Low 5 MHz Medium 15 MHz High 30 MHz Off
Noise per sample multiplier < 500 MHz
≥ 500 MHz
1. Within 1 hour after a zero, at a constant temperature, after 24 hours warm-up of the power meter. This component can be disregarded with
Auto-zero mode set to ON.
2. Measured over a one-minute interval, at a constant temperature, two standard deviations, with averaging set to 1.
0.5
0.45
1
0.75
2
1.1
1
1
Effect of video bandwidth setting
The noise per sample is reduced by applying the meter video bandwidth filter setting (High, Medium or Low). If averaging
is implemented, this will dominate any effect of changing the video bandwidth.
Effect of time-gating on measurement noise
The measurement noise on a time-gated measurement will depend on the time gate length. 100 averages are carried out every 1 μs of gate length. The Noise-per-Sample contribution in this mode can approximately be reduced by
√(gate length/10 ns) to a limit of 50 nW.
8
Page 9

Appendix A
Uncertainty calculations for a power measurement (settled, average power)
[Specification values from this document are in bold italic, values calculated on this page are underlined.]
Process:
1. Power level: . . . . . . . . . . . . . . . . . . . . . . . . . . . . . . . . . . . . . . . . . . . . . . . . . . . . . . . . . . . . . . . . . . . . . . . . . . . . . . . . W
2. Frequency: . . . . . . . . . . . . . . . . . . . . . . . . . . . . . . . . . . . . . . . . . . . . . . . . . . . . . . . . . . . . . . . . . . . . . . . . . . . . . . . . .
3. Calculate meter uncertainty:
Calculate noise contribution
• If in Free Run mode, Noise = Measurement noise x free run multiplier
• If in Trigger mode, Noise = Noise-per-sample x noise per sample multiplier
Convert noise contribution to a relative term1 = Noise/Power . . . . . . . . . . . . . . . . . . . . . . . . . . . . . . . . . . . . . . . %
Instrumentation linearity . . . . . . . . . . . . . . . . . . . . . . . . . . . . . . . . . . . . . . . . . . . . . . . . . . . . . . . . . . . . . . . . . . %
Drift . . . . . . . . . . . . . . . . . . . . . . . . . . . . . . . . . . . . . . . . . . . . . . . . . . . . . . . . . . . . . . . . . . . . . . . . . . . . . . . . . . . . %
RSS of above three terms ≥ Meter uncertainty = . . . . . . . . . . . . . . . . . . . . . . . . . . . . . . . . . . . . . . . . . . . . %
4. Zero uncertainty
(Mode and frequency-dependent) = Zero set/Power = . . . . . . . . . . . . . . . . . . . . . . . . . . . . . . . . . . . . . . . . . . %
5. Sensor calibration uncertainty
(Sensor, frequency, power and temperature-dependent) = . . . . . . . . . . . . . . . . . . . . . . . . . . . . . . . . . . . . . . . %
6. System contribution, coverage factor of 2 ≥ sys
(RSS three terms from steps 3, 4 and 5)
7. Standard uncertainty of mismatch
Max SWR (frequency-dependent) = . . . . . . . . . . . . . . . . . . . . . . . . . . . . . . . . . . . . . . . . . . . . . . . . . . . . . . . . . . . .
convert to reflection coefficient, | ρ
Max DUT SWR (frequency-dependent) = . . . . . . . . . . . . . . . . . . . . . . . . . . . . . . . . . . . . . . . . . . . . . . . . . . . . . . . .
convert to reflection coefficient, | ρ
8. Combined measurement uncertainty @ k=1
U
√2 2
Expanded uncertainty, k = 2, = U
C
=
Max(ρ
(
) • Max(ρ
DUT
Sensor
| = (SWR–1)/(SWR+1) = . . . . . . . . . . . . . . . . . . . . . . . . . . . . . . . . . .
Sensor
| = (SWR–1)/(SWR+1) = . . . . . . . . . . . . . . . . . . . . . . . . . . . . . . . . . . . .
DUT
2
)
sys
+
)
(
• 2 = . . . . . . . . . . . . . . . . . . . . . . . . . . . . . . . . . . . . . . . . . . . . . . . . . . . . . . . . . %
C
= . . . . . . . . . . . . . . . . . . . . . . . . . . . . . . . . . . . . . . . . . . . . . . . %
rss
2
rss
. . . . . . . . . . . . . . . . . . . . . . . . . . . . . . . . . . . . . . . . . . . . . . . . . . .
)
%
1. The noise-to-power ratio is capped for powers > 100 μW, in these cases use: Noise/100 μW.
9
Page 10

Worked Example
Uncertainty calculations for a power measurement (settled, average power)
[Specification values from this document are in bold italic, values calculated on this page are underlined.]
Process:
1. Power level: . . . . . . . . . . . . . . . . . . . . . . . . . . . . . . . . . . . . . . . . . . . . . . . . . . . . . . . . . . . . . . . . . . . . . . . . . . . . . . . .
2. Frequency: . . . . . . . . . . . . . . . . . . . . . . . . . . . . . . . . . . . . . . . . . . . . . . . . . . . . . . . . . . . . . . . . . . . . . . . . . . . . . . . . .
3. Calculate meter uncertainty: In free run, auto zero mode average = 16
Calculate noise contribution
• If in Free Run mode, Noise = Measurement noise x free run multiplier = 50 nW x 0.6 = 30 nW
• If in Trigger mode, Noise = Noise-per-sample x noise per sample multiplier
Convert noise contribution to a relative term1 = Noise/Power = 30 nW/100 μW . . . . . . . . . . . . . . . . . . . . . . . . 0.03 %
Instrumentation linearity . . . . . . . . . . . . . . . . . . . . . . . . . . . . . . . . . . . . . . . . . . . . . . . . . . . . . . . . . . . . . . . . . .
Drift . . . . . . . . . . . . . . . . . . . . . . . . . . . . . . . . . . . . . . . . . . . . . . . . . . . . . . . . . . . . . . . . . . . . . . . . . . . . . . . . . . . . –
RSS of above three terms ≥ Meter uncertainty = . . . . . . . . . . . . . . . . . . . . . . . . . . . . . . . . . . . . . . . . . . . .
4. Zero uncertainty
(Mode and frequency-dependent) = Zero set/Power = 300 nW/1 mW . . . . . . . . . . . . . . . . . . . . . . . . . . . . . . 0.03 %
5. Sensor calibration uncertainty
(Sensor, frequency, power and temperature-dependent) = . . . . . . . . . . . . . . . . . . . . . . . . . . . . . . . . . . . . . . .
6. System contribution, coverage factor of 2 ≥ sys
(RSS three terms from steps 3, 4 and 5)
7. Standard uncertainty of mismatch
= . . . . . . . . . . . . . . . . . . . . . . . . . . . . . . . . . . . . . . . . . . . . . . .
rss
1 mW
1 GHz
0.8 %
0.8 %
4.0 %
4.08 %
Max SWR (frequency-dependent) = . . . . . . . . . . . . . . . . . . . . . . . . . . . . . . . . . . . . . . . . . . . . . . . . . . . . . . . . . . . .
convert to reflection coefficient, | ρ
Max DUT SWR (frequency-dependent) = . . . . . . . . . . . . . . . . . . . . . . . . . . . . . . . . . . . . . . . . . . . . . . . . . . . . . . . .
convert to reflection coefficient, | ρ
8. Combined measurement uncertainty @ k=1
UC =
√2 2
Expanded uncertainty, k = 2, = U
1. The noise-to-power ratio is capped for powers > 100 μW, in these cases use: Noise/100 μW.
Max(ρ
(
) • Max(ρ
DUT
Sensor
| = (SWR–1)/(SWR+1) = . . . . . . . . . . . . . . . . . . . . . . . . . . . . . . . . . . 0.111
Sensor
| = (SWR–1)/(SWR+1) = . . . . . . . . . . . . . . . . . . . . . . . . . . . . . . . . . . . . 0.115
DUT
2
)
+
)
• 2 = . . . . . . . . . . . . . . . . . . . . . . . . . . . . . . . . . . . . . . . . . . . . . . . . . . . . . . . . .
C
2
sys
rss
. . . . . . . . . . . . . . . . . . . . . . . . . . . . . . . . . . . . . . . . . . . . . . . . . . .
(
)
10
1.25
1.26
2.23 %
±4.46 %
Page 11

Graphical Example
A. System contribution to measurement uncertainty versus power level (equates to step 6 result/2)
System uncertainty contribution - 1 sigma (%)
100.0%
N1921A: 500 MHz to 10 GHz
10.0%
1.0%
-35 -30 -25 -20 -15 -10 -5 0 5 10 15 20
Power (dBm)
Note: The above graph is valid for conditions of free-run operation, with a signal within the video bandwidth setting on the system.
Humidity < 70 %.
N1922A:18 to 40 GHz
Other bands
B. Standard uncertainty of mismatch
Standard uncertainty of mismatch - 1 sigma (%)
0.5
0.45
0.4
0.35
0.3
Sensor
0.25
ρ
0.2
0.15
0.1
0.05
0
0 0.1 0.2 0.3 0.4 0.5
ρ
DUT
Note: The above graph shows the standard uncertainty of mismatch = ρDUT. ρSensor / ←2, rather than the mismatch uncertainty
limits. This term assumes that both the source and load have uniform magnitude and uniform phase probability distributions.
SWR
ρ
SWR
ρ
1.0 0.00 1.8 0.29
1.05 0.02 1.90 0.31
1.10 0.05 2.00 0.33
1.15 0.07 2.10 0.35
1.20 0.09 2.20 0.38
1.25 0.11 2.30 0.39
1.30 0.13 2.40 0.41
1.35 0.15 2.50 0.43
1.40 0.17 2.60 0.44
1.45 0.18 2.70 0.46
1.5 0.20 2.80 0.47
1.6 0.23 2.90 0.49
1.7 0.26 3.00 0.50
C. Combine A & B
U
= √ (Value from Graph A)2 + (Value from Graph B)
C
Expanded uncertainty, k = 2, = UC • 2 = . . . . . . . . . . . . . . . . . . . . . . . . . . . . . . . . . . . . . . . . . . . . . . . . . . . . . . . . . . .
2
11
± %
Page 12

Ordering Information
Model Description
N1911A P-Series single-channel
peak power meter
N1912A P-Series dual-channel
peak power meter
Standard-shipped accessories
Power cord
USB cable Type A to Mini-B, 6 ft
Product CD-ROM (contains English
and localized User’s Guide and
Programming Guide)
Agilent IO Libraries Suite CD-ROM
Calibration certificate
Warranty
Standard 1-year, return-to-Agilent
warranty and service plan for the
N1911A/12A
3 months for standard-shipped
accessories
Options Description
Meter
N191xA-003 P-Series single/dual-channel with rear panel sensors and power ref
connectors
N191xA-H01 P-Series single/dual-channel with video output
Sensors
N192xA-105 P-Series sensors fixed 1.5 m (5 ft) cable length
N192xA-106 P-Series sensors fixed 3.0 m (10 ft) cable length
N192xA-107 P-Series sensors fixed 10 m (31 ft) cable length
Cables
N1917A P-Series meter cable adaptor, 1.5 m (5 ft)
N1917B P-Series meter cable adaptor, 3 m (10 ft)
N1917C P-Series meter cable adaptor, 10 m (31 ft)
N191xA-200 11730x cable adaptor
Other accessories
34131A Transit case for half-rack 2U-high instruments (e.g., 34401A)
34161A Accessory pouch
N191xA-908 Rack mount kit (one instrument)
N191xA-909 Rack mount kit (two instruments)
Warranty and calibration
N191xA-1A7 ISO17025 calibration data including Z540 compliance
N191xA-A6J ANSI Z540 compliant calibration test data
R-51B-001-3C Return to Agilent Warranty up front - 3 years plan
R-51B-001-5C Return to Agilent Warranty up front - 5 years plan
R-50C-011-3 Agilent Calibration up front - 3 years plan
R-50C-011-5 Agilent Calibration up front - 5 years plan
R-50C-016-3 ISO 17025 Compliant Calibration up front - 3 years plan
R-50C-016-5 ISO 17025 Compliant Calibration up front - 5 years plan
R-50C-021-3 ANSI Z540-1-1994 Calibration up front - 3 years plan
R-50C-021-5 ANSI Z540-1-1994 Calibration up front - 5 years plan
Documentation
N191xA-0BF Hard copy English language Programming Guide
N191xA-0BK Hard copy English language User’s Guide and Programming Guide
N191xA-0BW Hard copy English language Service Guide
N191xA-ABF Hard copy French localization User’s Guide and Programming Guide
N191xA-ABJ Hard copy Japanese localization User’s Guide and Programming
Guide
N192xA-0B1 Hard copy P-Series sensor English language manual
12
Page 13

www.agilent.com
s
www.agilent.com/find/powermeter
myAgilent
myAgilent
www.agilent.com/find/myagilent
A personalized view into the information most
relevant to you.
www.axiestandard.org
AdvancedTCA
Instrumentation and Test (AXIe) is an
open standard that extends the
AdvancedTCA for general purpose and
semiconductor test. Agilent is a founding
member of the AXIe consortium.
www.lxistandard.org
LAN eXtensions for Instruments puts the
power of Ethernet and the Web inside
your test systems. Agilent is a founding
member of the LXI consortium.
www.pxisa.org
PCI eXtensions for Instrumentation
(PXI) modular instrumentation delivers
a rugged, PC-based high-performance
measurement and automation system.
®
Extensions for
Agilent Channel Partners
www.agilent.com/find/channelpartners
Get the best of both worlds: Agilent’s
measurement expertise and product
breadth, combined with channel partner
convenience.
Three-Year Warranty
www.agilent.com/find/ThreeYearWarranty
Agilent’s combination of product reliability
and three-year warranty coverage is another
way we help you achieve your business goals:
increased confidence in uptime, reduced cost
of ownership and greater convenience.
Agilent Advantage Services
www.agilent.com/find/AdvantageServices
Accurate measurements throughout the
life of your instruments.
Agilent Electronic Measurement Group
DEKRA Certified
ISO 9001:2008
Quality Management SystemQuality Management Sy
www.agilent.com/quality
For more information on Agilent
Technologies’ products, applications or
services, please contact your local Agilent
office. The complete list is available at:
www.agilent.com/find/contactus
Americas
Canada (877) 894 4414
Brazil (11) 4197 3600
Mexico 01800 5064 800
United States (800) 829 4444
Asia Pacifi c
Australia 1 800 629 485
China 800 810 0189
Hong Kong 800 938 693
India 1 800 112 929
Japan 0120 (421) 345
Korea 080 769 0800
Malaysia 1 800 888 848
Singapore 1 800 375 8100
Taiwan 0800 047 866
Other AP Countries (65) 375 8100
Europe & Middle East
Belgium 32 (0) 2 404 93 40
Denmark 45 45 80 12 15
Finland 358 (0) 10 855 2100
France 0825 010 700*
*0.125 €/minute
Germany 49 (0) 7031 464 6333
Ireland 1890 924 204
Israel 972-3-9288-504/544
Italy 39 02 92 60 8484
Netherlands 31 (0) 20 547 2111
Spain 34 (91) 631 3300
Sweden 0200-88 22 55
United Kingdom 44 (0) 118 927 6201
For other unlisted countries:
www.agilent.com/find/contactus
(BP-3-1-13)
Product specifications and descriptions
in this document subject to change
without notice.
© Agilent Technologies, Inc. 2013
Published in USA, June 27, 2013
5989-2471EN
 Loading...