

Page 1
Agilent
E5071C ENA Network Analyzer
• 9 kHz to 4.5/6.5/8.5 GHz
• 100 kHz to 4.5/6.5/8.5 GHz (with bias tees)
• 300 kHz to 14/20 GHz (with bias tees)
E5092A Configurable Multiport Test Set
Data Sheet
Page 2

Table of Contents
Options ........................................................................................................................ 3
Definitions ................................................................................................................. 4
Boundary Conditions ............................................................................................. 4
Corrected System Performance ........................................................................ 5
System dynamic range ..................................................................................................... 5
Corrected system performance with calibration kit ....................................................
Uncorrected System Performance ................................................................13
Test Port Output (Source) ................................................................................. 14
Test port output frequency ............................................................................................14
Test port output power ..................................................................................................15
Test port output signal purity ........................................................................................17
Test Port Input ........................................................................................................ 18
Test port input levels ......................................................................................................18
Test port input (trace noise) .......................................................................................... 20
Test port input (stability) ...............................................................................................22
Test port input (dynamic accuracy) ..............................................................................23
Test port input (group delay) .........................................................................................25
General Information .............................................................................................27
System bandwidths .........................................................................................................27
Front panel information ..................................................................................................27
Rear panel information ...................................................................................................28
LXI compliance .................................................................................................................30
EMC, safety and environment ....................................................................................... 31
Analyzer environmental specifications and dimensions ..........................................32
7
Measurement Throughput Summary ............................................................ 36
Typical cycle time for measurement completion (ms).............................................. 36
Cycle time (ms) vs. number of points ..........................................................................48
Cycle time (ms) vs. IF bandwidth .................................................................................49
Data transfer time (ms) ..................................................................................................50
E5092A Configurable Multiport Test Set ..................................................... 51
Test set input/output performance ..............................................................................51
Option E5092A-020 port performance ......................................................................... 51
Control line .......................................................................................................................53
DC source ..........................................................................................................................53
Operating storage environment ....................................................................................53
Non-operating storage environment ............................................................................53
Front panel information ..................................................................................................54
Rear panel information ...................................................................................................54
Test set dimensions and block diagram ......................................................................54
Corrected System Performance for 75 Ω Measurements with
11852B 50 to 75 Ω Minimum-Loss Pads
................................................ 58
2
Page 3

Options
This document provides technical specifications for the E5071C ENA network
analyzer and the E5091A multiport test set.
E5071C-230 2-port test set, 9 kHz to 3 GHz without bias tees (Discontinued)
E5071C-235 2-port test set, 100 kHz to 3 GHz with bias tees (Discontinued)
E5071C-240 2-port test set, 9 kHz to 4.5 GHz without bias tees
E5071C-245 2-port test set, 100 kHz to 4.5 GHz with bias tees
E5071C-260 2-port test set, 9 kHz to 6.5 GHz without bias tees
E5071C-265 2-port test set, 100 kHz to 6.5 GHz with bias tees
E5071C-280 2-port test set, 9 kHz to 8.5 GHz without bias tees
E5071C-285 2-port test set, 100 kHz to 8.5 GHz with bias tees
E5071C-430 4-port test set, 9 kHz to 3 GHz without bias tees (Discontinued)
E5071C-435 4-port test set, 100 kHz to 3 GHz with bias tees (Discontinued)
E5071C-440 4-port test set, 9 kHz to 4.5 GHz without bias tees
E5071C-445 4-port test set, 100 kHz to 4.5 GHz with bias tees
E5071C-460 4-port test set, 9 kHz to 6.5 GHz without bias tees
E5071C-465 4-port test set, 100 kHz to 6.5 GHz with bias tees
E5071C-480 4-port test set, 9 kHz to 8.5 GHz without bias tees
E5071C-485 4-port test set, 100 kHz to 8.5 GHz with bias tees
E5071C-2D5 2-port test set, 300 kHz to 14 GHz with bias tees
E5071C-4D5 4-port test set, 300 kHz to 14 GHz with bias tees
E5071C-2K5 2-port test set, 300 kHz to 20 GHz with bias tees
E5071C-4K5 4-port test set, 300 kHz to 20 GHz with bias tees
E5092A Configurable multiport test set
Calibration kits and ECal modules
This E5071C data sheet also provides technical specifications for the
following calibration kits and ECal modules. For models not listed in
this data sheet, please download the free Uncertainty Calculator from
www.agilent.com/find/na_calculator to generate the curves for your
calibration kit.
85032F Calibration kit
85033E Calibration kit
85052D Calibration kit
85092C Electronic calibration (ECal) module
85093C Electronic calibration (ECal) module
N4691B Electronic calibration (ECal) module
3
Page 4

Definitions
Specification (spec.):
Warranted performance. All specifications apply at 23 ºC (±5 ºC), unless
otherwise stated, and 90 minutes after the instrument has been turned on.
Specifications include guard bands to account for the expected statistical
performance distribution, measurement uncertainties, and changes in
performance due to environmental conditions.
Supplemental information is intended to provide information that is helpful for
using the instrument but that is not guaranteed by the product warranty.
Typical (typ.):
Describes performance that will be met by a minimum of 80% of all products.
It is not guaranteed by the product warranty.
Supplemental performance data (SPD):
Supplemental performance data represents the value of a parameter that is
most likely to occur; the expected mean or average. It is not guaranteed by the
product warranty.
General characteristics:
A general, descriptive term that does not imply a level of performance.
Note: The specifications in this data sheet also apply to the E5071CEP ENA
network analyzer express configuration. For more information about the Express
ENA, visit www.agilent.com/find/express-e5071c
Boundary Conditions
In this data sheet, boundary conditions are given for the specifications. For
example, system dynamic range is 98 dB with the following boundary conditions.
Option: 485
Frequency: 10 MHz
IF bandwidth: 3 kHz
If the same boundary conditions fall under more than one category in a table,
apply the best value.
4
Page 5
Corrected System Performance
80
90
100
110
120
130
140
150
160
1.E+05 1.E+09 2.E+09 3.E+09 4.E+09 5.E+09 6.E+09 7.E+09 8.E+09
Test frequency [Hz]
System dynamic range [dB]
E5071C specification
The specifications in this section apply to measurements made with the
Agilent E5071C network analyzer under the following conditions:
• No averaging applied to data
• Environmental temperature of 23 °C (±5 °C) with less than 1 °C deviation
from the calibration temperature
• Response and isolation calibration performed
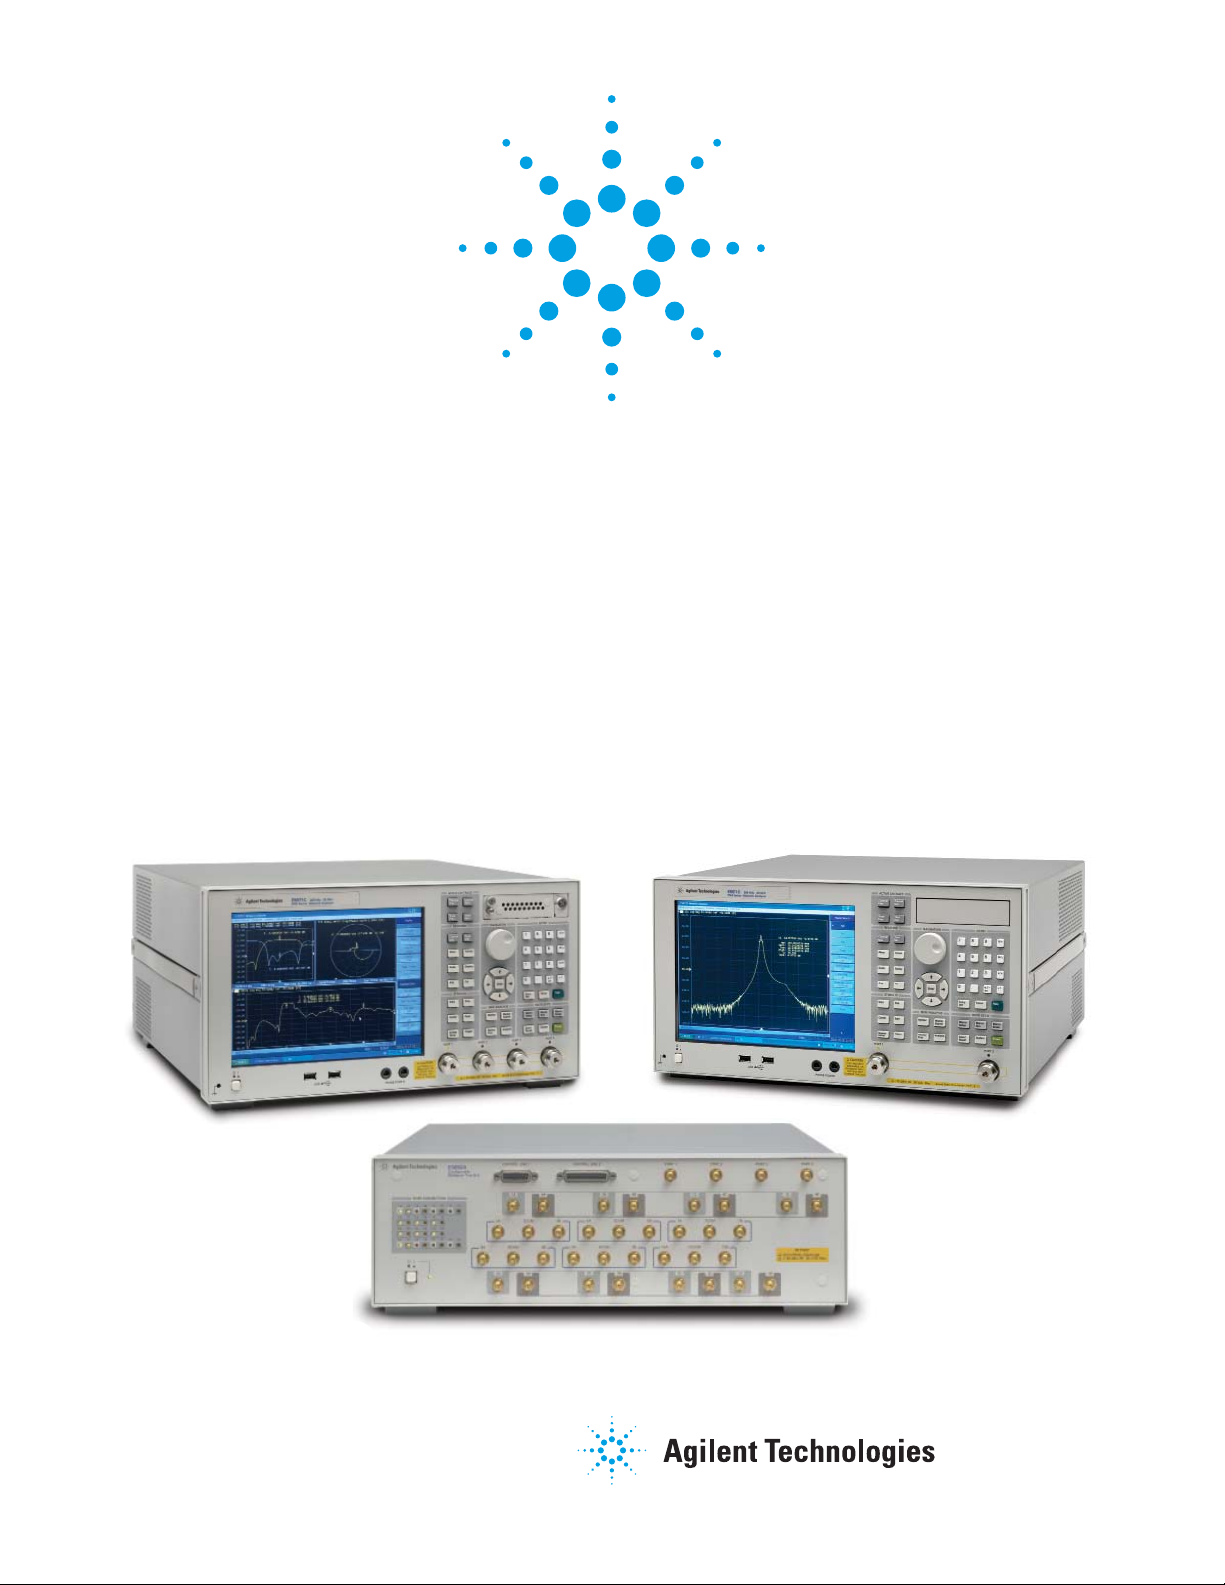
System dynamic range
Table 1. Option 230/235/240/245/260/265/280/285/430/435/440/445/
460/465/480/485
Description Specification SPD
System dynamic range
9 kHz to 300 kHz 72 dB
1, 2
300 kHz to 10 MHz
IF bandwidth = 3 kHz
82 dB
10 MHz to 6 GHz 98 dB
6 GHz to 8.5 GHz 92 dB
9 kHz to 300 kHz 97 dB 115 dB
300 kHz to 10 MHz 107 dB 115 dB
10 MHz to 6 GHz
IF bandwidth = 10 Hz
123 dB 130 dB
6 GHz to 7 GHz 117 dB 128 dB
7 GHz to 8 GHz 117 dB 126 dB
8 GHz to 8.5 GHz 117 dB 124 dB
Figure 1. System dynamic range (specification and actual measurement data example,
IF bandwidth 10 Hz)
1. The test port dynamic range is calculated as the difference between the test port rms noise fl oor
and the source maximum output power. The effective dynamic range must take measurement
uncertainty and interfering signals into account.
2. The specifi cation might not be met at 5 MHz or 50 MHz.
5
Page 6
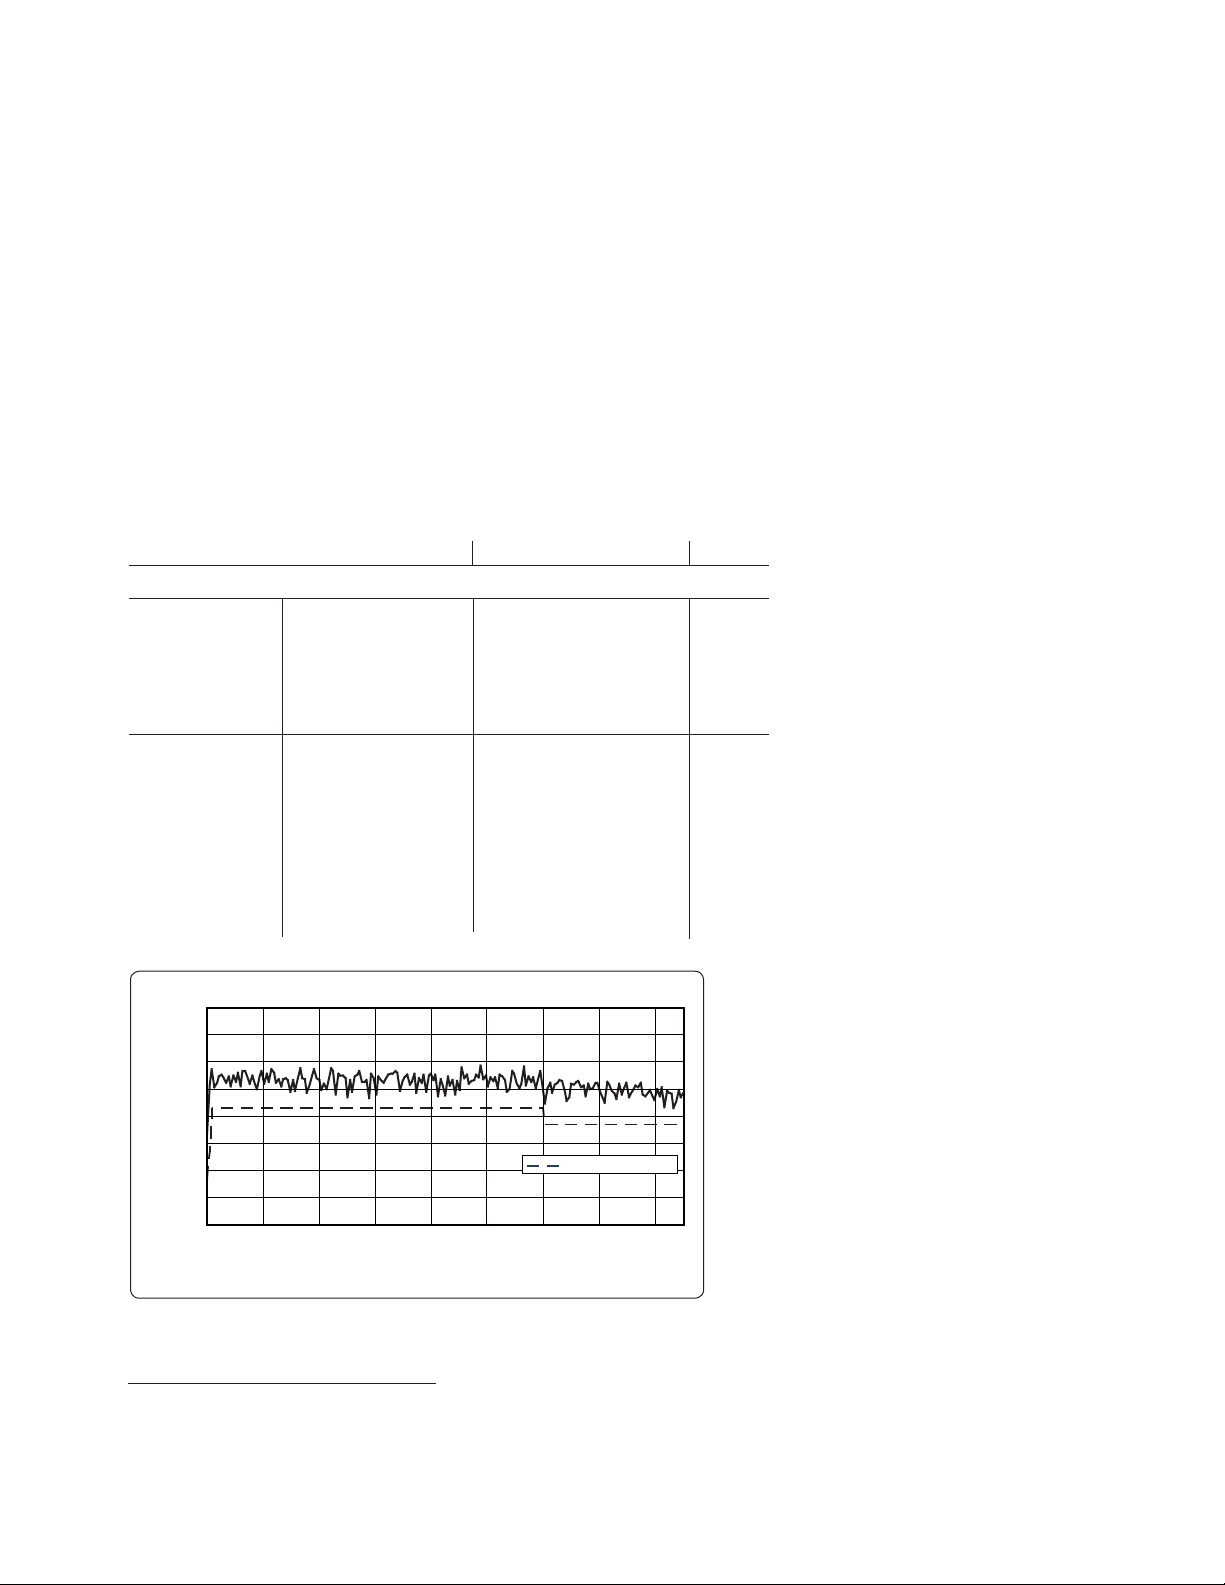
System dynamic range (continued)
Frequency [Hz]
System dynamic range[dB]
E5071C-2D5/2K5/4D5/4K5 specifica tion
0.0E+00 5.0E+09 1.0E+10 1.5E+10 2.0E+10
80
90
100
110
120
130
140
150
160
Table 2. Option 2D5/2K5/4D5/4K5
Description Specifi cation SPD
System dynamic range
300 kHz to 1 MHz
1 MHz to 10 MHz 82 dB
10 MHz to 100 MHz 95 dB
100 MHz to 6 GHz 98 dB
6 GHz to 8.5 GHz 92 dB
8.5 GHz to 10.5 GHz 80 dB
10.5 GHz to 15 GHz 75 dB
15 GHz to 20 GHz 71 dB
300 kHz to 1 MHz
1 MHz to 10 MHz 107 dB 115 dB
10 MHz to 100 MHz 120 dB 129 dB
100 MHz to 6 GHz 123 dB 130 dB
6 GHz to 8 GHz 117 dB 129 dB
8 GHz to 8.5 GHz 117 dB 127 dB
8.5 GHz to 10.5 GHz 105 dB 115 dB
10.5 GHz to 15 GHz 100 dB 111 dB
15 GHz to 20 GHz 96 dB 105 dB
1, 2
70 dB
IF bandwidth = 3 kHz
95 dB 105 dB
IF bandwidth = 10 Hz
Figure 2. System dynamic range (specification and actual measurement data example,
IF bandwidth 10 Hz)
1. The test port dynamic range is calculated as the difference between the test port’s rms noise
fl oor and the source’s maximum output power. Effective dynamic range must take measurement
uncertainty and interfering signals into account.
2. The specifi cation might not be met at 5 MHz or 50 MHz.
6
Page 7

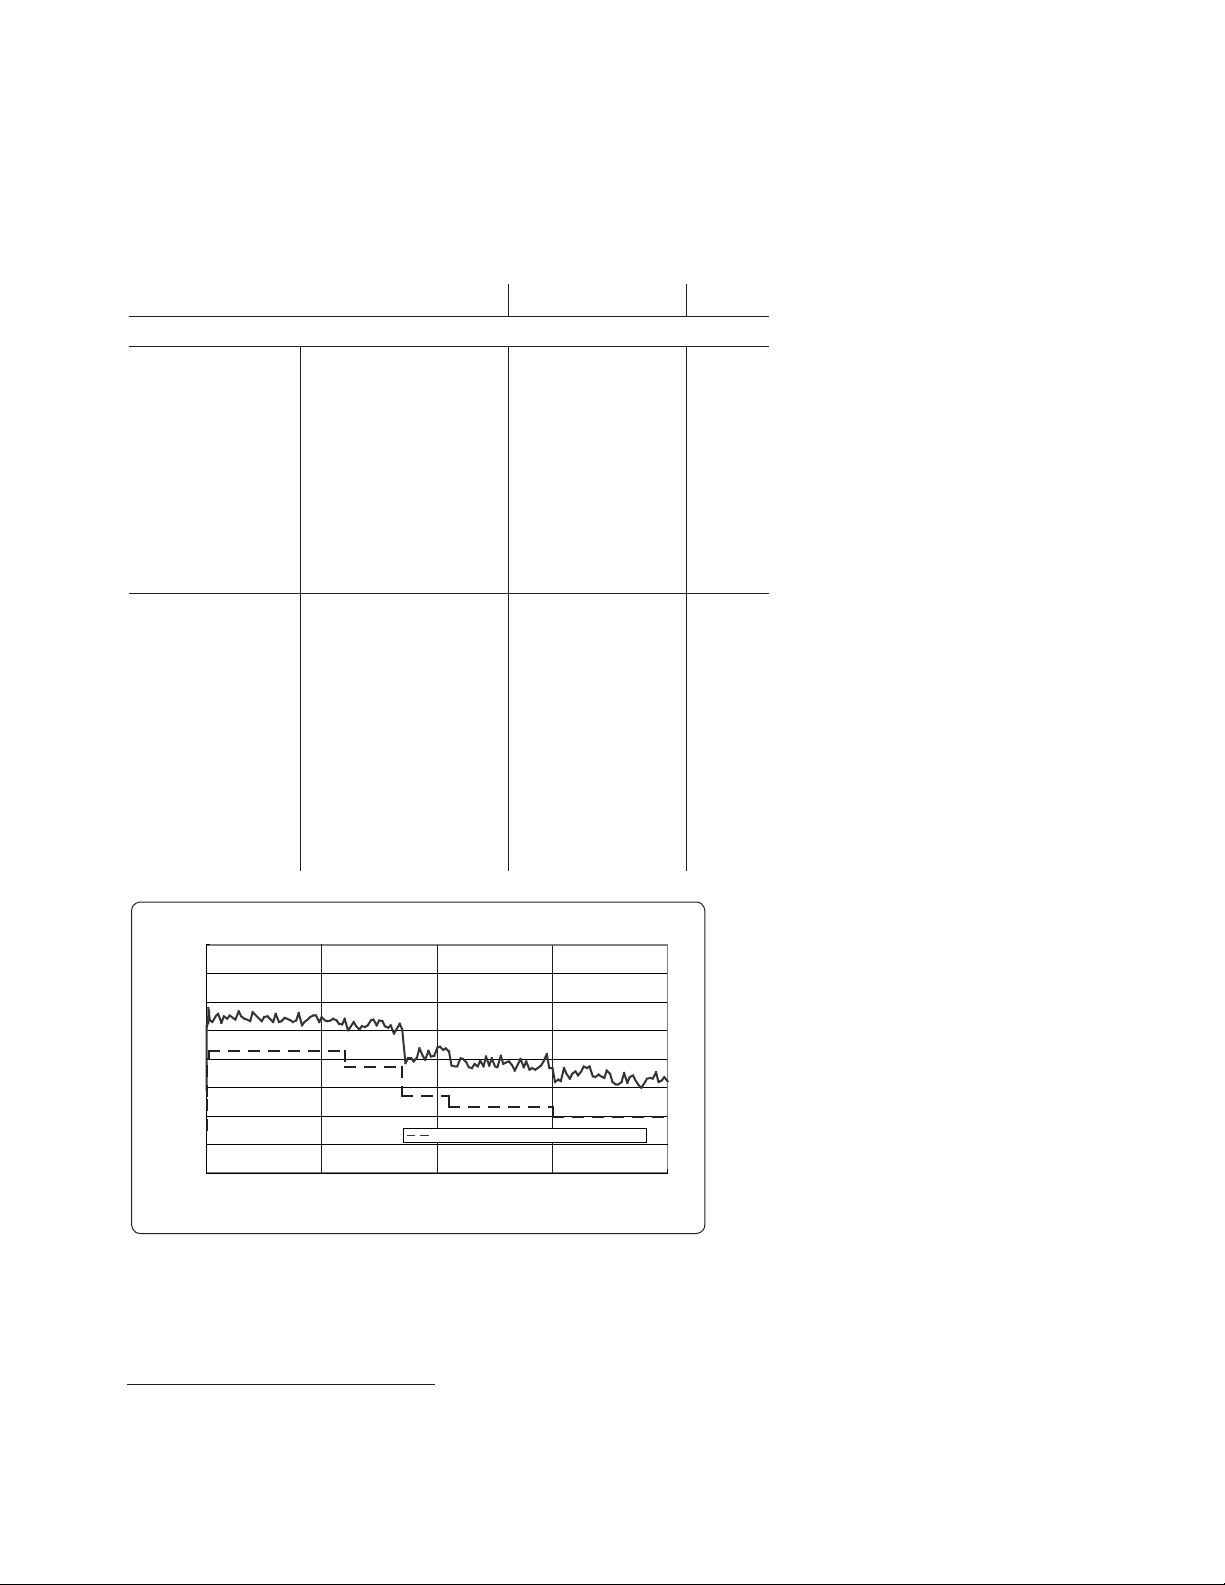
Corrected system performance with calibration kit
0.01
0.1
1
10
-90-80-70-60-50-40-30-20-
10010
S11 = S 22 = 0; Cal pow er = - 10 dBm; M eas po wer = -10 dBm
9 kHz to 3 00 kHz
300 KHz to 10 MHz
10 MHz to 3 GHz
3 GHz to 6 GHz
6 GHz to 8.5 G Hz
Magnitude
Transmission coefficient (dB)
Uncertainty (dB)
Transmission coefficient (dB)
0.1
1
10
100
-90-80-70-60-50-40-30-20-10010
S11 = S22 = 0; Cal power = -10 dBm; Meas power = -10 dBm
Phase
Uncertainty (Degrees)
9 kHz to 300 kHz
300 KHz to 10 MHz
10 MHz to 3 GHz
3 GHz to 6 GHz
6 GHz to 8.5 G Hz
Reflection coefficient (linear)
Uncertainty (linear)
Magnitude
0
0.01
0.02
0.03
0.04
0.05
0 0.2 0.4 0.6 0.8 1
9 KHz to 300 KHz, 300 KHz to 10 MHz
10 MHz to 3 GHz
3 GHz to 6 GHz
6 GHz to 8.5 GHz
S21 = S12 = 0; Cal power = -10 dBm; Meas power = -10 dBm
Reflection coefficient (linear)
Uncertainty (degrees)
Phase
0
2
4
6
8
10
0 0.2 0.4 0.6 0.8 1
S21 = S12 = 0; Cal power = -10 dBm; Meas power = -10 dBm
9 KHz to 300 KHz, 300 KHz to 10 MHz
10 MHz to 3 GHz
3 GHz to 6 GHz
6 GHz to 8.5 GHz
Option 230/235/240/245/260/265/280/285/430/435/440/445/460/465/480/485
Table 3. Corrected system performance with type-N device connectors,
85032F calibration kit
Network analyzer: E5071C
Calibration kit: 85032F (Type-N, 50 Ω)
Calibration: full 2-port
IF bandwidth = 10 Hz, no averaging applied to data, environmental temperature = 23 °C
(±5 °C ) with < 1 °C deviation from calibration temperature, isolation calibration performed
Specifi cation (dB)
Description
300 kHz
Directivity 49 49 46 40 38
Source match 41 41 40 36 35
Load match 49 49 46 40 37
Refl ection tracking ±0.011 ±0.011 ±0.021 ±0.032 ±0.054
Transmission tracking ±0.027 ±0.015 ±0.018 ±0.056 ±0.088
Transmission uncertainty (specification)
9 kHz to
300 kHz to
10 MHz
10 MHz to
3 GHz
3 GHz to
6 GHz
6 GHz to
8.5 GHz
Reflection uncertainty (specification)
7
Page 8
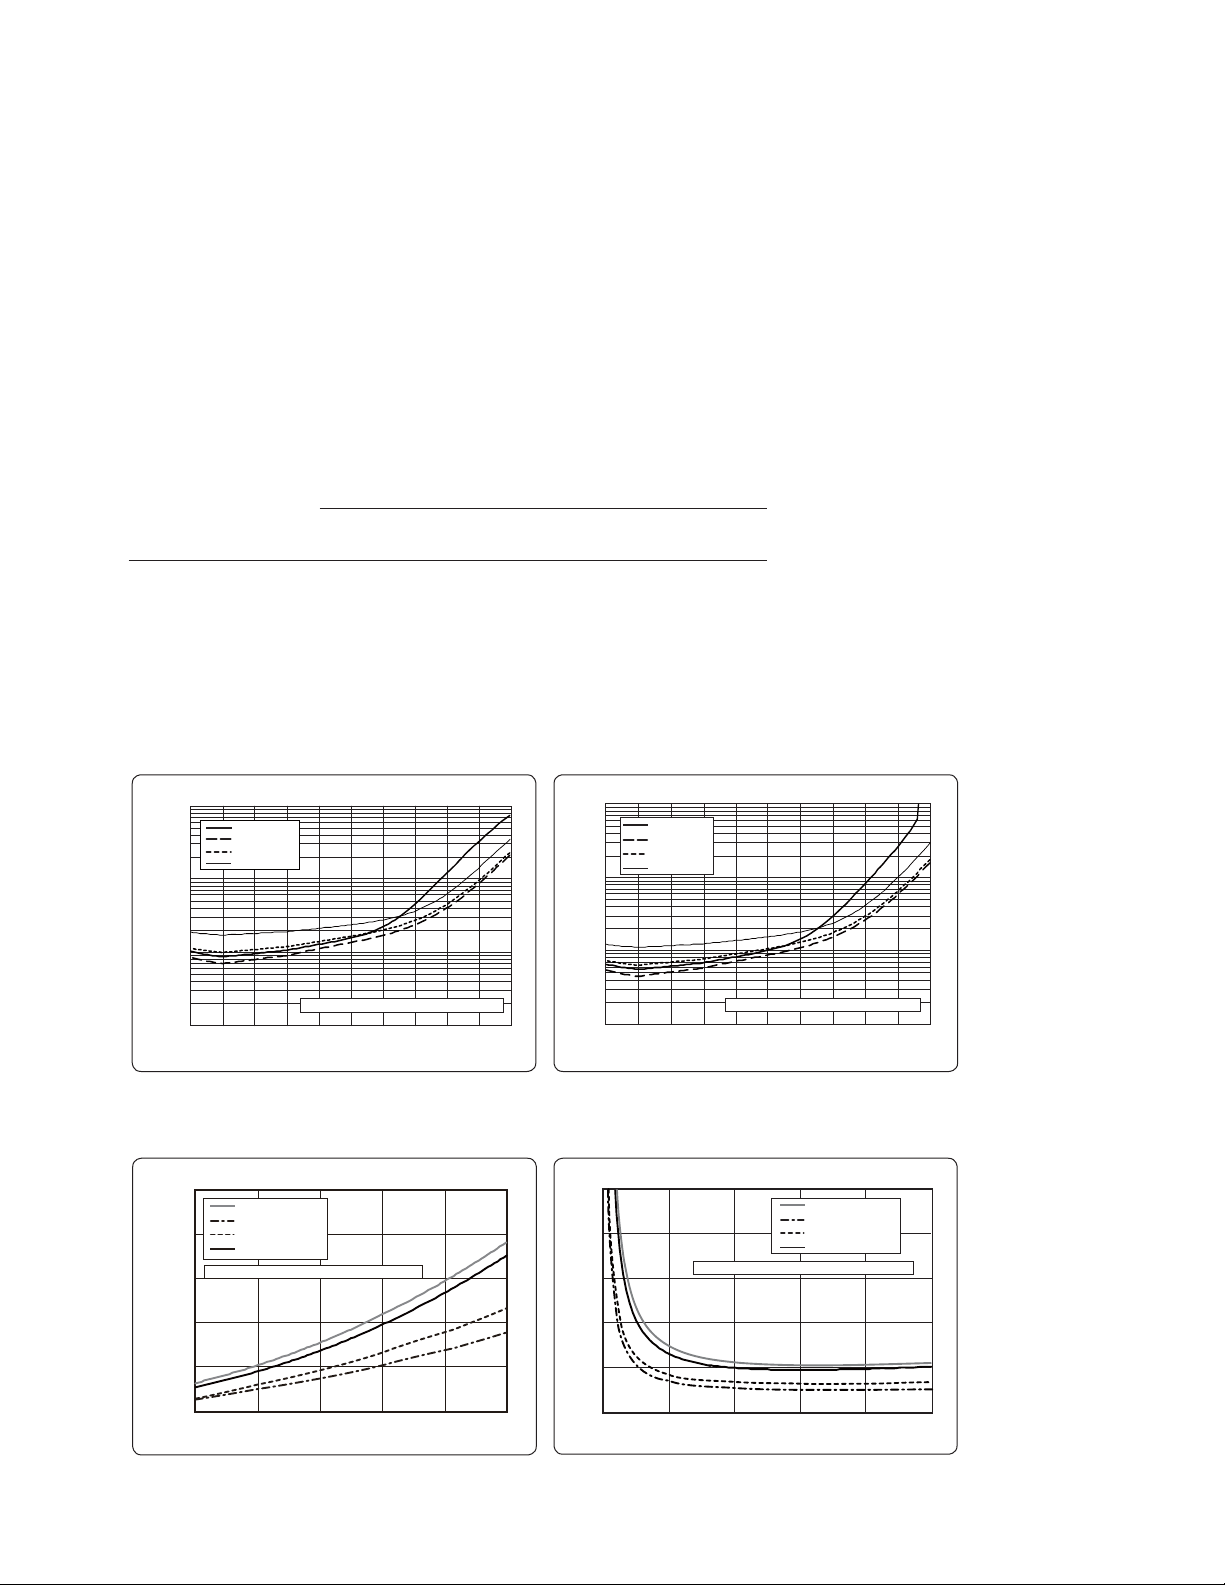
Table 4. Corrected system performance with type-N device connectors,
0.01
0.1
1
10
-9 0-80-7 0-60-5 0-40-3 0-20-1 0010
Uncertainty (dB)
Transmission Coefficient (dB)
Magnitude
300 KHz to 10 MHz
10 MHz to 3 GHz
3 GHz to 6 GHz
6 GHz to 8.5 GHz
S11 = S22 = 0; Cal power = -10 dBm; Meas power = -10dBm
0.1
1
10
100
-90-80-70-60-50-40-30-20-
10010
Uncertainty (Degrees)
Transmission coefficient (dB)
Phase
300 kHz to 10 MHz
10 MHz to 3 GHz
3 GHz to 6 GHz
6 GHz to 8.5 GHz
S11 = S 22 = 0 ; Cal power = -10 dBm; Meas power = -10dBm
0
0.01
0.02
0.03
0.04
0.05
0 0.2 0 .4 0.6 0 .8 1
Unc ertainty (lin ear)
Reflection coefficient (linear)
Magnitu de
300 kHz to 10 MHz
10 MHz to 3 GHz
3 GHz to 6 GHz
6 GHz to 8.5 GHz
S2 1 = S1 2 = 0; Cal power = -10 dBm; Meas power = -10 dBm
0
2
4
6
8
10
0 0.2 0.4 0.6 0.8 1
Reflection coefficient (linear)
Phase
300 kHz to 10 MHz
10 MHz to 3 GHz
3 GHz to 6 GHz
6 GHz to 8.5 GHz
Unc ertainty (lin ear)
S2 1 = S1 2 = 0; Cal power = -10 dBm; Meas power = -10 dBm
85092C electronic calibration (ECal) module
Network analyzer: E5071C
Calibration module: 85092C (Type-N, 50 Ω) Electronic calibration (ECal)
module
Calibration: full 2-port
IF bandwidth = 10 Hz, no averaging applied to data, environmental temperature = 23 °C
(±5 °C ) with < 1 °C deviation from calibration temperature , isolation calibration is not
performed
Specifi cation (dB)
Description
10 MHz
Directivity 45 54 52 47
Source match 36 44 41 36
Load match 41 47 44 39
Refl ection tracking ±0.100 ±0.040 ±0.060 ±0.070
Transmission tracking ±0.055 ±0.039 ±0.068 ±0.136
Transmission uncertainty (specification)
300 kHz to
10 MHz to
3 GHz
3 GHz to
6 GHz
6 GHz to
8.5 GHz
Reflection uncertainty (specification)
8
Page 9
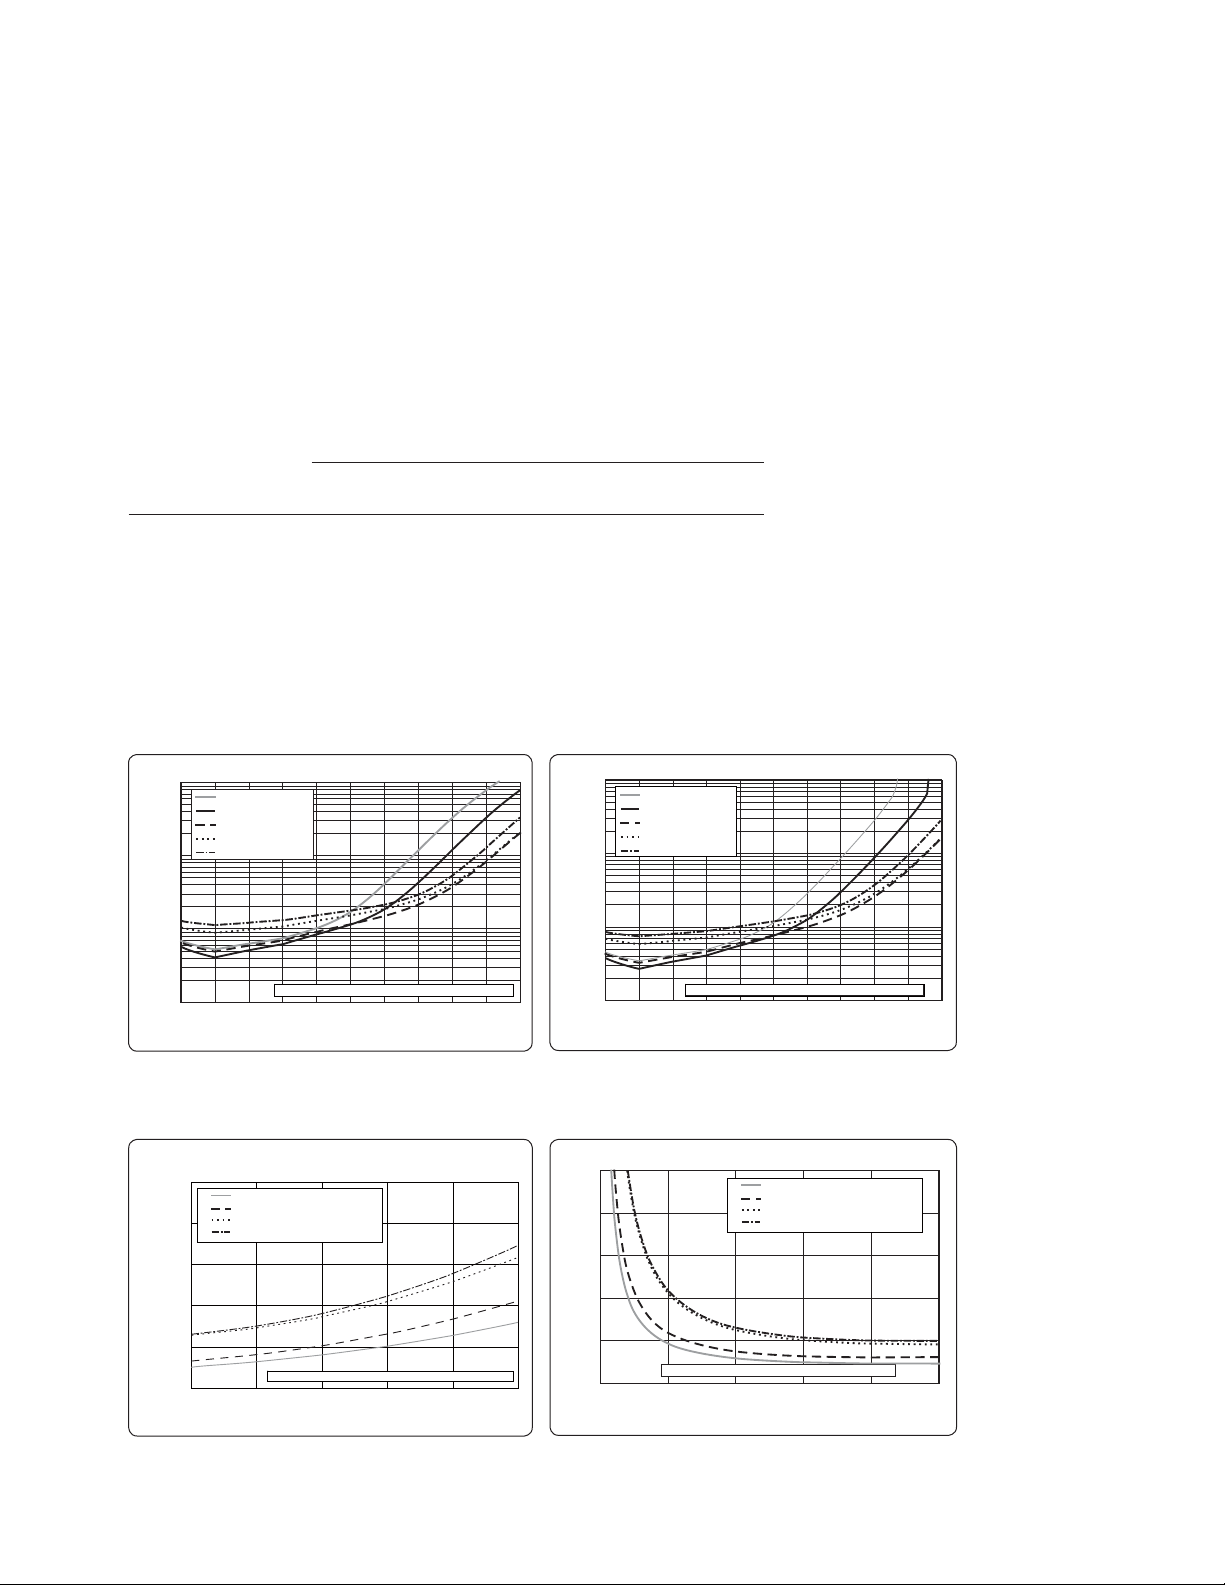
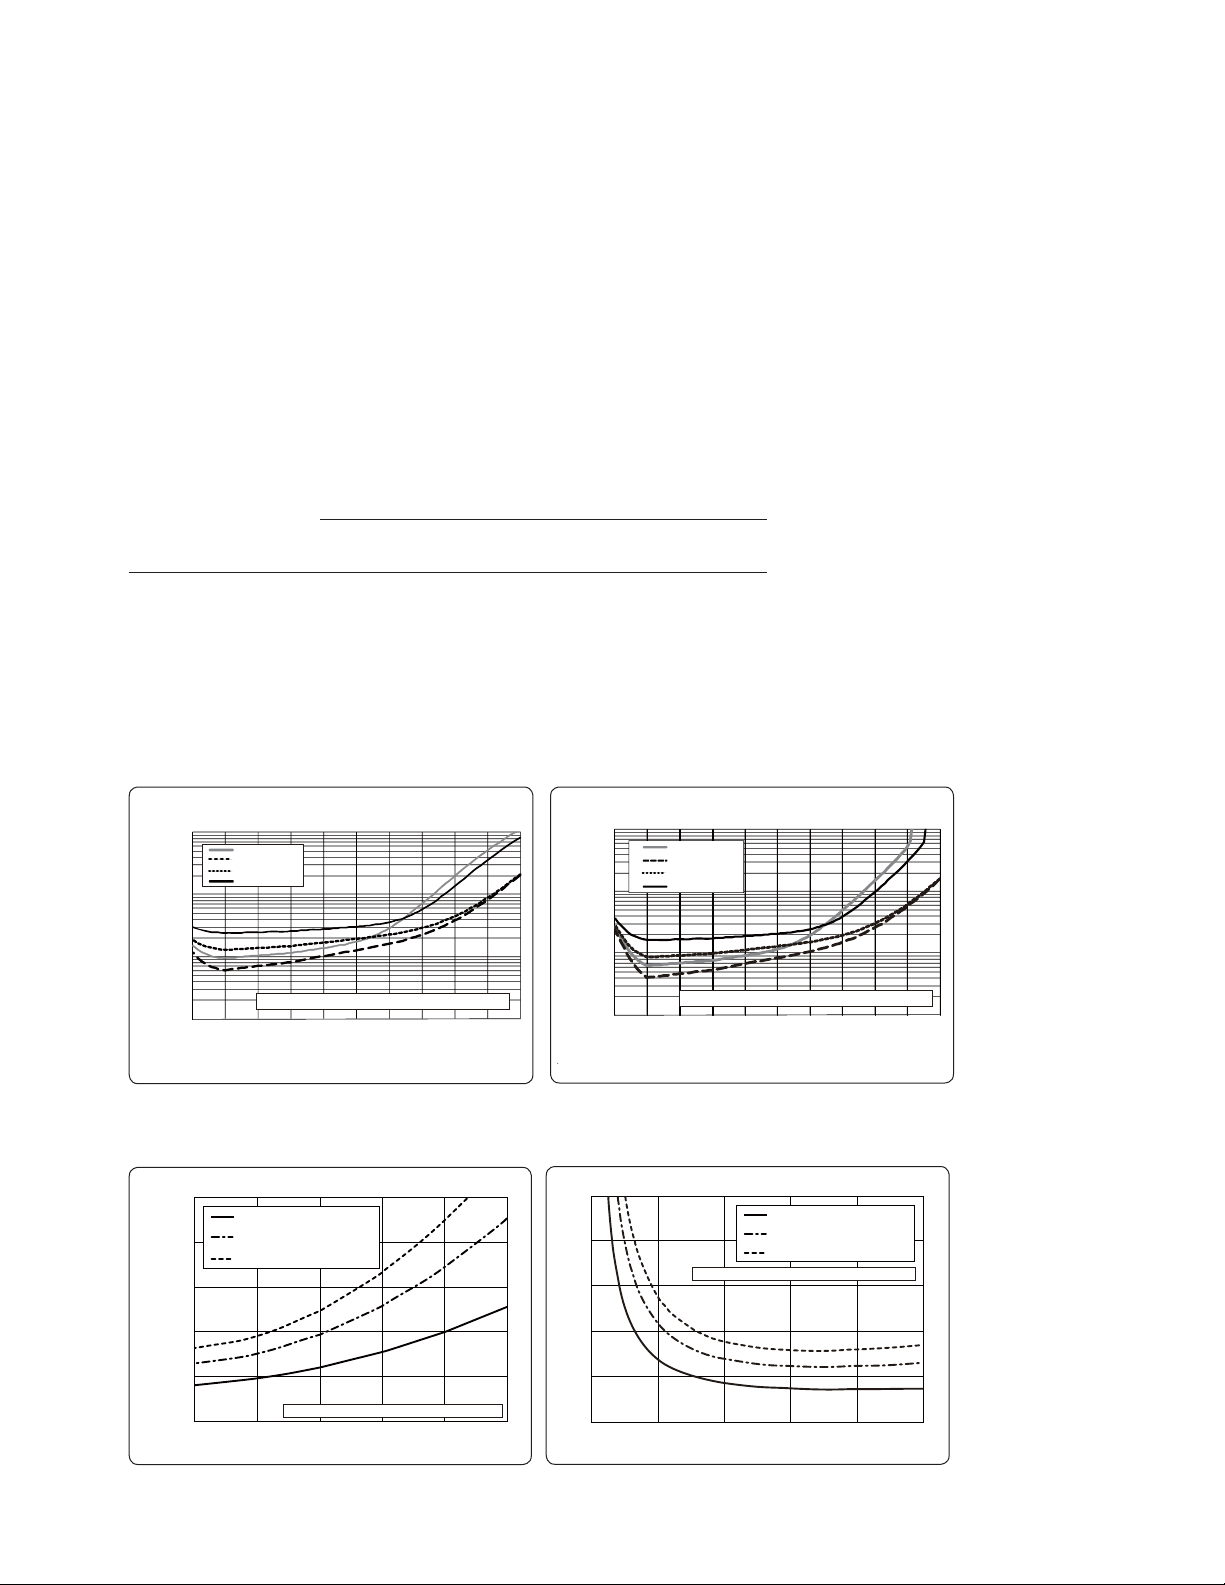
Table 5. Corrected system performance with 3.5 mm device connector type,
Transmission coefficient (dB)
Uncertainty (dB)
Magnitude
0.01
0.1
1
10
-90-80-70-60-50-40-30-20-10010
S11 = S22 = 0; Cal power = -10 dBm; Meas power = -10 dBm
9 KHz to 300 KHz
300 KHz to 10 MHz
10 MHz to 3 GHz
3 GHz to 6 GHz
6 GHz to 8.5 GHz
0.1
1
10
100
-90-80-70-60-50-40-30-20-10010
S11 = S22 = 0; Cal power = -10 dBm; Meas power = -10 dBm
9 KHz to 300 KHz
300 KHz to 10 MHz
10 MHz to 3 GHz
3 GHz to 6 GHz
6 GHz to 8.5 GHz
Transmission coefficient (dB)
Uncertainty (degrees)
Phase
Reflection coefficient (linear)
Uncertainty (linear)
Magnitude
0
0.01
0.02
0.03
0.04
0.05
0 0.2 0.4 0.6 0.8 1
S21 = S12 = 0; Cal power = -10 dBm; Meas power = -10 dBm
9 KHz to 300 KHz, 300 KHz to 10 MHz
10 MHz to 3 GHz
3 GHz to 6 GHz
6 GHz to 8.5 GHz
Reflection coefficient (linear)
Uncertainty (degrees)
Phase
0
2
4
6
8
10
0 0.2 0.4 0.6 0.8 1
S21 = S12 = 0; Cal power = -10 dBm; Meas power = -10 dBm
9 KHz to 300 KHz, 300 KHz to 10 MHz
10 MHz to 3 GHz
3 GHz to 6 GHz
6 GHz to 8.5 GHz
85033E calibration kit
Network analyzer: E5071C
Calibration kit: 85033E (3.5 mm, 50 Ω)
Calibration: full 2-port
IF bandwidth = 10 Hz, no averaging applied to data, environmental temperature = 23 °C
(±5 °C ) with < 1 °C deviation from calibration temperature, isolation calibration performed
Specifi cation (dB)
Description
300 kHz
Directivity 46 46 44 38 38
Source match 43 43 40 37 36
Load match 46 46 44 38 38
Refl ection tracking ±0.006 ±0.006 ±0.007 ±0.009 ±0.010
Transmission tracking ±0.026 ±0.015 ±0.020 ±0.058 ±0.079
Transmission uncertainty (specification)
9 kHz to
300 kHz to
10 MHz
10 MHz to
3 GHz
3 GHz to
6 GHz
6 GHz to
8.5 GHz
Reflection uncertainty (specification)
9
Page 10
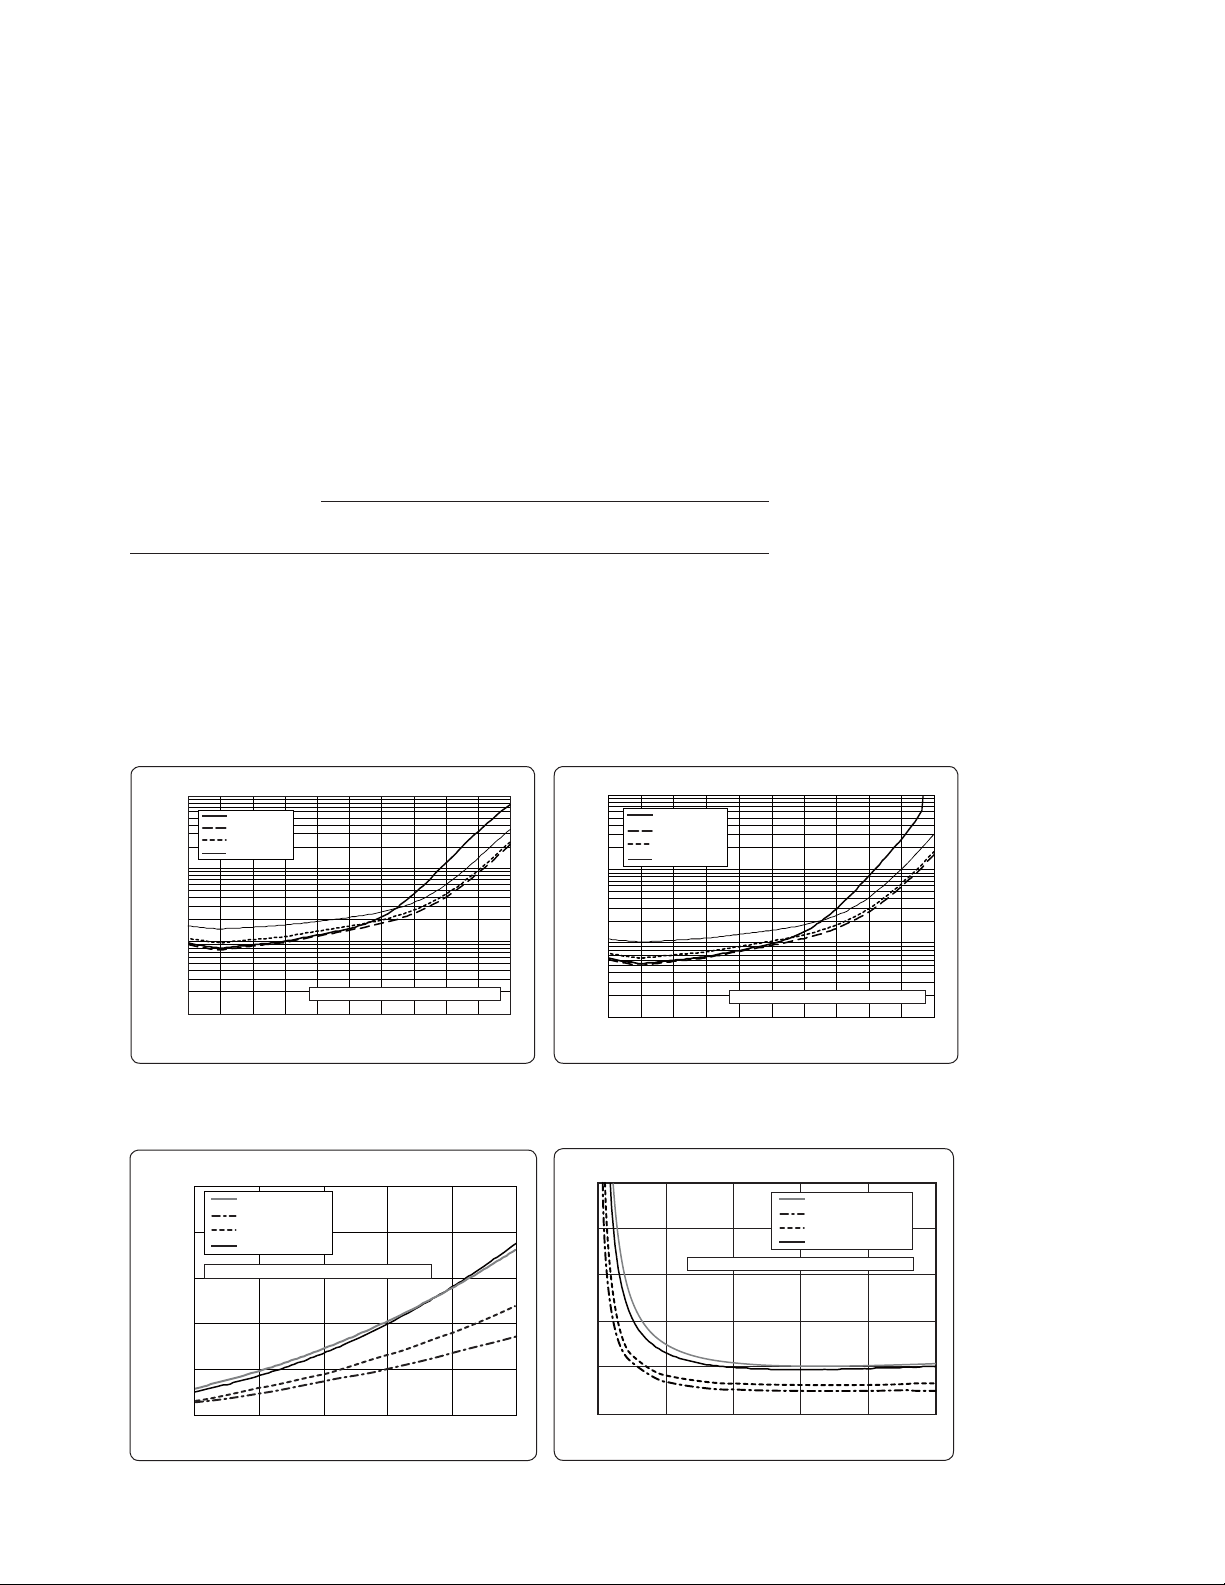
Table 6. Corrected system performance with 3.5 mm device connector type,
0.01
0.1
1
10
-9 0-80-7 0-6 0-50-4 0-30-2 0-1 0010
Uncertainty (dB)
Transmission Coefficient (dB)
Magnitude
300 KHz to 10 MHz
10 MHz to 3 GHz
3 GHz to 6 GHz
6 GHz to 8.5 GHz
S11 = S22 = 0; Cal power = -10 dBm; Meas power = -10dBm
1
300 kHz to 10 MHz
10 MHz to 3 G Hz
3 GHz to 6 GHz
6 GHz to 8.5 GHz
S11 = S 22 = 0 ; Cal power = -10 dBm; Meas power = -10dBm
0.1
1
10
100
-90-80-70-60-50-40-30-20-
10010
Uncertainty (Degrees)
Transmission coefficient (dB)
Phase
0
0.01
0.02
0.03
0.04
0.05
0 0.2 0.4 0 .6 0 .8 1
Uncertainty (linear)
Reflection coefficient (linear)
Magnitu de
300 kHz to 10 MHz
10 MHz to 3 GHz
3 GHz to 6 GHz
6 GHz to 8.5 GHz
S2 1 = S1 2 = 0; Cal power = -10 dBm; Meas power = -10 dBm
0
2
4
6
8
10
0 0.2 0.4 0.6 0.8 1
Uncertainty (degrees)
Reflection coefficient (linear)
Phase
300 kHz to 10 MHz
10 MHz to 3 GHz
3 GHz to 6 GHz
6 GHz to 8.5 GHz
S2 1 = S1 2 = 0; Cal power = -10 dBm; Meas power = -10 dBm
85093C electronic calibration (ECal) module
Network analyzer: E5071C
Calibration module: 85093C (3.5 mm, 50 Ω) electronic calibration (ECal)
module
Calibration: full 2-port
IF bandwidth = 10 Hz, no averaging applied to data, environmental temperature = 23 °C
(±5 °C ) with < 1 °C deviation from calibration temperature, isolation calibration is not
performed
Specifi cation (dB)
Description
10 MHz
Directivity 45 52 51 47
Source match 36 44 39 34
Load match 41 47 44 40
Refl ection tracking ±0.100 ±0.040 ±0.050 ±0.070
Transmission tracking ±0.055 ±0.049 ±0.068 ±0.117
Transmission uncertainty (specification)
300 kHz to
10 MHz to
3 GHz
3 GHz to
6 GHz
6 GHz to
8.5 GHz
Reflection uncertainty (specification)
10
Page 11
Option 2D5/2K5/4D5/4K5
0.01
0.1
1
10
-90-80-70-60-50-40-30-20-
10010
300 KHz to 500 MHz
500 MHz to 2 GHz
2 GHz to 6 GHz
6 GHz to 20 GHz
S11 = S 22 = 0; Cal pow er = - 10 dBm; M eas po wer = -10 dBm
Unc ertainty (dB )
Transmission Coefficient (dB)
Magnitude
0.1
1
10
100
-90-80-7 0-60-50-4 0-30-20-1 0010
300 KHz to 500 MHz
500 MHz to 2 GHz
2 GHz to 6 GHz
6 GHz to 20 GHz
S11 = S22 = 0; Cal power = -10 dBm; Meas power = -10 dBm
Phase
Uncertainty (Degrees)
Trans mission Coefficient (dB)
0
0.01
0.02
0.03
0.04
0.05
0 0.2 0.4 0.6 0.8 1
Uncertainty (linear)
Reflec tion coefficient (linear)
Magnitu de
300 KHz to 500 MHz, 500 MHz to 2 GHz
2 GHz to 6 GHz
6 GHz to 20 GHz
S2 1 = S1 2 = 0; Cal power = -10 dBm; Meas power = -10 dBm
0
2
4
6
8
10
0 0 .2 0.4 0.6 0.8 1
Unc ertainty (de grees)
Reflection coefficient (linear)
Phase
300 KHz to 500 MHz, 500 MHz to 2 GHz
2 GHz to 6 GHz
6 GHz to 20 GHz
S2 1 = S1 2 = 0; Cal power = -10 dBm; Meas power = -10 dBm
Table 7. Corrected system performance with 3.5 mm device connectors,
85052D calibration kit
Network analyzer: E5071C
Calibration kit: 85052D (3.5 mm, 50 Ω)
Calibration: full 2-port
IF bandwidth = 10 Hz, no averaging applied to data, environmental temperature = 23 °C
(±5 °C ) with < 1 °C deviation from calibration temperature, isolation calibration performed
Specifi cation (dB)
Description
500 MHz
Directivity 42 42 38 36
Source match 37 37 31 28
Load match 42 42 38 36
Refl ection tracking ±0.003 ±0.003 ±0.004 ±0.008
Transmission tracking ±0.068 ±0.034 ±0.100 ±0.208
Transmission uncertainty (specification)
300 kHz to
500 MHz to
2 GHz
2 GHz to
6 GHz
6 GHz to
20 GHz
Reflection uncertainty (specification)
11
Page 12
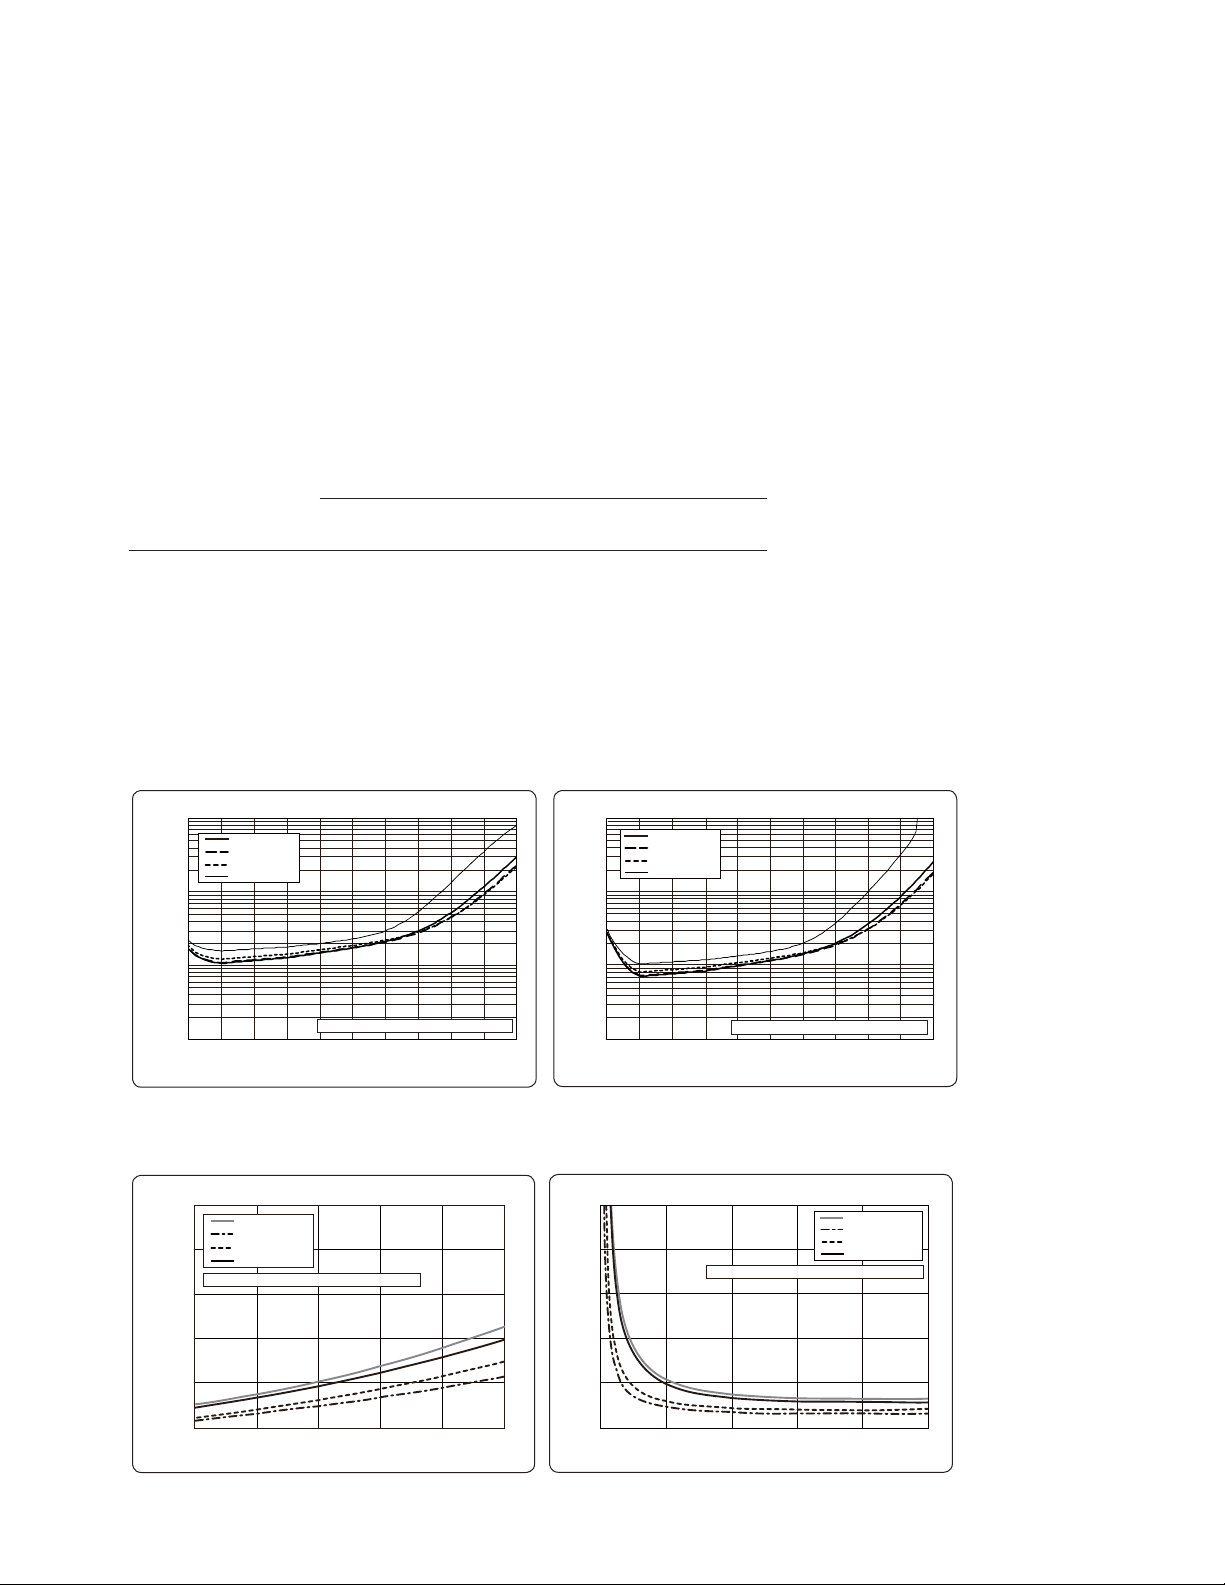
Table 8. Corrected system performance with 3.5 mm device connectors,
0
0.01
0.02
0.03
0.04
0.05
0 0.2 0 .4 0.6 0.8 1
Uncertainty (linear)
Reflection coefficient (linear)
Magnitu de
10 MHz to 500 MHz
500 MHz to 2 GHz
2 GHz to 6 GHz
6 GHz to 20 GHz
S2 1 = S1 2 = 0; Cal power = -10 dBm; Meas power = -10 dBm
0
2
4
6
8
10
0 0.2 0.4 0.6 0.8 1
Uncertainty (degrees)
Reflection coefficient (linear)
Phase
10 MHz to 500 MHz
500 MHz to 2 GHz
2 GHz to 6 GHz
6 GHz to 20 GHz
S2 1 = S1 2 = 0; Cal power = -10 dBm; Meas power = -10 dBm
10 MHz to 500 MHz
500 MHz to 2 GHz
2 GHz to 6 GHz
6 GHz to 20 GHz
S11 = S 22 = 0 ; Cal power = -10 dBm; Meas power = -10dBm
0.01
0.1
1
10
-90-80-70-60-50-40-30-20-
10010
Unc ertainty (dB )
Transmission coefficient (dB)
Magnitude
10 MHz to 500 MHz
500 MHz to 2 GHz
2 GHz to 6 GHz
6 GHz to 20 GHz
S11 = S 22 = 0 ; Cal power = -10 dBm; Meas power = -10dBm
0.1
1
10
100
-90-80-70-60-50-40-30-20-
10010
Uncertainty (Degrees)
Transmission coefficient (dB)
Phase
N4691B electronic calibration (ECal) module
Network analyzer: E5071C
Calibration module: N4691B (3.5 mm, 50 Ω) electronic calibration (ECal)
module
Calibration: full 2-port
IF bandwidth = 10 Hz, no averaging applied to data, environmental temperature = 23 °C
(±5 °C ) with < 1 °C deviation from calibration temperature, isolation calibration is not
performed
Specifi cation (dB)
Description
500 MHz
Directivity 46 56 54 48
Source match 41 47 45 44
Load match 38 41 39 36
Refl ection tracking ±0.050 ±0.020 ±0.030 ±0.040
Transmission tracking ±0.087 ±0.086 ±0.097 ±0.130
Transmission uncertainty (specification)
10 MHz to
500 MHz to
2 GHz
2 GHz to
6 GHz
6 GHz to
20 GHz
Reflection uncertainty (specification)
12
Page 13

Uncorrected System Performance
Table 9. Option 230/235/240/245/260/265/280/285/430/435/440/445/
460/465/480/485
User correction: OFF, system correction: ON
Specifi cation (dB)
Description
Directivity 20 dB 25 dB 20 dB 15 dB
Source match 20 dB 25 dB 20 dB 15 dB
Load match 12 dB 17 dB 12 dB 10 dB
Transmission tracking ±1.5 dB ±1.0 dB ±1.0 dB ±1.0 dB
Refl ection tracking ±1.5 dB ±1.0 dB ±1.0 dB ±1.0 dB
9 kHz to
300 kHz
Table 10. Option 2D5/2K5/4D5/4K5
User correction: OFF, system correction: ON
Specifi cation (dB)
Description
Directivity 20 dB 25 dB 25 dB 20 dB 15 dB 15 dB 15 dB
Source match 20 dB 25 dB 25 dB 20 dB 15 dB 15 dB 15 dB
Load match 9 dB 17 dB 15 dB 11 dB 9 dB 8 dB 7 dB
Transmission
tracking
Refl ection
tracking
300 kHz
to 1 MHz
±1.0 dB ±1.0 dB ±1.0 dB ±1.0 dB ±1.0 dB ±1.0 dB ±1.0 dB
±1.0 dB ±1.0 dB ±1.0 dB ±1.0 dB ±1.0 dB ±1.0 dB ±1.0 dB
1 MHz to
1 GHz
300 kHz to
3 GHz
1 GHz to
3 GHz
3 GHz to
6 GHz
3 GHz to
6 GHz
6 GHz to
8.5 GHz
6 GHz
to 8.5 GHz
8.5 GHz to
11 GHz
11 GHz to
20 GHz
13
Page 14

Test Port Output (Source)
Test port output frequency
Table 11. Option 230/235/240/245/260/265/280/285/430/435/440/
445/460/465/480/485/2D5/2K5/4D5/4K5
Description Specifi cation Typical
Frequency range
Option 230/430
Option 240/440
Option 260/460
Option 280/480
Option 235/435
Option 245/445
Option 265/465
Option 285/485
Option 2D5/4D5
Option 2K5/4K5
Resolution 1 Hz
Source stability
standard
Option 1E5
CW accuracy
standard
Option 1E5
9 kHz to 3 GHz
9 kHz to 4.5 GHz
9 kHz to 6.5 GHz
9 kHz to 8.5 GHz
100 kHz to 3 GHz
100 kHz to 4.5 GHz
100 kHz to 6.5 GHz
100 kHz to 8.5 GHz
300 kHz to 14 GHz
300 kHz to 20 GHz
±7 ppm (5 to 40 ºC)
±0.05 ppm (5 to 40 ºC),
±0.5 ppm/year
±7 ppm
±1 ppm
14
Page 15

Test port output power1
Table 12. Option 230/235/240/245/260/265/280/285/430/435/440/
445/460/465/480/485
Description Specifi cation Typical
Nominal power
(preset power)
Level accuracy
2, 6
(stepped sweep mode)
Level accuracy
2
(swept sweep mode)
Level linearity
3, 5, 6
(stepped sweep mode)
9 kHz to 5 GHz
5 GHz to 6 GHz
6 GHz to 7 GHz
7 GHz to 8.5 GHz
Level linearity
(swept sweep mode)
5
4
9 kHz to 5 GHz
5 GHz to 6 GHz
6 GHz to 7 GHz
7 GHz to 8.5 GHz
5, 6
Range
9 kHz to 5 GHz
5 GHz to 6 GHz
6 GHz to 7 GHz
7 GHz to 8.5 GHz
Sweep range
5, 6
9 kHz to 5 GHz
5 GHz to 6 GHz
6 GHz to 7 GHz
7 GHz to 8.5 GHz
Level resolution 0.05 dB
0 dBm
±0.650 dB (at 0 dBm,
50 MHz absolute)
±1.0 dB
±2.5 dB
±0.75 dB (–20 to 10 dBm)
±0.75 dB (–20 to 9 dBm )
±0.75 dB (–20 to 8 dBm )
±0.75 dB (–20 to 7 dBm )
±1.5 dB (at –20 to 10 dBm)
±1.5 dB (at –20 to 9 dBm)
±1.5 dB (at –20 to 8 dBm)
±1.5 dB (at –20 to 7 dBm)
–55 to 10 dBm
–55 to 9 dBm
–55 to 8 dBm
–55 to 7 dBm
–55 to 10 dBm
–55 to 9 dBm
–55 to 8 dBm
–55 to 7 dBm
Description Specifi cation SPD
Max leveled power
(Option 230/235/240/245/260/
265/280/285)
9 kHz to 8.5 GHz
(Option 430/435/440/445/460/
465/480/485)
9 kHz to 6 GHz
6 GHz to 7 GHz
7 GHz to 8.5 GHz
1. Source output performance on port 1 only. Other port output performance is typical.
2. Level accuracy is taken at 0 dBm, relative to 50 MHz reference unless otherwise stated.
3. Level linearity given is relative to 0 dBm.
4. The specifi cation might not be met at 5 MHz or 50 MHz.
5. The level accuracy specifi cation needs to be taken into account for test port output power level.
6. Power calibration using an external power meter improves level accuracy of the test port output power.
Proper power meters/sensors, and the 82357B USB-GPIB interface are required to conduct power calibration.
5, 6
10 dBm
10 dBm
9 dBm
8 dBm
15
Page 16

Test port output power
7
(continued)
Table 13. Option 2D5/2K5/4D5/4K5
Description Specifi cation Typical
Nominal power (preset power) –5 dBm
6
Level accuracy
(stepped sweep mode)1
300 kHz to 1 MHz
1 MHz to 5 MHz
5 MHz to 8.5 GHz
8.5 GHz to 20 GHz
Level accuracy
(swept sweep mode)
2
300 kHz to 1 GHz
1 GHz to 8.5 GHz
8.5 GHz to 20 GHz
Level linearity
(stepped sweep mode)
5, 6
3
300 kHz to 1 MHz
1 MHz to 6 GHz
6 GHz to 8 GHz
8 GHz to 10.5 GHz
10.5 GHz to 15 GHz
15 GHz to 20 GHz
Level linearity5
(swept sweep mode)
3
300 kHz to 1 MHz
1 MHz to 6 GHz
6 GHz to 8 GHz
8 GHz to 10.5 GHz
10.5 GHz to 15 GHz
15 GHz to 20 GHz
5, 6
Range
300 kHz to 1 MHz
1 MHz to 6 GHz
6 GHz to 8 GHz
8 GHz to 10.5 GHz
10.5 GHz to 15 GHz
15 GHz to 20 GHz
Sweep range
4, 5, 6
300 kHz to 1 MHz
1 MHz to 6 GHz
6 GHz to 8 GHz
8 GHz to 10.5 GHz
10.5 GHz to 15 GHz
15 GHz to 20 GHz
(Source attenuator = 0 dB)
Level resolution 0.05 dB
±0.650 dB (at –5 dBm, 50 MHz absolute)
+2.0 dB, –6.0 dB
±2.0 dB
±1.0 dB
±2.5 dB
±5.0 dB
±2.5 dB
+5.0 dB, –7.0 dB
±0.75 dB (–25 to 8 dBm)
±0.75 dB (–25 to 10 dBm)
±0.75 dB (–25 to 9 dBm )
±0.75 dB (–25 to 7 dBm )
±0.75 dB (–25 to 3 dBm )
±0.75 dB (–25 to 0 dBm )
±1.5 dB (–25 to 8 dBm)
±1.5 dB (–25 to 10 dBm)
±1.5 dB (–25 to 9 dBm )
±1.5 dB (–25 to 7 dBm )
±1.5 dB (–25 to 3 dBm )
±1.5 dB (–25 to 0 dBm )
–85 to 8 dBm
–85 to 10 dBm
–85 to 9 dBm
–85 to 7 dBm
–85 to 3 dBm
–85 to 0 dBm
–25 to 8 dBm
–25 to 10 dBm
–25 to 9 dBm
–25 to 7 dBm
–25 to 3 dBm
–25 to 0 dBm
1. Level accuracy is taken at –5 dBm, relative to 50 MHz reference unless otherwise stated.
2. Level accuracy is taken at –5 dBm, relative to 50 MHz reference.
3. Level linearity given is relative to –5 dBm.
4. The sweep range shifts based on the selected source attenuator value (0 dB to 60 dB, 10 dB step).
5. The level accuracy specifi cation needs to be taken into account for test port output power level.
6. Power calibration using an external power meter improves level accuracy of the test port output power.
Proper power meters/sensors, and the 82357B USB-GPIB interface are required to conduct power calibration.
7. Source output performance on port 1 only. Other port output performance is typical.
16
Page 17

Test port output power
6
(continued)
Table 13. Option 2D5/2K5/4D5/4K5
Description Specifi cation SPD
Max leveled power
300 kHz to 1 MHz
1 MHz to 10 GHz
10 GHz to 13 GHz
13 GHz to 15 GHz
15 GHz to 18 GHz
18 GHz to 20 GHz
3, 4
9 dBm
10 dBm
9 dBm
7 dBm
5 dBm
4 dBm
Test port output signal purity
Table 14. Option 230/235/240/245/260/265/280/285/430/435/440/
445/460/465/480/485
Description Specifi cation Typical
Harmonics (2nd or 3rd)
9 kHz to 2 GHz
2 GHz to 8.5 GHz
Non-harmonic spurious
9 kHz to 8.5 GHz < –30 dBc (at 5 dBm)
< –25 dBc (at 5 dBm)
< –20 dBc (at 5 dBm)
Table 15. Option 2D5/2K5/4D5/4K5
Description Specifi cation Typical
Harmonics (2nd to 5th)
300 kHz to 1 GHz
1 GHz to 20 GHz
Non-harmonic spurious
300 kHz to 20 GHz < –30 dBc (at –5 dBm)
1. This includes 6th and 7th harmonics when the test frequency is from 1 MHz to 1 GHz.
2. The carrier ±
3. The level accuracy specifi cation needs to be taken into account for test port output power level.
4. Power calibration using an external power meter improves level accuracy of the test port output power.
Proper power meters/sensors, and the 82357B USB-GPIB interface are required to conduct power calibration.
5. Maximum output power is the maximum power of "Range" in Table 13 Test port output power.
6. Source output performance on port 1 only. Other port output performance is typical.
1
/8
1
< –12 dBc (at maximum
output power)
< –15 dBc (at maximum
output power)
2
th spurious is excluded from 8.76 GHz to 17.52 GHz.
5
5
17
Page 18

Test Port Input
Test port input levels
Table 16. Option 230/235/240/245/260/265/280/285/430/435/440/
445/460/465/480/485
Description Specifi cation Typical
Maximum test port input level
9 kHz to 8.5 GHz +10 dBm
Damage level
9 kHz to 8.5 GHz +26 dBm
±35 VDC
Crosstalk
9 kHz to 300 kHz
300 kHz to 10 MHz
10 MHz to 3 GHz
3 GHz to 6 GHz
6 GHz to 8.5 GHz
Description Specifi cation SPD
Test port noise fl oor
9 kHz to 300 kHz
300 kHz to 10 MHz
10 MHz to 5 GHz
5 GHz to 6 GHz
6 GHz to 7 GHz
7 GHz to 8 GHz
8 GHz to 8.5 GHz
1
–100 dB
–110 dB
–120 dB
–110 dB
–100 dB
–97 dBm/Hz
–107 dBm/Hz
–123 dBm/Hz
–124 dBm/Hz
–119 dBm/Hz
–120 dBm/Hz
–120 dBm/Hz
–115 dBm/Hz
–115 dBm/Hz
–130 dBm/Hz
–131 dBm/Hz
–130 dBm/Hz
–129 dBm/Hz
–127 dBm/Hz
1. The specifi cation might not be met at 5 MHz or 50 MHz.
18
Page 19

Test port input levels (continued)
Table 17. Option 2D5/2K5/4D5/4K5
Description Specifi cation Typical
Maximum test port input level
300 kHz to 20 GHz +10 dBm
Damage level
300 kHz to 20 GHz +26 dBm
or ±35 VDC
Crosstalk
300 kHz to 1 MHz
1 MHz to 5 MHz
5 MHz to 10 MHz
10 MHz to 45 MHz
45 MHz to 4 GHz
4 GHz to 6 GHz
6 GHz to 8.5 GHz
8.5 GHz to 15 GHz
15 GHz to 20 GHz
Description Specifi cation SPD
Test port noise fl oor
300 kHz to 1 MHz
1 MHz to 10 MHz
10 MHz to 100 MHz
100 MHz to 6 GHz
6 GHz to 8 GHz
8 GHz to 8.5 GHz
8.5 GHz to 10.5 GHz
10.5 GHz to 15 GHz
15 GHz to 20 GHz
1
–68 dB
–70 dB
–100 dB
–110 dB
–118 dB
–123 dB
–120 dB
–112 dB
–106 dB
–97 dBm/Hz
–107 dBm/Hz
–120 dBm/Hz
–123 dBm/Hz
–118 dBm/Hz
–120 dBm/Hz
–108 dBm/Hz
–107 dBm/Hz
–106 dBm/Hz
–110 dBm/Hz
–115 dBm/Hz
–129 dBm/Hz
–130 dBm/Hz
–130 dBm/Hz
–130 dBm/Hz
–120 dBm/Hz
–120 dBm/Hz
–119 dBm/Hz
1. The specifi cation might not be met at 5 MHz or 50 MHz.
19
Page 20

Test port input (compression level)
Table 18. Option 230/235/240/245/260/265/280/285/430/435/440/
445/460/465/480/485
Description Specifi cation SPD
Compression level
Magnitude
9 kHz to 5 GHz
5 GHz to 8.5 GHz
(maximum test port input level = +10 dBm)
Phase
9 kHz to 3 GHz
3 GHz to 5 GHz
5 GHz to 8.5 GHz
(maximum test port input level = +10 dBm)
Table 19. Option 2D5/2K5/4D5/4K5
Description Specifi cation SPD
Compression level
Magnitude
300 kHz to 10 MHz
10 MHz to 10 GHz
10 GHz to 15 GHz
15 GHz to 20 GHz
(maximum test port input level = +10 dBm)
Phase
300 kHz to 5 GHz
5 GHz to 10 GHz
10 GHz to 15 GHz
15 GHz to 20 GHz
(maximum test port input level = +10 dBm)
0.08 dB
0.1 dB
0.3 deg
0.6 deg
1.0 deg
0.3 dB
0.182 dB
0.712 dB
1.87 dB
2.3 deg
4.3 deg
17.3 deg
20.3 deg
20
Page 21

Test port input (trace noise)
Table 20. Option 230/235/240/245/260/265/280/285/430/435/440/
445/460/465/480/485
Description Specifi cation SPD
Trace noise magnitude
9 kHz to 30 kHz (IFBW = 3 kHz) 0.004 dB rms 0.001 dB rms
30 kHz to 100 kHz (IFBW = 3 kHz) 0.003 dB rms 0.001 dB rms
100 kHz to 10 MHz (IFBW = 3 kHz) 0.003 dB rms 0.0005 dB rms
10 MHz to 4.38 GHz (IFBW = 70 kHz) 0.004 dB rms 0.001 dB rms
4.38 GHz to 5 GHz (IFBW = 70 kHz) 0.006 dB rms 0.0012 dB rms
5 GHz to 6 GHz (IFBW = 70 kHz) 0.006 dB rms 0.0012 dB rms
6 GHz to 7 GHz (IFBW = 70 kHz) 0.006 dB rms 0.0012 dB rms
7 GHz to 8.5 GHz (IFBW = 70 kHz)
(at maximum output power level of sweep range)
Trace noise phase
9 kHz to 30 kHz (IFBW = 3 kHz) 0.035 deg rms
30 kHz to 10 MHz (IFBW = 3 kHz) 0.020 deg rms
10 MHz to 4.38 GHz (IFBW = 70 kHz) 0.035 deg rms
4.38 GHz to 5 GHz (IFBW = 70 kHz) 0.050 deg rms
5 GHz to 6 GHz (IFBW = 70 kHz) 0.050 deg rms
6 GHz to 7 GHz (IFBW = 70 kHz) 0.050 deg rms
7 GHz to 8.5 GHz (IFBW = 70 kHz)
(at maximum output power level of sweep range)
1
0.006 dB rms 0.0012 dB rms
2
0.050 deg rms
1. The specifi cation might not be met at the following frequencies: 333.333 kHz, 406.25 kHz,
857.143 kHz, 928.571 kHz, 1.3 MHz, 2.4 MHz and 4.333333 MHz.
2. The specifi cation might not be met at 5 MHz or 50 MHz.
21
Page 22

Test port input (trace noise) (continued)
Table 21. Option 2D5/2K5/4D5/4K5
Description Specifi cation SPD
Trace noise magnitude
300 kHz to 1 MHz (IFBW = 3 kHz)
1 MHz to 10 MHz (IFBW = 3 kHz)
10 MHz to 4.38 GHz (IFBW = 70 kHz)
4.38 GHz to 8.5 GHz (IFBW = 70 kHz)
8.5 GHz to 13.137 GHz (IFBW = 70 kHz)
13.137 GHz to 17 GHz (IFBW = 70 kHz)
17 GHz to 20 GHz (IFBW = 70 kHz)
(at maximum output power level
of sweep range)
Trace noise phase
300 kHz to 1 MHz (IFBW = 3 kHz)
1 MHz to 10 MHz (IFBW = 3 kHz)
10 MHz to 4.38 GHz (IFBW = 70 kHz)
4.38 GHz to 8.5 GHz (IFBW = 70 kHz)
8.5 GHz to 13.137 GHz (IFBW = 70 kHz)
13.137 GHz to 17 GHz (IFBW = 70 kHz)
17 GHz to 20 GHz (IFBW = 70 kHz)
(at maximum output power level
of sweep range)
1, 3
0.006 dB rms
0.003 dB rms
0.004 dB rms
0.006 dB rms
0.009 dB rms
0.013 dB rms
0.023 dB rms
2, 3
0.040 deg rms
0.020 deg rms
0.035 deg rms
0.050 deg rms
0.064 deg rms
0.095 deg rms
0.165 deg rms
0.0009 dB rms
0.0005 dB rms
0.0010 dB rms
0.0012 dB rms
0.0024 dB rms
0.0040 dB rms
0.0065 dB rms
0.0120 deg rms
0.0025 deg rms
0.0075 deg rms
0.0150 deg rms
0.0250 deg rms
0.0320 deg rms
0.0520 deg rms
1. The specifi cation might not be met at the following frequencies: 406.25 kHz, 666.667 kHz,
722.222 kHz, 857.143 kHz, 928.571 kHz, 1.444444 MHz, 1.714286 MHz, 1.8 MHz, 1.857143 MHz,
1.95 MHz, 2.4375 MHz, 2.571429 MHz, 3.714286 MHz, 4.8 MHz, 5 MHz, 5.416667 MHz,
7.583333 MHz, 10 MHz, 10.833333 MHz, 12.5 MHz.
2. The specifi cation might not be met at 5 MHz or 50 MHz.
3. Trace noise SPD is defi ned with transmission measurements only.
22
Page 23

Test port input (stability)
1
Table 22. Option 230/235/240/245/260/265/280/285/430/435/440/
445/460/465/480/485
Description Specifi cation Typical
Stability magnitude
9 kHz to 3 GHz ±0.005 dB/°C
3 GHz to 6 GHz ±0.01 dB/°C
6 GHz to 8.5 GHz ±0.04 dB/°C
Stability phase
9 kHz to 3 GHz ±0.1 deg/°C
3 GHz to 6 GHz ±0.2 deg/°C
6 GHz to 8.5 GHz ±0.8 deg/°C
Table 23. Option 2D5/2K5/4D5/4K5
Description Specifi cation Typical
Stability magnitude
300 kHz to 3 GHz
3 GHz to 6 GHz
6 GHz to 20 GHz
Stability phase
300 kHz to 3 GHz
3 GHz to 6 GHz
6 GHz to 20 GHz
±0.005 dB/°C
±0.01 dB/°C
±0.04 dB/°C
±0.1 deg/°C
±0.2 deg/°C
±0.8 deg/°C
1. Stability is defi ned as a ratio measurement at the test port.
23
Page 24

Test port input (dynamic accuracy)
0.01
0.1
1
10
-100-90-80-70-60-50-40-30-20-10010
Accuracy (dB)
Test port power (dBm)
Magnitude
Accuracy (dB)
Test port power (dBm)
Phase
0.1
1
10
100
-100-90-80-70-60-50-40-30-20-10010
1
Table 24. Option 230/235/240/245/260/265/280/285/430/435/440/
445/460/465/480/485
Accuracy of the test port input power reading is relative to –10 dBm reference input
power level.
Description Specifi cation Typical
Dynamic accuracy magnitude
10 dBm ±0.207 dB
–30 dBm ±0.045 dB
–100 dBm ±2.00 dB
–110 dBm ±3.0 dB
Dynamic accuracy phase
10 dBm ±5.03 deg
–30 dBm ±0.30 deg
–100 dBm ±15.0 deg
Specification
±3.0 dB (at –110 dBm, Ref.= –10 dBm, typical)
1. Dynamic accuracy is verifi ed with the following measurements:
• compression over frequency
• IF linearity at two frequencies (1 MHz and 1.195 GHz) using a reference level of –10 dBm for an
input power range of 0 to –100 dBm.
24
Page 25

Test port input (dynamic accuracy)
Test port power (dBm)
Accuracy (dB)
Magnitude
0.01
0.1
1
10
-100-90-80-70-60-50-40-30-20-10010
Test port power (dBm)
Accuracy (dB)
Phase
0.1
1
10
100
-100-90-80-70-6 0-50-40-30-20-10010
1
(continued)
Table 25. Option 2D5/2K5/4D5/4K5
Accuracy of the test port input power reading is relative to –10 dBm reference input
power level.
Description Specifi cation Typical
Dynamic accuracy magnitude
10 dBm ±2.49 dB
–30 dBm ±0.046 dB
–100 dBm ±2.00 dB
–110 dBm ±3.0 dB
Dynamic accuracy phase
10 dBm ±20.6 deg
–30 dBm ±0.30 deg
–100 dBm ±15.0 deg
Specification
±3.0 dB (at –110 dBm, Ref.= –10 dBm, typical)
1. Dynamic accuracy is verifi ed with the following measurements:
• compression over frequency
• IF linearity at two frequencies (1 MHz and 1.195 GHz) using a reference level of –10 dBm for an
input power range of 0 to –100 dBm.
25
Page 26

Test port input (group delay)
Accuracy (nSec)
Aperture (MHz)
0.01 0.1 1 10 100
100
10
1
0.1
0.01
0.001
1
Table 26. Option 230/235/240/245/260/265/280/285/430/435/440/
445/460/465/480/485
Description Specifi cation Supplemental information
Aperture (selectable) (frequency span)/(number
of points - 1)
Maximum aperture 25% of frequency span
Minimum delay Limited to measuring no more
than 180° of phase change
within the minimum aperture.
Accuracy See graph below, typical
The following graph shows group delay accuracy with type-N connectors, full 2-port
calibration and a 10 Hz IF bandwidth.
Calibration kit (85032F). Insertion loss is assumed to be < 2 dB.
In general, the following formula can be used to determine the accuracy, in seconds, of a
specifi c group delay measurement:
±phase accuracy (degrees) / [360 x aperture (Hz)]
1. Group delay is computed by measuring the phase change within a specifi ed step (determined by
the frequency span and the number of points per sweep).
26
Page 27

Test port input (group delay)1 (continued)
Table 27. Option 2D5/2K5/4D5/4K5
Description Specifi cation Supplemental information
Aperture (selectable) (frequency span)/(number
of points - 1)
Maximum aperture 25% of frequency span
Minimum delay Limited to measuring no more
than 180° of phase change
within the minimum aperture.
Accuracy See graph below, typical
The following graph shows group delay accuracy with 3.5 mm (male) connectors, full
2-port calibration and a 10 Hz IF bandwidth.
Calibration kit (85052D). Insertion loss is assumed to be < 2 dB.
100
10
1
0.1
Accuracy (nSec)
0.01
0.001
Frequency = 1 GHz
Cal power = -10 dBm; Meas power = -10 dBm; Electrical Length = 10 m
0.01 0.1 1 10 100
Aperture (MHz)
In general, the following formula can be used to determine the accuracy, in seconds, of a
specifi c group delay measurement:
±phase accuracy (degrees) / [360 x aperture (Hz)]
1. Group delay is computed by measuring the phase change within a specified step (determined by
the frequency span and the number of points per sweep).
27
Page 28

General Information
Table 28. System bandwidth
Description General characteristics
IF bandwidth settings
Range 10 Hz to 500 kHz
Nominal settings are:
10, 15, 20, 30, 40, 50, 70, 100, 150, 200, 300, 400, 500, 700, 1 k,
1.5 k, 2 k, 3 k, 4 k, 5 k, 7 k, 10 k, 15 k, 20 k, 30 k, 40 k, 50 k, 70 k,
100 k, 150 k, 200 k, 300 k, 400 k, 500 kHz
Table 29. Front panel information
Description Typical General characteristics
RF connectors
Option 230/235/240/
245/260/265/280/285/
430/435/440/445/460/
465/480/485
Option 2D5/2K5/4D5/4K5
Probe power
Connector 3 terminal connector x 2
Voltage & maximum
current
Display
Type 10.4 in TFT color LCD
Resolution XGA (1024 x 768)
+15 V ±2% (400 mA)
–12.6 V ±5% (300 mA)
(Combined load for both
probe connections)
Type-N, female, 50 Ω
3.5 mm (male), 50 Ω nominal
with touch screen
1
1. Valid pixels are 99.99% and more. Below 0.01% (approx. 30 points) of fixed points of black, blue,
green or red are not regarded as failure.
28
Page 29

Table 30. Rear panel information
Description Typical General characteristics
External trigger input connector
Type BNC, female
Input level Low threshold voltage: 0.5 V
High threshold voltage: 2.1 V
Input level range: 0 to + 5 V
Pulse width ≥ 2 μsec
Polarity Positive or negative
External trigger output connector
Type BNC, female
Maximum output current 50 mA
Output level Low level voltage: 0 V
High level voltage: 5 V
Pulse width 1 μsec
Polarity Positive or negative
External reference signal input connector
Type BNC, female
Input frequency 10 MHz ±10 ppm
Input level –3 to + 10 dBm
Internal reference signal output connector
Type BNC, female
Output frequency 10 MHz ±7 ppm
Signal type Sinewave
Output level 0 dBm ±3 dB into 50 Ω
Output impedance 50 Ω
Internal reference signal oven connector
Type BNC, female
Output frequency 10 MHz ±1 ppm
Output level 0 dBm minimum
29
Page 30

Table 31. Rear panel information (continued)
Description Typical General characteristics
Bias tee input connector
Type BNC, female (for each port)
Maximum voltage ±35 VDC
Maximum current (no degradation in RF specifi cations) ±200 mA
Maximum current (damage level) ±500 mA
Fuse 500 mA, bi-pin style
Video output 15-pin mini D-Sub; female;
drives XGA compatible
monitors
GPIB 24-pin D-Sub (Type D-24),
female; compatible with
IEEE-488
USB-host port
Universal serial bus jack, Type A confi guration (4 contacts
inline, contact 1 on left); female; provides connection to
printer, ECal module, USB/GPIB interface or multiport test
set
Contact 1 Vcc: 4.75 to 5.25 VDC, 500
mA, maximum
Contact 2 – Data
Contact 3 + Data
Contact 4 Ground
1
USB (USBTMC
interface port
LAN 10/100BaseT Ethernet, 8-pin
Handler I/O port 36-pin centronics, female;
)
Universal serial bus jack,
Type B confi guration
(4 contacts inline); female;
provides connection to an
external PC; compatible
with USBTMC-USB488 and
USB 2.0.
confi guration; auto selects
between the two data rates
provides connection to
handler system
30
Page 31

Table 32. Rear panel information (continued)
Description Typical General characteristics
Line power
Frequency 47 Hz to 63 Hz
Voltage 90 to 132 VAC, or 198 to
VA max 350 VA max.
Power Consumption
Option 230/235/240/245/260/265/280/285
Option 430/435/440/445/460/465/480/485
Option 2D5/2K5
Option 4D5/4K5
Description Specifi cation General characteristics
AUX input connector
Type BNC, female x 2
Input range ±1 V or ±10 V selectable
Accuracy 1 % + 1 mV for ±1 V input
2
264 VAC (automatically
switched)
130 W (SPD)
155 W (SPD)
160 W (SPD)
185 W (SPD)
1 % + 10 mV for ±10 V input
Table 33. LXI compliance
Description General characteristics
Class C (only applies to units that are shipped with
fi rmware revision A.08.00 or later)
1. USB Test and Measurement Class (TMC) interface that communicates over USB, complying with
the IEEE 488.1 and IEEE 488.2 standards.
2. A third-wire ground is required.
31
Page 32

Table 34. EMC, safety and environment
Description General characteristics
EMC
European Council Directive 2004/108/EC
IEC 61326-1:2005
EN 61326-1:2006
CISPR 11:2003+A1:2004
EN 55011:2007
Group 1, Class A
IEC 61000-4-2:1995 +A2:2000
EN 61000-4-2:1995 +A2:2001
4 kV CD / 8 kV AD
IEC 61000-4-3:2006
EN 61000-4-3:2006
1-3 V/m, 80-1000 MHz / 1.4 GHz - 2.7 GHz, 80% AM
IEC 61000-4-4:2004
EN 61000-4-4:2004
1 kV power lines / 0.5 kV signal lines
IEC 61000-4-5:2005
EN 61000-4-5:2006
0.5 kV line-line / 1 kV line-ground
IEC 61000-4-6:2003 + A1:2004+ A2:2006
EN 61000-4-6:2007
3 V, 0.15-80 MHz, 80% AM
IEC 61000-4-11:2004
EN 61000-4-11:2004
0.5-300 cycle, 0% / 70%
Safety
Environment
ICES-001:2006 Group 1, Class A
AS/NZS CISPR11:2004
Group 1, Class A
European Council Directive 2006/95/EC
IEC 61010-1:2001 / EN 61010-1:2001
Measurement Category I
Pollution Degree 2
Indoor Use
CAN/CSA C22.2 No. 61010-1-04
Measurement Category I
Pollution Degree 2
Indoor Use
This product complies with the WEEE Directive (2002/96/EC) marking
requirements. The affi xed label indicates that you must not discard
this electrical/electronic product in domestic household waste.
Product Category: With reference to the equipment types in the
WEEE Directive Annex I, this product is classed as a “Monitoring
and Control instrumentation” product.
Do not dispose in domestic household waste.
To return unwanted products, contact your local Agilent offi ce, or
see www.agilent.com/environment/product/ for more information.
32
Page 33

Table 35. Analyzer environmental specifications and dimensions
Description General characteristics
Operating environment
Temperature +5 °C to +40 °C
Error-corrected temperature range 23 °C (±5 °C) with < 1 °C deviation from calibration temperature
Humidity 20% to 80% at wet bulb temperature < +29 °C (non-condensation)
Altitude 0 to 2,000 m (0 to 6561 feet)
Vibration 0.21 G maximum, 5 Hz to 500 Hz
Non-Operating storage environment
Temperature –10 °C to +60 °C
Humidity 20% to 90% at wet bulb temperature < +40 °C (non-condensation)
Altitude 0 to 4572 m (0 to 15,000 feet)
Vibration 0.5 G maximum, 5 Hz to 500 Hz
Dimensions See next page.
Weight (net)
Option 230/240/260/280 (2-port)
Option 235/245/265/285 (2-port)
Option 430/480/440/460 (4-port)
Option 435/445/465/485 (4-port)
Option 2D5/2K5 (2-port)
Option 4D5/4K5 (4-port)
18.2 kg
18.3 kg
19.9 kg
20.0 kg
19.8 kg
21.8 kg
33
Page 34

426
222
22
19
58 20 51 122 3727
Figure 3. Dimensions (front view, E5071C with Option 230/235/240/245/260/265/280/285,
in millimeters)
426
22
19
22
222
22
58 20 51 41 41 41 3727
Figure 4. Dimensions (front view, E5071C with Option 430/435/440/445/460/465/480/485,
in millimeters)
34
Page 35

426
58 20 51 122 3727
222
26
19
22
Figure 5. Dimensions (front view, E5071C with Option 2D5/2K5, in millimeters)
Figure 6. Dimensions (front view, E5071C with Option 4D5/4K5, in millimeters)
35
Page 36

18
215
15
235
13
222
472
417
32
23.4
424
472
32 417 23
14
21518
22213
235
1
148
109
422 1
25 25 16525
Figure 7. Dimensions (rear view with Option 1E5, in millimeters)
96128
271821
215
190
144
146
159
179
290252525
58
25
Figure 8. Dimensions (side view, E5071C Option 230/235/240/245/260/265/280/285/430/435/440/445/460/465/480/485
, in millimeters)
Figure 9. Dimensions (side view, E5071C with Option 2D5/2K5/4D5/4K5, in millimeters)
36
Page 37

Measurement Throughput Summary
Cycle time for measurement completion
1, 2
(ms)
Table 36. Option 230/235/240/245/260/265/280/285/430/435/440/445/
460/465/480/485
Sweep mode: Swept, analyzer display turned off with: DISP:ENAB OFF,
number of traces = 1, system error correction: OFF
Number of points
51 201 401 1601
Start 1 GHz, stop 1.2 GHz, 500 kHz IF bandwidth
Uncorrected 3.4 4.9 7.1 20
2-port cal 6.3 9.3 14 41
4-port cal 13 19 28 92
Start 1 GHz, stop 1.2 GHz, 100 kHz IF bandwidth
Uncorrected 3.7 5.2 7.3 20
2-port cal 6.6 10 15 42
4-port cal 13 21 32 94
Start 1 GHz, stop 1.2 GHz, 1 kHz IF bandwidth
Uncorrected 54 202 397 1563
2-port cal 107 401 792 3125
4-port cal 213 800 1581 6247
Start 100 kHz, stop 3 GHz, 500 kHz IF bandwidth
Uncorrected 8.7 11 12 25
2-port cal 17 21 24 48
4-port cal 34 42 49 102
Start 100 kHz, stop 3 GHz, 100 kHz IF bandwidth
Uncorrected 8.8 11 13 26
2-port cal 17 22 24 54
4-port cal 34 42 49 118
Start 100 kHz, stop 3 GHz, 1 kHz IF bandwidth
Uncorrected 56 206 404 1583
2-port cal 112 410 805 3163
4-port cal 222 818 1608 6324
1. Supplemental performance data.
2. Measured with fi rmware version A.09.30.
37
Page 38

Table 37. Option 230/235/240/245/260/265/280/285/430/435/440/445/
460/465/480/485
Start 100 kHz, stop 8.5 GHz, 500 kHz IF bandwidth
Uncorrected 15 18 19 24
2-port cal 28 35 38 48
4-port cal 55 69 74 104
Start 100 kHz, stop 8.5 GHz, 100 kHz IF bandwidth
Uncorrected 15 18 20 26
2-port cal 28 36 38 52
4-port cal 56 70 75 117
Start 100 kHz, stop 8.5 GHz, 1 kHz IF bandwidth
Uncorrected 57 207 404 1583
2-port cal 114 412 806 3163
4-port cal 225 821 1611 6324
(continued)
Number of points
51 201 401 1601
38
Page 39

Cycle time for measurement completion
1, 2
(ms)
Table 38. Option 230/235/240/245/260/265/280/285/430/435/440/445/
460/465/480/485
Sweep mode: Swept, analyzer display turned off with: DISP:ENAB OFF,
number of traces = 1, system error correction: ON
Number of Points
51 201 401 1601
Start 1 GHz, stop 1.2 GHz, 500 kHz IF bandwidth
Uncorrected 3.5 5.5 8.0 24
2-port cal 6.4 9.8 15 49
4-port cal 13 20 29 108
Start 1 GHz, stop 1.2 GHz, 100 kHz IF bandwidth
Uncorrected 3.6 5.4 8.0 23
2-port cal 6.6 11 16 48
4-port cal 13 22 33 107
Start 1 GHz, stop 1.2 GHz, 1 kHz IF bandwidth
Uncorrected 54 202 397 1563
2-port cal 107 401 792 3125
4-port cal 213 800 1581 6247
Start 100 kHz, stop 3 GHz, 500 kHz IF bandwidth
Uncorrected 8.7 11 13 28
2-port cal 18 21 24 53
4-port cal 34 42 49 112
Start 100 kHz, stop 3 GHz, 100 kHz IF bandwidth
Uncorrected 8.8 11 13 28
2-port cal 17 22 25 57
4-port cal 34 42 50 122
Start 100 kHz, stop 3 GHz, 1 kHz IF bandwidth
Uncorrected 56 206 404 1583
2-port cal 112 410 805 3163
4-port cal 222 818 1608 6324
1. Supplemental performance data.
2. Measured with fi rmware version A.09.30.
39
Page 40

Table 39. Option 230/235/240/245/260/265/280/285/430/435/440/445/
460/465/480/485
Start 100 kHz, stop 8.5 GHz, 500 kHz IF bandwidth
Uncorrected 15 18 20 27
2-port cal 28 35 38 52
4-port cal 55 69 74 111
Start 100 kHz, stop 8.5 GHz, 100 kHz IF bandwidth
Uncorrected 15 18 20 27
2-port cal 28 36 38 56
4-port cal 56 70 75 120
Start 100 kHz, stop 8.5 GHz, 1 kHz IF bandwidth
Uncorrected 57 207 404 1583
2-port cal 114 412 806 3163
4-port cal 225 821 1611 6324
(continued)
Number of points
51 201 401 1601
40
Page 41

Cycle time for measurement completion
1, 2
(ms)
Table 40. Option 230/235/240/245/260/265/280/285/430/435/440/445/
460/465/480/485
Sweep mode: Stepped, analyzer display turned off with: DISP:ENAB OFF,
number of traces = 1, system error correction: ON
Number of Points
51 201 401 1601
Start 1 GHz, stop 1.2 GHz, 500 kHz IF bandwidth
Uncorrected 4.4 7.7 12 29
2-port cal 8.2 15 22 56
4-port cal 16 29 45 126
Start 1 GHz, stop 1.2 GHz, 100 kHz IF bandwidth
Uncorrected 4.8 9.2 15 41
2-port cal 9.0 18 28 80
4-port cal 18 35 56 163
Start 1 GHz, stop 1.2 GHz, 1 kHz IF bandwidth
Uncorrected 54 202 397 1563
2-port cal 107 401 792 3125
4-port cal 213 800 1581 6247
Start 100 kHz, stop 3 GHz, 500 kHz IF bandwidth
Uncorrected 6.7 13 18 48
2-port cal 13 24 36 94
4-port cal 26 47 70 190
Start 100 kHz, stop 3 GHz, 100 kHz IF bandwidth
Uncorrected 7.1 14 22 60
2-port cal 14 27 42 119
4-port cal 27 53 82 237
Start 100 kHz, stop 3 GHz, 1 kHz IF bandwidth
Uncorrected 56 206 404 1583
2-port cal 112 410 805 3163
4-port cal 222 818 1608 6324
1. Supplemental performance data.
2. Measured with fi rmware version A.09.30.
41
Page 42

Table 41. Option 230/235/240/245/260/265/280/285/430/435/440/445/
460/465/480/485
Start 100 kHz, stop 8.5 GHz, 500 kHz IF bandwidth
Uncorrected 7.5 13 19 48
2-port cal 15 26 37 94
4-port cal 29 50 73 189
Start 100 kHz, stop 8.5 GHz, 100 kHz IF bandwidth
Uncorrected 7.9 15 22 60
2-port cal 16 29 43 120
4-port cal 30 56 85 237
Start 100 kHz, stop 8.5 GHz, 1 kHz IF bandwidth
Uncorrected 57 207 404 1583
2-port cal 114 412 806 3163
4-port cal 225 821 1611 6324
(continued)
Number of points
51 201 401 1601
42
Page 43

Cycle time for measurement completion
1, 2
(ms)
Table 42. Option 2D5/2K5/4D5/4K5
Sweep mode: Swept, analyzer display turned off with: DISP:ENAB OFF,
number of traces = 1, system error correction: OFF
Number of points
51 201 401 1601
Start 300 kHz, stop 20 GHz, 500 kHz IF bandwidth
Uncorrected 23 36 39 43
2-port cal 45 71 77 85
4-port cal 88 142 155 169
Start 300 kHz, stop 20 GHz, 100 kHz IF bandwidth
Uncorrected 23 37 40 43
2-port cal 45 72 78 86
4-port cal 89 144 156 171
Start 300 kHz, stop 20 GHz, 1 kHz IF bandwidth
Uncorrected 60 212 410 1591
2-port cal 120 421 817 3180
4-port cal 237 840 1632 6358
Start 8 GHz, stop 18 GHz, 500 kHz IF bandwidth
Uncorrected 17 22 22 23
2-port cal 34 42 44 45
4-port cal 67 83 86 102
Start 8 GHz, stop 18 GHz, 100 kHz IF bandwidth
Uncorrected 18 22 23 24
2-port cal 34 42 44 47
4-port cal 67 84 87 106
Start 8 GHz, stop 18 GHz, 1 kHz IF bandwidth
Uncorrected 58 207 405 1583
2-port cal 115 413 807 3163
4-port cal 229 823 1612 6324
1. Supplemental performance data.
2. Measured with fi rmware version A.09.30.
43
Page 44

Table 43. Option 2D5/2K5/4D5/4K5 (continued)
Number of points
51 201 401 1601
Start 11 GHz, stop 12 GHz, 500 kHz IF bandwidth
Uncorrected 3.0 3.2 4.9 17
2-port cal 5.6 6.1 9.9 37
4-port cal 11 14 23 84
Start 11 GHz, stop 12 GHz, 100 kHz IF bandwidth
Uncorrected 3.0 3.4 5.5 18
2-port cal 5.6 6.4 11 38
4-port cal 11 14 24 85
Start 11 GHz, stop 12 GHz, 1 kHz IF bandwidth
Uncorrected 52 200 396 1566
2-port cal 104 399 790 3130
4-port cal 206 795 1578 6258
44
Page 45

Cycle time for measurement completion
1, 2
(ms)
Table 44. Option 2D5/2K5/4D5/4K5
Sweep mode: Swept, analyzer display turned off with: DISP:ENAB OFF,
number of traces = 1, system error correction: ON
Number of points
51 201 401 1601
Start 300 kHz, stop 20 GHz, 500 kHz IF bandwidth
Uncorrected 23 36 39 43
2-port cal 45 71 77 85
4-port cal 88 142 155 170
Start 300 kHz, stop 20 GHz, 100 kHz IF bandwidth
Uncorrected 23 37 40 43
2-port cal 45 72 78 86
4-port cal 89 144 156 171
Start 300 kHz, stop 20 GHz, 1 kHz IF bandwidth
Uncorrected 60 212 410 1591
2-port cal 120 421 817 3180
4-port cal 237 840 1632 6358
Start 8 GHz, stop 18 GHz, 500 kHz IF bandwidth
Uncorrected 17 22 22 23
2-port cal 34 42 44 48
4-port cal 67 83 86 107
Start 8 GHz, stop 18 GHz, 100 kHz IF bandwidth
Uncorrected 18 22 23 24
2-port cal 34 42 44 49
4-port cal 67 83 87 110
Start 8 GHz, stop 18 GHz, 1 kHz IF bandwidth
Uncorrected 58 207 405 1583
2-port cal 115 413 807 3163
4-port cal 229 823 1612 6324
1. Supplemental performance data.
2. Measured with fi rmware version A.09.30.
45
Page 46

Table 45. Option 2D5/2K5/4D5/4K5 (continued)
Number of points
51 201 401 1601
Start 11 GHz, stop 12 GHz, 500 kHz IF bandwidth
Uncorrected 3.0 3.4 5.9 20
2-port cal 5.6 6.6 12 43
4-port cal 11 14 26 98
Start 11 GHz, stop 12 GHz, 100 kHz IF bandwidth
Uncorrected 3.0 3.5 5.8 20
2-port cal 5.6 6.8 12 43
4-port cal 11 15 26 98
Start 11 GHz, stop 12 GHz, 1 kHz IF bandwidth
Uncorrected 52 200 396 1566
2-port cal 104 399 790 3130
4-port cal 206 795 1578 6258
46
Page 47

Cycle time for measurement completion
1, 2
(ms)
Table 46. Option 2D5/2K5/4D5/4K5
Sweep mode: Stepped, analyzer display turned off with: DISP:ENAB OFF,
number of traces = 1, system error correction: ON
Number of points
51 201 401 1601
Start 300 kHz, stop 20 GHz, 500 kHz IF bandwidth
Uncorrected 11 18 24 56
2-port cal 21 35 48 112
4-port cal 41 69 94 222
Start 300 kHz, stop 20 GHz, 100 kHz IF bandwidth
Uncorrected 11 20 28 69
2-port cal 22 38 54 137
4-port cal 42 75 107 272
Start 300 kHz, stop 20 GHz, 1 kHz IF bandwidth
Uncorrected 60 212 410 1591
2-port cal 120 421 817 3180
4-port cal 237 840 1632 6358
Start 8 GHz, stop 18 GHz, 500 kHz IF bandwidth
Uncorrected 8.4 14 19 48
2-port cal 17 27 38 94
4-port cal 32 52 74 188
Start 8 GHz, stop 18 GHz, 100 kHz IF bandwidth
Uncorrected 8.8 15 22 60
2-port cal 17 30 44 120
4-port cal 34 58 86 237
Start 8 GHz, stop 18 GHz, 1 kHz IF bandwidth
Uncorrected 58 207 405 1583
2-port cal 115 413 807 3163
4-port cal 229 823 1612 6324
1. Supplemental performance data.
2. Measured with fi rmware version A.09.30.
47
Page 48

Table 47. Option 2D5/2K5/4D5/4K5 (continued)
Number of points
51 201 401 1601
Start 11 GHz, stop 12 GHz, 500 kHz IF bandwidth
Uncorrected 2.8 6.4 11 31
2-port cal 5.1 13 21 61
4-port cal 9.6 24 41 131
Start 11 GHz, stop 12 GHz, 100 kHz IF bandwidth
Uncorrected 3.4 8.0 14 43
2-port cal 5.9 16 27 86
4-port cal 12 30 53 171
Start 11 GHz, stop 12 GHz, 1 kHz IF bandwidth
Uncorrected 52 200 396 1566
2-port cal 104 399 790 3130
4-port cal 206 795 1578 6258
48
Page 49

Cycle time (ms)
1, 2
vs. number of points
Table 48. Option 230/235/240/245/260/265/280/285/430/435/440/445/
460/465/480/485
Start 1 GHz, stop 1.2 GHz, 500 kHz IF bandwidth, error correction: OFF,
display update: OFF, number of traces = 1
Sweep mode:
Number of
points
Fast swept,
system error
correction: OFF
3 3.1 3.1 3.4
11 3.3 3.3 3.3
51 3.5 3.5 4.4
101 3.9 4.1 5.6
201 4.9 5.5 7.7
401 7.1 8.0 12
801 12 14 18
1601 20 24 29
Cycle time (ms)
1, 2
vs. number of points
Sweep mode:
Fast swept,
system error
correction: ON
Sweep mode:
Std stepped,
system error
correction: ON
Table 49. Option 2D5/2K5/4D5/4K5
Start 11 GHz, stop 12 GHz, 500 kHz IF bandwidth, error correction: OFF,
display update: OFF, number of traces = 1
Sweep mode:
Number of
points
Fast swept,
system error
correction: OFF
51 3.0 3.0 2.8
201 3.2 3.4 6.5
401 4.9 5.9 11
1601 17 20 31
1. Supplemental performance data.
2. Measured with fi rmware version A.09.30.
Sweep mode:
Fast swept,
system error
correction: ON
49
Sweep mode:
Std stepped,
system error
correction: ON
Page 50

Cycle time (ms)
1, 2
vs. IF bandwidth
Table 50. All options
Sweep mode: Swept, analyzer display turned off with: DISP:ENAB OFF,
number of traces = 1, system error correction: OFF, NOP = 201
Option 230/235/240/245/260/265/280/
285/430/435/440/445/460/465/480/485
Frequency
[Hz]
4 G 500000 5.0 10 G 500000 2.8
4 G 400000 5.0 10 G 400000 2.8
4 G 300000 4.9 10 G 300000 2.8
4 G 200000 4.9 10 G 200000 2.8
4 G 150000 4.9 10 G 150000 2.8
4 G 100000 5.0 10 G 100000 3.0
4 G 70000 5.7 10 G 70000 3.8
4 G 50000 6.9 10 G 50000 4.9
4 G 40000 7.8 10 G 40000 5.9
4 G 30000 9.4 10 G 30000 7.5
4 G 20000 13 10 G 20000 11
4 G 15000 16 10 G 15000 14
4 G 10000 23 10 G 10000 21
4 G 7000 31 10 G 7000 29
4 G 5000 42 10 G 5000 40
4 G 4000 52 10 G 4000 50
4 G 3000 68 10 G 3000 66
4 G 2000 100 10 G 2000 98
4 G 1500 133 10 G 1500 132
4 G 1000 198 10 G 1000 196
4 G 700 278 10 G 700 276
4 G 500 391 10 G 500 389
4 G 400 487 10 G 400 485
4 G 300 648 10 G 300 646
4 G 200 970 10 G 200 968
4 G 150 1291 10 G 150 1289
4 G 100 1935 10 G 100 1933
4 G 70 2739 10 G 70 2739
4 G 50 3864 10 G 50 3869
4 G 40 4829 10 G 40 4837
4 G 30 6437 10 G 30 6449
4 G 20 9653 10 G 20 9671
4 G 15 12870 10 G 15 12892
4 G 10 19302 10 G 10 19330
IFBW
[Hz]
Cycle time
[ms]
Option 2D5/2K5/4D5/4K5
Frequency
[Hz]
IFBW
[Hz]
Cycle time
[ms]
1. Supplemental performance data.
2. Measured with fi rmware version A.09.30.
50
Page 51

Data transfer time
1, 2
(ms)
Table 51. All options
Number of points
51 201 401 1601
SCPI over GPIB
64-bit fl oating point 4 12 25 88
32-bit fl oating point 3 7 13 45
ASCII 30 108 223 841
SCPI over 100 Mbps LAN (Telnet)
REAL 64 1 1 2 4
REAL 32 1 1 1 2
ASCII 15 59 117 457
SCPI over 100 Mbps LAN (SICL-LAN)
REAL 64 3 3 4 6
REAL 32 3 3 3 5
ASCII 4 8 14 47
SCPI over USB (SICL-USB)
REAL 64 2 2 2 3
REAL 32 2 2 2 3
ASCII 4 13 24 91
SCPI over GPIB/USB (82357B)
REAL 64 8 15 21 68
REAL 32 7 10 13 37
ASCII 75 290 579 2313
4
COM
Variant type 1 1 1 1
3
3
3
3
1. Supplemental performance data.
2. Measured with fi rmware version A.09.30.
3. Measured using a VEE Pro 7.0 program running on a 3.2 GHz Pentium 4 DELL Precision 370,
Transferred complex S
4. Measured using an E5071C VBA macro running inside the analyzer. Transferred complex S11 data.
data, using :CALC{1-36}:DATA:FDAT?.
11
51
Page 52

E5092A Configurable multiport test set
The section provides test input/output performance without calibration by the E5071C.
Table 52. Test set input/output performance
Description Specifi cation Typical
Frequency range 50 MHz to 20 GHz
Damage level 20 dBm, ±35 VDC
Table 53. Option E5092A-020 port performance
Description Specifi cation Typical
Load match (selected port)
SPDT switch
1
50 MHz to 2 GHz
2 GHz to 4 GHz
4 GHz to 8 GHz
8 GHz to 10 GHz
10 GHz to 18 GHz
18 GHz to 20 GHz
SP4T switch
50 MHz to 2 GHz
2 GHz to 3 GHz
3 GHz to 8 GHz
8 GHz to 10 GHz
10 GHz to 18 GHz
18 GHz to 20 GHz
Load match (unselected port)
SPDT switch
50 MHz to 3 GHz
3 GHz to 10 GHz
10 GHz to 16 GHz
16 GHz to 18 GHz
18 GHz to 20 GHz
SP4T switch
50 MHz to 3 GHz
3 GHz to 10 GHz
10 GHz to 16 GHz
16 GHz to 18 GHz
18 GHz to 20 GHz
2
1
2
17 dB
11 dB
8 dB
7 dB
4 dB
4 dB
17 dB
11 dB
8 dB
7 dB
4 dB
4 dB
17 dB
11 dB
8 dB
6 dB
4 dB
17 dB
11 dB
8 dB
6 dB
4 dB
1. SPDT: Single-pole-double-throw switches. Applies to SW5, SW6, SW7, SW8, SW9 and SW10 in the E5092A. (See Figure 20.)
2. SP4T: Single-pole-four-throw switches. Applies to SW1, SW2, SW3 and SW4 in the E5092A. (See Figure 20.)
52
Page 53

Table 54. Option E5092A-020 port performance (continued)
Description Specifi cation Typical
Load match (common port)
SPDT switch
50 MHz to 2 GHz
2 GHz to 4 GHz
4 GHz to 8 GHz
8 GHz to 10 GHz
10 GHz to 20 GHz
SP4T switch
50 MHz to 1.3 GHz
1.3 GHz to 4 GHz
4 GHz to 8 GHz
8 GHz to 10 GHz
10 GHz to 20 GHz
Insertion loss
SPDT switch
50 MHz to 100 MHz
100 MHz to 2 GHz
2 GHz to 3 GHz
3 GHz to 4 GHz
4 GHz to 6 GHz
6 GHz to 8 GHz
8 GHz to 10 GHz
10 GHz to 14 GHz
14 GHz to 18 GHz
18 GHz to 20 GHz
SP4T switch
50 to 100 MHz
100 MHz to 2 GHz
2 GHz to 3 GHz
3 GHz to 4 GHz
4 GHz to 6 GHz
6 GHz to 8 GHz
8 GHz to 10 GHz
10 GHz to 14 GHz
14 GHz to 18 GHz
18 GHz to 20 GHz
Stability per switch
Condition: Enviroment Temperature +23 °C ±3 °C and Internal DC source: ≤ 100 mA
(Sum of 4 channels), no heat source and no wall close to the unit.
50 M to 4 GHz
4 G to 12 GHz
12 G to 20 GHz
Condition: besides the above
50 M to 4 GHz
4 G to 12 GHz
12 G to 20 GHz
Isolation
50 MHz to 500 MHz
500 MHz to 1 GHz
1 GHz to 2 GHz
2 GHz to 6 GHz
6 GHz to 10 GHz
10 GHz to 18 GHz
18 GHz to 20 GHz
1
16 dB
11 dB
8 dB
7 dB
4 dB
2
16 dB
11 dB
8 dB
7 dB
4 dB
1
4 dB
3.5 dB
4.5 dB
5 dB
5.5 dB
7 dB
8 dB
8.5 dB
10 dB
11.5 dB
2
4 dB
3.5 dB
4.5 dB
5.5 dB
6 dB
7.5 dB
8.5 dB
9.5 dB
10.5 dB
12 dB
0.003 dB/°C (SPD)
0.005 dB/°C (SPD)
0.008 dB/°C (SPD)
0.007 dB/°C (SPD)
0.012 dB/°C (SPD)
0.017 dB/°C (SPD)
3
65 dB
80 dB
85 dB
90 dB
85 dB
75 dB
65 dB
(Over arbitrarily test ports)
1. SPDT: Single-pole-double-throw switches. Applies to SW5, SW6, SW7, SW8, SW9 and SW10 in the E5092A. (See Figure 20.)
2. SP4T: Single-pole-four-throw switches. Applies to SW1, SW2, SW3 and SW4 in the E5092A. (See Figure 20.)
3. This specifi cation is defi ned when all ports are terminated with a 50 ohm load.
53
Page 54

Table 55. Control line
Description Specifi cation Typical
Number of groups 4
Group A: 8 bits
Group B,C,D: 4 bits
Input voltage range
Maximum current
Impedance Group A, B: < 10 ohm
1
0 V to +5 V (positive input)
–5 V to 0 V (negative input)
Group A, B: 50 mA in total of each group
Group C, D: 500 uA in total of each group
Group C, D: < 200 ohm
Table 56. DC source
Description Specifi cation Typical
Number of sources 4
Output voltage range
Output voltage accuracy ±3 % of setting (+1 V to +5 V) at
1 M ohm load impedance
Voltage resolution 10 mV (nominal)
Maximum current 150 mA for each source
0 V to +5.2 V (nominal)
3
2
Output impedance < 5 ohm
Table 57. Operating storage environment
Description General characteristics
Temperature +5 °C to +40 °C
Humidity 20 to 80 % at wet bulb temperature
< +29 °C (non-condensing)
Altitude 0 to 2,000m (0 to 6,561 feet)
Vibration 0.21 G max., 5 to 500 Hz
Table 58. Non-operating storage environment
Description General characteristics
Temperature –10 °C to +60 °C
Humidity 20 to 90 % at wet bulb temperature
< +40 °C (non-condensing)
Altitude 0 to 4,572 m (0 to 15,000 feet)
Vibration 0.5 G max., 5 Hz to 500 Hz
1. Input voltage will be clipped at about ±5.2 V when over this range.
2. The output voltage can be set in this range.
3. The output voltage resolution becomes effective between 0 V to 5.2 V.
54
Page 55

Table 59. Front panel information
426
129
192
133
18
Description General characteristics
RF connectors SMA (Female)
Test ports 38 ports
Control line 15-pin D-sub, female
25-pin D-sub, female
Table 60. Rear panel information
Description General characteristics
USB port Type B-receptacle, provide
connection to the E5071C
Line power
Frequency
Voltage
VA max
1
47 to 63 Hz
90 to 132 VAC, or 198 to 264 VAC
(automatically switched)
300 VA max.
Table 61. Test set dimensions and block diagram
Description General characteristics
Dimensions
E5092A Option 020 See Figures 16, 17, 18 and 19
Weight
E5092A Option 020 9 kg
Figure 10. Dimensions (front view, with Option E5092A-020, in millimeters, nominal)
1. 1A third-wire ground is required.
55
Page 56

Figure 11. Dimensions (pitch between switches, with Option E5092A-020, in millimeters, nominal)
129 37
133
51
83
36.8
132.72
18.57
17
27
27
65.34
23.38
23.38
40.640.640.6
13.5
27 69.8
272727
27 27.8
146
18 126
144
472
23
417
32 22
Figure 12. Dimensions (rear view, with Option E5092A-020, in millimeters, nominal)
Figure 13. Dimensions (side view, with Option E5092A-020, in millimeters, nominal)
56
Page 57

Figure 14. Switch confi guration (E5092A-020)
SW6
6A 6B
6COM
SW7
7COM
7A 7B
SW8
8A 8B
8COM
SW9
9COM
9A 9B
SW10
10A 10B
10COM
SW5
5A
5COM
5B
SW1
1A 1B 1C 1D
PORT 1
SW2
2A 2B 2C 2D
PORT 2
SW3
3A 3B 3C 3D
PORT 3
SW4
4A 4B 4C 4D
PORT 4
DC Source (Group A)
Max Current
Output
Voltage
DC Source Output
Output
Impedance
Positive Input
(High)
Negative Input
(Low)
Control Line 1 (Group A)
Impedance
Control Line 1 (Group A)
Control Line 2 (Group A)
Control Line 3 (Group A)
Control Line 4 (Group A)
::
Control Line 8 (Group A)
:
DC Source (Group B)
DC Source Output
DC Source (Group C)
DC Source Output
DC Source (Group D)
DC Source Output
Figure 15. DC control line (E5092A-020)
Positive Input (High)
Negative Input (Low)
Positive Input (High)
Negative Input (Low)
Positive Input (High)
Negative Input (Low)
Control Line 2 (Group B)
Control Line 2 (Group C)
Control Line 2 (Group D)
Control Line 1 (Group B)
Control Line 2 (Group B)
Control Line 3 (Group B)
Control Line 4 (Group B)
Control Line 1 (Group C)
Control Line 2 (Group C)
Control Line 3 (Group C)
Control Line 4 (Group C)
Control Line 1 (Group D)
Control Line 2 (Group D)
Control Line 3 (Group D)
Control Line 4 (Group D)
57
Page 58

D-SUB 25pin
assignment
Line 4
Line 3
Line 2
Line 1
Line 4
Line 3
Line 2
Line 1
Positive input
Positive input
Negative input
GND
DC source
GND
DC source
23 22 21 20 19 18 17
12
GND
Negative input
24
GND
25
13 111098765
Line 4
Negative input
16
4
Line 3
Positive input
15
3
Line 2
DC source
14
2
Line 1
1
GROUP B GROUP C GROUP D
GROUP B GROUP C GROUP D
Line 8
Line 7
Line 6
Line 5
Line 4
Line 3
Line 2
Line1
GND
Reserved
DC source
Positive input
Negative input
Reserved
Reserved
15 14 13 12 11 10 9
87654321
GRO UP A
GRO UP A
D-SUB 15 pin
assignment
Figure 16. Control line pin assignment (E5092A-020)
58
Page 59

10 MHz to 3 GHz
S11 = S22 = 0; Source power = –10 dBm
Transmission using 85036E and 11852B
Transmission coefficient (dB)
10
1
0.1
0.01
Mag (dB)
10 0 –10 –20 –30 –40 –50 –60 –70 –80 –90
10 MHz to 3 GHz
S11 = S22 = 0; Source power = –10 dBm
Transmission using 85036E and 11852B
Transmission coefficient (dB)
100
10
1
0.1
Phase (deg)
10 0 –10 –20 –30 –40 –50 –60 –70 –80 –90
10 MHz to 3 GHz
S21 = S12 = 0; Source power = –10 dBm
Reflection using 85036E and 11852B
Reflection coefficient (linear)
10
8
6
4
2
0
Phase (deg)
0 0.2 0.4 0.6 0.8 1
10 MHz to 3 GHz
S21 = S12 = 0; Source power = –10 dBm
Reflection using 85036E and 11852B
Reflection coefficient (linear)
0.1
0.08
0.06
0.04
0.02
0
Mag (linear)
0 0.2 0.4 0.6 0.8 1
Corrected System Performance for 75 Ω Measurements with 11852B
50 to 75 Ω Minimum-Loss Pads (Supplemental Information)
Option 230/235/240/245/260/265/280/285/430/435/440/445/
460/465/480/485
Table 62. Corrected system performance with type-N 75 Ω device connectors,
85036E calibration kit
Network analyzer: E5071C
calibration kit: 85036E (type-N 75 Ω)
50 to 75 Ω adapters: 11852B
calibration: full 2-port
IF bandwidth = 10 Hz, no averaging applied to data, environmental temperature = 23 °C
±5 °C with < 1 °C deviation from calibration temperature, isolation calibration performed
Typical (dB)
Description 10 MHz to 3 GHz
Directivity 37
Source match 33
Load match 39
Reflection tracking ±0.015
Transmission tracking ±0.019
Transmission uncertainty 10 MHz to 3 GHz (typical)
Magnitude
Reflection uncertainty 10 MHz to 3 GHz (typical)
Magnitude
Phase
Phase
59
Page 60

www.agilent.com
www.agilent.com/find/ena
Agilent Email Updates
www.agilent.com/find/emailupdates
Get the latest information on the
products and applications you select.
www.lxistandard.org
LAN eXtensions for Instruments puts
the power of Ethernet and the Web
inside your test systems. Agilent is a
founding member of the LXI consortium.
Agilent Channel Partners
www.agilent.com/find/channelpartners
Get the best of both worlds: Agilent’s
measurement expertise and product
breadth, combined with channel
partner convenience.
Agilent Advantage Services is committed
to your success throughout your equipment’s lifetime. To keep you competitve,
we continually invest in tools and
processes that speed up calibration and
repair and reduce your cost of ownership.
You can also use Infoline Web Services
to manage equipment and services more
effectively. By sharing our measurement
and service expertise, we help you create
the products that change our world.
www.agilent.com/find/advantageservices
www.agilent.com/quality
For more information on Agilent Technologies’ products, applications or services,
please contact your local Agilent office.
The complete list is available at:
www.agilent.com/find/contactus
Americas
Canada (877) 894 4414
Brazil (11) 4197 3500
Mexico 01800 5064 800
United States (800) 829 4444
Asia Pacific
Australia 1 800 629 485
China 800 810 0189
Hong Kong 800 938 693
India 1 800 112 929
Japan 0120 (421) 345
Korea 080 769 0800
Malaysia 1 800 888 848
Singapore 1 800 375 8100
Taiwan 0800 047 866
Other AP Countries (65) 375 8100
Europe & Middle East
Belgium
32 (0) 2 404 93 40
Denmark 45 70 13 15 15
Finland 358 (0) 10 855 2100
France 0825 010 700*
*0.125 €/minute
Germany
49 (0) 7031 464 6333
Ireland 1890 924 204
Israel 972-3-9288-504/544
Italy 39 02 92 60 8484
Netherlands 31 (0) 20 547 2111
Spain 34 (91) 631 3300
Sweden 0200-88 22 55
United Kingdom 44 (0) 131 452 0200
For other unlisted Countries:
www.agilent.com/find/contactus
Revised: June 8, 2011
Product specifications and descriptions
in this document subject to change
without notice.
© Agilent Technologies, Inc. 2011
Published in USA, July 5, 2011
5989-5479EN
 Loading...