

Page 1

Agilent
E5052A Signal Source Analyzer
10 MHz to 7, 26.5, or 110 GHz
Data Sheet
Page 2

2
Phase Noise Measurement
Table 1-1. Phase noise measurement
Description Specifications
Frequency range 10 MHz to 7 GHz
Frequency bands 10 M to 41 MHz
39 M to 101 MHz
99 M to 1.5 GHz
300 M to 7 GHz
Offset frequency range
Carrier > 400 MHz 1 Hz to 40 MHz (standard)
10 Hz to 40 MHz (Option E5052A-011)
39 MHz ≤ Carrier ≤ 99 MHz 1 Hz to 20 MHz (standard)
10 Hz to 20 MHz (Option E5052A-011)
10 MHz ≤ Carrier ≤ 39 MHz 1 Hz to 5 MHz (standard)
10 Hz to 5 MHz (Option E5052A-011)
Enhanced phase noise sensitivity1Cross-correlation method (standard)
Number of correlation: 1 to 10,000
Frequency tracking range 0.4% of carrier frequency
IF gain 0, 10, 20, 30, 40, 50 dB (standard)
0, 10, 20 dB (E5053A-011)
Input level
10 to 30 MHz –15 to +20 dBm
30 MHz to 7 GHz –20 to +20 dBm
Built-in LO phase noise optimization < 150 kHz (optimized for close-in phase noise)
> 150 kHz (optimized for far-out phase noise)
See Figure 1-2
Accuracy
1 to 100 Hz offset < ± 4 dB (typical)
100 to 1 kHz offset < ± 4 dB (typical)
1 k to 1 MHz offset < ± 2 dB (typical)
1 M to 40 MHz offset < ± 3 dB (typical)
SSB phase noise sensitivity See Table 1-2 through Table 1-4, Figure 1-1 through Figure 1-3
Spurious level 65 dBc (typical) > 1 kHz offset
Measurement time See Table 1-5
1. Not available for E5052A-011.
Definitions
All specifications apply over a 18 °C to 28 °C range
(unless otherwise stated) and 30 minutes after
the instrument has been turned on. All specified
and supplemental values for RF input signals are
applicable to sinusoidal-wave carriers unless
otherwise noted.
Supplemental information is intended to provide
information that is helpful for using the instrument
but that is not guaranteed by the product warranty.
This information is denoted as either typical or
nominal.
Specification (spec.): Warranted performance.
Specifications include guardbands to account for
the expected statistical performance distribution,
measurement uncertainties, and changes in
performance due to environmental conditions.
Typical (typ.): Expected performance of an average
unit that does not include guardbands. It is not
guaranteed by the product warranty.
Nominal (nom.): A general, descriptive term that
does not imply a level of performance. It is not
guaranteed by the product warranty.
Page 3

3
Table 1-4. SSB phase noise sensitivity improvement by correlation
Number of correlation 10 100 1000 10000
Improvement factor 5 dB 10 dB 15 dB 20 dB
Table 1-2. SSB phase noise sensitivity (standard, < 150 kHz optim., correlation = 1, + 5 dBm input, start frequency = 1 Hz,
measurement time = 17.7 sec)
Table 1-3. SSB phase noise sensitivity (Option E5052A-011, < 150 kHz optim., + 5 dBm input, start frequency = 10 Hz,
measurement time = 4.4 sec)
Offset from carrier (Hz)
Input frequency
10 MHz
Spec.
Typ.
100 MHz
Spec.
Typ.
1 GHz
Spec.
Typ.
3 GHz
Spec.
Typ.
7 GHz
Spec.
Typ.
1 10 100 1 k 10 k 100 k 1 M 10 M 40 M
—
—
-74.0
-114.0
-148.5 -156.5 -166.5 -168.5
-144.5 -152.5 -160.5 -170.5 -172.5
-148.5 -156.5 -163.5 -168.5 -170.0
-54.0
-94.0 -135.5 -152.5 -160.5 -167.5 -172.5 -174.0
-128.5 -137.5 -144.5 -160.5 -170.0 -170.5
-34.0
-77.0 -115.5 -132.5 -141.5 -148.5 -164.5 -174.0 -174.5
-119.0 -128.0 -133.7 -149.7 -163.2 -166.7
-24.5
-64.5 -106.0 -123.0 -132.0 -137.7 -153.7 -167.2 -170.7
-111.6 -120.6 -127.0 -143.0 -156.5 -160.0
-17.1
-57.1
-98.6 -115.6 -124.6 -131.0 -147.0 -160.5 -164.0
—
—
—
—
Offset from carrier (Hz)
Input frequency
10 MHz
100 MHz
1 GHz
3 GHz
7 GHz
Spec. -145.5 -153.5 -160.0 -160.0
Typ. -106.0 -138.5 -149.5 -157.5 -167.5 -169.5
Spec. -145.5 -153.5 -160.0 -160.0
Typ. -94.0 -132.5 -149.5 -157.5 -164.5 -169.5
Spec. -125.5 -134.5 -141.5 -157.5
Typ. -74.0 -112.5 -129.5 -138.5 -145.5 -161.5
Spec. -116.0 -125.0 -130.7 -146.7
Typ. -64.5 -103.0 -120.0 -129.0 -134.7 -150.7 -164.2 -167.7
Spec. -108.6 -117.6 -124.0 -140.0 -153.5 -157.0
Typ. -57.1 -95.6 -112.6 -121.6 -128.0 -144.0 -157.5 -161.0
10 100 1 k 10 k 100 k 1 M 10 M 40 M
—
—
-160.0
-170.0
-160.0
-170.0
-160.0
—
—
—
—
-160.0
-170.0
-160.0
Page 4

4
Figure1-4. SSB phase noise sensitivity of different LO optimization
(typical)( standard, correlation = 1, carrier frequency = 1 GHz, start
offset frequency = 1 Hz, +5 dBm input, measurement time = 17.7 sec)
Figure1-2. SSB phase noise sensitivity (E5052A-011, typical)
(standard, < 150 kHz optim., +5 dBm input, start offset frequency
= 10 Hz, measurement time = 4.4 sec)
Figure1-3. SSB phase noise sensitivity improved with the crosscorrelation function (typical) (standard, improvement with the
correlation, carrier frequency = 1 GHz, < 150 kHz optim., +5 dBm input)
Figure1-1. SSB phase noise sensitivity (typical)
(standard, < 150 kHz optim., correlation = 1, +5 dBm input,
start offset frequency = 1 Hz, measurement time = 17.7 sec)
Page 5

5
Table 1-5. Typical measurement time (sec) for phase noise
measurement
1
Table 1-6. Measurement capabilities
Phase noise
Measurement parameters SSB phase noise, spurious, integrated
phase noise, rms noise, rms jitter,
residual FM
Number of trace 1 data trace and 1 memory trace
Data formats dBc/Hz (SSB phase noise), dBc
(spurious), rms degree, rms radian
(rms noise), sec (rms jitter), Hz rms
(residual FM)
Measurement trigger Set to continuous, hold, or single,
sweep with internal, external,
manual, or bus trigger
Frequency, RF Power, DC Current Measurements
Table 1-7. Frequency measurement
Description Specifications
Frequency range 10 M to 1.5 GHz
300 M to 7 GHz
Resolution 10 Hz, 1 kHz, 64 kHz
Internal time base stability ± 5 ppm
Accuracy ± (resolution + time base accuracy)
Table 1-8. RF power measurement
Description Specifications
Frequency range band 10 M to 1.5 GHz
300 M to 7 GHz
Input level
10 MHz to 30 MHz -15 dBm to +20 dBm
30 MHz to 7 GHz -20 dBm to +20 dBm
Resolution 0.01 dB
Accuracy (peak voltage response)
30 MHz to 3 GHz, > -10 dBm ± 0.5 dB
Other than the above ± 1 dB
Table 1-9. DC current measurement
Description Specifications
Current range 0 to 80 mA
Resolution 10 µA
Accuracy ± (0.2% of reading + 160 µA)
Table 1-10. Frequency, RF power, DC current measurements (standard)
Frequency, power, and DC current (for standard)
Measurement Analyzer mode:
parameters Frequency versus DC control voltage, dF / dV
control (tuning sensitivity)
Frequency versus DC power voltage
(frequency pushing), dF / dV power
RF power versus DC control voltage
RF power versus DC power voltage
DC current (at DC power port only)
versus DC control voltage
DC current (at DC power port only)
versus DC power voltage
Tester mode:
Frequency, power, and DC current
(at DC power port)
Number of points 2 to 1001
Data formats Frequency: Hz, dHz, %, ppm, Hz/V
RF Power: dBm
DC Current: A
Measurement
trigger Set to continuous, hold, or single, sweep with
internal, external, manual, or bus trigger
Table 1-11. Frequency, power, and DC current (Option E5052A-011)
Frequency, power, and DC current (Option E5052A-011)
Measurement Frequency, power and DC current (at DC power
parameters port) (numerical display only)
Data format Frequency: Hz, dHz, %, ppm, Hz/V
RF Power: dBm
DC Current: A
Measurement Set to continuous, hold, or single with internal,
trigger external, manual, or bus trigger
1. Measurement time (sec) = 0.2 + the above value x number of correlation when applying
cross-correlation function (standard ONLY). For E5052-011, number of correlation = 1.
Stop frequency (Hz)
100 k
1 M
10 M
40 M
Start frequency (Hz)
1 10 100 1k
10.9 2.7 0.34 0.04
10.7 2.7 0.34 0.04
11.1 2.8 0.35 0.04
17.7 4.4 0.56 0.07
Page 6

Transient Measurement
Table 1-12. Transient measurement
Description Specifications
Measurement function Frequency, power, phase
Target frequency range 10 MHz to 7 GHz
Input power level -20 to +20 dBm
Frequency bandwidth
Wide band See Table 1-13
Narrow band 3.125 kHz, 25 kHz, 200 kHz, 1.6 MHz,
or 25.6 MHz
Span (measurement time) 10 µsec to 100 msec, 1, 2, 5 step
Time resolution 10 nsec to 100 µsec
Frequency transient measurement
Accuracy ± (frequency resolution
1
+ time
base accuracy)
Power transient measurement
Range -20 to +20 dBm
Accuracy ± 2 dB (typical)
Resolution 0.1 dB (typical)
Phase transient measurement
2, 3
Accuracy 0.1 deg/GHz (0.1 deg min.) (typical)
Trace noise 0.02 deg/GHz (0.02 deg min.) (typical)
Stability 10 deg/sec (typical)
Pre-trigger delay -80% of span (measurement time)
to +1 sec maximum
Table 1-13. Wide band frequency selection table
Table 1-14-1. Wide band transient (Time span, time resolution and number of points)
Measurement 10 µ 20 µ 50 µ 100 µ 200 µ 500 µ 1 m 2 m 5 m 10 m 20 m 50 m 100 m 200 m 500 m 1 2 5
time (sec)
Time resolution 0.01 0.02 0.05 0.1 0.2 0.5 1 2 6.25 12.5 25 62.5 125 250 625 1250 2500 6250
(µsec)
Number 1001 1001 1001 1001 1001 1001 1001 1001 801 801 801 801 801 801 801 801 801 801
of point
Table 1-14-2. Frequency resolution (Hzrms) of wide band transient
Transient Time span (sec)
frequency
band (MHz) 10 µ to 100 µ 200 µ 500 µ 1 m to 100 m 200 m to 5
50 to 150 28 k 10 k 3 k 1 k 313
100 to 300 56 k 20 k 7 k 2 k 313
200 to 600 113 k 40 k 14 k 5 k 313
300 to 900 169 k 60 k 21 k 7 k 313
400 to 1200 226 k 80 k 28 k 10 k 313
500 to 1500 282 k 100 k 35 k 12 k 313
600 to 1800 339 k 120 k 42 k 15 k 313
800 to 2400 452 k 160 k 56 k 20 k 313
1000 to 3000 565 k 200 k 70 k 25 k 313
1200 to 3600 678 k 240 k 84 k 30 k 313
1400 to 4200 791 k 280 k 98 k 35 k 313
1600 to 4800 905 k 320 k 113 k 40 k 313
1800 to 5400 1 M 360 k 127 k 45 k 313
2000 to 6000 1 M 400 k 141 k 50 k 313
2200 to 6600 1 M 440 k 155 k 55 k 313
2400 to 7200 1 M 480 k 169 k 60 k 313
1. See Tables 1-14 through 1-16 for details.
2. The time base of DUT is required to lock with the time base of the analyzer.
3. When a DUT’s frequency is settled to a selected target frequency.
6
Frequency
max. (MHz)
Frequency
min. (MHz)
5400 6000 6600 72003000 3600 4200 48001200 1500 1800 2400150 300 600 900
1800 2000 2200 24001000 1200 1400 1600400 500 600 80050 100 200 300
Page 7

7
Table 1-15. Narrow band transient (frequency bandwidth = 3.125 kHz)
Measurement time (sec) 100 m 200 m 500 m 1 2 5 10
Frequency resolution (Hz rms) 0.0095 0.0095 0.0034 0.0012 0.0004 0.0004 0.0004
Time resolution (µsec) 81.92 163.84 409.6 819.2 1638.4 4096 10240
Number of point 1222 1222 1222 1222 1222 1222 978
Table 1-16. Narrow band transient (frequency bandwidth = 25 kHz)
Measurement time (sec) 10 m 20 m 50 m 100 m 200 m 500 m 1 2 5 10
Frequency resolution (Hz rms) 0.22 0.22 0.076 0.027 0.0095 0.0095 0.0095 0.0095 0.0095 0.0095
Time resolution (µsec) 10.24 20.48 51.2 102.4 204.8 512 1280 2560 6400 12800
Number of point 978 978 978 978 978 978 783 783 783 783
Table1-17. Narrow band transient (frequency bandwidth = 200 kHz)
Measurement time (sec) 1 m 2 m 5 m 10 m 20 m 50 m 100 m 200 m 500 m 1 2 5 10
Frequency resolution (Hz rms) 4.9 4.9 1.7 0.6 0.2 0.2 0.2 0.2 0.2 0.2 0.2 0.2 0.2
Time resolution (µsec) 1.28 2.56 6.4 12.8 25.6 64 160 320 800 1600 3200 8000 16000
Number of point 783 783 783 783 783 783 626 626 626 626 626 626 626
Table1-18. Narrow band transient (frequency bandwidth = 1.6 MHz)
Measurement time (sec)
100
µ
200
µ
500
µ 1 m 2 m 5 m 10 m 20 m 50 m 100 m 200 m 500 m 1 2 5 10
Frequency resolution (Hz rms) 110 110 110 39 21 14 5 5 5 5 5 5 5 5 5 5
Time resolution (µsec) 0.16 0.32 0.8 0.8 1.6 4 8 20 80 160 320 800 1600 3200 8000 1600
Number of point 626 626 626 1251 1251 1251 1251 1001 626 626 626 626 626 626 626 626
Table1-19. Narrow band transient (frequency bandwidth = 25.6 MHz)
Measurement time (sec) 10 µ 20 µ 50 µ 100 µ 200 µ 500 µ 1 m 2 m 5 m 10 m 20 m 50 m 100 m 200 m 500 m 1 2 5
Frequency resolution (Hz rms)
7 k 7 k 7 k 7 k 3 k 884 313 313 313 313 313 313 313 313 313 313 312.5 312.5
Time resolution (µsec) 0.01 0.02 0.05 0.1 0.2 0.5 1 2 6.25 12.5 25 62.5 125 250 625 1250 2500 6250
Number of point 1001 1001 1001 1001 1001 1001 1001 1001 801 801 801 801 801 801 801 801 801 801
Table 20. Spectrum monitor measurement capabilities
Spectrum monitor
Number of trace 1 data trace and 1 memory trace per measurement trace
Data formats dBm, dBV, watt, volt, dBm / Hz, dBV / Hz, watt / Hz, volt / √Hz
Measurement trigger Set to continuous, hold, or single, sweep with internal, external, manual, or bus trigger
Page 8

8
Port Output (DC Power/Control)
Table 1-21. DC power voltage output
Description Specifications
Voltage range 0 to 16 V
Resolution 1 mV
Setting accuracy ± (0.2% + 2 mV)
Maximum output current 80 mA
Noise < 10 nV / Hz at 10 kHz
Output resistance < 0.3 ohm (typical)
Settling time @error: 0.1% < 20 msec (typical)
Table 1-22. DC control voltage output
Description Specifications
Voltage range -15 to 35 V
Resolution 0.1 mV
Setting accuracy
-15 to 0 V ± ((Setting + 15 V) x 0.1% + 5 mV)
(typical)
0 to 35 V ± (Setting x 0.1% + 2 mV) (typical)
Maximum output current 20 mA (typical)
Noise
0 to 20 V 1 nV / Hz at 10 kHz
-15 to 0 V, 20 to 35 V 1.5 nV / Hz at 10 kHz
Output resistance (DC) < 50 ohm
Output resistance (AC) 50 ohm (nominal)
Settling time @error: 0.1% < 20 msec (typical)
Test Port Input
Table 1-23. RF in
Description Specifications
Input level
10 M to 30 MHz -15 to +20 dBm
30 M to 7 GHz -20 to +20 dBm
Input attenuator 0 to 35 dB in 5 dB steps
Damage level +23 dBm (nominal)
VSWR
10 M to 30 MHz < 1.6
30 M to 2 GHz < 1.2
2 G to 3 GHz < 1.3
3 G to 4 GHz < 1.3 (typical)
4 G to 7 GHz < 1.5 (typical)
General Information
Table 1-24. Front panel information
Description Supplemental information
RF in
Type Type-N, female, 50 ohm (nominal)
DC power / control
Type BNC, female, 50 ohm (nominal)
Display
Size 10.4 in TFT color LCD
Resolution VGA (640 • 480)
1
Table 1-25. Rear panel information
Description Supplemental information
External trigger connector
Type BNC, female
Input level Low threshold voltage: 0.5 V
High threshold voltage: 2.1 V
Input level range: 0 to + 5 V
Pulse width ≥ 2 µsec, typical
Polarity Positive/negative selectable
External trigger 0 to 1 usec
timing adjustment
External reference signal input connector
Type BNC, female
Input frequency 10 MHz ± 10 Hz, typical
Input level -6 dBm to + 16 dBm, typical
Internal reference signal output connector
Type BNC, female
Input frequency 10 MHz ± 50 Hz, typical
Signal type Sine wave, typical
Output level 2.5 dBm ± 3 dB, typical
Output impedance 50 ohm nominal
VGA video output 15-pin mini D-Sub; female;
drives VGA compatible monitors
GPIB 24-pin D-Sub (type D-24), female;
compatible with IEEE-488
Parallel port 36-pin D-Sub (type 1284-C), female;
provides connection to printers
USB port
Universal serial bus jack
Type A configuration, female;
provides connection to printer, USB/GPIB
interface
Type B configuration
2
(USBTMC), female;
provides connections to an external PC
Contact 1 Vcc: 4.75 to 5.25 VDC, 500 mA, maximum
Contact 2 Data
Contact 3 +Data
Contact 4 Ground
LAN 10 / 100 base T ethernet, 8-pin configuration;
auto selects between the two data rates
24 Bit I/O port 36-pin D-sub, female; provides connection to
handler system
Line power
3
Frequency 47 Hz to 63 Hz
Voltage 90 to 132 VAC, or 198 to 264 VAC
(automatically switched)
VA maximum 500 VA max
1. Valid pixels are 99.99% and more. Below 0.01% (approx. 30 points) of fixed points
of black, blue, green or red are not regarded as failure.
2. USB Test and Measurement Class (TMC) interface that communicates over USB
using USBTMC messages based on the IEEE 488.1 and IEEE 488.2 standards.
Type B configuration will be included with E5052A shipments beginning August 2005.
3. A third-wire ground is required.
√
√
√
Page 9

9
Table 1-26. EMC and safety
Description Supplemental information
EMC
• European council directive 89 / 336 /
EEC, 92 / 31 / EEC, 93 / 68 / EEC
IEC 61326 - 1: 1997 +A1: 1998 +A2:
2000/EN 61326 - 1: 1997 +A1: 1998
+A2: 2001
• CISPR 11: 1997 +A1: 1999 / EN 55011:
1998 +A1: 1999
• Group 1, Class A
• IEC 61000 - 4-2:1995 +A1: 1998 / EN
61000 - 4-2: 1995 +A1: 1998
• 4 kV CD / 8 kV AD
• IEC 61000 - 4-3: 1995 +A1: 1998 / EN
61000 - 4-3: 1996 +A1: 1998
• 3 V / m, 80 - 1000 MHz, 80% AM
• IEC 61000 - 4-4: 1995 / EN 61000 - 4-4:
1995
• 1 kV power / 0.5 kV signal
• IEC 61000 - 4-5: 1995 / EN 61000 - 4-5:
1995
• 0.5 kV normal / 1 kV common
• IEC 61000 - 4-6: 1996 / EN 61000 - 4-6:
1996
• 3 V, 0.15-80 MHz, 80% AM
• IEC 61000 - 4-11: 1994 / EN 61000 - 4-11:
1994
• 100% 1 cycle European council directive
ICES/NMB-001 This ISM device complies with Canadian
ICES-001:1998
AS/NZS 2064.1/2 Group 1, Class A
Safety
European council directive 73/23/EEC,
93/68/EEC
IEC 61010-1:2001/EN 61010-1:2001
Measurement category I, pollution degree 2,
indoor use
IEC60825-1:1994 Class 1 LED
CAN/CSA C22.2 No. 1010.1-92
Table 1-27. Analyzer environment and dimensions
Description Supplemental information
Operating environment
Temperature +10 °C to +40 °C
Humidity 20% to 80% at wet bulb temperature
< +29 °C (non-condensing)
Altitude 0 to 2,000 m (0 to 6,561 feet)
Vibration 0.5 G maximum, 5 Hz to 500 Hz
Non-operating storage environment
Temperature -10 °C to +60 °C
Humidity 20% to 90% at wet bulb temperature
< +40 °C (non-condensing)
Altitude 0 to 4,572 m (0 to 15,000 feet)
Vibration 0.5 G maximum, 5 Hz to 500 Hz
Dimensions See Figures 1-5 through 1-7
Weight (net) 21 kg
ISM 1-A
ISM 1-A
Page 10

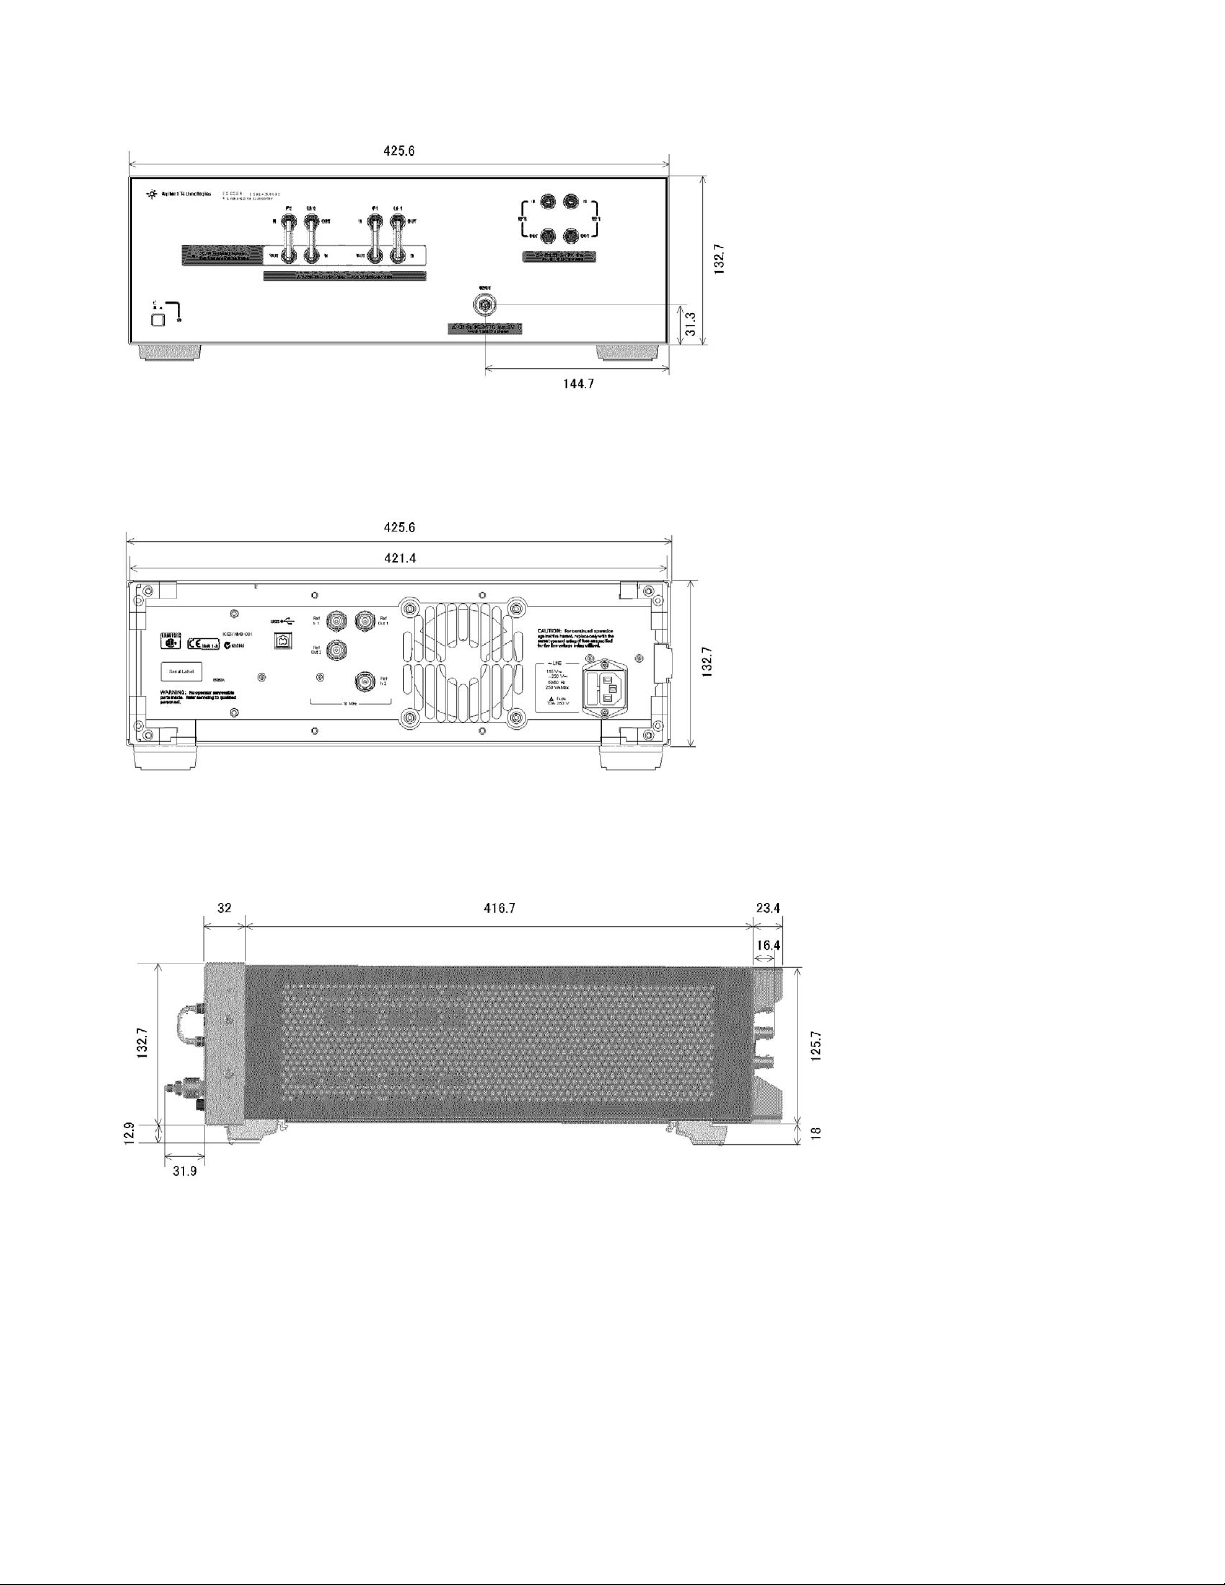
Figure 1-5. Dimensions (front view, in millimeters, nominal)
Figure 1-6. Dimensions (rear view, in millimeters, nominal)
Figure 1-7. Dimensions (side view, in millimeters, nominal)
Table 1-28. Measurement capabilities
Number of Up to 4 measurement windows
measurement windows: and 1 user defined window
Data markers: 6 independent markers per trace. Reference
marker available for delta marker operation.
Marker functions
Marker search: Max value, min value, peak, peak left, peak
right, target, target left, target right,
multi-peak, multi-target, bandwidth
parameters with user-defined bandwidth
values
Marker-to functions: Set, start, stop, center to active marker
stimulus value; set reference to active
marker response value
Search range: User definable
Tracking: Performs marker search continuously or on
demand
User defined window
Number of trace: 8 data traces and 8 memory traces
Table 1-29. DC power/control voltage setting
Measured number User definable from 2 to 1001
of points per sweep
(standard only):
Sweep type (parameter) Control voltage sweep, power voltage
(standard only): sweep
Control voltage: Set control voltage from –15 V to +35 V
Power voltage: Set power voltage from 0 V to +16 V
Table 1-30. Trace functions
Display data: Display current measurement data, memory
data, or current measurement and memory
data simultaneously
Trace math: Addition, subtraction, multiplication
or division of trace or memory data
Title: Add custom title to each measurement
window. Titles are printed on hard copies of
displayed measurements
Autoscale: Automatically selects scale resolution and
reference value to vertically center the
trace
Statistics: Calculates and displays mean, standard
deviation and peak-to-peak deviation of the
data trace
10
Page 11

11
Table 1-31. Storage
Internal hard disk drive: Store and recall instrument states and trace data on 10 GB, minimum, internal hard drive. Trace data can be saved
in CSV (comma separated value) format. All files are MS-DOS®-compatible. Instrument states include all control
settings and memory trace data.
File sharing: Internal hard disk drive (F:) can be accessed from an external Windows®PC through LAN or USB (USBTMC)
Disk drive: Instrument states and trace data can be stored on an internal 3.5 inch 1.4 MB floppy disk in MS-DOS-compatible
format
Screen hard copy: Printouts of instrument data are directly produced on a printer. The analyzer provides USB and parallel interfaces
Table 1-32. System capabilities
Familiar graphical The analyzer employs a graphical user interface based on Windows®operating system. There are three ways to
user interface: operate the instrument manually: you can use a hard key interface, a touch screen interface, or a mouse interface.
Limit line
Limit test Define the test limit that appears on the display for pass/fain testing. Defined limits may be any combination
of horizontal/sloping lines and discrete data points.
Table1-33. Function differences between standard and E5052A-011
Descriptions Standard E5052A-011
Phase noise measurement
Offset frequency 1 Hz to 40 MHz 10 Hz to 40 MHz
IF gain 0, 10, 20, 30, 40, 50 dB 0, 10, 20 dB
Enhanced phase noise sensitivity Yes (1 to 10,000 correlations) No
Phase noise sensitivity See table 1-2 See table 1-3
Frequency, RF power, DC current measurement
Measurement parameters Analyzer mode: Tester mode:
Frequency versus DC control voltage dF/dV control Frequency, power, and DC current
(tuning sensitivity) (at DC power port)
Frequency versus DC power voltage (frequency pushing),
dF/dV power
RF power versus DC control voltage or DC power voltage
DC current (at DC power port only) versus
DC control voltage or DC power voltage
Tester mode:
Frequency, power, and DC current (at DC power port)
Table 1-34. Automation
Methods
Internal analyzer execution: Applications can be developed in a built-in VBA® (Visual Basic for Applications) language. Applications can
be executed from within the analyzer via COM (component object model) or using SCPI.
Controlling via GPIB The GPIB interface operates to IEEE 488.2 and SCPI protocols. The analyzer can be controlled by a GPIB
or USB (USBTMC): external controller. The analyzer can control external devices using a USB/GPIB interface.
Controlling via USB The USB interface operates with USBTMC and SCPI protocols. The analyzer can be controlled with an
(USBTMC): external PC using the USB interface with a USB cable.
LAN
Standard conformity: 10 base-T or 100 base-TX (automatically switched), Ethertwist, RJ45 connector
Protocol: TCP/IP
Function: Telnet, SICL-LAN
Table 1-35. E5001A SSA-J precision clock jitter analysis software
Description Specification
Measurement parameters Random jitter (RJ), Periodic jitter (PJ) frequency, PJ rms, Jitter trend (TJ vs. time), TJ p-p, PJ p-p, PJ d-d
Jitter spectrum bandwidth 1 Hz to 40 MHz (standard)
10 Hz to 40 MHz (Option E5052A-011)
Page 12

12
System Performance with the E5053A Downconverter
The system performance is the combination of the E5052A SSA
and E5053A downconverter. All data is typical performance.
Table 2-1. System performance characteristics
Description Performance characteristics
Test port
Frequency range 10 MHz to 3 GHz (E5052A SSA RF IN port)
3 to 26.5 GHz (E5053A downconverter input port)
Input level -15 dBm to +20 dBm (10 M to 3 GHz, E5052A RF IN)
-30 dBm to + 10 dBm (3 to 10 G frequency band)
-20 dBm to + 5 dBm (10 to 26.5 GHz frequency band)
Carrier search range
1
-10 dBm to +10 dBm (3 to 10 GHz frequency band)
-10 dBm to +5 dBm (9 to 26.5 GHz frequency band)
Phase noise measurement
Frequency band 10 MHz to 3 GHz (E5052A SSA RF IN port)
3 to 10 GHz or 9 to 26.5 GHz (E5053A downconverter RF IN port)
SSB phase noise sensitivity See Figure 2 and Table 2
Frequency tracking range 1.8 MHz (< 4.9 GHz, 3 to 10 GHz band)
2.8 MHz (>= 4.9 GHz, 3 to 10 GHz band)
1.3 MHz (< 10 GHz, 9 to 26.5 GHz band)
2.6 MHz (>= 10 GHz, 9 to 26.5 GHz band)
Transient measurement
Wide band measurement range 50 MHz to 3 GHz (E5052A SSA RF IN port)
500 MHz (E5053A downconverter RF IN port)
Narrow band measurement range 200 kHz, 1.6 MHz, or 25.6 MHz
RF power measurement accuracy
2
+/- 2 dB (10 MHz to 3 GHz)
+/- 3 dB (3 to 10 GHz)
+/- 4 dB (9 to 26.5 GHz)
Frequency, RF power, DC current measurement
Frequency measurement resolution 10 Hz, 1 kHz, or 64 kHz
RF power measurement accuracy
2
+/- 2 dB (10 MHz to 3 GHz)
+/- 3 dB (3 to 10 GHz)
+/- 4 dB (9 to 26.5 GHz)
Spectrum monitor
Frequency span 15 MHz max
RBW 1.53 Hz to 400 kHz, 1-3-5 step
Absolute level accuracy +/- 4 dB
1. Carrier search function is applicable for the phase noise, frequency/power/DC current, and spectrum monitor functions
when using the E5053A downconverter RF IN port.
2. Power accuracy can be improved by applying the “user-power cal” function equipped with the SSA Rev2.0 firmware.
Figure 2-1. E5053A with E5052A block diagram
E5052A Signal Source Analyzer
PLL
ADC FFT
Correlation
ADC
PLL
FFT
DUT
3 TO 26.5 GHZ
E5053A Microwave Downconverter
Fundamental
3rd harmonic
or
mixing
IF gain
block
10 MHz
to
3 GHz
Page 13

13
System Performance with the E5053A Downconverter
Table 2-2. System phase noise sensitivity (typical)
Offset from carrier (Hz)
Input frequency 1 10 100 1k 10 k 100 k 1 M 10 M 40 M
3 GHz -39.0 -78.7 -99.5 -124.4 -135.3 -137.5 -153.5 -164.5 -167.6
10 GHz -34.6 -71.8 -91.1 -116.1 -124.1 -128.1 -147.1 -156.6 -160.0
18 GHz -31.6 -66.5 -85.3 -110.3 -121.2 -125.3 -141.3 -150.7 -154.2
26.5 GHz -29.0 -63.2 -81.8 -106.8 -117.8 -121.8 -137.8 -147.3 -150.8
E5052A with E5053A phase noise performance (standard,
correlation = 1, measuring ultra-low noise N5507A uW LO)
Block diagram of SSA millimeter wave
Figure 2-2. System phase noise sensitivity with the E5053A downconverter
(standard, 0 dBm input, correlation = 1, start offset frequency = 1 Hz, measurement time = 17.7 sec)
Page 14

E5053A Microwave Downconverter
Specification Summary
Downconverter Test Port
Table 2-3. Input/output
Description Specification
Test port input
Frequency range 3 to 26.5 GHz
Maximum Input level +10 dBm (3 to 10 GHz band)
+5 dBm (9 to 26.5 GHz band)
Damage level +23 dBm (nominal)
LO output
Output frequency 3 to 10 GHz
LO resolution 50 MHz
Output power 10 to 16 dBm (3 to 6 GHz)
10 to 15 dBm (6 to 10 GHz)
LO spurious -55 dBc (Foffset > 300 Hz, typical)
IF Input
Frequency range 250 to 1250 MHz
Maximum input level 0 dBm (typical)
IF gain 0 to 35 dB (5 dB step)
Noise floor -163 dBm/Hz
Mixer bias current -10 to 10 mA
General Information
Table 2-4. Real Panel Information
Description Supplemental Information
External reference signal input connector
Type BNC, female
Input frequency 10 MHz +/- 10 Hz (typical)
Input level -5 dBm +/- 5 dB (typical)
Internal reference signal output connector
Type BNC, female
Input frequency 10 MHz +/- 50 Hz (typical)
Input level 2.5 dBm +/- 3 dB (typical)
USB port Universal serial bus jack,
type B configuration, female;
provides connection to the
E5052A SSA
Line power
1
Frequency 47 to 63 Hz
Voltage 90 to 132 VAC, or 198 to 264 VAC
(automatically switched)
VA maximum 120 VA max
Table 5. Analyzer environment and dimensions
Description Supplemental Information
Operating environment
Temperature +10 degC to +40 degC
Humidity 20 to 80% at wet bulb temperature
< +28 degC (non-condensing)
Non-operating storage environment
Temperature -10 degC to +60 degC
Humidity 20 to 90% at wet bulb temperature
< +40 degC (non-condensing)
Dimensions See figures
Weight 11 kg
1. A third-wire ground is required.
E5053A Microwave Downconverter Specification Summary
Table 2-5. E5053A downconverter LO phase noise
Offset from carrier (Hz)
Input frequency 1 10 100 1 k 10 k 100 k 1 M 10 M 40 M
3 GHz Spec. -110.5 -116.5 -113.5 -127.5 -140.0 -140.0
Typ. -49.5 -79.5 -94.5 -114.5 -120.5 -117.5 -131.5 -144.0 -144.0
6 GHz Spec. -104.4 -110.4 -109.4 -123.4 -140.0 -140.0
Typ. -43.4 -73.4 -88.4 -108.4 -114.4 -113.4 -127.4 -144.0 -144.0
10 GHz Spec. -100.0 -103.0 -102.0 -119.0 -140.0 -140.0
Typ. -39.0 -69.0 -84.0 -104.0 -107.0 -106.0 -123.0 -144.0 -144.0
Figure 2-3. E5052A downconverter LO phase noise (typical)
14
Page 15
15
Figure 2-4. Dimensions (front view, in millimeters, nominal
Figure 2-5. Dimensions (rear view, in millimeters, nominal)
Figure 2-6. Dimensions (side view, in millimeters, nominal)
Page 16

Web Resources
Visit our Signal Source Analyzer Web site for
additional product information and literature:
www.agilent.com/find/ssa
Phase noise measurements:
www.agilent.com/find/phasenoise
RF and microwave accessories:
www.agilent.com/find/accessories
Windows‚ and Visual Basic‚ are U.S. registered trademarks of Microsoft Corporation.
www.agilent.com/find/emailupdates
Get the latest information on the products and applications
you select.
www.agilent.com/find/agilentdirect
Quickly choose and use your test equipment solutions
with confidence.
www.agilent.com/find/open
Agilent Open simplifies the process of connecting and
programming test systems to help engineers design, validate
and manufacture electronic products. Agilent offers open
connectivity for a broad range of system-ready instruments,
open industry software, PC-standard I/O and global support,
which are combined to more easily integrate test system
development.
www.agilent.com
For more information on Agilent Technologies’ products, applications
or services, please contact your local Agilent office. The complete list
is available at:
www.agilent.com/find/contactus
Americas
Canada (877) 894-4414
Latin America 305 269 7500
United States (800) 829-4444
Asia Pacific
Australia 1 800 629 485
China 800 810 0189
Hong Kong 800 938 693
India 1 800 112 929
Japan 81 426 56 7832
Korea 080 769 0800
Malaysia 1 800 888 848
Singapore 1 800 375 8100
Taiwan 0800 047 866
Thailand 1 800 226 008
Europe
Austria 0820 87 44 11
Belgium 32 (0) 2 404 93 40
Denmark 45 70 13 15 15
Finland 358 (0) 10 855 2100
France 0825 010 700
Germany 01805 24 6333*
*0.14 /minute
Ireland 1890 924 204
Italy 39 02 92 60 8 484
Netherlands 31 (0) 20 547 2111
Spain 34 (91) 631 3300
Sweden 0200-88 22 55
Switzerland (French) 41 (21) 8113811(Option 2)
Switzerland (German) 0800 80 53 53 (Option 1)
United Kingdom 44 (0) 118 9276201
Other European Countries:
www.agilent.com/find/contactus
Revised: May 7, 2007
Product specifications and descriptions in this document subject
to change without notice.
© Agilent Technologies, Inc. 2004-2007
Printed in USA, October 16, 2007
5989-0903EN
Remove all doubt
Our repair and calibration services will get your equipment
back to you, performing like new, when promised. You will
get full value out of your Agilent equipment throughout its
lifetime. Your equipment will be serviced by Agilent-trained
technicians using the latest factory calibration procedures,
automated repair diagnostics and genuine parts. You will
always have the utmost confidence in your measurements.
Agilent offers a wide range of additional expert test and
measurement services for your equipment, including initial
start-up assistance onsite education and training, as well as
design, system integration, and project management.
For more information on repair and calibration services, go to:
www.agilent.com/find/removealldoubt
Agilent Email Updates
Agilent Direct
Agilent
Open
 Loading...