

Page 1
1300 nm or 1550 nm carrier
130 MHz to 20 GHz
modulation bandwidth
Single wavelength configuration
Agilent 8703A
Lightwave Component Analyzer
Technical Specifications
Page 2

A powerful combination of calibrated 20 GHz lightwave
and microwave measurement capabilities is described in
this Agilent 8703A technical specifications. This includes
the following models and options:
Agilent 8703A Lightwave Component Analyzer
• Option 100 Adds External Lightwave Source Input
• Option 210 1550 nm DFB
1
Laser
• Option 220 1300 nm DFB Laser
• Option 300 Adds One Lightwave Receiver
Agilent 83424A Lightwave CW Source
• Option 100 Adds External Lightwave Source Input
Agilent 83425A Lightwave CW Source
• Option 100 Adds External Lightwave Source Input
With accuracy, speed and convenience, the 8703A
performs the optical, electrical, and electro-optical
measurement types listed below. This data can be shown
in magnitude, phase and distance-time measurement
formats. A performance summary is in Table 2. Following
Table 2 is a block diagram and detailed operating
conditions and specifications.
Additional configuration information can be found in the
8703A configuration guide (Agilent literature number
5966-4827E).
1
“DFB” is an abbreviation for Distributed Feedback Laser.
Lightwave source characterization
(electrical-in and optical-out)
Source slope responsivity tests
• Modulation bandwidth
• Modulated output power flatness
• Step response
• Modulation signal group delay and differential phase
• Reflected signal sensitivity
• Distance-time response
Optical reflection tests
• Port return loss
• Distance-time response
Electrical reflection tests
• Port impedance or return loss
• Distance-time response
Lightwave receiver characterization
(optical-in and electrical-out)
Receiver slope responsivity tests
• Modulation bandwidth
• Modulated output power flatness
• Step response
• Modulation signal group delay and differential
phase
• Distance-time response
Optical reflection tests
• Port return loss
• Distance-time response
Electrical reflection tests
• Port impedance or return loss
• Distance-time response
Optical device characterization
(optical-in and optical-out)
Optical transfer function tests
• Insertion loss or gain
• Modulated output power
flatness
• Step response .
• Modulation signal group delay and differential
phase
• Distance-time response
• Modal dispersion
Optical reflection response tests
• Port return loss
• Distance-time response
Microwave device characterization
(electrical-in and electrical-out)
Electrical transfer function tests
• Insertion loss or gain
• Output power flatness
• Step response
• Group delay and deviation from linear phase
• Distance-time response
Electrical reflection response tests
• Port impedance or return loss
• Distance-time response
Table 1. Types of
measurements performed with
the Agilent 8703A
2
Introduction
Page 3

System dynamic range..(see pages 5, 11, 14)
Transmission test (typical)
Optical-to-optical: 38 to 51 dBo
Optical-to-electrical: 105 to 110 dBe
Electrical-to-optical: 75 to 95 dBe
Electrical-to-electrical: 100 to 110 dBe
Reflection test (typical)
Optical: 31 to 44 dBo
Electrical: 36 to 56 dBe
Distance-time domain........... (see page 13)
Length/location (typical)
Range: 10 ns to 0.5 ms (2 m to 50 km)
Range resolution: 0.5 ps (0.1 mm)
Response resolution: 24 to 48.5 ps (5 to 10 mm)
Stimulus types
Low pass step: 50 ps minimum rise time
Low pass impulse: 48.5 ps minimum pulse width
Bandpass impulse: 97 ps minimum pulse width
Group delay
measurements............................. (see page 15)
Minimum aperture: 1 Hz
Maximum 1 Hz aperture delay: 500 ms
Lightwave source....................... (see page 6)
Wavelength: 1308 or 1550 nm, ±10 nm
Spectral width: 3 nm RMS (FP) or 50 MHz (DFB)
(typical)
Average optical output power: 70 to 600 µW
Modulation bandwidth: 130 MHz to 20 GHz
Modulation frequency resolution: 1 Hz
Modulated optical output power (p-p): 90 to
130 µW (typical)
Modulation index: 25% (typical)
Optical return loss: 15 dBo (typical)
Lightwave receiver................... (see page 7)
Wavelength: 1298 to 1560 nm
Input modulation bandwidth: 130 MHz to 20 GHz
Maximum average input power operating level:
5 mW
System sensitivity (typical): 20 nW
Input port return loss (typical): 20 dBo
Microwave source.................... (see page 11)
Frequency bandwidth: 130 MHz to 20 GHz
Frequency resolution: 1 Hz
Output power range: +5 to –70 dBm
Harmonics: <–15 dBc (typical)
Microwave receiver................ (see page 11)
Frequency bandwidth: 130 MHz to 20 GHz
Maximum input power operating level: 0 dBm
System sensitivity: –110 dBm
Connector types
Lightwave:
HMS-10
FC/PC
DIN 47256
ST
Biconic
SC
Microwave: 3.5 mm (male)
Data accuracy
enhancement................................ (see page 15)
Calibration types:
Response calibration
Response and match calibration
Response and isolation calibration
1-port calibration
Full 2-port calibration
Reference plane extensions
Data averaging:
IF bandwidth control
Sweep-to-sweep averaging
2
Final performance depends upon the 8703A configuration.
For example, performance will vary according to the type of
lightwave source used. Refer inside for further information.
3
Agilent 8703A
Performance overview
Table 2. Agilent 8703A
performance overview
2
Page 4
4
Agilent 8703A
Block diagram
Figure 1. Simplified block
diagrams for lightwave and
microwave test sets and
information processor
MICROWAVE TEST SET
INFORMATION
PROCESSOR
0.13–20 GHz
RF Source
Attenuator
LIGHTWAVE TEST SET
DAC
Step
External
Detector
ALC
MOD
Phase
Lock
Laser
1300 or
1550 nm
S
Sampler Drive
Bias
Tee
RF Port 1 RF Port 2
Bias
Tee
SS
Samplers
RF
Input
RF
Output
MOD ALC
DC
Block
Optical
Switch
(Opt. 100
Only)
Optical
Modulator
Optical
Output
Isolator
Polarization
Controller
(Peak)
External
Laser
Input
(Opt. 100 Only)
DAC
Bias
Tee
Lightwave
Directional Coupler
Input Coupled Test
Port
Photodiode
Receivers
Auxiliary
Optical
Input
(Opt. 300 Only)
Optical
Input
Page 5
Specifications describe the instrument’s warranted performance for the
temperature range of 23 ±3°C after a three hour warm-up. Supplemental
characteristics describe useful, non-warranted performance parameters.
These are denoted as “typical” or “nominal”.
Measurement examples
The following graphs show device (DUT) measurements
compared to typical (– – –) 8703A measurement ranges
9
.
Table 3. System
dynamic range (typical)
3
Frequency range (GHz)
0.13 to 12.0 12.0 to 20
Lightwave transfer function test
Optical-to-optical
4
43 dBo
5
38 dBo
Optical-to-electrical
4
105 dBe
6
105 dBe
Electrical-to-optical 85 dBe
7
75 dBe
Lightwave reflection test
Optical
4
36 dBo
5
31 dBo
Optical-to-optical
transmission test
(DUT = 10, 20, 30, 40 and
50 dB attenuators)
Electrical-to-optical
transfer function test
(DUT = laser source)
Optical-to-electrical
transfer function test
(DUT = photodiode
receiver)
5
For optical-to-optical devices, (dBo) = 10 log (#2 optical power
(W p-p) / #1 optical power (W p-p))
6
For optical-to-electrical devices, slope responsivity (dBe) = 20 log
((∆ current (A p-p) / ∆ optical power (W p-p)) / 1 A/W)
7
For electrical-to-optical devices, slope responsivity (dBe) = 20 log
((∆ optical power (W p-p) / ∆ current (A p-p)) / 1 W/A)
8
Measurement range can be shifted upward by externally adding
attenuation in the signal path during calibration and measurement.
3
Limited by maximum lightwave source output power, maximum
lightwave receiver input power, maximum microwave output power
and system noise floor. Specified for an IF bandwidth of 10 Hz and an
averaging factor of 16 after an appropriate calibration has been
performed (i.e. response & isolation calibration for optical tests,
response & match and isolation calibration for electrical-to-optical
and optical-to-electrical tests).
4
8703A Option 100 systems will typically see 1 dBo less dynamic range
than is shown for optical transfer function and reflection measurements.
Optical-to-electrical transfer function measurements will typically
see 2 dBe less.
5
Frequency domain
lightwave dynamic range
Page 6

Table 4.
Lightwave source
characteristics
9
9
Lightwave source characteristics are described given a >30 dB return
loss optical termination.
10
Output power is 1 dBo less for systems with Option 100. This is a
class I (FDA (U.S.A.)) and class IIIb (IEC (Europe)) laser.
11
Average optical output power level can be controlled with an external
optical attenuator like the 8157A. The 8703A does not have an internal
optical attenuator.
12
The modulated optical output power level is set by the 8703A and
cannot be adjusted by the user.
13
Modulation index is defined as peak modulated optical power divided
by average optical power. For example, the 8703A FP configuration of
Table 4 shows an index of 25% (= 65 µW / 260 µW).
14
Laser reflection sensitivity is tested using a 95 % reflection, an optical
coupler (15 dB coupling factor and 1.5 dB main arm loss) and the optical
output powers shown in Table 4.
15
Isolation refers to the isolation between the 8703A’s optical modulator
and the internal laser. External sources must have built-in isolation.
Refer to the block diagram, Figure 1.
16
Harmonic levels are given for average optical powers and modulation
powers listed in Table 4. dBc rating is for dBe below the fundamental
modulation components.
Opt 210 Opt 220 Opt 100 Opt 100
Description (DFB laser)
10
(DFB laser)
10
with Agilent 83424A with Agilent 83425A
Wavelength 1550 ±10 nm 1308 ±10 nm 1550 ±10 nm 1308 ±10 nm
Spectral width <50 MHz <50 MHz <50 MHz <50 MHz
(typical)
Average optical
output power
11
Maximum: 600 µW (–2.2 dBm) 600 µW (–2.2 dBm) 500 µW (–3.0 dBm) 500 µW (–3.0 dBm)
Typical: 260 µW (–5.9 dBm) 260 µW (–5.9 dBm) 180 µW (–7.4 dBm) 180 µW (–7.4 dBm)
Minimum: 125 µW (–9.0 dBm) 125 µW (–9.0 dBm) 70 µW (–11.6 dBm) 70 µW (–11.6 dBm)
Modulation 130 MHz 130 MHz 130 MHz 130 MHz
bandwidth to 20 GHz to 20 GHz to 20 GHz to 20 GHz
Modulated 1 Hz 1 Hz 1 Hz 1 Hz
frequency
resolution
Modulated optical
output power
(typical)
12
Peak-to-peak: 130 µW (–8.9 dBm) 130 µW (–8.9 dBm) 90 µW (–10.5 dBm) 90 µW (–10.5 dBm)
Peak: 65 µW (–11.9 dBm) 65 µW (–11.9 dBm) 45 µW (–13.5 dBm) 45 µW (–13.5 dBm)
Modulation index 25% 25% 25% 25%
(typical)
13
Reflection sensitivity ±0.1 dB ±0.1 dB ±0.1 dB ±0.1 dB
(typical)
14
Laser isolation
15
80 dB 80 dB 80 dB 80 dB
Degree of 20:1 20:1 20:1 20:1
polarization
(typical)
Port return loss 15 dBo 15 dBo 15 dBo 15 dBo
(typical)
Harmonics <–9 dBc <–9 dBc <–9 dBc <–9 dBc
(typical)
16
Compatible fiber 9/125 µm 9/125 µm 9/125 µm 9/125 µm
6
Lightwave source and
receiver characteristics
Page 7

External lightwave sources
22
Option 100 allows external lightwave sources to be used
with the Agilent 8703A lightwave component analyzer. The
external sources must conform to the following characteristics.
Wavelengths
17
:
1530 to 1570 nm Option 210
1290 to 1330 nm Option 220
Reflection sensitivity: external laser input port typical
optical return loss >15 dBo
Average output power range
18
: 100 µW to 5 mW
(–10 dBm to +7 dBm)
Compatible fiber: 9/125 um
Degree of signal polarization: >20:1
Polarization controller: two quarter-wavelength
elements required
Lightwave receiver characteristics
19
Input wavelength20: 1298 to 1560 nm
Input modulation bandwidth: 130 MHz to 20 GHz
Maximum average input power operating level:
5 mW (+7 dBm)
Average input power damage level: 10 mW
(+10 dBm)
System sensitivity (using 10 Hz IF bandwidth, 16
averages, p-p): 20 nW (–47 dBm) (typical)
Polarization sensitivity: ±0.05 dB (typical)
Input port return loss: >20 dBo (typical)
Lightwave directional
coupler characteristics
Wavelength: 1298 to 1560 nm
Coupling factor (“test port” to “coupled” port): 3 dB
(typical)
Main arm loss (“input” port to “test port”): 3 dB (typical)
Directivity
21
: 37 dB (typical)
Isolation (“input” port to “coupled” port): 40 dB (typical)
Return loss, all ports: 37 dBo (typical with HMS-10
connector types)
17
Caution! Do not input wavelengths below 1200 nm. Damage to the
8703A optical modulator will result.
18
9 dB optical loss is typical for the external lightwave source path
through the optical modulator shown in Figure 1. This will affect
system dynamic range. Compare cases to 83424A and 83425A
configurations (Table 3 and 4) to calculate dynamic range for systems
using different external sources.
19
Lightwave receiver characteristics are tested in an environment of
>15 dBo optical source match return loss.
20
Lightwave receiver will operate beyond the system’s specified 1308
or 1550 ±10 nm and a normalized calibration can be done. However,
complete 8703A performance cannot be warranted outside of
1308 or 1550 ±10 nm.
21
Directivity (dB) = Isolation (dB) - Coupling Factor (dB). Specification
assumes a 37 dB return loss connector match at the coupler’s “test
port”. Coupler’s isolation will be degraded reducing directivity when
a connector of less than 37 dB return loss is connected to the “test
port”.
22
7
INVISIBLE LASER RADIATION-AVOID
DIRECT EXPOSURE TO BEAM
FDA LASER CLASS I PRODUCT
IEC LASER CLASS 1 PRODUCT
Page 8

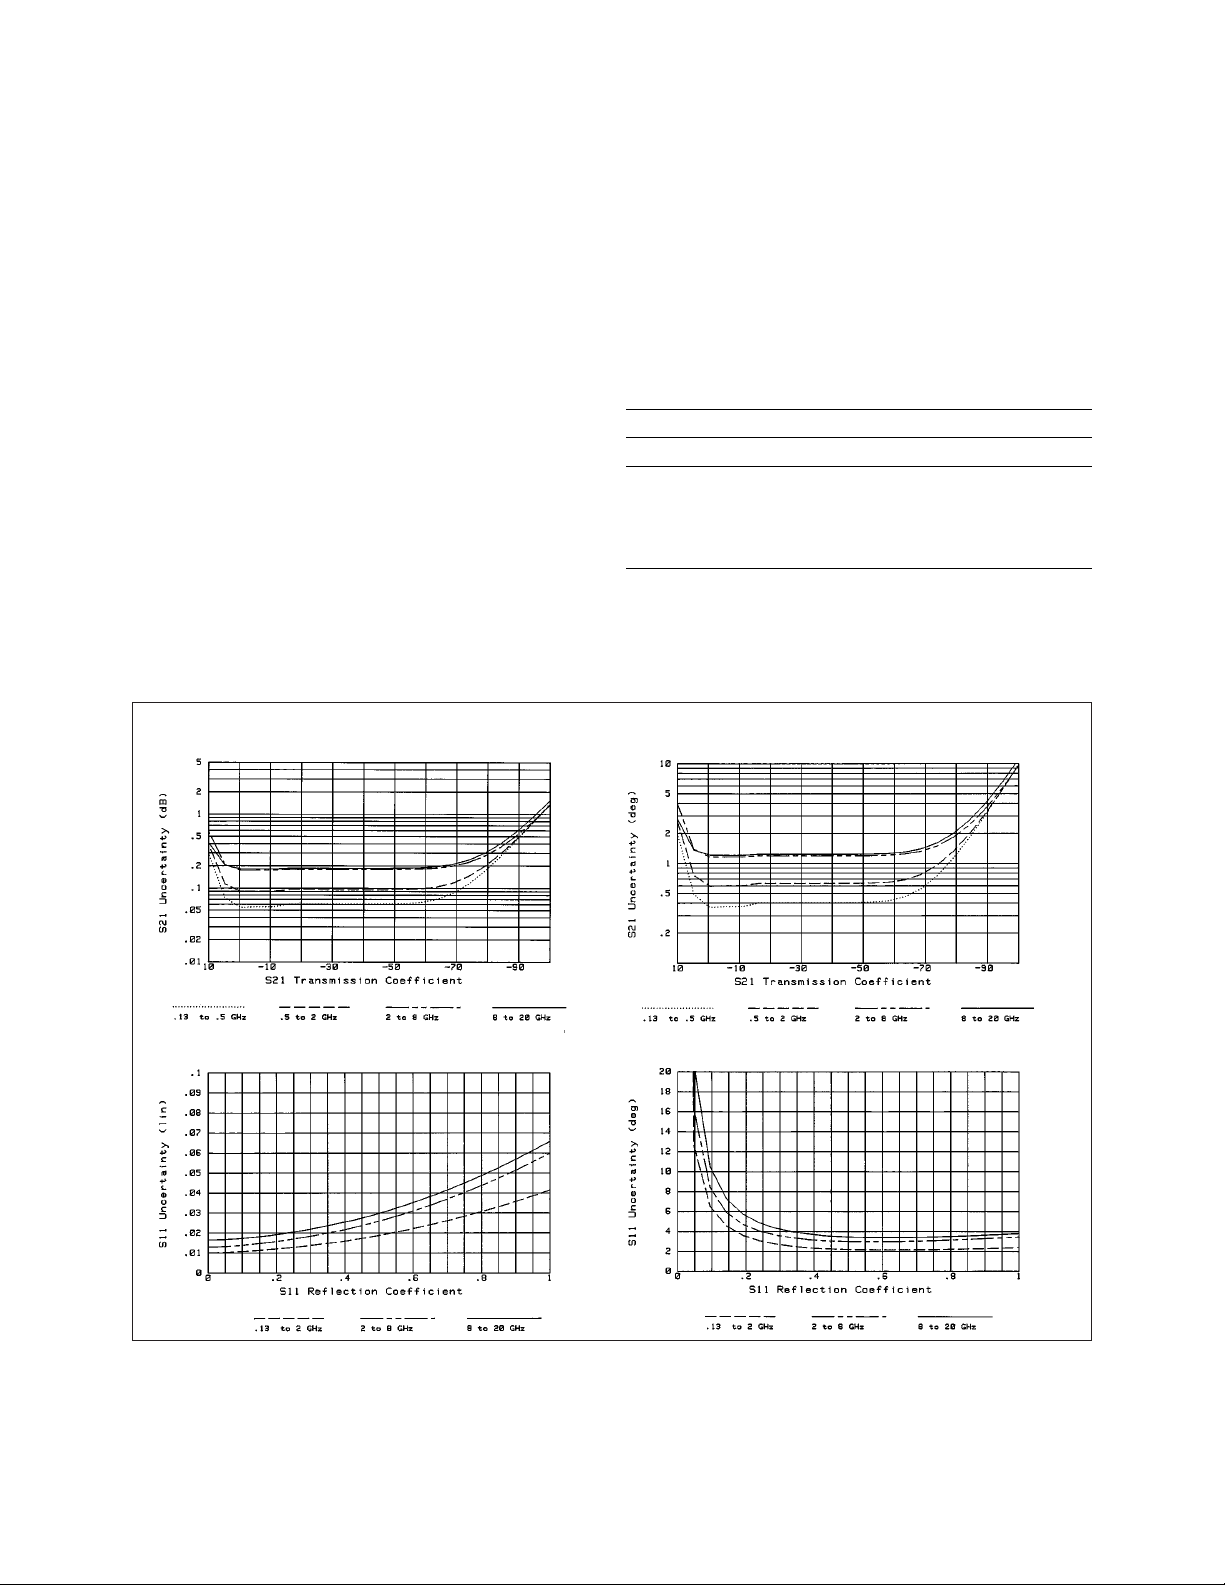
Lightwave measurement uncertainty is presented in the
following graphs and tables. This covers three types of
measurements: optical (transmission and reflection)
measurements, optical-to-electrical measurements, and
electrical-to-optical measurements. Data is recorded after
an 8703A accuracy enhancement has been performed
using the indicated calibration type. This analysis accounts
for the following errors
23
:
• Residual systematic errors (Table 5)
• System dynamic accuracy (dB from reference)
24
• 3.5 mm connector repeatability
25
• Lightwave source stability
• Lightwave source and receiver factory calibration
uncertainty
26
• Switch repeatability
• Noise
A 10 Hz IF bandwidth, a 16 averaging factor and a
23 ±3°C temperature range are used in all cases. Data
applies to all 8703A internal source configurations of
Table 4.
The following table shows 8703A residual systematic
errors after accuracy enhancement using the same
calibration and setup as stated for each of the three
lightwave measurement types.
Table 5. Residual
lightwave measurement
systematic errors.
Frequency range (GHz)
0.13 to 12.0 12.0 to 20
Optical residual characteristics
(typical)
Lightwave source port return loss 15 dBo 15 dBo
Lightwave receiver port return loss 20 dBo 20 dBo
Transmission tracking
27
±0.55 dB ±0.55 dB
Lightwave directional coupler
test port return loss 37 dBo 37 dBo
Directivity 37 dB 37 dB
Reflection tracking
27
±0.45 dB ±0.45 dB
Electrical residual characteristics
(typical)
Microwave source port return loss 29 dBe
28
29 dBe
Microwave receiver port return loss 30 dBe 30 dBe
8
Lightwave measurement
accuracy summary
Optical transmission and reflection
Measurement setup
Calibration type: response & isolation
Calibration standards:
14.5 dB return loss Fresnel standard
Connectors and cables:
HMS-10 lightwave connectors
40 cm single mode fiber cables
Measurement uncertainty
29
Transmission test
Magnitude
Phase
(typical)
Reflection test
Magnitude
(typical)
Page 9
9
23
Additional technical information about lightwave measurement
error analysis and calibration is available upon request from an
Agilent Technologies representative.
24
Crosstalk effects are included in the dynamic range and
dynamic accuracy specifications.
25
Optical connector repeatability, cable stability, and system drift
are not included. Transmission and transfer function measurements assume a well-matched device that produces no reflection
from its input port.
26
These calibrations are verified with Agilent’s in-house NIST
traceable reference receiver.
27
Tracking accounts for switch repeatability and frequency response
differences between the measurement reference path and test path.
28
For electrical-to-electrical devices:
Return loss (dBe) = –20 log (ρ)
Transmission (dBe) = 20 log (V2/V1) = 20 log (I2/I1) = 10 log (P2/P1)
29
Lightwave measurement uncertainty is defined as:
Warranted uncertainty = ((system errors)^2 + (random RSS
errors)^2)^0.5. Typical uncertainty is the RSS combination of all
system and random errors.
30
Uncertainty graphs below refer to relative flatness and modulation
bandwidth measurements. An absolute uncertainty value for a
specific data point can be calculated by adding 1.5 dB to the value
found on the uncertainty graphs.
Optical-to-electrical
30
Measurement setup
Calibration type: response & match
Calibration standards:
Lightwave receiver factory calibration data
Agilent 85052D RF calibration kit
Connectors and cables:
HMS-10 lightwave connectors
40 cm single mode fiber
3.5 mm RF connectors
Agilent 85131E RF cable
Measurement uncertainty
29
Transfer function test
Electrical-to-optical
30
Measurement setup
Calibration type: response & match
Calibration standards:
Lightwave source calibration data
Agilent 85052D RF calibration kit
Connectors and cables:
HMS-10 lightwave connectors
40 cm single mode fiber
3.5 mm RF connectors
Agilent 85131E RF cable
Measurement uncertainty
29
Transfer function test
Magnitude
(typical)
Magnitude
(typical)
Phase
(typical)
Phase
(typical)
Page 10
Single point uncertainty
Individual uncertainty elements are shown below for a
10 GHz modulation frequency data point of a photodiode
receiver transfer function measurement done on an 8703A.
The uncertainty graphs on pages 8 and 9 summarize the
results of this same analysis for optical and electro-optical
device measurements across wide modulation bandwidths.
Device description
Device: photodiode receiver
Data point slope responsivity: –10 dBe
RF output port return loss: 50 dB
Optical input port return loss: 50 dB
Description of uncertainty term
Lightwave source port return loss . . . . . . . . . . . . . . . .15 dB
Transmission tracking . . . . . . . . . . . . . . . . . . . . . . . . . . . .0.25 dB
Microwave receiver port return loss . . . . . . . . . . . . .30 d B
System dynamic accuracy . . . . . . . . . . . . . . . . . . . . . . . . .0.3 dB
Connector repeatability. . . . . . . . . . . . . . . . . . . . . . . . .0.005 dB
Lightwave source stability . . . . . . . . . . . . . . . . . . . . . . . .0.1 dB
Lightwave receiver factory calibration
uncertainty . . . . . . . . . . . . . . . . . . . . . . . . . . . . . . . . . . . . . . . .0.65 dB
Switch repeatability . . . . . . . . . . . . . . . . . . . . . . . . . . . . . .0.03 dB
Noise . . . . . . . . . . . . . . . . . . . . . . . . . . . . . . . . . . . . . . . . . . . . . . .0.01 dB
Total measurement uncertainty value . . . . . .±0.76 dB (RSS)
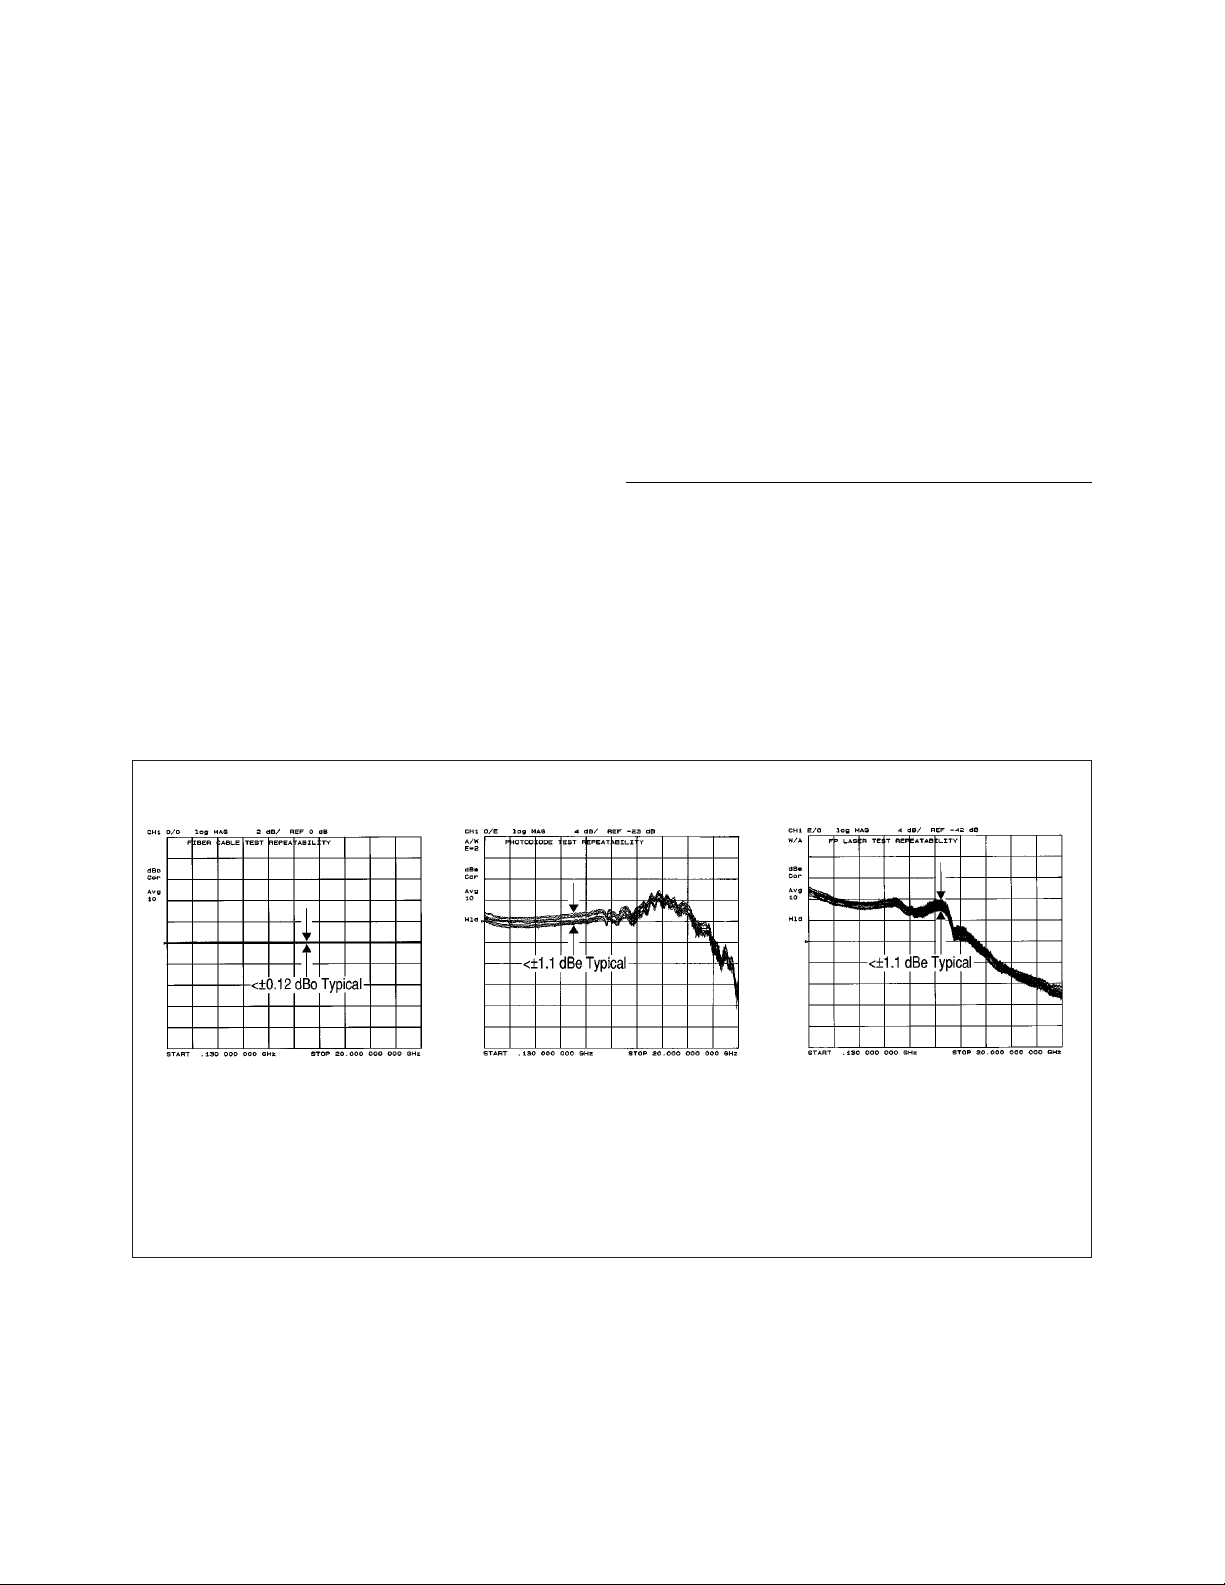
Measurement repeatability
Typical measurement repeatability represents how
measurement uncertainties can affect measurements made
on different 8703A instruments. Each graph below shows
data of the same device tested on 10 different 8703A
instruments. All measurements were done using a 30 Hz
IF bandwidth, a 10 averaging factor and a 23 ±3°C
temperature range.
Optical-to-optical
measurement
repeatability (typical)
(DUT = 2 meter single
mode fiber)
Optical-to-electrical
measurement
repeatability (typical)
(DUT = photodiode
receiver)
Electrical-to-optical
measurement
repeatability (typical)
(DUT = FP laser
source)
10
Lightwave measurement
accuracy examples
Page 11

Electricalto-electrical
transmission test
(DUT = filter)
Electrical
reflection test
(DUT = filter)
Specifications describe the instrument’s warranted performance for the
temperature range of 23 ±3°C after a three hour warm-up. Supplemental
characteristics describe useful, non-warranted performance parameters.
These are denoted as “typical” or “nominal”.
Table 6. System
dynamic range
31
Frequency range (GHz)
0.13 to 0.5 0.5 to 2 2 to 8 8 to 20
Forward transmission (S21) 105 dBe 103 dBe 102 dBe 100 dBe
Reverse transmission (S12) 45 dBe 62 dBe 75 dBe 75 dBe
Microwave source characteristics
Frequency
Bandwidth: 130 MHz to 20 GHz
Resolution:
Start/stop/center/CW: 1 Hz
Stability: ±0.8 ppm (typical) at 23 ±3°C
±3.0 ppm/year (typical) at 23 ±3°C
Accuracy: 10 ppm
Output
Power range:
+5 to –50 dBm (3.2 mW to 0.01 µW) in 5 dB steps from
port 1
–15 to –70 dBm (32 µW to 0.1 nW) in 5 dB steps from
port 2
Power flatness: ±3 dB (at 0 dBm port 1 output power, at
–20 dBm port 2 output power (plus coupler roll-off))
Harmonics power level:
<–15 dBc at 0 dBm output power (typical)
Impedance: 50 ohms (nominal)
Bias port
DC bias: 500 mA, 40 VDC maximum
Microwave receiver characteristics
Frequency
Bandwidth: 130 MHz to 20 GHz
Impedance: 50 ohms (nominal)
Maximum input power operating level: 0 dBm
(1.0 mW)
Input power damage level: +20 dBm (100 mW)
System sensitivity (using 10 Hz IF bandwidth,
16 averages): –110 dBm (0.01 pW) (typical)
Measurement examples
The following graphs show device (DUT) measurements
compared to typical (– – –) 8703A measurement ranges
32
.
31
Limited by maximum output power and system noise floor. Specified
for an IF bandwidth of 10 Hz, using a full 2-port measurement
calibration (including an isolation calibration performed with an
averaging factor of 16). Dynamic range is tested for transmission
measurements only; dynamic range for reflection measurements is
limited in practice by directivity.
32
The 85052D RF Calibration Kit was used for this measurement
calibration.
11
Frequency domain
microwave performance
summary
Page 12
Measurement uncertainty
Transmission test (S21)
36
Reflection test (S11)
37
Microwave measurement accuracy for the 8703A analyzer
is presented in the following graphs and tables. All data is
taken after an 8703A accuracy enhancement using the
calibration type shown. This analysis accounts for the
following errors
33
:
• Residual systematic errors (Table 7)
• System dynamic accuracy (dB from reference)
34
• 3.5 mm connector repeatability
• Switch repeatability
35
• Noise
A 10 Hz IF bandwidth, a 16 averaging factor and a
23 ±3°C temperature range are used in all cases.
Microwave transmission
and reflection
Measurement setup
Calibration type: full 2-port & isolation
Calibration Standards: Agilent 85052D RF calibration kit
Connectors and cables: 3.5 mm RF connectors
85131E RF cable
The following table shows 8703A residual systematic errors
after accuracy enhancement using the same calibration and
setup as for the microwave measurements below.
Table 7. Residual
microwave
measurement
systematic errors.
Frequency range (GHz)
0.13 to 0.5 0.5 to 2 2 to 8 8 to 20
Directivity 40 dB 40 dB 38 dB 36 dB
Source port return loss3830 dB 30 dB 30 dB 29 dB
Receiver port return loss3835 dB 35 dB 30 dB 30 dB
Reflection tracking
39
±0.10 dB ±0.10 dB ±0.10 dB ±0.20 dB
Transmission tracking
39
±0.10 dB40±0.10 dB40±0.12 dB ±0.15 dB
Magnitude Phase
Magnitude Phase
33
Additional technical information about microwave measurement
error analysis and calibration is available upon request from an
Agilent Technologies representative.
34
Crosstalk effects are included in dynamic range and dynamic
accuracy specification.
35
Cable stability and system drift are not included.
36
The graphs for transmission measurements assume a well-matched
device (S11 = S22 = 0).
37
The graphs shown for reflection measurement uncertainty apply to
a one-port device.
38
Before calibration accuracy enhancement the source match is 10 dB
return loss and the receiver is 12 dB return loss.
39
Tracking includes switch repeatability, temperature stability and
frequency response.
40
Reverse transmission tracking (S12) is ±0.25 dB from 0.13 to
0.5 GHz, and ±0.15 dB from 0.5 to 2.0 GHz.
12
Microwave measurement
accuracy summary
Page 13

Introduction
Analog and digital device design, testing and trouble
shooting are made easier by using both the distance-time
domain and frequency domain capabilities of the 8703A.
This combination lets the user:
1) Discover if a problem exists.
2) Locate and quantify potential causes of the problem
(i.e. unexpected reflections, attenuations, etc.)
3) Simulate frequency domain and distance-time
domain results with unwanted responses
mathematically removed using the Gating function.
Method
A step or impulse response is simulated by processing
frequency domain data through an inverse Fast Fourier
Transform (FFT). This produces a linear distance-time
response. This is similar to a time domain reflectometer
(TDR) response done with a broadband oscilloscope
and a small signal step or impulse stimulus. Data is
displayed in a parameter-versus-time format for
transmission and reflection parameters.
Features
Measurement range is the maximum distance or time
span that can be displayed given that the test signal stays
within the dynamic range of the 8703A. Range (Ta), also
called “alias free range”, is defined below:
Ta = (N-1) / Freq. Span
where “N” = number of CRT data points
42
. If N = 201 points
and Freq. Span = 20 GHz then Ta = 10 nano- seconds (or
approximately 2 meters in fiber cable with a 1.4 index of
refraction). Longer ranges are achieved by changing the
key parameters.
Measurement range-resolution is a measure of the
8703A’s ability to locate a single response and is defined as:
Tr = (Time Span) / (N-1)
where the “Time Span” is the span of time displayed on the
8703A’s CRT. “N” is the number of display data points
41
.
For example, range-resolution is 0.5 pico- seconds for a
time span of 0.4 nanoseconds and N = 801 in the bandpass
mode. This is approximately 0.1 mm in single-mode fiber.
Response resolution is the smallest distance or time
between two responses, where each response can be
identified. Response resolution is estimated for the three
stimulus types available in the 8703A:
Lowpass step response42:
Tr = (0.45 / Fspan) x 1.0 (min.) window factor
2.2 (normal)
3.3 (max.)
Lowpass impulse response
43
:
Tr = (0.6 / Fspan) x 1.0 (min.) window factor
1.6 (normal)
2.4 (max.)
Bandpass impulse response
43
:
Tr = 2 X (0.6 / Fspan) x 1.0 (min.) window factor
1.6 (normal)
2.4 (max.)
Where the “Fspan” is the frequency span of the frequency
domain measurement. For example, if the Fspan is 20 GHz
and a normal window factor is used for the lowpass impulse
mode, then the response-resolution is 48.5 picoseconds
(approximately 5 mm of separation between reflection
responses in fiber cable)
44
.
Window factors control the pulse width or step rise time
used in the inverse Fourier transform. Minimum, normal
and maximum windows are user selected to make trade
offs between time resolution versus overshoot and ringing
in the response.
Distance-time markers can be used to automatically
calculate and display length and location of optical and
electrical responses. The relative velocity factor or
refractive index value used in the marker calculations can
and should be set to match the medium being used.
Gating enables some frequency domain and distance-time
domain test conditions to be isolated and simulated.
For example, unwanted reflection and transmission paths
within a device can affect a device's response. Gating
enables the effect of these unwanted paths to be marked
and mathematically removed in the distance-time domain.
This new simulated response can also be viewed in the
frequency domain while the gating function is active.
In this way the simulated effect of a design change can
be evaluated.
41
Lowpass impulse and step modes have a 201 CRT data point
maximum limit. This does not apply to the bandpass mode.
42
Effective rise time of the 8703A’s step signal is equal to the
response resolution “Tr”.
43
Effective pulse width (full-width-half-maximum) of the 8703A’s
impulse signal is equal to the response resolution “Tr”.
44
Calculated time is for the actual distance traveled. Reflection paths
must be considered to estimate physical locations. The 8703A
automatically calculates the distance traveled for a reflection
measurement and displays the “one way” path length. Multiple
reflections in transmission paths are not automatically accounted for.
13
Distance-time domain
performance summary
Page 14

Frequency bandwidth (GHz)
Measurement description 0.13 to 12.0 0.13 to 20
Lightwave forward
transmission measurement
Optical-to-optical 51 dBo 51 dBo
Optical-to-electrical 110 dBe 110 dBe
Electrical-to-optical 95 dBe 95 dBe
Lightwave reflection measurement
Optical (Impulse mode only) 44 dBo 44 dBo
Microwave forward
transmission measurement
Electrical-to-electrical 110 dBe 110 dBe
Microwave reflection measurement
Electrical (Impulse mode only) 56 dBe 56 dBe
Signal shape examples
The following are graphs of impulse and step signals
generated by the inverse FFT of the 8703A using a 20 GHz
Fspan. Electrical (dBe) and electro-optical (dBe) cases
are not presented since the signal shape is similar to the
lightwave examples shown.
Lightwave
impulse response
transmission test
(DUT = 21 cm single
mode fiber)
Lightwave
step response
transmission test
(DUT = 21 cm single
mode fiber)
45
Limited by maximum lightwave receiver input power, maximum
microwave power and system noise floor. Specified for a 20 GHz
frequency bandwidth, a normal window factor, a 10 Hz IF bandwidth,
a 16 averaging factor and after an appropriate calibration has been
performed (i.e., response & isolation calibration for optical tests,
response & match and isolation calibration for electrical-to-optical and
optical-to-electrical tests, or full 2-port and isolation calibration for
electrical test).
Table 8. Single response
system dynamic range
45
(for distance-time
lowpass impulse and step
response modes, typical).
14
Distance-time domain
performance summary
cont'd
Page 15

Group delay measurements
Group delay is computed by measuring the phase change
within a specified frequency aperture (determined by the
frequency span and the number of points per sweep).
The phase change, in degrees, is then divided by the
frequency aperture, in Hz (times –360).
Aperture
Determined by the frequency span, the number of
steps per sweep, and the amount of smoothing applied.
(Minimum aperture limited by source frequency resolution
of 1 Hz.)
Minimum aperture = (frequency span) / (number of
points–1)
Maximum aperture = 20 % of the frequency span
Range
The maximum delay is limited to measuring no more
than ±180 degrees of phase change within the minimum
aperture. For example, with a minimum aperture of
1 Hz, the maximum delay that can be measured is
500 milliseconds.
Accuracy
Accuracy is a function of the uncertainty in determining
the phase change. The following is a general formula for
calculating typical accuracy, in seconds, for a specific
group delay measurement.
±0.003 x Phase Uncertainty (deg)
Aperture (Hz)
Data accuracy enhancement
Lightwave measurement calibration types
Response: Simultaneously accounts for magnitude and
phase errors due to a system’s modulation frequency
response. This applies for either transmission or reflection
tests.
Response and match: Accounts for magnitude and
phase responses as well as microwave source and receiver
return loss errors. The isolation part of this calibration
can be included to compensate for directivity (reflection)
and crosstalk (transmission).
Response and isolation: Compensates for modulation
frequency responses plus directivity (reflection) or
crosstalk (transmission).
Microwave measurement calibration types
Frequency response: Simultaneously corrects for
magnitude and phase frequency response errors for either
reflection or transmission measurements.
Response/isolation cal: Compensates for frequency
response plus directivity (reflection) or crosstalk
(transmission).
1-port cal: Correction of test set port 1 or port 2
directivity, frequency response and source match errors.
2-port cal: Compensates for directivity, source match,
reflection frequency response, load match, transmission
frequency response, and crosstalk.
Reference plane extension
Applies to lightwave and microwave. Redefines the plane
of the measurement reference (zero phase) to other
than the source or receiver ports of the lightwave and
microwave test sets. Is defined in seconds of delay from
the test set port and ranges between ±10 seconds.
Calibration kits
Select from standard lightwave and microwave calibration
kits. Lightwave calibration kits are internally defined for
an optical “thru” and “Fresnel”. Microwave calibration
kits for 3.5mm, 7mm, or type-N 50 ohm connectors are
also defined for electrical “open”, “shorts” and loads
(sliding or fixed broadband loads). Customized calibration
kits, called “User Kits”, can be be defined or modified,
and saved and recalled internally or from disc, for use
with other calibration kits.
Data averaging
IF bandwidth: Selectable from 10 Hz, 30 Hz, 100 Hz,
300 Hz, 1 kHz, and 3 kHz bandwidths.
Sweep-to-sweep averaging: Averages vector data on
each successive sweep. Averaging factors range from
1 to 999.
Segmented cal
Perform a single calibration in frequency list sweep mode
for all segments. Afterwards, calibration remains valid for
any one segment selected from the list.
Frequency subset cal
Perform a calibration in linear sweep mode, up to 1601
points over entire frequency range. Afterwards, calibration
remains valid for any frequency subset (smaller frequency
range within endpoints used during calibration). Analyzer
measures over nearest arbitrary number of cardinal
calibration points.
15
General
information
Page 16

Environmental
characteristics
Operating temperature
0 to 55°C
Warranted temperature
23 ±3°C
Non-operating storage
temperature
–40° to +70°C
8703A Lightwave
Component Analyzer
Power: 47.5 to 66 Hz: 90 to 132 volts,
198 to 264 volts, 350 VA (for top plug)
+95 VA (for bottom plug) = 445 VA
total maximum
Weight: Net, 50 kg (110 lb.);
shipping, 57 kg (125 lb.)
Dimensions: 370 H x 425 W x
502 mm D (14.57 H x 16.73 W x
19.76 in. D) Allow 50 mm (2.0 in.)
additional depth for front panel
connectors.
83424A and 83425A
Lightwave CW Sources
Power: 90 to 132 volts, 198 to
264 volts, 95 VA maximum
Weight: Net, 7.5 kg. (16.5 lb.);
shipping, 9.0 kg (19.8 lb.)
Dimensions: 88.9 H x 425 W x
502 mm D (3.5 H x 16.75 W x
19.75 in. D)
For more information about Agilent Technologies
test and measurement products, applications,
services, and for a current sales office listing,
visit our web site,
www.agilent.com/comms/lightwave
You can also contact one of the
following centers and ask for a test and
measurement sales representative.
United States:
Agilent Technologies
Test and Measurement Call Center
P.O. Box 4026
Englewood, CO 80155-4026
(tel) 1 800 452 4844
Canada:
Agilent Technologies Canada Inc.
5150 Spectrum Way
Mississauga, Ontario
L4W 5G1
(tel) 1 877 894 4414
Europe:
Agilent Technologies
Test & Measurement
European Marketing Organisation
P.O. Box 999
1180 AZ Amstelveen
The Netherlands
(tel) (31 20) 547 2000
Japan:
Agilent Technologies Japan Ltd.
Measurement Assistance Center
9-1, Takakura-Cho, Hachioji-Shi,
Tokyo 192-8510, Japan
(tel) (81) 426 56 7832
(fax) (81) 426 56 7840
Latin America:
Agilent Technologies
Latin American Region Headquarters
5200 Blue Lagoon Drive, Suite #950
Miami, Florida 33126, U.S.A.
(tel) (305) 267 4245
(fax) (305) 267 4286
Australia/New Zealand:
Agilent Technologies Australia Pty Ltd
347 Burwood Highway
Forest Hill, Victoria 3131
(tel) 1-800 629 485 (Australia)
(fax) (61 3) 9272 0749
(tel) 0 800 738 378 (New Zealand)
(fax) (64 4) 802 6881
Asia Pacific:
Agilent Technologies
24/F, Cityplaza One, 1111 King’s Road,
Taikoo Shing, Hong Kong
(tel) (852) 3197 7777
(fax) (852) 2506 9284
Technical data subject to change
Copyright © 1990, 2000
Agilent Technologies
Printed in U.S.A. 7/00
5952-1754E
 Loading...