

Page 1

HP 4395A
Network/Spectrum/Impedance Analyzer
Technical Specifications
Specifications describe the instrument's warranted performance over the temperature range of 0°C to 40°C
(except as noted). Supplemental characteristics are intended to provide information that is useful in applying
the instrument by giving non-warranted performance parameters. These are denoted as SPC (supplemental
performance characteristics), typical, or nominal. Warm up time must be greater than or equal to 30 minutes
after power on for all specifications.
Network Measurement
Source Characteristics
Frequency Characteristics
Range
Resolution
Frequency reference
Accuracy
Aging
Initial achievable accuracy
Temperature stability
Precision frequency reference (option 1D5)
Accuracy
Aging
Initial achievable accuracy
Temperature stability
................................................................... 10 Hz to 500 MHz
........................................................................ 1 mHz
at 23 ± 5°C, referenced to 23°C ................................................ <±5.5 ppm
.............................................................. <±2.5 ppm/year (SPC)
............................................... <±1.0 ppm (SPC)
at 23 ± 5°C, referenced to 23°C .............................................. <±2ppm (SPC)
at 0°C to 40°C, referenced to 23°C ............................................. <±0.13 ppm
.............................................................. <±0.1 ppm/year (SPC)
.............................................. <±0.02 ppm (SPC)
at 0°C to 40°C, referenced to 23°C ........................................ <±0.01 ppm (SPC)
Output Characteristics
Power range
Level accuracy
at 0 dBm output, 50 MHz, 23 ± 5°C, .................................................. ±1.0 dB
Level linearity
........................................................... –50 dBm to +15 dBm
Output Power Linearity
≥ –40 dBm
< –40 dBm
1 at relative to 0 dBm output, 50 MHz, 23 ± 5°C
1
±1.0 dB
±1.5 dB
Page 2

Flatness
at 0 dBm output, relative to 50 MHz, 23 ± 5°C ........................................... ±2 dB
Resolution
........................................................................ 0.1 dB
Spectral Purity Characteristics
Harmonics
at +10 dBm output ........................................................... <–30 dBc
Non-harmonics spurious
at +10 dBm output ........................................................... <–30 dBc
Noise sidebands
at ≥10 kHz offset from carrier ................................................. <–95 dBc/Hz
Power sweep range
........................................................... 20 dB max.
Power sweep linearity
deviation from linear power referenced to the stop power level ......................... ±0.5 dB
Impedance
................................................................ 50 Ω nominal
Return loss
frequency ≤ 200 MHz ....................................................... >15 dB (SPC)
frequency > 200 MHz .......................................................... >7 dB (SPC)
Connector
............................................................... Type N female
2
Page 3

Receiver Characteristics
Input Characteristics
Frequency range
Input attenuator
.......................................................... 10 Hz to 500 MHz
..................................................... 0 to 50 dB, 10 dB step
Full scale input level (R,A,B)
Attenuator setting (dB) Full scale input level
0 –10 dBm
10 0 dBm
20 +10 dBm
30 +20 dBm
40 +30 dBm
50 +30 dBm
IF bandwidth (IFBW)
................................... 2, 10, 30, 100, 300, 1 k, 3 k, 10 k, 30 kHz
Note: The IFBW should be set to less than 1/5 of the lowest frequency in the sweep range.
Noise level (referenced to full scale input level, 23 ± 5°C)
at 10 Hz ≤ frequency < 100 Hz, IFBW=2 Hz ...................................... –85 dB (SPC)
at 100 Hz ≤ frequency < 100 kHz, IFBW=10 Hz .......................................... –85 dB
at 100 kHz ≤ frequency, IFBW=10 Hz ................................................ –115 dB
Input crosstalk
for input R ... +10 dBm input, input attenuator: 20 dB
for input A, B ... input attenuator: 0 dB
at <100 kHz
R through A, B ............................................................... <–100 dB
others ................................................................. <–100 dB (SPC)
at ≥100 kHz
R through A, B ............................................................... <–120 dB
others ................................................................. <–120 dB (SPC)
Source Crosstalk (for input A, B)(typical for input R)
at +10 dBm output, <100 kHz , input attenuator: 0 dB ................................. <–100 dB
at +10 dBm output, ≥100 kHz , Input attenuator: 0 dB ................................. <–120 dB
Multiplexer switching impedance change
at Input attenuator 0 dB ....................................................... <0.5% (SPC)
at Input attenuator 10 dB and above ............................................. <0.1% (SPC)
Connector
Impedance
................................................................. Type N female
.................................................................. 50 Ω nominal
Return loss
Input attenuator
0 dB 10 dB 20 dB to 50 dB
10 Hz ≤ frequency < 100 kHz
100 kHz ≤ frequency ≤ 100 MHz
100 MHz < frequency 15 dB
25 dB
25 dB
1
25 dB1 25 dB
1
25 dB 25 dB
1
15 dB 15 dB
1
1
1
1 SPC
Maximum input level
............................. +30 dBm (at input attenuator: 40 dB or 50 dB)
Maximum safe input level
.......................................... +30 dBm or ±7 Vdc (SPC)
3
Page 4
Magnitude Characteristics
Absolute amplitude accuracy (R, A, B)
at –10 dBm input, input attenuator: 10 dB, frequency ≥100 Hz, IFBW ≤ 3 kHz, 23 ± 5°C, ...... <±1.5 dB
Ratio accuracy (A/R, B/R) (typical for A/B)
at –10 dBm input, input attenuator: 10 dB, IFBW ≤ 3 kHz, 23 ± 5°C, ....................... <±2 dB
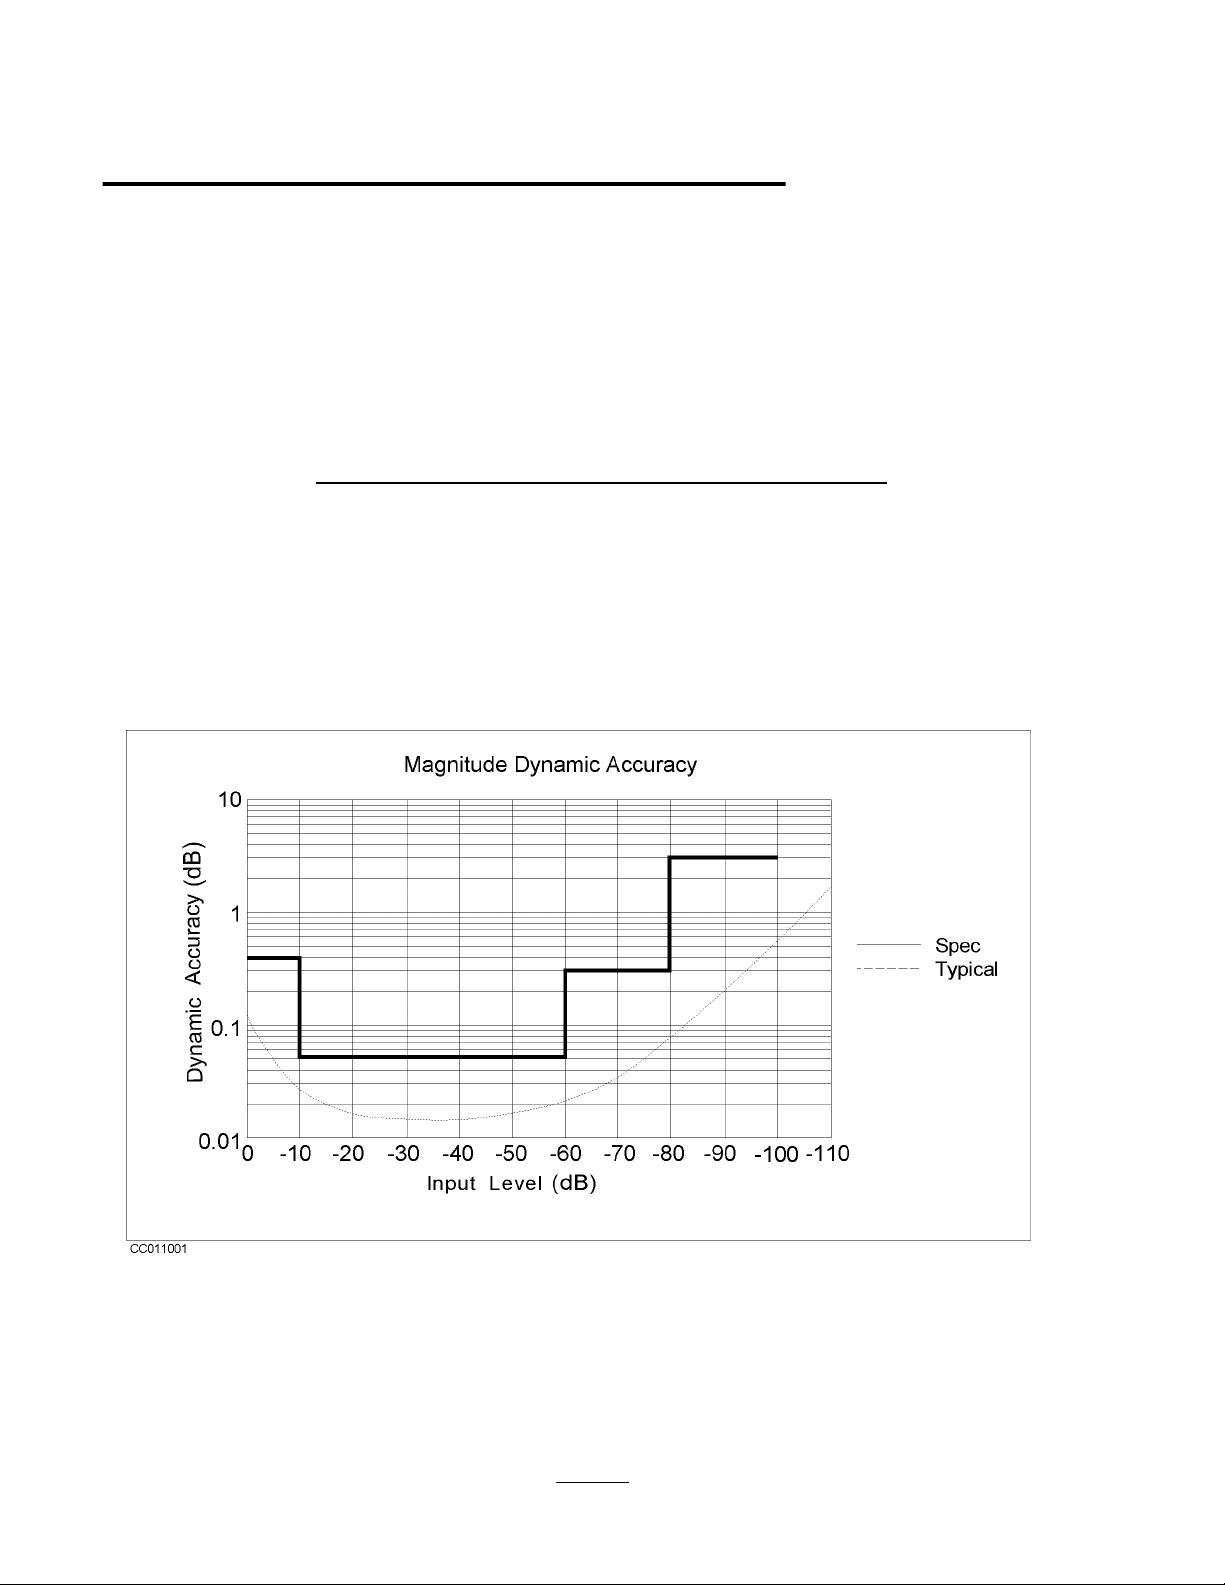
Dynamic accuracy (A/R, B/R) (typical for A/B)
Input Level
(relative to full scale input level –10 dB)
0 dB ≥ input level > –10 dB
–10 dB ≥ input Level ≥ –60 dB
–60 dB > input level ≥ –80 dB
–80 dB > input level ≥ –100 dB
1. R input level (B input level for A/B) = full scale input level –10 dB, IFBW = 10 Hz, 23 ± 5°C
Dynamic Accuracy
frequency ≥ 100 Hz
±0.4 dB
±0.05 dB
±0.3 dB
±3 dB
1
Figure 1-1. Magnitude Dynamic Accuracy
4
Page 5
Residual responses
.................................................. <–80 dB full scale (SPC)
Trace noise (A/R, B/R, A/B)
at 50 MHz, both inputs: full scale input level –10 dB, IFBW = 300 Hz ............ <0.005 dB rms (SPC)
Stability (A/R, B/R, A/B)
................................................ < ±0.01 dB/°C (SPC)
Phase Characteristics
Measurements format
................................. Standard format, Expanded phase format
Frequency response (deviation from linear phase) (A/R, B/R) (SPC for A/B)
at –10 dBm input, input attenuator: 10 dB, IFBW ≤ 3 kHz, 23 ± 5°C ......................... < ±12°
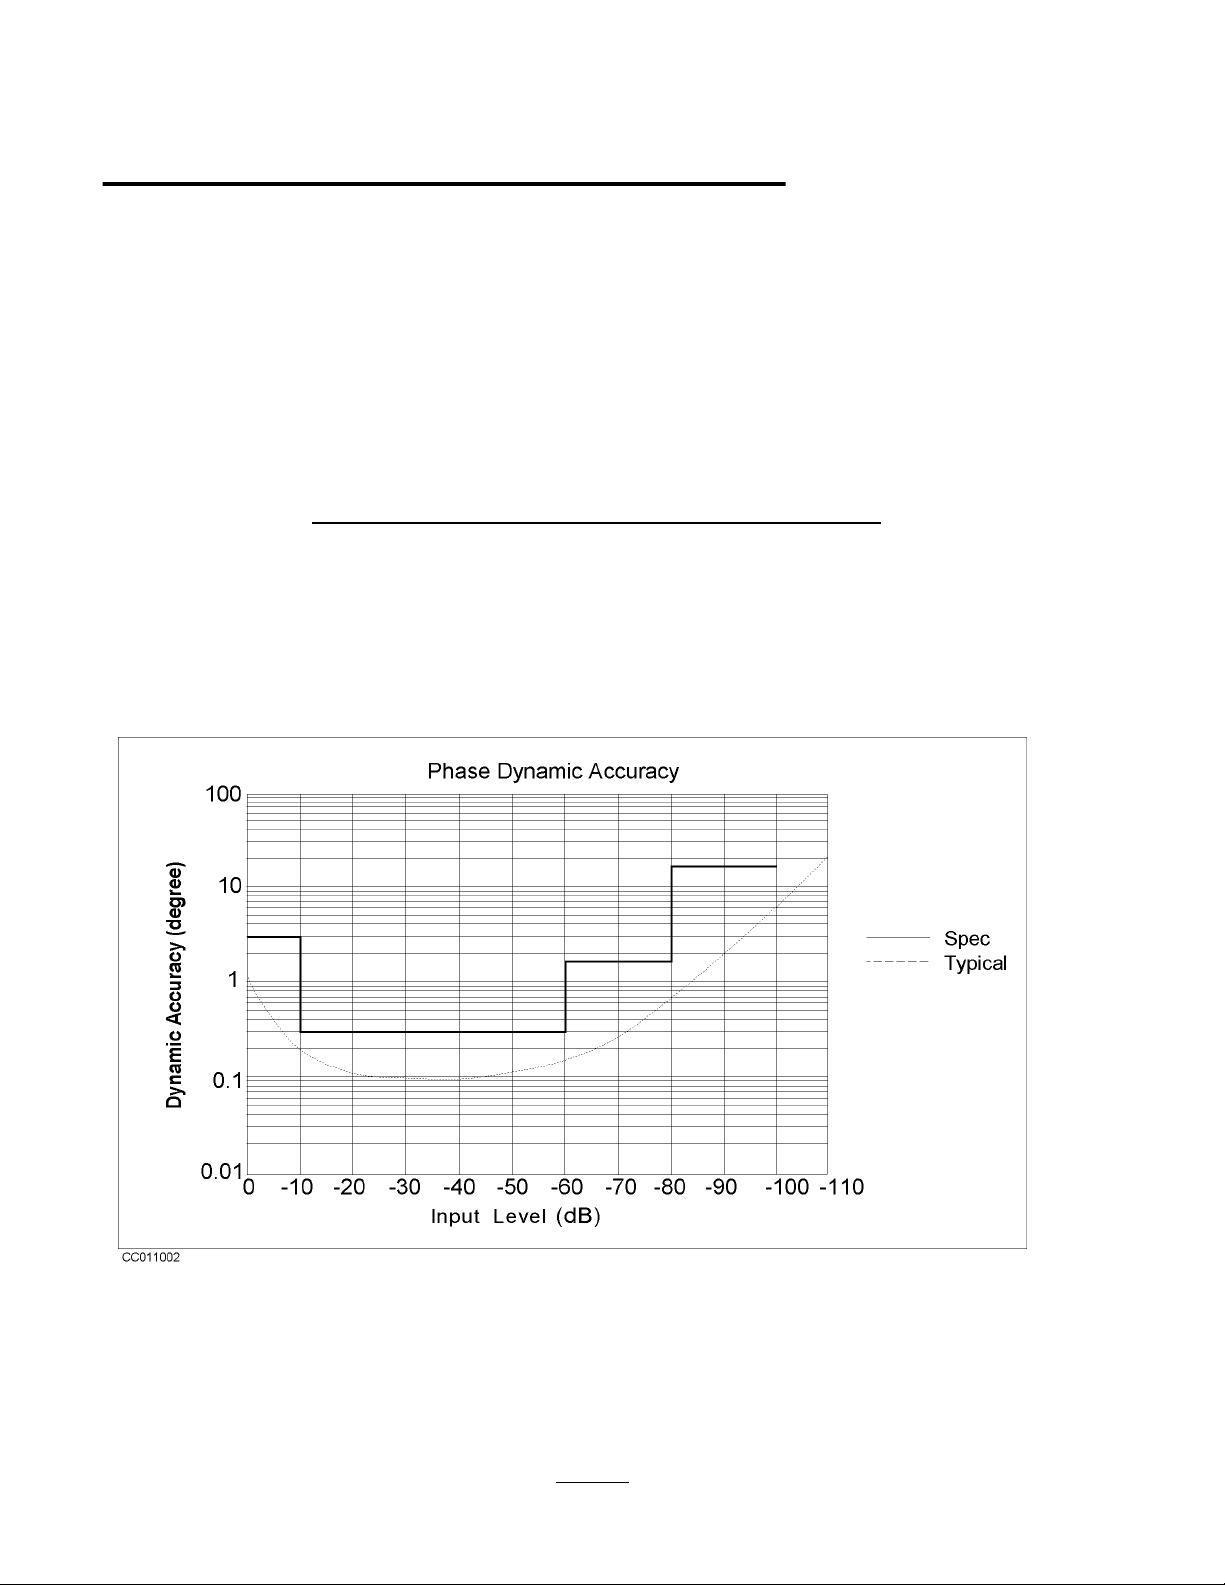
Dynamic accuracy (A/R, B/R) (SPC for A/B)
(relative to full scale input level –10 dB)
Input Level
0 dB ≥ input level > –10 dB
–10 dB ≥ input level ≥ –60 dB
–60 dB > input level ≥ –80 dB
–80 dB > input level ≥ –100 dB
1. R input level (B input level for A/B) = full scale input level –10 dB, IFBW = 10 Hz, 23 ± 5°C
Dynamic Accuracy
frequency ≥ 100 Hz
±3°
±0.3°
±1.8°
±18°
1
Figure 1-2. Phase Dynamic Accuracy
Trace noise (A/R, B/R, A/B)
at 50 MHz, both inputs: full scale input level –10 dB, IFBW=300 Hz ................ <0.04° rms (SPC)
Stability (A/R, B/R, A/B)
.................................................. < ±0.1 °/°C (SPC)
5
Page 6

Group Delay Characteristics
Aperture [Hz]
......................................................... 0.25% to 20% of span
Accuracy
In general, the following formula can be used to determine the accuracy, in seconds, of a specific group
delay measurement:
................................................................
PhaseAccuracy(deg ree
Aperture(Hz)×360(degree
Sweep Characteristics
Sweep type
Sweep direction
Trigger type
Trigger source
Event trigger
............................... Linear frequency, Log frequency, Power, List frequency
....................................................... Upper direction only
....................................... Hold, Single, Number of groups, Continuous
................................. Internal (free run), External, Manual, HP-IB (bus)
.......................................................... On point, On sweep
)
)
6
Page 7

]
Spectrum Measurement
Frequency Characteristics
Frequency range
Frequency readout accuracy
............................ ±((freq readout[Hz])×(freq ref accuracy[1])+RBW[Hz]+
.......................................................... 10 Hz to 500 MHz
where NOP means number of display points
SPAN[Hz
NOP
−
1
Frequency reference
Accuracy
at 23 ± 5°C, referenced to 23°C ................................................. <±5.5 ppm
Aging
Initial achievable accuracy
.............................................................. <±2.5 ppm/year (SPC)
............................................... <±1.0 ppm (SPC)
Temperature stability
at 23 ± 5°C, referenced to 23°C ............................................. <±2 ppm (SPC)
Precision frequency reference (option 1D5)
Accuracy
at 0°C to 40°C, referenced to 23°C ............................................. <±0.13 ppm
Aging
Initial achievable accuracy
.............................................................. <±0.1 ppm/year (SPC)
.............................................. <±0.02 ppm (SPC)
Temperature stability
at 0°C to 40°C, referenced to 23°C ........................................ <±0.01 ppm (SPC)
Resolution bandwidth (RBW)
Range
3 dB RBW at span > 0 ................................................ 1 Hz to 1 MHz, 1-3 step
3 dB RBW at span = 0 ............... 3k, 5k, 10k, 20k, 40k, 100k, 200k, 400k, 800k, 1.5M, 3M, 5MHz
Selectivity
(60 dB BW / 3 dB BW)
at span > 0 ........................................................................ <3
Mode
....................................................................Auto or Manual
Accuracy
at span > 0 ..................................................................... <±10%
at span = 0 ..................................................................... <±30%
Video bandwidth (VBW)
Range
at span > 0 .................................. 3 mHz to 3 MHz, 1-3 step, 0.003 ≤ VBW/RBW ≤ 1
]
))[Hz
7
Page 8
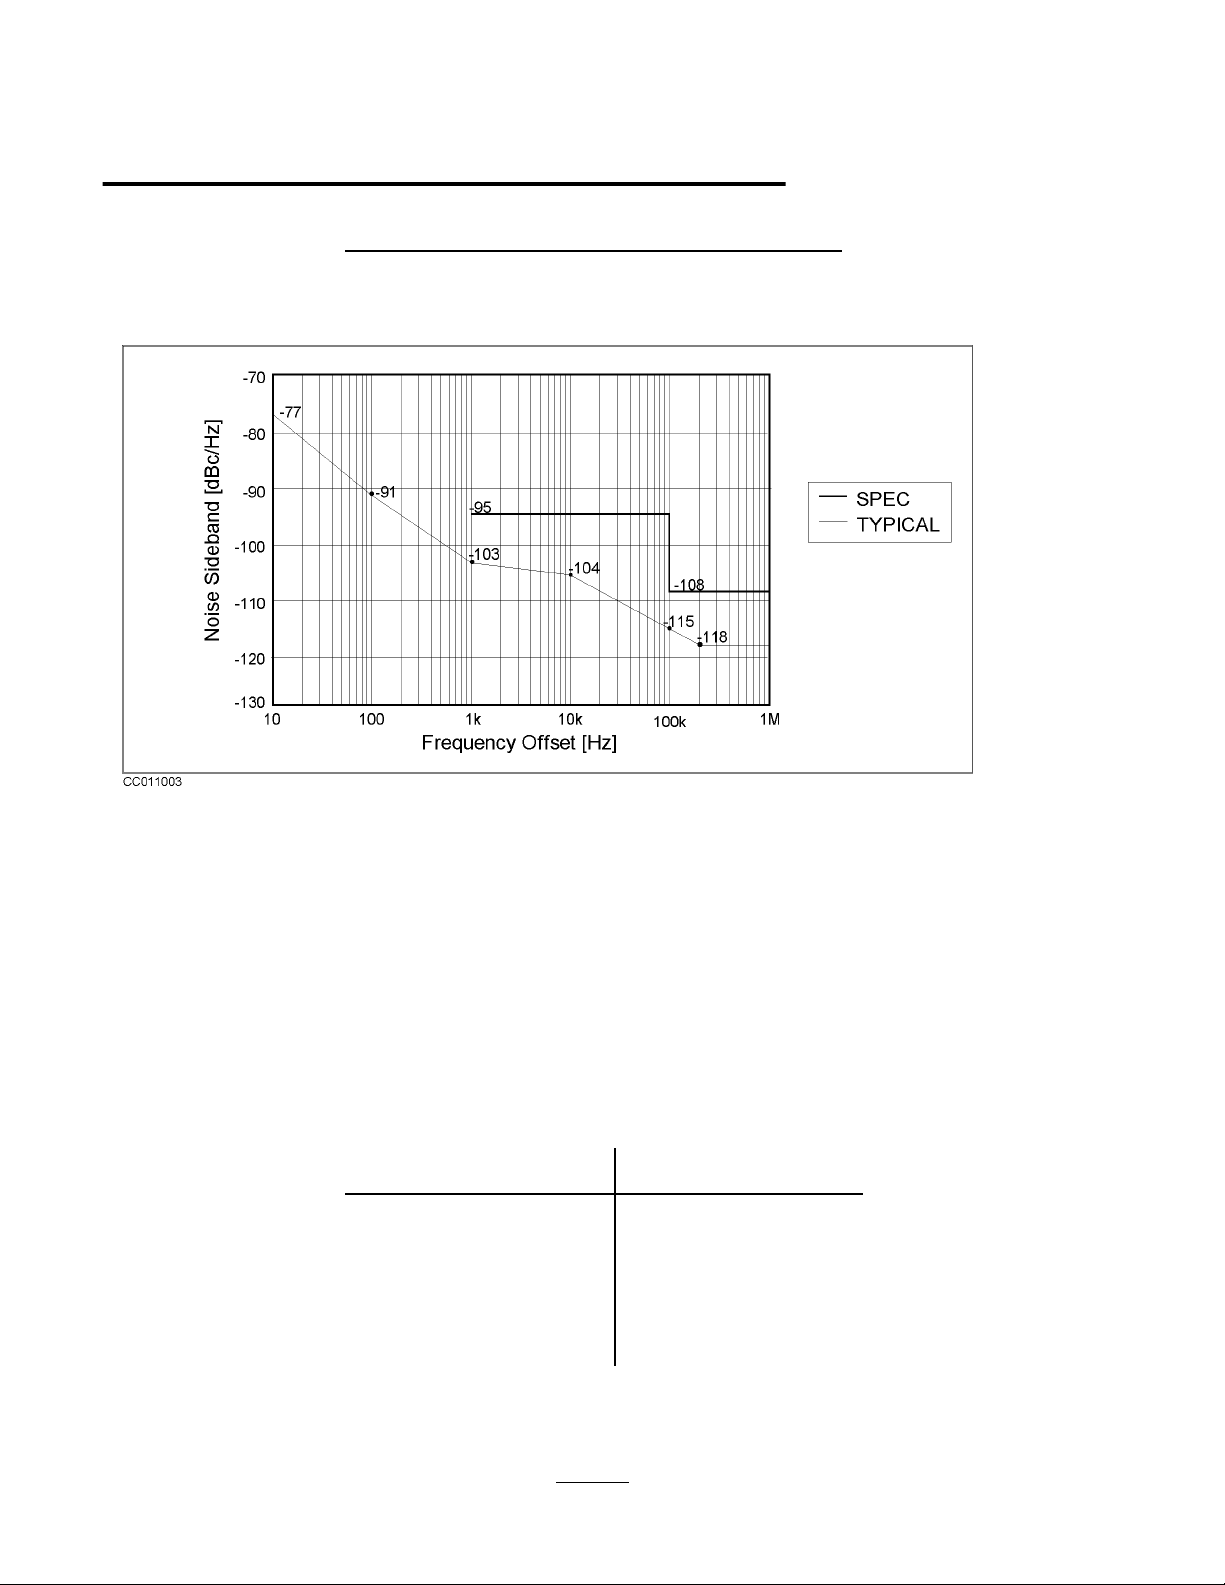
Noise sidebands
Offset from Carrier Noise Sidebands
≥1 kHz
≥100 kHz
< –95 dBc/Hz
< –108 dBc/Hz
Figure 1-3. Noise Sidebands
Amplitude Characteristics
Amplitude range
Reference value setting range
...................................... displayed average noise level to +30 dBm
.......................................... –100 dBm to +30 dBm
Level accuracy
at –20 dBm input, 50 MHz, input attenuator: 10 dB, 23 ± 5°C ............................ <±1.0 dB
Frequency response
at –20 dBm input, input attenuator: 10 dB, referenced to level at 50 MHz, 23 ± 5°C
frequency ≥ 100 Hz .............................................................. <±1.5 dB
frequency < 100 Hz .............................................................. <±3.0 dB
Amplitude fidelity
Log scale
2
1
Range
(dB to reference input level) [dB]
0 to –30 ±0.05
–30 to –40 ±0.1
–40 to –50 ±0.2
–50 to –60 ±0.5
–60 to –70 ±1.0
–70 to –80 ±3.0
Amplitude Fidelity
[dB]
8
Page 9
Linear scale
1
Fidelity shows an extent of nonlinearity referenced to the reference input level.
2
RBW = 10 Hz, –20 dBm ≤ reference value ≤ +30 dBm, reference input level=full scale input level –10 dB, 23 ± 5°C
2
..................................................................... <±3%
Note: Refer to Input attenuator part for the definition of full scale input level.
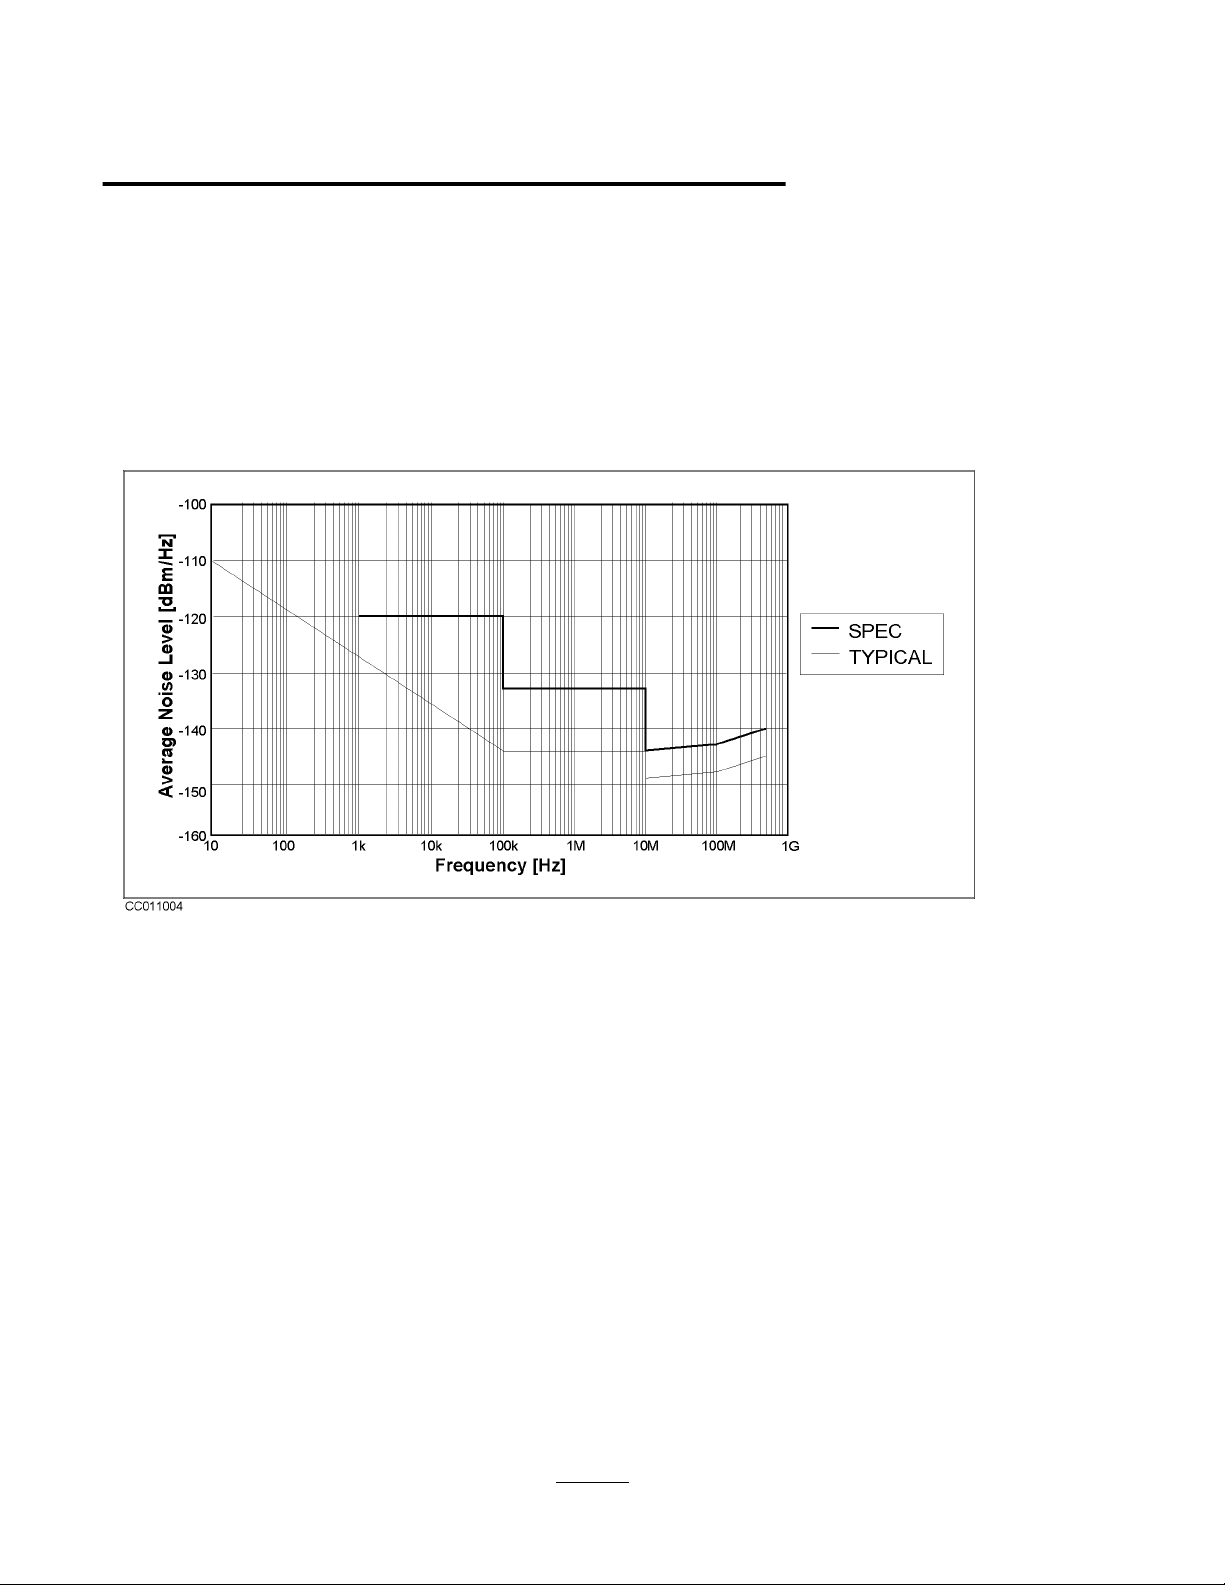
Displayed average noise level
at reference value ≤–40 dBm, input attenuator: auto or 0 dB
at frequency ≥1 kHz .......................................................... –120 dBm/Hz
at ≥100 kHz ................................................................ –133 dBm/Hz
at ≥10 MHz ............................................ (–145 + frequency/100 MHz) dBm/Hz
1
at start frequency ≥ 10 MHz
1
Figure 1-4. Typical Displayed Average Noise Level
9
Page 10

On-screen dynamic range
Figure 1-5. Typical On-screen Dynamic Range (Center: 100 MHz)
Spurious responses
Second harmonic distortion
at single tone input with full scale input level –10 dB, input signal frequency ≥ 100 kHz
..............................................................<–70 dBc, <–75 dBc (SPC)
Third order inter-modulation distortion
at two tones input with full scale input level –16 dB, separation ≥ 100 kHz
..............................................................<–75 dBc, <–80 dBc (SPC)
Spurious
at single tone input with full scale input level –10 dB, input signal frequency ≤ 500 MHz
............................................................................ <–75 dBc
except for the following frequency ranges:
5.6 MHz ±1 MHz, 30.6 MHz ±1 MHz, 415.3 MHz ±1 MHz
Residual response
at reference value setting ≤–40 dBm, input attenuator: auto or 0 dB .................... <–110 dBm
10
Page 11

Typical dynamic range
Figure 1-6. Typical Dynamic Range at Inputs R, A, and B
Input attenuator
Setting range
Mode
.......................................................................
.................................................... 0 dB to 50 dB, 10 dB step
Attenuator Setting (dB) Full Scale Input Level (dBm)
0 –20
10 –10
20 0
30 +10
40 +20
50 +30
Auto or Manual
(In auto mode, the attenuator is set to 20 dB above the reference value; this ensures that the maximum signal
level after the attenuator will not be greater than –20 dBm.)
Input attenuator switching uncertainty
at attenuator: ≤ 30 dB, referenced to 10 dB ............................................ <±1.0 dB
at attenuator: ≥ 40 dB, referenced to 10 dB ............................................. <±1.5 dB
Temperature drift
......................................................... <±0.05 dB/°C (SPC)
11
Page 12

Scale
Log
............................................................... 0.1 dB/div to 20 dB/div
Linear
–12
at watt ................................................................. 1.0 x10
at volt .................................................................. 1.0 x10
Measurement format
Display unit
....................................... dBm (unit of marker: dBm, dBV, dBµV, V, W)
................................................ Spectrum or Noise (/Hz)
W/div
–9
V/div
Sweep Characteristics
Sweep type
Trigger type
Trigger source
Sweep time
Zero span
.................................................................... Linear, List
....................................... Hold, Single, Number of groups, Continuous,
.............. Internal (free run), External, Manual, Level gate, Edge gate, HP-IB (bus)
(excluding each sweep setup time)
RBW SPAN Typical Sweep Time
1 MHz 500 MHz 190 ms
100 kHz 100 MHz 300 ms
10 kHz 10 MHz 240 ms
1 kHz 1 MHz 190 ms
100 Hz 100 kHz 270 ms
10 Hz 10 kHz 2.0 s
1 Hz 1 kHz 11 s
— Zero Span _1
1 See the next item for sweep time at zero span
RBW Minimum Resolution Maximum Sweep Time
5 MHz 40 ns 1.28 ms
100 kHz 1.28 µs 81.92 ms
3 k Hz 40.96 µs 2.62 s
Number of display points
at span > 0 .................................................. 2 to 801 points (automatically set)
at span = 0 ........................................................ 2 to 801 points (selectable)
12
Page 13

Input Characteristics
Input Port
Crosstalk
....................................................................... R, A, B
from any input to other inputs, at the same input attenuator settings .............. < –100 dB (SPC)
Connector
Impedance
................................................................. Type N female
.................................................................. 50 Ω nominal
Return Loss
Input Attenuator
0 dB 10 dB 20 dB to 50 dB
10 Hz ≤ frequency < 100 kHz
100 kHz ≤ frequency ≤ 100 MHz
100 MHz < frequency 15 dB
1
(SPC)
Input Leve
l .......................................... +30 dBm max. at input attenuator: 50 dB
Maximum safe input level
1
25 dB
25 dB
1
25 dB
1
.......................................... +30 dBm or ±7 Vdc (SPC)
1
25 dB
25 dB 25 dB
15 dB 15 dB
1
1
1
13
Page 14

Specifications when Option 1D6 Time-Gated spectrum analysis is installed
All specifications are identical to the standard HP 4395A except the following items.
Gate length
Range
..................................................................... 6 µs to 3.2 s
Resolution
Range of Gate Length(Tl ) Resolution
≤ 25 ms
6 µs ≤ T
25 ms < T
64 ms < T
130 ms < T
320 ms < T
1.28 s < T
l
≤ 64 ms
l
≤ 130 ms
l
≤ 320 ms
l
≤ 1.28 s
l
≤ 3.2 s
l
0.4 µs
1 µs
2 µs
5 µs
20 µs
100 µs
Gate delay
Range
..................................................................... 2 µs to 3.2 s
Resolution
Range of Gate Delay (Td) Resolution
2 µs ≤ T
25 ms < T
64 ms < T
130 ms < T
320 ms < T
1.28 s < T
≤ 25 ms
d
≤ 64 ms
d
≤ 130 ms
d
≤ 320 ms
d
≤ 1.28 s
d
≤ 3.2 s
d
Additional Amplitude Error
Log scale
Linear scale
Gate Control Modes
................................................................. < 0.3 dB (SPC)
................................................................. < 3% (SPC)
.......................................... Edge (positive/negative) or Level
Gate Trigger Input (External Trigger Input is used)
Connector
level
.............................................................................. TTL
................................................................. BNC female
Gate Output
Connector
level
.............................................................................. TTL
................................................................. BNC female
0.4 µs
1 µs
2 µs
5 µs
20 µs
100 µs
14
Page 15

HP 4395A Option 010 Impedance Measurement
The following specifications are applied when the HP 43961A Impedance Test Kit is connected to the
HP 4395A.
Measurement Functions
Measurement parameters Z, Y, L, C, Q, R, X, G, B, θ
Display parameters |Z|, θ
Display Formats
Vertical lin/log scale
Complex plane
Polar/Smith/admittance chart
Sweep Parameters
, R, X, |Y|, θy, G, B, |Γ|, θγ, Γx, Γ
z
, Cp, Cs, Lp, Ls, Rp, Rs, D, Q
y
Linear frequency sweep
Logarithmic frequency sweep
List frequency sweep
Power sweep (in dBm unit)
IF Bandwidth
2, 10, 30, 100, 300, 1k, 3k, 10k, 30k [Hz]
Calibration
OPEN/SHORT/LOAD 3 term calibration
Fixture compensation
Port extension correction
Measurement Port Type
APC-7
Output Characteristics
Frequency range ........................................................... 100 kHz to 500 MHz
Frequency resolution .................................................................. 1 mHz
Output impedance ............................................................... 50 Ω nominal
Output Level
when the measurement port is terminated by 50 Ω
when the measurement port is open .................................... 0.71 mVrms to 1.26 Vrms
1
Note: When the measurement port is terminated with 50 Ω, the signal level at the measurement port is 6
1
................................ –56 to +9 dBm
dB lower than the signal level at the RF OUT port.
Resolution ......................................................................... 0.1 dBm
Level accuracy ................................................... ± (A + B + 6
x F/(1.8 x 10
9
))dB
Where
A = 2 dB
B = 0 dB (at 0 dBm ≤ P ≤ +15 dBm)
or B = 1 dB (at –40 dBm ≤ P < 0 dBm)
or B = 2 dB (at –50 dBm ≤ P < –40 dBm)
F is setting frequency [Hz], P is output power setting
15
Page 16

Measurement Basic Accuracy (Supplemental Performance Characteristics)
Measurement accuracy is specified at the connecting surface of the APC-7 connector of the HP 43961A under
the following conditions:
Warm up time ................................................................ > 30 minutes
Ambient temperature ............................................................ 23°C ± 5°C,
within ±1°C from the temperature at which calibration is performed
Signal level (setting) ........................................................... 0 to +15 dBm
Correction ........................................................................... ON
IFBW (for calibration and measurement) .............................................. ≤ 300 Hz
Averaging factor (for calibration and measurement) .......................................... ≥ 8
16
Page 17

Figure 1-7. Impedance Measurement Accuracy
|Z| - θ Accuracy
|Z| accuracy Z
θ accuracy
Where, is measured. A, B, and C are obtained from Figure 1-7.
Z
Z
m
= A +(B/
a
θ
= sin
a
+C ×
Z
m
−
1
(Z
/100)
a
)×100[%
Z
m
]
17
Page 18

|Y| - θ Accuracy
|Y| accuracy Y
θ accuracy
Where, is |Y| measured. A, B, and C are obtained from Figure 1-7.
Y
m
= A +(B×
a
θ
= sin
a
+C/
Y
−
m
1
(Y
/100)
a
)×100[%
Z
m
]
R - X Accuracy (Depends on D)
Accuracy
R
a
X
a
D ≤ 0.2 0.2 < D ≤ 5
±Xm x Xa /100[Ω] Ra /cosθ[%]
/sinθ[%] ±Rm x Ra /100[Ω]
Xa[%]
X
a
5 < D
R
[%]
a
Where,
D can be calculated as: R/X, or
, orR/(2πf × L
)
s
R × 2πf ×C
θ can be calculated as: , ortan
tan
= A +(B/
R
a
= A +(B/
X
a
+C ×
R
m
+C ×
X
m
R
X
)×100
m
)×100
m
−
−
−
s
1
(X/R)
1
(2πf × L
1
(1/(R × 2πf × Cs))
s
/R)
, ortan
%
%
Rm and Xm are the measured R and X, respectively. A, B, and C are obtained from Figure 1-7.
G - B Accuracy (Depends on D)
Accuracy
G
a
B
a
±Bm x Ba /100[S]
Where,
D can be calculated as: , orG/B
G ×2πf ×L
θ can be calculated as: , ortan
tan
G
a
= A +(B/
B
a
= A +(B/
+C ×
G
m
+C ×
B
m
)×100[%]
G
m
)×100[%]
B
m
D ≤ 0.2 0.2 < D ≤ 5
/cosθ[%]
G
a
/sinθ[%]
Ba[%]
, orG/(2πf × C
p
)
−
−
−
p
1
(B/G)
1
(2πf × C
1
(1/(G × 2πf × Lp))
p
/G)
, ortan
B
a
5 < D
G
±G
x Ga /100[S]
m
a
[%]
18
Page 19

Gm and Bm are the measured G and B, respectively. A, B, and C are obtained from Figure 1-7.
D Accuracy
Accuracy
D
a
Where, Za is |Z| accuracy.
L Accuracy (Depends on D)
Accuracy
L
a
Where, L
= 2πf × L
l
= A +(B/
a
, f
m
+C ×
Z
l
Z
is frequency in Hz, and L
C Accuracy (Depends on D)
Accuracy
C
a
Where, C
= 2πf × C
c
= A +(B/
a
m
is frequency in Hz, and C
, f
+C ×
Z
c
)×100[%]
l
)×100[%]
Z
c
D ≤ 0.2
Za /100 (Za /100) x (1 + D2)
D ≤ 0.2
La /100 La (1 + D)
is measured L. A, B, and C are obtained from Figure 1-7.Z
m
D ≤ 0.2
Ca C
is measured C. A, B, and C are obtained from Figure 1-7.Z
m
0.2 < D
0.2 < D
0.2 < D
(1 + D)
a
19
Page 20

Common to Network/Spectrum/Impedance Measurement
Display
LCD
Size/Type
Number of pixels
Effective Display Area
Number of display channels
Format
Number of traces
For measurement ................................................................ 2 traces
For memory ..................................................................... 2 traces
Data math
Data hold
............................................................. 8.4 inch color LCD
.............................................................. 640 x480
..................................... 160 mm x 115 mm(600 x 430 dots)
............................................................. 2
...................................................... single, dual (split or overwrite)
.........................................................................
x
............................................................. gain
gain
x
(data – memory) – offset,
gain
x
(data + memory) – offset,
gain
x
(data/memory ) – offset
data – offset,
.................................................... Maximum hold, Minimum hold
Marker
Number of markers
Main marker
Sub-marker
.......................................................... 1 for each channel
........................................................... 7 for each channel
∆marker ............................................................... 1 for each channel
Hard copy
Mode .............................................Dump mode only (including color dump mode)
Storage
Built-in flexible disk drive
Type
................................................... 3.5 inch, 1.44 MByte, or 720 KByte,
1.44 MByte format is used for disk initialization
Memory
.......................................... 512 KByte, can be backed up by flash memory
HP-IB
Interface
Interface function
Data transfer formats
.................................................. IEEE 488.1-1987, IEEE 488.2-1987,
IEC 625, and JIS C 1901-1987 standards compatible.
...................................... SH1, AH1, T6, TE0, L4, LE0, SR1, RL1,
PP0, DC1, DT1, C1, C2, C3, C4, C11, E2
.............................................................. ASCII,
32 and 64 bit IEEE 754 Floating point format,
DOS PC format (32 bit IEEE with byte order reversed)
20
Page 21

Printer parallel port
Interface
Printer control language
Connector
............................................ IEEE 1284 Centronics standard compliant
.................................... HP PCL3 Printer Control Language
................................................................ D-SUB (25-pin)
Option 001 DC Voltage/Current Source
The setting of option 001 DC voltage/current source is independent of Channel 1 and Channel 2 settings.
Voltage
Range
Resolution
................................................................... –40 V to +40 V
....................................................................... 1 mV
Current limitation
at Voltage setting = –25 V to +25 V .............................................. ±100 mA
at Voltage setting = –40 V to –25 V, 25 V to 40 V ..................................... ±20 mA
Current
Range
Resolution
................................................. –20 µA to –100 mA, 20 µA to 100 mA
...................................................................... 20 µA
Voltage limitation
at Current setting = –20 mA to +20 mA ............................................. ±40 V
at Current setting = –100 mA to –20 mA, 20 mA to 100 mA ............................. ±25 V
Accuracy
Voltage
at 23 ± 5°C ........................................... ±(0.1% + 4 mV + I
Current
at 23 ± 5°C ........................................... ±(0.5% + 30 µA + V
1
current at DC source connector
2
voltage at DC source connector
1
[mA] x 5 [Ω] mV)
dc
2
[V]/10 [kΩ] mA)
dc
Probe Power
Output voltage
................................. +15 V (300 mA), –12.6 V (160 mA), GND nominal
Specifications When HP Instrument BASIC Is Operated
Keyboard
Connector
.................................................... PS/2 style 101 English keyboard
................................................................... mini-DIN
8 bit I/O port
Connector
Level
Number of Input/Output bit
.............................................................. D-SUB (15-pin)
............................................................................. TTL
................................... 4 bit for Input, 8 bit for Output
21
Page 22

Figure 1-8. 8 bit I/O Port Pin Assignments
24-bit I/O Interface
Connector
Level
I/O
Figure 1-9. 24-bit I/O Interface Pin Assignment
............................................................................. TTL
................................................. 8-bit for input or output, 16-bit for output
.............................................................. D-SUB (36-pin)
22
Page 23

Table 1-1. Signal Source Assignment
Pin No. Signal Name Signal Standard
1 GND 0 V
2 INPUT1 TTL level, pulse input (pulse width: 1µs or above)
3 OUTPUT1 TTL level, latch output
4 OUTPUT2 TTL level, latch output
5 OUTPUT PORT A0 TTL level, latch output
6 OUTPUT PORT A1 TTL level, latch output
7 OUTPUT PORT A2 TTL level, latch output
8 OUTPUT PORT A3 TTL level, latch output
9 OUTPUT PORT A4 TTL level, latch output
10 OUTPUT PORT A5 TTL level, latch output
11 OUTPUT PORT A6 TTL level, latch output
12 OUTPUT PORT A7 TTL level, latch output
13 OUTPUT PORT B0 TTL level, latch output
14 OUTPUT PORT B1 TTL level, latch output
15 OUTPUT PORT B2 TTL level, latch output
16 OUTPUT PORT B3 TTL level, latch output
17 OUTPUT PORT B4 TTL level, latch output
18 OUTPUT PORT B5 TTL level, latch output
19 OUTPUT PORT B6 TTL level, latch output
20 OUTPUT PORT B7 TTL level, latch output
21 I/O PORT C0 TTL level, latch output
22 I/O PORT C1 TTL level, latch output
23 I/O PORT C2 TTL level, latch output
24 I/O PORT C3 TTL level, latch output
25 I/O PORT D0 TTL level, latch output
26 I/O PORT D1 TTL level, latch output
27 I/O PORT D2 TTL level, latch output
28 I/O PORT D3 TTL level, latch output
29 PORT C STATUS TTL level, input mode: LOW, output mode: HIGH
30 PORT D STATUS TTL level, input mode: LOW, output mode: HIGH
31 WRITE STROBE SIGNAL TTL level, active low, pulse output (width: 10 µs; typical)
32 +5V PULLUP
33 SWEEP END SIGNAL TTL level, active low, pulse output (width: 20 µs; typical)
34 +5V +5V, 100 mA MAX
35 PASS/FAIL SIGNAL TTL level, PASS: HIGH, FAIL: LOW, latch output
36 PASS/FAIL WRITE STROBE SIGNAL TTL level, active low, pulse output (width: 10 µs; typical)
23
Page 24

General Characteristics
Input and Output Characteristics
External reference input
Frequency
Level
Input impedance
Connector
........................................................ 10 MHz ±100 Hz (SPC)
........................................................... –5 dBm to +5 dBm (SPC)
........................................................... 50 Ω nominal
................................................................. BNC female
Internal Reference Output
Frequency
Level
Output Impedance
Connector
.............................................................. 10 MHz nominal
..................................................................... 0 dBm (SPC)
......................................................... 50 Ω nominal
................................................................. BNC female
Reference oven output (Option 1D5)
Frequency
Level
Output impedance
Connector
.............................................................. 10 MHz nominal
..................................................................... 0 dBm (SPC)
......................................................... 50 Ω nominal
................................................................. BNC female
External trigger input
Level
Pulse width (T
Polarity
Connector
............................................................................. TTL
)
.......................................................... ≥2 µs Typically
p
........................................................ positive/negative selective
................................................................. BNC female
External program Run/Cont input
Connector
Level
Gate output (Option 1D6)
Level
Connector
................................................................. BNC female
............................................................................. TTL
............................................................................. TTL
................................................................. BNC female
Figure 1-10. Trigger Signal (External trigger input)
24
Page 25

S-parameter test set interface
Connector
.............................................................. D-SUB (25-pin)
Caution
Do not connect a printer to this connector. If you connect a printer with the S-parameter
test set interface connector (TEST SET-I/O INTERCONNECT), it may cause damage to
the printer.
Figure 1-11. S-Parameter Test Set Interface Pin Assignments
External monitor output
Connector
Display resolution
........................................................... D-SUB (15-pin HD)
........................................................ 640 x 480 VGA
Operation Conditions
Temperature
Disk drive non-operating condition .............................................. 0°C to 40°C
Disk drive operating condition .................................................. 10°C to 40°C
Humidity
at wet bulb temperature ≤29°C, without condensation
Disk drive non-operating condition .......................................... 15% to 95% RH
Disk drive operating condition .............................................. 15% to 80% RH
Altitude
Warm up time
..................................................................... 0 to 2,000 m
................................................................. 30 minutes
25
Page 26

Non-operation Conditions
Temperature
................................................................ –20°C to 60°C
Humidity
at wet bulb temperature ≤45°C, without condensation ............................. 15% to 95% RH
Altitude
..................................................................... 0 to 4,572 m
Others
EMC
......................... Complies with CISPR 11 (1990) / EN 55011 (1991) : Group 1, Class A
Complies with EN 50082-1 (1992) / IEC 1000-4-2 (1995) : 4 kV CD, 8 kV AD
Complies with EN 50082-1 (1992) / IEC 801-3 (1984) : 3 V/m
Complies with EN 50082-1 (1992) / IEC 1000-4-4 (1995) : 1 kV / Main,0.5kV / Signal Line
Complies with IEC 1000-3-2 (1995) / EN 61000-3-2 (1995)
Complies with IEC 1000-3-3 (1994) / EN 61000-3-3 (1995)
Safety
................. Complies with IEC 1010-1 (1990), Amendment 1 (1992), Amendment 2 (1995)
Certified by CSA-C22.2 No.1010.1-92
Power requirements
Weight
Dimensions
....................................................................... 21 kg (SPC)
.................................................. 425 (W) x 235 (H) x 553 (D) mm
90 V to 132 V, or 198 V to 264 V (automatically switched), 47 to 63 Hz, 300 VA max.
Furnished Accessories
Accessory HP part number Accessory HP part number
Operation Manual 04395-90000 Power Cable
Programming Manual 04395-90001 BNC Adapter
HP Instrument BASIC Users Handbook E2083-90005
Service Manual
Sample Program Disk 04395-18000 mini-DIN keyboard C3757-60401
Floppy Disk 9164-0299 Handle Kit
BNC cable 8120-1839 Rack Mount Kit
BNC-N adapter 1250-0780 Rack Mount and Handle Kit
1 Option 0BW only
2 The power cable depends on where the instrument is used.
3 Option 1D5 only
4 Option 1D7 only
5 Option 1CN only
6 Option 1CM only
7 Option 1CP only
1
04395-90100 50 to 75 W adapter
50 to 75 Ω minimum loss pad
2
3
4
5
6
7
—
1250-1859
4
HP 11825B option C04
1250-2438
5062-3991
5062-3979
5062-3985
26
Page 27

For more information about
Hewlett-Packard test & measurement
products, applications, services, and for a
current sales office listing, visit our web
site, http://www.hp.com/go/tmdir. You can
also contact one of the following centers
and ask for a test and measurement sales
representative.
United States:
Hewlett-Packard Company
Test and Measurement Call Center
P.O. Box 4026
Englewood, CO 80155-4026
1 800 452 4844
Canada:
Hewlett-Packard Canada Ltd.
5150 Spectrum Way
Mississauga, Ontario
L4W 5G1
(905) 206 4725
Europe:
Hewlett-Packard
European Marketing Centre
P.O. Box 999
1180 AZ Amstelveen
The Netherlands
(31 20) 547 9900
Japan:
Hewlett-Packard Japan Ltd.
Measurement Assistance Center
9-1, Takakura-Cho, Hachioji-Shi,
Tokyo 192, Japan
Tel: (81-426) 56-7832
Fax: (81-426) 56-7840
Latin America:
Hewlett-Packard
Latin American Region Headquarters
5200 Blue Lagoon Drive
9th Floor
Miami, Florida 33126
U.S.A.
Tel: (305) 267-4245
Tel: (305) 267-4220
Fax: (305) 267-4288
Australia/New Zealand:
Hewlett-Packard Australia Ltd.
31-41 Joseph Street
Blackburn, Victoria 3130
Australia
1 800 629 485
Asia Pacific:
Hewlett-Packard Asia Pacific Ltd
17-21/F Shell Tower, Times Square,
1 Matheson Street, Causeway Bay,
Hong Kong
Tel: (852) 2599 7777
Fax: (852) 2506 9285
Data subject to change
Copyright 1998
Hewlett-Packard Company
Printed in U.S.A. 1/98
5965-9340E
 Loading...