

Page 1
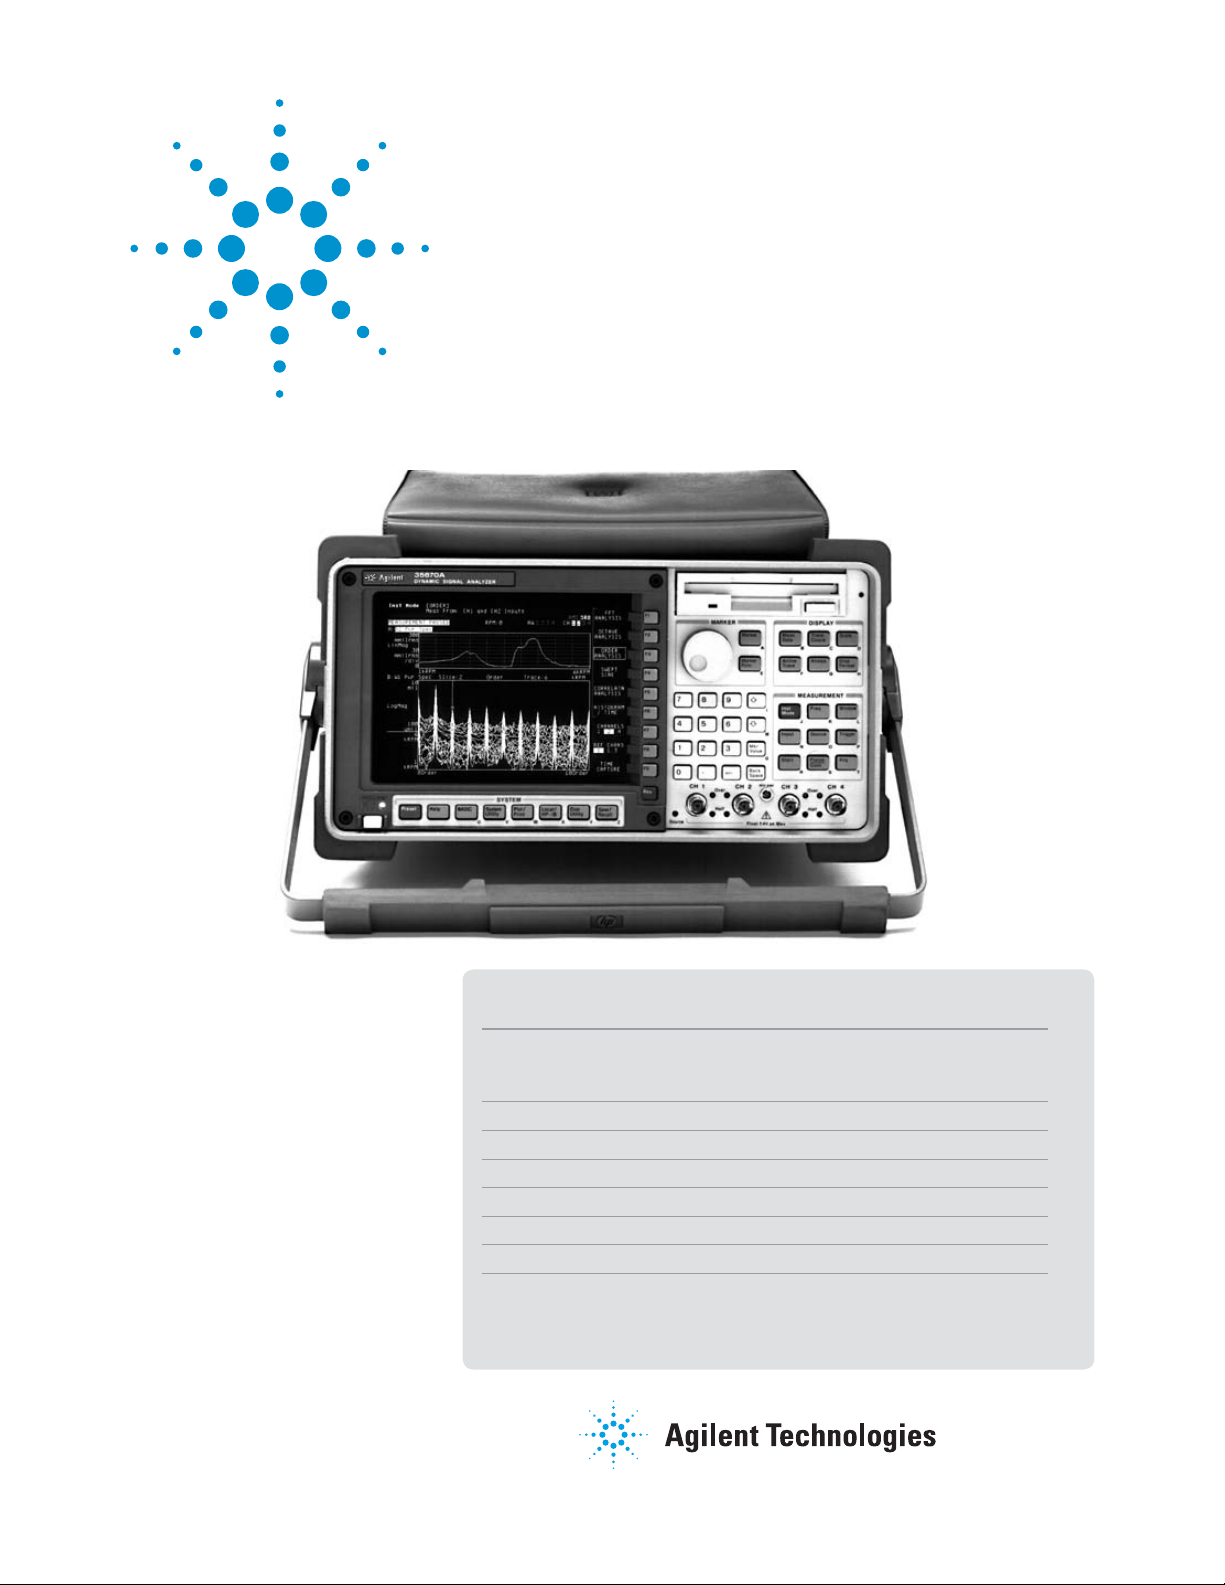
Agilent 35670A
Dynamic Signal Analyzer
Versatile two- or four-channel high-per for mance
FFT-based spectrum/network an a lyz er
122 µHz to 102.4 kHz 16-bit ADC
Data Sheet
Key Specifi cations
Frequency range 102.4 kHz 1 channel
51.2 kHz 2 channel
25.6 kHz 4 channel
Dynamic range 90 dB typical
Accuracy ±0.15 dB
Channel match ±0.04 dB and ±0.5 degrees
Real-time bandwidth 25.6 kHz/1 channel
Resolution 100, 200, 400, 800 & 1600 lines
Time capture > 6 Msamples
Source types Random, burst random, periodic chirp, burst chirp,
pink noise, sine, swept-sine ( Option1D2), arbitrary
( Option 1D4)
Page 2

Summary of Features on Standard Instrument
The following features are standard with the
Agilent 35670A:
Instrument modes
FFT analysis Histogram/time
Correlation analysis Time capture
Measurement
Frequency domain
Frequency response Power spectrum
Linear spectrum Coherence
Cross spectrum Power spectral density
Time domain (oscilloscope mode)
Time waveform Autocorrelation
Cross-correlation Orbit diagram
Amplitude domain
Histogram, PDF, CDF
Trace coordinates
Linear magnitude Unwrapped phase
Log magnitude Real part
dB magnitude Imaginary part
Group delay Nyquist diagram
Phase Polar
Trace units
Y-axis amplitude: combinations of units, unit value,
calculated value, and unit format describe y-axis amplitude
Units: volts, g, meters/sec2, inches/sec2, meters/sec,
inches/sec, meters, mils, inches, pascals, Kg, N, dyn, lb,
user-defined EUs
Unit value: rms, peak, peak-to-peak
Calculated value: V, V2, V2/Hz, √Hz, V2s/Hz (ESD)
Unit format: linear, dB’s with user selectable dB reference,
dBm with user selectable impedance.
Y-axis phase: degrees, radians
X-axis: Hz, cpm, order, seconds, user-defined
Display formats
Single
Quad
Dual upper/lower traces
Small upper and largelower
Front/back overlay traces
Measurement state
Bode diagram
Waterfall display with skew, -45 to 45 degrees
Trace grids on/off
Display blanking
Screen saver
Display scaling
Autoscale Selectable reference
Manual Scale Linear or log X-axis
Input range tracking Y-axis log
X & Y scale markers with expand and scroll
Marker functions
Individual trace markers
Coupled multi-trace markers
Absolute or relative marker
Peak search
Harmonic markers
Band marker
Sideband power markers
Waterfall markers
Time parameter markers
Frequency response markers
Signal averaging (FFT mode)
Average types (1 to 9,999,999 averages)
RMS Time exponential
RMS exponential Peak hold
Time
Averaging controls
Overload reject
Fast averaging on/off
Update rate select
Select overlap process percentage
Preview time record
Measurement control
Start measurement
Pause/continue measurement
Triggering
Continuous (Freerun)
External (analog or TTL level)
Internal trigger from any channel
Source synchronized trigger
GPIB trigger
Armed triggers
Automatic/manual
RPM step
Time step
Pre- and post-trigger measurement Delay
Tachometer input:
±4 V or ±20 V range
40 mv or 200 mV resolution
Up to 2048 pulses/rev
Tach hold-off control
2
Page 3

Source outputs
Random Burst random
Periodic chirp Burst chirp
Pink noise Fixed sine
Note: Some source types are not available for use in
optional modes. See option description for details.
Input channels
Manual range Anti-alias filters On/Off
Up-only auto range AC or DC coupling
Up/down auto range LED half range and overload
indicators
Floating or grounded A-weight filters On/Off
Transducer power supplies (4 ma constant current)
Data storage functions
Built-in 3.5 in., 1.44-Mbyte flexible disk also supports
720-KByte disks, and 2 Mbyte NVRAM disk. Both
MS-DOS® and HP-LIF formats are available. Data can be
formatted as either ASCII or binary (SDF). The 35670A
provides storage and recall from the internal disk, internal
RAM disk, internal NVRAM disk, or external GPIB disk for
any of the following information:
Instrument setup states Trace data
User-math Limit data
Time capture buffers Agilent Instrument BASIC
Waterfall display data Programs
Data tables Curve fit/synthesis tables
Frequency
20 spans from 195 mHz to 102.4 kHz (1 channel mode)
20 spans from 98 mHz to 51.2 kHz (2 channel mode)
Digital zoom with 244 µHz resolution throughout the
102.4 kHz frequency bands.
Resolution
100, 200, 400, 800 and 1600 lines
Windows
Hann Uniform
Flat top Force/exponential
Math
+,-,*, / Conjugate
Magnitude Real and imaginary
Square Root FFT, FFT
LN EXP
*jω or /jω PSD
Differentiation A, B, and C weighting
Integration Constants K1 thru K5
Functions F1 thru F5
-1
Analysis
Limit test with pass/fail
Data table with tabular readout
Data editing
GPIB capabilities
Conforms to IEEE 488.1 /488.2
Conforms to SCPI 1992
Controller with Agilent Instrument Basic Option
Calibration & memory
Single or automatic calibration
Built-in diagnostics & service tests
Nonvolatile clock with time/date
Time/date stamp on plots and saved data files
Online help
Access to topics via keyboard or index
Fan
On/Off
Time capture functions
Capture transient events for repeated analysis in FFT,
octave, order, histogram, or correlation modes (except
swept-sine). Time-captured data may be saved to internal
or external disk, or transferred over GPIB. Zoom on
captured data for detailed nar row band analysis.
3
Page 4

Agilent 35670A Specifi cations
Instrument specifications apply after 15 minutes warm-up
and within 2 hours of the last self-calibration. When the
internal cooling fan has been turned OFF, specifications
apply within 5 minutes of the last self-cal i bra tion. All specifications are with 400 line frequency resolution and with
anti-alias filters enabled unless stated otherwise.
Frequency
Maximum range**
1 channel mode 102.4 kHz,
51.2 kHz (opt AY6*)
2 channel mode 51.2 kHz
4 channel mode (Option AY6 only) 25.6 kHz
Spans
1 channel mode 195.3 mHz to 102.4 kHz
2 channel mode 97.7 mHz to 51.2 kHz
4 channel mode (Option AY6 only) 97.7 mHz to 25.6 kHz
Minimimum resolution
1 channel mode 122 µHz (1600 line
display)
2 channel mode 61 µHz (1600 line
display)
4 channel mode (Option AY6 only) 122 µHz (800 line
display)
Maximum real-time bandwidth
FFT span for continuous data acquistion)
(Preset, fast averaging)
1 channel mode 25.6 kHz
2 channel mode 12.8 kHz
4 channel mode (Option AY6 only) 6.4 kHz
Measurement rate
(Typical) (Preset, fast averaging)
1 channel mode ≥ 70 averages/sec
2 channel mode ≥ 33 averages/sec
4 channel mode (Option AY6 only) ≥ 15 averages/sec
Display update rate
Typical (Preset, fast average off) ≥ 5 updates/Sec
Maximum ≥ 9 updates/Sec
(Preset, fast average off, single channel, single display,
undisplayed trace displays set to data registers)
Accuracy
±30 ppm (.003%)
Single channel ampltude
Absolute amplitude accuracy (FFT)
(A combination of full scale accuracy, full scale flatness,
and amplitude linearity.)
±2.92% (0.25 dB) of reading
±0.025% of full scale
FFT full scale accuracy at 1 kHz (0 dBfs)
±0.15 dB (1.74%)
FFT full scale flatness (0 dBfs) relative to 1 kHz
±0.2 dB (2.33%)
FFT amplitude linearity at 1 kHz measured on +27 dBVrms
range with time avg, 0 to -80 dBfs
±0.58% (0.05 dB) of reading
±0.025% of full scale
Amplitude resolution
(16 bits less 2 dB over-range) with averaging 0.0019% of
full scale (typical)
Residual DC response (FFT mode)
Frequency display (excludes A-weight filter)
<-30 dBfs or 0.5 mVdc
FFT dynamic range
Spurious free dynamic range
(Includes spurs, harmonic distortion, intermodulation
distortion, alias products). Excludes alias responses at
extremes of span.
Source impedence = 50 Ω.
800 line display.
90 dB typical (<-80 dBfs)
* Option AY6 single channel maximum range extends to 102.4 kHz
without anti-alias fi lter protection.
** Show all lines mode allows display of up to 131.1, 65.5 and 32.7
kHz respectively. Amplitudes accuracy is unspecifi ed and not alias
protected.
4
Page 5

Full span FFT noise floor (typical)
Flat top window, 64 RMS averages, 800 line display.
Typical noise floor vs. range for different frequency spans
-70 dB/0.03%
dB below
full scale
-80 dB/0.01%
-90 dB/0.003%
-100 dB/0.001%
-51 -41 -31 -21 -11 27
0.0028 0.0089 0.028 0.089 0.280 22.4
51.2 kHz Span
6.4 kHz Span
800 Hz Span
Amplitude range (dBVrms / Vrms)
Harmonic distortion <-80 dBfs
Single Tone (in band), ≤ 0 dBfs
Intermodulation distortion <-80 dBfs
Two tones (in-band), each ≤ -6.02 dBfs
Spurious and residual responses <-80 dBfs
Source impedence = 50 Ω.
Frequency alias responses
Single tone (out of displayed range),
≤ 0 dBfs, ≤ 1 MHz
(≤ 200 kHz with IEPE transducer power
supply On)
2.5% to 97.5% of the frequency span <-80 dBfs
Lower and upper 2.5% of frequency span <-65 dBfs
Input noise
Input noise level
Flat top window, -51 dBVrms range
Source impedance = 50 Ω
Above 1280 Hz <-140 dBVrms/√2Hz
160 Hz to 1280 Hz <-130 dBVrms/√
2
Hz
Note: To calculate noise as dB below full scale:
2
Noise [dBfs] = Noise [dB/√
Hz] + 10LOG(NBW) - Range
[dBVrms]; where NBW is the noise equivalent BW of the
window (see below).
Window parameters Uniform Hann Flat top
-3 dB bandwidth* 0.125% of span 0.185% of span 0.450% of span
Noise equivalent bandwidth* 0.125% of span 0.1875% of span 0.4775% of span
Attenuation at ±½ bin 4.0 dB 1.5 dB 0.01 dB
Shape factor
716 9.1 2.6
(-60 dB BW/-3 dB BW)
* For 800 line displays. With 1600, 400, 200, or 100 line displays, multiply bandwidths by 0.5, 2, 4, and 8, respectively.
5
Page 6

Single channel phase
Phase accuracy relative to external
± 4.0 deg
trigger
16 time averages center of bin,
DC coupled 0 dBfs to -50 dBfs only
0 Hz < freq ≤ 10.24 kHz only
For Hann and flat top windows, phase is relative to a cosine
wave at the center of the time record. For the uniform, force,
and exponential windows, phase is relative to a cosine wave
at the beginning of the time record.
Cross-channel amplitude
FFT cross-channel gain accuracy ± 0.04 dB (0.46%)
Frequency response mode
Same amplitude range
At full scale: Tested with 10 RMS
averages on the -11 to +27 dBVrms
ranges, and 100 RMS averages on
the -51 dBVrms range
Cross-channel phase
Cross-channel phase accuracy
± 0.5 deg
(Same conditions as cross-channel
amplitude)
Input
Input ranges (full scale)
(Auto-range capability)
+27 dBVrms (31.7 Vpk) to -51 dBVrms
(3.99 mVpk) in 2 dB steps
Maximum input levels 42 Vpk
Input impedance 1 MΩ ±10%
90 µF nominal
Low side to chassis impedance 1 MΩ ±30% (typical)
Floating mode <0.010 µF
Grounded mode ≤100 Ω
AC coupling rolloff <3 dB rolloff at 1 Hz
Source impedance = 50 Ω
Common mode rejection ratio
Single tone at or below 1 kHz
-51 dBVrms to -11 dBVrms ranges >75 dB typical
-9 dBVrms to +9 dBVrms ranges >60 dB typical
+11 dBVrms to +27 dBVrms ranges >50 dB typical
Common mode range
(floating mode) ± 4 V pk
IEPE transducer power supply
Current source 4.25 ± 1.5 mA
Open circuit voltage +26 to +32 Vdc
A-weight filter Type 0 tolerance
Conforms to ANSI Standard S1.4-1983;
and to IEC 651-1979; 10 Hz to 25.6 kHz
Crosstalk
Between input channels, and
source-to-input (Receiving channel
source impedance = 50 Ω)
< -135 dB
below signal or
< -80 dBfs of
receiving
channel, whichever response
is greater in
amplitude
Time domain
Specifications apply in histogram/time mode,
and unfiltered time display
DC amplitude accuracy ±5.0 %fs
Rise time of -1 V to 0 V test pulse <11.4 µSec
Settling time of -1 V to 0 V test pulse <16 µSec to 1%
Peak overshoot of -1 V to 0 V
<3%
test pulse
Sampling period
1 channel mode 3.815 µSec to 2 Sec in 2x steps
2 channel mode 7.629 µSec to 4 Sec in 2x steps
4 channel mode 15.26 µSec to 8 Sec in 2x steps
(Option AY6 only)
6
Page 7

Trigger
Trigger modes Internal, source,
external (analog
setting) GPIB
Maximum trigger delay
Post trigger 8191 seconds
Pre trigger 8191 sample periods
No two channels can be further than
±7168 samples from each other.
External trigger max. input ±42 Vpk
External trigger range
Low range -2 V to +2 V
High range -10 V to +10 V
External trigger resolution
Low range 15.7 mV
High range 78 mV
Tachometer
Pulses per Revolution 0.5 to 2048
RPM 5 ≤ RPM ≤ 491,519
RPM Accuracy ±100 ppm (0.01%)
(typical)
Tach level range
Low range -4 V to +4 V
High range -20 V to +20 V
Tach level resolution
Low range 39 mV
High range 197 mV
Maximum tach input level ±42 Vpk
Minimum tach pulse width 600 nSec
Maximum tach pulse rate 400 kHz (typical)
Source output
Source types Sine, random noise,
chrip, pink noise,
burst random, burst
chirp
Amplitude range AC: ±5 V peak*
DC: ±10 V*
* Vac
+ |Vdc| ≤ 10 V
pk
AC amplitude resolution
Voltage > 0.2 Vrms 2.5 mVpeak
Voltage < 0.2 Vrms 0.25 mVpeak
DC offset accuracy ±15 mV ± 3% of
(|DC| + Vac
) set-
pk
tings
Pink noise adder Add 600 mV typical
when using pink
noise
Output impedance < 5 Ω
Maximum loading
Current ±20 mA peak
Capacitance 0.01 µF
Sine amplitude accuracy at 1 kHz ±4% (0.34 dB) of
setting
Rload > 250 Ω 0.1 Vpk to 5 Vpk
Sine Flatness (relative to 1 kHz) ±1 dB
0.1 V to 5 V peak
Harmonic and sub-harmonic distortion and spurious
signals (In band)
0.1 Vpk to 5 Vpk sine wave
Fundamental < 30 kHz < -60 dBc
Fundamental > 30 kHz < -40 dBc
Digital interfaces
External keyboard Compatible with
PC-style 101-key
keyboard
GPIB
Conforms to the following standards:
IEEE 488.1 (SH1, AH1, T6, TE0, L4, LE0, SR1, RL1,
PP0, DC1, DT1, C1, C2, C3, C12, E2)
EEE 488.2-1987
Complies with SCPI 1992
Data transfer rate
(REAL 64 Format)
< 45 mSec for a
401 point trace
Serial port
Parallel port
External VGA port
7
Page 8

Computed order tracking – Option 1D0
Maximum order x Maximum RPM
( —————————————— ) ≤
60
Online (real time) 1 channel mode 25,600 Hz
2 channel mode 12,800 Hz
4 channel mode 6,400 Hz
Capture playback 1 channel mode 102,400 Hz
2 channel mode 51,200 Hz
4 channel mode 25,600 Hz
Number of orders ≤ 200 5 ≤ RPM ≤ 491,519
(Maximum useable RPM is limited by resolution, tach pulse
rate,pulses/revolution and average mode settings.)
Delta order 1/128 to 1/1
Resolution ≤ 400
(Maximum order)/(Delta order)
Maximum RPM ramp rate 1000 RPM/second real-time
(typical)
1000 - 10,000 RPM run up
Maximum order 10
Delta order 0.1
RPM step 30 (1 channel)
60 (2 channel)
120 (4 channel)
Order track amplitude
accuracy
±1 dB (typical)
Real time octave analysis – Option 1D1
Standards
Conforms to ANSI Standard S1.11 - 1986, Order 3, Type 1-D,
extended and optional frequency ranges
Conforms to IEC 651-1979 Type 0 Impulse, and ANSI S1.4
1 second stable average
Single tone at band center: ≤ ± 0.20 dB
Readings are taken from the linear total power spectrum
bin. It is derived from sum of each filter.
1/3-octave dynamic range > 80 dB (typical) per
ANSI S1.11-1986
2 second stable average
Total power limited by input noise level
Frequency ranges (at centers)
Online (real time):
Single channel 2 channel 4 channel
1/1 octave 0.063 - 16 kHz 0.063 - 8 kHz 0.063 - 4 kHz
1/3 octave 0.08 - 40 kHz 0.08 - 20 kHz 0.08 - 10 kHz
1/12 octave 0.0997 -
12.338 kHz
Capture playback
1/1 octave 0.063 - 16 kHz 0.063 - 16 kHz 0.063 - 16 kHz
1/3 octave 0.08 - 31.5 kHz 0.08 - 31.5 kHz 0.08 - 31.5 kHz
1/12 octave 0.0997 -
49.35 kHz
One to 12 octaves can be measured and displayed.
1/1-, 1/3-, and 1/12-octave true center fre quen cies related by the
formula: f(i+1)/f(i) = 2^(1/n); n=1, 3, or 12; where 1000 Hz is
the reference for 1/1, 1/3 octave, and 1000*2^(1/24) Hz is the
reference for 1/12 octave. The marker returns the ANSI standard
preferred frequencies.
0.0997 -
6.169 kHz
0.0997 -
49.35 kHz
0.0997 -
3.084 kHz
0.0997 -
49.35 kHz
Swept sine measurements – Option 1D2
Dynamic range 130 dB
Tested with 11 dBVrms source level at: 100 mSec integration
Curve fi t/synthesis – Option 1D3
20 Poles/20 zeroes curve filter frequency response
synthesis pole/zero, pole residue & polynomical format
Arbitrary waveform source – Option 1D4
Amplitude range AC: ±5 V peak*
DC: ±10 V*
* Vacpk + |Vdc| ≤ 10 V
Record length # of points = 2.56 x lines of
resolution, or # of complex
points = 1.28 x lines of resolution
DAC resolution
0.2828 Vpk to 5 Vpk 2.5 mV
0 Vpk to 0.2828 Vpk 0.25 mV
8
Page 9

General Specifi cations
General specifi cations
Safety standards CSA certified for electronic
test and measurement equipment per CSA C22.2, NO.
231 This product is designed
for compliance to: UL1244,
Fourth Edition IEC 348, 2nd
Edition, 1978
EMI / RFI standards CISPR 11
Acoustic power LpA < 55 dB (Cooling fan at
high speed setting)
< 45 dB (Auto speed setting
at 25 °C)
Fan speed settings of high, automatic, and off are available.
The fan off setting can be enabled for a short period of
time, except at higher ambient temperatures where the fan
will stay on.
Environmental operating restrictions
Operating:
Disk in drive
Ambient temp. 4 °C to 45 °C 0 °C to 55 °C -40 °C to 70 °C
Relative humidity
(non-condensing)
Minimum 20% 15% 5%
Maximum 80% at 32 °C 95% at 40 °C 95% at 50 °C
Vibrations (5 - 500 Hz) 0.6 Grms 1.5 Grms 3.41 Grms
Shock 5 G (10 mSec ½ sine) 5 G (10 mSec ½ sine) 40 G (3 mSec ½ sine)
Max. altitude 4600 meters
(15,000 ft.)
Operating:
No disk in drive
4600 meters
(15,000 ft.)
Abbreviations
dBVrms dB relative to 1 Volt rms.
dBfs dB relative to full scale amplitude range.
Full scale is approx. 2 dB below ADC overload.
Typical Typical, non-warranted, performance speci-
fication included to provide general product
information.
Storage &
transport
4600 meters
(15,000 ft.)
AC power 90 Vrms - 264 Vrms
(47 - 440 Hz)
350 VA maximum
DC power 12 VDC to 28 VDC nominal
200 VA maximum
DC current at 12 V Standard: <10 A typical
4 channel: <12 A typical
Warm-up time 15 minutes
Weight 15 kg (33 lb) net
29 kg (64 lb) shipping
Dimensions (Excluding bail handle and impact cover)
Height 190 mm (7.5")
Width 340 mm (13.4")
Depth 465 mm (18.3")
9
Page 10

Remove all doubt
Our repair and calibration services will get your equipment back to you, performing like new, when promised.
You will get full value out of your Agilent equipment
through-out its lifetime. Your equipment will be serviced by Agilent-trained technicians using the latest
factory calibration procedures, automated repair diagnostics and genuine parts. You will always have the utmost
confi dence in your measurements. For information
regarding self maintenance of this product, please
contact your Agilent offi ce.
Agilent offers a wide range of additional expert test
and measurement services for your equipment, including initial start-up assistance, onsite education
and training, as well as design, system integration,
and project management.
For more information on repair and calibration
services, go to:
www.agilent.com/fi nd/removealldoubt
Agilent Email Updates
www.agilent.com/fi nd/emailupdates
Get the latest information on the
products and applications you select.
Agilent Direct
www.agilent.com/fi nd/agilentdirect
Quickly choose and use your test
equipment solutions with confi dence.
MS-DOS is a U.S. registered trademark of
Microsoft Corporation.
MATLAB is a U.S. registered trademark of
The Math Works, Inc.
www.agilent.com
www.agilent.com/fi nd/35670A
For more information on Agilent Technologies’ products,
applications or services, please contact your local Agilent
office. The complete list is available at:
www.agilent.com/fi nd/contactus
Americas
Canada (877) 894-4414
Latin America 305 269 7500
United States (800) 829-4444
Asia Pacifi c
Australia 1 800 629 485
China 800 810 0189
Hong Kong 800 938 693
India 1 800 112 929
Japan 0120 (421) 345
Korea 080 769 0800
Malaysia 1 800 888 848
Singapore 1 800 375 8100
Taiwan 0800 047 866
Thailand 1 800 226 008
Europe & Middle East
Austria 01 36027 71571
Belgium 32 (0) 2 404 93 40
Denmark 45 70 13 15 15
Finland 358 (0) 10 855 2100
France 0825 010 700*
*0.125 €/minute
Germany 07031 464 6333
Ireland 1890 924 204
Israel 972-3-9288-504/544
Italy 39 02 92 60 8484
Netherlands 31 (0) 20 547 2111
Spain 34 (91) 631 3300
Sweden 0200-88 22 55
Switzerland 0800 80 53 53
United Kingdom 44 (0) 118 9276201
Other European Countries:
www.agilent.com/fi nd/contactus
Revised: October 1, 2008
Product specifi cations and descriptions in this document
subject to change without notice.
© Agilent Technologies, Inc. 2009
Printed in USA, January 9, 2009
5966-3064E
 Loading...