

Low Cost, Dual, High Current Output
A
B
FEATURES
High speed
−3 dB bandwidth: 190 MHz, G = +5
Slew rate: 820 V/μs, R
Wide output swing
20.4 V p-p differential, R
High output current
Low distortion
−95 dBc typical at 1 MHz, V
−69 dBc typical at 10 MHz, V
Power management and shutdown
Control inputs CMOS level compatible
Shutdown quiescent current 0.65 mA/amplifier
Adjustable low quiescent current: 3.9 mA to 7.6 mA per amp
APPLICATIONS
Home networking line drivers
Twisted pair line drivers
Power line communications
Video line drivers
ARB line drivers
I/Q channel amplifiers
= 50 Ω
LOAD
of 100 Ω from 12 V supply
LOAD
= 2 V p-p, G = +5, R
OUT
= 2 V p-p, G = +5, R
OUT
LOAD
LOAD
= 50 Ω
= 50 Ω
Line Driver with Shutdown
ADA4310-1
PIN CONFIGURATIONS
+V
1
S
2
NC
3
OUT A
–IN A
4
+IN A
5
NC = NO CONNECT
Figure 1. Thermally Enhanced, 10-Lead MINI_SO_EP
OUT
16
1NC
2−IN A
3+IN A
4GND
NC = NO CONNECT
5
NC
Figure 2. Thermally Enhanced, 4 mm × 4 mm 16-Lead LFCSP_VQ
OUT B
10
9
–IN B
8
+IN B
PD1
7
PD0
6
S
OUT
NC
+V
14
13
15
12 NC
11 −IN B
10 +IN B
9PD1
8
7
6
S
NC
–V
PD0
06027-001
06027-002
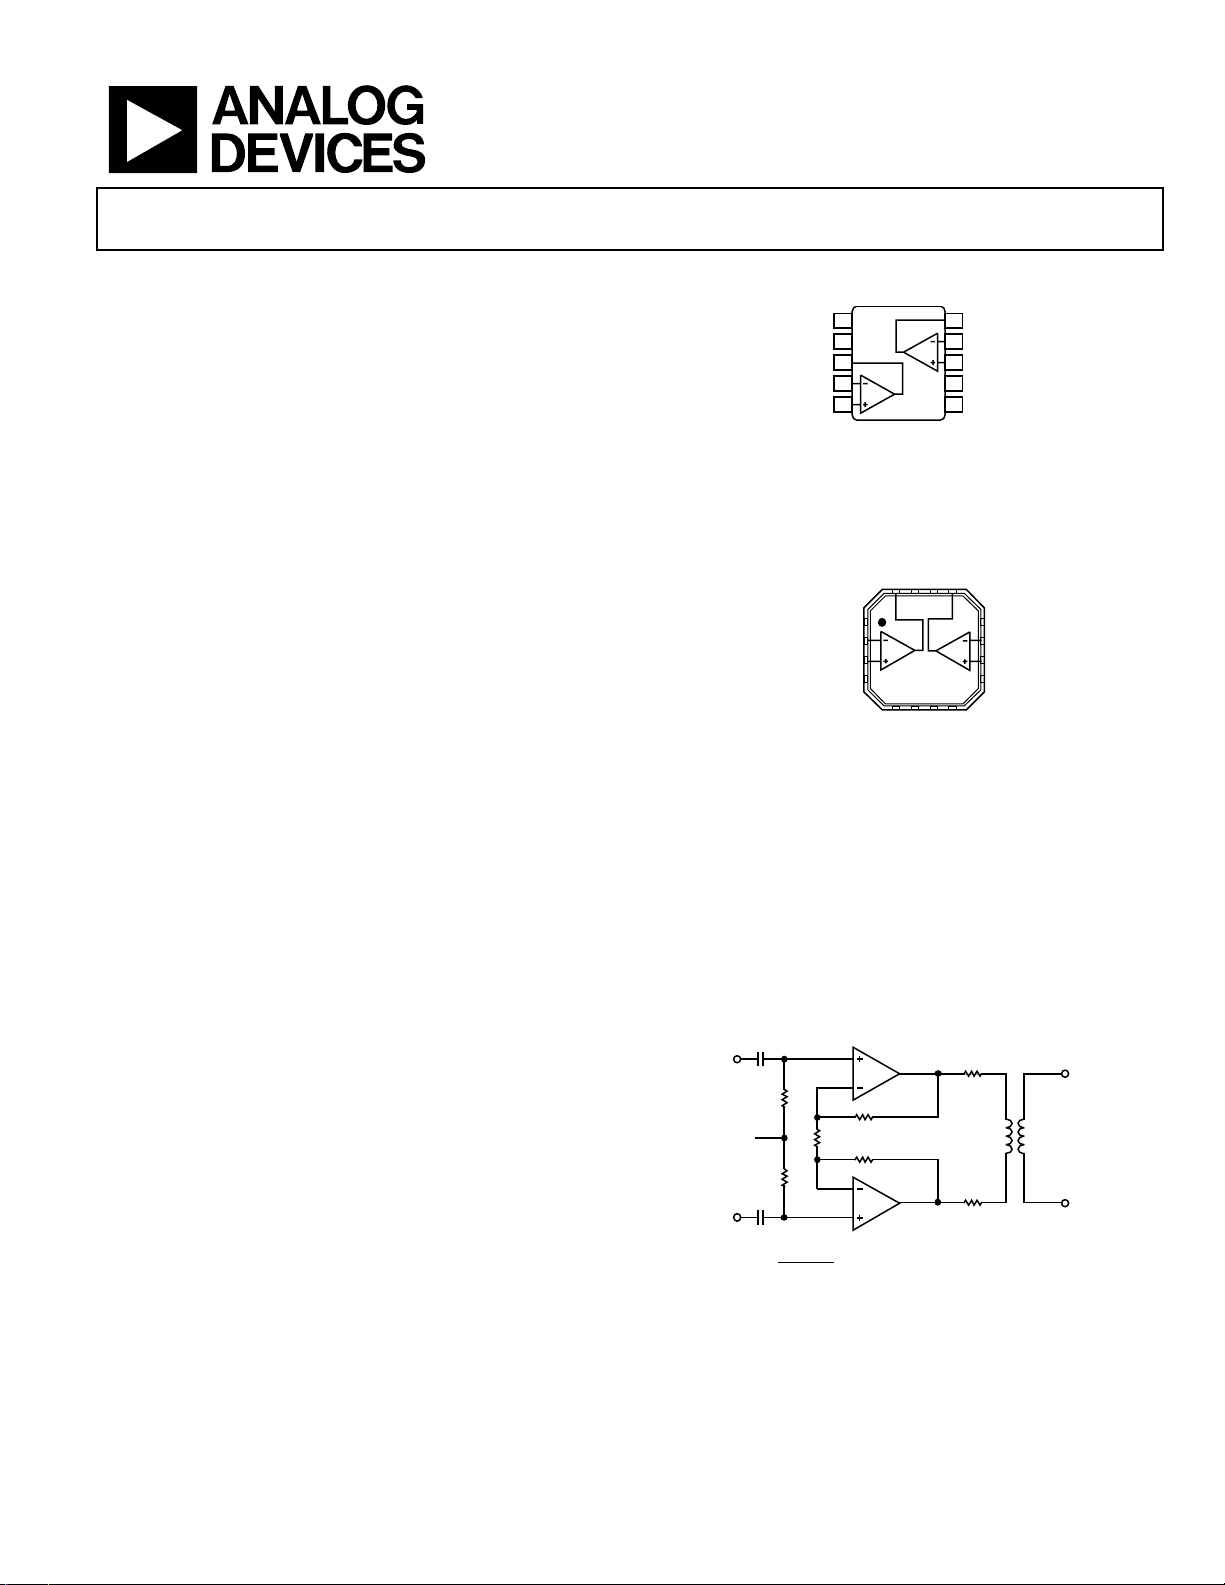
GENERAL DESCRIPTION
The ADA4310-1 is comprised of two high speed, current
feedback operational amplifiers. The high output current, high
bandwidth, and fast slew rate make it an excellent choice for
broadband applications requiring high linearity performance
while driving low impedance loads.
The ADA4310-1 incorporates a power management function
that provides shutdown capabilities and/or the ability to
optimize the amplifiers quiescent current. The CMOScompatible, power-down control pins (PD1 and PD0) enable
the ADA4310-1 to operate in four different modes: full power,
medium power, low power, and complete power down. In the
power-down mode, quiescent current drops to only
0.65 mA/amplifier, while the amplifier output goes to a high
impedance state.
Rev. 0
Information furnished by Analog Devices is believed to be accurate and reliable. However, no
responsibility is assumed by Anal og Devices for its use, nor for any infringements of patents or ot her
rights of third parties that may result from its use. Specifications subject to change without notice. No
license is granted by implication or otherwise under any patent or patent rights of Analog Devices.
Trademarks and registered trademarks are the property of their respective owners.
The ADA4310-1 is available in a thermally enhanced, 10-lead
MSOP with an exposed paddle for improved thermal conduction
and in a thermally enhanced, 4 mm × 4 mm 16-lead LFCSP.
The ADA4310-1 is rated to work in the extended industrial
temperature range of −40°C to +85°C.
1/2
1
V
MID
V
CC
1
=
V
MID
Figure 3. Typical PLC Driver Application
One Technology Way, P.O. Box 9106, Norwood, MA 02062-9106, U.S.A.
Tel: 781.329.4700 www.analog.com
Fax: 781.461.3113 ©2006 Analog Devices, Inc. All rights reserved.
ADA4310-1
1/2
ADA4310-1
–
V
EE
2
06027-003

ADA4310-1
TABLE OF CONTENTS
Features.............................................................................................. 1
Theory of Operation ...................................................................... 10
Applications....................................................................................... 1
Pin Configurations ........................................................................... 1
General Description ......................................................................... 1
Revision History ............................................................................... 2
Specifications..................................................................................... 3
Absolute Maximum Ratings............................................................ 5
Thermal Resistance ...................................................................... 5
ESD Caution.................................................................................. 5
Pin Configurations and Function Descriptions ........................... 6
Typical Performance Characteristics ............................................. 7
REVISION HISTORY
10/06—Revision 0: Initial Version
Application Information................................................................ 11
Feedback Resistor Selection...................................................... 11
Power Control Modes of Operation ........................................ 11
Exposed Thermal Pad Connections ........................................ 11
Power Line Application............................................................. 11
Board Layout............................................................................... 12
Power Supply Bypassing............................................................ 12
Outline Dimensions....................................................................... 13
Ordering Guide .......................................................................... 13
Rev. 0 | Page 2 of 16

ADA4310-1
SPECIFICATIONS
VS = 12 V, ±6 V (@ TA = 25°C, G = +5, RL = 100 Ω, unless otherwise noted).
Table 1.
Parameter Test Conditions/Comments Min Typ Max Unit
DYNAMIC PERFORMANCE
−3 dB Bandwidth G = +5, V
PD1 = 0, PD0 = 1 140 MHz
PD1 = 1, PD0 = 0 100 MHz
Slew Rate G = +5, V
PD1 = 0, PD0 = 1 790 V/μs
PD1 = 1, PD0 = 0 750 V/μs
NOISE/DISTORTION PERFORMANCE
Distortion (Worst Harmonic) fC = 1 MHz, V
PD1 = 0, PD0 = 0 −95 dBc
PD1 = 0, PD0 = 1 −88 dBc
PD1 = 1, PD0 = 0 −77 dBc
f
= 10 MHz, V
C
PD1 = 0, PD0 = 0 −69 dBc
PD1 = 0, PD0 = 1 −57 dBc
PD1 = 1, PD0 = 0 −47 dBc
f
= 20 MHz, V
C
PD1 = 0, PD0 = 0 −50 dBc
PD1 = 0, PD0 = 1 −42 dBc
PD1 = 1, PD0 = 0 −35 dBc
Input Voltage Noise f = 100 kHz 2.85 nV/√Hz
Input Current Noise f = 100 kHz 21.8 pA/√Hz
DC PERFORMANCE
Input Offset Voltage 1 mV
Input Bias Current
Noninverting Input −2 μA
Inverting Input 6 μA
Open-Loop Transimpedance
R
R
LOAD
LOAD
Common-Mode Rejection −62 dB
INPUT CHARACTERISTICS
Input Resistance f < 100 kHz 500 kΩ
OUTPUT CHARACTERISTICS
Single-Ended +Swing R
Single-Ended −Swing R
Single-Ended +Swing R
Single-Ended −Swing R
Differential Swing R
LOAD
LOAD
LOAD
LOAD
LOAD
POWER SUPPLY
Operating Range (Dual Supply) ±2.5 ±6 V
Operating Range (Single Supply) +5 +12 V
Supply Current PD1 = 0, PD0 = 0 7.6 mA/amp
PD1 = 0, PD0 = 1 5.6 mA/amp
PD1 = 1, PD0 = 0 3.9 mA/amp
PD1 = 1, PD0 = 1 0.65 mA/amp
= 0.1 V p-p, PD1 = 0, PD0 = 0 190 MHz
OUT
= 2 V p-p, R
OUT
= 2 V p-p, R
OUT
OUT
OUT
= 2 V p-p, R
= 2 V p-p, R
= 50 Ω, PD1 = 0, PD0 = 0 820 V/μs
LOAD
= 50 Ω
LOAD
= 50 Ω
LOAD
= 50 Ω
LOAD
= 50 Ω 14 MΩ
= 100 Ω 35 MΩ
= 50 Ω +5.08 VP
= 50 Ω −5.12 VP
= 100 Ω +5.14 VP
= 100 Ω −5.17 VP
= 100 Ω 20.4 V p-p
Rev. 0 | Page 3 of 16

ADA4310-1
Parameter Test Conditions/Comments Min Typ Max Unit
POWER DOWN PINS
PD1, PD0 Threshold Referenced to GND 1.5 V
PD1, PD0 = 0 Pin Bias Current PD1 or PD0 = 0 V −0.2 μA
PD1, PD0 = 1 Pin Bias Current PD1 or PD0 = 3 V 70 μA
Enable/Disable Time 0.04/2 μs
Power Supply Rejection Ratio Positive/Negative −70/−60 dB
Rev. 0 | Page 4 of 16
ADA4310-1
ABSOLUTE MAXIMUM RATINGS
Table 2.
Parameter Rating
Supply Voltage
10-Lead MINI_SO_EP 12 V
16-Lead LFCSP_VQ ±6V
Power Dissipation (T
JMAX
− TA)/θ
JA
Storage Temperature Range −65°C to +125°C
Operating Temperature Range −40°C to +85°C
Lead Temperature (Soldering 10 sec) 300°C
Junction Temperature 150°C
Stresses above those listed under Absolute Maximum Ratings
may cause permanent damage to the device. This is a stress
rating only; functional operation of the device at these or any
other conditions above those indicated in the operational
section of this specification is not implied. Exposure to absolute
maximum rating conditions for extended periods may affect
device reliability.
THERMAL RESISTANCE
θJA is specified for the worst-case conditions, that is, θJA is
specified for device soldered in circuit board for surface-mount
packages.
Table 3.
Package Type θJA Unit
10-Lead MINI_SO_EP 44 °C/W
16-Lead LFCSP_VQ 63 °C/W
Maximum Power Dissipation
The maximum safe power dissipation for the ADA4310-1 is
limited by the associated rise in junction temperature (T
) on
J
the die. At approximately 150°C, which is the glass transition
temperature, the plastic changes its properties. Even temporarily
exceeding this temperature limit can change the stresses that the
package exerts on the die, permanently shifting the parametric
performance of the amplifiers. Exceeding a junction temperature of
150°C for an extended period can result in changes in silicon
devices, potentially causing degradation or loss of functionality.
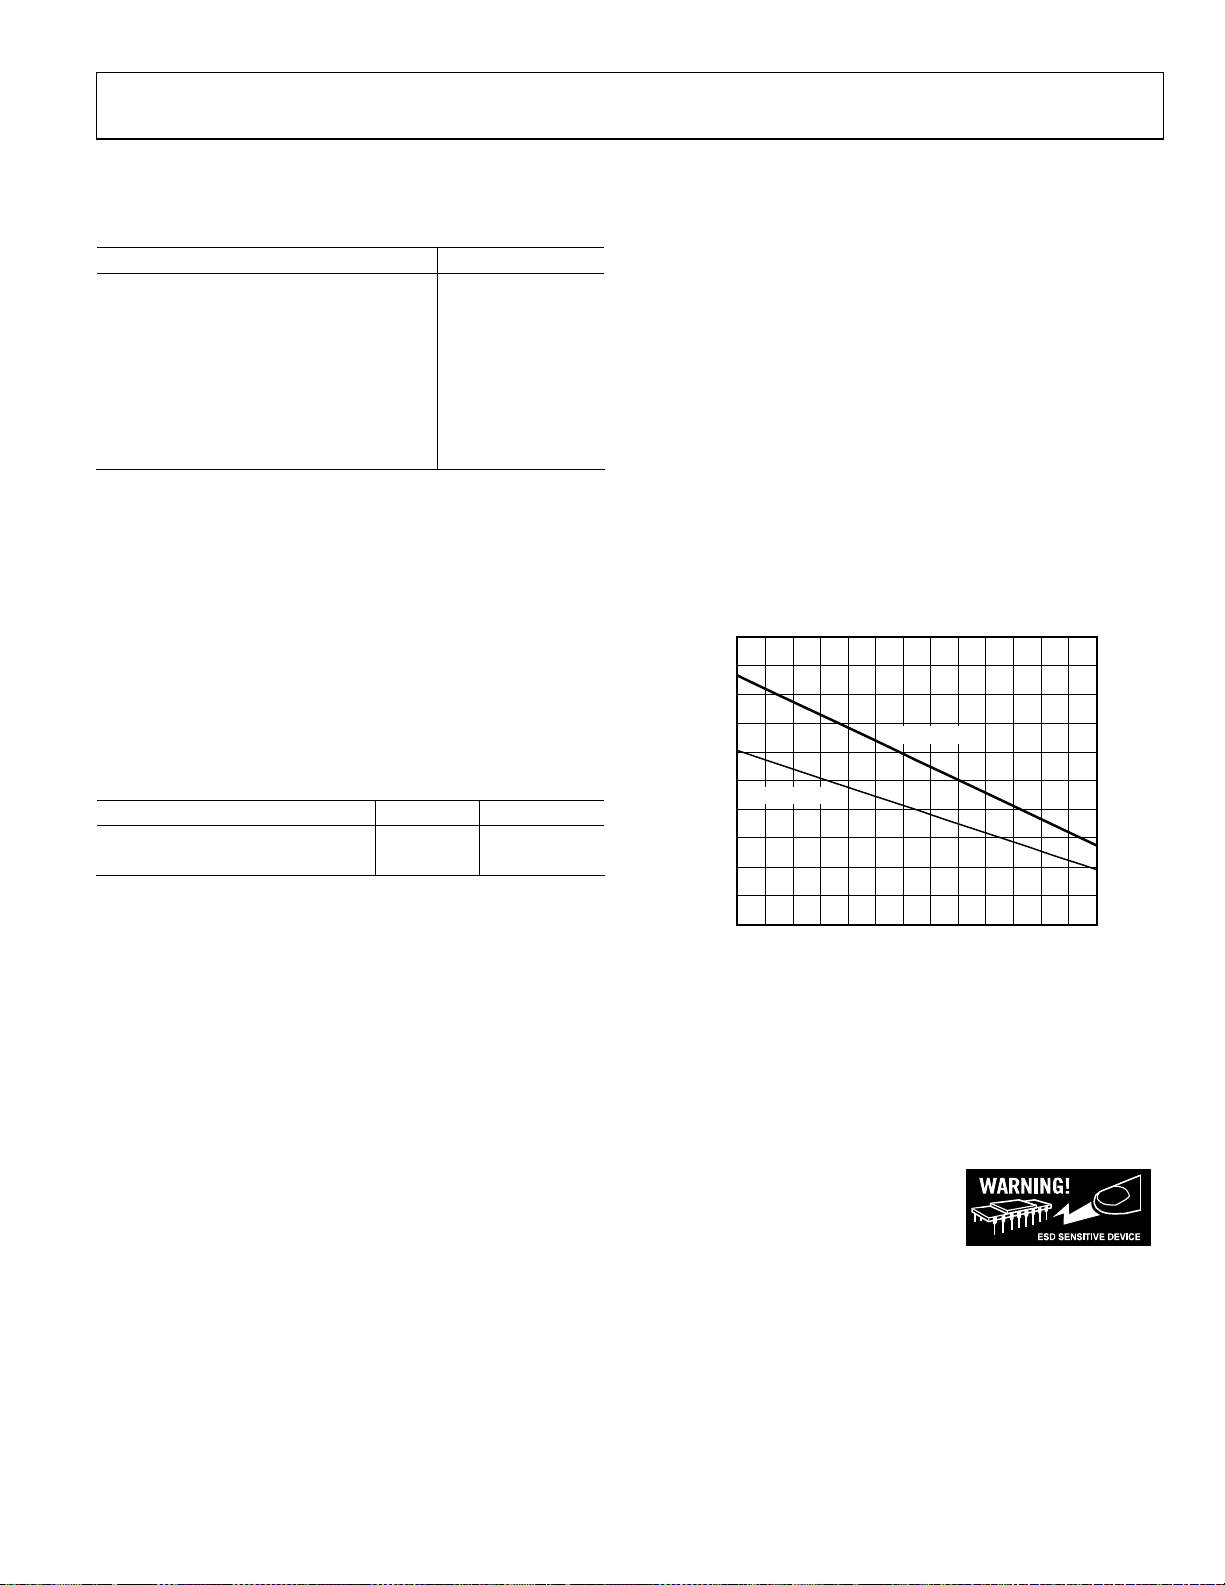
Figure 4 shows the maximum safe power dissipation in the
package vs. the ambient temperature for the 10-lead
MINI_SO_EP (44°C/W) and for the 16-lead LFCSP_VQ
(63°C/W) on a JEDEC standard 4-layer board. θ
values are
JA
approximations.
5.0
4.5
4.0
3.5
3.0
2.5
LFCSP_VQ-16
2.0
1.5
1.0
MAXIMUM POW ER DISSIP ATION (W )
0.5
0
–35 –15 5 25 45 65 85
Figure 4. Maximum Power Dissipation vs. Temperature for a 4-Layer Board
MINI_SO_E P-10
AMBIENT TEMPERATURE (°C)
06027-016
ESD CAUTION
ESD (electrostatic discharge) sensitive device. Electrostatic charges as high as 4000 V readily accumulate
on the human body and test equipment and can discharge without detection. Although this product features
proprietary ESD protection circuitry, permanent damage may occur on devices subjected to high energy
electrostatic discharges. Therefore, proper ESD precautions are recommended to avoid performance
degradation or loss of functionality.
Rev. 0 | Page 5 of 16

ADA4310-1
A
B
PIN CONFIGURATIONS AND FUNCTION DESCRIPTIONS
+V
NC
OUT A
–IN A
+IN A
S
1
2
3
4
5
NC = NO CONNECT
10
9
8
7
6
OUT B
–IN B
+IN B
PD1
PD0
06027-001
Figure 5. 10-Lead MSOP Pin Configuration
Table 4. 10-Lead MSOP Pin Function Description
Pin No. Mnemonic Description
1 +VS Positive Power Supply Input
2 NC No Connection
3 OUT A Amplifier A Output
4 −IN A Amplifier A Inverting Input
5 +IN A Amplifier A Noninverting Input
6 PD0 Power Dissipation Control
7 PD1 Power Dissipation Control
8 +IN B Amplifier B Noninverting Input
9 −IN B Amplifier B Inverting Input
10 OUT B Amplifier B Output
11 (Exposed
Paddle)
GND
Ground (Electrical Connection
Required)
S
OUT
OUT
NC
+V
14
13
16
15
1NC
2−IN A
3+IN A
4GND
NC = NO CONNECT
5
6
NC
NC
12 NC
11 −IN B
10 +IN B
9PD1
8
7
S
–V
PD0
06027-002
Figure 6. 16-Lead LFCSP Pin Configuration
Table 5. 16-Lead LFCSP Pin Function Description
Pin No. Mnemonic Description
1, 5, 6, 12, 15 NC No Connection
2 −IN A Amplifier A Inverting Input
3 +IN A Amplifier A Noninverting Input
4 GND Ground
7 −VS Negative Power Supply Input
8 PD0 Power Dissipation Control
9 PD1 Power Dissipation Control
10 +IN B Amplifier B Noninverting Input
11 −IN B Amplifier B Inverting Input
13 OUT B Amplifier B Output
14 +VS Positive Power Supply Input
16 OUT A Amplifier A Output
17 (Exposed
GND Ground
Paddle)
Rev. 0 | Page 6 of 16

ADA4310-1
–
TYPICAL PERFORMANCE CHARACTERISTICS
12
V
= 100mV p-p
OUT
R
= 50Ω
L
9
6
3
0
–3
–6
–9
NORMALIZED G AIN (d B)
–12
–15
–18
PD1, PD0 = 0, 0
1
G = +10
G = +20
10 100 1000
FREQUENCY (MHz)
G = +2
G = +5
Figure 7. Small Signal Frequency Response for Various Closed-Loop Gains
23
V
= 100mV p-p
OUT
G = +5
20
R
= 50Ω
L
17
14
11
8
5
GAIN (dB)
2
–1
–4
–7
–10
1
PD1, PD0 = 0, 1
PD1, PD0 = 1, 0
10 100 1000
FREQUENCY (MHz)
PD1, PD0 = 0, 0
Figure 8. Small Signal Frequency Response for Various Modes
100000
10000
1000
100
MAGNITUDE (kΩ)
R
10
1
= 100Ω
L
0°
–45
–90
–135
–180
–225
06027-022
06027-021
PHASE (Degrees)
20
V
= 2V p-p
OUT
= 50Ω
R
L
–30
G = +5
HARMONIC DISTO RTION (dBc)
–40
–50
–60
–70
–80
–90
–100
–110
–120
0.1
PD1, PD0 = 1, 0
PD1, PD0 = 0, 1
PD1, PD0 = 0, 0
1 10 100
FREQUENCY (MHz)
Figure 10. Harmonic Distortion vs. Frequency
100
10
VOLTAGE NOISE (nV/√Hz)
1
10 100 1k 10k 100k 1M 10M 100M 1G
FREQUENCY (Hz)
Figure 11. Voltage Noise vs. Frequency
0.20
G = +5
R
= 50Ω
L
0.15
10ns/DIV
0.10
0.05
0
OUTPUT (V)
–0.05
–0.10
–0.15
HD2
HD3
06027-023
06027-012
0.1
0.0001 0.001 0.01 0.1 1 10 100 1000
FREQUENCY ( MHz)
Figure 9. Open-Loop Transimpedance Gain and Phase vs. Frequency
–270
–0.20
06027-013
06027-020
Figure 12. Small Signal Transient Response
Rev. 0 | Page 7 of 16

ADA4310-1
–
0
PD1, PD0 = (0, 0)
R
= 100Ω
L
–10
–20
–30
–40
40
PD1, PD0 = (1,1)
–60
–80
–50
COMMON-MO DE REJECTIO N (dB)
–60
–70
0.01 0. 1 1 10 100 1000
FREQUE NCY (MHz )
Figure 13. Common-Mode Rejection(CMR) vs. Frequency
0
G = +5
PD1, PD0 = (0, 0)
–10
= 100Ω
R
L
–20
–30
–40
–50
–60
POWER SUPPLY REJECTI ON (dB)
–70
–80
0.01 0. 1 1 10 100 1000
+PSR
–PSR
FREQUE NCY (MHz )
Figure 14. Power Supply Rejection(PSR) vs. Frequency
100
PD1, PD0 = (0, 0)
10
FEEDTHROUG H (dB)
–100
–120
1 10 100 1000
6027-007
FREQUENCY (MHz )
06027-010
Figure 16. Off-Isolation vs. Frequency
1000
PD1, PD0 = (1,1)
100
10
1
0.1
OUTPUT IMPEDANCE (kΩ)
0.01
0.001
0.01 0. 1 1 10 100 1000
06027-006
FREQUENCY (MHz)
06027-008
Figure 17. Output Impedance vs. Frequency (Disabled)
2.5
10ns/DIV
V
2.0
1.5
OUT
V
, V
PD0
PD1
1
OUTPUT IMPEDANCE (Ω)
0.1
1.0
VOLTAGE (V)
0.5
0
0.01
0.1 1 10 100 1000
FREQUENCY (MHz )
Figure 15. Closed-Loop Output Impedance vs. Frequency
6027-009
–0.5
Figure 18. Power-Down Turn On/Turn Off
06027-011
Rev. 0 | Page 8 of 16

ADA4310-1
0
–20
–40
–60
–80
CROSSTAL K (dB)
–100
–120
0.1 1 10 100 1000
FREQUENCY (MHz)
06027-014
Figure 19. Crosstalk
Rev. 0 | Page 9 of 16

ADA4310-1
THEORY OF OPERATION
The ADA4310-1 is a current feedback amplifier with high
output current capability. With a current feedback amplifier, the
current into the inverting input is the feedback signal, and the
open-loop behavior is that of a transimpedance, dV
/dIIN or TZ.
O
The open-loop transimpedance is analogous to the open-loop
voltage gain of a voltage feedback amplifier.
simplified model of a current feedback amplifier. Because R
proportional to 1/g
where g
is the transconductance of the input stage. Basic
m
, the equivalent voltage gain is just TZ × gm,
m
Figure 20 shows a
IN
is
analysis of the follower with gain circuit yields
()
V
O
×=
G
V
IN
Z
()
sT
Z
RRGsT
+×+
FIN
where:
R
F
G
R
IN
+= 1
R
G
501≈=
g
m
Because G × R
<< RF for low gains, a current feedback
IN
amplifier has relatively constant bandwidth vs. gain, the 3 dB
point being set when |T
| = RF.
Z
Of course, for a real amplifier there are additional poles that
contribute excess phase, and there is a value for R
below which
F
the amplifier is unstable. Tolerance for peaking and desired
flatness determines the optimum R
R
G
R
N
V
IN
Figure 20. Simplified Block Diagram
in each application.
F
R
F
R
IN
T
Z
I
IN
V
OUT
06027-017
Rev. 0 | Page 10 of 16

ADA4310-1
APPLICATION INFORMATION
FEEDBACK RESISTOR SELECTION
The feedback resistor has a direct impact on the closed-loop
bandwidth and stability of the current feedback op amp.
Reducing the resistance below the recommended value can
make the amplifier response peak and even become unstable.
Increasing the size of the feedback resistor beyond the recommended value reduces the closed-loop bandwidth.
Tabl e 6
provides a convenient reference for quickly determining the
feedback and gain resistor values, and the corresponding
bandwidth, for common gain configurations. The recommended
value of feedback resistor for the ADA4310-1 is 499 Ω.
Table 6. Recommended Values and Frequency Performance
Gain RF (Ω) RG (Ω) −3 dB SS BW (MHz)
+2 499 499 230
+5 499 124 190
+5 1k 249 125
+10 499 55.4 160
+20 499 26.1 115
1
Conditions: VS = ±6 V, TA = 25°C, RL = 50 Ω, PD1, PD0 = 0,0.
POWER CONTROL MODES OF OPERATION
The ADA4310-1 features four power modes: full power, ¾
power, ½ power, and shutdown. The power modes are
controlled by two logic pins, PD0 and PD1. The power-down
control pins are compatible with standard 3 V and 5 V CMOS
logic.
Tabl e 7 shows the various power modes and associated
logic states. In the power-down mode, the output of the
amplifier goes into a high-impedance state.
Table 7. Power Modes
PD1 PD0 Power Mode
Total Supply
Current (mA)
Output
Impedance
Low Low Full Power 15.2 Low
Low High ¾ Power 11.2 Low
High Low ½ Power 7.8 Low
High High Power Down 1.3 High
EXPOSED THERMAL PAD CONNECTIONS
The exposed thermal pad on the 10-lead MSOP package is both
the reference for the PD pins and the only electrical connection
for the negative supply voltage. Therefore, in the 10-lead MSOP
package, the ADA4310-1 can only be used on a single supply.
The exposed thermal pad MUST be connected to ground.
Failure to do so will render the part inoperable.
1
A requirement for both packages is that the thermal pad be
connected to a solid plane with low thermal resistance, ensuring
adequate heat transfer away from the die and into the board.
POWER LINE APPLICATION
Applications (that is, powerline AV modems) requiring greater
than 10 dBm peak power should consider using an external line
driver, such as the ADA4310-1.
interface between the TxDAC® output and ADA4310-1 biased
for single-supply operation. The TxDAC’s peak-to-peak differential output voltage swing should be limited to 2 V p-p, with
the ADA4310-1’s gain configured to realize the additional
voltage gain required by the application. A low-pass filter
should be considered to filter the DAC images inherent in the
signal reconstruction process. In addition, dc blocking capacitors
are required to level-shift the TxDAC’s output signal to the
common-mode level of the ADA4310-1 (that is, AVDD/2).
0.1µF
R
SET
O
I
F
E
R
REFADJ
TxDAC
0dB T O –7.5dB
Figure 21. TxDAC Output Directly via Center-Tap Transformer
E
L
B
A
S
I
D
x
T
IOUTP+
IOUTP–
Figure 21 shows an example
OPTIONAL
LCLPF
AVDD/2
1/2
ADA4310-1
1/2
ADA4310-1
06027-019
The 4 mm × 4 mm 16-lead LFCSP package has dedicated pins
for both the positive and negative supplies, and it can be used
in either single supply or dual supply applications. There is no
electrical connection for the exposed thermal pad. Although the
pad could theoretically be connected to any potential, it is still
typically connected to ground.
Rev. 0 | Page 11 of 16

ADA4310-1
BOARD LAYOUT
As is the case with all high speed applications, careful attention
to printed circuit board layout details prevents associated board
parasitics from becoming problematic. Proper RF design
technique is mandatory. The PCB should have a ground plane
covering all unused portions of the component side of the
board to provide a low impedance return path. Removing the
ground plane on all layers from the area near the input and
output pins reduces stray capacitance, particularly in the area of
the inverting inputs. Signal lines connecting the feedback and
gain resistors should be as short as possible to minimize the
inductance and stray capacitance associated with these traces.
Termination resistors and loads should be located as close as
possible to their respective inputs and outputs. Input and output
traces should be kept as far apart as possible to minimize
coupling (crosstalk) though the board. Wherever there are
complementary signals, a symmetrical layout should be
provided to the extent possible to maximize balanced
performance. When running differential signals over a long
distance, the traces on the PCB should be close. This reduces
the radiated energy and makes the circuit less susceptible to RF
interference. Adherence to stripline design techniques for long
signal traces (greater than about 1 inch) is recommended.
POWER SUPPLY BYPASSING
The ADA4310-1 operates on supplies, from +5 V to ±6 V. The
ADA4310-1 circuit should be powered with a well-regulated
power supply. Careful attention must be paid to decoupling the
power supply. High quality capacitors with low equivalent series
resistance (ESR), such as multilayer ceramic capacitors
(MLCCs), should be used to minimize supply voltage ripple and
power dissipation. In addition, 0.1 µF MLCC decoupling
capacitors should be located no more than ⅛-inch away from
each of the power supply pins. A large, usually tantalum, 10 µF
capacitor is required to provide good decoupling for lower
frequency signals and to supply current for fast, large signal
changes at the ADA4310-1 outputs. Bypassing capacitors should
be laid out in such a manner to keep return currents away from
the inputs of the amplifiers. This minimizes any voltage drops
that can develop due to ground currents flowing through the
ground plane. A large ground plane also provides a low
impedance path for the return currents.
For more information on high speed board layout, go to
www.analog.com and A Practical Guide to High-Speed Printed-
Circuit-Board Layout.
Rev. 0 | Page 12 of 16

ADA4310-1
OUTLINE DIMENSIONS
3.00 BSC
3.00 BSC
PIN 1
0.95
0.85
0.75
0.15
0.00
6
10
TOP
4.90 BSC
VIEW
1
5
1.10 MAX
SEATING
PLANE
BOTTOM VIEW
0.23
0.08
0.50 BSC
0.33
0.17
COPLANARITY
0.10
COMPLIANT TO JEDEC STANDARDS MO-187-BA-T
EXPOSED
PAD
2.50
0.75
8°
0°
SQ
0.80
0.60
0.40
Figure 22. 10-Lead Mini Small Outline Package with Exposed Pad [MINI_SO_EP]
(RH-10)
Dimensions shown in millimeters
PIN 1
INDICATOR
1.00
0.85
0.80
12° MAX
SEATING
PLANE
4.00
BSC SQ
TOP
VIEW
0.80 MAX
0.65 TYP
0.35
0.30
0.25
3.75
BSC SQ
0.20 REF
0.60 MAX
0.65 BSC
0.05 MAX
0.02 NOM
COPLANARITY
0.75
0.60
0.50
0.08
0.60 MAX
(BOTTOM VIEW)
13
12
EXPOSED
9
8
PAD
16
5
1.95 BSC
PIN 1
INDICATOR
1
.
2
5
2
Q
S
0
1
.
2
5
9
.
1
4
0.25 MIN
COMPLIANT TO JEDEC STANDARDS MO-220-VG GC
010606-0
Figure 23. 16-Lead Lead Frame Chip Scale Package [LFCSP_VQ]
4 mm × 4 mm Body, Very Thin Quad
(CP-16-4)
Dimensions shown in millimeters
ORDERING GUIDE
Temperature
Model
Package
Package Description
ADA4310-1ARHZ-RL1 −40°C to +85°C 10-Lead Mini Small Outline Package with Exposed Pad [MINI_SO_EP] RH-10 0L
ADA4310-1ARHZ-R71 −40°C to +85°C 10-Lead Mini Small Outline Package with Exposed Pad [MINI_SO_EP] RH-10 0L
ADA4310-1ARHZ1 −40°C to +85°C 10-Lead Mini Small Outline Package with Exposed Pad [MINI_SO_EP] RH-10 0L
ADA4310-1ACPZ-RL1 −40°C to +85°C 16-Lead Lead Frame Chip Scale Package [LFCSP_VQ] CP-16-4
ADA4310-1ACPZ-R21 −40°C to +85°C 16-Lead Lead Frame Chip Scale Package [LFCSP_VQ] CP-16-4
ADA4310-1ACPZ-R71 −40°C to +85°C 16-Lead Lead Frame Chip Scale Package [LFCSP_VQ] CP-16-4
1
Z = Pb-free part.
Rev. 0 | Page 13 of 16
Package
Option
Branding

ADA4310-1
NOTES
Rev. 0 | Page 14 of 16

ADA4310-1
NOTES
Rev. 0 | Page 15 of 16

ADA4310-1
NOTES
©2006 Analog Devices, Inc. All rights reserved. Trademarks and
registered trademarks are the property of their respective owners.
D06027-0-10/06(0)
Rev. 0 | Page 16 of 16
 Loading...