

www.BDTIC.com/ADI
Ultralow Noise Amplifier at Lower Power
FEATURES
Ultralow noise: 2.8 nV/√Hz at 1 kHz typical
Ultralow distortion: 0.0002% typical
Low supply current: 1.8 mA per amplifier typical
Offset voltage: 1 mV maximum
Bandwidth: 6.5 MHz typical
Slew rate: 12 V/μs typical
Unity-gain stable
Extended industrial temperature range
SOIC package
APPLICATIONS
Precision instrumentation
Professional audio
Active filters
Low noise amplifier front end
Integrators
GENERAL DESCRIPTION
The ADA4075-2 is a dual, high performance, low noise operational
amplifier combining excellent dc and ac characteristics on the
Analog Devices, Inc., iPolar® process. The iPolar process is an
advanced bipolar technology implementing vertical junction
isolation with lateral trench isolation. This allows for low noise
performance amplifiers in smaller die size at faster speed and
lower power. Its high slew rate, low distortion, and ultralow
noise make the ADA4075-2 ideal for high fidelity audio and
high performance instrumentation applications. It is also
especially useful for lower power demands, small enclosures,
and high density applications. The ADA4075-2 is specified for
the temperature range of −40°C to +125°C and is available in a
standard SOIC package.
ADA4075-2
PIN CONFIGURATION
OUTA
1
ADA4075-2
–INA
2
+INA
TOP VIEW
3
(Not to Scale)
4
V–
Figure 1. 8-Lead SOIC
Table 1. Low Noise Precision Op Amps
Supply 44 V 36 V 12 V to 16 V 5 V
Single OP27 AD8671 AD8665 AD8605
AD8675 OP162 AD8655
AD797 AD8691
Dual OP275 AD8672 AD8666 AD8606
AD8676 OP262 AD8656
AD8599 AD8692
Quad ADA4004-4 AD8668 AD8608
AD8674 OP462 AD8694
8
7
6
5
V+
OUTB
–INB
+INB
7642-001
Rev. 0
Information furnished by Analog Devices is believed to be accurate and reliable. However, no
responsibility is assumed by Analog Devices for its use, nor for any infringements of patents or other
rights of third parties that may result from its use. Specifications subject to change without notice. No
license is granted by implication or otherwise under any patent or patent rights of Analog Devices.
Trademarks and registered trademarks are the property of their respective owners.
One Technology Way, P.O. Box 9106, Norwood, MA 02062-9106, U.S.A.
Tel: 781.329.4700 www.analog.com
Fax: 781.461.3113 ©2008 Analog Devices, Inc. All rights reserved.

ADA4075-2
www.BDTIC.com/ADI
TABLE OF CONTENTS
Features .............................................................................................. 1
Applications ....................................................................................... 1
Pin Configurations ........................................................................... 1
General Description ......................................................................... 1
Revision History ............................................................................... 2
Specifications ..................................................................................... 3
Absolute Maximum Ratings ............................................................ 4
Thermal Resistance ...................................................................... 4
Power Sequencing ........................................................................ 4
ESD Caution .................................................................................. 4
Typical Performance Characteristics ............................................. 5
REVISION HISTORY
10/08—Revision 0: Initial Version
Applications Information .............................................................. 15
Input Protection ......................................................................... 15
Total Harmonic Distortion ....................................................... 15
Phase Reversal ............................................................................ 15
DAC Output Filter...................................................................... 16
Balanced Line Driver ................................................................. 17
Balanced Line Receiver .............................................................. 18
Low Noise Parametric Equalizer .............................................. 19
Schematic ......................................................................................... 20
Outline Dimensions ....................................................................... 21
Ordering Guide .......................................................................... 21
Rev. 0 | Page 2 of 24

ADA4075-2
www.BDTIC.com/ADI
SPECIFICATIONS
VSY = ±15 V, VCM = 0 V, TA = 25°C, unless otherwise noted.
Table 2.
Parameter Symbol Conditions Min Typ Max Unit
INPUT CHARACTERISTICS
Offset Voltage VOS 0.2 1 mV
−40°C ≤ TA ≤ +125°C 1.2 mV
Input Bias Current IB 30 100 nA
−40°C ≤ TA ≤ +125°C 150 nA
Input Offset Current IOS 5 50 nA
−40°C ≤ TA ≤ +125°C 75 nA
Input Voltage Range −40°C ≤ TA ≤ +125°C −12.5 +12.5 V
Common-Mode Rejection Ratio CMRR VCM = −12.5 V to +12.5 V 110 118 dB
−40°C ≤ TA ≤ +125°C 106 dB
Large-Signal Voltage Gain AVO R
−40°C ≤ TA ≤ +125°C 108 dB
R
−40°C ≤ TA ≤ +125°C 106 dB
Offset Voltage Drift ∆VOS/∆T −40°C ≤ TA ≤ +125°C 0.3 μV/°C
Input Resistance RIN 40 MΩ
Input Capacitance, Differential Mode C
Input Capacitance, Common Mode C
2.4 pF
INDM
2.1 pF
INCM
OUTPUT CHARACTERISTICS
Output Voltage High VOH R
−40°C ≤ TA ≤ +125°C 12.5 V
R
−40°C ≤ TA ≤ +125°C 12 V
V
−40°C ≤ TA ≤ +125°C 15 V
Output Voltage Low VOL R
−40°C ≤ TA ≤ +125°C −13 V
R
−40°C ≤ TA ≤ +125°C −12.5 V
V
−40°C ≤ TA ≤ +125°C −15.5 V
Short-Circuit Current ISC 40 mA
Closed-Loop Output Impedance Z
f = 100 kHz, AV = 1 0.3 Ω
OUT
POWER SUPPLY
Power Supply Rejection Ratio PSRR VSY = ±4.5 V to ±18 V 106 110 dB
−40°C ≤ TA ≤ +125°C 100 dB
Supply Current per Amplifier ISY V
−40°C ≤ TA ≤ +125°C 3.35 mA
DYNAMIC PERFORMANCE
Slew Rate SR RL = 2 kΩ, AV = 1 12 V/μs
Settling Time tS To 0.01%, VIN = 10 V step, RL = 1 kΩ 3 μs
Gain Bandwidth Product GBP RL = 1 MΩ, CL = 35 pF, AV = 1 6.5 MHz
Phase Margin ΦM R
THD + NOISE
Total Harmonic Distortion and Noise THD + N RL = 2 kΩ, AV = 1, VIN = 3 V rms, f = 20 Hz to 20 kHz 0.0002 %
NOISE PERFORMANCE
Voltage Noise en p-p f = 0.1 Hz to 10 Hz 60 nV p-p
Voltage Noise Density en f = 1 kHz 2.8 nV/√Hz
Current Noise Density in f = 1 kHz 1.2 pA/√Hz
= 2 kΩ, VO = −11 V to +11 V 114 117 dB
L
= 600 Ω, VO = −10 V to +10 V 112 117 dB
L
= 2 kΩ to GND 12.8 13 V
L
= 600 Ω to GND 12.4 12.8 V
L
= ±18 V, RL = 600 Ω to GND 15.4 15.8 V
SY
= 2 kΩ to GND −14 −13.6 V
L
= 600 Ω to GND −13.6 −13 V
L
= ±18 V, RL = 600 Ω to GND −16.6 −16 V
SY
= ±4.5 V to ±18 V, IO = 0 mA 1.8 2.25 mA
SY
= 1 MΩ, CL = 35 pF, AV = 1 60 Degrees
L
Rev. 0 | Page 3 of 24

ADA4075-2
www.BDTIC.com/ADI
ABSOLUTE MAXIMUM RATINGS
Table 2.
Parameter Rating
Supply Voltage ±20 V
Input Voltage ±VSY
Input Current1 ±10 mA
Differential Input Voltage ±1 V
Output Short-Circuit Duration to GND Indefinite
Storage Temperature Range −65°C to +150°C
Operating Temperature Range −40°C to +125°C
Junction Temperature Range −65°C to +150°C
Lead Temperature (Soldering, 60 sec) 300°C
1
The input pins have clamp diodes to the power supply pins.
Stresses above those listed under Absolute Maximum Ratings
may cause permanent damage to the device. This is a stress
rating only; functional operation of the device at these or any
other conditions above those indicated in the operational
section of this specification is not implied. Exposure to absolute
maximum rating conditions for extended periods may affect
device reliability.
THERMAL RESISTANCE
θJA is specified for the worst-case conditions, that is, a device
soldered in a circuit board for surface-mount packages. This
was measured using a standard 2-layer board.
Table 3. Thermal Resistance
Package Type θJA θ
8-Lead SOIC 158 43 °C/W
Unit
JC
POWER SEQUENCING
The op amp supplies must be established simultaneously with,
or before, any input signals are applied. If this is not possible,
the input current must be limited to 10 mA.
ESD CAUTION
Rev. 0 | Page 4 of 24
ADA4075-2
www.BDTIC.com/ADI
TYPICAL PERFORMANCE CHARACTERISTICS
TA = 25°C, unless otherwise noted.
250
200
VSY = ±15V
V
= 0V
CM
250
200
VSY = ±5V
V
= 0V
CM
150
100
NUMBER OF AMPLIFIERS
50
0
–1.0 –0. 5 0 0. 5 1. 0
VOS (mV)
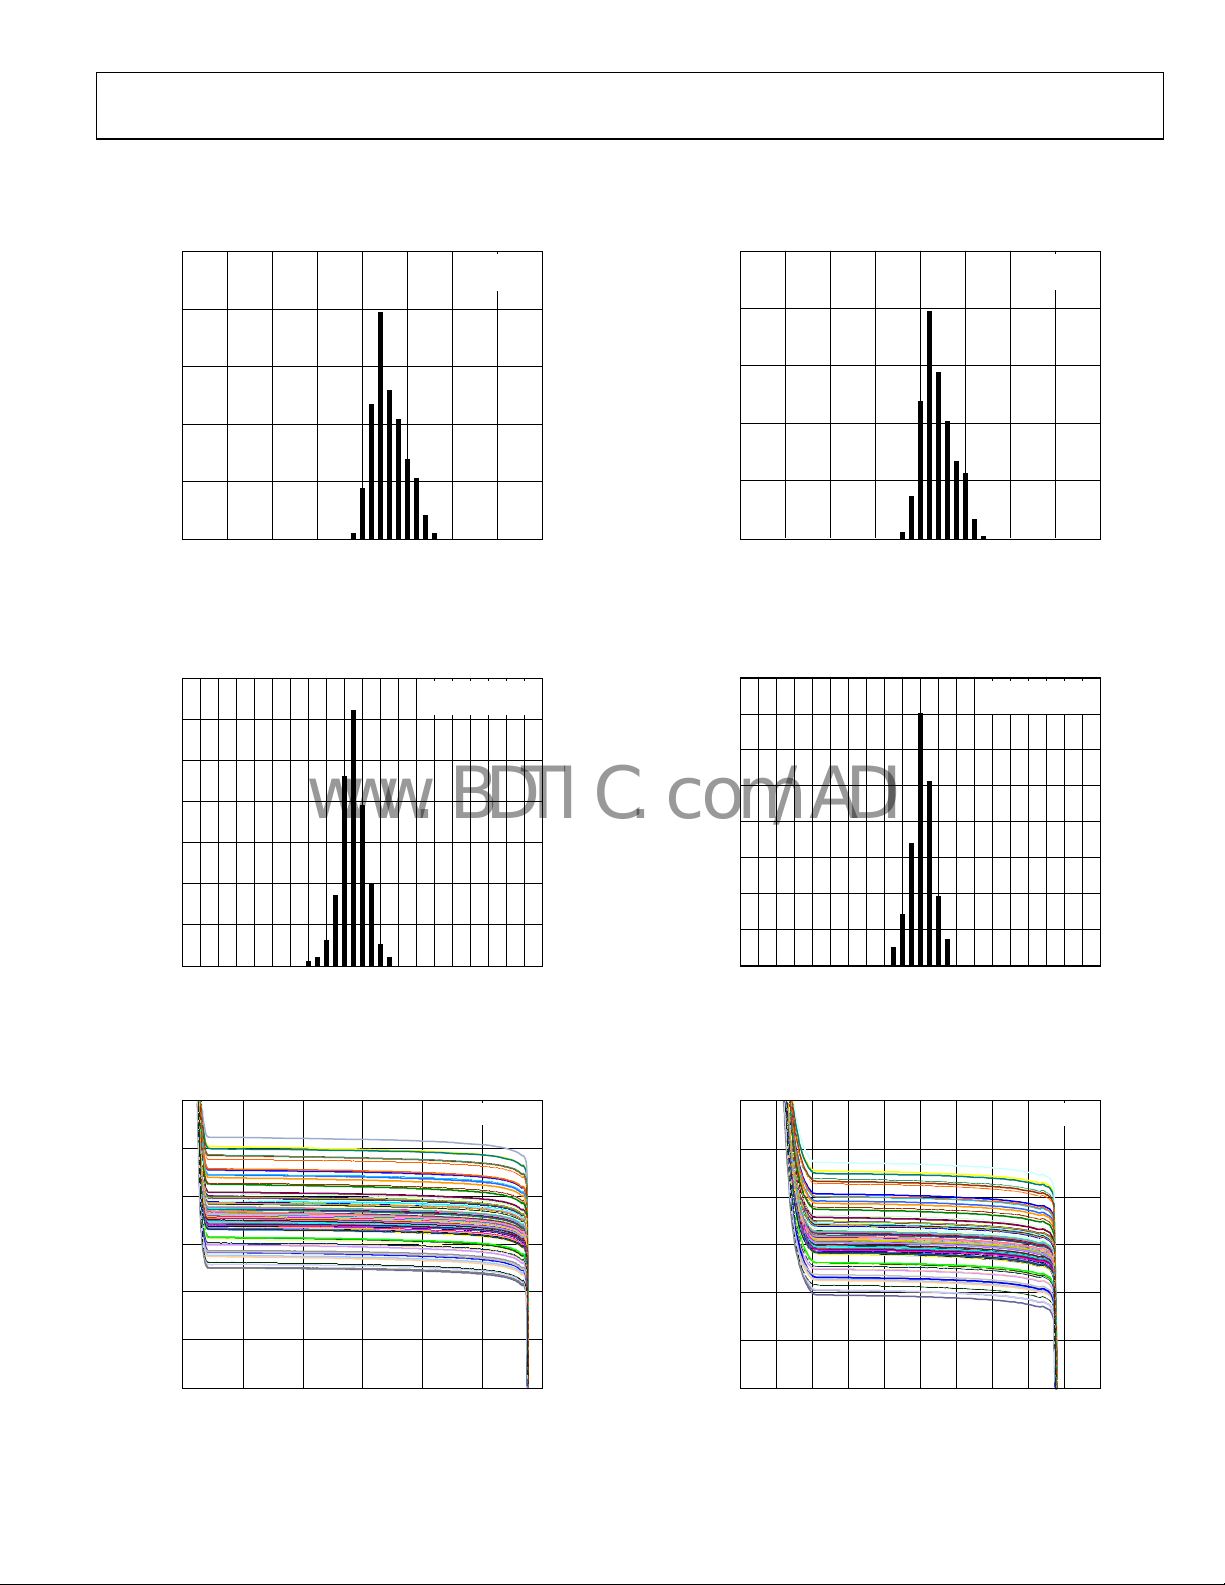
Figure 2. Input Offset Voltage Distribution
70
60
50
40
30
20
NUMBER OF AMPLIFIERS
10
VSY = ±15V
–40°C T
A
+125°C
150
100
NUMBER OF AMPL IFIERS
50
0
–1.0 –0. 5 0 0. 5 1.0
07642-003
VOS (mV)
07642-006
Figure 5. Input Offset Voltage Distribution
80
70
60
50
40
30
NUMBER OF AMPLIFIERS
20
10
VSY = ±5V
–40°C T
+125°C
A
0
–2.0 –1. 6 –1.2 –0.8 –0.4 0 0.4 0. 8 1.2 1.6 2.0
TCVOS (V/°C)
Figure 3. Input Offset Voltage Drift Distribution
300
200
100
(V)
0
OS
V
–100
–200
–300
–15 –10 –5 0 5 10 15
VCM (V)
VSY = ±15V
Figure 4. Input Offset Voltage vs. Common-Mode Voltage
07642-004
07642-005
Rev. 0 | Page 5 of 24
0
–2.0 –1. 6 –1.2 –0.8 –0.4 0 0.4 0. 8 1.2 1.6 2.0
TCVOS (V/°C)
Figure 6. Input Offset Voltage Drift Distribution
300
200
100
(V)
0
OS
V
–100
–200
–300
–5 –4 –3 –2 –1 0 1 2 3 4 5
VCM (V)
VSY = ±5V
Figure 7. Input Offset Voltage vs. Common-Mode Voltage
07642-007
07642-008

ADA4075-2
www.BDTIC.com/ADI
80
VSY = ±15V
100
VSY = ±5V
60
40
(nA)
B
I
20
0
–40 –25 –10 5 20 35 50 65 80 95 110 125
TEMPERATURE (° C)
Figure 8. Input Bias Current vs. Temperature
60
VSY = ±15V
50
40
30
(nA)
B
I
20
80
60
(nA)
B
I
40
20
0
–40 –25 –10 5 20 35 50 65 80 95 110 125
07642-009
TEMPERATURE (° C)
07642-012
Figure 11. Input Bias Current vs. Temperature
60
VSY = ±5V
50
40
30
(nA)
B
I
20
10
0
–15 –10 –5 0 5 10 15
VCM (V)
Figure 9. Input Bias Current vs. Input Common-Mode Voltage
10
VCC – V
OH
1
VOL – V
EE
OUTPUT VOLTAGE TO SUPPLY RAIL (V)
0.1
0.001 0.01 0.1 1 10 100
LOAD CURRENT (mA)
VSY = ±15V
Figure 10. Output Voltage to Supply Rail vs. Load Current
10
0
–4–3–2–101234
07642-047
VCM (V)
07642-049
Figure 12. Input Bias Current vs. Input Common-Mode Voltage
10
VCC – V
OH
1
OUTPUT VOLTAGE TO SUPPLY RAIL (V)
0.1
0.001 0.01 0.1 1 10 100
07642-010
VOL – V
EE
LOAD CURRENT (mA)
VSY = ±5V
07642-013
Figure 13. Output Voltage to Supply Rail vs. Load Current
Rev. 0 | Page 6 of 24

ADA4075-2
www.BDTIC.com/ADI
2.5
2.0
1.5
1.0
VCC – V
V
– V
OL
VSY = ±15V
R
= 2k
L
OH
EE
2.0
1.5
1.0
VCC – V
VOL – V
OH
EE
VSY = ±5V
R
= 2k
L
0.5
OUTPUT VOLTAGE TO SUPPLY RAIL (V)
0
–40 –25 –10 5 20 35 50 65 80 95 110 125
TEMPERATURE (° C)
Figure 14. Output Voltage to Supply Rail vs. Temperature
140
120
100
80
60
40
20
0
GAIN (dB)
–20
–40
–60
–80
–100
1k 10k 100k 1M 10M 100M
PHASE
GAIN
FREQUENCY (Hz)
VSY = ±15V
Figure 15. Open-Loop Gain and Phase vs. Frequency
140
120
100
80
60
40
20
0
–20
–40
–60
–80
–100
07642-011
PHASE (Degrees)
07642-015
0.5
OUTPUT VOLTAGE TO SUPPLY RAIL (V)
0
–40 –25 –10 5 20 35 50 65 80 95 110 125
TEMPERATURE (° C)
Figure 17. Output Voltage to Supply Rail vs. Temperature
140
120
100
80
60
40
20
0
GAIN (dB)
–20
–40
–60
–80
1k 10k 100k 1M 10M 100M
GAIN
PHASE
FREQUENCY (Hz)
Figure 18. Open-Loop Gain and Phase vs. Frequency
VSY = ±5V
140
120
100
80
60
40
20
0
–20
–40
–60
–80
–100–100
07642-014
PHASE (Degrees)
07642-018
50
AV = +100
40
30
AV = +10
20
10
AV = +1
GAIN (dB)
0
–10
–20
–30
1k 10k 100k 1M 10M 100M
FREQUENCY (Hz)
VSY = ±15V
±15V
07642-016
Figure 16. Closed-Loop Gain vs. Frequency
Rev. 0 | Page 7 of 24
50
AV = +100
40
30
AV = +10
20
10
AV = +1
GAIN (dB)
0
–10
–20
–30
1k 10k 100k 1M 10M 100M
FREQUENCY (Hz)
VSY = ±5V
Figure 19. Closed-Loop Gain vs. Frequency
±15V
07642-019
ADA4075-2
www.BDTIC.com/ADI
1k
100
VSY = ±15V
AV = +10
100
1k
VSY = ±5V
AV = +10
10
()
1
OUT
Z
0.1
0.01
0.001
10 100 1k 10k 100k 1M 10M
AV = +100
AV = +1
FREQUENCY (Hz)
Figure 20. Output Impedance vs. Frequency
140
120
100
80
60
CMRR (dB)
40
VSY = ±15V
10
()
1
OUT
Z
0.1
0.01
0.001
10 100 1k 10k 100k 1M 10M
07642-017
AV = +100
FREQUENCY (Hz)
AV = +1
07642-020
Figure 23. Output Impedance vs. Frequency
140
120
100
80
60
CMRR (dB)
40
VSY = ±5V
20
0
100 1k 10k 100k 1M 10M
FREQUENCY (Hz)
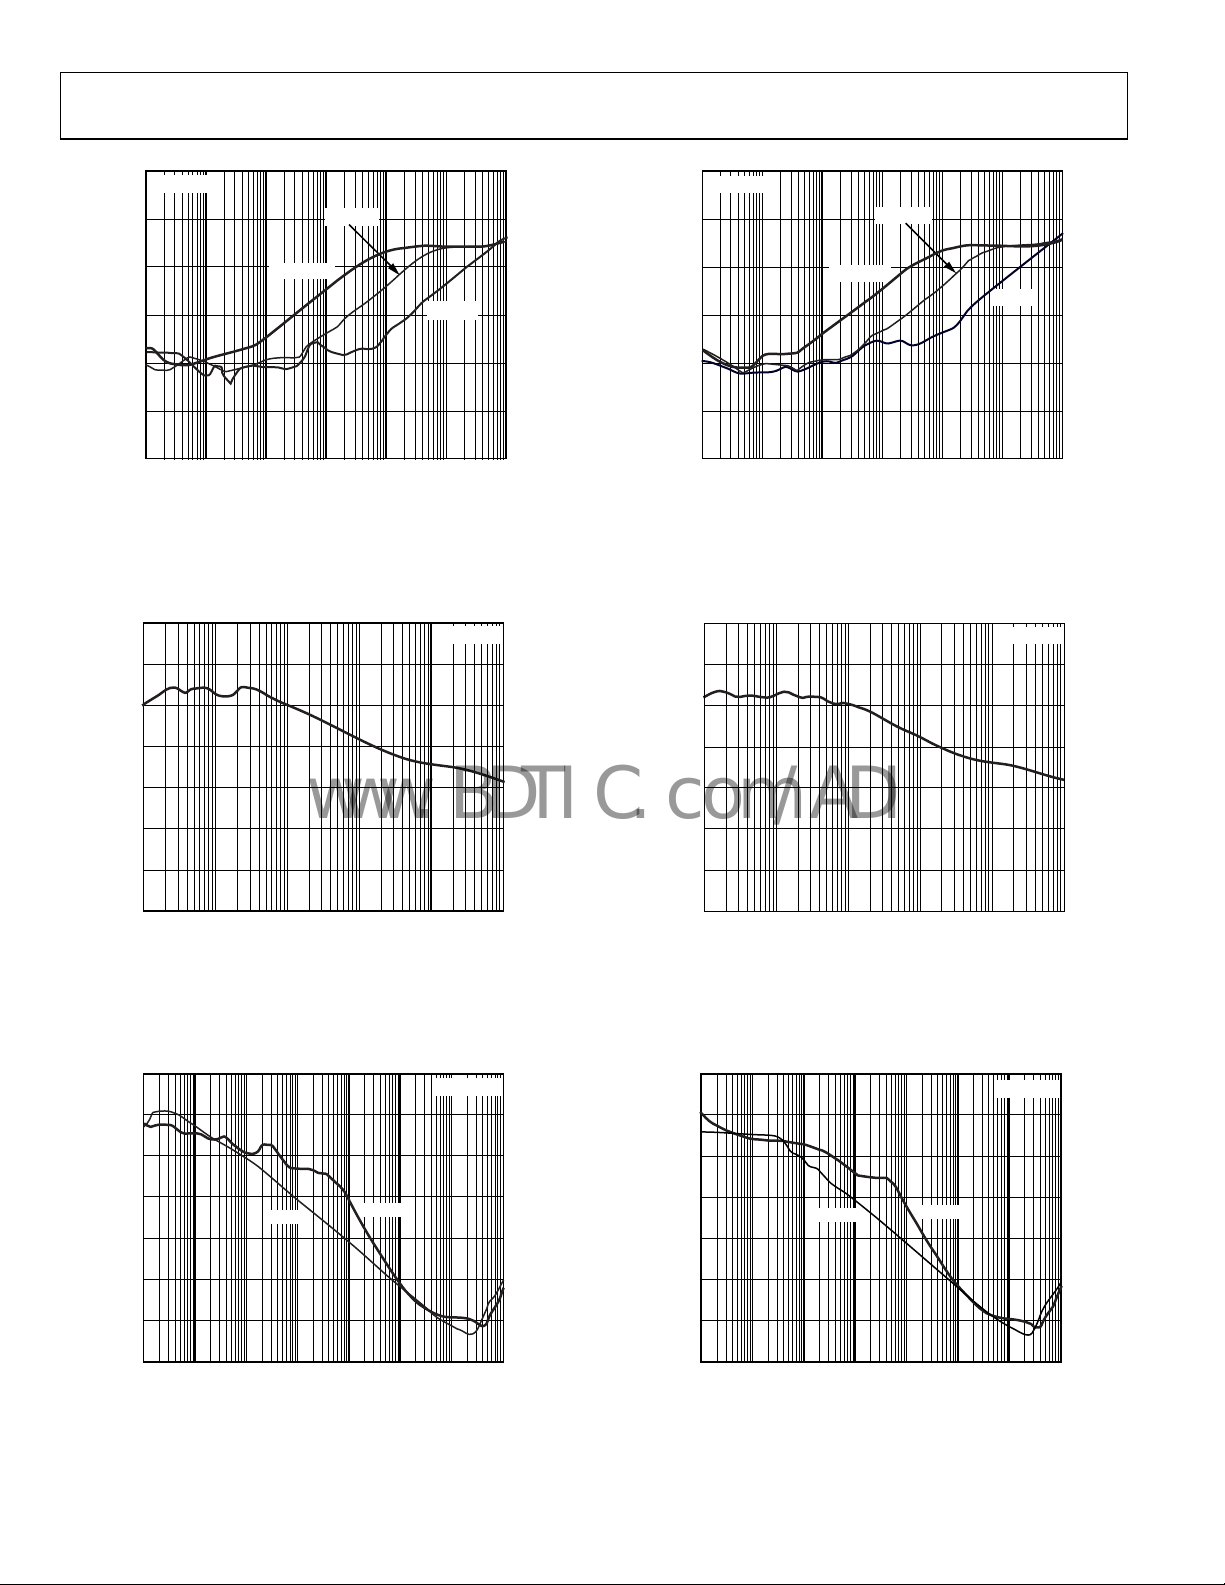
Figure 21. CMRR vs. Frequency
120
100
80
60
40
PSRR (dB)
20
0
–20
10 100 1k 10k 100k 1M 10M 100M
PSRR+
FREQUENCY (Hz)
PSRR–
VSY = ±15V
Figure 22. PSRR vs. Frequency
20
0
100 1k 10k 100k 1M 10M
07642-021
FREQUENCY (Hz)
07642-024
Figure 24. CMRR vs. Frequency
120
100
80
60
40
PSRR (dB)
20
0
–20
10 100 1k 10k 100k 1M 10M 100M
7642-022
PSRR+
FREQUENCY (Hz)
PSRR–
VSY = ±5V
07642-025
Figure 25. PSRR vs. Frequency
Rev. 0 | Page 8 of 24

ADA4075-2
www.BDTIC.com/ADI
40
VSY = ±15V
A
= +1
V
35
R
= 2k
L
30
25
20
15
OVERSHOOT (%)
10
5
0
10 100 1000
CAPACITANCE (pF )
Figure 26. Small-Signal Overshoot vs. Load Capacitance
VSY = ±15V
V
= 20V p-p
IN
A
= +1
V
R
= 2k
L
C
= 100pF
L
07642-023
40
VSY = ±5V
A
= +1
V
35
R
= 2k
L
30
25
20
15
OVERSHOOT (%)
10
5
0
10 100 1000
CAPACITANCE (pF )
Figure 29. Small-Signal Overshoot vs. Load Capacitance
VSY = ±5V
V
= 7V p-p
IN
A
= +1
V
R
= 2k
L
C
= 100pF
L
07642-026
VOLTAGE (5V/DIV)
TIME (4µs/DIV)
Figure 27. Large-Signal Transient Response
VSY = ±15V
V
= 100mV p-p
IN
A
= +1
V
R
= 2k
L
C
= 100pF
L
VOLTAGE (20mV/DIV)
0V
AMPLITUDE (2V/DIV)
07642-027
TIME (4µs/DIV)
0V
07642-030
Figure 30. Large-Signal Transient Response
VSY = ±5V
V
= 100mV p-p
IN
A
= +1
V
R
= 2k
0V
VOLTAGE (20mV/DIV)
L
C
= 100pF
L
0V
TIME (10µ s/DIV)
07642-028
Figure 28. Small-Signal Transient Response
Rev. 0 | Page 9 of 24
TIME (10µs/DIV)
Figure 31. Small-Signal Transient Response
07642-031

ADA4075-2
www.BDTIC.com/ADI
4
2
0
INPUT
VSY = ±15V
4
2
0
INPUT
VSY = ±5V
INPUT
OUTPUT
OUTPUT
TIME (1µs/DIV)
TIME (1µs/DIV)
VSY = ±5V
0
–2
OUTPUT VO LTAGE (V )
–4
–6
–8
07642-032
4
2
OUTPUT VOLTAGE (V)
0
–2
–4
07642-034
OUTPUT
INPUT VOLTAGE (V)
TIME (1µs/DIV)
Figure 32. Negative Overload Recovery
4
2
0
–2
INPUT VOLTAGE (V)
INPUT
OUTPUT
TIME (1µs/DIV)
VSY = ±15V
Figure 33. Positive Overload Recovery
0
–5
–10
–15
–20
15
10
5
0
–5
–10
OUTPUT VOL TAGE (V)
07642-029
INPUT VOLTAGE (V)
Figure 35. Negative Overload Recovery
4
2
0
–2
OUTPUT VOLTAGE (V)
07642-033
INPUT VOLTAGE (V)
Figure 36. Positive Overload Recovery
VSY = ±15V
+10mV
0V
–10mV
07642-061
VOLTAGE (5V/ DIV)
ERROR BAND
INPUT
OUTPUT
TIME (2µs/DIV)
Figure 34. Positive Settling Time to 0.01%
Rev. 0 | Page 10 of 24
VOLTAGE (5V/DIV)
ERROR BAND
V
SY
INPUT
OUTPUT
TIME (2µs/ DIV)
Figure 37. Positive Settling Time to 0.01%
= ±5V
+6mV
0V
–6mV
07642-062

ADA4075-2
www.BDTIC.com/ADI
= ±5V
V
SY
= ±15V
V
SY
INPUT
VOLTAGE (5V/DIV)
ERROR BAND
TIME (2µs/ DIV)
OUTPUT
+10mV
0V
–10mV
7642-064
Figure 38. Negative Settling Time to 0.01%
10
VSY = ±15V
VOLTAGE (5V/DIV)
ERROR BAND
10
TIME (2µs/DIV)
Figure 41. Negative Settling Time to 0.01%
INPUT
OUTPUT
+6mV
0V
–6mV
07642-063
VSY = ±5V
VOLTAGE NOISE DENSITY (nV/Hz)
1
1 10 100 1k 10k 100k
FREQUENCY (Hz)
Figure 39. Voltage Noise Density
10
V
= ±15V
SY
UNCORRELATED
R
1
CURRENT NOISE DENS ITY (pA/ Hz)
0.1
1 10 100 1k 10k 100k
FREQUENCY (Hz)
R
R
= 0
S1
CORRELATED
R
= R
S1
S2
S1
S2
Figure 40. Current Noise Density
VOLTAGE NOISE DENSITY (nV/Hz)
1
1 10 100 1k 10k 100k
7642-035
FREQUENCY (Hz)
07642-038
Figure 42. Voltage Noise Density
10
V
= ±5V
SY
UNCORRELATED
R
1
CURRENT NOISE DENS ITY (pA/ Hz)
0.1
1 10 100 1k 10k 100k
07642-045
FREQUENCY (Hz)
R
R
= 0
S1
CORRELATED
R
= R
S1
S2
S1
S2
07642-046
Figure 43. Current Noise Density
Rev. 0 | Page 11 of 24

ADA4075-2
www.BDTIC.com/ADI
VSY = ±15V
INPUT NOISE VOLTAGE (10nV/DIV)
TIME (1s/ DIV)
07642-036
Figure 44. 0.1 Hz to 10 Hz Noise
8
6
4
SUPPLY CURRENT (mA)
2
+125°C
+85°C
+25°C
–40°C
INPUT NOISE VOLTAGE (10nV/DIV)
TIME (1s/ DIV)
Figure 47. 0.1 Hz to 10 Hz Noise
6
5
4
3
2
SUPPLY CURRENT (mA)
1
VSY = ±15V
VSY = ±5V
VSY = ±5V
07642-039
0
4 6 8 1012141618
SUPPLY VOLTAGE (±V)
Figure 45. Supply Current vs. Supply Voltage
0
–20
–40
–60
–80
–100
CHANNEL SEPARATIO N (dB)
–120
–140
100 1k 10k 100k
FREQUENCY (Hz)
VSY = ±15V
= 10V p-p
V
IN
= 2k
R
L
Figure 46. Channel Separation vs. Frequency
0
–40 –25 –10 5 20 35 50 65 80 95 110 125
07642-048
TEMPERATURE (° C)
07642-057
Figure 48. Supply Current vs. Temperature
0
–20
–40
–60
–80
–100
CHANNEL SEPARATIO N (dB)
–120
–140
100 1k 10k 100k
07642-041
FREQUENCY (Hz)
VSY = ±5V
= 5V p-p
V
IN
= 2k
R
L
07642-044
Figure 49. Channel Separation vs. Frequency
Rev. 0 | Page 12 of 24

ADA4075-2
www.BDTIC.com/ADI
10
1
0.1
0.01
THD + NOISE ( %)
0.001
0.0001
0.00001
0.0001 0.001 0.01 0.1 1 10
AMPLITUDE (V rms)
Figure 50. THD + Noise vs. Amplitude
1
0.1
VSY = ±15V
V
VSY = ±15V
f = 1kHz
600
2k
= 3V rms
IN
07642-058
10
VSY = ±5V
f = 1kHz
1
0.1
0.01
THD + NOISE (%)
0.001
0.0001
0.00001
0.0001 0.001 0.01 0. 1 1 10
AMPLITUDE ( V rms)
600
2k
Figure 53. THD + Noise vs. Amplitude
1
0.1
VSY = ±5V
V
= 1.5V rms
IN
07642-065
0.01
THD + NOISE (%)
0.001
0.0001
10 100k
100 1k 10k
FREQUENCY (Hz)
600
2k
Figure 51. THD + Noise vs. Frequency
10
1
0.1
0.01
THD + NOISE (%)
0.001
0.0001
0.00001
0.0001 0. 001 0. 01 0.1 1 10 100
AMPLITUDE (V rms)
600
2k
Figure 52. THD + Noise vs. Amplitude
VSY = ±18V
f = 1kHz
0.01
THD + NOISE (%)
0.001
0.0001
10 100 1k 10k 100k
07642-060
FREQUENCY (Hz)
600
2k
07642-067
Figure 54. THD + Noise vs. Frequency
1
0.1
0.01
0.001
THD + NOISE (%)
0.0001
0.00001
10 100 1k 10k 100k
07642-056
600
FREQUENCY (Hz)
2k
VSY = ±18V
V
= 8V rms
IN
07642-059
Figure 55. THD + Noise vs. Frequency
Rev. 0 | Page 13 of 24

ADA4075-2
www.BDTIC.com/ADI
2.5
2.0
1.5
1.0
0.5
OUTPUT VOLTAGE TO SUPPLY RAIL (V)
0
–40 –25 –10 5 20 35 50 65 80 95 110 125
TEMPERATURE ( °C)
VSY = ±18V
R
= 2k
L
VCC – V
OH
VOL – V
EE
07642-066
Figure 56. Output Voltage to Supply Rail vs. Temperature
10
VSY = ±18V
VCC – V
OH
1
OUTPUT VOLTAGE TO SUPPLY RAIL (V)
0.1
0.001 0.01 0.1 1 10 100
VOL – V
EE
LOAD CURRENT (mA)
Figure 57. Output Voltage to Supply Rail vs. Load Current
07642-068
Rev. 0 | Page 14 of 24

ADA4075-2
www.BDTIC.com/ADI
APPLICATIONS INFORMATION
INPUT PROTECTION
The maximum differential input voltage that can be applied to
the ADA4075-2 is determined by the internal diodes connected
across its inputs. These diodes limit the maximum differential
input voltage to ±1 V and are needed to prevent base-emitter
junction breakdown from occurring in the input stage of the
ADA4075-2 when very large differential voltages are applied. To
make sure that the ultralow voltage noise feature of the ADA4075-2
is preserved, the commonly used internal resistors in series with
the inputs were not used to limit the current in the diodes.
In small-signal applications, this is not an issue; however, in
applications where large differential voltages can be inadvertently
applied to the device, large currents may flow through these
diodes. If the differential voltage of the ADA4075-2 exceeds ±1 V,
external resistors should be used at both inputs of the op amp to
limit the input currents to less than ±10 mA (see Figure 58).
However, when series resistors are added, the total voltage noise
degrades because the resistors may have a thermal noise that is
greater than the voltage noise of the op amp itself. For example, a
1 kΩ resistor at room temperature has a thermal noise of 4 nV/√Hz,
whereas the ADA4075-2 has an ultralow voltage noise of only
2.8 nV/√Hz typical.
ADA4075-2
2
R2R13
Figure 58. Input Protection
TOTAL HARMONIC DISTORTION
The total harmonic distortion + noise (THD + N) of the
ADA4075-2 is 0.0002% typical with a load resistance of 2 kΩ.
Figure 59 shows the performance of the ADA4075-2 driving a
2 kΩ load with supply voltages of ±4 V and ±15 V. Notice that
there is more distortion for the supply voltage of ±4 V than for a
supply voltage of ±15 V. Thus, it is very important to operate the
ADA4075-2 at a supply voltage greater than ±5 V for optimum
distortion. The THD + noise graphs for supply voltages of ±5 V
and ±18 V are available in Figure 54 and Figure 55.
1
07642-050
1
0.1
0.01
THD + NOISE (%)
0.001
0.0001
10 100 1k 10k 100k
Figure 59. THD + Noise vs. Frequency
VSY = ±4V
R
= 2k
L
V
= 1.5V rms
IN
FREQUENCY (Hz)
V
SY
R
= 2k
L
V
= 3V rms
IN
= ±15V
07642-069
PHASE REVERSAL
Phase reversal occurs in some amplifiers when the input
common-mode voltage range is exceeded. When the voltage
driving the input to these amplifiers exceeds the maximum
input common-mode voltage range, the output of the amplifiers
changes polarity. Phase reversal can cause permanent damage to
the amplifier as well as system lockups in feedback loops.
The ADA4075-2 amplifiers have been carefully designed to prevent
output phase reversal when both inputs are maintained within
the specified input voltage range. If one or both inputs exceed
the input voltage range but remain within the supply rails, the
output is capped at the maximum output that it can swing to.
For a supply voltage of ±15 V and a load resistance of 2 kΩ, the
output is capped at 13 V typical when the input voltage exceeds
the input voltage range but stays within the supply rails. Figure 60
shows the output voltage of the AD4075-2 configured as a unitygain buffer with a supply voltage of ±15 V.
V
IN
V
OUT
VOLTAGE (5V/DIV)
VSY = ±15V
Rev. 0 | Page 15 of 24
TIME (40µs/DIV)
Figure 60. No Phase Reversal
07642-053

ADA4075-2
www.BDTIC.com/ADI
DAC OUTPUT FILTER
The ultralow voltage noise, low distortion, and high slew rate of
the ADA4075-2 make it an ideal choice for professional audio
signal processing. Figure 61 shows the ADA4075-2 used in a
typical audio DAC output filter configuration. The differential
outputs of the DAC are fed into the ADA4075-2. The ADA4075-2
is configured as a differential Sallen-key filter. It operates as an
external low-pass filter to remove high frequency noise present
DAC OUTN
DAC OUTP
11k
5.62k 1.5k
5.62k
Figure 61. Typical DAC Output Filter Circuit (Differential)
3.01k
on the output pins of the DAC. It also provides differential-tosingle-ended conversion from the differential outputs of the DAC.
For a DAC output filter, an op amp with reasonable slew rate
and bandwidth is required. The slew rate of the ADA4075-2 is
at a high 12 V/µs, and the bandwidth is 6.5 MHz. The cutoff
frequency of the low-pass filter is approximately 167 kHz. In
addition, the 100 kΩ and 47 µF RC network perform ac coupling
to block out the dc components at the output.
11k
68pF
1/2
ADA4075-2
150pF270pF560pF
100
47µF
2.2nF
+
100k
OUTPUT
07642-054
Rev. 0 | Page 16 of 24

ADA4075-2
www.BDTIC.com/ADI
BALANCED LINE DRIVER
The circuit of Figure 62 shows a balanced line driver designed
for audio use. Such drivers are intended to mimic an output
transformer in operation, whereby the common-mode voltage
can be impressed by the load. Furthermore, either output can be
shorted to ground in single-ended applications without affecting
the overall operation.
Circuits of this type use positive and negative feedback to obtain a
high common-mode output impedance, and they are somewhat
notorious for component sensitivity and susceptibility to latch-up.
This circuit uses several techniques to avoid spurious behavior.
First, the 4-op-amp arrangement ensures that the input impedance
is load independent (the input impedance can become negative
with some configurations). Note that the output op amps are
packaged with the input op amps to maximize drive capability.
Second, the positive feedback is ac-coupled by C2 and C3, which
eliminates the need for offset trim. Because the circuit is ac-coupled
at the input, these capacitors do not have significant dc voltage
across them, thus tantalum types of capacitors can be used.
IN
C1
10µF
10k
R1
A1
1/2
ADA4075-2
R2
4.7k
C4
50pF
R3
4.7k
A3
1/2
ADA4075-2
NOTES
1. ALL RESISTORS S HOULD HAVE 1% TOLERANCE.
2. A1/A2 IN SAME PACKAGE; A3/A4 I N SAME PACKAGE.
R4
4.7k
R6
4.7k
R10
4.7k
R15
4.7k
Figure 62. Balanced Line Driver
Finally, even with these precautions, it is vital that the positive
feedback be accurately controlled. This is partly achieved by
using 1% resistors. In addition, the following setup procedure
ensures that the positive feedback does not become excessive:
1. Set R11 to its mid position (or short the ends together,
whichever is easier), and temporarily short the negative
output to ground.
2. Apply a 10 V p-p sine wave at approximately 1 kHz to the
input, and adjust R7 to provide 930 mV p-p at the point
marked “test.”
3. Remove the short from the negative output (and across
R11, if used), and adjust R11 until the output waveforms
are symmetric.
The overall gain of the driver is equal to 2, which provides an
extra 6 dB of headroom in balanced differential mode. The
output noise is about −109 dBV in a 20 kHz bandwidth.
C5
50pF
R5
4.7k
ADA4075-2
R7
250
FEEDBACK
TRIM
SYMMETRY
TRIM
R11
250
50pF
ADA4075-2
A2
1/2
100R94.7k
R12
4.7k
C6
A4
1/2
R16
100
R8
TEST
100
R14
100
R13
R17
4.7k
C2
10µF
C3
10µF
OUT+
OUT–
07642-073
Rev. 0 | Page 17 of 24

ADA4075-2
www.BDTIC.com/ADI
BALANCED LINE RECEIVER
Figure 63 depicts a unity-gain balanced line receiver capable of
a high degree of hum rejection. The CMRR is approximately
given by
R1R4
⎞
⎛
log20
10
Therefore, R1 to R4 should be close-tolerance components to
obtain the best possible CMRR without adjustment. The presence
of A2 ensures that the impedances are symmetric at the two inputs
(unlike many other designs), and, as a bonus, A2 also provides a
⎜
R2R3
⎝
⎟
⎠
C2
50pF
R3
10k
R2
5k
R8
5.6k
A3*
R9
11k
R1
5k
ADA4075-2
R10
11k
IN–
IN+
R7
5.6k
C1
22µF
(NON-POLAR)
*A3 REDUCES THE DEGRAD ATI ON OF CMRR
(SEE THE BALANCED LINE RECEIV ER SECTIO N FOR MORE DETAILS).
Figure 63. Balanced Line Receiver
A1
1/2
complementary output. A3 raises the common-mode input
impedance from about 7.5 k to about 70 k, reducing the
degradation of CMRR due to mismatches in source impedance.
It should be noted that A3 is not in the signal path, and almost any
op amp will work well here. Although it may seem as though the
inverting output should be noisier than the noninverting one,
they are in fact symmetric at about −111 dBV (20 kHz bandwidth).
Sometimes an overall gain of ½ is desired to provide an extra
6 dB of differential input headroom. This can be attained by
reducing R3 and R4 to 5 k and increasing R9 to 22 k.
OUT+
OUT–
07642-071
R5
5k
R4
10k
C3
50pF
R6
5k
A2
1/2
ADA4075-2
Rev. 0 | Page 18 of 24
ADA4075-2
www.BDTIC.com/ADI
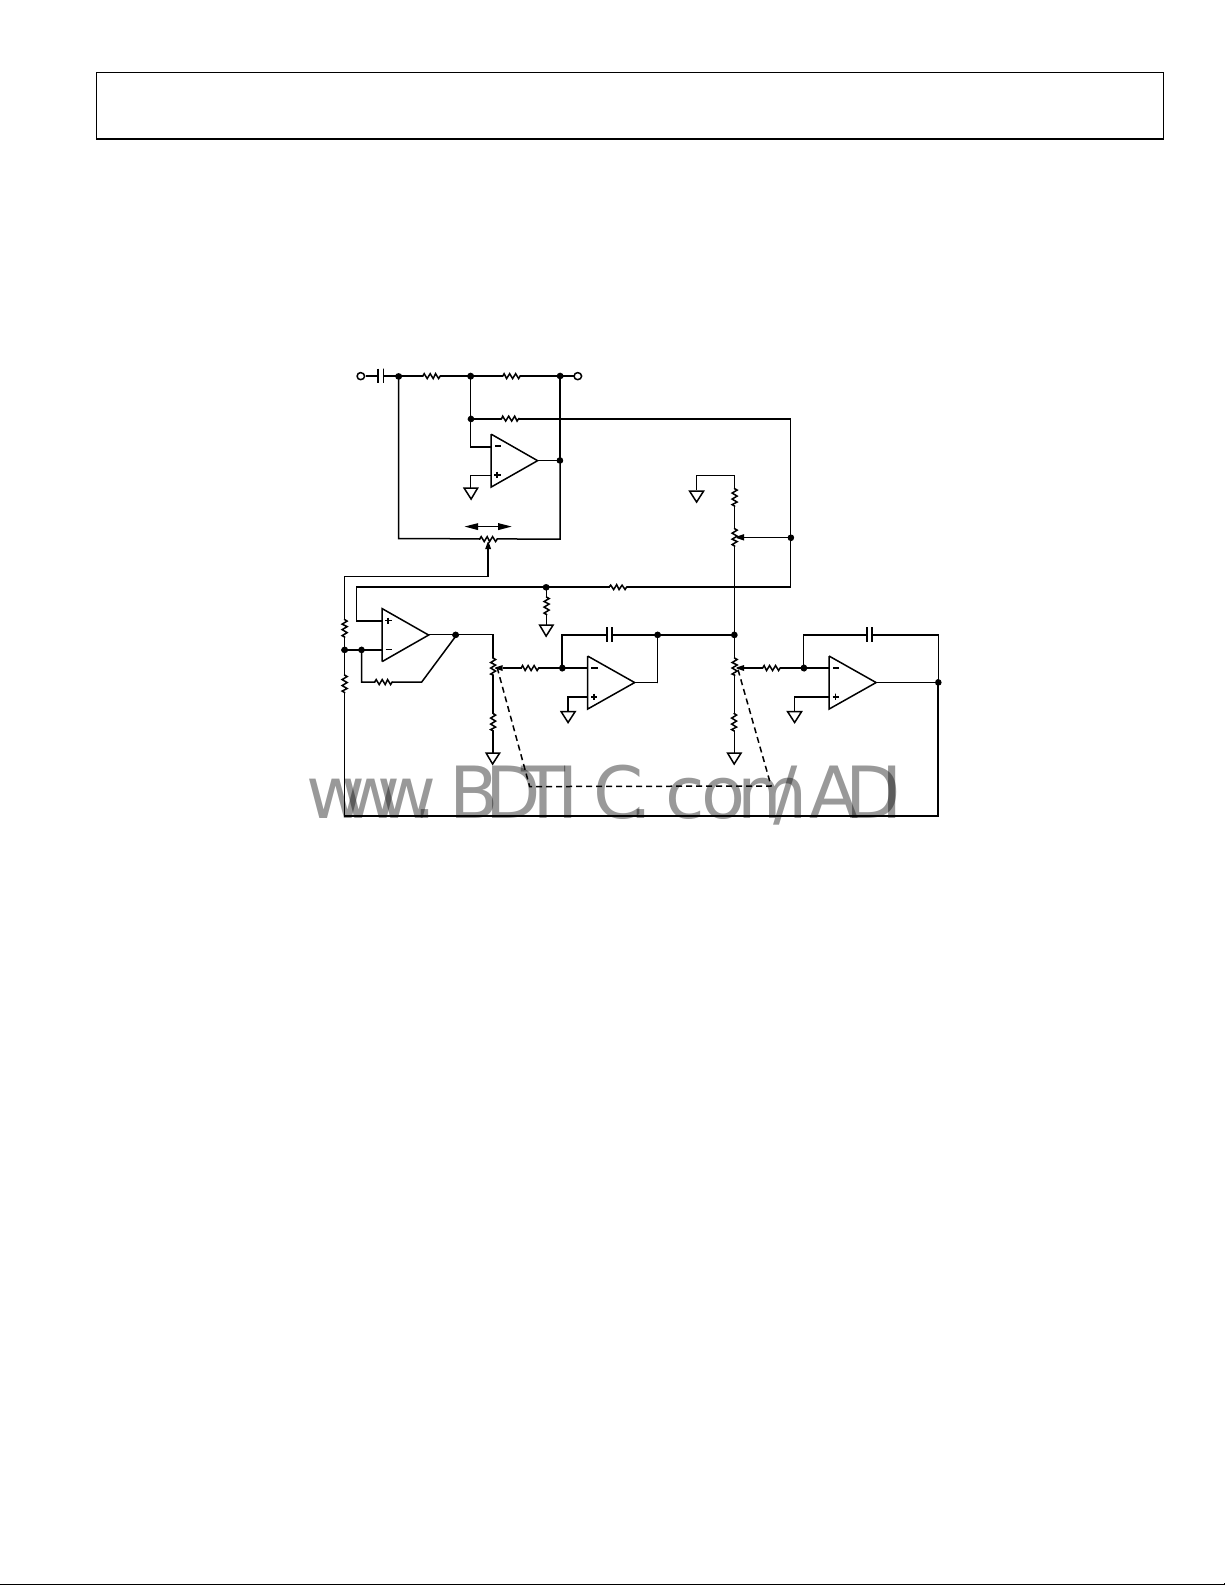
LOW NOISE PARAMETRIC EQUALIZER
The circuit of Figure 64 is a reciprocal parametric equalizer
yielding ±20 dB of cut or boost with variable bandwidth and
frequency. The frequency control range is 6.9:1, with the geometric
mean center frequency conveniently occurring at the midpoint
of the potentiometer setting. The center frequency is equal to
47µF
IN OUT
6.2k6.2k
620
48 Hz/Ct, where Ct is the value of C1 and C2 in microfarads.
The bandwidth control adjusts the Q from 0.9 to about 11. The
overall noise is setting dependent, but with all controls centered
it is about −104 dBV in a 20 kHz bandwidth. Such a low noise
level can obviate the need for a bypass switch in many applications.
2.5k
620
1/2
5k
1.5k
1.3k
FREQUENCY (G ANGED POTENTIOMET ER)
BANDWIDTH
2.7k
C1*
2.5k
1/2
620
100
1k
1.3k
1/2
C2*
ADA4075-2ADA4075-2
07642-074
ADA4075-2
BOOST CUT
1.5k
2.5k
*THE CENTER FRE QUENCY IS AFFECT ED BY THE VALUE OF C1 AND C2
(SEE THE L OW NOIS E PARAMETRI C EQUALIZ ER SECTIO N FOR MORE DETAILS).
ADA4075-2
1/2
2.5k
Figure 64. Low Noise Parametric Equalizer
Rev. 0 | Page 19 of 24

ADA4075-2
V
www.BDTIC.com/ADI
SCHEMATIC
+
OUTA/
–INA/
–INB
Figure 65. Simplified Schematic
+INA/
+INB
OUTB
V–
07642-072
Rev. 0 | Page 20 of 24

ADA4075-2
www.BDTIC.com/ADI
OUTLINE DIMENSIONS
5.00 (0.1968)
4.80 (0.1890)
4.00 (0.1574)
3.80 (0.1497)
0.25 (0.0098)
0.10 (0.0040)
COPLANARI TY
0.10
CONTROL LING DIMENSI ONS ARE IN MILL IMET ERS; INCH DI MENSIO NS
(IN PARENTHESES ) ARE ROUNDED- OFF MI LLI METER EQ UIVALENTS FOR
REFERENCE ONLY AND ARE NOT APPROPRI ATE FOR USE I N DESIG N.
85
1
1.27 (0.0500)
SEATING
PLANE
COMPLI ANT TO JEDE C STANDARDS MS-012-A A
BSC
6.20 (0.2441)
5.80 (0.2284)
4
1.75 (0.0688)
1.35 (0.0532)
0.51 (0.0201)
0.31 (0.0122)
8°
0°
0.25 (0.0098)
0.17 (0.0067)
0.50 (0.0196)
0.25 (0.0099)
1.27 (0.0500)
0.40 (0.0157)
45°
012407-A
Figure 66. 8-Lead Standard Small Outline Package [SOIC_N]
Narrow Body
(R-8)
Dimensions shown in millimeters and (inches)
ORDERING GUIDE
Model Temperature Range Package Description Package Option
ADA4075-2ARZ
ADA4075-2ARZ-R7
ADA4075-2ARZ-RL
1
Z = RoHS Compliant Part.
1
−40°C to +125°C 8-Lead SOIC_N R-8
1
−40°C to +125°C 8-Lead SOIC_N R-8
1
−40°C to +125°C 8-Lead SOIC_N R-8
Rev. 0 | Page 21 of 24

ADA4075-2
www.BDTIC.com/ADI
NOTES
Rev. 0 | Page 22 of 24

ADA4075-2
www.BDTIC.com/ADI
NOTES
Rev. 0 | Page 23 of 24

ADA4075-2
www.BDTIC.com/ADI
NOTES
©2008 Analog Devices, Inc. All rights reserved. Trademarks and
registered trademarks are the property of their respective owners.
D07642-0-10/08(0)
Rev. 0 | Page 24 of 24
 Loading...