


Video Op Amp
AD829
Rev. I
rights of third parties that may result from its use. Specifications subject to change without notice. No
Trademarks and registered trademarks are the prop erty of their respective owner s.
Fax: 781.461.3113 ©2011 Analog Devices, Inc. All rights reserved.
AD829
TOP VIEW
(Not to Scale)
OFFSET NULL
1
–IN
2
+IN
3
–V
S
4
OFFSET NULL
+V
S
OUTPUT
C
COMP
8
7
6
5
00880-001
00880-002
20 19123
18
14
15
16
17
4
5
6
7
8
9 10 11 12 13
NC
+V
NC
OUTPUT
NC
NC = NO CONNECT
NC
NC
NC
–V
NC
C
COMP
NC
OFFSET
NULL
OFFSET
NULL
NC
–IN
NC
+IN
NC
NC
AD829
TOP VIEW
(Not to Scale)
Data Sheet
FEATURES
High speed
120 MHz bandwidth, gain = −1
230 V/µs slew rate
90 ns settling time to 0.1%
Ideal for video applications
0.02% differential gain
0.04° differential phase
Low noise
1.7 nV/√Hz input voltage noise
1.5 pA/√Hz input current noise
Excellent dc precision
1 mV maximum input offset voltage (over temperature)
0.3 µV/°C input offset drift
Flexible operation
Specified for ±5 V to ±15 V operation
±3 V output swing into a 150 Ω load
External compensation for gains 1 to 20
5 mA supply current
Available in tape and reel in accordance with EIA-481A standard
GENERAL DESCRIPTION
The"% is a low noise (1.7 nV/√Hz), high speed op amp with
custom compensation that provides the user with gains of 1 to 20
while maintaining a bandwidth >50 MHz. Its 0.04° differential
phase and 0.02% differential gain performance at 3.58 MHz and
4.43 MHz, driving reverse-terminated 50 Ω or 75 Ω cables, makes
it ideally suited for professional video applications. The AD829
achieves its 230 V/µs uncompensated slew rate and 750 MHz
gain bandwidth while requiring only 5 mA of current from
power supplies.
The external compensation pin of the AD829 gives it
exceptional versatility. For example, compensation can be
selected to optimize the bandwidth for a given load and power
supply voltage. As a gain-of-2 line driver, the −3 dB bandwidth
can be increased to 95 MHz at the expense of 1 dB of peaking.
Its output can also be clamped at its external compensation pin.
The AD829 exhibits excellent dc performance. It offers a minimum
open-loop gain of 30 V/mV into loads as low as 500 Ω, a low input
voltage noise of 1.7 nV/√Hz, and a low input offset voltage of 1 mV
maximum. Common-mode rejection and power supply rejection
ratios are both 120 dB.
This op amp is also useful in multichannel, high speed data
conversion where its fast (90 ns to 0.1%) settling time is important.
In such applications, the AD829 serves as an input buffer for 8-bit to
10-bit ADCs and as an output I/V converter for high speed DACs.
Information furnished by Analog Devices is believed to be accurate and reliable. However, no
responsibility is assumed by Analog Devices for its use, nor for any infringements of patents or other
license is granted by implication or otherwise under any patent or patent rights of Analog Devices.
Operating as a traditional voltage feedback amplifier, the AD829
provides many of the advantages that a transimpedance amplifier
offer. A bandwidth >50 MHz can be maintained for a range of
gains through the replacement of the external compensation
capacitor. The AD829 and the transimpedance amplifier are both
unity-gain stable and provide similar voltage noise performance
(1.7 nV/√Hz); however, the current noise of the AD829
(1.5 pA/√Hz) is less than 10% of the noise of transimpedance
amplifiers. The inputs of the AD829 are symmetrical.
PRODUCT HIGHLIGHTS
1. The input voltage noise of 2 nV/√Hz, current noise of
1.5 pA/√Hz, and 50 MHz bandwidth for gains of 1 to 20
make the AD829 an ideal preamp.
2. A differential phase error of 0.04 and a 0.02% differential
gain error, at the 3.58 MHz NTSC, 4.43 MHz PAL, and
SECAM color subcarrier frequencies, make the op amp an
outstanding video performer for driving reverse-terminated
50 Ω and 75 Ω cables to ±1 V (at their terminated end).
3. The AD829 can drive heavy capacitive loads.
4. Performance is fully specified for operation from ±5 V
to ±15 V supplies.
5. Th
packages. Chips and MIL-STD-883B parts are also available.
The 8-lead SOIC is available for the extended temperature
range (−40°C to +125°C).
One Technology Way, P.O. Box 9106, Norwood, MA 02062-9106, U.S.A.
Tel: 781.329.4700 www.analog.com
High Speed, Low Noise
CONNECTION DIAGRAM
Figure 1. 8-Lead PDIP (N), CERDIP (Q), and SOIC (R)
Figure 2. 20-Terminal LCC
9 is available in PDIP, CERDIP, and small outline
e AD82

AD829 Data Sheet
TABLE OF CONTENTS
Features .............................................................................................. 1
General Description ......................................................................... 1
Connection Diagram ....................................................................... 1
Product Highlights ........................................................................... 1
Revision History ............................................................................... 2
Specifications ..................................................................................... 3
Absolute Maximum Ratings ............................................................ 5
Thermal Characteristics .............................................................. 5
Metallization Photo ...................................................................... 5
ESD Caution .................................................................................. 5
Typical Performance Characteristics ............................................. 6
REVISION HISTORY
10/11—Rev. H to R e v. I
Change to Tab le 2 ............................................................................. 5
4/09—Re
Changes to Features .......................................................................... 1
Changes to Quiescent Current Parameter, Table 1 ...................... 4
Changes to Ta ble 2 ............................................................................ 5
Added Thermal Characteristics Section and Table 3 .................. 5
Updated Outline Dimensions ....................................................... 17
Changes to Ordering Guide .......................................................... 19
4/04—R
Added Figure 1; Renumbered Sequentially .................................. 4
Changes to Ordering Guide ............................................................ 5
Updated Table I ............................................................................... 11
Updated Figure 15 .......................................................................... 12
Updated Figure 16 .......................................................................... 13
Updated Outline Dimensions ....................................................... 14
v. G to Rev. H
ev. F to R e v. G
Test Circuits ..................................................................................... 11
Theory of Operation ...................................................................... 12
Externally Compensating the AD829 ...................................... 12
Shunt Compensation ................................................................. 12
Current Feedback Compensation ............................................ 13
Low Error Video Line Driver ................................................... 15
High Gain Video Bandwidth, 3-Op-Amp Instrumentation
Amplifier ..................................................................................... 16
Outline Dimensions ....................................................................... 17
Ordering Guide .......................................................................... 19
2/03—Re
Renumbered Figures ......................................................... Universal
Changes to Product Highlights ....................................................... 1
Changes to Specifications ................................................................. 2
Changes to Absolute Maximum Ratings ........................................ 4
Changes to Ordering Guide ............................................................. 4
Updated Outline Dimensions ....................................................... 13
v. E to Re v. F
Rev. I | Page 2 of 20
Data Sheet AD829
VO = 20 V p-p,
±15 V
3.6
3.6
3.6 MHz
COMMON-MODE REJECTION
VCM = ±2.5 V
±5 V
100
120 100
120 100
120 dB
POWER SUPPLY REJECTION
98
120 98
120 98
120 dB
SPECIFICATIONS
TA = 25°C and VS = ±15 V dc, unless otherwise noted.
Table 1.
AD829JR AD829AR AD829AQ/AD829S
Parameter Conditions VS Min Typ Max Min Typ Max Min Typ Max Unit
INPUT OFFSET VOLTAGE t
Offset Voltage Drift
INPUT BIAS CURRENT
t
INPUT OFFSET CURRENT
t
Offset Current Drift
OPEN-LOOP GAIN
RL = 150 Ω 40 40 40 V/mV
t
RL = 500 Ω 85 85 85 V/mV
t
DYNAMIC PERFORMANCE
Gain Bandwidth Product ±5 V 600 600 600 MHz
±15 V 750 750 750 MHz
Full Power Bandwidth
1, 2
to t
MIN
to t
MIN
to t
MIN
= ±2.5 V,
V
O
= 500 Ω
R
L
to t
MIN
= ±10 V,
V
O
= 1 kΩ
R
L
to t
MIN
= 2 V p-p,
V
O
= 500 Ω
R
L
MAX
±5 V,
0.2 1
0.2 1
0.1 0.5 mV
±15 V
±5 V,
1
0.3 0.3 0.3 µV/°C
1
0.5 mV
±15 V
±5 V,
3.3 7 3.3 7 3.3 7 µA
±15 V
8.2 9.5 9.5 µA
MAX
±5 V,
50 500 50 500 50 500 nA
±15 V
500 500 500 nA
MAX
± 5 V,
0.5 0.5 0.5 nA/°C
±15 V
±5 V 30 65 30 65 30 65 V/mV
20 20 20 V/mV
MAX
±15 V 50 100 50 100 50 100 V/mV
20 20 20 V/mV
MAX
±5 V 25 25 25 MHz
RL = 1 kΩ
Slew Rate2 RL = 500 Ω ±5 V 150 150 150 V/µs
RL = 1 kΩ ±15 V 230 230 230 V/µs
Settling Time to 0.1% AV = –19
−2.5 V to
±5 V 65 65 65 ns
+2.5 V
10 V step ±15 V 90 90 90 ns
Phase Margin2 CL = 10 pF ±15 V
RL = 1 kΩ 60 60 60 Degrees
DIFFERENTIAL GAIN ERROR3
DIFFERENTIAL PHASE ERROR3
= 100 Ω,
R
L
= 30 pF
C
COMP
= 100 Ω,
R
L
= 30 pF
C
COMP
±15 V 0.02 0.02 0.02 %
±15 V 0.04 0.04 0.04 Degrees
VCM = ±12 V ±15 V 100 120 100 120 100 120 dB
t
MIN
to t
96 96 96 dB
MAX
VS = ±4.5 V
to ±18 V
t
MIN
to t
94 94 94 dB
MAX
INPUT VOLTAGE NOISE f = 1 kHz ±15 V 1.7 2 1.7 2 1.7 2 nV/√Hz
INPUT CURRENT NOISE f = 1 kHz ±15 V 1.5 1.5 1.5 pA/√Hz
Rev. I | Page 3 of 20

AD829 Data Sheet
±15 V
5.3
6.8 5.3
6.8 5.3
6.8
mA
AD829JR AD829AR AD829AQ/AD829S
Parameter Conditions VS Min Typ Max Min Typ Max Min Typ Max Unit
INPUT COMMON-MODE
VOLTAGE RANGE
−3.8 −3.8 −3.8 V
±15 V +14.3 +14.3 +14.3 V
−13.8 −13.8 −13.8 V
OUTPUT VOLTAGE SWING RL = 500 Ω ±5 V ±3.0 ±3.6 ±3.0 ±3.6 ±3.0 ±3.6 V
RL = 150 Ω ±5 V ±2.5 ±3.0 ±2.5 ±3.0 ±2.5 ±3.0 V
RL = 50 Ω ±5 V ±1.4 ±1.4 ±1.4 V
RL = 1 kΩ ±15 V ±12 ±13.3 ±12 ±13.3 ±12 ±13.3 V
RL = 500 Ω ±15 V ±10 ±12.2 ±10 ±12.2 ±10 ±12.2 V
Short-Circuit Current
INPUT CHARACTERISTICS
Input Resistance
(Differential)
Input Capacitance
(Differential)
4
Input Capacitance
(Common Mode)
CLOSED-LOOP OUTPUT
RESISTANCE
POWER SUPPLY
Operating Range ±4.5 ±18 ±4.5 ±18 ±4.5 ±18 V
Quiescent Current ±5 V 5 6.5 5 6.5 5 6.5 mA
t
±5 V +4.3 +4.3 +4.3 V
±5 V,
32 32 32 mA
±15 V
13 13 13 kΩ
5 5 5 pF
1.5 1.5 1.5 pF
AV = +1,
2 2 2 mΩ
f = 1 kHz
to t
MIN
8.0 8.0 8.7 mA
MAX
t
TRANSISTOR COUNT
to t
MIN
MAX
Number of
8.3 9.0 9.0 mA
46 46 46
transistors
1
Full power bandwidth = slew rate/2 π V
2
Tested at gain = 20, C
3
3.58 MHz (NTSC) and 4.43 MHz (PAL and SECAM).
4
Differential input capacitance consists of 1.5 pF package capacitance plus 3.5 pF from the input differential pair.
COMP
= 0 pF.
PEAK
.
Rev. I | Page 4 of 20
Data Sheet AD829
Internal Power Dissipation1
Output Short-Circuit Duration
Indefinite
AD829A
−40°C to +125°C
8-Lead PDIP (N)
100 (derates at 8.7 mW/°C)
°C/W
–IN
OFFSET NULL
OFFSET NULL
+IN
00880-004
AMBIENT TEMPERATURE (°C)
MAXIMUM POWER DISSIPATION (W)
–55 –45 –35 –25 –15 –5 5 15 25 35 45 55 65 75 85 95 105 115
0
0.5
1.0
1.5
2.0
2.5
125
CERDIP
SOIC
PDIP
LCC
ABSOLUTE MAXIMUM RATINGS
Table 2.
Parameter Rating
Supply Voltage ±18 V
8-Lead PDIP (N) 1.3 W
8-Lead SOIC (R) 0.9 W
8-Lead CERDIP (Q) 1.3 W
20-Terminal LCC (E) 0.8 W
Differential Input Voltage2 ±6 V
Storage Temperature Range
8-Lead CERDIP (Q) and 20-Terminal LCC (E) −65°C to +150°C
8-Lead PDIP (N) and 8-Lead SOIC (R) −65°C to +125°C
Operating Temperature Range
AD829J 0°C to 70°C
AD829S −55°C to +125°C
Lead Temperature (Soldering, 60 sec) 300°C
1
Maximum internal power dissipation is specified so that TJ does not exceed
150°C at an ambient temperature of 25°C.
2
If the differential voltage exceeds 6 V, external series protection resistors
should be added to limit the input current.
Stresses above those listed under Absolute Maximum Ratings
may cause permanent damage to the device. This is a stress
rating only; functional operation of the device at these or any
other conditions above those indicated in the operational
section of this specification is not implied. Exposure to absolute
maximum rating conditions for extended periods may affect
device reliability.
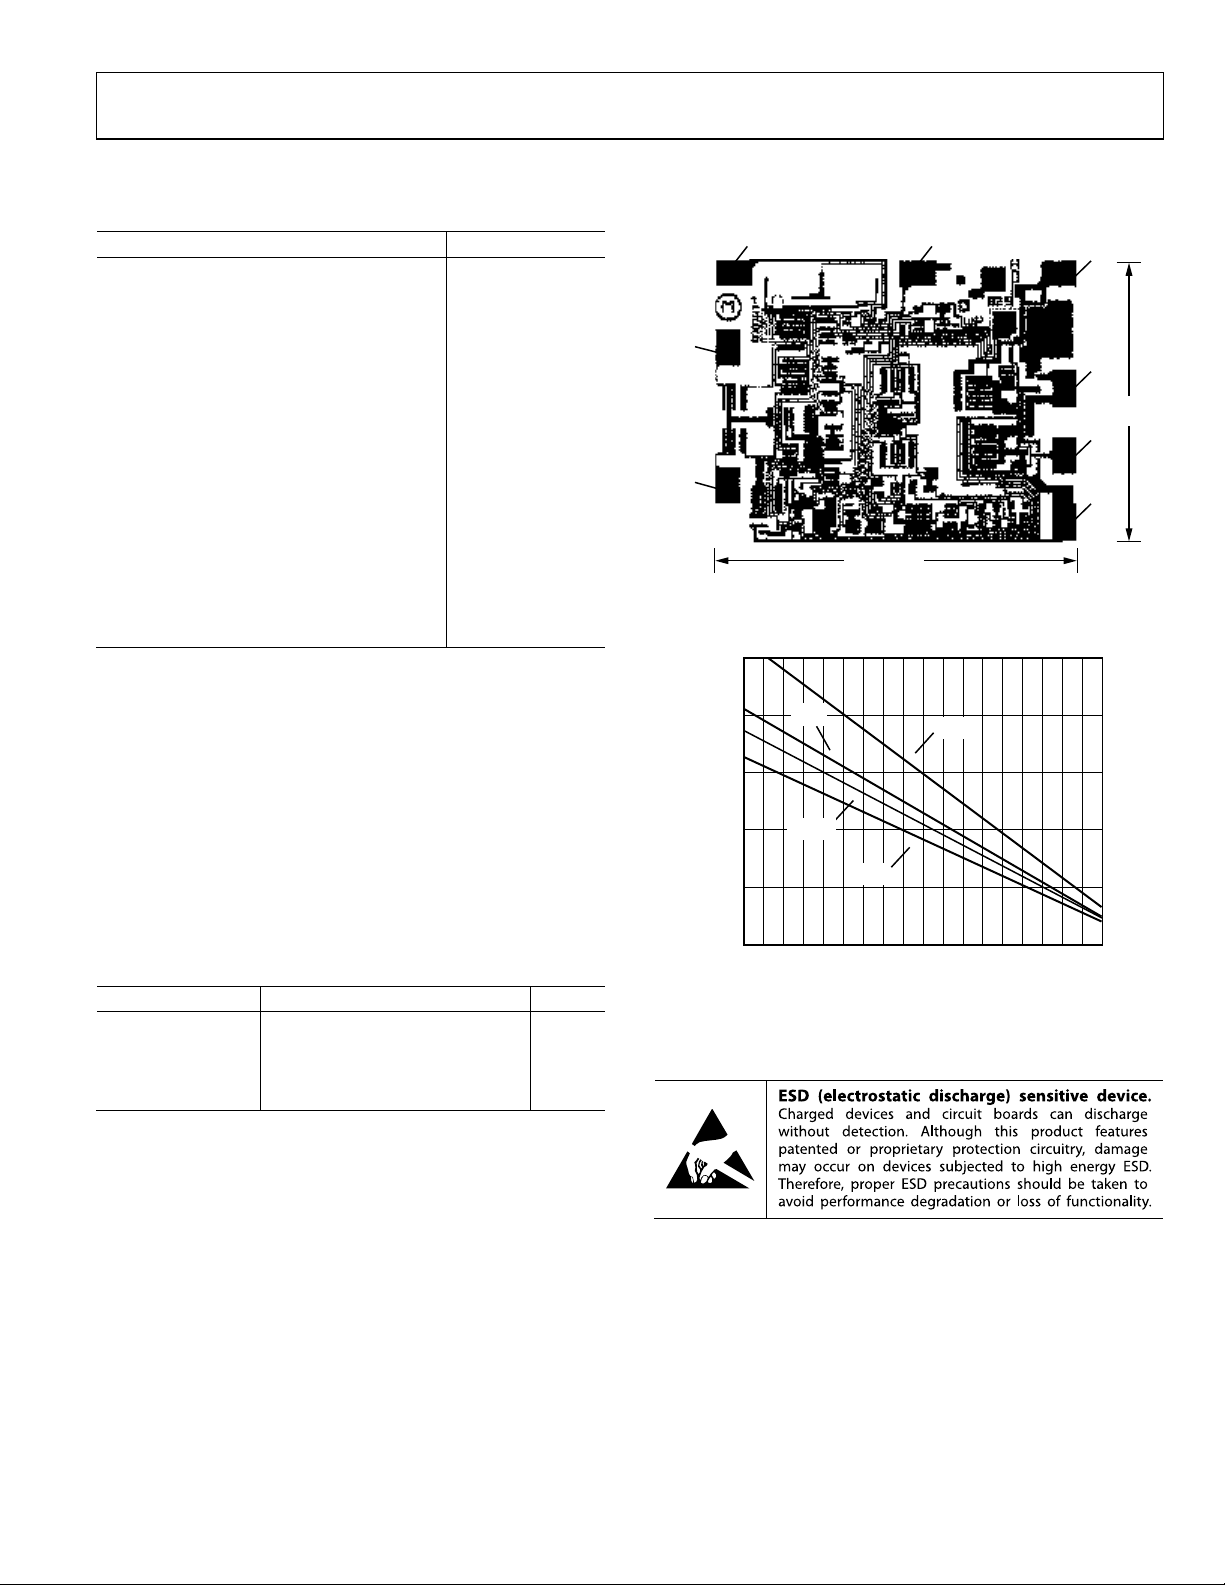
METALLIZATION PHOTO
1
2
3
0.067 (1.70)
SUBSTRATE CONNECTED TO + V
Figure 3. Metallization Photo; Contact Factory for Latest Dimensions,
Dimensions Shown in Inches and (Millimeters)
8
S
+V
S
7
OUTPUT
6
C
COMP
5
–V
S
4
0.054
(1.37)
00880-003
THERMAL CHARACTERISTICS
Table 3.
Package Type θJA Unit
8-Lead CERDIP (Q) 110 (derates at 8.7 mW/°C) °C/W
20-Lead LCC (E) 77 °C/W
8-Lead SOIC (R) 125 (derates at 6 mW/°C) °C/W
Figure 4. Maximum Power Dissipation vs. Temperature
ESD CAUTION
Rev. I | Page 5 of 20

AD829 Data Sheet
00880-005
SUPPLY VOLTAGE (±V)
INPUT COMMON-MODE RANGE (V)
0 5 10 15
0
5
10
15
20
20
+V
OUT
–V
OUT
00880-006
SUPPLY VOLTAGE (±V)
MAGNITUDE OF THE OUTPUT VOLTAGE (V)
0 5 10 15
0
5
10
15
20
20
+V
OUT
–V
OUT
RL = 1kΩ
00880-007
LOAD RESISTANCE (Ω)
OUTPUT VOLTAGE SWING (V p-p)
10 100 1k
0
5
10
25
20
15
30
10k
±15V
SUPPLIES
±5V
SUPPLIES
00880-008
SUPPLY VOLTAGE (±V)
QUIESCENT CURRENT (mA)
0 5 10 15
4.0
4.5
5.0
5.5
6.0
20
00880-009
TEMPERATURE (°C)
INPUT BIAS CURRENT (µA)
–60 –40 –20 0 20 40 60 80 100 120
–2
–3
–4
–5
140
V
S
= ±5V, ±15V
00880-010
FREQUENCY (Hz)
CLOSED-LOOP OUTPUT IMPEDANCE (Ω)
1k 10k 100k 1M 10M
0.001
0.01
0.1
1
10
100
100M
AV = 20
C
COMP
= 0pF
A
V
= 1
C
COMP
= 68pF
TYPICAL PERFORMANCE CHARACTERISTICS
Figure 5. Input Common-Mode Range vs. Supply Voltage
Figure 6. Output Voltage Swing vs. Supply Voltage
Figure 8. Quiescent Current vs. Supply Voltage
Figure 9. Input Bias Current vs. Temperature
Figure 7. Output Voltage Swing vs. Resistive Load
Figure 10. Closed-Loop Output Impedance vs. Frequency
Rev. I | Page 6 of 20

Data Sheet AD829
00880-011
TEMPERATURE (°C)
QUIESCENT CURRENT (mA)
–60 –40 –20 0 20 40 60 80 100 120
3
7
6
5
4
140
VS = ±15V
V
S
= ±5V
00880-012
AMBIENT T E M P E RATURE (°C)
SHORT-CI RCUIT CURRENT LIMIT (mA)
–60 –40 –20 0 20 40 60 80 100 120
15
40
30
35
25
20
140
NEGATIVE
CURRENT LIM IT
POSITIVE
CURRENT LIM IT
V
S
= ±5V
00880-013
TEMPERATURE (°C)
–3dB BANDWIDT H ( M Hz )
–60 –40 –20 0 20 40 60 80 100 120
45
65
60
55
50
140
VS = ±15V
A
V
= +20
C
COMP
= 0pF
00880-014
FREQUENCY (Hz)
OPEN-LOOP GAIN (dB)
PHASE (Degrees)
100 1k 10k 100k 1M 10M
0
120
100
80
60
40
20
–20
100
80
60
40
20
0
100M
PHASE
GAIN
±5V
SUPPLIES
500Ω LOAD
GAIN
±15V
SUPPLIES
1kΩ LOAD
C
COMP
= 0pF
00880-015
LOAD RESISTANCE (Ω)
OPEN-LOOP GAIN (dB)
10 100 1k
75
80
85
90
95
100
105
10k
V
S
= ±15V
V
S
= ±5V
00880-016
FREQUENCY (Hz)
PSRR (dB)
1k 10k 100k 1M 10M
20
120
100
60
80
40
100M
+SUPPLY
–SUPPLY
C
COMP
= 0pF
Figure 11. Quiescent Current vs. Temperature
Figure 12. Short-Circuit Current Limit vs. Ambient Temperature
Figure 14. Open-Loop Gain and Phase vs. Frequency
Figure 15. Open-Loop Gain vs. Resistive Load
Figure 13. –3 dB Bandwidth vs. Temperature
Figure 16. Power Supply Rejection Ratio (PSRR) vs. Frequency
Rev. I | Page 7 of 20

AD829 Data Sheet
00880-017
FREQUENCY (Hz)
CMRR (dB)
1k 10k 100k 1M 10M
20
120
100
60
80
40
100M
C
COMP
= 0pF
00880-018
INPUT FRE QUENCY (MHz)
OUTPUT VOLTAGE (V p-p)
1 10
0
5
10
15
20
25
30
100
VS = ±15V
R
L
= 1kΩ
A
V
= +20
C
COMP
= 0pF
V
S
= ±5V
R
L
= 500Ω
A
V
= +20
C
COMP
= 0pF
00880-019
SETTLING TIME (ns)
OUTPUT SWING FROM 0 TO ±V
0 20 40 60 80 100 120 140
–10
–8
–6
–4
–2
0
2
4
6
8
10
160
1%1%0.1%
0.1%
ERROR
A
V
= –19
C
COMP
= 0pF
00880-020
FREQUENCY ( Hz )
THD (dB)
100 300 1k 3k 10k 30k
–110
–105
–100
–95
–90
–85
–80
–75
–70
100k
V
IN
= 3V RMS
A
V
= –1
C
COMP
= 30pF
C
L
= 100pF
R
L
= 500Ω
R
L
= 2kΩ
00880-021
FREQUENCY ( Hz )
THD (dB)
0 500k 1.0M 1.5M
–70
–20
–30
–40
–50
–60
2.0M
THIRD HARMONIC
SECOND HARMONIC
VIN = 2.25V RMS
A
V
= –1
R
L
= 250Ω
C
L
= 0pF
C
COMP
= 30pF
00880-022
FREQUENCY ( Hz )
INPUT VOLTAGE NOISE (nV/ Hz)
10 100 1k 10k 100k 1M
0
5
4
3
2
1
10M
Figure 17. Common-Mode Rejection Ratio (CMRR) vs. Frequency
Figure 18. Large Signal Frequency Response
Figure 20. Total Harmonic Distortion (THD) vs. Frequency
Figure 21. Second and Third THD vs. Frequency
Figure 19. Output Swing and Error vs. Settling Time
Figure 22. Input Voltage Noise Spectral Density
Rev. I | Page 8 of 20

Data Sheet AD829
00880-023
–60 –40 –20 0 20 40 60 80 100 120
100
400
350
300
250
200
150
140
RISE
FALL
RISE
FALL
V
S
= ±15V
V
S
= ±5V
A
V
= +20
SLEW RATE 10% TO
90%
SLEW RATE (V/µs)
TEMPERATURE (°C)
00880-024
SUPPLY VOLTAGE (V)
DIFFERE NTIAL PHASE ( Degrees)
DIFFERENTIAL GAIN (%)
±5 ±10
0.03
0.05
0.04
0.03
0.02
0.01
±15
0.043°
DIFFERENTIAL GAIN
DIFFERE NTIAL PHASE
00880-027
200mV 50ns
0%
10
90
00880-028
20mV 20ns
0%
10
90
100%
00880-030
2V
50ns
0%
10
90
100%
00880-031
50mV
20ns
0%
10
90
100%
Figure 23. Slew Rate vs. Temperature
Figure 24. Differential Phase and Gain vs. Supply Voltage
Figure 26. Gain-of-2 Follower Small Signal Pulse Response (See Figure 32)
Figure 27. Gain-of-20 Follower Large Signal Pulse Response (See Figure 33)
Figure 25. Gain-to-2 Follower Large Signal Pulse Response (See Figure 32)
Figure 28. Gain-of-20 Follower Small Signal Pulse Response (See Figure 33)
Rev. I | Page 9 of 20

AD829 Data Sheet
00880-033
200mV 50ns
0%
10
90
100%
00880-034
20mV 20ns
0%
10
90
100%
Figure 29. Unity-Gain Inverter Large Signal Pulse Response (See Figure 34)
Figure 30. Unity-Gain Inverter Small Signal Pulse Response (See Figure 34)
Rev. I | Page 10 of 20

Data Sheet AD829
00880-025
1
2
3
8
5
7
4
6
–
+
AD829
–V
S
+V
S
OFFSET
NULL
ADJUST
20kΩ
0.1µF
0.1µF
C
COMP
(EXTERNAL)
00880-026
3
2
7
5
6
4
+
–
AD829
+15V
–15V
0.1µF
5pF
300kΩ
300kΩ
C
COMP
15pF
0.1µF
50Ω
CABLE
50Ω
50Ω
50Ω
TEKTRONIX
TYPE 7A24
PREAMP
50Ω
CABLE
HP8130A
5ns RISE TIME
00880-029
2
3
7
6
4
–
+
AD829
+15V
–15V
0.1µF
1pF
2kΩ
105kΩ
0.1µF
5Ω
100Ω
50Ω
CABLE
HP8130A
5ns RISE TIME
TEKTRONIX
TYPE 7A24
PREAMP
FET
PROBE
45Ω
C
COMP
= 0pF
00880-032
2
3
7
6
4
–
+
AD829
+15V
–15V
0.1µF
0.1µF
5
C
COMP
15pF
50Ω
HP8130A
5ns RISE TIME
50Ω
CABLE
50Ω
CABLE
300Ω
50Ω
5pF
300Ω
50Ω
TEKTRONIX
TYPE 7A24
PREAMP
TEST CIRCUITS
Figure 31. Offset Null and External Shunt Compensation Connections
Figure 32. Follower Connection, Gain = 2
Figure 33. Follower Connection, Gain = 20
Figure 34. Unity-Gain Inverter Connection
Rev. I | Page 11 of 20

AD829 Data Sheet
00880-035
–IN+IN
1.2mA
OFFSET NULL
C
12.5pF
R
500Ω
OUTPUT
+V
S
–V
S
C
COMP
15Ω
15Ω
00880-036
2
3
7
6
4
–
+
AD829
+V
S
–V
S
0.1µF
0.1µF
5
C
COMP
50Ω
50Ω
COAX
CABLE
R1
C
LEAD
R2
V
OUT
1kΩ
V
IN
00880-037
3
2
7
6
4
+
–
AD829
+V
S
–V
S
0.1µF
0.1µF
C
LEAD
5
C
COMP
50Ω
50Ω
CABLE
V
OUT
R2
R1
1kΩ
V
IN
THEORY OF OPERATION
The AD829 is fabricated on the Analog Devices, Inc., proprietary
complementary bipolar (CB) process, which provides PNP and
NPN transistors with similar f
s of 600 MHz. As shown in
T
Figure 35, the AD829 input stage consists of an NPN differential
pair in which each transistor operates at a 600 µA collector current.
This gives the input devices a high transconductance, which in
turn gives the AD829 a low noise figure of 2 nV/√Hz at 1 kHz.
An RC network in the output stage (see Figure 35) completely
removes the effect of capacitive loading when the amplifier
compensates for closed-loop gains of 10 or higher. At low
frequencies, and with low capacitive loads, the gain from the
compensation node to the output is very close to unity. In this case,
C is bootstrapped and does not contribute to the compensation
capacitance of the device. As the capacitive load increases, a pole
forms with the output impedance of the output stage, which
reduces the gain, and subsequently, C is incompletely
bootstrapped. Therefore, some fraction of C contributes to the
compensation capacitance, and the unity-gain bandwidth falls.
As the load capacitance is further increased, the bandwidth
continues to fall, and the amplifier remains stable.
EXTERNALLY COMPENSATING THE AD829
The AD829 is stable with no external compensation for noise
gains greater than 20. For lower gains, two different methods of
frequency compensating the amplifier can be used to achieve
closed-loop stability: shunt and current feedback compensation.
Figure 35. Simplified Schematic
The input stage drives a folded cascode that consists of a fast pair of
PNP transistors. These PNPs drive a current mirror that provides a
differential-input-to-single-ended-output conversion. The high
speed PNPs are also used in the current-amplifying output stage,
which provides a high current gain of 40,000. Even under heavy
loading conditions, the high f
s of the NPN and PNPs, produced
T
using the CB process, permit cascading two stages of emitter
followers while maintaining 60 phase margin at closed-loop
bandwidths greater than 50 MHz.
Two stages of complementary emitter followers also effectively
buffer the high impedance compensation node (at the C
from the output so that the AD829 can maintain a high dc openloop gain, even into low load impedances (92 dB into a 150 Ω
load and 100 dB into a 1 kΩ load). Laser trimming and PTAT
biasing ensure low offset voltage and low offset voltage drift,
enabling the user to eliminate ac coupling in many applications.
For added flexibility, the AD829 provides access to the internal
frequency compensation node. This allows users to customize the
frequency response characteristics for a particular application.
Unity-gain stability requires a compensation capacitance of 68 pF
(Pin 5 to ground), which yields a small signal bandwidth of
66 MHz and slew rate of 16 V/µs. The slew rate and gain
bandwidth product varies inversely with compensation
capacitance. Table 4 and Figure 37 show the optimum
compensation capacitance and the resulting slew rate for
a desired noise gain.
For gains between 1 and 20, choose C
bandwidth relatively constant. The minimum gain that will still
provide stability depends on the value of the external
compensation capacitance.
to keep the small signal
COMP
pin)
COMP
Rev. I | Page 12 of 20
SHUNT COMPENSATION
Figure 36 and Figure 37 show that shunt compensation has an
external compensation capacitor, C
compensation pin and ground. This external capacitor is tied in
parallel with approximately 3 pF of internal capacitance at the
compensation node. In addition, a small capacitance, C
parallel with resistor R2, compensates for the capacitance at the
inverting input of the amplifier.
Figure 36. Inverting Amplifier Connection Using External Shunt
Compensation
Figure 37. Noninverting Amplifier Connection Using External Shunt
Compensation
Table 4 gives the recommended C
as the corresponding slew rates and bandwidth. The capacitor
values were selected to provide a small signal frequency response
with <1 dB of peaking and <10% overshoot. For Tab le 4, ±15 V
, connected between the
COMP
COMP
and C
values, as well
LEAD
, in
LEAD

Data Sheet AD829
I
2
q
kT
f
RateSlew
T
π= 4
25
−24
105
2.49
0
0
230
39
00880-038
NOISE GAIN
C
COMP
(pF)
SLEW RATE (V/µs)
1 10
1
10
100
10
100
1k
100
SLEW RATE
C
COMP
V
S
= ±15V
supply voltages should be used. Figure 38 is a graphical extension
of Table 4, which shows the slew rate/gain trade-off for lower
closed-loop gains, when using the shunt compensation scheme.
C
is the compensation capacitance.
COMP
r
is the inverse of the transconductance of the input transistors.
e
kT/q approximately equals 26 mV at 27°C.
Because both f
and slew rate are functions of the same variables,
T
the dynamic behavior of an amplifier is limited. Because
Figure 38. Value of C
and Slew Rate vs. Noise Gain
COMP
CURRENT FEEDBACK COMPENSATION
Bipolar, nondegenerated, single-pole, and internally
compensated amplifiers have their bandwidths defined as
f
=
T
1
=
Cr
π
2
e
COMP
where:
f
is the unity-gain bandwidth of the amplifier.
T
I is the collector current of the input transistor.
I
kT
π
2
q
C
COMP
C
COMP
RateSlew
=
then
This shows that the slew rate is only 0.314 V/µs for every megahertz of bandwidth. The only way to increase the slew rate is to
increase the f
, and that is difficult because of process limitations.
T
Unfortunately, an amplifier with a bandwidth of 10 MHz can
only slew at 3.1 V/µs, which is barely enough to provide a full
power bandwidth of 50 kHz.
The AD829 is especially suited to a form of current feedback
compensation that allows for the enhancement of both the full
power bandwidth and the slew rate of the amplifier. The voltage
gain from the inverting input pin to the compensation pin is
large; therefore, if a capacitance is inserted between these pins,
the bandwidth of the amplifier becomes a function of its feedback resistor and the capacitance. The slew rate of the amplifier
is now a function of its internal bias (2I) and the compensation
capacitance.
Table 4. Component Selection for Shunt Compensation
Follower Gain Inverter Gain R1 (Ω) R2 (Ω) C
LEAD
(pF) C
(pF) Slew Rate (V/µs) −3 dB Small Signal Bandwidth (MHz)
COMP
1 Open 100 0 68 16 66
2 −1 1 k 1 k 5 25 38 71
5 −4 511 2.0 k 1 7 90 76
10 −9 226 2.05 k 0 3 130 65
20 −19 105 2 k 0 0 230 55
100 −99 20 2 k 0 0 230 7.5
Rev. I | Page 13 of 20

AD829 Data Sheet
00880-039
2
3
7
6
4
–
+
AD829
+V
S
–V
S
0.1µF
5
0.1µF
C1*
50Ω
50Ω
COAX
CABLE
R1
C
COMP
R
F
V
OUT
R
L
1kΩ
V
IN
IN4148
*RECOMMENDED VALUE
OF C
COMP
FOR C1
<7pF 0pF
≥7pF 15pF
C
COMP
SHOULD NEVER EXCEED
15pF FOR THIS CONNECTION
00880-040
5V 200ns
0%
10
90
100%
00880-041
FREQUENCY (Hz)
CLOSED-LOOP GAIN (dB)
100k 1M 10M
–15
–12
–9
–6
–3
0
3
6
9
12
15
100M
GAIN = –4
–3dB @ 8.2MHz
GAIN = –2
–3dB @ 9.6MHz
GAIN = –1
–3dB @ 10.2MHz
VIN = –30dBm
V
S
= ±15V
R
L
= 1kΩ
R
F
= 1kΩ
C
COMP
= 15pF
C1 = 15pF
00880-042
5V 200ns
0%
10
90
100%
00880-043
20mV
10ns
0%
10
90
100%
Because the closed-loop bandwidth is a function of RF and
C
(see Figure 39), it is independent of the amplifier closed-
COMP
loop gain, as shown in Figure 41. To preserve stability, the time
constant of R
<65 MHz. For example, with C
and C
F
needs to provide a bandwidth of
COMP
= 15 pF and RF = 1 kΩ, the
COMP
small signal bandwidth of the AD829 is 10 MHz. Figure 40
shows that the slew rate is in excess of 60 V/µs. As shown in
Figure 41, the closed-loop bandwidth is constant for gains of
−1 to −4; this is a property of the current feedback amplifiers.
Figure 42 is an oscilloscope photo of the pulse response of a unitygain inverter that has been configured to provide a small signal
bandwidth of 53 MHz and a subsequent slew rate of 180 V/µs;
R
= 3 kΩ and C
F
= 1 p F. Figure 43 shows the excellent pulse
COMP
response as a unity-gain inverter, this using component values
= 1 kΩ and C
of R
F
COMP
= 4 pF.
Figure 39. Inverting Amplifier Connection Using Current Feedback
Compensation
Figure 40. Large Signal Pulse Response of Inverting Amplifier Using Current
Feedback Compensation, C
= 15 pF, C1 = 15 pF RF = 1 kΩ, R1 = 1 kΩ
COMP
Figure 42. Large Signal Pulse Response of the Inverting Amplifier Using
Current Feedback Compensation, C
= 1 pF, RF = 3 kΩ, R1 = 3 kΩ
COMP
Figure 43. Small Signal Pulse Response of Inverting Amplified Using Current
Feedback Compensation, C
= 4 pF, RF = 1 kΩ, R1 = 1 kΩ
COMP
Figure 41. Closed-Loop Gain vs. Frequency for the Circuit of Figure 38
Rev. I | Page 14 of 20

Data Sheet AD829
00880-044
FREQUENCY (MHz)
CLOSED-LOOP GAIN (dB)
1 10
–15
–12
–9
–6
–3
0
3
6
9
12
15
100
GAIN = –4
C
COMP
= 2pF
GAIN = –2
C
COMP
= 3pF
GAIN = –1
C
COMP
= 4pF
V
S
= ±15V
R
L
= 1kΩ
R
F
= 1kΩ
V
IN
= –30dBm
00880-045
FREQUENCY (MHz)
OUTPUT LEVEL (dB)
1 10
–47
–44
–41
–38
–35
–32
–29
–26
–23
–20
–17
100
±5V
±15V
V
IN
= –20dBm
R
L
= 1kΩ
R
F
= 1kΩ
GAIN = –1
C
COMP
= 4pF
00880-046
3
2
7
6
4
5
+
–
AD829
+15V
–15V
0.1µF
3pF
C
COMP
2kΩ
2kΩ
0.1µF
50Ω
50kΩ
50Ω
50Ω
COAX
CABLE
50Ω
COAX
CABLE
V
IN
V
OUT
00880-047
3
2
7
6
5
4
+
–
AD829
+15V
0.1µF
30pF
C
COMP
–15V
0.1µF
300Ω
300Ω
75Ω
75Ω
75Ω
50Ω
COAX
CABLE
V
IN
V
OUT
OPTIONAL
2pF TO 7pF
FLATNESS
TRIM
Figure 44 and Figure 45 show the closed-loop frequency
response of the AD829 for different closed-loop gains and
different supply voltages.
Figure 44. Closed-Loop Frequency Response for the Inverting Amplifier Using
When a noninverting amplifier configuration using a current
feedback compensation is needed, the circuit shown in Figure 46 is
recommended. This circuit provides a slew rate twice that of the
shunt compensated noninverting amplifier of Figure 47 at the
expense of gain flatness. Nonetheless, this circuit delivers 95 MHz
bandwidth with 1 dB flatness into a back-t
wit
phase error of only 0.015 at 4.43 MHz.
Current Feedback Compensation
Figure 45. Closed-Loop Frequency Response vs. Supply for the Inverting
Amplifier Using Current Feedback Compensation
erminated cable,
h a differential gain error of only 0.01% and a differential
LOW ERROR VIDEO LINE DRIVER
The buffer circuit shown in Figure 47 drives a back-terminated
75 Ω video line to standard video levels (1 V p-p), with 0.1 dB
gain flatness to 30 MHz and with only 0.04° and 0.02% differential
phase and gain at the 4.43 MHz PAL color subcarrier frequency.
This level of performance, which meets the requirements for
Rev. I | Page 15 of 20
high definition video displays and test equipment, is achieved
using only 5 mA quiescent current.
Figure 46. Noninverting Amplifier Connection Using Current Feedback
Compensation
Figure 47. Video Line Driver with a Flatness over Frequency Adjustment

AD829 Data Sheet
00880-048
+15V
–15V
COMM
10µF
10µF
0.1µF
0.1µF
1µF
1µF
0.1µ
F
0.1µF
+V
S
–V
S
PIN 4
EACH
AM
PLIFIER
PIN 7
100Hz
1MHz
10MHz
64.6dB
44.7dB
23.9dB
INPUT
FREQUENCY CMRR
A1
AD829
2pF TO 8pF
SETTLING TIME
AC CMR ADJUST
3pF
3pF
1pF
1pF
2kΩ
200Ω
R
G
210Ω
1kΩ
2kΩ
200Ω
970Ω
50Ω
2kΩ
(G = 5)
5
3
2
6
DC CMR
ADJUST
3pF
(G = 20)
(G = 20)
A2
AD829
A3
AD848
+V
IN
+V
IN
CIRCUIT G AIN = + 1
4000Ω
R
G
5
5
2
3
6
5
3
2
6
HIGH GAIN VIDEO BANDWIDTH, 3-OP-AMP INSTRUMENTATION AMPLIFIER
Figure 48 shows a 3-op-amp instrumentation amplifier circuit
that provides a gain of 100 at video bandwidths. At a circuit gain of
100, the small signal bandwidth equals 18 MHz into a FET probe.
Small signal bandwidth equals 6.6 MHz with a 50 Ω load. The
0.1% settling time is 300 ns.
The input amplifiers operate at a gain of 20, while the output
op amp runs at a gain of 5. In this circuit, the main bandwidth
limitation is the gain/bandwidth product of the output amplifier.
Extra care should be taken while breadboarding this circuit
because even a couple of extra picofarads of stray capacitance at the
compensation pins of A1 and A2 will degrade circuit bandwidth.
Figure 48. High Gain Video Bandwidth, 3-Op-Amp In-Amp Circuit
Rev. I | Page 16 of 20

Data Sheet AD829
CONTROLLING DIMENSIONS ARE IN MILLIMETERS; INCH DIMENSIONS
(IN PARENTHESES) ARE ROUNDED-OFF MILLIMETER EQUIVALENTS FOR
REFERENCE ONLYAND ARE NOT APPROPRIATE FOR USE IN DESIGN.
COMPLIANT TO JEDEC STANDARDS MS-012-AA
012407-A
0.25 (0.0098)
0.17 (0.0067)
1.27 (0.0500)
0.40 (0.0157)
0.50 (0.0196)
0.25 (0.0099)
45°
8°
0°
1.75 (0.0688)
1.35 (0.0532)
SEATING
PLANE
0.25 (0.0098)
0.10 (0.0040)
4
1
8 5
5.00(0.1968)
4.80(0.1890)
4.00 (0.1574)
3.80 (0.1497)
1.27 (0.0500)
BSC
6.20 (0.2441)
5.80 (0.2284)
0.51 (0.0201)
0.31 (0.0122)
COPLANARITY
0.10
COMPLIANT TO JEDEC STANDARDS MS-001
CONTROLLING DIMENSIONSARE IN INCHES; MILLIMETER DIMENSIONS
(IN
PARENTHESES) ARE
ROUNDED-OF F INCH EQUI VALENTS FOR
REFERENCE O NLYAND ARE NO
T APPROPRIATE FOR USE IN DESIGN.
CORNER LEADS MAY BE CONFIGURED AS WHOLE OR HAL F LEADS.
070606-A
0.022 (0.56)
0.018 (0.46)
0.014 (0.36)
SEATING
PLANE
0.015
(0.38)
MIN
0.210 (
5.33)
MAX
0.150 (3.81)
0.130 (3.30)
0.115 (2.92)
0.070 (1.78)
0.060 (1.52)
0.045 (1.14)
8
1
4
5
0.280 (7.11)
0.250 (6.35)
0.240 (6.10)
0.100 (2.54)
BSC
0.400 (10.16)
0.365 (9.27)
0.355 (9.02)
0.060 (1.52)
MAX
0.430 (10.92)
MAX
0.014 (0.36)
0.010 (0.25)
0.008 (0.20)
0.325 (8.26)
0.310 (7.87)
0.300 (7.62)
0.195 (4.95)
0.130 (3.30)
0.115 (2.92)
0.015 (0.38)
GAUGE
PLANE
0.005 (0.13)
MIN
OUTLINE DIMENSIONS
Figure 49. 8-Lead Standard Small Outline Package [SOIC_N]
Narrow Body (R-8)
Dimensions shown in millimeters and (inches)
Figure 50. 8-Lead Plastic Dual In-Line Package [PDIP]
Narrow Body
(N-8)
Dimensions shown in inches and (millimeters)
Rev. I | Page 17 of 20

AD829 Data Sheet
CONTROLLING DIMENSIONS ARE IN INCHES; MILLIMETER DIMENSIONS
(IN PARENTHESES) ARE ROUNDED-OFF INCH EQUIVALENTS FOR
REFERENCE ONLY AND ARE NOT APPROPRIATE FOR USE IN DESIGN.
0.310 (7.87)
0.220 (5.59)
0.005 (0.13)
MIN
0.055 (1.40)
MAX
0.100 (2.54) BSC
15°
0°
0.320 (8.13)
0.290 (7.37)
0.015 (0.38)
0.008 (0.20)
SEATING
PLANE
0.200 (5.08)
MAX
0.405 (10.29) MAX
0.150 (3.81)
MIN
0.200 (5.08)
0.125 (3.18)
0.023 (0.58)
0.014 (0.36)
0.070 (1.78)
0.030 (0.76)
0.060 (1.52)
0.015 (0.38)
1
4
5
8
CONTROLLING DIMENSIONSARE IN INCHES; MILLIMETER DIMENSIONS
(IN PARENTHESES) ARE ROUNDED-OFF INCH EQUIVALENTS FOR
REFERENCE O NLYAND ARE NO T APPROPRIATE FOR USE IN DESIGN.
1
20
4
9
8
13
19
14
3
18
BOTTOM
VIEW
0.028 (0.71)
0.022 (0.56)
45° TYP
0.015 (0.38)
MIN
0.055 (1.40)
0.045 (1.14)
0.050 (1.27)
BSC
0.075 (1.91)
REF
0.011 (0.28)
0.007 (0.18)
R TYP
0.095 (2.41)
0.075 (1.90)
0.100 (2.54) REF
0.200 (5.08)
REF
0.150 (3.81)
BSC
0.075 (1.91)
REF
0.358 (9.09)
0.342 (8.69)
SQ
0.358
(9.09)
MAX
SQ
0.100 (2.54)
0.064 (1.63)
0.088 (2.24)
0.054 (1.37)
022106-A
Figure 51. 8-Lead Ceramic Dual In-Line [CERDIP]
(Q-8)
Dimensions shown in inches and (millimeters)
Figure 52. 20-Terminal Ceramic Leadless Chip Carrier [LCC]
(E-20-1)
Dimensions shown in inches and (millimeters)
Rev. I | Page 18 of 20

Data Sheet AD829
Model1
Temperature Range
Package Description
Package Option
AD829AR-REEL
−40°C to +125°C
8-Lead SOIC_N
R-8
AD829JRZ-REEL
0°C to 70°C
8-Lead SOIC_N
R-8
ORDERING GUIDE
AD829AR −40°C to +125°C 8-Lead SOIC_N R-8
AD829AR-REEL7 −40°C to +125°C 8-Lead SOIC_N R-8
AD829ARZ
AD829ARZ-REEL
AD829ARZ-REEL7
AD829JN 0°C to 70°C 8-Lead PDIP N-8
AD829JNZ 0°C to 70°C 8-Lead PDIP N-8
AD829JR 0°C to 70°C 8-Lead SOIC_N R-8
AD829JR-REEL 0°C to 70°C 8-Lead SOIC_N R-8
AD829JR-REEL7 0°C to 70°C 8-Lead SOIC_N R-8
AD829JRZ 0°C to 70°C 8-Lead SOIC_N R-8
AD829JRZ-REEL7 0°C to 70°C 8-Lead SOIC_N R-8
AD829AQ −40°C to +125°C 8-Lead CERDIP Q-8
AD829SQ −55°C to +125°C 8-Lead CERDIP Q-8
AD829SQ/883B −55°C to +125°C 8-Lead CERDIP Q-8
5962-9312901MPA −55°C to +125°C 8-Lead CERDIP Q-8
AD829SE/883B −55°C to +125°C 20-Lead LCC E-20-1
5962-9312901M2A −55°C to +125°C 20-Lead LCC E-20-1
AD829JCHIPS Die
AD829SCHIPS Die
AD829AR-EBZ Evaluation Board
1
Z = RoHS Compliant Part.
−40°C to +125°C 8-Lead SOIC_N R-8
−40°C to +125°C 8-Lead SOIC_N R-8
−40°C to +125°C 8-Lead SOIC_N R-8
Rev. I | Page 19 of 20

AD829 Data Sheet
©2011 Analog Devices, Inc. All rights reserved. Trademarks and
NOTES
registered trademarks are the property of their respective owners.
D00880-0-10/11(I)
Rev. I | Page 20 of 20
 Loading...