

Page 1
Alicat Scientic, Inc.
7641 N Business Park Drive
Tucson, Arizona 85743
USA
Alicat.com
Page 2

Notice: Alicat Scientic, Inc. reserves the right to make any
changes and improvements to the products described in
this manual at any time and without notice. This manual is
copyrighted. This document may not, in whole or in part, be
copied, reproduced, translated, or converted to any electronic
medium or machine readable form, for commercial purposes,
without prior written consent from the copyright holder.
Note: Although we provide assistance on Alicat Scientic
products both personally and through our literature, it is the
complete responsibility of the user to determine the suitability
of any product to their application.
The manufacturer does not warrant or assume responsibility for
the use of its products in life support applications or systems.
For more information regarding this or any Alicat product, please
contact us at:
Alicat Scientic, Inc
7641 N Business Park Drive
Tucson, Arizona 85743
USA
Ph: 520-290-6060
888-290-6060
Fax: 520-290-0109
email: [email protected]
Web site: www.alicat.com
04/04/2016 Rev.4 DOC-FVISIONSCMAN
2
Page 3

Table of Contents
Welcome to Flow Vision™ SC 5
System Requirements 5
Section 1 - Getting Started 6
Installing the Software 6
Launching Flow Vision™ SC 8
Section 2 - Setting up Flow Vision™ SC 9
Registering Flow Vision™ SC 9
Flow Vision™ SC Menu and Menu functions 9
File Menu 10
Edit Menu 10
Layout Menu 10
Help Menu 10
Flow Vision™ SC Screen Layout 11
Tabs 11
Moving & Docking Modules in the Flow Vision™ Window 12
Section 3 - Communicating with a Device 13
Connecting To An Instrument And Receiving Data 13
Adding a Device to a Known COM Port 13
Searching for Devices 14
Opening the Device Window 15
General Tab 15
Gas Select™ 16
Averaging 16
Tare 16
Control Section (Controllers only) 16
Control Loop 16
Valve Tuning 17
Valve Offset 17
Info Tab 17
Creating Custom Expressions 17
Removing a Device 18
3
Page 4

Table of Contents
Section 4 – Optional Modules 19
Logs 19
Splitting Data Files 20
Starting and Stopping Data Logs 20
Charts 21
Creating Charts 21
Charting 22
Scripts 23
Descriptions of Simple Script Commands 24
Display Data 24
Change Set-point (Scale Units) 24
Change Set-point (% of Full Scale) 24
Tare 24
Sample Script 24
Running the Script 25
Terminals 26
Uninstalling Flow Vision™ SC 27
Troubleshooting and FAQs 28
Contact Information 29
4
Page 5

Welcome to Flow Vision™ SC
Flow Vision™ SC is a graphic based software package that allows you
to operate any Alicat ow or pressure instrument via a graphical user
interface.
Flow Vision™ SC lets you: access information from your Alicat instruments;
make changes in commands to those instruments; monitor performance;
log data; chart data; and communicate directly with the unit via a terminal
window.
If you have used earlier versions of Alicat Scientic’s Flow Vision™
software, we are sure you will nd many new and improved functions in
this latest version: Flow Vision™ SC.
Note: Identiers and scripts from earlier versions of Flow Vision™ are not
recognized by Flow Vision™ SC.
System Requirements
• Microsoft Windows Vista, Windows 7, Windows 8/8.1, Windows 10
• Microsoft® .NET Framework Version 4.5.2
(A copy of Microsoft® .NET Framework can be downloaded at: https://
www.microsoft.com/en-us/download/details.aspx?id=42642)
• 18 MB hard disk space
• Available COM port that supports 19200 baud communications*
* Note: Some laptops are not equipped with serial ports. A virtual serial
port can be created using a USB to Serial adapter.
5
Page 6

Section 1 - Getting Started
In this section you will learn about:
• How to install Flow Vision™ SC to your computer
• How to start using Flow Vision™ SC
Installing the Software
In order to begin using the Flow Vision™ SC software, you will need to
install the software onto the computer to which you plan to connect your
Alicat ow or pressure instrument.
To install the software, place your original Flow Vision™ SC USB ash
drive into a USB port on your computer or laptop.
In a moment, you will see the installation screen.
To continue, choose the button marked “Next >”.
Upon clicking “Next” the End User License Agreement will be shown.
Please read the Agreement carefully and if you agree to the terms listed,
use the mouse pointer to place a check mark in the box next to the
sentence indicating that you agree to the End User License Agreement.
After you have done that you can click the “Next” button to continue with
the software installation. If you do not agree to the terms listed, cancel the
installation, remove the ash drive from your computer and contact your
software vendor to arrange returning the software for a refund.
You can abort the installation at any time by choosing the button marked
“Cancel” or revert to the previous step by choosing the button marked
“Back”.The next screen will ask into which directory you would like to
install the Flow Vision™ SC software.
By default, the program will create a program folder and subfolder in the
“Program Files” folder in your main drive directory. This location is suitable
for most users. If you would like to install Flow Vision™ SC into a different
location, you can manually enter the location’s address in the space provided
or you can choose the button marked “Browse” and select the appropriate
directory.
If you are using a computer at your company and are unsure of the
appropriate location for installation, please request assistance from your
company’s IT department.
You can review the amount of space required on your computer to install
Flow Vision™ SC by choosing the button marked “Disk Cost”.
A window will appear showing available drives in the computer, the size of
each drive, how much space is available on each drive, the space required
for Flow Vision™ SC, and the amount of space that will be available after
Flow Vision™ SC is installed.
6
Page 7

This allows you to select the most appropriate location for Flow Vision™
SC to be installed based on drive space constraints.
To exit this screen and continue with the installation process, select the
button marked “OK”.
You will also be asked if you would like to install Flow Vision™ SC for
yourself only or for anyone who uses the computer. Flow Vision™ SC’s
operation will not be affected in any way by this selection. Once you have
made your selections, click the button marked “Next”.
The next screen will inform you that Flow Vision™ SC is ready to be
installed. You can take this opportunity to go back and make changes or
to cancel the installation.
If you are satised with your choices, you can continue with the installation
by choosing the button marked “Next”.
You will not see an installation screen with a progress bar visually
indicating the progress of the installation of Flow Vision™ SC onto your
computer.
Do not turn off or restart the computer during the installation process.
Turning off or restarting the computer during this process will cause Flow
Vision™ SC to not install properly and possibly cause damage to your
computer.
When the installation process is complete, a screen will appear indicating
that Flow Vision™ SC has been successfully installed on your computer.
To exit this screen and the Flow Vision™ SC installation process, select
the button marked “Close”.
Once you have selected “Close”, the installation screen will disappear
from your screen.
7
Page 8
You can now remove the Flow Vision™ SC ash drive from your computer.
You will no longer need the Flow Vision™ SC ash drive to run the software.
Be sure to keep the Flow Vision™ SC ash drive and Registration
Key in a safe place in the event you need to reinstall the software.
Launching Flow Vision™ SC
With Flow Vision™ SC installed to your computer, you can now begin
using the Flow Vision™ SC program.
In order to begin you must rst start the program.
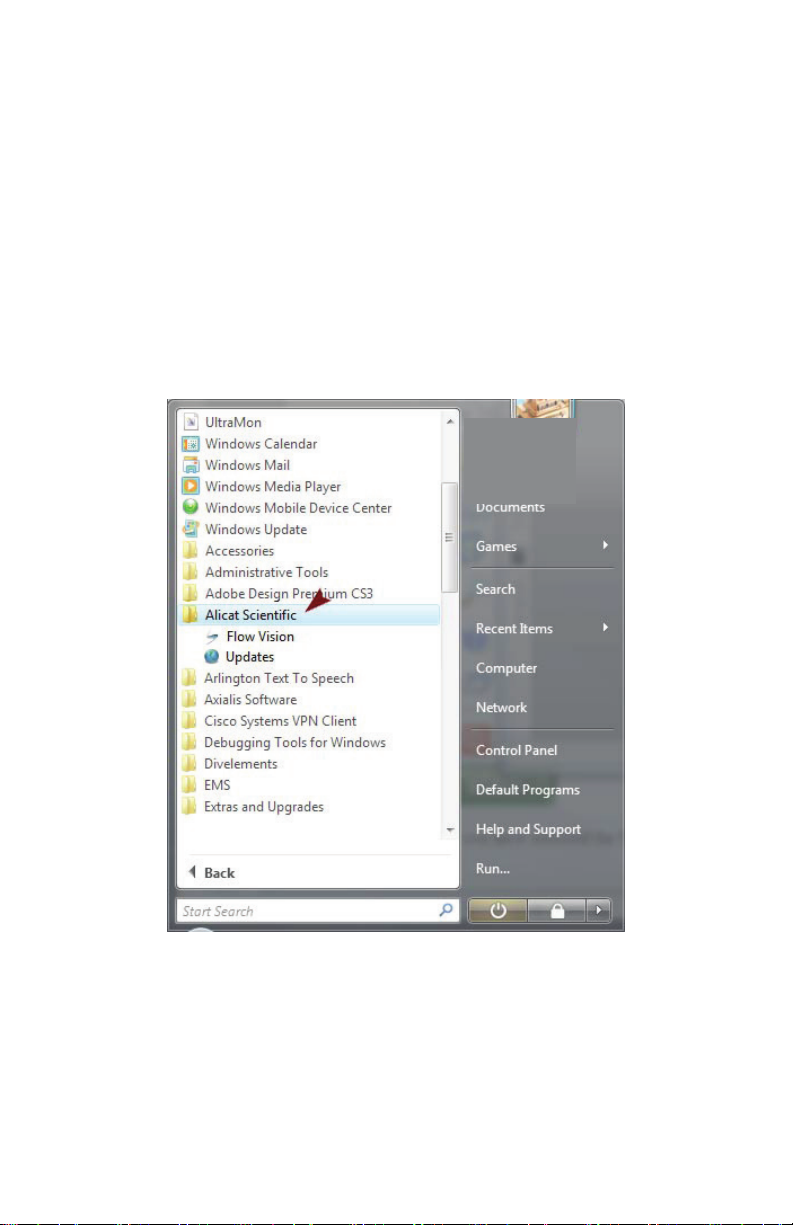
To start the program you will need to select the Flow Vision™ SC program
shortcut from the Start Menu.
>>Start Menu>Alicat Scientic>Flow Vision
Once you have selected the Flow Vision™ SC shortcut from the Start
Menu, the program will begin.
After registration, the application will gather information about your system.
Specically, Flow Vision™ SC probes your computer for available COM
ports. This process only occurs on the rst launch of Flow Vision™ SC. All
subsequent launches will load more quickly.
8
Page 9
Section 2 - Setting up Flow Vision™ SC
In this section you will learn about:
• Registering Flow Vision™ SC
• Flow Vision™ SC Menu and Menu functions
• Flow Vision™ SC screen layout
Registering Flow Vision™ SC
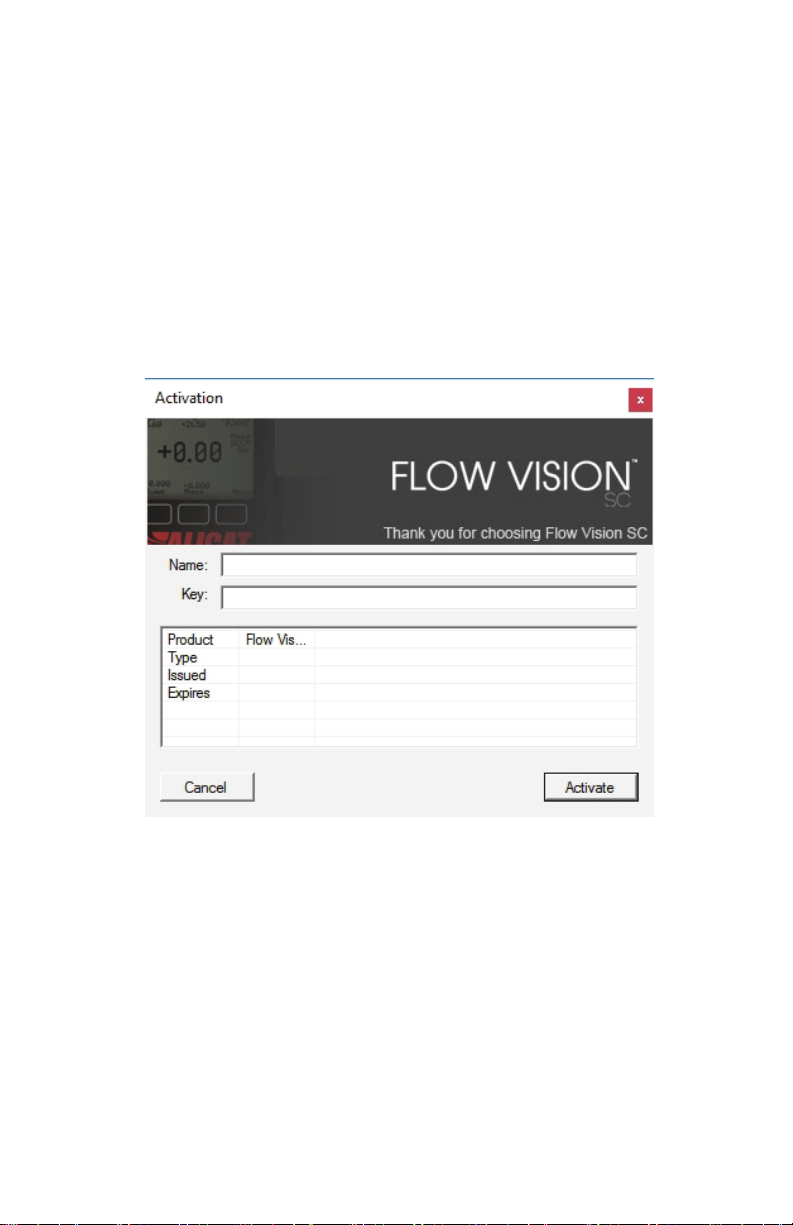
Before Flow Vision™ SC will launch, it needs to be registered. A
registration key is provided with the software.
Please enter the name and registration key in the appropriate elds. After
successful registration, the application will launch.
Flow Vision™ SC Menu and Menu functions
When you start Flow Vision™ SC for the rst time you will see an empty
workspace.
Along the top of the screen you will nd the menu functions: File; Edit;
Layout and Help.
To access a menu, place your mouse cursor over the desired menu and
click the left mouse button.
To select a function from the menu point the mouse arrow to the desired
function and once it is highlighted, click the left mouse key.
Explanations of each menu and its sub-functions follow.
9
Page 10

File Menu
The le menu allows you to exit the program.
Edit Menu
The edit menu allows you to access the “Properties” section of Flow
Vision™ SC. In this section, you can make changes as to how Flow
Vision™ SC functions.
Polling can be adjusted so that the devices will either be polled as quickly
as possible, or will wait a given number of milliseconds between polls.
The polling rate is the time interval for the software to take data from the
instrument, measured in milliseconds.
The “View trace/debug information” option will allow you to view in-depth
information about the application.
Layout Menu
The Layout Menu allows you to arrange open windows in a specic way,
show and hide modules, and save and load layouts.
Help Menu
The Help Menu contains documentation that will answer questions about
the software and how it is used. You can access Flow Vision™ SC version
information by selecting the “About” tab.
10
Page 11
Flow Vision™ SC Screen Layout
Flow Vision™ SC allows you several options in screen conguration. Flow
Vision™ SC is a modular program. Some people will use more functionality
than others. As such, components of Flow Vision™ SC have been housed in
separate modules. Modules and their functions will be discussed later in this
manual.
Tabs
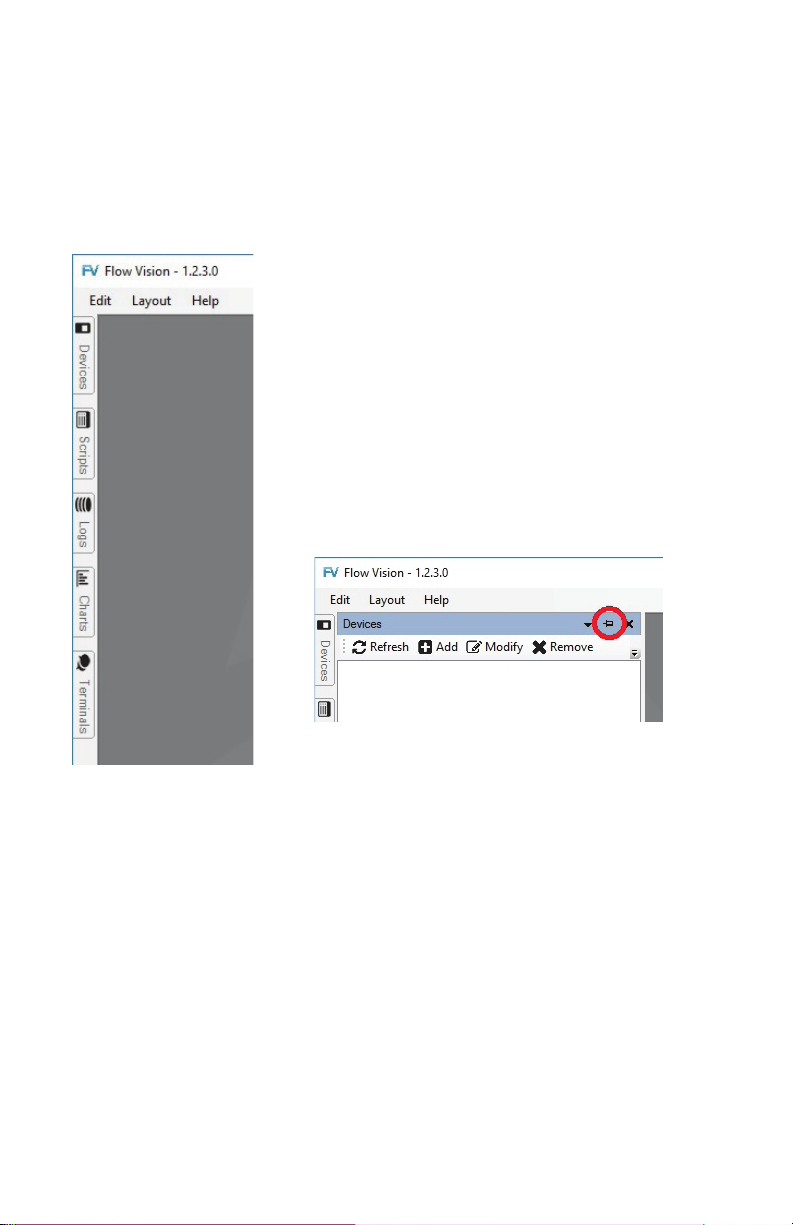
When Flow Vision™ SC is started for the rst time,
you will see a column of tabs along the left side of
the Flow Vision™ SC window.
Placing your mouse cursor over an individual tab
will open the tab into the main screen. Removing
your cursor from the tab window for a few seconds
will cause the tab to disappear from the main
screen.
If you would like the tab to stay open permanently,
simply press the auto-hide (push-pin shaped)
button located on the upper right corner of the tab
screen.
If the pin is facing to the left the tab window will
disappear when not in use. If the pin is facing
downward the tab window will stay open until the auto-hide button is
pressed again.
The auto-hide is useful when performing multiple functions. Non-critical
functions can be hidden while the critical functions are pinned to the
screen.
Flow Vision™ SC allows you to choose which modules are visible and
which are not.
By using the using the View>Modules menu, you can select which module
tabs are made available. By default, all module functions are shown as
tabs.
Use your mouse button to uncheck the modules you do not want shown.
If you decide you want to use a module that is not visible, simply return to
the View>Modules menu and use your mouse button to check the module
you would like to have visible.
11
Page 12
Based on the size of the Flow Vision™ SC window, you may not see all of
the available options in a particular module tab.
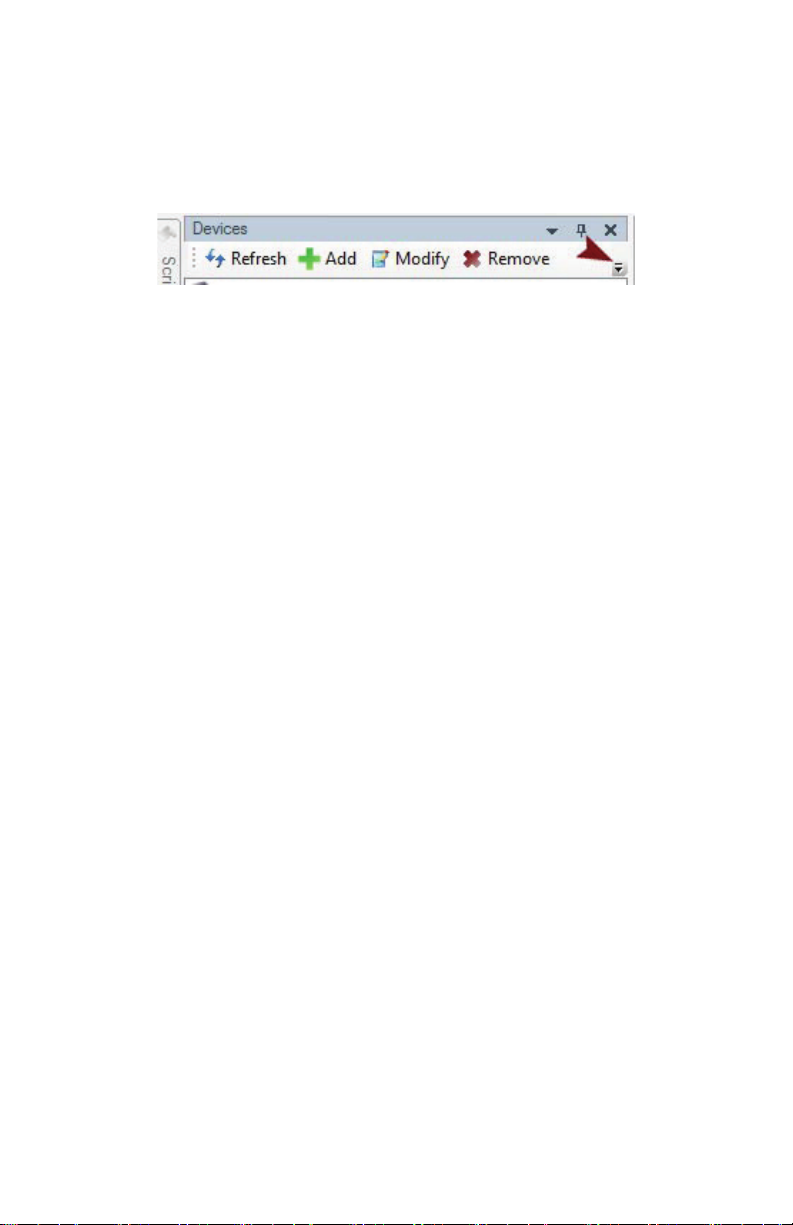
If the window is too small to list all of the options, you will see a downward
facing arrow to the right of the visible options. Clicking this arrow will
display the remaining options. If the window is wide enough, you will see
all of the available options and the downward arrow will not be visible.
Moving and Docking Modules in the Flow Vision™ Window
Another innovative feature of Flow Vision™ SC is the ability to move and
dock modules to different locations on the screen.
To move a tab menu you will rst need to turn off the auto-hide function by
using your mouse to press the auto-hide button. (See ‘Tabs’ section, page
13, for instructions).
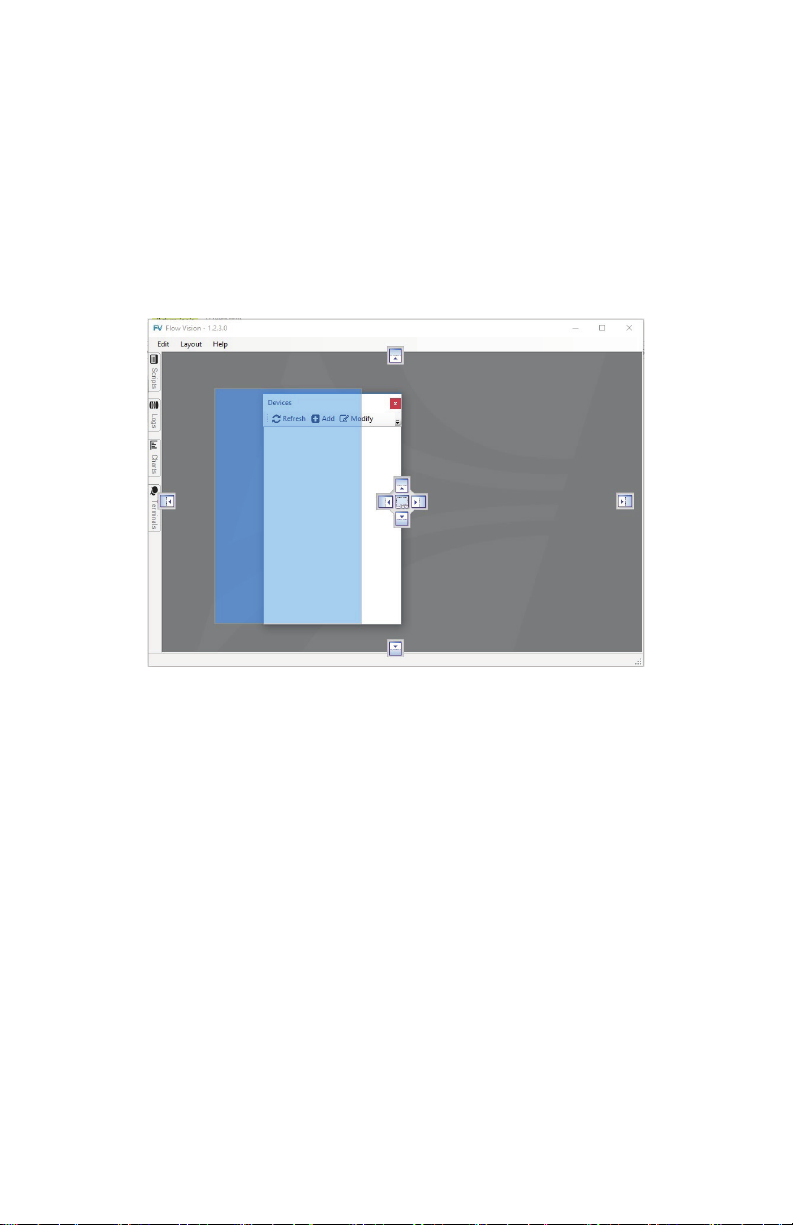
Drag the open window towards the part of the screen in which you like it to
stay. The following diagram will appear on the screen:
Drag the window to one of the anchor points and the window will reattach
itself to the screen.
You can also re-activate the auto-hide feature and a tab will be created on
the side of screen on which the window is attached.
You may repeat this procedure for any number of tabs. By using the center
anchors you can arrange tabs side-by-side or bottom-to-top, in order to
maximize open tab arrangement on the screen.
Individual screen layouts can be saved via the View>Layout menu.
12
Page 13

Section 3 - Communicating with a Device
In this section you will learn about:
• Connecting and registering an Alicat Scientic device
• Opening the Device Module
• Polling a device
• Locking the front display
• Changing the measured gas
• Changing averaging
• Taring the unit
• Set-point control (controllers only)
• Valve tuning (controllers only)
• Getting information about the instrument
• Removing devices
• Setting software alarms
• Creating custom modiers
Connecting to an Instrument and Receiving Data
In order to start using Flow Vision™ SC with an instrument, you will need
to add the instrument to Flow Vision™ SC’s device module.
There are two ways to add devices to Flow Vision™ SC. The “Add” option
allows you to add a single device on a known COM port. If you have
multiple devices or you are not sure which port your device is connected
to the “Search” option is a better choice.
Adding a device on a known COM Port
If you have not connected your instrument to your computer you will need
to do this before taking the next step. You can connect an Alicat instrument
to a computer using Alicat accessory cable MD8DB9 or by following the
directions in the Alicat instrument manual about how to make a cable.
With your device connected to your computer and powered up, open the
“Devices” tab and select “Add”.
A window will appear entitled “New Device”.
Use the arrow to the right of the blank space entitled “COM Port:” to select
the com port to which your device is attached. By default your unit will
come with the unit identier A. (For information on unit identiers please
consult the product manual that accompanied your Alicat instrument).
If your unit identier is not A, select the appropriate identier.
Once the proper selections have been made, select “Find Device >” and
Flow Vision™ SC will look for the attached instrument. The process make
take a few moments. A successfully added a device will be visible in the
Devices tab.
13
Page 14
Searching for Devices
To search for devices connected to your computer choose the “Search”
option from the “Devices” menu.
Note: If you do not see the “Search” option in the “Devices” menu click the
down arrow for more options.
After selecting the option, the “Search for Devices” window will open.
Select the number of devices connected to your system. After Flow
Vision™ SC nds this number of devices it will stop searching.
The “COM ports” box lists the available ports on your system. Ports that
Flow Vision™ SC determines may have devices connected are checked.
Check any other ports you would like to search.
Finally, choose the range of identiers you would like to check for. Click
the “Search >>” button.
Flow Vision™ SC will locate and load devices matching the selected
parameters. Once you have successfully added a device, it will be visible
in the Devices tab.
14
Page 15
Opening the Device Window
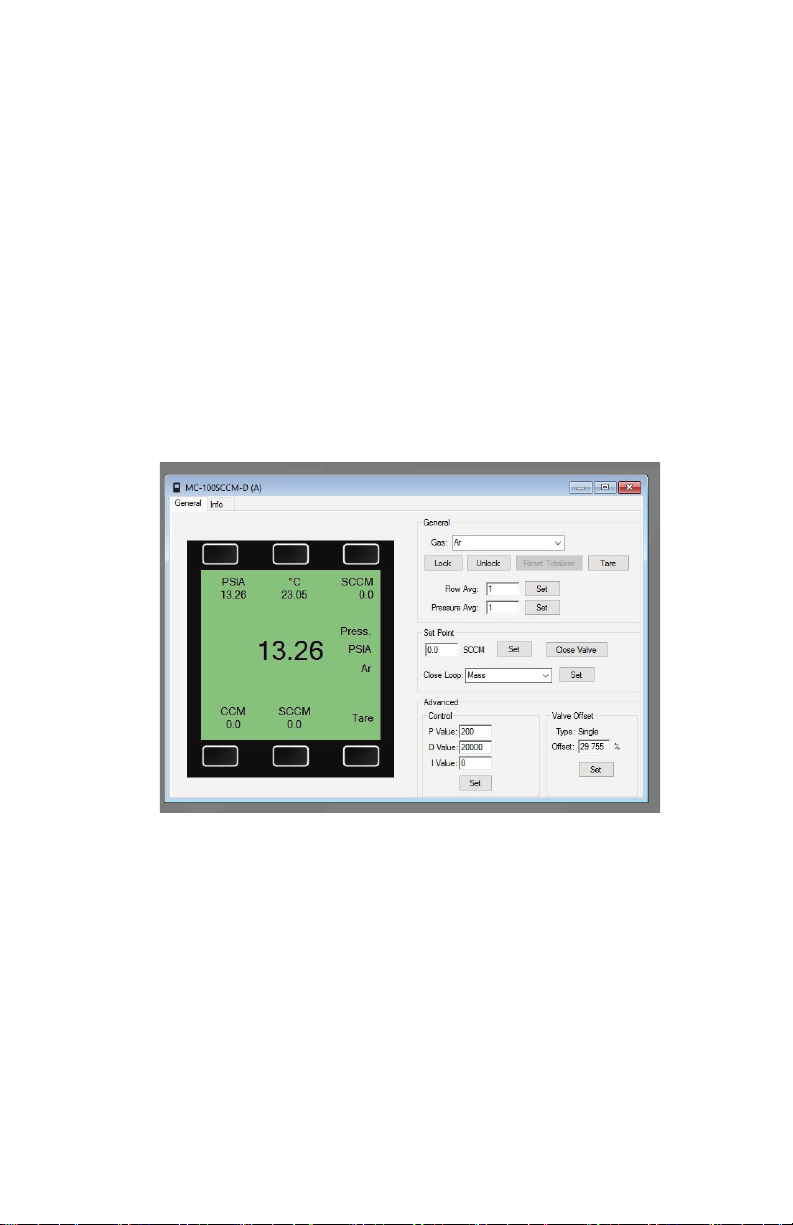
After you have successfully connected to your instrument, from the Device
tab double click on the device you would like to monitor. After a few moments
a window will appear showing a virtual image of your device with a functional
display.
With the device window open, you will see a row of tabs across the top of
the window underneath the window header.
The tabs are: General and Info.
Each of these tabs allows you to make functional changes to the instrument.
General Tab
The general tab is the default starting tab when opening the device window.
In this tab you will see a virtual representation of an instrument.
The image is generic and may not look exactly like the unit connected, this
is normal.
You will immediately notice the display screen. This screen is a
representation of the display functions on the instrument. You can access
display functions by rolling your mouse over and pressing any of the
buttons on the virtual screen.
Using the buttons on the Flow Vision™ SC virtual display will not make the
same change to the display on the instrument itself.
You will notice that the menu screen available on the instrument display is
not available on the Flow Vision™ SC virtual display, this is normal.
In addition to the virtual device, you will be able to make changes affecting
the unit’s operation. You will nd the gas select menu, ow tare, display
lock and averaging functions.
15
Page 16

Gas Select™ — To change the measured gas type, simply click the down
arrow to the right of the gas name to display the gas list.
Scroll down the list until you see the gas you will be owing and click on
that gas. The selected gas should be displayed in the white box. If it is not,
repeat the steps.
If you do not see the gas you will be owing on the list, please contact the
factory before proceeding to verify if your unit is compatible with the gas.
Do Not Flow Gases That Are Not On The Gas List Without Factory
Approval. Doing So Will Void Your Warranty And May Cause
Permanent Damage To Your Flow Instrument.
Averaging changes the sensitivity of the unit’s display to reduce “jitter”.
Averaging does not change Flow Vision™ SC’s data.
When the averaging is set to a low gure, the unit’s display will show ow
rate changes to the last signicant digit as it is happening. The result is a
rapidly changing integer to the right of the decimal. Some users nd this to
be a nuisance when trying to record data.
By increasing the averaging, the display will stabilize and not show the
minute changes in ow. Increasing averaging will not affect the performance
or accuracy of the unit in any way. Averaging is simply a setting that helps
reduce the “jitter” of the display.
Tare — The tare function is used to set the zero on the instrument. Tare only
when there is no gas ow going to the unit. The tare function is discussed
in detail in the instruction manual that accompanied your instrument.
Control Section (Controllers only)
The control section allows you to change set-point and perform valve
tuning on your controllers.
To change the set-point simply enter the desired set-point in the text box.
Once the set-point number is in the box, click the mouse on the “Set”
button to send the set-point to the instrument. The unit should now be
owing the process gas at the desired set-point.
Control Loop — You can change the control loop if your process
requires.
By clicking the down arrow in the box to the right of “Close Loop”, you can
select to close loop on mass ow, volumetric ow or pressure.
With MC/MCP/MCR series mass ow controllers,you can select to close
loop on mass ow, volumetric ow or pressure, while pressure controllers
will allow you to close loop on pressure and liquid controllers will allow
close loop on volumetric ow.
Once the desired control loop has been selected, click on the “Set” button
to send the command to the ow instrument.
16
Page 17

Valve Tuning — If you require specialized valve tuning, you may do this
via the “Control” section in the “Advanced” section.
Adjustment of PD&I values will change how the valve responds, valve
stability and valve speed.
It is strongly recommended that adjustments to PD&I settings not be made
unless you have some experience with proportional valve tuning.
Adjusting The PD&I Settings Without Prior Training May Result In
Permanent Damage To Your Control Valve.
Valve offset or preload is a setting to compensate for the mechanical
pressure effects that gas pressure may exert on the control valve. Gas
pressure in the system exerts a mechanical force on the control valve that,
depending upon the gas pressure, may slow its response when opening.
By increasing valve offset, a signal is sent to the valve that will increase its
force when opening.
Adjusting valve offset may help your Alicat controller respond more quickly
when moving away from a zero set-point.
Valve offset is a value between 0 and 100, 0 being little to no offset and
100 being maximum offset.
If your controller uses an Alicat medium sized valve, the offset effect is
reversed. 0 being maximum offset and 100 being little to no offset.
Valve offset has no effect at a zero set-point.
Info Tab
The info tab provides specic information about the unit.
This information is helpful when requesting telephone support or
authorization for recalibration or repair.
Creating Custom Expressions
The info tab also allows custom expressions, where you can change the
output of various measurements.
Suppose we want to change the temperature display from degrees C to
degrees F.
To do this, in the eld under to “Temperature Expression” you will enter
the formula used to convert the measured parameter into your desired
measurement.
To do this, in the eld under to “Units:” type the heading that you would
want to use, for this example it would “˚F”.
In this case we will use the formula (˚C * 9/5) + 32 as the conversion. The
word “value” is used to dene the measured parameter. So, the formula for
converting ˚C to ˚F will look like this: “(value * 9/5) + 32” without the quotes.
17
Page 18
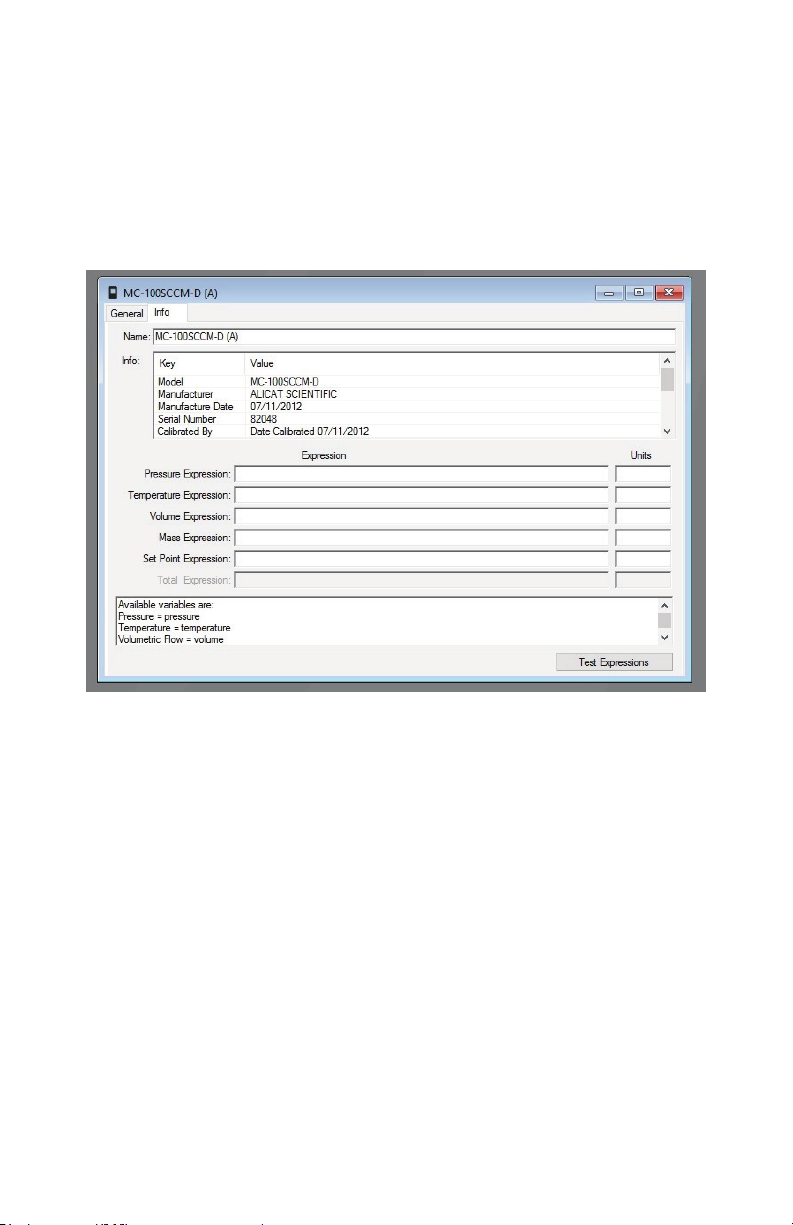
Once you have entered the conversion expression and the units you can
test the functionality of the expression before applying it.
To do that, enter a number in the box to the right of “Value” and then click
the “Text Expression” button. If your formula is correct the window that
appears will show the correct integer based on your formula.
In this case we use 2 as the test value and receive a test expression of
35.6. This means our formula is working.
Removing a Device
To remove a device, select the desired device in the “Devices” tab by
clicking it once. After selecting the device click the “Remove” option in the
menu. After selecting “Yes” at the prompt the instrument will be removed
from Flow Vision™ SC.
Removing A Device That Is Used In a Data Log/Chart Will
Cause That Data Log/Chart To Stop Working.
18
Page 19
Section 4 – Optional Modules
Flow Vision™ SC, as mentioned earlier, is built around the concept of
modules. As such, you can now add or remove modules based on your
intended level of use.
For the casual user only the most essential modules can be made
available and the others made invisible — reducing screen clutter and
possible confusion.
For the advanced user, all modules can be made visible and available on the
screen.
In this section, we will go over each of the modules and their functionality.
Logs
Data logs can be created if you are required to keep records of measured
data for the device for any period of time. Data logs are useful because
they can be viewed outside of Flow Vision™ SC or incorporated into a
database to create an accurate history of data given by the device.
To create a data log, you will rst need to access the “Logs” module. If you
cannot see the Logs module please refer to section 2 (page 11).
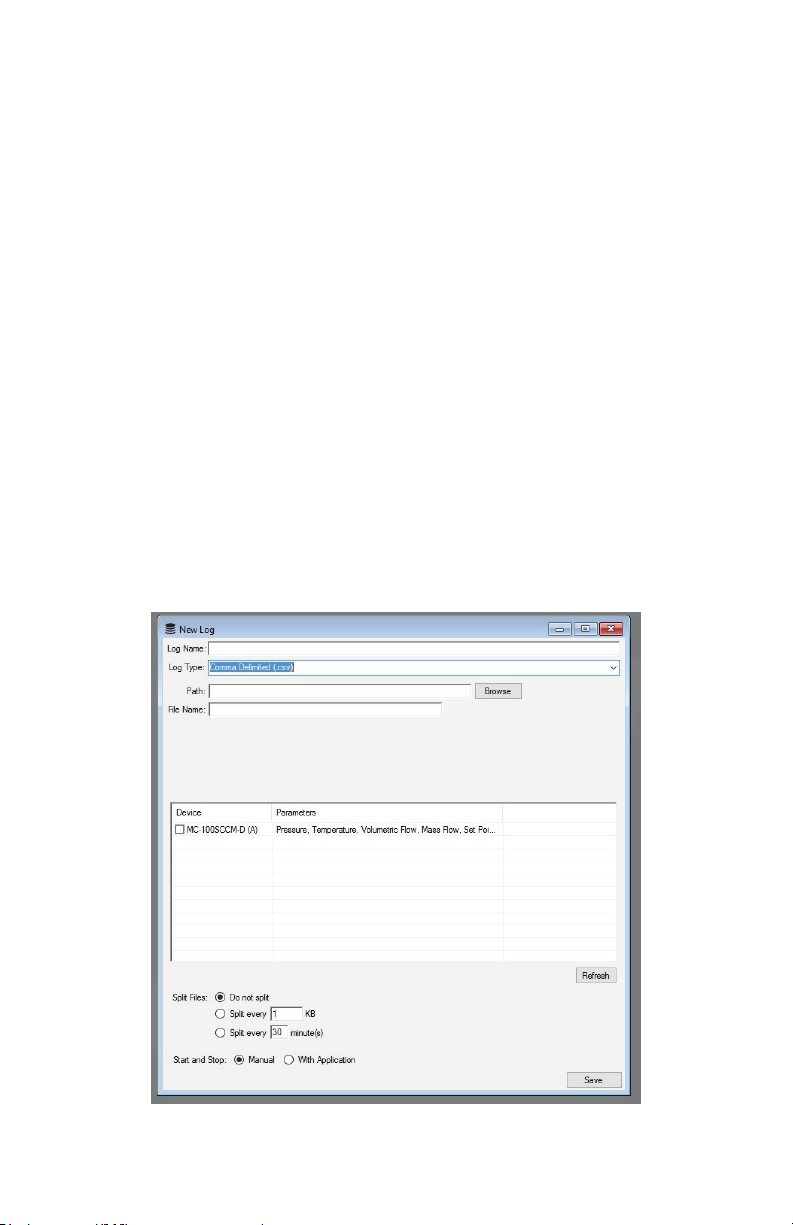
Once you have accessed the Logs module click on “Add”. A window will
appear with options for conguring your data log.
19
Page 20

First, name the data log. This is done by entering a name into the text box
to the right of “Log Name”.
Next, using the drop down arrow next to the “Log Type:” indicator, select
the type of log le you would like.
After you have selected the log name and the type of log le, you will need
to tell Flow Vision™ SC where you would like to save the le and under
what name.
Next, dene the unit (data source) and the parameters you want to log. To
do this, click the “Data” tab on the top of the New Log window.
Splitting Data Files
If you are logging to a .txt le or a .csv le, you can have Flow Vision™
SC split the le into smaller pieces so that the data is more manageable.
Data can be split by le size or time.
Please note: When database le extensions are selected, the File
Splitting menu will be inaccessible. Database les are handled by external
programs that are not affected by le size and have interfaces that allow
users to manipulate data through the database program itself.
Starting and Stopping Data Logs
Flow Vision™ SC also allows you to congure how data logs are started
and stopped.
Logs can be set to start: manually by the user or automatically when Flow
Vision™ SC starts.
Once you have completed all of the sections for a new log, click the “Save”
button in the bottom right hand corner to save the log le.
When the log le has been successfully saved, the New Log window will
automatically close.
By accessing the Logs module again, you will see your saved test in the
window.
If you chose to start or stop the data log manually, you can do so by double
clicking the entry under the Log module.
By accessing the Logs module again, you will see your saved test in the
window.
Once you have completed the data log, you can recover the le using the
Open Folder button in the Data Logs module window.
20
Page 21
Charts
Flow Vision™ SC allows you to create charts to display data.
Creating Charts
To create a chart, access the Charts module. If you do not see the Charts
module refer to section 2 (page 11) for instruction on how to make the
Charts module visible.
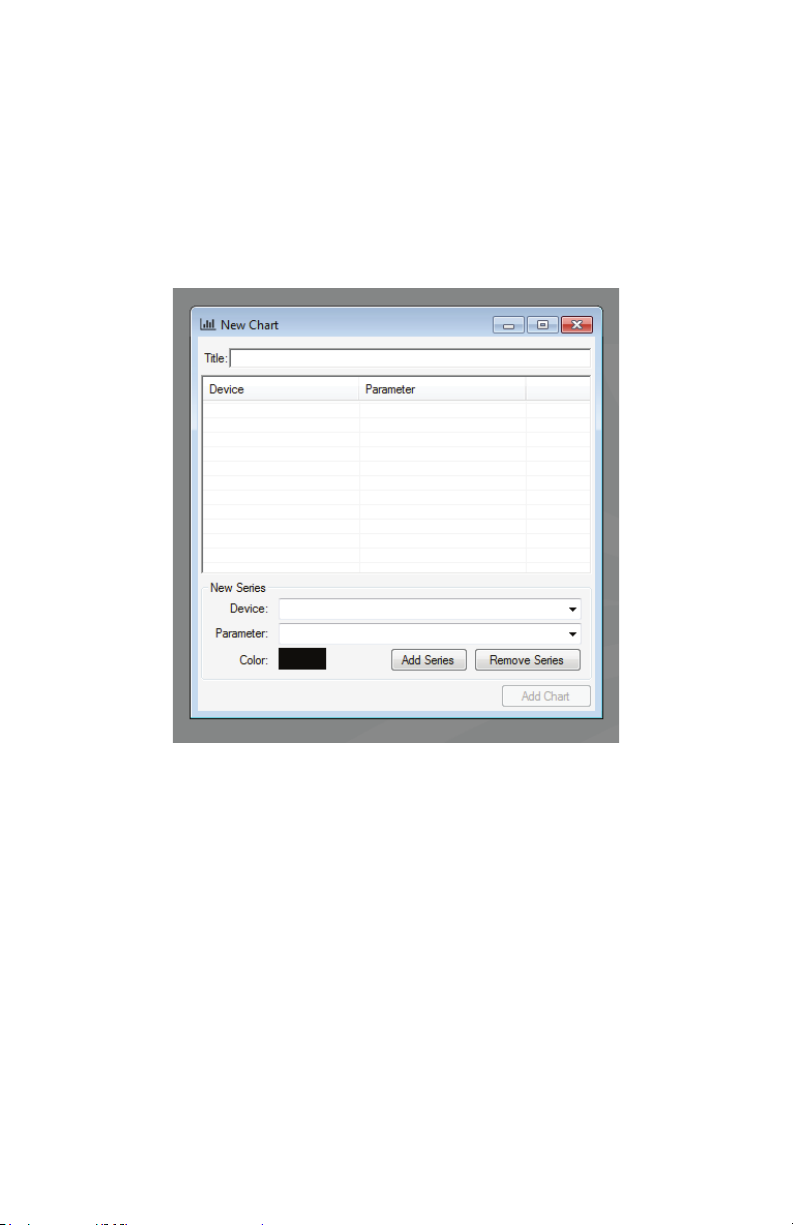
Once you have accessed the Charts module, click on the “Add” button to
bring up the “New Chart” window.
In the New Chart window, begin by naming the chart. To do this, type a
name for the chart in the space provided to the right of “Chart Title:”.
Next, you will need to add a device or series to the chart.
To do this, select the device to chart by using the down arrow to the right
of the “Device” eld.
The arrow will display a list of available devices from which to select one.
Finally, select the parameter you would like to chart.
Clicking the down arrow to the right of the “Parameter” eld will display a
list of available parameters from which to select.
Once you have selected a parameter, assign it a color using the “Color”
eld below the parameter eld.
Again, click the down arrow to the right of the “Color” eld to display a list
of available colors from which to select.
21
Page 22
With the color selected, press the “Add Series” button to add the parameter
to the “Series” section of the New Chart window.
Each series represents a charted line. You can repeat the “New Series”
step for as many parameters you would like to chart from as any units you
have connected.
You will notice that the color of the text dening the charted parameter in
the series eld will correspond to the color of its line on the chart.
A series can be removed by placing a check mark in the box next to the
series name in the Series eld and pressing the “Remove Series” button.
Once satised with your selections, press the “Add Chart” button to add
the chart to the list of available charts in the Chart module.
After you have added the chart, the New Chart window will disappear from
your screen.
Charting
To begin charting, access the Chart module to see your chart in the list of
available charts.
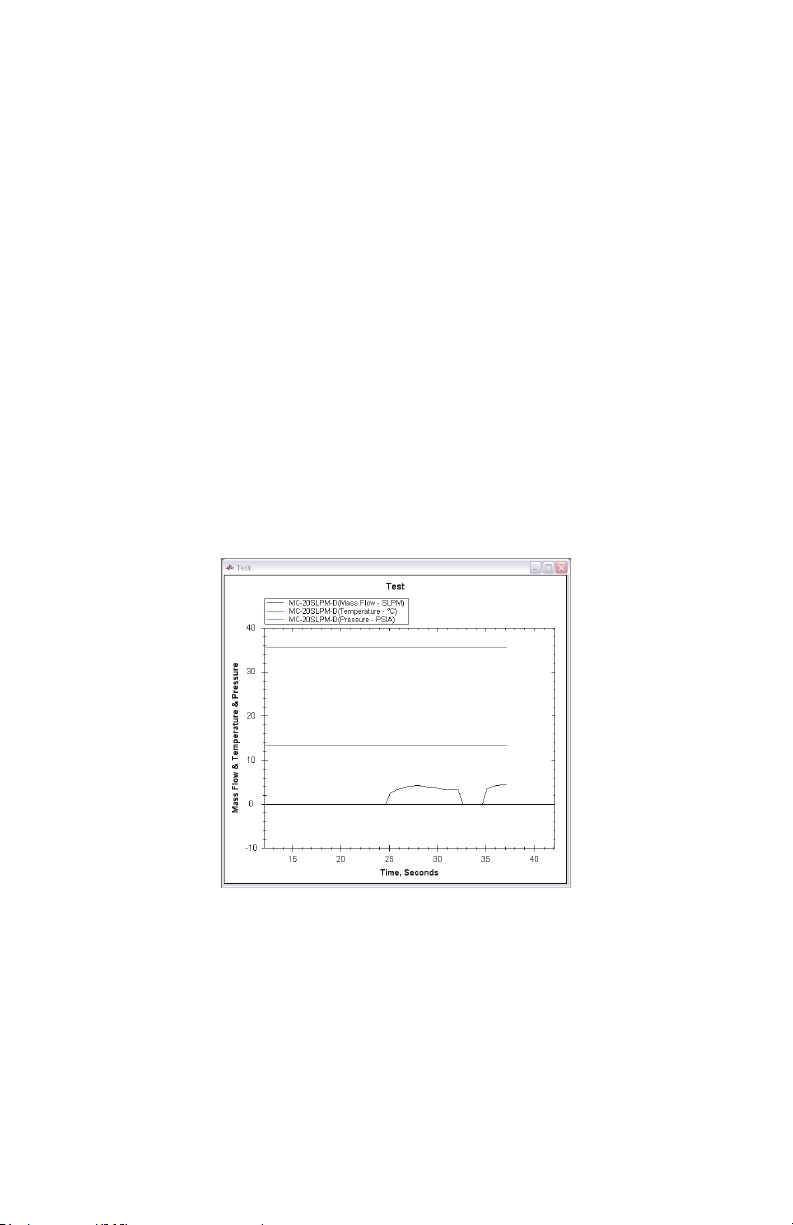
Double click on your chart and it will bring up a window charting your selected
series.
Charting is done based on units of time in seconds. The Y axis will scale
according to the parameter with the largest integer measurement. In this
case, it is temperature.
Please note: You cannot save/export a chart setting. Once the chart is
removed from the Chart module, it will need to be redone if you would like
to chart the same series.
The Chart module will allow you to modify an existing chart using the
“Modify” button or to delete an existing chart by using the “Remove” button.
You can also “Refresh” the list if a previously added chart does not appear
on the list.
22
Page 23
Scripts
Scripts allow users to create automated command sets based on time.
You can program Flow Vision™ SC to send specic commands to your
connected ow instruments at specied time intervals.
To create a script, you will rst need to access the Script module tab. If you
do not see the Script module refer to section 2 (page 11) for instruction on
how to make the Script module visible.
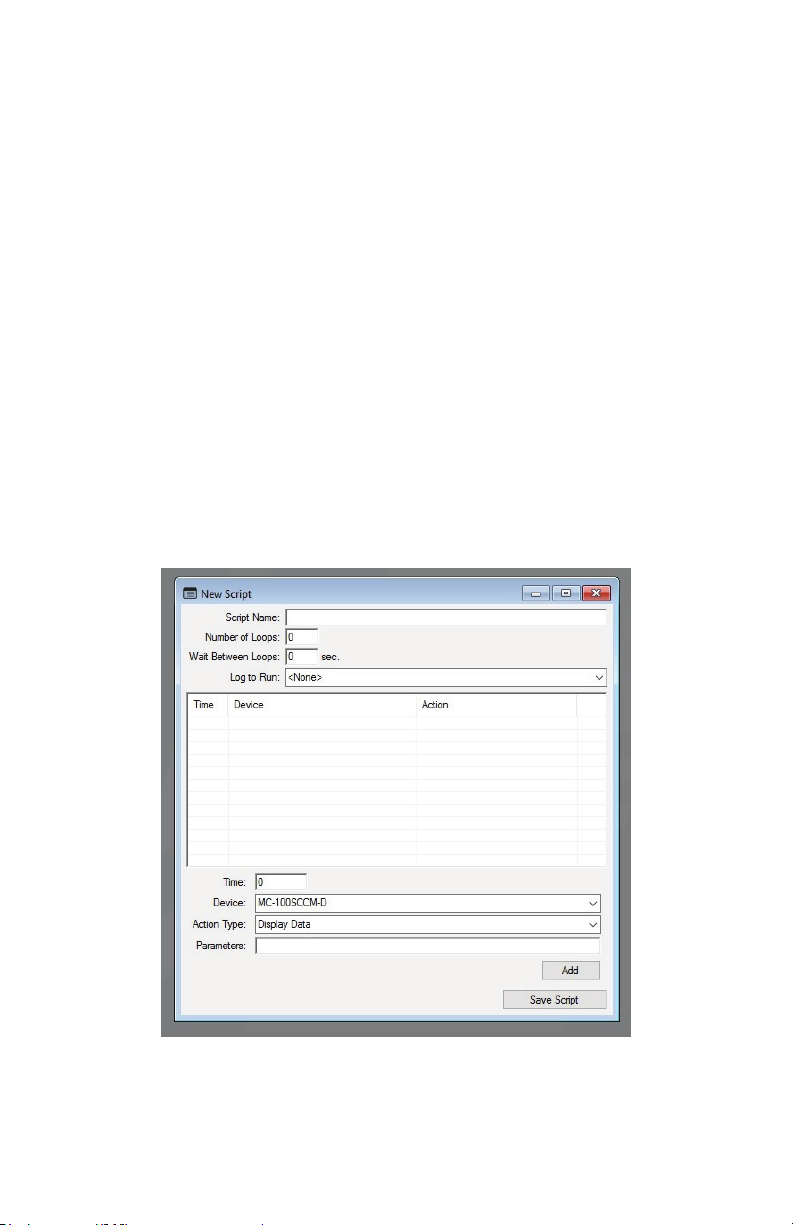
Once you have accessed the Script module, click “Add” to bring up the
New Script window.
At the top of the window, in the box to the right of “Script Name”, name the
script you are building. You can name the script anything you would like.
Next, add commands by device, action, and parameters (depends on
action).
You can also add a Log to run with the script.
Note: The common value among all the script functions is Execution Time.
The Execution Time is the time (in seconds) at which the address change
should take place from the start of the script.
23
Page 24

Descriptions of Simple Script Commands
Display Data
This will display a data frame.
Change Set-point (Scale Units)
The Change Set-point (Scale Units) command lets you change the setpoint of the instrument as a function of the unit’s scale. Selecting this
command will cause an Input window to appear that requires input of
Execution Time (in seconds) and Scale Units.
Please note: The Change Set-point (Scale Units) function is only available
with controllers.
Change Set-point (% of Full Scale)
The Change Set-point (% of Full Scale) command allows you to change
the set-point of the instrument as a function of percentage (0 - 100%).
Selecting this command will cause an Input window to appear that
requires input of Execution Time (in seconds) and % of Full Scale. It is not
necessary to use the “%” symbol when populating the Parameter Value.
Please note: The Change Set-point (% of Full Scale) function is only
available with controllers.
Tare
The tare function is used to set the zero on the instrument. Tare only when
there is no gas ow going to the unit. The tare function is discussed in detail
in the instruction manual that accompanied your instrument. Choosing the
tare function will cause an Input window to appear that requires input of
Execution Time (in seconds).
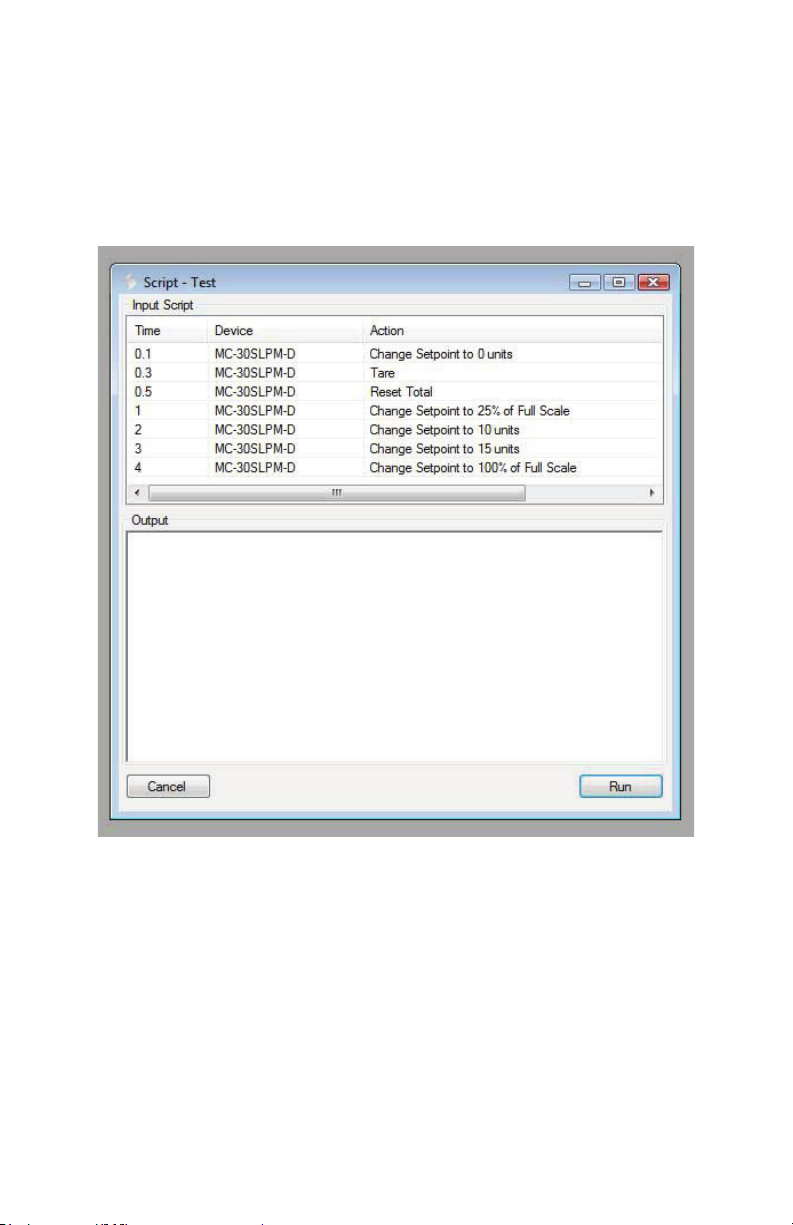
Sample Script
Below is a sample script that will cause a ow controller to:
1. Change the set-point to 0 at .1 seconds from start (controllers only)
2. Tare at .3 seconds from start
3. Change the set-point to 25% at 1 seconds from start (controllers only)
4. Change the set-point to 10SLPM at 2 seconds from start (controllers only)
5. Change the set-point to 15SLPM at 3 seconds from start (controllers only)
6. Change the set-point to 100% at 4 seconds from start (controllers only)
Once you have completed a script, you can review your selections. If you
decide you don’t want particular steps, they can be removed by selecting
the specic step(s) and then clicking the “Remove Selected” button.
Finally, click the “Save” button to save the script into the Script module tab.
24
Page 25
Running the Script
To run the script, access the Script module tab and double-click the script
you would like to run.
In this example, it is the script that was just saved.
Once you have double-clicked on the script, a window will appear that will
allow you to run the script and monitor the results of each command.
Click the “Run” button to run the script. In the Output box on the bottom
half of the screen, you will see a verication of each function as it takes
place.
At the end of the script, the instrument will remain as it was after the last
command in the script.
25
Page 26
Terminals
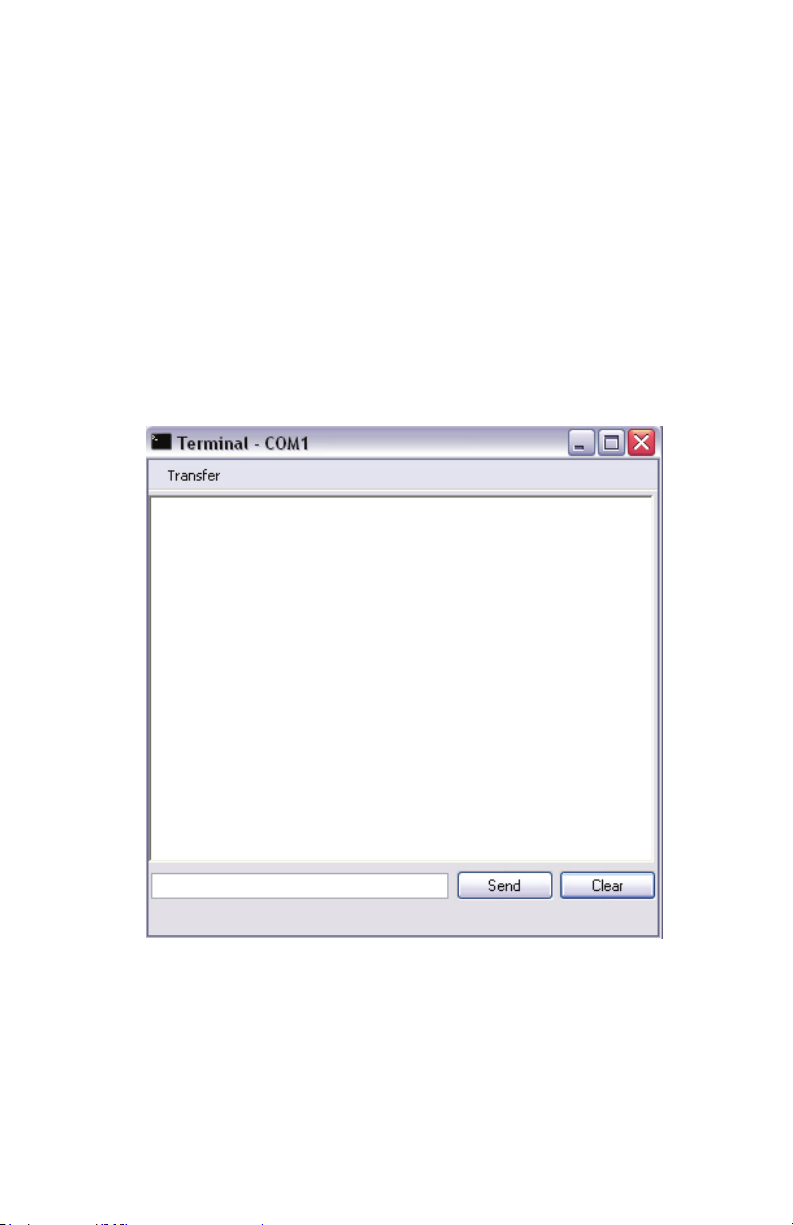
The Terminals module allows communication with the device through an
ASCII terminal without leaving the Flow Vision™ SC program.
To begin a terminal session, you will need to open the Terminal module
tab. If you do not see the Terminal module tab refer to section 2 (page 11)
for instruction on how to make the Terminal module visible.
Upon accessing the Terminal module tab, you will see the communication
port to which your unit is attached.
Begin the terminal session by double clicking on the communication port
to which the instrument you would like to poll is connected.
A window will appear that will allow you to communicate with the instrument
as you would via a terminal window.
26
Page 27
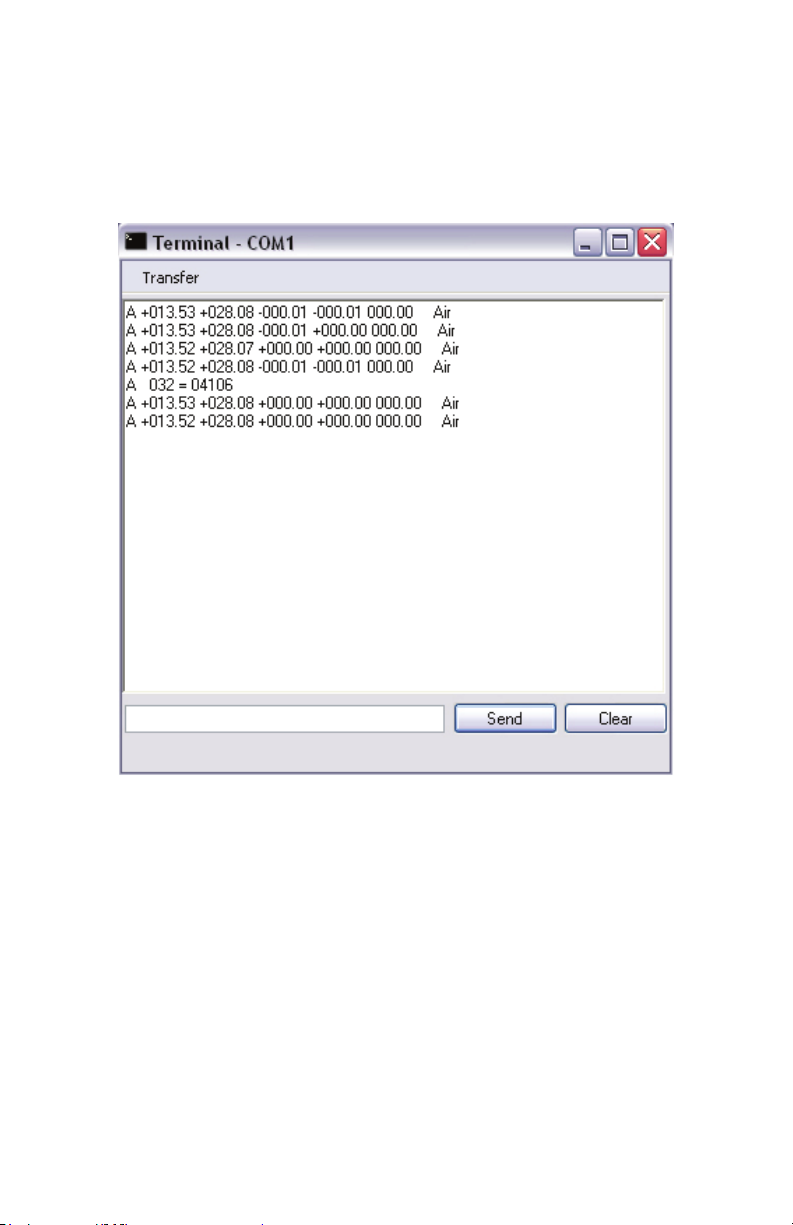
Please refer to the instruction manual that accompanied your instrument
for instructions on communicating with a unit via a terminal window.
You will not have to worry about connection settings as this is done through
Flow Vision™ SC if the device has been identied by Flow Vision™ SC as
a connected and available device.
Uninstalling Flow Vision™ SC
To uninstall Flow Vision™ SC use the Add and Remove Programs function
from your Windows® control panel. Flow Vision™ SC can be selected from
the program group and uninstalled. If you are unfamiliar with the Add and
Remove Programs function of your Windows® software please consult
your system administrator or refer to your Windows® operating manual.
27
Page 28

Troubleshooting and FAQs
If you have Flow Vision™ SC installed and running, the Help Menu
(page 12)may provide the answer you are looking for.
My Alicat device will not connect to Flow Vision™ SC.
1. Check all connections between Alicat device and computer.
2. Make sure Alicat unit is powered.
3. Make sure Alicat unit communication is set to 19,200 baud.
4. Verify that the communication cable is built correctly and installed
properly.
5. Verify that a connection can be made with the computer using
Windows® HyperTerminal® and following the instructions in the
manual that accompanied your ow device.
Flow Vision™ SC will not start when I connect the ash drive.
Your computer may not be able to run the autorun script. Try to run the
Flow Vision™ SC setup.exe program from the drive directory using
Windows
®
Explorer
®
Flow Vision™ SC will not install properly.
1. Verify that your computer meets the minimum requirements to run
Flow Vision™ SC.
2. If your computer meets the requirements and the problem persists
please contact Alicat directly for support.
The process information displayed on my Alicat device and on the
Flow Vision™ SC screen don’t always match.
In the congure menu the polling rate will dictate how often the Flow
Vision™ SC screen is updated.
Flow Vision™ SC and the display on my Alicat device don’t always
match at zero ow.
The Alicat ow device comes with programming to help stabilize the
display at zero ow. The Flow Vision™ SC display will not have this
stabilization feature and will show minute uctuations at zero, while the
device’s display will be a solid zero. This slight difference in reading is
normal.
I can’t nd my captured ow data.
Click on the Script. Choose open folder.
28
Page 29

Contact Information
For more information regarding this or any Alicat product, please contact:
Alicat Scientic, Inc
7641 N Business Park Drive
Tucson, Arizona 85743
USA
Ph: 520-290-6060
888-290-6060
Fax: 520-290-0109
email: [email protected]
Web site: www.alicat.com
Notice: Alicat Scientic, Inc. reserves the right to make any changes and
improvements to the products described in this manual at any time and
without notice. This manual is copyrighted. This document may not, in
whole or in part, be copied, reproduced, translated, or converted to any
electronic medium or machine readable form, for commercial purposes,
without prior written consent from the copyright holder.
Note: Although we provide assistance on Alicat Scientic products both
personally and through our literature, it is the complete responsibility of the
user to determine the suitability of any product to their application.
The manufacturer does not warrant or assume responsibility for the use of
its products in life support applications or systems.
29
Page 30
alicat.com The Fastest Flow Controller Company in the World!
SCIH 1000.00 = 0.2732 SLPM SLPM 1.00 = 3660.7688 SCIH
Flow Conversions:
18 Xenon Xe 229.8483 5.3950 0.9947
19 Sulfur Hexauoride SF6 153.5320 6.0383 0.9887
SCFM 1.00 = 28.3160 SLPM SLPM 100.00 = 3.5316 SCFM
SCFH 1.00 = 0.4719 SLPM SLPM 100.00 = 211.9093 SCFH
SCIM 100.00 = 1.6390 SLPM SLPM 1.00 = 61.0128 SCIM
Phone: 888-290-6060 Fax: 520-290-0109
16 iso-Butane i-C4H10 74.7846 2.4403 0.9735
17 Krypton Kr 251.3249 3.4323 0.9979
14 Acetylene C2H2 104.4480 1.0720 0.9928
15 Ethylene C2H4 103.1839 1.1533 0.9943
Reference: NIST REFPROP 9 Database
12 Propane C3H8 81.4631 1.8320 0.9838
13 normal-Butane n-C4H10 74.0536 2.4493 0.9699
29 95% Ar / 5% CH4 P-5 223.9106 1.5850 0.9993
*i
n micropoise (1 Poise = gram / (cm) (sec)) **Grams/Liter
10 Neon Ne 311.1264 0.8244 1.0005
11 Oxygen O2 205.5021 1.3088 0.9994
Stargon® CS
8 Nitrogen N2 178.0474 1.1453 0.9998
9 Nitrous Oxide N2O 148.4124 1.8089 0.9945
28
27
90% Ar / 8% CO2 /
Helistar® A1025
2.5% CO2
2% O2
6 Hydrogen H2 89.1535 0.08235 1.0006
7 Helium He 198.4561 0.16353 1.0005
26 75% He / 25% Ar HE-25 234.6860 0.5308 1.0002
90% He / 7.5% Ar /
4 Carbon Dioxide CO2 149.3184 1.8080 0.9950
5 Ethane C2H6 93.5412 1.2385 0.9924
25 75% Ar / 25% He HE-75 231.6056 1.2660 0.9997
24 75% CO2 / 25% Ar C-75 168.2250 1.7634 0.9966
2 Methane CH4 110.7595 0.6569 0.9982
3 Carbon Monoxide CO 176.4933 1.1453 0.9996
23 98% Ar / 2% CO2 C-2 224.7148 1.6373 0.9993
22 92% Ar / 8% CO2 C-8 220.1352 1.6475 0.9992
0 Air Air 184.8989 1.1840 0.9997
1 Argon Ar 226.2399 1.6339 0.9994
21 90% Ar / 10% CO2 C-10 218.6026 1.6509 0.9991
20 75%Ar / 25% CO2 C-25 206.9763 1.6766 0.9987
# Gas
Gas Viscosity, Density and Compressibility:
Viscosity*
Absolute
25°C
14.696PSIA
Density **
25°C
Compressibility
14.696PSIA
25°C
# Gas
7641 N Business Park Drive
Tucson AZ 85743 USA
Star29 219.7934 1.6410 0.9992
A1025 214.9760 0.3146 1.0003
Viscosity*
Absolute
25°C
14.696PSIA
Density **
25°C
Compressibility
14.696PSIA
25°C
 Loading...