

Page 1

OmniVista SafeGuard
Manager
Release 3.0
Administration Guide
PART NUMBER: 005-0034 REV A1
UBLISHED: MARCH 2007
P
A
LCATEL-LUCENT
26801 WEST AGOURA ROAD
CALABASAS, CA 91301 USA
(818) 880-3500
WWW.ALCATEL-LUCENT.COM
Page 2

Alcatel-Lucent Proprietary
Copyright © 2007 Alcatel-Lucent. All rights reserved. This document may not be reproduced in whole
or in part without the expressed written permission Alcatel-Lucent. Alcatel-Lucent ® and the AlcatelLucent logo are registered trademarks of Alcatel-Lucent. All other trademarks are the property of their
respective owners.
2
OmniVista SafeGuard Manager Administration Guide
Page 3

Contents
Preface
About This Guide. . . . . . . . . . . . . . . . . . . . . . . . . . . . . . . . . . . . . . . . . . . . . . . . . . . . . . . . . . . . . . . . . . .8
Intended Audience . . . . . . . . . . . . . . . . . . . . . . . . . . . . . . . . . . . . . . . . . . . . . . . . . . . . . . . . . . . . . 8
Guide Overview . . . . . . . . . . . . . . . . . . . . . . . . . . . . . . . . . . . . . . . . . . . . . . . . . . . . . . . . . . . . . . . .8
Conventions Used in This Guide . . . . . . . . . . . . . . . . . . . . . . . . . . . . . . . . . . . . . . . . . . . . . . . . . . . . . .9
Related Documentation . . . . . . . . . . . . . . . . . . . . . . . . . . . . . . . . . . . . . . . . . . . . . . . . . . . . . . . . . . .10
Additional Resources . . . . . . . . . . . . . . . . . . . . . . . . . . . . . . . . . . . . . . . . . . . . . . . . . . . . . . . . . . . 10
Chapter 1: Getting Started
Overview . . . . . . . . . . . . . . . . . . . . . . . . . . . . . . . . . . . . . . . . . . . . . . . . . . . . . . . . . . . . . . . . . . . . . . . . 12
Key Features . . . . . . . . . . . . . . . . . . . . . . . . . . . . . . . . . . . . . . . . . . . . . . . . . . . . . . . . . . . . . . . . . . . . .12
Getting Started . . . . . . . . . . . . . . . . . . . . . . . . . . . . . . . . . . . . . . . . . . . . . . . . . . . . . . . . . . . . . . . . . . . 14
System Requirements. . . . . . . . . . . . . . . . . . . . . . . . . . . . . . . . . . . . . . . . . . . . . . . . . . . . . . . . . . . 14
OmniVista SafeGuard Manager Client Requirements. . . . . . . . . . . . . . . . . . . . . . . . . . . . . . . . 15
Starting the Server . . . . . . . . . . . . . . . . . . . . . . . . . . . . . . . . . . . . . . . . . . . . . . . . . . . . . . . . . . . . . 16
Installing the Client. . . . . . . . . . . . . . . . . . . . . . . . . . . . . . . . . . . . . . . . . . . . . . . . . . . . . . . . . . . . .16
Logging In to the Client. . . . . . . . . . . . . . . . . . . . . . . . . . . . . . . . . . . . . . . . . . . . . . . . . . . . . . . . .18
Navigation. . . . . . . . . . . . . . . . . . . . . . . . . . . . . . . . . . . . . . . . . . . . . . . . . . . . . . . . . . . . . . . . . . . . . . .20
Dashboards. . . . . . . . . . . . . . . . . . . . . . . . . . . . . . . . . . . . . . . . . . . . . . . . . . . . . . . . . . . . . . . . . . .20
Menus. . . . . . . . . . . . . . . . . . . . . . . . . . . . . . . . . . . . . . . . . . . . . . . . . . . . . . . . . . . . . . . . . . . . . . . .21
Page Bar . . . . . . . . . . . . . . . . . . . . . . . . . . . . . . . . . . . . . . . . . . . . . . . . . . . . . . . . . . . . . . . . . . . . .21
Action Bar . . . . . . . . . . . . . . . . . . . . . . . . . . . . . . . . . . . . . . . . . . . . . . . . . . . . . . . . . . . . . . . . . . . . 22
Viewing Tips . . . . . . . . . . . . . . . . . . . . . . . . . . . . . . . . . . . . . . . . . . . . . . . . . . . . . . . . . . . . . . . . . . . . . .23
Modifying Your Password. . . . . . . . . . . . . . . . . . . . . . . . . . . . . . . . . . . . . . . . . . . . . . . . . . . . . . . . . . . 24
Adding a Device. . . . . . . . . . . . . . . . . . . . . . . . . . . . . . . . . . . . . . . . . . . . . . . . . . . . . . . . . . . . . . . . . . 25
Chapter 2: Installation and Setup
Installing the OmniVista SafeGuard Manager Server. . . . . . . . . . . . . . . . . . . . . . . . . . . . . . . . . . . .30
Upgrading the OmniVista SafeGuard Manager Server . . . . . . . . . . . . . . . . . . . . . . . . . . . . . . . . . .33
Pre-Upgrade Tasks . . . . . . . . . . . . . . . . . . . . . . . . . . . . . . . . . . . . . . . . . . . . . . . . . . . . . . . . . . . . .33
Uninstalling the Server. . . . . . . . . . . . . . . . . . . . . . . . . . . . . . . . . . . . . . . . . . . . . . . . . . . . . . . . . . . . . .34
Starting the Server. . . . . . . . . . . . . . . . . . . . . . . . . . . . . . . . . . . . . . . . . . . . . . . . . . . . . . . . . . . . . . . . . 36
Shutting Down the Server. . . . . . . . . . . . . . . . . . . . . . . . . . . . . . . . . . . . . . . . . . . . . . . . . . . . . . . . . . .36
OmniVista SafeGuard Manager Administration Guide
3
Page 4

Contents
Installing the OmniVista SafeGuard Manager Client . . . . . . . . . . . . . . . . . . . . . . . . . . . . . . . . . . . .37
Logging into the OmniVista SafeGuard Manager Client. . . . . . . . . . . . . . . . . . . . . . . . . . . . . . . . . 39
Connecting Over Firewall . . . . . . . . . . . . . . . . . . . . . . . . . . . . . . . . . . . . . . . . . . . . . . . . . . . . . . . . . .41
Chapter 3: General Navigation
Viewing Visualization Tables . . . . . . . . . . . . . . . . . . . . . . . . . . . . . . . . . . . . . . . . . . . . . . . . . . . . . . . .44
Viewing Table Data . . . . . . . . . . . . . . . . . . . . . . . . . . . . . . . . . . . . . . . . . . . . . . . . . . . . . . . . . . . . 45
Navigating between Different Table Views. . . . . . . . . . . . . . . . . . . . . . . . . . . . . . . . . . . . . . . . . . . .47
Choosing Columns in a Table . . . . . . . . . . . . . . . . . . . . . . . . . . . . . . . . . . . . . . . . . . . . . . . . . . . . . . .48
Searching and Sorting . . . . . . . . . . . . . . . . . . . . . . . . . . . . . . . . . . . . . . . . . . . . . . . . . . . . . . . . . . . . . 50
Searching Table Data Locally. . . . . . . . . . . . . . . . . . . . . . . . . . . . . . . . . . . . . . . . . . . . . . . . . . . .51
Sorting Table Data Locally. . . . . . . . . . . . . . . . . . . . . . . . . . . . . . . . . . . . . . . . . . . . . . . . . . . . . . .51
Searching and Sorting Data in the Entire Database . . . . . . . . . . . . . . . . . . . . . . . . . . . . . . . . . 52
Exporting and Printing Data. . . . . . . . . . . . . . . . . . . . . . . . . . . . . . . . . . . . . . . . . . . . . . . . . . . . . . . . .53
Using the Status Bar. . . . . . . . . . . . . . . . . . . . . . . . . . . . . . . . . . . . . . . . . . . . . . . . . . . . . . . . . . . . . . . .54
Chapter 4: Visualization
Overview . . . . . . . . . . . . . . . . . . . . . . . . . . . . . . . . . . . . . . . . . . . . . . . . . . . . . . . . . . . . . . . . . . . . . . . . 56
Dashboards . . . . . . . . . . . . . . . . . . . . . . . . . . . . . . . . . . . . . . . . . . . . . . . . . . . . . . . . . . . . . . . . . . . . . .57
Security Incidents . . . . . . . . . . . . . . . . . . . . . . . . . . . . . . . . . . . . . . . . . . . . . . . . . . . . . . . . . . . . . . 57
User Sessions with Incidents . . . . . . . . . . . . . . . . . . . . . . . . . . . . . . . . . . . . . . . . . . . . . . . . . . . . . .62
Network Awareness . . . . . . . . . . . . . . . . . . . . . . . . . . . . . . . . . . . . . . . . . . . . . . . . . . . . . . . . . . . . 63
Configuring Dashboards . . . . . . . . . . . . . . . . . . . . . . . . . . . . . . . . . . . . . . . . . . . . . . . . . . . . . . . . . . . 68
Defining Modules within a Dashboard. . . . . . . . . . . . . . . . . . . . . . . . . . . . . . . . . . . . . . . . . . . . .69
Defining Bars within a Module. . . . . . . . . . . . . . . . . . . . . . . . . . . . . . . . . . . . . . . . . . . . . . . . . . . .76
Viewing Visualization Data . . . . . . . . . . . . . . . . . . . . . . . . . . . . . . . . . . . . . . . . . . . . . . . . . . . . . . . . . 78
Viewing Policy Incidents . . . . . . . . . . . . . . . . . . . . . . . . . . . . . . . . . . . . . . . . . . . . . . . . . . . . . . . .79
Viewing Malware Incidents. . . . . . . . . . . . . . . . . . . . . . . . . . . . . . . . . . . . . . . . . . . . . . . . . . . . . . 81
Viewing Posture Incidents . . . . . . . . . . . . . . . . . . . . . . . . . . . . . . . . . . . . . . . . . . . . . . . . . . . . . . .84
Viewing User Sessions. . . . . . . . . . . . . . . . . . . . . . . . . . . . . . . . . . . . . . . . . . . . . . . . . . . . . . . . . . .85
Viewing Application Types . . . . . . . . . . . . . . . . . . . . . . . . . . . . . . . . . . . . . . . . . . . . . . . . . . . . . . 87
Viewing Application Instances . . . . . . . . . . . . . . . . . . . . . . . . . . . . . . . . . . . . . . . . . . . . . . . . . . . 88
Viewing Application Flows . . . . . . . . . . . . . . . . . . . . . . . . . . . . . . . . . . . . . . . . . . . . . . . . . . . . . .90
Creating Policy Filters. . . . . . . . . . . . . . . . . . . . . . . . . . . . . . . . . . . . . . . . . . . . . . . . . . . . . . . . . . .91
Viewing Time-based Data . . . . . . . . . . . . . . . . . . . . . . . . . . . . . . . . . . . . . . . . . . . . . . . . . . . . . . . . . . 93
Additional Time-based Filtering . . . . . . . . . . . . . . . . . . . . . . . . . . . . . . . . . . . . . . . . . . . . . . . . . . 94
Viewing Active Data Against Historical Data. . . . . . . . . . . . . . . . . . . . . . . . . . . . . . . . . . . . . . . 95
4
OmniVista SafeGuard Manager Administration Guide
Page 5

Chapter 5: Device Configuration
Managing Devices . . . . . . . . . . . . . . . . . . . . . . . . . . . . . . . . . . . . . . . . . . . . . . . . . . . . . . . . . . . . . . . .98
Checking a Device . . . . . . . . . . . . . . . . . . . . . . . . . . . . . . . . . . . . . . . . . . . . . . . . . . . . . . . . . . . .98
Adding a New Device. . . . . . . . . . . . . . . . . . . . . . . . . . . . . . . . . . . . . . . . . . . . . . . . . . . . . . . . . .98
Configuring Device Objects . . . . . . . . . . . . . . . . . . . . . . . . . . . . . . . . . . . . . . . . . . . . . . . . . . . . . . .103
Application Groups . . . . . . . . . . . . . . . . . . . . . . . . . . . . . . . . . . . . . . . . . . . . . . . . . . . . . . . . . . . 103
Application Filters . . . . . . . . . . . . . . . . . . . . . . . . . . . . . . . . . . . . . . . . . . . . . . . . . . . . . . . . . . . . . 105
Network Zones . . . . . . . . . . . . . . . . . . . . . . . . . . . . . . . . . . . . . . . . . . . . . . . . . . . . . . . . . . . . . . .107
Policies . . . . . . . . . . . . . . . . . . . . . . . . . . . . . . . . . . . . . . . . . . . . . . . . . . . . . . . . . . . . . . . . . . . . . .109
Role Derivations . . . . . . . . . . . . . . . . . . . . . . . . . . . . . . . . . . . . . . . . . . . . . . . . . . . . . . . . . . . . . .119
Roles. . . . . . . . . . . . . . . . . . . . . . . . . . . . . . . . . . . . . . . . . . . . . . . . . . . . . . . . . . . . . . . . . . . . . . . .122
LDAP Servers . . . . . . . . . . . . . . . . . . . . . . . . . . . . . . . . . . . . . . . . . . . . . . . . . . . . . . . . . . . . . . . . .125
Editing Device Objects. . . . . . . . . . . . . . . . . . . . . . . . . . . . . . . . . . . . . . . . . . . . . . . . . . . . . . . . . . . .127
Editing Interfaces . . . . . . . . . . . . . . . . . . . . . . . . . . . . . . . . . . . . . . . . . . . . . . . . . . . . . . . . . . . . . 131
Templates. . . . . . . . . . . . . . . . . . . . . . . . . . . . . . . . . . . . . . . . . . . . . . . . . . . . . . . . . . . . . . . . . . . . . . . 132
Creating a New Template. . . . . . . . . . . . . . . . . . . . . . . . . . . . . . . . . . . . . . . . . . . . . . . . . . . . . .133
Importing Templates . . . . . . . . . . . . . . . . . . . . . . . . . . . . . . . . . . . . . . . . . . . . . . . . . . . . . . . . . .134
Contents
Deleting an Existing Device . . . . . . . . . . . . . . . . . . . . . . . . . . . . . . . . . . . . . . . . . . . . . . . . . . . . . . . . 136
Polling a Device . . . . . . . . . . . . . . . . . . . . . . . . . . . . . . . . . . . . . . . . . . . . . . . . . . . . . . . . . . . . . .137
Synchronizing a Device . . . . . . . . . . . . . . . . . . . . . . . . . . . . . . . . . . . . . . . . . . . . . . . . . . . . . . . . . . .137
Manually Synchronizing a Device . . . . . . . . . . . . . . . . . . . . . . . . . . . . . . . . . . . . . . . . . . . . . . . 138
Device Actions . . . . . . . . . . . . . . . . . . . . . . . . . . . . . . . . . . . . . . . . . . . . . . . . . . . . . . . . . . . . . . . . . .138
Manage Configuration . . . . . . . . . . . . . . . . . . . . . . . . . . . . . . . . . . . . . . . . . . . . . . . . . . . . . . . .139
Manage Files. . . . . . . . . . . . . . . . . . . . . . . . . . . . . . . . . . . . . . . . . . . . . . . . . . . . . . . . . . . . . . . . .144
Reboot Device . . . . . . . . . . . . . . . . . . . . . . . . . . . . . . . . . . . . . . . . . . . . . . . . . . . . . . . . . . . . . . .149
Refresh . . . . . . . . . . . . . . . . . . . . . . . . . . . . . . . . . . . . . . . . . . . . . . . . . . . . . . . . . . . . . . . . . . . . . .150
Other Actions. . . . . . . . . . . . . . . . . . . . . . . . . . . . . . . . . . . . . . . . . . . . . . . . . . . . . . . . . . . . . . . . . . . .152
Execute Show Commands . . . . . . . . . . . . . . . . . . . . . . . . . . . . . . . . . . . . . . . . . . . . . . . . . . . . .153
ICS Admin . . . . . . . . . . . . . . . . . . . . . . . . . . . . . . . . . . . . . . . . . . . . . . . . . . . . . . . . . . . . . . . . . . .154
Delete Visualization Data . . . . . . . . . . . . . . . . . . . . . . . . . . . . . . . . . . . . . . . . . . . . . . . . . . . . . .154
Update Template. . . . . . . . . . . . . . . . . . . . . . . . . . . . . . . . . . . . . . . . . . . . . . . . . . . . . . . . . . . . .155
Discard Non-template Changes . . . . . . . . . . . . . . . . . . . . . . . . . . . . . . . . . . . . . . . . . . . . . . . .156
Understanding Device Management Display. . . . . . . . . . . . . . . . . . . . . . . . . . . . . . . . . . . . . . . . . 157
Recommended Device Management Workflow. . . . . . . . . . . . . . . . . . . . . . . . . . . . . . . . . . . . . .159
Chapter 6: Query and Reports
Query . . . . . . . . . . . . . . . . . . . . . . . . . . . . . . . . . . . . . . . . . . . . . . . . . . . . . . . . . . . . . . . . . . . . . . . . . .162
Reports . . . . . . . . . . . . . . . . . . . . . . . . . . . . . . . . . . . . . . . . . . . . . . . . . . . . . . . . . . . . . . . . . . . . . . . . .166
Defining a Report . . . . . . . . . . . . . . . . . . . . . . . . . . . . . . . . . . . . . . . . . . . . . . . . . . . . . . . . . . . . .166
Scheduling a Report . . . . . . . . . . . . . . . . . . . . . . . . . . . . . . . . . . . . . . . . . . . . . . . . . . . . . . . . . .169
Generating a Report . . . . . . . . . . . . . . . . . . . . . . . . . . . . . . . . . . . . . . . . . . . . . . . . . . . . . . . . . . 170
OmniVista SafeGuard Manager Administration Guide
5
Page 6

Contents
Chapter 7: Managing the Server
User Authentication . . . . . . . . . . . . . . . . . . . . . . . . . . . . . . . . . . . . . . . . . . . . . . . . . . . . . . . . . . . . . .174
Authentication Guidelines. . . . . . . . . . . . . . . . . . . . . . . . . . . . . . . . . . . . . . . . . . . . . . . . . . . . . . 175
User Accounts . . . . . . . . . . . . . . . . . . . . . . . . . . . . . . . . . . . . . . . . . . . . . . . . . . . . . . . . . . . . . . . . . . . 176
Adding a New User . . . . . . . . . . . . . . . . . . . . . . . . . . . . . . . . . . . . . . . . . . . . . . . . . . . . . . . . . . . 177
Enabling Dual-Admin or 4-Eye Mode. . . . . . . . . . . . . . . . . . . . . . . . . . . . . . . . . . . . . . . . . . . . .178
File Repository . . . . . . . . . . . . . . . . . . . . . . . . . . . . . . . . . . . . . . . . . . . . . . . . . . . . . . . . . . . . . . . . . . . 179
Client Settings . . . . . . . . . . . . . . . . . . . . . . . . . . . . . . . . . . . . . . . . . . . . . . . . . . . . . . . . . . . . . . . . . . .182
Server Settings . . . . . . . . . . . . . . . . . . . . . . . . . . . . . . . . . . . . . . . . . . . . . . . . . . . . . . . . . . . . . . . . . . .183
Setting Visualization Filters . . . . . . . . . . . . . . . . . . . . . . . . . . . . . . . . . . . . . . . . . . . . . . . . . . . . . .183
Exporting the Database. . . . . . . . . . . . . . . . . . . . . . . . . . . . . . . . . . . . . . . . . . . . . . . . . . . . . . . .186
Purging the Database . . . . . . . . . . . . . . . . . . . . . . . . . . . . . . . . . . . . . . . . . . . . . . . . . . . . . . . . .188
Backing Up the Database. . . . . . . . . . . . . . . . . . . . . . . . . . . . . . . . . . . . . . . . . . . . . . . . . . . . . .189
Restoring the Database. . . . . . . . . . . . . . . . . . . . . . . . . . . . . . . . . . . . . . . . . . . . . . . . . . . . . . . .191
Mailing Malware and Report Notifications . . . . . . . . . . . . . . . . . . . . . . . . . . . . . . . . . . . . . . . .192
Periodic Tasks . . . . . . . . . . . . . . . . . . . . . . . . . . . . . . . . . . . . . . . . . . . . . . . . . . . . . . . . . . . . . . . .194
General . . . . . . . . . . . . . . . . . . . . . . . . . . . . . . . . . . . . . . . . . . . . . . . . . . . . . . . . . . . . . . . . . . . . .195
Chapter 8: Audit Logs and Statistics
Audit Logs . . . . . . . . . . . . . . . . . . . . . . . . . . . . . . . . . . . . . . . . . . . . . . . . . . . . . . . . . . . . . . . . . . . . . . 198
OmniVista SafeGuard Manager Log Messages . . . . . . . . . . . . . . . . . . . . . . . . . . . . . . . . . . . .199
Device Health . . . . . . . . . . . . . . . . . . . . . . . . . . . . . . . . . . . . . . . . . . . . . . . . . . . . . . . . . . . . . . . . . . .201
Viewing Device Health Statistics. . . . . . . . . . . . . . . . . . . . . . . . . . . . . . . . . . . . . . . . . . . . . . . . .202
Server Health . . . . . . . . . . . . . . . . . . . . . . . . . . . . . . . . . . . . . . . . . . . . . . . . . . . . . . . . . . . . . . . . . . . .204
Viewing Server Health Statistics . . . . . . . . . . . . . . . . . . . . . . . . . . . . . . . . . . . . . . . . . . . . . . . . .205
Index
6
OmniVista SafeGuard Manager Administration Guide
Page 7

Preface
In this preface:
■ About This Guide
■ Conventions Used in This Guide
■ Related Documentation
Page 8

Preface
About This Guide
This guide describes the OmniVista SafeGuard Manager command center features,
including how to use and navigate through different views. This guide also provides
detailed installation procedures for the server and client.
Intended Audience
The OmniVista SafeGuard Manager Administration Guide is for experienced network
administrators who are responsible for installing, configuring, and maintaining the
Alcatel-Lucent devices and OmniVista SafeGuard Manager command center.
Guide Overview
The information in this guide is separated into several chapters to make it easy for you to
find exactly what you are looking for.
Chapter Description
Chapter 1, Getting Started Provides installation procedures and a brief overview
of the key features of the OmniVista SafeGuard
Manager command center.
Chapter 2, Installation and
Setup
Chapter 3, General
Navigation
Chapter 4, Visualization Describes the configuration of dashboards and the
Chapter 5, Device
Configuration
Chapter 6, Query and Reports Describes the creation, printing, and viewing of
Chapter 7, Managing the
Server
Provides detailed installation and setup instructions.
Describes different navigation techniques such as,
search and sorting.
checking of user activity, health of the host system,
violation histories, and other network activity.
Provides instructions for configuring device objects
and templates.
reports on network traffic and incidents.
Describes client settings, user accounts, and user
authentication. Additionally, it describes server
settings: how to restore, purge, or back up the
database and set up the OmniVista SafeGuard
Manager mailer so email notifications can be sent
on Malware events and reports.
Chapter 8, Audit Logs and
Statistics
8
Provides audit log information and device and
server health and statistics.
OmniVista SafeGuard Manager Administration Guide
Page 9
Conventions Used in This Guide
This document uses the following conventions:
Italic Italics are used the first time a glossary term is introduced,
for the titles of books, and for menu items.
■ Bulleted lists Bulleted lists designate items of equal importance.
1 Numbered lists Numbered lists designate a specific sequence of steps
required to complete a procedure.
Boldface type Boldface type is used for button names.
Code Code excerpts and command line sequences are
shown in this type face.
Ellipsis.... Is used in code and argument syntax to indicate that
inconsequential information is not shown.
Preface
NOTE: Means readers pay special attention to the information. Notes contain
helpful suggestions or references to materials covered in the guide.
CAUTION: Informs users to be careful of situation described in
Cautions. In this situation, you could do something that could result
in deletion of information or damage of equipment.
WARNING: Informs users of safety conditions. In this situation, you
could do something that could result in bodily injury or electric
shock.
OmniVista SafeGuard Manager Administration Guide
9
Page 10

Preface
Related Documentation
■
OmniAccess SafeGuard Controller Installation Guide
Describes the OmniAccess SafeGuard Controller. The guide provides detailed
installation instructions and technical specifications for the OmniAccess
SafeGuard Controller.
■
OmniAccess SafeGuard OS Administration Guide
Provides concepts and configuration instructions for the major features of
OmniAccess SafeGuard OS and its supported products, which includes End Point
Validation (EPV) the integral component for using ICS.
■
ICS Dissolvable Agent for SafeGuard Administration Guide
Describes how to configure the Integrity Clientless Security (ICS) module of the
Alcatel-Lucent Network Admission Control (NAC).
Additional Resources
Alcatel-Lucent publishes documents for Alcatel-Lucent customers at:
www.Alcatel-Lucent.com
10
OmniVista SafeGuard Manager Administration Guide
Page 11

chapter
Getting Started
1
This section includes the following:
■ Overview
■ Key Features
■ Getting Started
■ Navigation
■ Viewing Tips
■ Modifying Your Password
■ Adding a Device
Page 12

Chapter 1: Getting Started
Overview
The OmniVista SafeGuard Manager command center provides centralized and easy-touse management of one or more Alcatel-Lucent devices, enabling network administrators
to perform basic configuration, management, and monitoring of several devices in a
single interface. OmniVista SafeGuard Manager provides the foundation for gaining
usage awareness and flagging network security incidents by users; it also enables global
policy configuration with the ability to take real-time action from the control panel.
Powerful predefined reports provide clear views on enterprise network health and user
actions.
Unlike traditional network management systems that report at the MAC or IP level,
OmniVista SafeGuard Manager maps events to the network users. A user is identified by
the SafeGuard Controller enforcement devices during the authentication phase. This user
ID is then bound to the MAC and IP addresses of the computer, such that, that any future
communication from that machine is bound to the user ID. This allows an administrator
to identify any user incidents or identify the location of the violating machine.
User-based features combined with drillable data navigation enable OmniVista
SafeGuard Manager to communicate business information simply at a top level, yet the
details are only a click away. This real-time correlation of network incident or awareness
events to the user saves hours of manual association and custom scripting.
OmniVista SafeGuard Manager 3.0 supports the following:
■ Devices: OAG 1000, OAG 2400, OAG 4048x
■ SafeGuard platform: SafeGuard software release 3.0
Key Features
The OmniVista SafeGuard Manager command center Release 3.0 supports the following
features:
■ Device Configuration—Allows you to manage devices with detailed views of
devices and physical ports. Also keeps your network under a single management
system allowing you to select actions on the canned policies and push down to
devices.
■ User Authentication—In addition to local database authentication, OmniVista
SafeGuard Manager users can be authenticated using an external RADIUS server.
12
■ Visualization Filters—Allows you to set up visualization filters such that you can
selectively view events based on VLAN ID, application type, or user role.
■ VLAN Filters—Allows you set up visualization filters based on VLAN IDs.
■ Drillable Database Query—Allows you to execute pre-defined and custom
queries.
OmniVista SafeGuard Manager Administration Guide
Page 13

Chapter 1: Getting Started
■ Policy Creation Using Flows—Allows you to create policy filters from data
available in an application flow.
■ CSV/HTML Report Generator—Allows you to create customized reports with
server-side Scheduler; these reports can be e-mailed and printed easily.
■ Real-time Incident Dashboard—Displays total number of users, authenticated
and unauthenticated, device health, and policy, posture, and malware incidents.
Also displays incidents for unauthenticated users and top user roles with
incidents/incident counts. Administrators can remove offending machines off the
network and revoke user privileges by de-authenticating users.
■ Real-time User Incident Dashboard—Displays authentication failures by users,
users with policy, posture, and malware incidents, and top user roles with
incidents.
■ Real-time Awareness Dashboard—Displays top 10 user sessions by bandwidth,
top 10 destinations, top 10 Web Sites, top 10 applications by flow count, bottom 10
applications by flow count, or top 10 applications by bandwidth.
■ Audit Logs—Provides logs that indicate who did what and when and on which
device. These logs are for user and device operations and can be helpful for
auditing purposes.
■ Device and Server Health—Allows you to collect, view, and store statistics
relating to device or server health. These statistics are helpful in analyzing each
device’s performance and its current connections.
■ Software Upgrade—Allows you to upgrade the software version on the device.
■ File Distribution—Allows you to manage files in a repository and distribute as
necessary.
■ Reboot—This feature allows you to reboot the selected device(s).
■ Online Help—The online help feature is available using the F1 function key.
OmniVista SafeGuard Manager Administration Guide
13
Page 14
Chapter 1: Getting Started
Getting Started
The OmniVista SafeGuard Manager command center has client and server components.
The server runs on a Windows server system, and the client runs on a Windows client
system using Internet Explorer. The client can be deployed directly from the server using
the Java Web Start technology.
To quickly get started with OmniVista SafeGuard Manager, you need the following:
■ System Requirements
■ OmniVista SafeGuard Manager Client Requirements
■ Starting the Server
■ Starting the Server
■ Installing the Client
■ Logging In to the Client
■ Dashboards
■ Menus
■ Adding a Device
System Requirements
The following requirements are for OmniVista SafeGuard Manager server installation.
The software installation enforces these requirements, and exits you out of the
installation if the minimum requirements are not met. For more installation information,
see Installing the OmniVista SafeGuard Manager Server.
■ 2-GB RAM
■ 60-GB free disk space
NOTE: The disk space is allocated as 5GB for installation and 55GB for
data. Installation needs to be performed using the C drive and this
drive should have a minimum of 5GB free space; however, data can be
saved to the D drive that should have a minimum of 55GB space.
■ Microsoft Windows Server 2003 (Enterprise, Standard, or Web Edition)
14
NOTE: Microsoft Windows Server 2003 should have SP1 installed.
Alcatel-Lucent supports 32 bit versions only.
OmniVista SafeGuard Manager Administration Guide
Page 15

■ 2.8-GHz processor speed
■ 2 processors
NOTE: The appliance that ships from Alcatel-Lucent meets all these
requirements.
OmniVista SafeGuard Manager Client Requirements
The OmniVista SafeGuard Manager client can be run on most Windows systems.
Minimum requirements are:
■ One of the following Windows platforms:
— Microsoft Windows Server 2000
— Microsoft Windows Server 2003 (Enterprise or Standard)
Chapter 1: Getting Started
— Microsoft Windows XP Professional
■ 2.8-GHz single CPU
■ 512-MB RAM
■ 2-GB hard disk
■ Internet Explorer 6.0 or higher
■ Screen resolution of 1024 x 768 pixels
■ Internet connectivity to install Java Web Start
OmniVista SafeGuard Manager Administration Guide
15
Page 16

Chapter 1: Getting Started
Starting the Server
When you boot up the OmniVista SafeGuard Manager appliance, the OmniVista
SafeGuard Manager server is started automatically. However, if you upgraded the
software version or re-installed the software, you must manually start the server. For
more information on installing, upgrading, or uninstalling, see Installation and Setup.
To manually start the server:
1 Use the Windows shortcut from the Start menu, Programs > OmniVista SafeGuard
Manager > Start Server.
A GUI window displays. This window performs checks to verify that all ports
needed for the server are available, starts all the server components as Windows
services, and informs you when the server is ready.
2 Click OK to close the window.
The OmniVista SafeGuard Manager server runs in the background. If you now
reboot the system, the server should come up automatically.
Installing the Client
The OmniVista SafeGuard Manager client is based on Java Web Start technology,
allowing you to install the client automatically with a single click over the network. For
more information on client installation, see Installation and Setup.
To install the client:
1 Launch Internet Explorer.
2 Access the OmniVista SafeGuard Manager system by typing the following URL:
http://<server-ip-address>
If the client does not have Java Web Start already installed, you are prompted to
install Java Runtime Environment (JRE). Follow the on-screen prompts using the
default options to install JRE. Java Web Start is included with JRE.
NOTE: The automatic installation of JRE requires ActiveX controls to be
enabled on your Internet Explorer. If ActiveX controls are not enabled, a
“download Java Web Start” link displays. Internet Explorer also alerts you if
ActiveX controls are not enabled and gives you an option to enable ActiveX
controls. You can choose to enable ActiveX controls for automatic installation
of Java Web Start, or you can download JRE version 1.5.0 by going to the
download link. If you manually install Java Web Start, repeat Step 2.
16
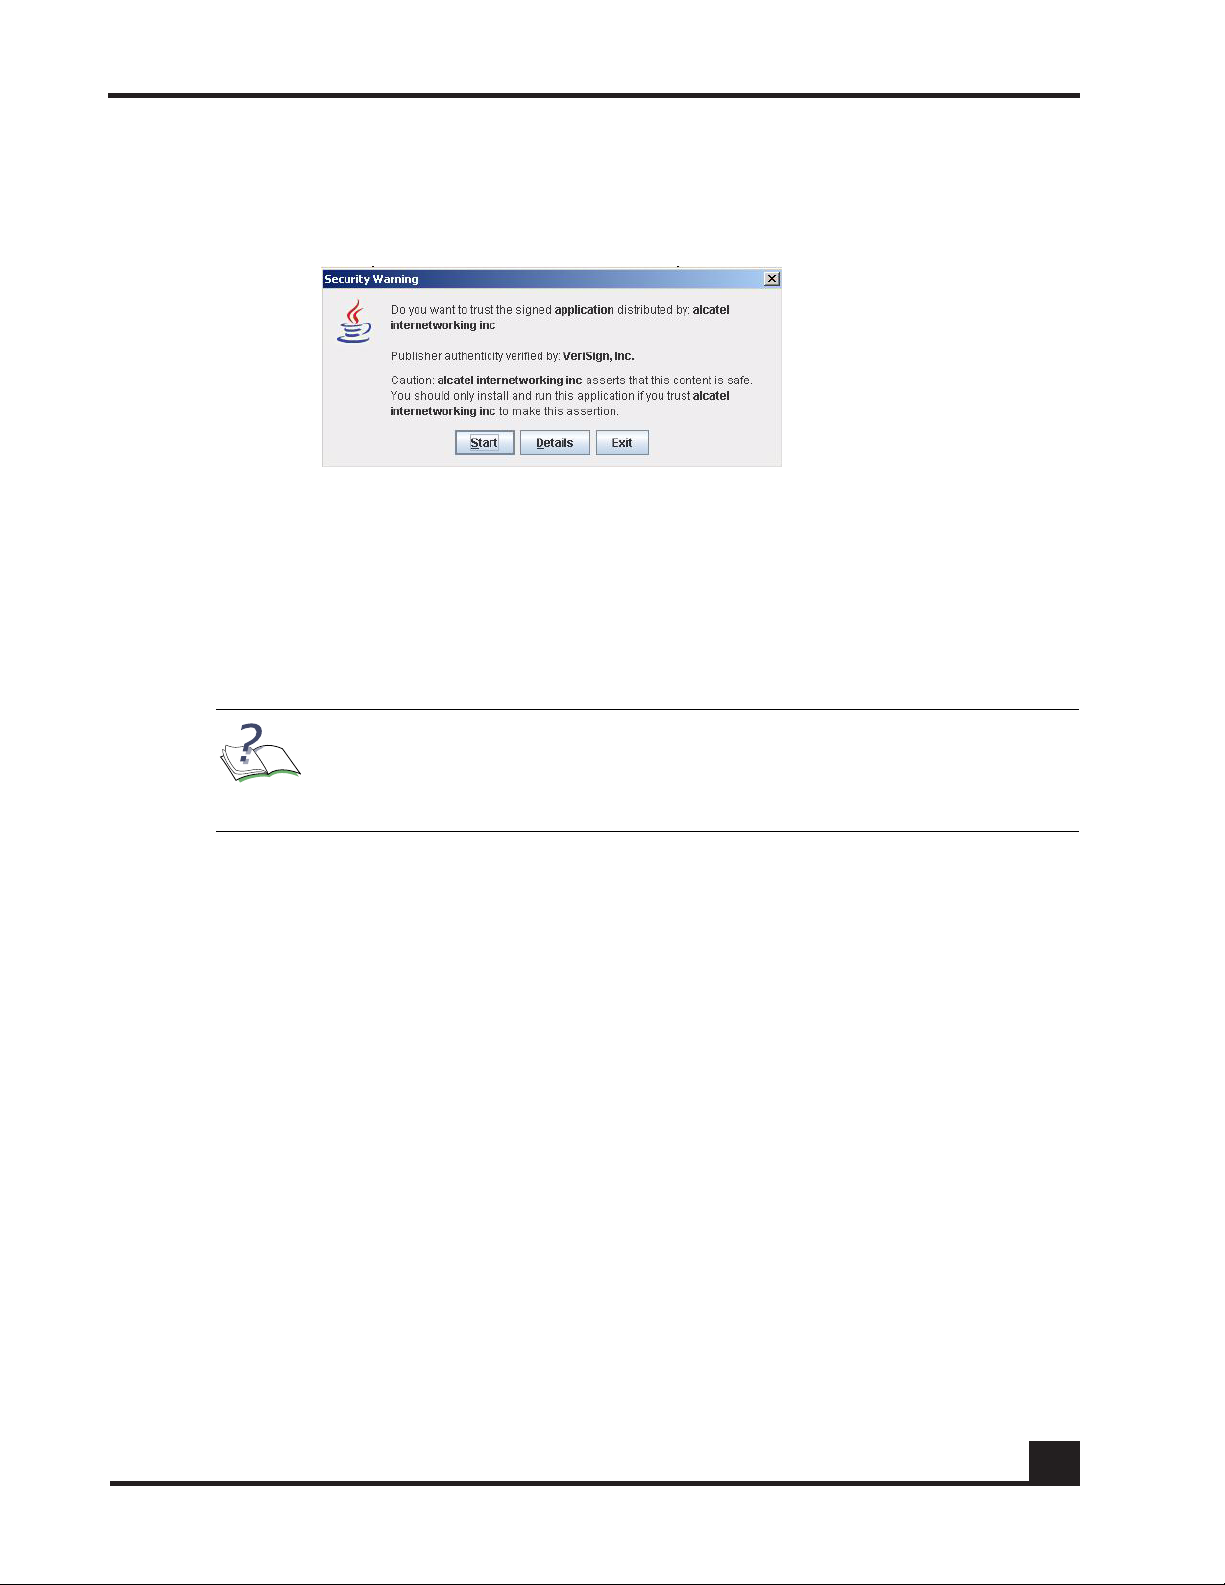
After Java Web Start is installed, the OmniVista SafeGuard Manager client code is
downloaded and installed. Java Web Start displays a dialog box informing you
OmniVista SafeGuard Manager Administration Guide
Page 17
Chapter 1: Getting Started
that the application is authored by Alcatel-Lucent and needs some privileges on
your client system (Figure 1).
Figure 1 Security Warning
3 Click Start. A prompt appears asking if you want to create a shortcut on the
desktop.
4 Select Yes to create a shortcut. If you select No, you can still launch the client
using the URL from Step 2.
The client launches. See Logging In to the Client for information on logging
procedures.
NOTE: Every time the OmniVista SafeGuard Manager client is launched, it
compares its version with the OmniVista SafeGuard Manager server. If the
client version is different than that of the server, the client automatically
updates itself from the new version of the server.
OmniVista SafeGuard Manager Administration Guide
17
Page 18
Chapter 1: Getting Started
Logging In to the Client
To log in to the client:
1 Launch the client using either of the following methods:
— Double-click on the shortcut that was created on your desktop when you first
installed the client.
— Invoke from Internet Explorer by typing the URL (http://ip-address-of-
OmniVistaSafeGuardManager-server).
— Launch from the start menu using start menu > OmniVista SafeGuard
Manager > Client
NOTE: If you are launching the client from the server for the first
time, you might be prompted to install certain applications. See
Installing the Client for more information.
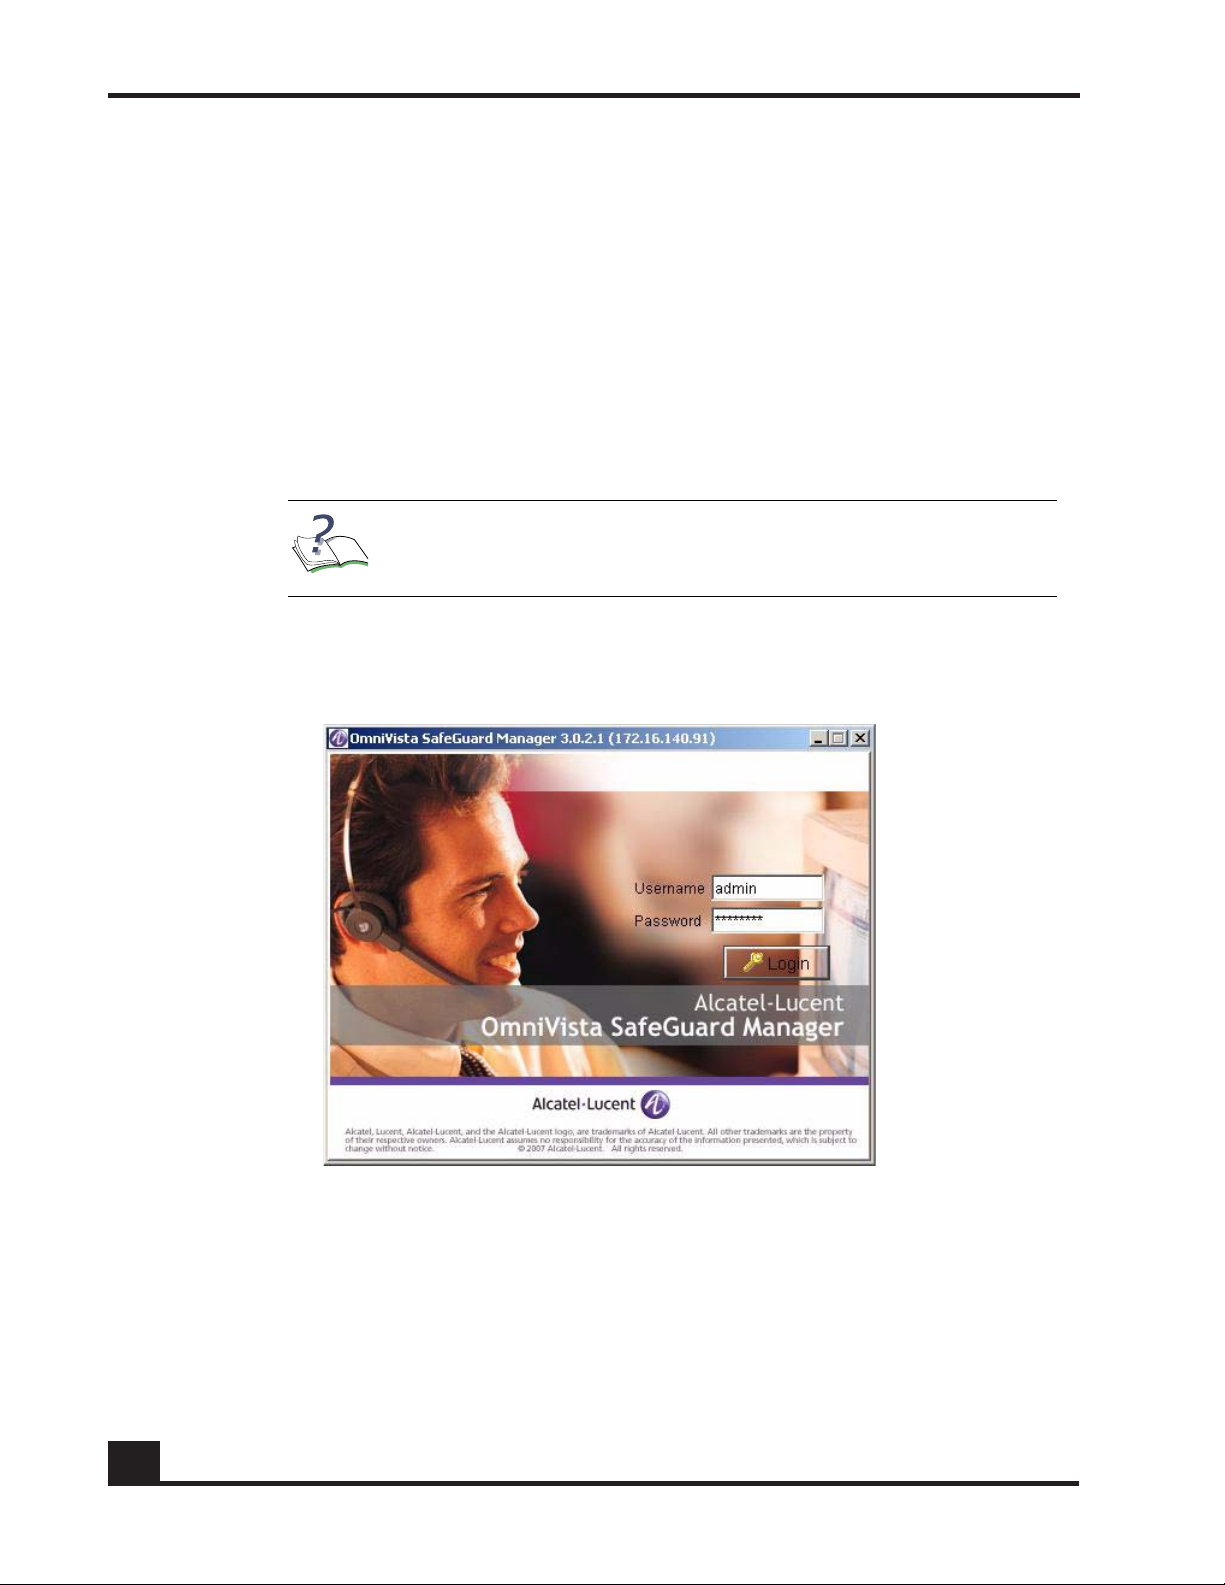
The Login screen appears (Figure 2).
Figure 2 OmniVista SafeGuard Manager Client Login Screen
2 In the Username field, type
admin as the default user.
18
3 In the Password field, type
password.
OmniVista SafeGuard Manager Administration Guide
Page 19
4 Click Login. If you are logging in for the first time to the OmniVista SafeGuard
Manager server, the Alcatel-Lucent License Agreement will be displayed. You
must accept it to use OmniVista SafeGuard Manager.
NOTE: The license agreement is a one-time acknowledgement for
each server and is not displayed for this client or any other client or
this server.
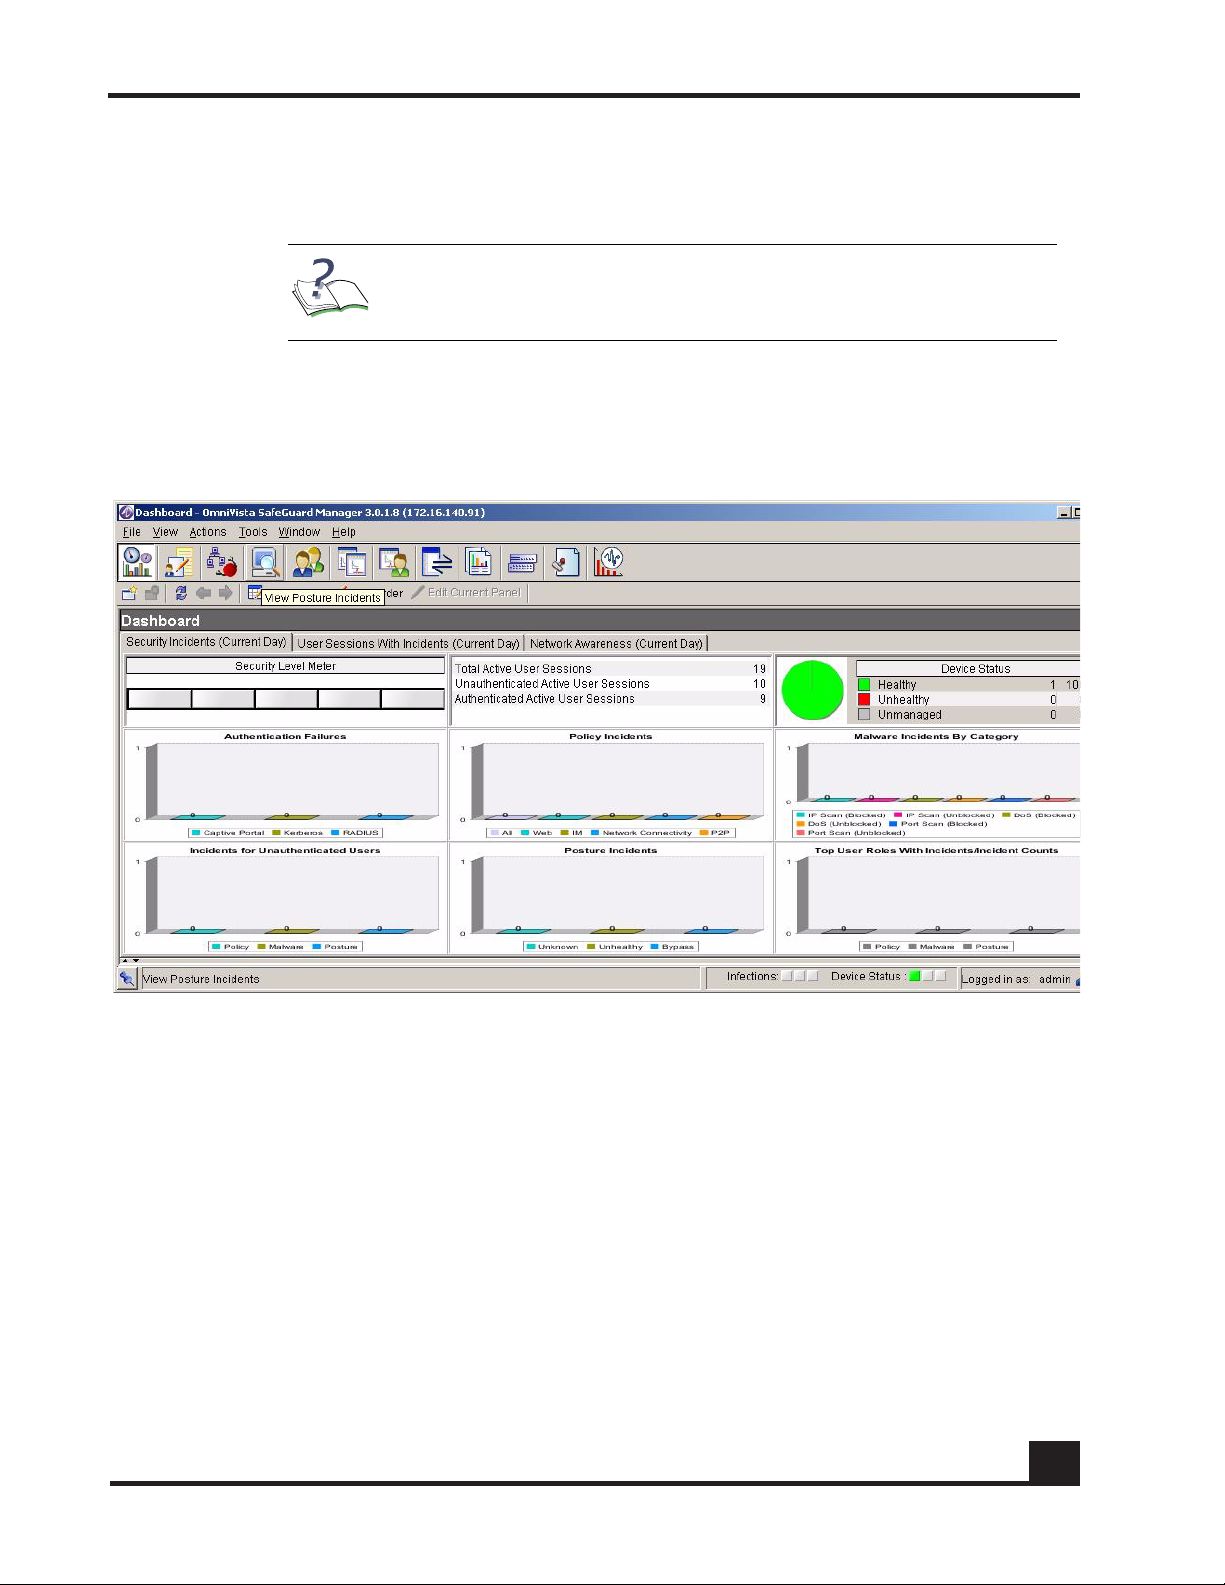
The client is successfully launched, and the OmniVista SafeGuard Manager
command center panel displays (Figure 3).
Figure 3 OmniVista SafeGuard Manager Dashboard
Chapter 1: Getting Started
OmniVista SafeGuard Manager Administration Guide
19
Page 20
Menu Bar
Page Bar
Action Bar
Chapter 1: Getting Started
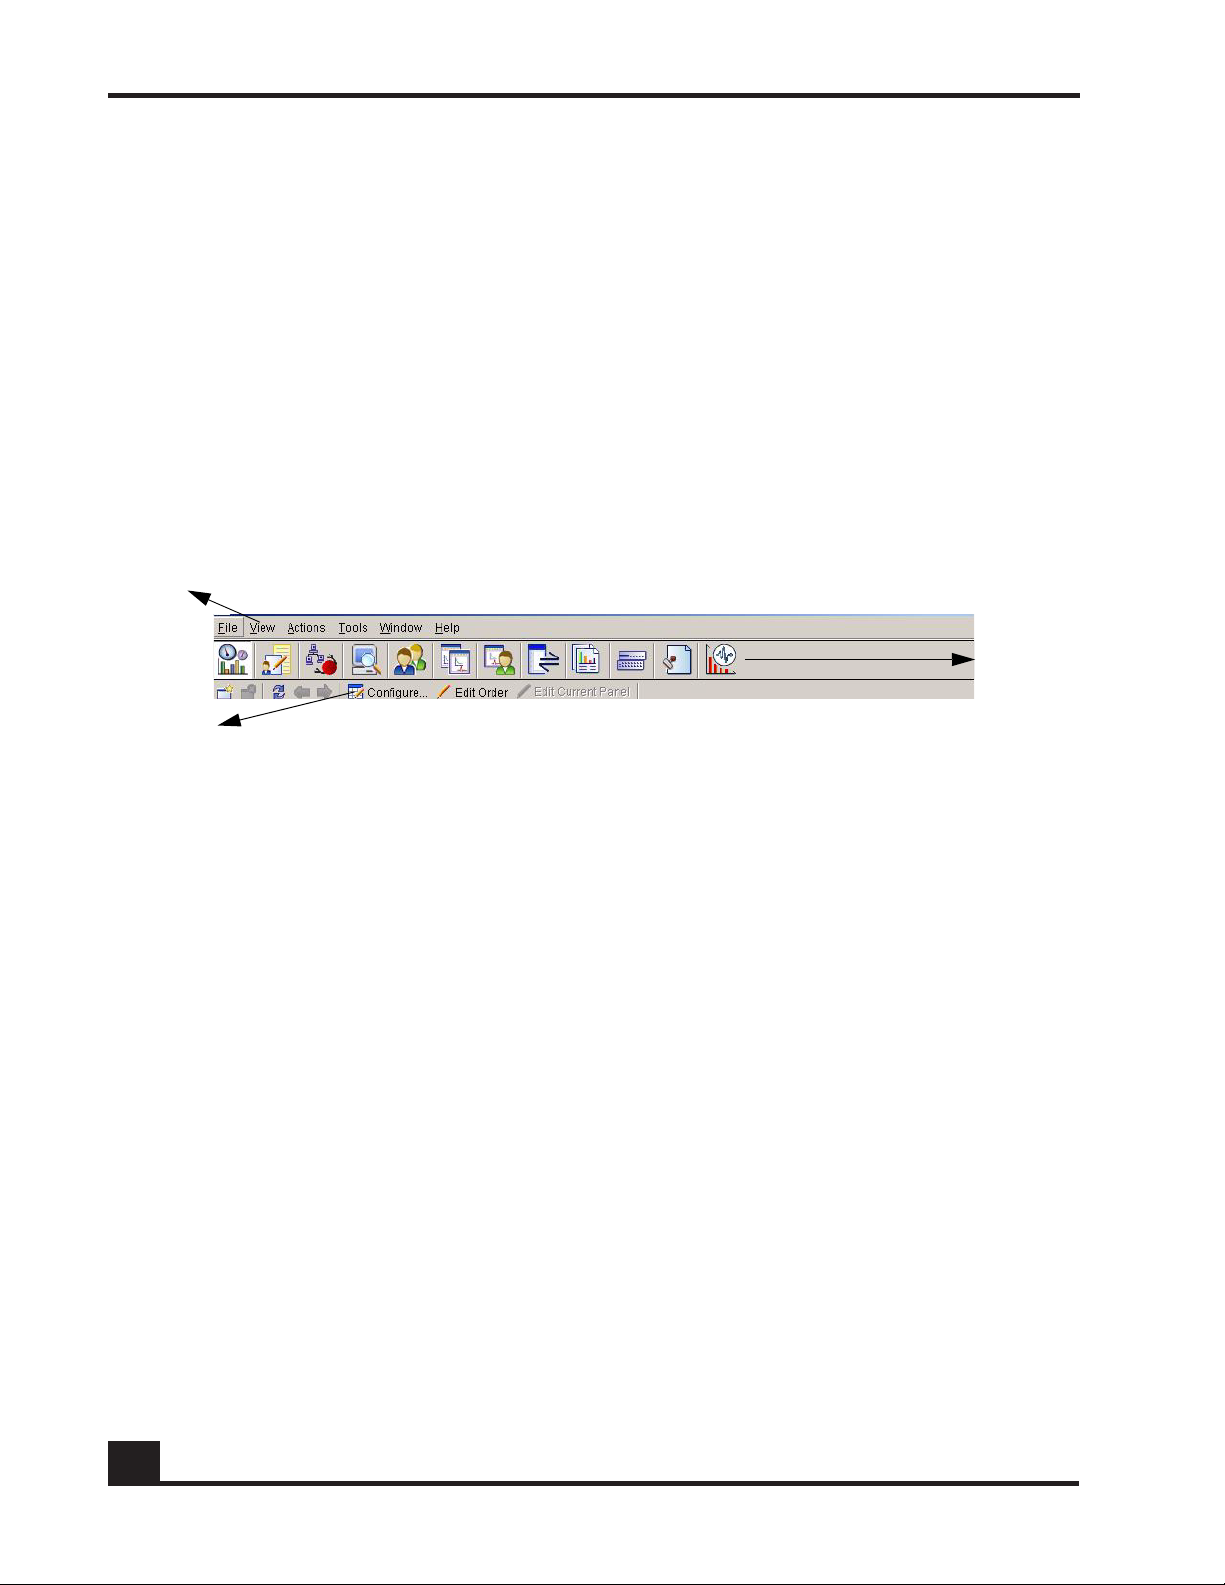
Navigation
When you log into the OmniVista SafeGuard Manager command center, a navigation
panel displays that allows you to access the various features by simply clicking a button
or using a menu item. You can navigate the OmniVista SafeGuard Manager command
center using the following:
■ Dashboards
■ Menu Bar
■ Page Bar
■ Action Bar
Figure 4 OmniVista SafeGuard Manager Navigation Elements
Dashboards
The OmniVista SafeGuard Manager command center has three dashboards that provide a
high-level network summary. These dashboards can be used to further investigate either
actionable user incidents or informational and user traffic patterns. For more information
on how to use the visualization features of the dashboard, see Visualization. The three
dashboards are:
■ Incidents—Displays total number of users, authenticated and unauthenticated,
■ User Incidents—Displays authentication failures by users, users with policy,
■ Network Awareness—Displays various application usage patterns and statistics
device health, and policy, posture, and malware incidents. Administrators can
remove offending machines off the network and revoke user privileges by deauthenticating users.
posture, and malware incidents, and top user roles with incidents.
for active users, such as top 10 user sessions by bandwidth, top 10 user sessions
with most blocked incidents, top 10 destinations, top 10 Web Sites, and so forth.
The modules are automatically refreshed every 5 minutes.
20
OmniVista SafeGuard Manager Administration Guide
Page 21
Menus
You can access the OmniVista SafeGuard Manager features by selecting menu commands
that are located in the menu bar, which is the toolbar located at the top of the screen
(Figure 4).
Page Bar
The OmniVista SafeGuard Manager Page Bar icons allow you to access the various
features of OmniVista SafeGuard Manager while retaining the context as much as
possible. The Page Bar icons provide a quick single-click action that is synonymous with
the menu items:
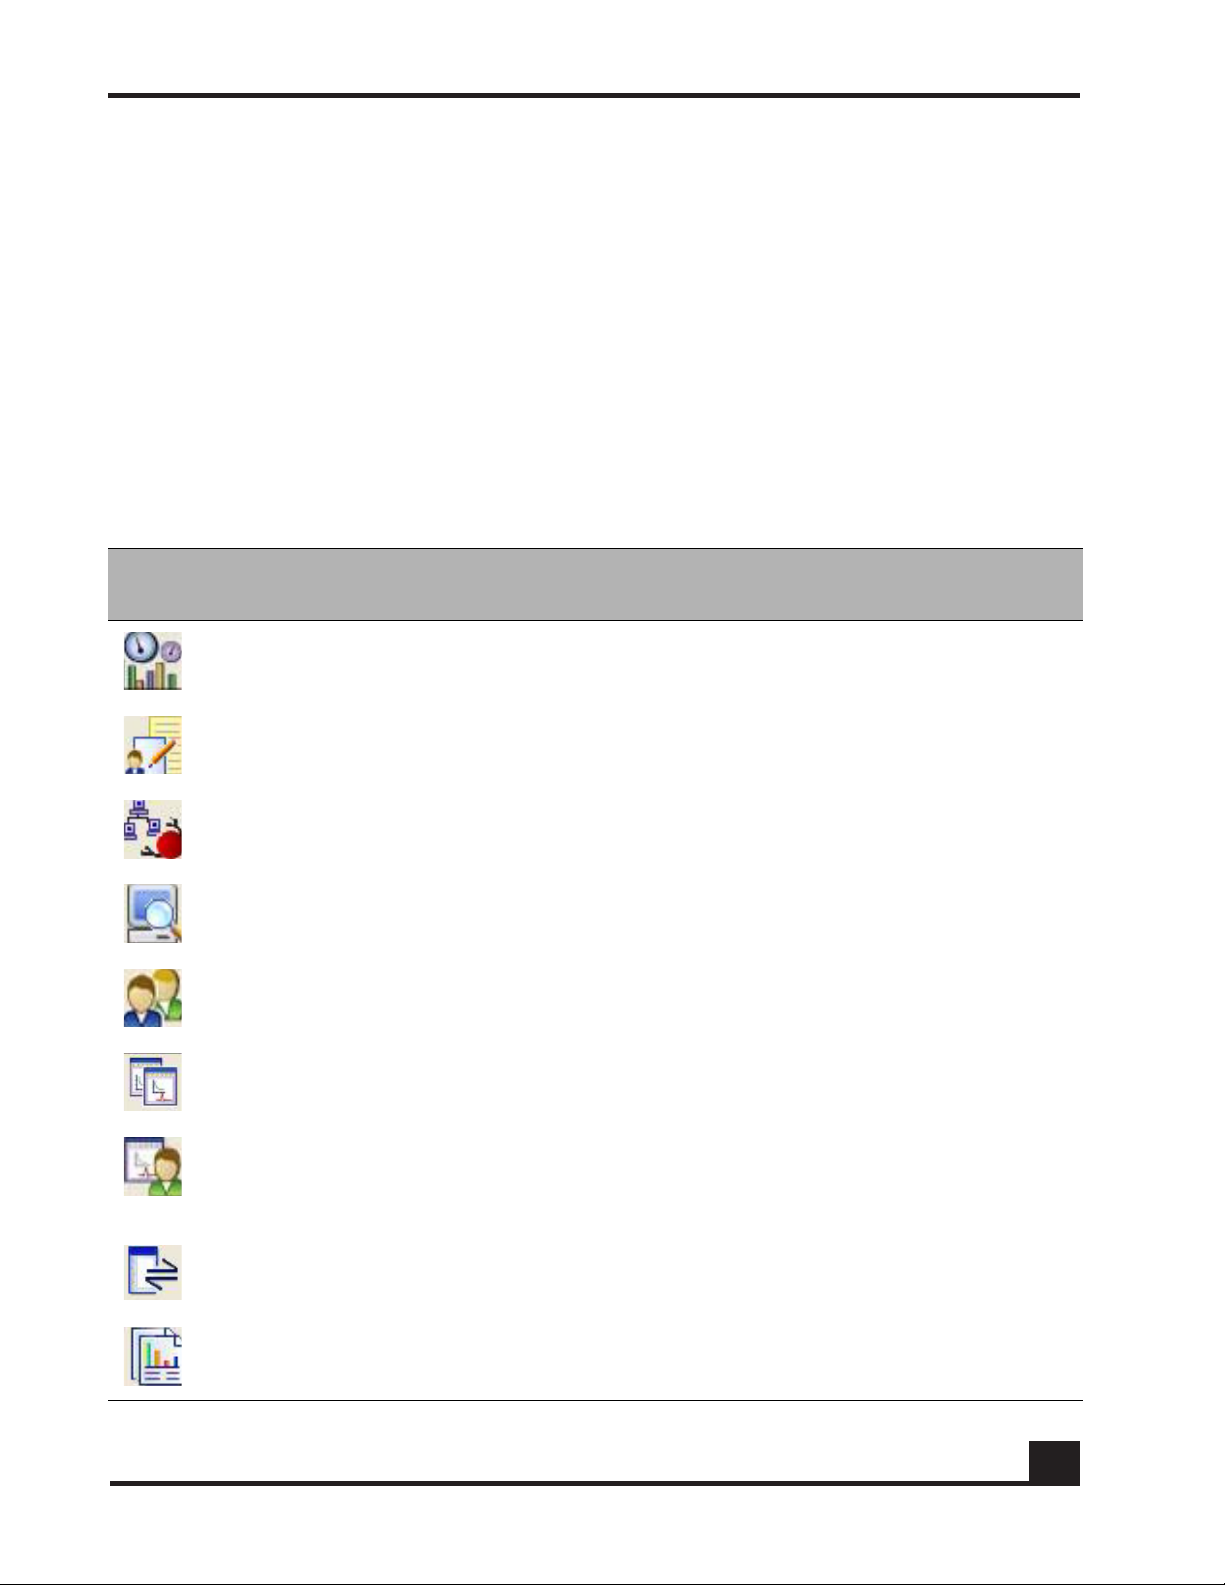
Table 1 Navigating within OmniVista SafeGuard Manager
Chapter 1: Getting Started
Page Bar
Icon
Menu Sequence
View > Go To >
Dashboard
View > Go To >
Policy Incidents
View > Go To >
Malware Incidents
View > Go To >
Posture Incidents
View > Go To >
Users
View > Go To >
Applications
View > Go To >
Application
Instances
Key
Sequence
Ctrl + 0 Dashboards Displays Incidents, User Incidents,
Ctrl + 1 Policy
Ctrl + 2 Malware
Ctrl + 3 Posture
Ctrl + 4 Users Displays network activity per user.
Ctrl + 5 Applications Displays network activity per
Ctrl + 6 Application
Displays View Description
and Global Awareness
dashboards.
Displays all policy incidents.
Incidents
Displays all malware incidents.
Incidents
Displays all posture Incidents.
Incidents
application.
Displays the user bandwidth
Instances
usage for each user, application
type, destination port, and
destination IP address.
View > Go To >
Application Flows
View > Go To >
Reports
OmniVista SafeGuard Manager Administration Guide
Ctrl + 7 Application
Ctrl + 9 Reports Allows you to create and view
Flows
Displays application flows for all
application.
reports on network traffic
patterns and anomalies.
21
Page 22

Chapter 1: Getting Started
Table 1 Navigating within OmniVista SafeGuard Manager (continued)
Page Bar
Icon
Menu Sequence
View > Go To >
Config
Management
View > Go To >
Audit Logs
View > Go To >
Statistics
When you click on any of the Page Bar icons, a table view is displayed that shows the
Navigation Tree on the left-side, the contents in the upper-half of the screen and details
for the selected object in the lower-half of the screen. The Navigation Tree and the Action
Bar change based on the action task selected in the Page Bar.
Action Bar
Key
Sequence
Shift + 1 Config
Shift + 2 Audit Logs Displays log entries that are
Shift + 3 Statistics Displays device and server health
Displays View Description
Enables you to manage Alcatel-
Management
Lucent devices, view inventory,
and perform minimal
configuration of the device
system and ports.
relevant for auditing purposes.
statistics.
The Action Bar allows you to access commands, as you need them, by a simple click of a
button.
To use the Action Bar, do any of the following:
■ To choose a command from the bar, click the command button or Actions >
command
■ To view what a command does, position the mouse over the command button to
see its tooltip.
■ To close the Action Bar, choose View > Toolbars > Actions.
22
OmniVista SafeGuard Manager Administration Guide
Page 23

Viewing Tips
The following tips expedite your navigation through the OmniVista SafeGuard Manager
Manager panels and windows:
■ Buttons in the Action Bar are used to execute actions. Select a row and then click
the action button. If an action is not applicable for the selected row, the
corresponding button is disabled.
■ In the table views, some information about the table size is displayed above the
table (the number of rows) and the alarm and infection status is displayed in the
status bar below the table.
■ You can search the data from the visualization database using filters. To view
filters, click Find in the Action Bar. A free-form search field is displayed where
you can type keywords to search data displayed in table views. To search the data
from the database, click Database Search. A new search and sort header opens at
the top of the table header. Click on the search bar of the column to specify the
filtering criteria for that column. Click on the sort bar for the column to specify the
sort criteria for that column. You can select multi-column sort order. After you
have finished setting filters for one or more columns, click Refresh to see the new
results. To clear all filters, click Clear. For more information on how to use the
search and sort features, see General Navigation.
Chapter 1: Getting Started
■ Select a row to view detailed information on the selected row.
■ Right-click on a row to display applicable actions.
OmniVista SafeGuard Manager Administration Guide
23
Page 24
Chapter 1: Getting Started
Modifying Your Password
The Account Management feature of OmniVista SafeGuard Manager allows an
administrator to perform basic modifications to user accounts, such as adding users,
changing passwords, and configuring dual-admin.
To modify your password:
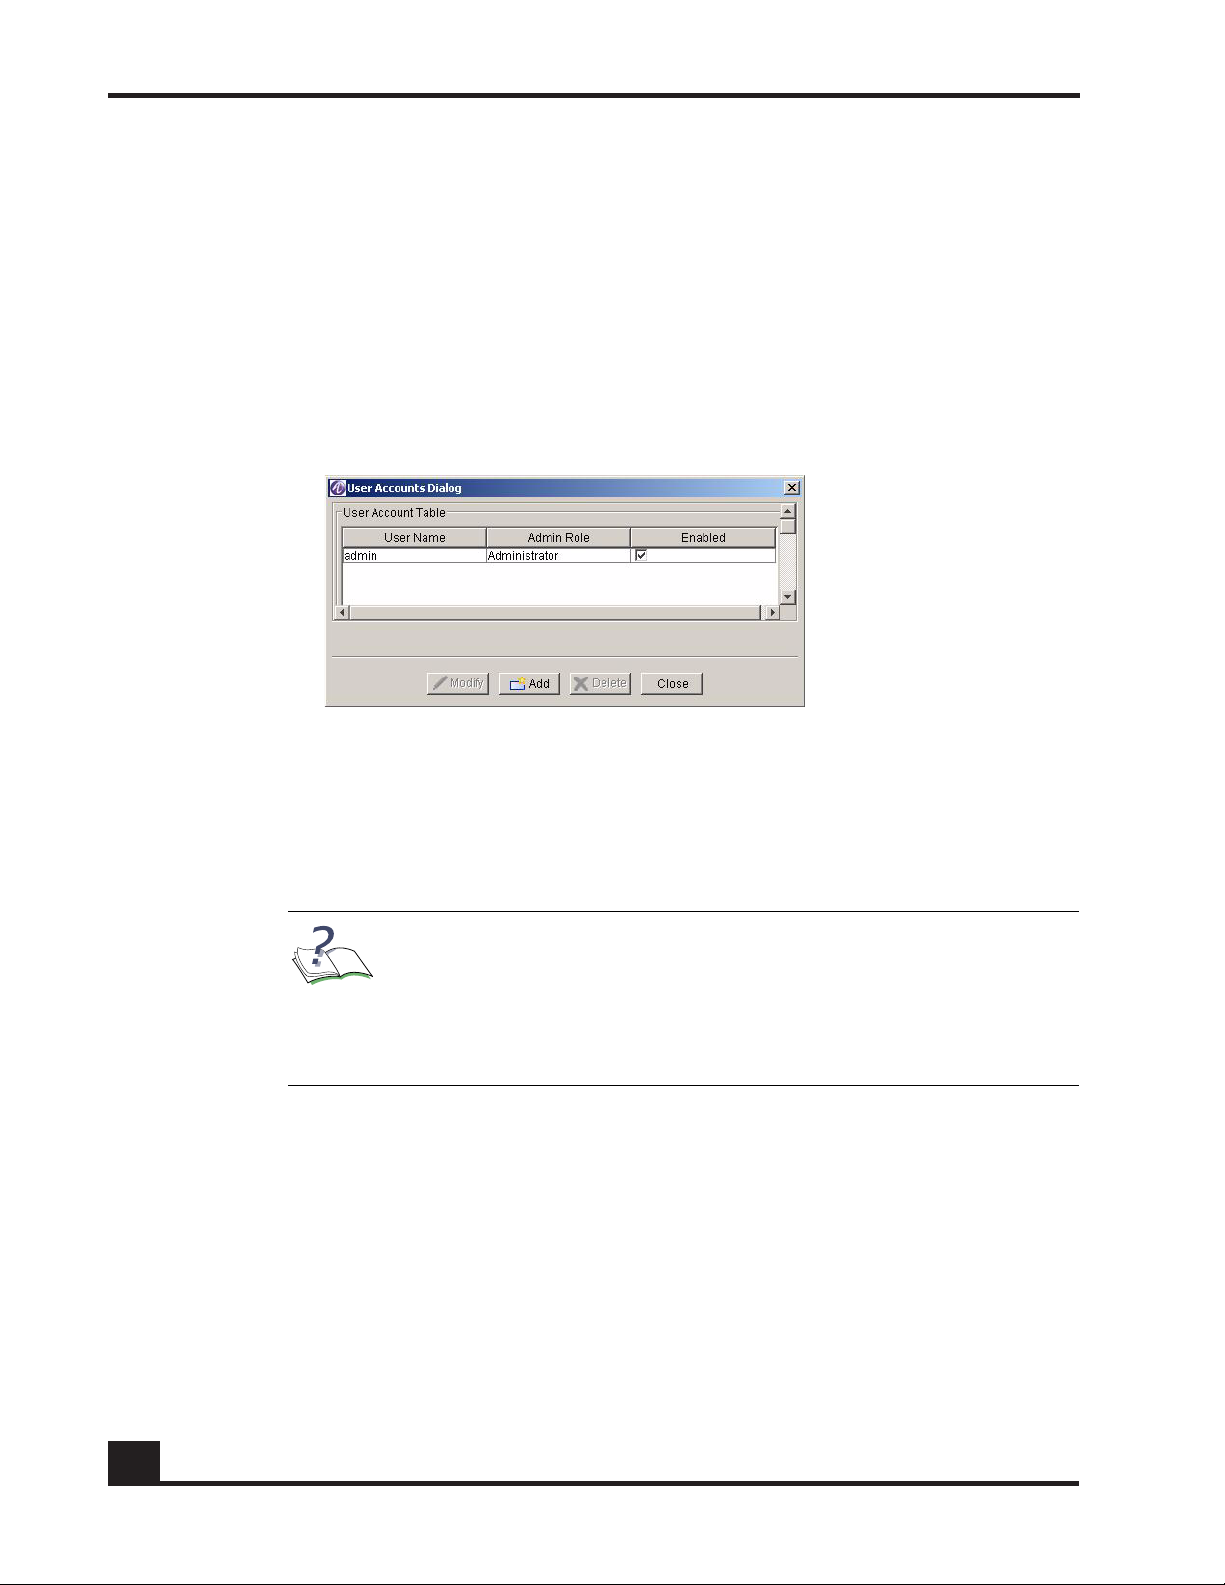
1 Select Tools > OmniVista SafeGuard Manager Users > User Accounts... The Account
Management window (Figure 5) displays.
Figure 5 Account Management Window
2 Select one of the following Admin Login Setting:
■ Standard—requires a single login and password
■ Dual-admin—requires two logins and passwords
3 Click Apply to apply the login setting.
NOTE: The Enabled checkbox shows the status of the user account.
This is used to indicate whether the user can log in or not. For all user
accounts, except admin, when an authentication method is changed
from Radius to local, the account is set to “disabled”. The account
remains in a disabled state until the administrator resets the password
for the account.
4 Select the “admin” user and click Modify to change the password for the “admin”
user. The Modify User Account dialog box (Figure 6) displays.
24
OmniVista SafeGuard Manager Administration Guide
Page 25
Chapter 1: Getting Started
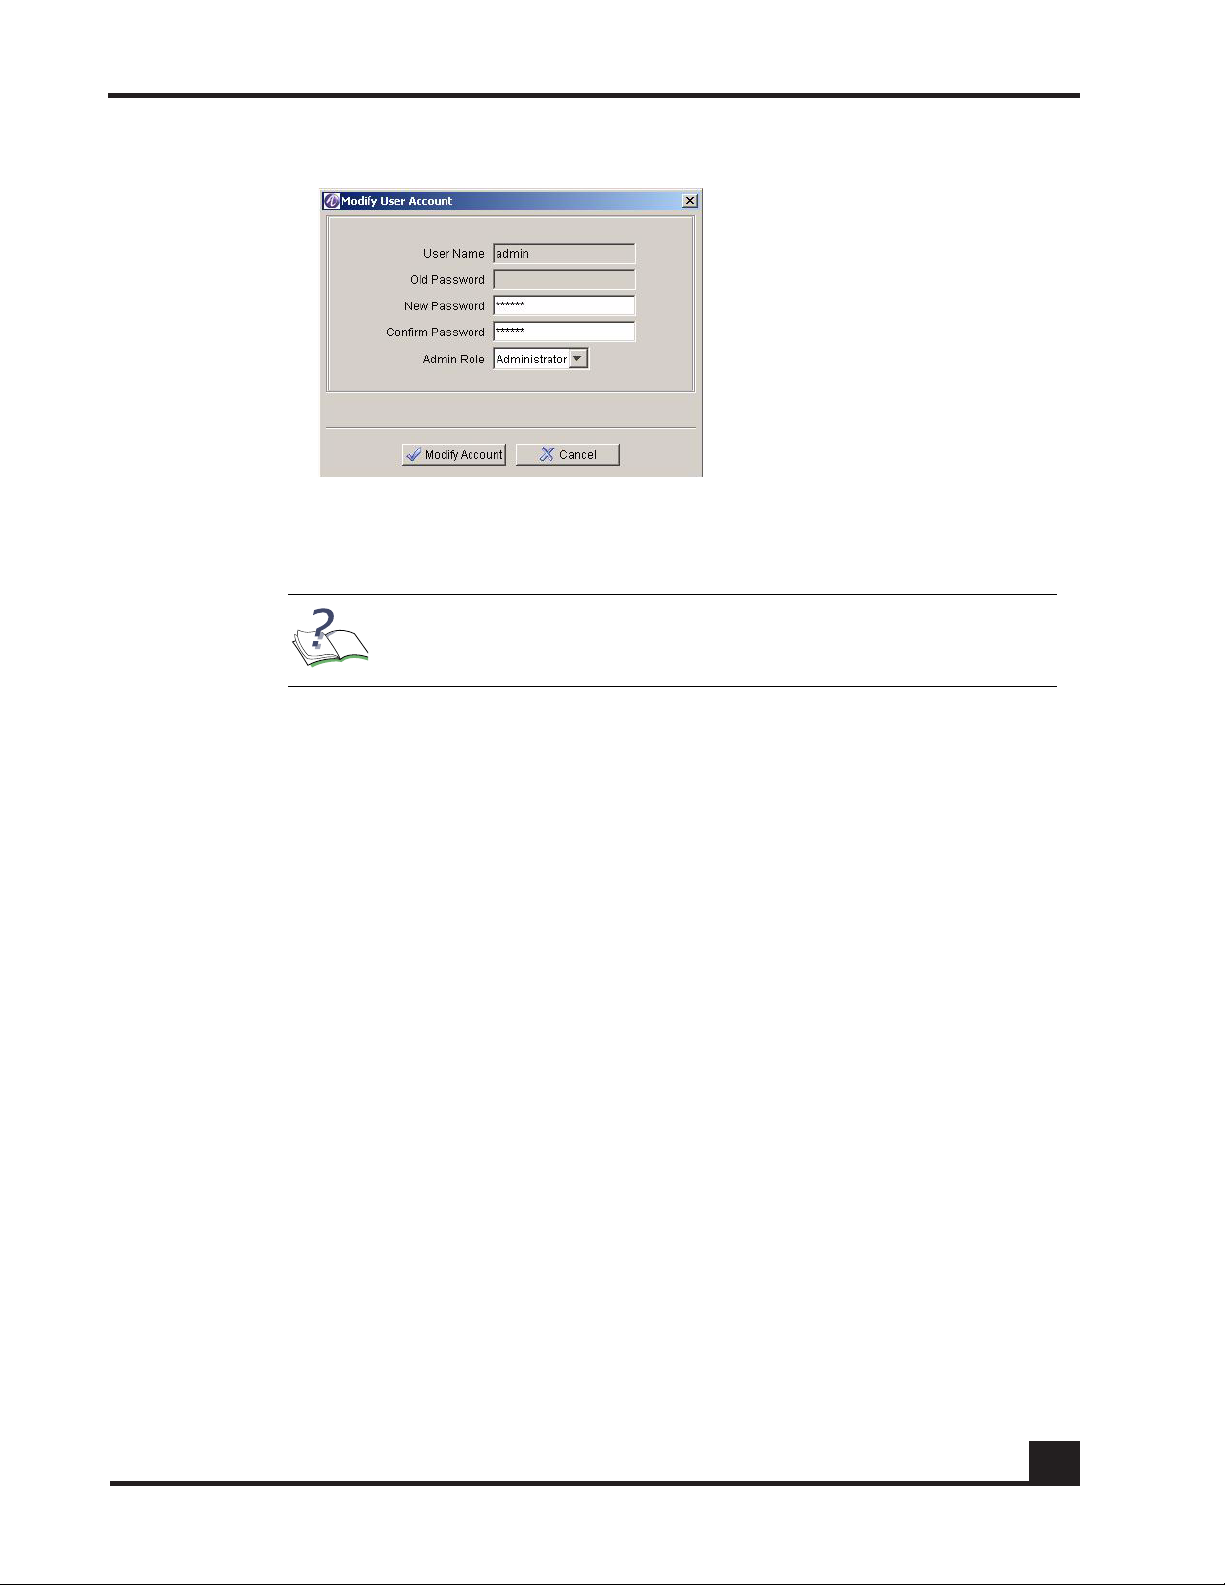
Figure 6 Modify User Account Dialog Box
5 Modify the password, as needed, and click Modify Password.
6 Click Modify Account if you are changing the admin role or user information.
NOTE: For more information on adding a new user or the different
types of user roles, see User Accounts.
Adding a Device
Before you can visualize any data, you need to add a device. For more information on
device management, see Device Configuration.
To add a single device:
1 Select the Device Configuration icon from the Page Bar or select the View > Go To >
Config Management menu item.
2 Click the New icon from the Action Bar.
3 Select Single Device. The New Device (Figure 7) dialog box displays.
OmniVista SafeGuard Manager Administration Guide
25
Page 26
Chapter 1: Getting Started
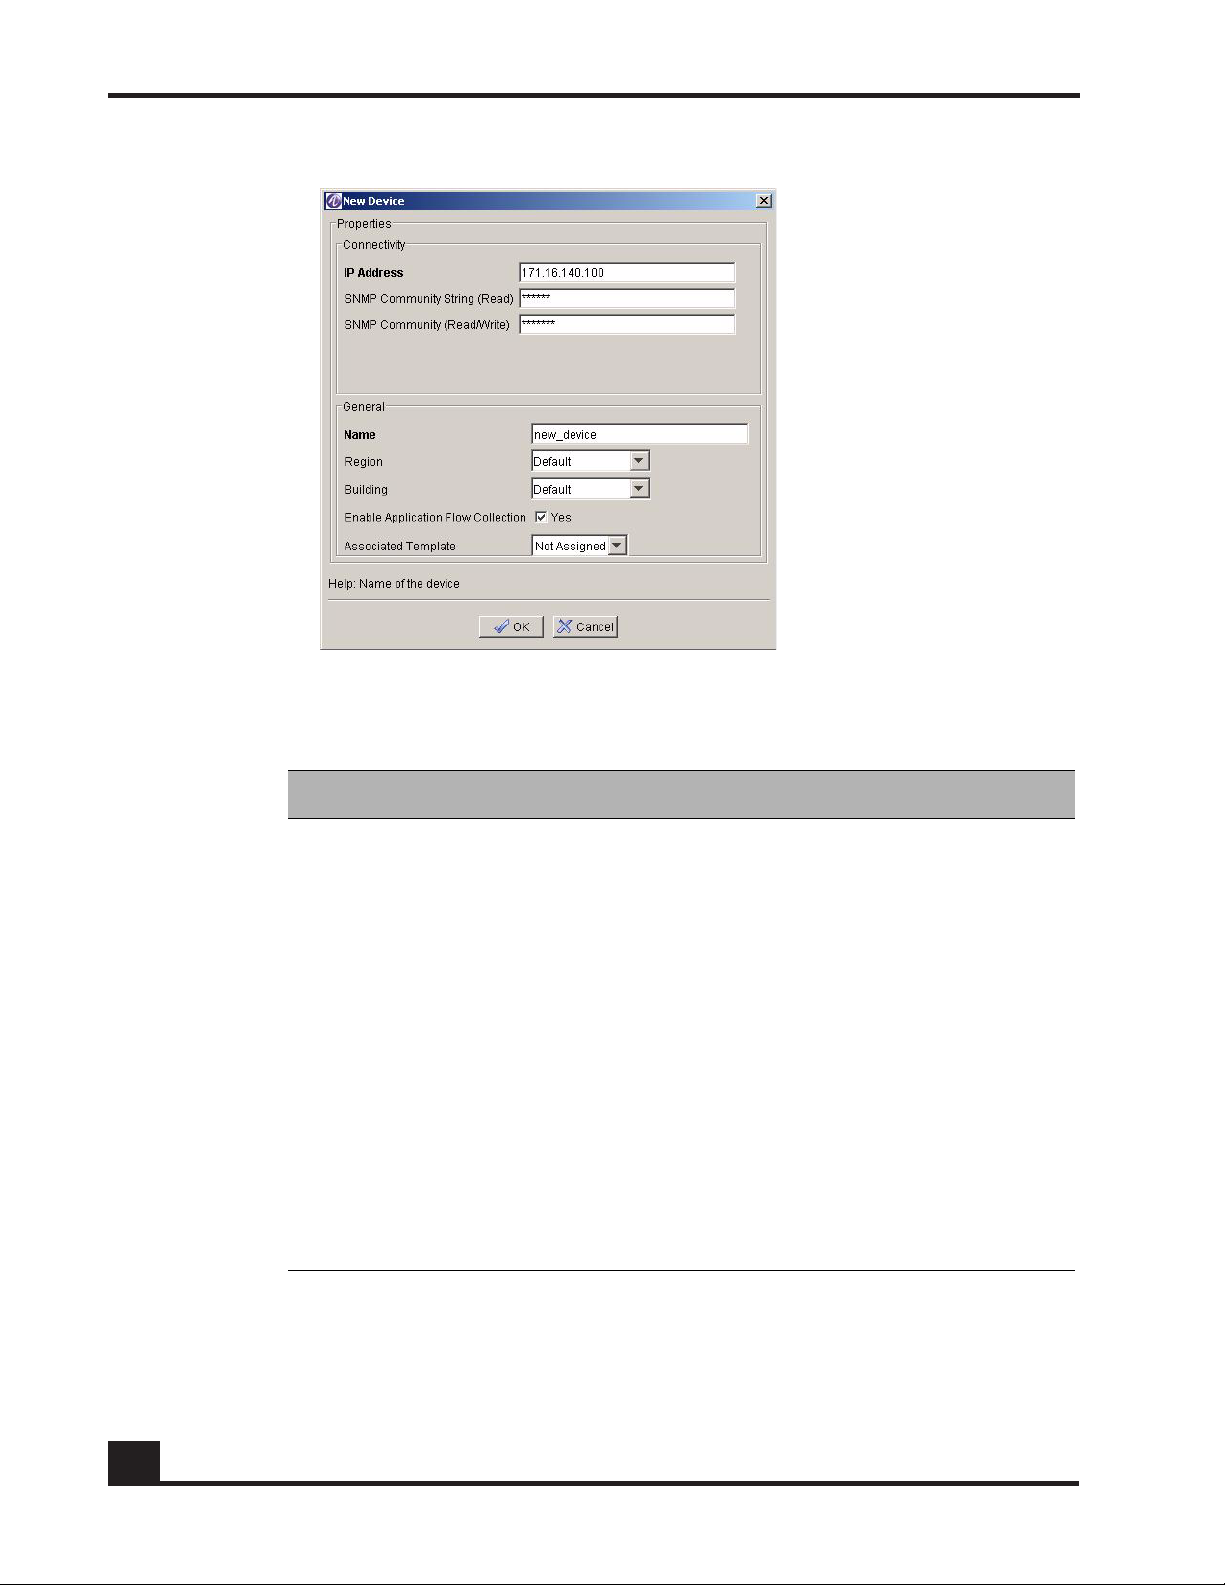
Figure 7 New Device Dialog Box
4 Enter the following device attributes:
Table 2 Add Device Attributes
Attribute Description
IP Address The Management IP address of the device.
SNMP Community
String (Read)
SNMP Community
(Read/Write)
Name Device name.
Region Name of the region in which the device is located.
Building Name of the building in which the device is located.
Enable Application
Flow Collection
Associated Template Select a template from the pull-down list that you
Simple Network Management Protocol (SNMP) read
community name that was configured when the
device was initially set up.
SNMP read/write community name that was
configured when the device was initially set up.
Click this box if you want to collect application flow
data.
want to associate with the device. For more
information on templates, see Templates.
26
OmniVista SafeGuard Manager Administration Guide
Page 27
Chapter 1: Getting Started
NOTE: Make sure that the attributes are specified correctly; otherwise,
adding a device fails producing one of the following error messages,
“Device unreachable,” or “Device is not a Alcatel-Lucent device,” or “Unable
to communicate with IP Address.”
5 Click OK to add the device. The add process reads the system configuration and
the list of outstanding visualization events from the device using a combination of
SNMP and Alcatel-Lucent proprietary OmniVista SafeGuard Manager
Visualization Channel.
NOTE:
some of the events may be lost by the time you add the device.
The device displays in the All Devices panel and the device objects display in the
Device Hierarchy navigation tree.
NOTE:
strings for the device to be added.
To add multiple devices:
1 Select the Device Configuration icon from the Page Bar or select the View > Go To >
Config Management menu item.
2 Click the New icon from the Action Bar.
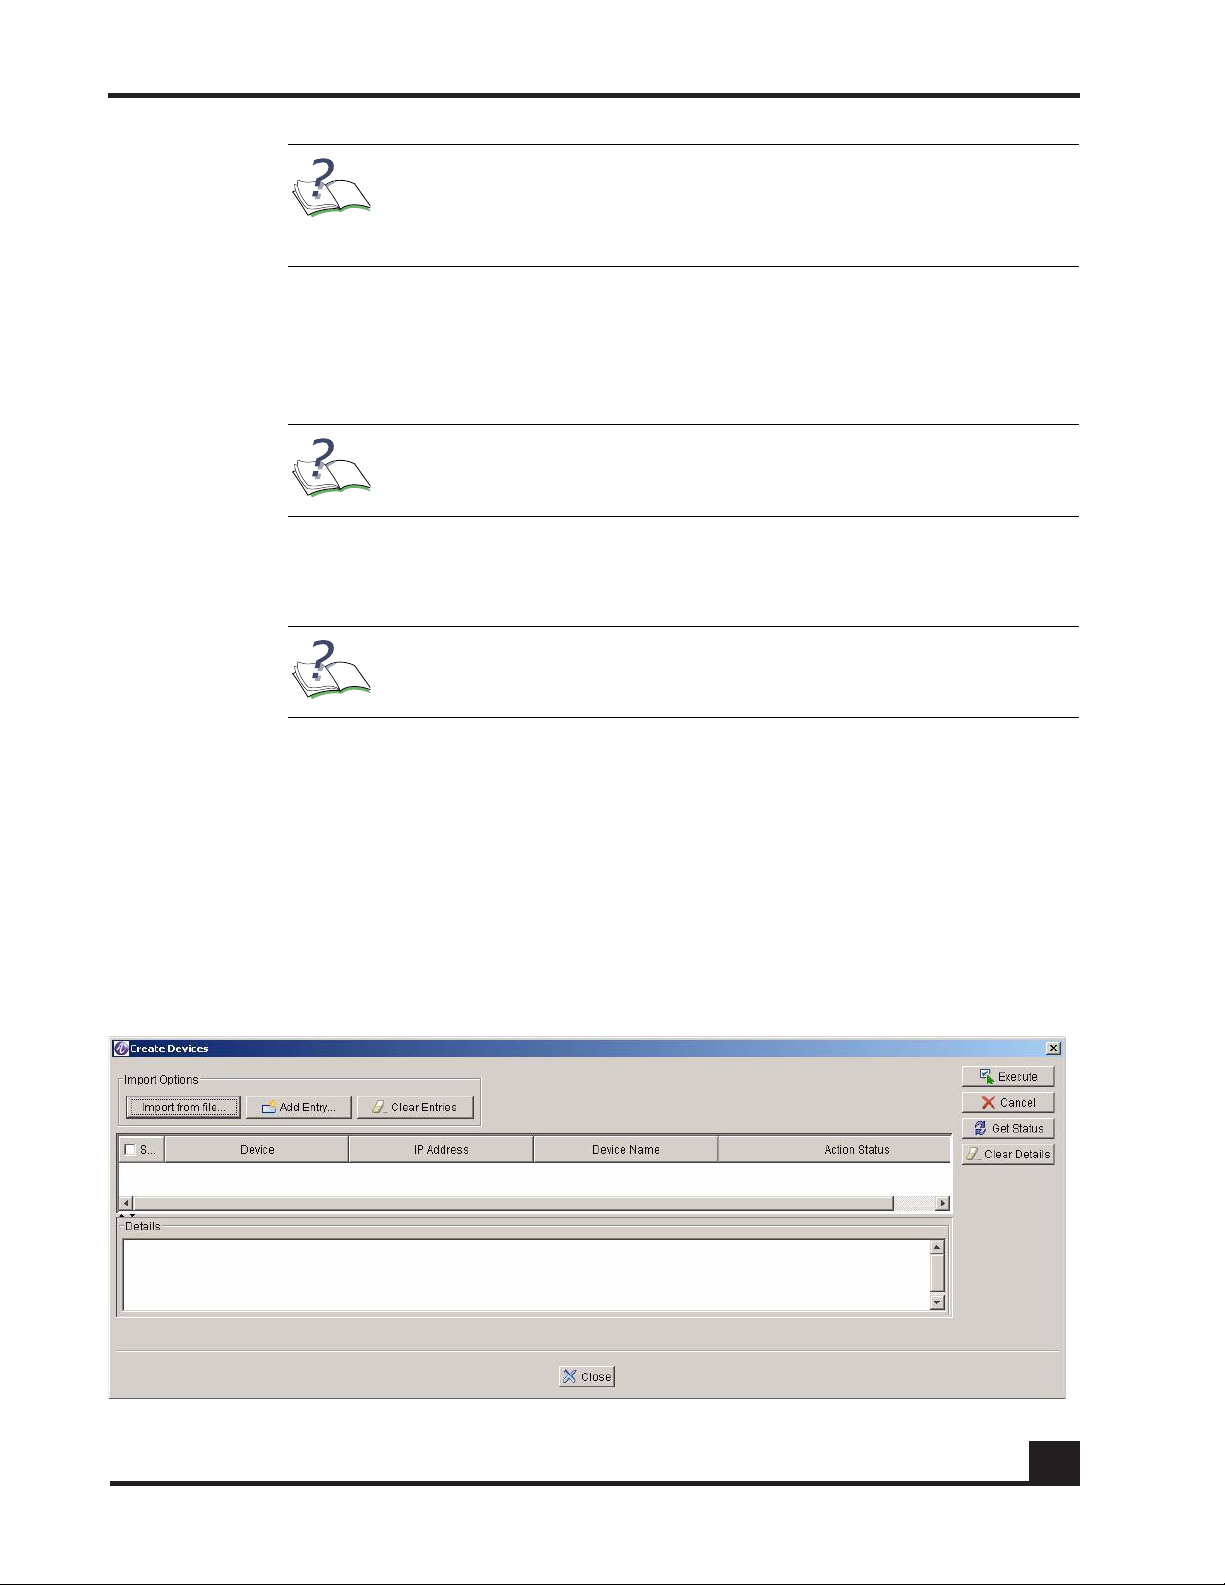
3 Select Multi Device. The Create Devices (Figure 8) dialog box displays. You can
populate this table using either the Import From File or the Add Entry option.
Figure 8 Add Multiple Devices
The device periodically ages out the visualization data; therefore,
The device must be reachable with appropriate community
OmniVista SafeGuard Manager Administration Guide
27
Page 28

Chapter 1: Getting Started
4 Click Import From File to import a list of devices written in a specific format. For
example:
#########################################################################
Name: Device List File #Purpose: For bulk device addition into OmniVista
SafeGuard Manager Syntax of each line: #
ip,read,readwrite,name,region,building,enable-flow-collection-in-truefalse # # Example: 172.16.3.125,public,private,controller,R1,B1,true
#########################################################################
172.16.3.125,public,private,controller,R1,B1,true
172.16.1.53,public,private,switch,R1,B2,true
5 Click Add Entry to add another entry in the table. This can be used to create a list.
6 The following device attributes are displayed:
Table 3 Add Device Attributes
Attribute Description
Select Device Select the Select Device checkbox to select all
devices in the list.
Device Show the device name with its IP address.
IP Address The Management IP address of the device.
SNMP Community
String (Read)
Simple Network Management Protocol (SNMP) read
community name that was configured when the
device was initially set up.
SNMP Community
(Read/Write)
SNMP read/write community name that was
configured when the device was initially set up.
Device Name Device name.
Action Status Status of the action you selected.
7 Click Clear Entries to clear all entries from the table.
8 Click Execute. The server schedules and processes each entry and provides
feedback and action detail in the Action Status column.
28
OmniVista SafeGuard Manager Administration Guide
Page 29

chapter
Installation and Setup
2
This section includes the following:
■ Installing the OmniVista SafeGuard Manager Server
■ Upgrading the OmniVista SafeGuard Manager Server
■ Uninstalling the Server
■ Starting the Server
■ Shutting Down the Server
■ Installing the OmniVista SafeGuard Manager Client
■ Installing the OmniVista SafeGuard Manager Client
■ Logging into the OmniVista SafeGuard Manager Client
■ Connecting Over Firewall
Page 30
Chapter 2: Installation and Setup
Installing the OmniVista SafeGuard Manager Server
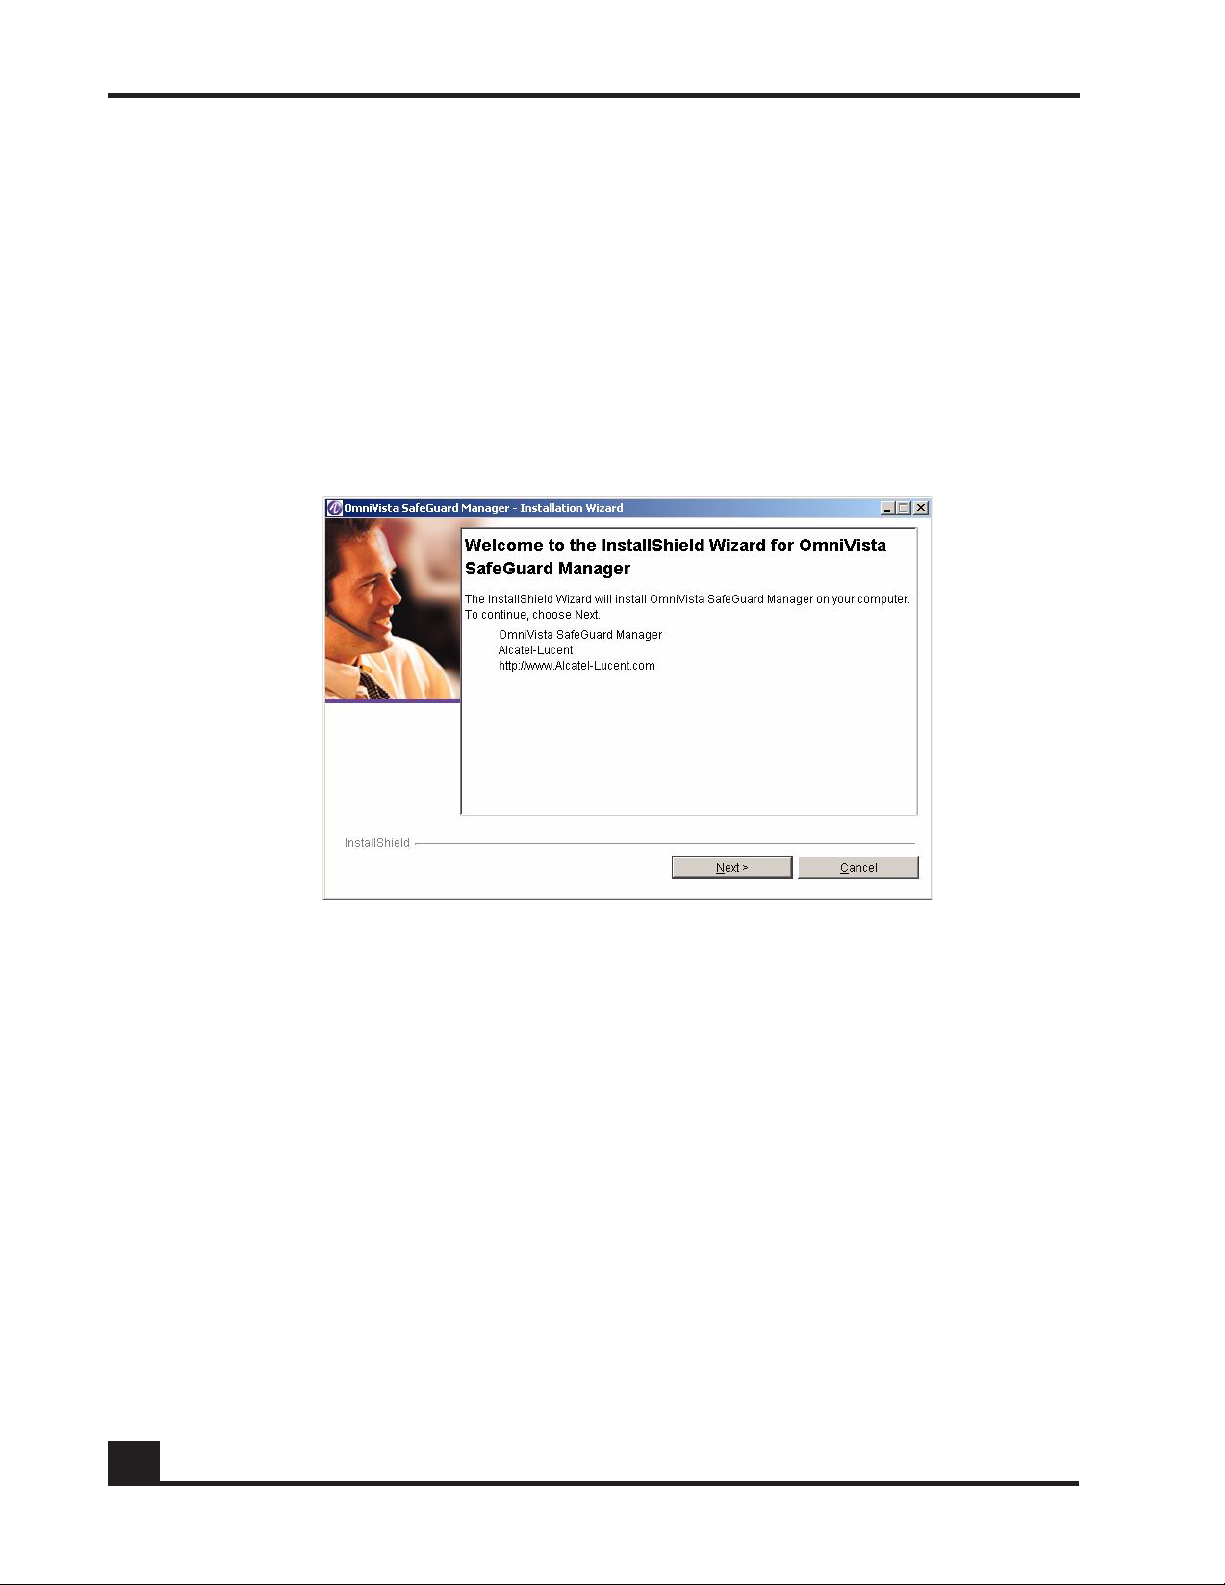
To install the OmniVista SafeGuard Manager server:
1 Double-click the executable file (
The Installation Wizard prepares Java Virtual Machine (JVM) and initializes the
installation wizard. This could take a few seconds.
After the initialization process is completed, the Welcome screen displays
(Figure 9).
Figure 9 Installation Welcome Screen
omnivista-safeguard-<version>.exe).
30
2 Click Next. The Alcatel-Lucent license agreement displays (Figure 10).
OmniVista SafeGuard Manager Administration Guide
Page 31

Figure 10 Alcatel-Lucent License Agreement
3 Accept the licensing terms and click Next.
Chapter 2: Installation and Setup
4 The Directory Location screen displays (Figure 11).
Figure 11 OmniVista SafeGuard Manager Alcatel-Lucent Installation Directory
Location
5 Accept the default location to which the installation files will be downloaded for
the Install Location, or click Browse to choose a different directory. The default
location is
C:\Alcatel-Lucent\OmniVistaSafeGuardManager. Specify a data
directory where all application, application flow, and visualization data is saved.
The data directory allows you to save data when you uninstall or upgrade to a
newer version of OmniVista SafeGuard Manager.
OmniVista SafeGuard Manager Administration Guide
31
Page 32

Chapter 2: Installation and Setup
6 If a previous version of OmniVista SafeGuard Manager already exists on your
system, a warning is displayed and you are given an option to exit the
installation.
7 Click Exit Installation to quit the installation process. Uninstall OmniVista
SafeGuard Manager and then re-install.
8 If a previous version is not installed, click Next. The Summary screen displays
giving you a summary of where the installation files will be downloaded and the
size of the files for the server and client installation.
Figure 12 Installation Summary
32
9 Click Next. The installation process begins. You can see the progress bar as the
files are downloaded. A console window displays informing you of services and
database being started.
10 After installation is completed, the OmniVista SafeGuard Manager Successfully
Installed screen displays. Click Finish.
OmniVista SafeGuard Manager server and client are now installed on your
system. The server is installed as a Windows service. An icon for the OmniVista
SafeGuard Manager client is created on your desktop.
11 Server start screen displays asking if you want to start the server. Click Yes to
restart the server.
Figure 13 Server Start
OmniVista SafeGuard Manager Administration Guide
Page 33

Chapter 2: Installation and Setup
Upgrading the OmniVista SafeGuard Manager Server
When the appliance is shipped from Alcatel-Lucent it comes pre-installed with
OmniVista SafeGuard Manager. You need to uninstall OmniVista SafeGuard Manager
and then re-install to upgrade. For more information on installing, upgrading, and
uninstalling the server, see Installation and Setup.
WARNING: When you upgrade the OmniVista SafeGuard Manager server,
the existing database and reports are overwritten. Make sure that you make
a backup copy of the database and the reports.
Pre-Upgrade Tasks
When upgrading the OmniVista SafeGuard Manager server from version 2.x to 3.0, 2.x
data is not upgraded. Before performing an uninstall, administrators must export the
device data using the following procedure, this will help them import back all the
previously added devices:
1 Execute cimExportData.bat. This creates a file called “devices.txt” under the
C:\Alcatel-Lucent\OmniVistaSafeGuardManager|ExportData directory.
2 Uninstall the older version of the OmniVista SafeGuard Manager server.
3 Install the newer version of the OmniVista SafeGuard Manager server.
4 Import all devices through using the Add Multiple Devices > Import from File
option. For more information, see Adding Multiple Devices.
To upgrade the OmniVista SafeGuard Manager command center to the latest release:
1 Log in to the system using the administrator account.
NOTE: To uninstall or upgrade software, you must have
administrator-level privileges. Make sure you log in using the user
account that is set up with these privileges.
2 Uninstall the existing version using the Windows shortcut from the Start menu,
Programs > OmniVista SafeGuard Manager > Uninstall > Uninstall OmniVista
SafeGuard Manager.
3 Follow the on-screen prompts using default options.
4 Reboot the system when the uninstallation is completed.
5 After the system is rebooted, double-click on the installation package (omnivista-
safeguard-<version>.exe) available on the installation CD.
OmniVista SafeGuard Manager Administration Guide
33
Page 34

Chapter 2: Installation and Setup
6 Follow the on-screen prompts using default options.
7 After the installation is completed, you have to start the OmniVista SafeGuard
Manager server. For more information on starting the server, see Starting the
Server.
Uninstalling the Server
To uninstall the server:
1 From the Start menu, click Programs > OmniVista SafeGuard Manager > Uninstall >
Uninstall OmniVista SafeGuard Manager. The Welcome screen displays (Figure 14).
Figure 14 Uninstallation Welcome Screen
34
2 Click Next. A summary information window displays with directory location
information.
OmniVista SafeGuard Manager Administration Guide
Page 35

Figure 15 Uninstallation Summary
Chapter 2: Installation and Setup
3 Install asks you if you want to delete backup and data directories. Select No if you
want to save the data.
Figure 16 Delete Data Directory
4 Follow the on-screen prompts to uninstall the server. The uninstall wizard stops
the server and database, cleans the log files and begins the uninstallation process.
The status is displayed in a console window.
The uninstall process completes and a “OmniVista SafeGuard Manager
successfully uninstalled” window is displayed.
5 Click Next. Uninstall will ask you to restart the system.
6 Select the restart option and click Finish to complete the uninstall. All associated
files and shortcuts are removed from your system.
OmniVista SafeGuard Manager Administration Guide
35
Page 36

Chapter 2: Installation and Setup
Starting the Server
When you boot up the OmniVista SafeGuard Manager appliance, the OmniVista
SafeGuard Manager server is started automatically. However, if you upgraded the
software version or re-installed the software, you must manually start the server.
To manually start the server:
1 Use the Windows shortcut from the Start menu, Programs > OmniVista SafeGuard
Manager > Start Server. A GUI window displays. This window performs checks to
verify that all ports needed for the server are available, starts all the server
components as Windows services, and informs you when the server is ready.
2 Click OK to close the window.
The OmniVista SafeGuard Manager server runs in the background. If you now reboot the
system, the server should come up automatically.
Shutting Down the Server
To shut down the server:
1 From the Start menu, click Programs > OmniVista SafeGuard Manager > Stop Server.
The OmniVista SafeGuard Manager server is stopped along with the Windows
services.
NOTE: When you shut down the OmniVista SafeGuard Manager appliance,
the OmniVista SafeGuard Manager server is stopped automatically.
36
OmniVista SafeGuard Manager Administration Guide
Page 37

Chapter 2: Installation and Setup
Installing the OmniVista SafeGuard Manager Client
The OmniVista SafeGuard Manager client is based on Java Web Start technology,
allowing you to install the client automatically over the network with a single click.
NOTE: If the client machine has a JRE version that is earlier than 1.5, then the
client is automatically upgraded to JRE 1.5.
To install the client:
1 Launch Internet Explorer.
NOTE: Currently, only Internet Explorer version 6.0 or higher is supported.
2 Access the OmniVista SafeGuard Manager system by typing the following URL:
http://<server-ip-address>
If the client does not have Java Web Start already installed, you are prompted to
install Java Runtime Environment (JRE). Follow the on-screen prompts using the
default options to install JRE. Java Web Start is included with JRE.
NOTE: The automatic installation of JRE requires ActiveX controls to be
enabled on your Internet Explorer. If ActiveX controls are not enabled, a
“download Java Web Start” link displays. Internet Explorer also alerts you if
ActiveX controls are not enabled and gives you an option to enable ActiveX
controls. You can choose to enable ActiveX controls for automatic installation
of Java Web Start, or you can download JRE version 1.5.0 by going to the
download link. If you manually install Java Web Start, repeat Step 2.
After Java Web Start is installed, the OmniVista SafeGuard Manager client code is
downloaded and installed when you access the OmniVista SafeGuard Manager
server (Step 2).
Java Web Start displays a dialog box informing you that the application is
authored by Alcatel-Lucent and needs some privileges on your client system.
OmniVista SafeGuard Manager Administration Guide
37
Page 38

Chapter 2: Installation and Setup
Figure 17 Security Warning
3 Click Start. A prompt appears asking if you want to create a shortcut on the
desktop.
4 Select Yes to create a shortcut. If you select No, you can still launch the client
using the URL from Step 2.
The client launches. See Logging into the OmniVista SafeGuard Manager Client
for information on logging in procedures.
NOTE: Every time the OmniVista SafeGuard Manager client is
launched, it compares its version with the OmniVista SafeGuard
Manager server. If the client version is different than that of the server,
the client automatically updates itself with the new version of the
server.
38
OmniVista SafeGuard Manager Administration Guide
Page 39

Chapter 2: Installation and Setup
Logging into the OmniVista SafeGuard Manager Client
To log into the client:
1 Launch the client using either of the following methods:
— Double-clicking on the shortcut that was created on your desktop when you
first installed the client.
— Invoking from the Internet Explorer by typing the URL (http://ip-address-of-
OmniVistaSafeGuardManager-server).
NOTE: If you are launching the client from the server for the first
time, you might be prompted to install certain applications. See
Installing the OmniVista SafeGuard Manager Client for more
information.
The Login screen displays (Figure 18).
Figure 18 OmniVista SafeGuard Manager Client Login Screen
2 In the Username field, type
3 In the Password field, type
admin as the default user.
password.
OmniVista SafeGuard Manager Administration Guide
39
Page 40

Chapter 2: Installation and Setup
4 Click Login. If you are logging in for the first time to the OmniVista SafeGuard
Manager server, the Alcatel-Lucent License Agreement displays. You must accept
it to use OmniVista SafeGuard Manager.
NOTE: The Alcatel-Lucent license agreement is a one-time
acknowledgement for each server and is not displayed for this client
or any other client or this server.
The client is launched and the dashboard is displayed (Figure 19).
Figure 19 OmniVista SafeGuard Manager Client - Dashboard
40
OmniVista SafeGuard Manager Administration Guide
Page 41

Connecting Over Firewall
If a firewall exists between the OmniVista SafeGuard Manager client and the OmniVista
SafeGuard Manager server, or between the OmniVista SafeGuard Manager server and the
SafeGuard OS device, certain ports must be opened for successful deployment. Ta bl e 4
gives the number of ports that must be open:
Table 4 Ports that must be open for successful deployment
When connecting... Ports that need to be open...
Chapter 2: Installation and Setup
Between the OmniVista
SafeGuard Manager
server and client
Between the OmniVista
SafeGuard Manager
server and the SafeGuard
OS device
■ TCP 80
■ TCP 1099
■ TCP 8003
■ TCP 8004
■ TCP 8011
■ UDP 161
■ TCP 16001
■ TCP 16002
■ TCP 16005
■ UDP 69
OmniVista SafeGuard Manager Administration Guide
41
Page 42

Chapter 2: Installation and Setup
42
OmniVista SafeGuard Manager Administration Guide
Page 43

chapter
General Navigation
3
This section includes the following:
■ Viewing Visualization Tables
■ Choosing Columns in a Table
■ Searching and Sorting
■ Exporting and Printing Data
■ Using the Status Bar
Page 44

Chapter 3: General Navigation
Viewing Visualization Tables
Visualization allows administrators to track what a user is doing, what applications are
being used, and what is being done to a network. Such tracking is useful for forensic and
postmortem purposes, that is, for debugging and ensuring that the network is
performing at its optimum and there are no threats to the network. SafeGuard collects
this data and periodically pushes it in tabular format to OmniVista SafeGuard Manager
as visualization data.
Visualization data can be viewed in tabular format for the following objects:
Table 5 Table Views
Table Type Description
Policy Incidents Displays a list of all policy incidents against a user. For more information,
see Viewing Policy Incidents.
Malware Incidents Displays a list of malware incidents. This table also displays the counts of
various severities of the infection events. For more information, see
Viewing Malware Incidents.
Posture Incidents Displays all posture incidents, including EPV incident ID, host IP and MAC
addresses. For more information, see Viewing Posture Incidents.
User Displays user authentication and bandwidth usage that is aggregated
for each user. Typically this has a navigation tree on the left panel that
helps finds users belonging to a specific group/role or connected to a
specific port of a specific device. For more information, see, Viewing
User Sessions.
Application Type Displays the user bandwidth usage that is aggregated for each type of
application. For more information, see Viewing Application Types.
Application Instance Displays the user bandwidth usage for each user, application type,
destination port, and destination IP address. For more information, see
Viewing Application Instances.
Application Flows Allows an administrator to view application flows for a selected user or
application. For more information, see Viewing Application Flows.
When you click on a table view, you are presented with a table that shows all visible data
and a column to the left that lets you customize or view data by time, incident, location,
and so forth (Figure 20).
44
OmniVista SafeGuard Manager Administration Guide
Page 45

Figure 20 Table View (Users)
Chapter 3: General Navigation
Viewing Table Data
To view table data:
1 Use the Action Bar buttons to navigate from one type of table view to another. See
Viewing Visualization Tables for more information on different table views.
2 Use the scroll buttons at the top of the table to scroll through the data, one page at
a time, previous page, next page, first page, or last page.
3 Use the fields in the left column to customize viewable data as follows:
Attribute Description
Status From the dropdown list, select to view incidents by status:
■ Active—displays all active incidents
■ Inactive—displays all inactive incidents
OmniVista SafeGuard Manager Administration Guide
45
Page 46

Chapter 3: General Navigation
Attribute Description
Time Range From the dropdown list choose a time for which you want to view table
data. Following values are available:
■ Current Hour—displays incidents for the current hour
■ Last Hour—displays incidents for the last hour
■ Current Day—displays incidents for the current day
■ Last Day—displays incidents for the day before
■ Previous Day—displays incidents for the previous 24 hours.
■ Previous Hour—displays incidents for the hour before the current time.
■ Custom—allows you to enter a specific time in the From and To time
fields
Time Filter Display incidents by:
■ Detection Time—time when incident was detected (first occurrence,
last occurrence, login time, and logout time depending on the view)
■ Cleared Time—time when incident was cleared
From/To These fields are only applicable if you select Custom in the time range. A
dropdown arrow provides you with a calendar to specify the date and
time in the From and To fields.
And... Click And to specify additional time filters. For more information on using
the this field, see Additional Time-based Filtering.
Users Select to view users by authentication state, type, application group,
and so forth.
All roles Select to view incidents for a specific role.
VLAN Filtering Allows you set up visualization filters based on VLAN IDs.
All locations Select to view incidents for a specific building or location.
In general, all table views allow you to search and sort the data. You can search and sort
data:
■ at the currently displayed page level
■ at the database level
For more information on how you can search and sort data, see Searching and Sorting.
46
OmniVista SafeGuard Manager Administration Guide
Page 47

Chapter 3: General Navigation
Navigating between Different Table Views
The single-window design in OmniVista SafeGuard Manager lets you navigate from one
view to another with a single click of a button. Figure 21 below shows the different views
to which you can navigate from a given table view. For example, from the User view you
can use the Action Bar buttons to access Posture Incidents, Malware Incidents, Policy
Incidents, Applications, and Application Instances.
Figure 21 Navigating between Different Table Views
OmniVista SafeGuard Manager Administration Guide
47
Page 48

Chapter 3: General Navigation
Choosing Columns in a Table
OmniVista SafeGuard Manager allows you to choose and set the order in which you view
the columns in a given table view. These settings are remembered in Windows for each
user and are applied when you visit the same table again. However, you can reset the
column order to its default value at any given time. From the menu bar, select Tool s >
Client Settings> Reset Views>.
To hide or select the columns in a table view:
1 From a table view (All Users, All Application Types, and so on), click the Edit
icon from the Action Bar. The Column Editor displays with a list of hidden and
displayed columns (Figure 22).
Figure 22 Column Editor
48
2 Use the Column Editor buttons as described to hide or display a column in the
table view:
Table 6 Column Editor Buttons
Button Name Function
Display All Select Display All to display all the columns available in the
table.
Display Highlight a column in the Hidde n Columns panel and click Dis-
play to add to the Displayed Columns panel.
OmniVista SafeGuard Manager Administration Guide
Page 49

Chapter 3: General Navigation
Table 6 Column Editor Buttons (continued)
Button Name Function
Hide Select a column in the Displayed Columns panel and click Hide
to remove it from the display list. This will hide the column from
the table view.
Hide All Select Hide All to hide all the columns from the table view.
Top Select a column in the Display Columns panel and click Top to
move the selected column to the top of the list. This will be the
first column displayed in your table view.
Up Select a column in the Display Columns panel and click Up to
move the selected column one level up in the list.
Down Select a column in the Display Columns panel and click Down to
move the selected column one level down in the list.
Bottom Select a column in the Display Columns panel and click Bottom
to move the selected column to the bottom of the list. This will be
the last column in the table view.
The Table Preview panel (bottom of the Editor window) gives you a preview of
your table as you make these selections.
3 Click OK to apply the changes. When you go into the table view, the columns are
displayed in the order you selected here.
4 Click Reset to reset the columns to the previous settings.
5 Click Cancel to exit out of the Column editor without making any changes.
NOTE: When in table view, you can also change the display order of the
columns in a table by selecting and dragging a column. You can also change
the column width by dragging the column header separator. These settings are
remembered by the Windows client machine for each user.
OmniVista SafeGuard Manager Administration Guide
49
Page 50

Chapter 3: General Navigation
Searching and Sorting
Most of the visualization tables display a maximum of 1,000 rows. When the number of
rows that exist in the database is more than can be displayed in a window, page
navigation buttons are shown in the top-right corner of the screen (Figure 23).
NOTE: If you increase the page size from 1,000 rows, data retrieval
may take longer.
Figure 23 Tables - Partial View
You can search and sort the data displayed in tabular views using either of the following
methods:
■ Search and sort the data displayed in table views by entering text in the free-form
search panel. This method applies a search and sort order that is local to the data
currently displayed.
■ Search the whole database by applying database queries and search criteria. This
method applies the search to the server database and refreshes the client data.
NOTE: The page forward, page back, first page, and last page buttons
allow you to navigate between multiple pages of the search/sort
results. You can also change the limit on the number of records that are
displayed. Simply, click on the page number at the top of the table and
enter the page size in the text box that is displayed.
50
OmniVista SafeGuard Manager Administration Guide
Page 51

Searching Table Data Locally
To search table data locally:
1 Select View > Go To > Users (or any other menu item, or click an icon from the Page
Bar to get to a table view). In a table view, click the Find icon. A free-form
text search field displays (Figure 24).
Figure 24 Free-Form Search Fields
2 Enter a keyword on which to base the search.
Chapter 3: General Navigation
Sorting Table Data Locally
To sort the table data locally:
1 In table view, click on a column header. The first column header that you click on
becomes the primary sort field (indicated by a slightly larger arrow). You can click
on several column headers to add them to the sort as a secondary sort and
perform a multi-level sort.
2 Double-click on a column header to reset the sort to a single column and clear the
sort on all other fields.
3 Single-click on an already sort-enabled header to toggle the sort order between
ascending or descending.
OmniVista SafeGuard Manager Administration Guide
51
Page 52

Search bar
sort button
Chapter 3: General Navigation
Searching and Sorting Data in the Entire Database
Most table columns allow search and sort on the database; however, certain columns do
not have this functionality.
To search and sort the database on the server:
1 In a table view, click the Find icon. A search panel displays (Figure 24).
2 Click Database Search. The column headers now have search fields and sort
buttons (Figure 25).
Figure 25 New Search Fields for Table Headers
3 Click on the search bar of the column. A search criteria dialog box opens, allowing
you to specify the search criteria.
Figure 26 Search Criteria Dialog
4 Select a condition from the dropdown list, and specify a search condition
(username, IP address, and so on). If you want to specify more than one search
condition, select a condition from the condition dropdown list; then click More to
add more than one parameter. Up to 5 search conditions can be applied using the
following operators combined together:
=equal to
!= more than one
52
<less than
<= less than or equal to
> greater than
>= greater than or equal to
OmniVista SafeGuard Manager Administration Guide
Page 53

5 Click OK. Your search criteria are applied.
6 Click on the sort button (Figure 25) to apply the sort criteria for that column. You
can apply multi-level sorts. The numbers on the sort buttons signify the sorting
order. A sort can be applied in either an ascending or a descending order. If you
want to reset the sort order, double-click a column to make it the primary sort and
reset all other columns.
7 After you have set the filters for one or more columns, click the Refresh icon
in the Action Bar to see new results.
NOTE: Toggle the Advance button to clear the advance filters.
Exporting and Printing Data
Chapter 3: General Navigation
OmniVista SafeGuard Manager allows you to export data into a comma-separated value
(CSV) file format. CSV format is often used to exchange data between disparate
applications. CSV files can easily be exported, for example, into Excel worksheets. You
can also print any visualization tables or columns or reports.
To export data in CSV format:
1 From a table view, click the Export icon. A Windows file browser dialog box
displays.
2 Specify the name and location for the file. The file is saved with a csv extension.
To print data:
1 From a table view, click the Print icon. A Windows Print browser dialog box
displays.
2 Select a printer and click OK. The file is printed to the printer you specified.
OmniVista SafeGuard Manager Administration Guide
53
Page 54

Chapter 3: General Navigation
Using the Status Bar
The status bar displays the progress of an action, for example, when you synchronize a
device or retrieve data, and when there are any alarms or infections on a device
(Figure 27).
Figure 27 Status Bar
The little green icon on the right corner of the status bar has a tool tip which displays
the current OmniVista SafeGuard Manager Server Health parameters. A sample display
of current values using tooltip is shown below.
54
OmniVista SafeGuard Manager Administration Guide
Page 55

chapter
Visualization
4
This section includes the following:
■ Overview
■ Dashboards
■ Configuring Dashboards
■ Viewing Visualization Data
■ Viewing Time-based Data
Page 56

Chapter 4: Visualization
Overview
Network visualization is the ability to determine detailed information about what users
are doing in the network. Data collected during visualization is aggregated and
maintained in a relational database using a set of tables (see Tab l e 1 0 for more information
on the kind of data collected).
By having the events be user-based, network visualization allows an administrator to
monitor data in a manner that presents the data in a drillable and easily digestible format.
You can take remediation steps faster when you have a better understanding of a
problem and can act upon a network event.
For example, you have a vendor working on site on a regular basis. You might want to
give this vendor more privileges than a visitor, but might also want to restrict vendor use
to certain applications or file types. Network visualization allows you to configure
policies to block access and log information about that access to OmniVista SafeGuard
Manager. You can also set up visualization filters that enable you to selectively view
events based on VLAN ID, application type, or user role.
Network visualization provides all the user, application, and performance information
you need to have visibility into the network usage through the real-time dashboards (for
more information, see Dashboards). This usage is constant and covers all points in the
network. Visualization events are collected and stored for each user or application. The
OmniVista SafeGuard Manager command center provides dynamic, high-level views of
security information, including:
■ Providing real-time and historical data
■ Identifying who is using the network and viewing aggregated data for each user
■ Identifying applications and resources as they interact with each other and
viewing aggregated data for each application
■ Identifying traffic patterns that represent normal and legitimate use of the
network
■ Identifying which traffic patterns represent abnormal (and possibly abusive)
behavior
■ Identifying when important events occur
■ Identifying classified documents that passed over the network
■ Maintaining the malware state of all hosts and allowing administrators to reset
the malware state of hosts
56
OmniVista SafeGuard Manager Administration Guide
Page 57

Dashboards
The OmniVista SafeGuard Manager command center comes with three pre-defined realtime dashboards:
■ Security Incidents
■ User Sessions with Incidents
■ Network Awareness
These dashboards display current day counters.
Security Incidents
The Security Incidents dashboard refreshes every 60 seconds but can also be refreshed
using the F5 key. You can access this dashboard (Figure 28) by clicking the Incidents tab
on the dashboard. The Incidents tab displays statistics based on incident instances
irrespective of users. For example, if user U1 has 100 incidents and user U2 has one
incident, this tab is going to show 101 incidents. Any new incident will raise the bar
height.
Chapter 4: Visualization
Figure 28 Dashboards - Security Incidents Tab
OmniVista SafeGuard Manager Administration Guide
57
Page 58

Chapter 4: Visualization
The Incidents dashboard displays the following information:
■ Security Level Meter
■ User Sessions Summary
■ Device Status
■ Authentication Failures
■ Policy Incidents
■ Malware Incidents by Category
■ Incidents for Unauthenticated Users
■ Top User Roles with Incidents/Incident Counts
Security Level Meter
The Security Level Meter (top-left panel) shows weighted incidents per user. The gauge
moves to the right as the incidents grow. The severity level is indicated on a scale of 1-5,
where 1 is the lowest and 5 is the highest severity level.
Figure 29 Security Level Meter
User Sessions Summary
The User Summary table (top-center panel) displays important statistics about the hostside user counts: total active users, authenticated active users, unauthenticated active
users.
Figure 30 User Sessions Summary
58
OmniVista SafeGuard Manager Administration Guide
Page 59

Chapter 4: Visualization
Device Status
The Device Health pie chart shows the connectivity health of a device. Devices that are
healthy show up in green and devices that cannot be reached, show up in red.
Figure 31 Device Health
You can access Device Management by clicking on the Device Health panel. For more
information on Device Management, see Chapter 5, Device Configuration.
Authentication Failures
The Authentication Failures bar chart displays the various kinds of access control
incidents:
■ Captive Portal—displays the number of users that have failed authentication
using the Captive Portal.
■ Kerberos—displays login failures occurred authenticating users through
Kerberos.
■ RADIUS—displays the number login failures occurred authentication users
through RADIUS.
Figure 32 Authentication Failures
OmniVista SafeGuard Manager Administration Guide
59
Page 60

Chapter 4: Visualization
Policy Incidents
The Policy Incidents bar chart shows various types of policy incidents, all policy
incidents, Web, IM, or network connectivity incidents only. For more information on
policy incidents, see Viewing Policy Incidents.
Figure 33 Policy Incidents
Malware Incidents by Category
The Malware Incidents bar chart shows various types of malware incidents: by category:
■ number of IP scans that were blocked
■ number of IP scans that were unblocked
■ number of port scans that were blocked
■ number of port scans that were unblocked
■ number of DoS incidents that were blocked
■ number of DoS incidents that were unblocked
Click on each bar to display a corresponding list of malware events. For more
information on viewing malware incident details, see Viewing Malware Incidents.
Figure 34 Malware Incidents by Category
60
For more information on viewing malware incident details, see Viewing Malware Incidents.
OmniVista SafeGuard Manager Administration Guide
Page 61
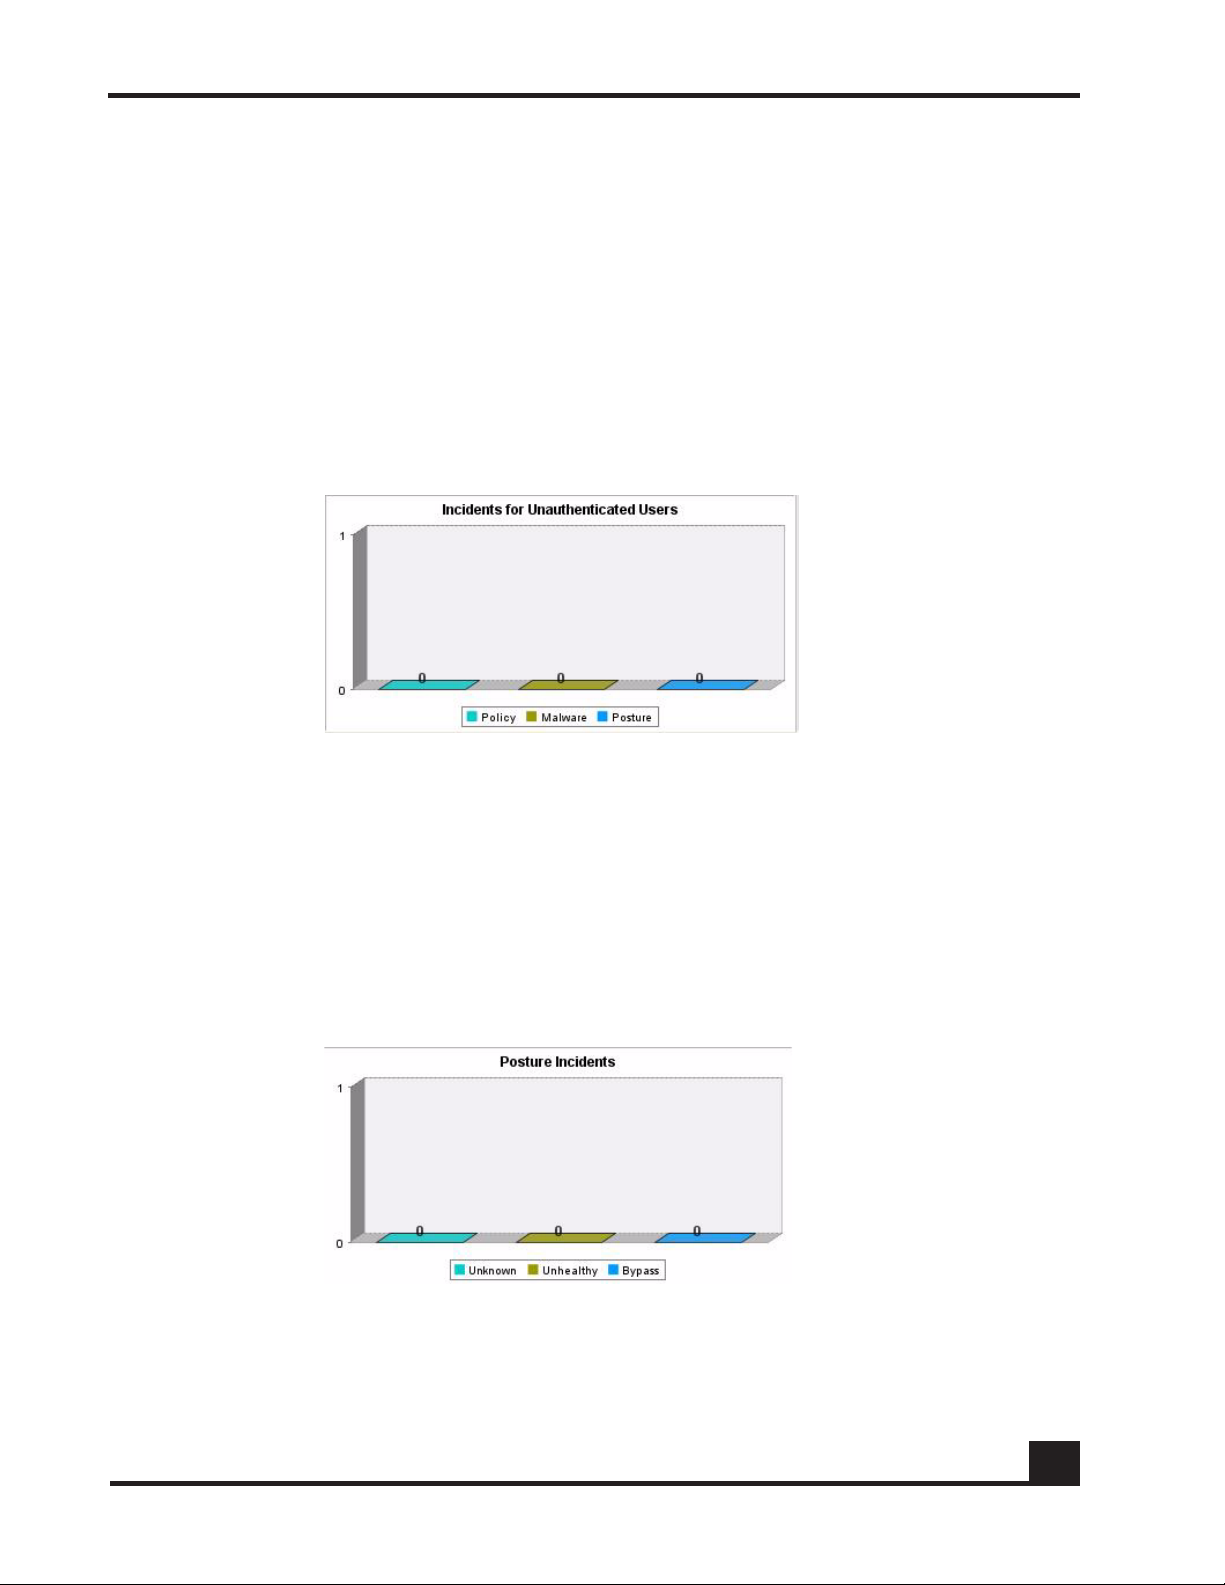
Chapter 4: Visualization
Incidents for Unauthenticated Users
The Incidents for Unauthenticated Users chart summarizes the various incidents in the
network that are caused by unauthenticated users:
■ Users with Policy Incidents—number of unauthenticated users that are violating
resource access policies.
■ Users with Malware Incidents—number of unauthenticated users that are
violating malware policies.
■ Posture—number of unauthenticated users that are causing posture incidents.
Figure 35 Incidents for Unauthenticated Users
Click on each bar to view user details including corresponding incidents. For more
information on viewing user details, see Viewing User Sessions.
Posture Incidents
The Posture Incidents bar chart shows various types of posture incidents, unknown,
unhealthy, or bypass. For more information on posture incidents, see Viewing Posture
Incidents.
Figure 36 Posture Incidents
OmniVista SafeGuard Manager Administration Guide
61
Page 62
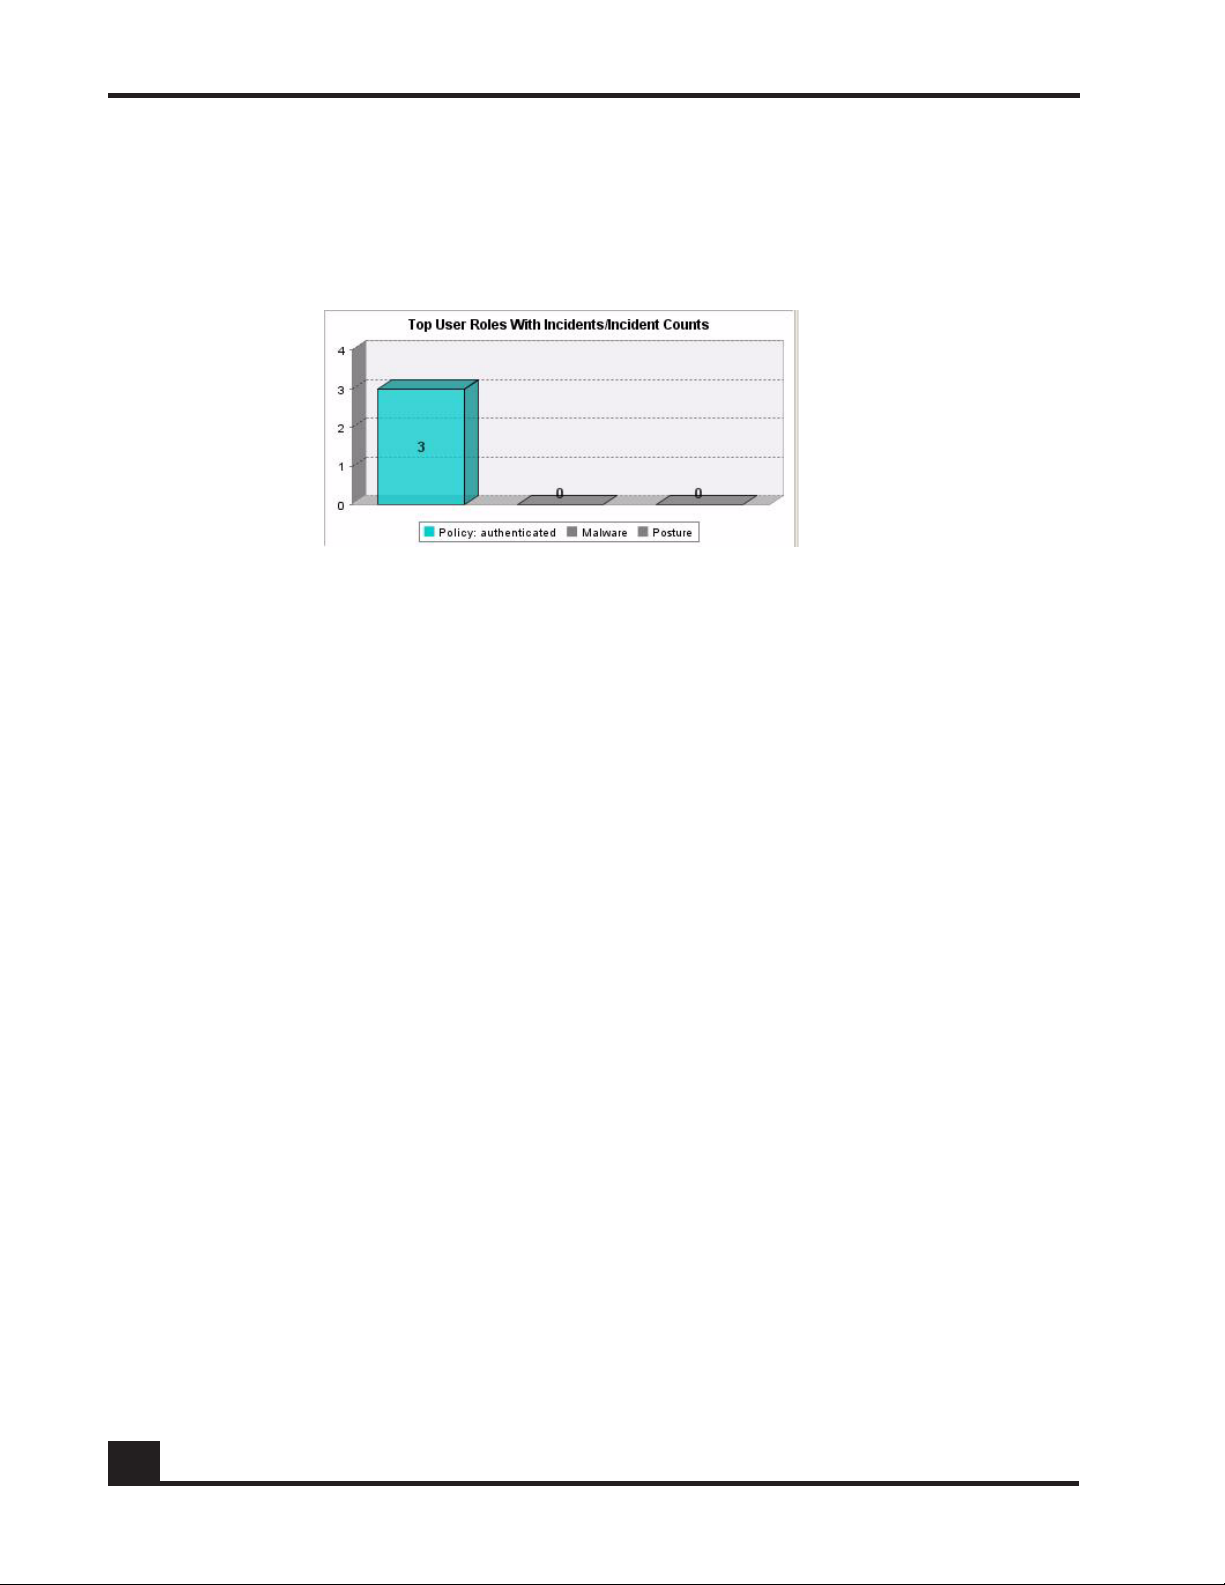
Chapter 4: Visualization
Top User Roles with Incidents/Incident Counts
The Top User Roles with Incidents bar chart displays the top user roles that are
generating the maximum number of policy, malware, or posture incidents.
Figure 37 Top User Roles with Incidents
Click on any bar to display the associated top roles with most incidents window.
User Sessions with Incidents
The User Sessions with Incidents tab displays similar information as the Security
Incidents tab but the statistics displayed is more user-centric. For example, if user U1 has
100 incidents and user U2 has one incident, the statistics are displayed as 2 users
generating incidents, even though there are a total of 101 incidents. The bar height goes
up only when there is a new user generating an incident.
62
OmniVista SafeGuard Manager Administration Guide
Page 63

Network Awareness
The Network Awareness dashboard displays various application usage patterns and
statistics for active users. The modules are automatically refreshed every 5 minutes. You
can also use the F5 key to refresh the modules.
In the Network Awareness dashboard, double-click on the module header to display the
associated detail information. For example, if you double-click the Top 10 User Sessions
by Bandwidths module header, the Top 10 User Sessions window is displayed with user
details and the bandwidth usage. However, some modules allow row details. For such
modules, select a row and double-click to see associated detail information.
NOTE: You can right click on any module to display the details in either a bar
graph or a pie chart format. You can also select to hide or display the legend
that accompanies the graph. You can also position the mouse cursor on any of
the bar graph or pie chart element to get tooltips.
Figure 38 Dashboard - Network Awareness Tab
Chapter 4: Visualization
OmniVista SafeGuard Manager Administration Guide
63
Page 64

Chapter 4: Visualization
The Network Awareness dashboard displays the following information:
■ Top 10 User Sessions by Bandwidth
■ Top 10 User Sessions with Most Blocked Incidents
■ Top 10 Destinations
■ Top 10 Web Sites
■ Top 10 Applications by Flow Count
■ Bottom 10 Applications by Flow Count
■ Top 10 Applications by Bandwidth (Bar Chart)
Top 10 User Sessions by Bandwidth
The Top 10 User Sessions by Bandwidth table displays the name and usage of the top 10
user sessions by bandwidth. The bandwidth is shown in terms of percentage (%) usage.
Figure 39 Top 10 User Sessions by Bandwidth
Click on the column header to display a list of users, including all user details. For more
information on viewing user details, see Viewing User Sessions.
Top 10 User Sessions with Most Blocked Incidents
The Top 10 User Sessions with the Most Blocked Incidents shows the IP addresses of the
top 10 user sessions that had the most blocked policy incidents. Username is displayed
only if available.
64
Figure 40 Top 10 User Sessions with Most Blocked Incidents
OmniVista SafeGuard Manager Administration Guide
Page 65
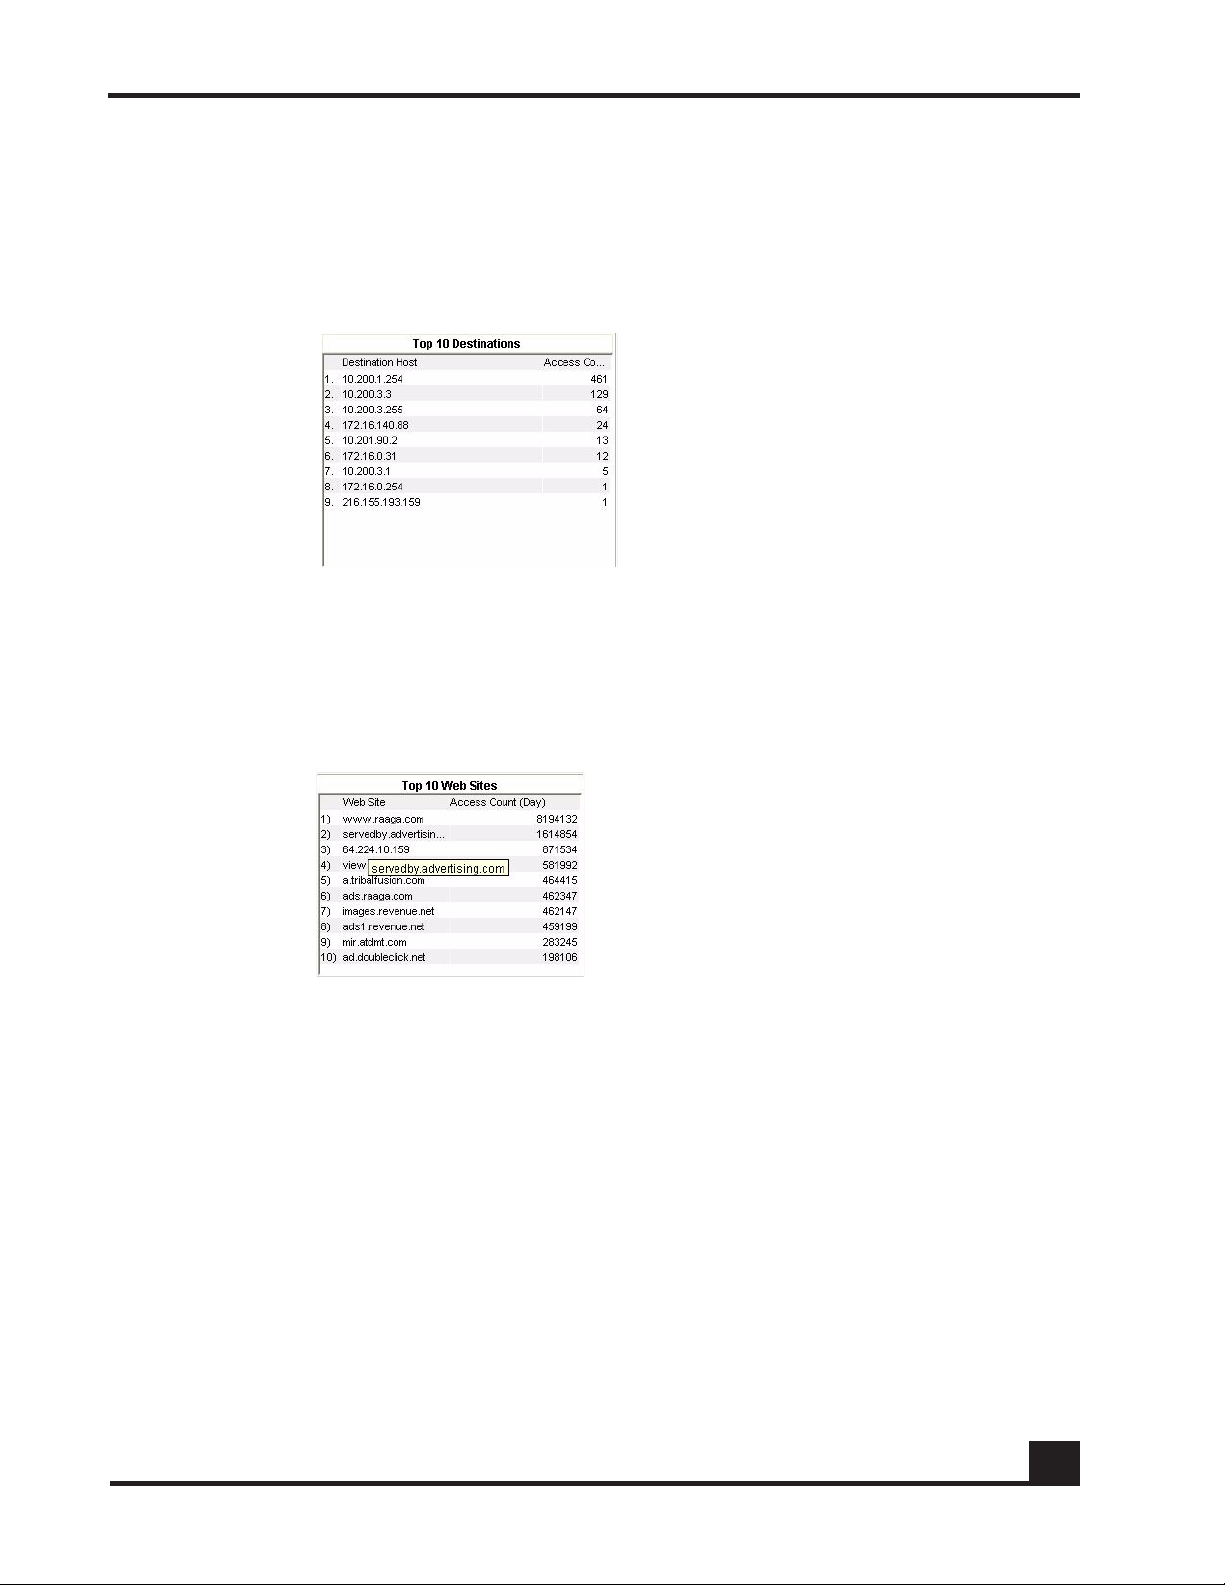
Chapter 4: Visualization
Top 10 Destinations
The Top 10 Destinations table displays IP addresses of the top 10 destinations that users
frequently visited, with the destination IP address that has the most hits being displayed
at the top.
Figure 41 Top 10 Destinations
Top 10 Web Sites
The Top 10 Web Sites table displays the names of the top 10 sites visited by users,
including the number of times each site was visited.
Figure 42 Top 10 Web Sites
OmniVista SafeGuard Manager Administration Guide
65
Page 66

Chapter 4: Visualization
Top 10 Applications by Flow Count
The Top 10 Application by Flow Count table displays the names and the number of
instances (destination IP and port pairs) of the top 10 applications by instances.
Figure 43 Top 10 Application by Flow Count
Click on the column header to display a list of applications, including all application
instance details. You can also place the mouse cursor on the pie chart to display tooltips.
For more information on viewing application instances, see Viewing Application Instances.
Bottom 10 Applications by Flow Count
The Bottom 10 Application by Flow Count table displays the names and the number of
instances (destination IP and port pairs) of the last 10 applications by instances.
Figure 44 Last 10 Applications by Flow Count
66
Click on the column header to display a list of applications, including all application
instance details. You can also place the mouse cursor on the pie chart to display tooltips.
OmniVista SafeGuard Manager Administration Guide
Page 67

Chapter 4: Visualization
Top 10 Applications by Bandwidth (Bar Chart)
The Top 10 Applications by Bandwidth bar chart displays the names and usage of the top
10 applications by bandwidth. The bandwidth is shown in terms of percentage (%) usage.
Figure 45 Top 10 Applications by Bandwidth (Bar Chart)
Click on this panel to display a list of applications, including application details. Click on
an individual bar to display the details for the selected application, including application
statistics, number of users using the selected application, list of destination IP and port
pairs (application instances). For more information on application types and instances,
see Viewing Application Types and Viewing Application Instances.
OmniVista SafeGuard Manager Administration Guide
67
Page 68

Chapter 4: Visualization
Configuring Dashboards
If you find that the default pre-defined dashboards do not conform to your needs,
OmniVista SafeGuard Manager allows you to copy the existing dashboards and then
customize them accordingly or create new ones from scratch. Each dashboard comprises
of the following three tabs:
■ Layout—The Layout tab is where you define how the modules are positioned and
displayed in a panel. This is where you also define the order in which the
dashboards are to be displayed.
■ Modules—Within any given module, you can configure bars. Each module
should have a minimum of one bar. You can select the number of modules you
want displayed and how they are displayed. The modules can be configured by
the user and OmniVista SafeGuard Manager also comes with pre-defined system
modules. The system modules within a dashboard can be of the following sizes:
— Regular height and width
— Pre-defined half-height
— Pre-defined double-width (displays in two columns)
The configurable modules will always be of regular height and width.
Any user-configured modules can be cloned or edited; however, only the system
modules that are of regular height and width (User Login Failures, Policy
Incidents, Users with Policy Incidents, Malware, Unauthenticated User incidents,
Posture incidents (Unhealthy, Bypass, Quarantine) can be cloned or modified on a
global level, not on a per-user or per-role basis. Any newly cloned (copied) or
created dashboard layout can then be modified to rearrange the layout. Any
module can only be replaced with a module of the same size. For information on
how to configure modules, see Defining Modules within a Dashboard
NOTE: OmniVista SafeGuard Manager does not allow you to
configure all modules. Only the User Login Failures, Policy Incidents,
Users with Policy Incidents, Malware, Unauthenticated User incidents,
Posture incidents (Unhealthy, Bypass, Quarantine) modules can be
cloned or modified on a global level, not on a per-user or per-role basis.
■ Bars—A bar is the smallest component of the dashboard that describes which
query template is to be used. Each bar in a module corresponds to a query that
retrieves data from the server. The Bar tab is where you define the bar display
attributes and their titles. For more information on bars, see Defining Bars within a
Module.
68
OmniVista SafeGuard Manager Administration Guide
Page 69

Defining Modules within a Dashboard
To create a new dashboard:
1 Click the Dashboard icon from the Page Bar or from the menu, select View > Go To
> Dashboard (Ctrl + 0). The Dashboard displays.
2 Click the Configure icon from the Action Bar. The Dashboard Configuration
screen displays (Figure 46).
Figure 46 Dashboard Configuration
Chapter 4: Visualization
3 Click New. The Add New Layout window displays (Figure 47).
OmniVista SafeGuard Manager Administration Guide
69
Page 70

Chapter 4: Visualization
Figure 47 Add New Layout
4 Enter the configuration as follows:
Table 7 New Layout Attributes
Attribute Name Description
Name Enter a name for the new dashboard.
Number of Columns From the dropdown list, select the number of columns you
want in the new dashboard.
Number of Rows From the dropdown list, select the number of rows you want
in the new dashboard.
Reset Resets the dashboard values to the new values.
Time Range Specify the time range for which you want to display data.
This field uses the time filter applied in the bar chart and then
applies the time range applied for the module. Valid values
are:
■ Current day: current calendar day
■ Past 24 hours
■ Last hour
70
OmniVista SafeGuard Manager Administration Guide
Page 71

Chapter 4: Visualization
Table 7 New Layout Attributes (continued)
Attribute Name Description
Fixed Row Location Check the top checkbox if you want the fixed row to display
at the top of the dashboard. Check the bottom checkbox if
you want the fixed row to display at the bottom. Only
specific modules are allowed in the fixed row area. For
example, Device Health, User Statistics, Top 3 Role with
policy incidents.
5 Click a module to configure it. The Module Selection screen displays (Figure 48).
Figure 48 Module Selection
6 Highlight a module name.
7 Select a Component Width. This allows you to specify whether your module will
span a single column or more than one.
NOTE: How many columns you can have a module spanning
depends on the column you are defining. For example, if you are
defining a middle column in a three-column dashboard, you will only
be able to span that module across two columns, because the first
module may already have a column defined.
OmniVista SafeGuard Manager Administration Guide
71
Page 72

Chapter 4: Visualization
8 Click Select. The properties of the selected module are applied to the module in
the new dashboard.
9 Repeat the process till all modules have been specified.
10 Click Edit Order on the Dashboard Configuration dialog box (Figure 46). The
Dashboard Tabs Order Editor displays (Figure 49).
Figure 49 Dashboard Tabs Order Editor
NOTE: Not all modules are configurable. If a module can be cloned or
edited, the Clone and Edit buttons are available.
72
11 The Dashboard Tabs Order Editor allows you to select the order in which you
want the dashboards to be displayed. Use the Tab Editor buttons as described to
hide, display, or change the order tab in the dashboard view:
Table 8 Dashboard Tab Order Editor Buttons
Button Name Function
Select All Click Select All to move all the dashboards in the Selected
column. All dashboards will display when you go to the dashboard view.
Select Highlight a dashboard in the Unselected column and click
Select to move the dashboard to the Selected column.
OmniVista SafeGuard Manager Administration Guide
Page 73

Chapter 4: Visualization
Table 8 Dashboard Tab Order Editor Buttons
Button Name Function
De-select Highlight a dashboard in the Selected column and click De-
select to remove it from the selected list. This dashboard will
not display as a tab when you go into dashboard view.
De-select All Click De-select All to remove all dashboards from the
selected list.
Top Select a dashboard in the Selected column and click Top to
move the dashboard to the top of the list. This dashboard will
display as the first tab in the dashboard view.
Up Select a dashboard in the Selected column and click Up to
move the dashboard one level up in the list.
Down Select a dashboard in the Selected column and click Down
to move the dashboard one level down in the list.
Bottom Select a dashboard in the Selected column and click Bottom
to move the dashboard to the bottom of the list. This dashboard will display as the last tab in the dashboard view.
12 Click OK to apply the changes.
13 Click Refresh in the Action Bar to bring up the configured dashboards to the
current dashboard. The dashboard tabs will appear in the order you specified.
To clone or edit an existing dashboard:
1 In the Dashboards view, click the Configure icon from the Action Bar. The
Dashboard Configuration screen displays (Figure 46).
2 Select a dashboard configuration that you want to clone or edit.
3 Click Edit to change the configuration or Clone to copy the configuration of the
selected dashboard. The Layout Configuration screen displays (Figure 50).
OmniVista SafeGuard Manager Administration Guide
73
Page 74

Chapter 4: Visualization
Figure 50 Layout Configuration
4 Select the number of Rows and Columns using the dropdown lists.
5 Select the checkbox for whether you want the fixed row location to be on top or at
the bottom.
6 Select the module that you want to change. The Module Selection screen displays
(Figure 48).
7 If it’s a user-configured module, the Edit, Clone, and Delete buttons will be
active. Make the modifications as necessary and click OK.
NOTE: You can only delete a user-configured module. However, if the
module properties are being used in another module or dashboard, an
error message is displayed and deletion will not occur.
8 Use the Order button to change the order of the dashboard tabs. See Ta b le 8 for
more information on using the Order button.
74
OmniVista SafeGuard Manager Administration Guide
Page 75

Chapter 4: Visualization
Using Pre-defined Modules
OmniVista SafeGuard Manager allows you to configure custom dashboards. Custom
dashboards can be configured using modules that have been pre-defined. Some of these
pre-defined modules are:
■ Top 10 Applications by Bandwidth—top 10 applications defined by the
percentage of usage.
■ Top 10 Applications by Instances—top 10 applications by the frequency of
application instances.
■ Top 10 Destinations—top 10 destination IP addresses.
■ Top 10 FTP Files—top 10 File Transfer Protocol (FTP) files either downloaded or
uploaded.
■ Top 10 IM Files—top 10 Instant Messenger (IM) instances sent or received.
■ Top 10 Policy Incidents—top 10 policy incidents that occurred in the specified
time range.
■ Top 10 Policy Incidents Blocked—top 10 policy incidents that were blocked.
■ Top 10 Users by Bandwidth—top 10 users by usage.
OmniVista SafeGuard Manager Administration Guide
75
Page 76

Chapter 4: Visualization
Defining Bars within a Module
You can configure multiple bars within a module; however, each module should have at
least one bar. Each bar within a module has an action query associated with it (this
identifies the query that needs to be executed when you click on a bar). The associated
query then retrieves data from the server. The following bar characteristics should be
noted when defining bars:
■ System bars cannot be deleted or cloned.
■ Pre-defined bars can be cloned but cannot be deleted.
■ User-defined bars can be edited and cloned but can only be deleted if the bar
properties are not being used in any other module.
To define bars within a module:
1 On the Dashboard Configuration screen (Figure 46), select the Bars tab. The
following view displays.
Figure 51 Dashboard Configuration - Bars
2 Click New if you want to add a new bar. The Add New Bar screen displays
(Figure 52).
Figure 52 Add New Bar
76
OmniVista SafeGuard Manager Administration Guide
Page 77

Chapter 4: Visualization
3 Enter the bar configuration as follows:
Table 9 Add New Bar Attributes
Attribute Description
Name Name for the bar.
Title Title for the bar.
Bar Query Template Name From the dropdown list, select a query template that
will retrieve data from the database.
Bar Query Template Time Filter Specify a time filter for the bar, this is the time filter
that will be applied when collecting counts, for
example top 10.
Action Query Template Type From the dropdown list, select the visualization data
type: User, Malware incidents, Policy incidents, and
so forth.
Action Query Template Name From the dropdown list, select an action type: All
active users, Kerberos authentication failures, List of
users with active worms, and so forth.
Action Query Template Time
Filter
Color Click the color bar. A color template is displayed
Enabled Select the Enabled checkbox to enable the bar.
Identify the time filter for the action query. This
attribute is only available if a time filter was not set
during the query definition.
where you can select the bar color.
4 Click OK for the configuration to apply.
5 Select a bar in the Bar tab of the Dashboard Configuration screen and click Edit to
modify an existing bar configuration.
6 Select a bar and click Clone to copy the configuration of an existing bar.
7 Select a bar and click Delete to remove the bar from a given module.
NOTE: You can only delete a user-configured bar. However, if the bar
properties are being used in another bar or module, an error message is
displayed and deletion will not occur.
OmniVista SafeGuard Manager Administration Guide
77
Page 78

Chapter 4: Visualization
Viewing Visualization Data
Visualization allows administrators to track what a user is doing, what applications are
being used, and what is being done to a network. Such tracking is useful for forensic and
postmortem purposes, that is, for debugging and ensuring that the network is
performing at its optimum and there are no threats to the network. SafeGuard collects
this data (traffic flow, Layer 7, malware events from the CPU, policy events from policy,
and authentication events from Auth) and periodically pushes it in tabular format to
OmniVista SafeGuard Manager as visualization data.
Visualization data can be viewed in tabular format for the following objects:
Table 10 Visualization Data Objects
Table Type Description
Policy Incidents Displays a list of all policy incidents against a user. For more information,
see Viewing Policy Incidents.
Malware Incidents Displays a list of malware incidents. This table also displays the counts of
various severities of the infection events. For more information, see
Viewing Malware Incidents.
Posture Incidents Displays all posture incidents, including EPV incident ID, host IP and MAC
addresses. For more information, see Viewing Posture Incidents.
User Sessions Displays user authentication and bandwidth usage that is aggregated
for each user. Typically this has a navigation tree on the left panel that
helps finds users belonging to a specific group/role or connected to a
specific port of a specific device. For more information, see, Viewing
User Sessions.
Application Type Displays the user bandwidth usage that is aggregated for each type of
application. For more information, see Viewing Application Types.
Application Instance Displays the user bandwidth usage for each user, application type,
destination port, and destination IP address. For more information, see
Viewing Application Instances.
Application Flows Allows an administrator to view application flows for a selected user or
application. For more information, see Viewing Application Flows.
78
OmniVista SafeGuard Manager Administration Guide
Page 79

Viewing Policy Incidents
When policy conditions are matched for any given user, policy incidents are created. To
view policy incidents:
1 Click the View Policy Incidents icon from the Page Bar or select View > Go To >
Policy Incidents (Ctrl + 1) menu item. The All Events view displays with the
following information
Table 11 Policy incidents Attributes
Attribute Description
Username Username in violation of a policy.
First Occurrence Time the violation first occurred.
Last Occurrence Displays the time of the last policy violation.
# of Occurrences Number of times the violation occurred.
Chapter 4: Visualization
Policy Name Name of the policy that is applied.
Policy Filter Applicable policy filters.
Policy Action Action taken when the policy violation occurred.
Application Name Application that was being used when the policy violation occurred.
Protocol Protocol being used, TCP or UDP.
MAC Address MAC address of the user’s machine.
Source IP Address Originating IP address of the machine at which the policy violation
was detected.
Destination IP Address Destination IP address of the machine to which the policy violation is
reaching.
Severity Identifies if the policy violation is major.
Policy Category Category for the policy violation. Can be one of two pre-defined
categories (resource access, application control) or can be a user-
defined string. If a category is not defined, this column displays blank.
Violation Status Violation status, whether the violation has been cleared.
Authentication Status Authentication status for the user, authenticated or unauthenticated.
Authentication Role Authentication role for the user.
User Status Status for the user, active or inactive.
2 Search the data displayed locally in the table view by clicking the Find icon in the
Action Bar. A free-form text search field is displayed. Enter a keyword in the text
field to define your search. To search the database, click the Database Search
OmniVista SafeGuard Manager Administration Guide
79
Page 80

Chapter 4: Visualization
button in the Find field. For more information on using the search and sort
features, see Chapter 3, General Navigation.
3 To view specific incidents by status, location, role, or category, use the attributes
in the left column. For more information on using the left column fields, see
Chapter 3, General Navigation.
4 Select a row and click Clear to clear the policy violation and put it in history.
5 Select a row and click Delete to delete the violation record from the database.
6 Click User Details in the Action Bar to get a detailed view of the user activity.
7 Highlight a row to get a detailed view of the selected policy violation in the
bottom half of the screen. The details view shows a detailed view of the user and
machine in violation, including policy name, policy severity, action taken, and so
on.
8 Highlight a policy incident and right-click to select Show Policy Config to
display the policy configuration screen for the selected incident. A confirmation
dialog box displays before you can view the configuration information. See
Policies for more information on policy configuration.
9 Click Refresh to get the latest policy incidents from the server.
10 Click Export to export the table details into a CSV file that can easily be exported
into an Excel worksheet.
11 Click Print to print the data to a networked printer.
80
OmniVista SafeGuard Manager Administration Guide
Page 81

Viewing Malware Incidents
The term malware is derived from malicious software, which is any program or file that is
harmful to a computer system. Common types of malware include computer viruses,
worms, Trojan horses, and spyware.
When SafeGuard OS detects malware on the system, malware policies specify how the
infection is handled. For more information on how SafeGuard OS detects and isolates
malware security threats, see the OmniAccess SafeGuard OS Administration Guide. These
malware policies specify how much or how little access a user or an application has to the
network when it is suspected of being infected. OmniVista SafeGuard Manager allows
administrators to view all malware incidents and clear or whitelist any incidents on a
per-user or per-application basis, if necessary.
To view all malware incidents:
1 Click the View Malware Incidents icon from the Page Bar or select View > Go To >
Malware Incidents (Ctrl + 2) menu item. The All Malware Incidents view displays
the following information:
Chapter 4: Visualization
Table 12 Malware Attributes
Attribute Description
Time Time the malware incident was detected.
Malware Action Action taken against the malware incident.
Severity Severity level of the malware incident.
Category Category to which the malware incident belongs.
Algorithm Algorithm used to identify whether the suspected malware is actually
malware.
Application Application that was being used at the time of malware detection.
Application Group The name of the application group to which the infected application
belongs. An application group is a collection of application protocols.
# of Connections Number of connection attempts.
Time taken to Detect Time it took to detect the malware incident.
Username User name that created the malware violation.
Computer Name Name of the computer from which the malware incident originated.
MAC Address MAC address of the computer from which the malware incident
originated.
Source IP Address Originating IP address where malware was detected.
Destination IP Address Destination IP address.
OmniVista SafeGuard Manager Administration Guide
81
Page 82

Chapter 4: Visualization
Table 12 Malware Attributes (continued)
Attribute Description
Protocol Protocol being used: TCP or UDP.
History History of the last 8 malware incidents. When you place your cursor on
the history column, a tooltip displays up to 8 IP addresses related to
the specific incident. This is very helpful for diagnostic purposes, to see
what algorithm was used to determine that this is actually an incident
and what other IP address are impacted.
Cleared Time Time the malware is cleared. The cleared time is shown in History view
only.
Authentication Status Authentication status for the user, authenticated or unauthenticated.
Authentication Role Authentication role for the user.
User Status User Status: Active or inactive.
2 Search the data displayed locally in the table view by clicking the Find icon in the
Action Bar. A free-form text search field is displayed. Enter a keyword in the text
field to define your search. To search the database, click the Database Search
button in the Find field. For more information on using the search and sort
features, see Chapter 3, General Navigation.
3 Use the navigation tree to the left to view malware incidents by the type of
infection (quarantined, action taken, malware category, detection algorithm), role,
or location. For more information on using the left column fields, see Chapter 3,
General Navigation.
4 Select a row and click Clear to clear the infection event and enable the device. For
example, if the option was set to block the host and the host is infected, the device
sends an alert. OmniVista SafeGuard Manager takes the appropriate action to
either just log or block it. When you select Clear, you remove the malware event
and tell OmniVista SafeGuard Manager to let the host pass through.
NOTE: A malware event can be cleared either at the device level or
through OmniVista SafeGuard Manager. After the device detects that
the malware does not exist, it can send a clear event or the user can clear
the event from OmniVista SafeGuard Manager.
5 Select a row and click Whitelist, which adds a white list to the user and any traffic
from the user will not be considered for malware detection. A confirmation dialog
box displays asking you to select Yes to proceed or No to cancel.
6 Click User Details to get a detailed view of the user activity.
7 Highlight an incident to get a detailed view of the selected malware instance. The
Infection Details view at the bottom of the screen shows the detailed view of the
82
OmniVista SafeGuard Manager Administration Guide
Page 83

Chapter 4: Visualization
user machine, allowing you to traverse through the details and see what
applications the user is using, the infections and the policy incidents against the
user. This is helpful in diagnostics purposes and can help the administrator to
narrow down the problem and identify where the problem exists.
8 Click Refresh to get the latest malware events.
9 Click Application Flows in the Action Bar to view application flows affected in
the neighborhood (plus or minus time specified) of the malware event. For more
information, see Malware Incident Tracking and Troubleshooting.
Malware Incident Tracking and Troubleshooting
OmniVista SafeGuard Manager allows administrators to view application flows related
to malware incidents. This feature helps administrators to narrow down the time
window in which a specific malware incident occurred, highlight the application flow in
proximity to that incident, and thus troubleshoot the incident as needed.
To view application flows in relation to a malware incident:
1 Select View Malware Incidents from the Page Bar.
2 Highlight the malware incident for which you want to see application flow detail.
3 Click Application Flows in the Action Bar. The Application Flows screen
displays.
4 In the left-hand navigation column, select the status of Active for all active
application flows, Inactive for all inactive application flows, and Active or
Inactive for all flows.
5 Reference Time displays the time the malware incident occurred; this helps you to
specify the time range for the application flows in reference to the malware
incident.
6 Use the Time Range field to configure a time in seconds of plus or minus 5, 10, 30,
or 60 seconds in which you want to see all application flows in relation to the
selected malware incident. For example, if you select +/- 5 seconds, all
application flows in proximity of the selected malware incident (+/- 5 seconds)
will display.
7 Apply a time filter of Any Occurrence, First Occurrence, or Last Occurrence.
8 Click Refresh to view the updated data.
OmniVista SafeGuard Manager Administration Guide
83
Page 84

Chapter 4: Visualization
Viewing Posture Incidents
The term “posture” refers to a collection of attributes that play a role in the conduct or
health of a device that is seeking network access. Some of these attributes relate to the
endpoint device-type and operating system; and other belong to various security
applications that might be present on the endpoint, such as anti-virus (AV) scanning
software.
Posture validation refers to the act of applying a set of rules to the posture data to provide
an assessment of the level of trust that you can place in that endpoint. Posture incidents;
therefore, are any events that are in violation and suspect the health of an endpoint
device.
To view all posture incidents:
1 Click the View Posture Incidents icon from the Page Bar or select View > Go To >
Posture Incidents (Ctrl + 3) menu item. The All Posture Infections view displays the
following information:
Table 13 All Posture Incidents Attributes
Attribute Name Description
State State, active or inactive.
Host IP IP address for the host.
Host MAC MAC address for the host.
Time Time the posture incident occurred.
Status Message Status Message
Device IP IP Address for the device.
EVP Incident ID Identifier for the EVP incident.
2 To view specific incidents by status, location, role, or category, use the attributes
in the left column. For more information on using the left column fields, see
Chapter 3, General Navigation.
3 Click Refresh to see the updated incidents.
4 Click Find to apply a textual or advanced search in the table shown in All Posture
Incidents. For more information on using the search and sort features, see Chapter
3, General Navigation.
84
OmniVista SafeGuard Manager Administration Guide
Page 85

Chapter 4: Visualization
Viewing User Sessions
You can view visualization data, network activity per user or for all users.
To vi e w a ll use r s:
1 From the Dashboard, click on the Total Users row in the User panel, click the View
Users icon from the Page Bar, or select the View > Go To > Users (Ctrl +4) menu
item. The All Users screen displays with the following information:
Table 14 User Attributes
Attribute Description
Username User name as detected by the authentication (login ID).
Source IP Address IP address of the user’s interface.
MAC Address MAC address of the user’s interface.
Bandwidth Bandwidth that the user is using.
Authentication Status Current state of the user: authenticated, unauthenticated, or
authentication failed.
Authentication Role Role derived for this user based on authentication protocol, server,
and user name.
Authentication Type Type of authentication. The values can be:
■ krb: Windows AD/Kerberos v5 passive sniffing
■ captive-portal: HTTP-based active authentication
■ unauthenticated: Guest users
Authentication IP IP address of the authentication server
Computer Name Name of the computer the user is using.
Login Time Time the user logged in.
Device Physical Port Physical port of the Alcatel-Lucent device (SafeGuard OS) on which
the user is detected.
VLAN VLAN on which the user is detected.
Domain Name of the domain to which the user is identified.
User ID Identifier for the user.
Logout Time Time the user logged out. The logout time is shown in History view only.
2 Search the data displayed locally in the table view by clicking the Find icon in the
Action Bar. A free-form text search field is displayed. Enter a keyword in the text
field to define your search. To search the database, click the Database Search
OmniVista SafeGuard Manager Administration Guide
85
Page 86

Chapter 4: Visualization
button in the Find field. For more information on using the search and sort
features, see Chapter 3, General Navigation.
3 To view specific users by status, location, role, or category, use the attributes in the
left column. For more information on using the left column fields, see Chapter 3,
General Navigation.
4 Select a user and click Clear User to reset the authentication state for the selected
user. The user is treated as unauthenticated and needs to be authenticated.
5 Highlight a user to view user details for the selected user in the bottom-half of the
screen. The detailed view shows all activity and application instances for the
selected user.
NOTE: Some data might be excluded from the display because
visualization filters may have been applied. You can disable the filters if
you want to store or display all data. Disabling the filters will not
retrieve previously filtered data; however, new data will be stored. For
more information on visualization filters, see Setting Visualization Filters.
6 Highlight a user and click Show Role Config in the Action Bar to display the role
configuration information for the selected user. See Roles for more information on
configuring roles.
7 Select a user and click an Action Bar icon to display a different table view for the
selected user. Figure 53 shows the different views you can access from the Users
view.
Figure 53 Other Table Views from a Selected User View
86
8 Click Refresh to view the updated visualization data.
OmniVista SafeGuard Manager Administration Guide
Page 87

9 Click Export to export the table details into a CSV file that can easily be exported
into an Excel worksheet.
10 Click Print to print the data to a networked printer.
Viewing Application Types
The application view displays the type of application being used (HTTP, FTP, and so
forth).
To view all application types:
1 Click the View Applications icon from the Page Bar or select View > Go To >
Applications (Ctrl + 5) menu item. The All Application Type screen displays with
the following information:
Table 15 Application Attributes
Chapter 4: Visualization
Attribute Description
Application Application type.
Protocol Protocol the application is using: TCP or UDP.
Application ID Identifier for the application.
Bandwidth Bandwidth that the application is using.
2 Search the data displayed locally in the table view by clicking the Find icon in the
Action Bar. A free-form text search field is displayed. Enter a keyword in the text
field to define your search. To search the database, click the Database Search
button in the Find field. For more information on using the search and sort
features, see Chapter 3, General Navigation.
3 To view specific incidents by status, location, role, or category, use the attributes
in the left column. For more information on using the left column fields, see
Chapter 3, General Navigation.
4 Highlight a row to get detailed information on the selected application type. The
details appear in the bottom-half of the screen.
5 Select a row and click an Action Bar icon to display a different table view for the
selected application. Figure 54 shows the different views you can access from the
Applications view.
OmniVista SafeGuard Manager Administration Guide
87
Page 88

Chapter 4: Visualization
Figure 54 Other Table Views from Application View
6 Click Refresh to view the updated visualization data.
7 Click Export to export the table details into a CSV file that can easily be exported
into an Excel worksheet.
8 Click Print to print the data.
Viewing Application Instances
To view all application instances:
1 Click the View Application Instances icon from the Page Bar or select View > Go To
> Application Instances (Ctrl + 6) menu item. The All Application Instances screen
displays with the following information:
Table 16 Application Instances Attributes
Attribute Description
Username Name of the user for whom the instance is recorded.
Application Application type.
Protocol Protocol the application is using: TCP or UDP.
Source IP Address IP address where the application instance originated.
Destination IP Address Destination IP address for the application instance.
Destination Port Destination port for the application instance.
Bytes In Total number of incoming bytes.
Bytes Out Total number of outgoing bytes.
88
OmniVista SafeGuard Manager Administration Guide
Page 89

Table 16 Application Instances Attributes (continued)
Attribute Description
Packets In Total number of incoming packets.
Packets Out Total number of outgoing packets
Application Instances Total number of application instances.
Chapter 4: Visualization
Deny Traffic from Host side IP
Deny Traffic to Host-side IPDeny traffic that is directed to host-side address.
Deny traffic originating from host-side IP address.
2 Search the data displayed locally in the table view by clicking the Find icon in the
Action Bar. A free-form text search field is displayed. Enter a keyword in the text
field to define your search. To search the database, click the Database Search
button in the Find field. For more information on using the search and sort
features, see Chapter 3, General Navigation.
3 Highlight a row to get a detailed summary of the selected application instance in
the bottom-half of the screen.
4 Select a row and click the App Flows icon from the Action Bar to get application
flows for the selected application instance. The Application Flows view gives a
detailed view of all application instances for the selected user. For more
information on using the Application Flows view, see Viewing Application Flows.
Figure 55 shows the other views that you can access for the selected application
instance.
Figure 55 Other Table Views from Application Instances View
5 Click Refresh to view the updated visualization data.
6 Click Export to export the table details into a CSV file that can easily be exported
into an Excel worksheet.
OmniVista SafeGuard Manager Administration Guide
89
Page 90

Chapter 4: Visualization
Viewing Application Flows
To view application flows:
1 Click the View Application Flows icon from the Page Bar or select View > Go To >
Application Flows (Ctrl + 7) menu item. The Application Flows view displays,
giving a detailed view of all user activity for the selected user.
2 Search the data displayed locally in the table view by clicking the Find icon in the
Action Bar. A free-form text search field is displayed. Enter a keyword in the text
field to define your search. To search the database, click the Database Search
button in the Find field. For more information on using the search and sort
features, see Chapter 3, General Navigation.
3 Select a row and click Layer 7 Events from the Action Bar to get a detailed Layer 7
view of the application instance, including the event ID, time stamp, event type,
and Layer 7 event details.
4 Select a row on the Application Flows view to get a flow summary for the selected
user in the bottom-half of the screen.
5 Click Refresh to apply any search or sort filters and display the latest data from
the database.
6 Click Export to export the table details into a CSV file that can easily be exported
into an Excel worksheet.
90
OmniVista SafeGuard Manager Administration Guide
Page 91

Creating Policy Filters
OmniVista SafeGuard Manager allows you to create a policy filter from data available in
an application flow.
To create a policy filter:
1 Click the View Application Flows icon in the Page Bar.
2 Select a data flow line and right-click to select Create Policy Filter. The New Policy
Filter screen displays (Figure 56).
Figure 56 Create New Policy Filter
Chapter 4: Visualization
3 Enter the information as follows:
Table 17 New Policy Filter Attributes
Attribute Description
Device/Template From the dropdown list, select either a device or a tem-
plate for which you want to define a new policy filter.
Policy Type Select the type of policy for which you are creating this
filter: user, malware, or override.
Policy Name Select the policy name to which the filter is to be
applied.
OmniVista SafeGuard Manager Administration Guide
91
Page 92

Chapter 4: Visualization
Table 17 New Policy Filter Attributes
Attribute Description
Select choice of filter From the dropdown list, select the type of filter. Valid val-
Name Specify a brief name for the new policy filter.
Action Select an action: Deny, Reset TCP, or Permit.
ues are:
■ None
■ Block user
■ Deny traffic originating from user
■ Deny traffic to user
■ Deny traffic from user to network IP
■ Deny traffic from network-side IP to user
■ Deny traffic from network-side IP
■ Deny traffic to network-side IP
Enable Log Select this checkbox if you want a log entry to be cre-
ated.
Enable Mirror
Direction Select the direction in which the policy filter is to be
applied, bi-directional, flow-in, or flow-out. For more
information on traffic direction, see Traffic Flow.
4 Click OK to create the filter.
92
OmniVista SafeGuard Manager Administration Guide
Page 93

Viewing Time-based Data
OmniVista SafeGuard Manager allows you to apply time filters in the navigational views.
Using these time filters, you can specify a time range for which you want to view data.
These navigational views also allow you to view data that can be active or inactive and is
within the time range specified.
To view data within a specific time range:
1 Click on a Page Bar icon to get a table view (Figure 57).
Figure 57 View All User Sessions
Chapter 4: Visualization
2 In the left column, set the Status as Active to view active data or Inactive to view
historical data. You can also select Active or Inactive to view all data.
3 Use the Time Range dropdown list to specify a time period for which you want to
view data. Current Hour is selected as the default.
4 Select Custom in the Time Range field to activate the To and From fields. Clicking
on this dropdown list brings up a calendar and timestamp that allows you to
select a specific date and time for which the data is to be displayed.
5 Use the Time Filter dropdown list to specify the time filter. Connected During
Time Range is selected as the default; therefore, whatever you specify in the Time
Range field will impact the data displayed.
OmniVista SafeGuard Manager Administration Guide
93
Page 94

Chapter 4: Visualization
6 Click Refresh to update the view.
Additional Time-based Filtering
For certain views (application and users), you can apply additional time filters to exclude
or include data from the original time-based query. For example, if your initial query was
to show users logged in between 4:00pm to 5:00pm, you can use the additional exclude
filters to show users not logged in between 3:00pm to 4:00 pm.
To apply additional filtering:
1 Click on the And... toggle button in the Time Range specification panel of the
navigation tree (Figure 57). The time filters are expanded (Figure 58).
Figure 58 Additional Time Filters
94
2 Select the Not checkbox to exclude the data from the original time range,
compared to the data specified in the new time range.
3 The Time Filter that you selected previously is displayed as a read-only field. If
you need to change the Time Filter, see Viewing Time-based Data.
4 Select a new time range using the Time Range dropdown list. OmniVista
SafeGuard Manager validates this selection to ensure that the time range selected
is not the same as the original time range.
5 Refresh the page to apply the new time filters.
OmniVista SafeGuard Manager Administration Guide
Page 95

Search Time
Range
App fl 1
App fl 2
App fl3
App fl4
t1
t2
t3 t4
t5
t6
t7 t8
t9 t10
Viewing Active Data Against Historical Data
Active data is generated while the user is logged in. Data is considered history (inactive)
when the user logs out. Whenever any data or events are cleared, they also become part
of history.
NOTE: Malware and Posture events are host based; therefore, they
are not considered history when the user logs out. These events must
be cleared for them to be history.
Searching Active or Inactive Data within a Specified Time Range
OmniVista SafeGuard Manager allows you to search for active or inactive data within a
specified time range (Figure 57). This example uses a search for active applications and
application instances within a specified time range.
Figure 59 Search Active or Inactive Data within Specified Time Range
Chapter 4: Visualization
Figure 59 shows that a search for an active application “App” between t1 and t2 time
period results in a sum of bandwidth (bytes, packets) of all the application flows (fl1 –
fl4). The start time of the application comes up as t3 and the last occurrence time shows
up as t4.
At this point, what users might expect (given the search time range of t1 – t2) is to see
data within the time range specified. However, search crosses the time boundaries and
displays aggregate data for all the flows of the application “App” which either started or
ended (or could be both), or active between t1 and t2 times.
OmniVista SafeGuard Manager Administration Guide
95
Page 96

Chapter 4: Visualization
96
OmniVista SafeGuard Manager Administration Guide
Page 97

chapter
Device Configuration
5
This section includes the following:
■ Managing Devices
■ Configuring Device Objects
■ Templates
■ Editing Device Objects
■ Deleting an Existing Device
■ Synchronizing a Device
■ Device Actions
■ Other Actions
■ Understanding Device Management Display
■ Recommended Device Management Workflow
Page 98

Chapter 5: Device Configuration
Managing Devices
This section describes how you can add new devices, delete existing devices, and
perform basic device configuration.
Checking a Device
When you add a device, OmniVista SafeGuard Manager checks to ensure that the device
is a Alcatel-Lucent device. No other devices are added. The check ensures that:
■ the device has a valid Alcatel-Lucent IP address
■ SNMP community names match the names configured on the device
■ the device added is a Alcatel-Lucent device
If the compatibility check fails, an error message is displayed.
Adding a New Device
OmniVista SafeGuard Manager allows you to add a single device or multiple devices
from a list of devices that you create using a specific format.
Adding a Single Device
To add a single device:
1 Select the Device Configuration icon from the Page Bar or select the View > Go To >
Config Management menu item.
2 Click the New icon from the Action Bar.
3 Select Single Device. The New Device (Figure 60) dialog box displays.
98
OmniVista SafeGuard Manager Administration Guide
Page 99

Figure 60 New Device Dialog Box
Chapter 5: Device Configuration
4 Enter the following device attributes:
Table 18 Add Device Attributes
Attribute Description
IP Address The Management IP address of the device.
SNMP Community
String (Read)
SNMP Community
(Read/Write)
Name Device name.
Region Name of the region in which the device is located.
Building Name of the building in which the device is located.
Enable Application
Flow Collection
Associated Template Select a template from the pull-down list that you
Simple Network Management Protocol (SNMP) read
community name that was configured when the
device was initially set up.
SNMP read/write community name that was
configured when the device was initially set up.
Click this box if you want to collect application flow
data.
want to associate with the device. For more
information on templates, see Templates.
OmniVista SafeGuard Manager Administration Guide
99
Page 100

Chapter 5: Device Configuration
5 Click OK to add the device. The add process reads the system configuration and
the list of outstanding visualization events from the device using a combination of
SNMP and Alcatel-Lucent proprietary OmniVista SafeGuard Manager
Visualization Channel.
NOTE: Make sure that the attributes are specified correctly; otherwise,
adding a device fails producing one of the following error messages,
“Device unreachable,” or “Device is not a Alcatel-Lucent device,” or “Unable
to communicate with IP Address.”
NOTE:
some of the events may be lost by the time you add the device.
The device displays in the All Devices panel and the device objects display in the
Device Hierarchy navigation tree (Figure 61).
NOTE:
strings for the device to be added.
Figure 61 Device Configuration
The device periodically ages out the visualization data; therefore,
The device must be reachable with appropriate community
100
OmniVista SafeGuard Manager Administration Guide
 Loading...