

Page 1

Agilent N26 20A
FrameScope Pro
Network Performance
Analyzer
User’s Manual
Version 1.1
Agilent Technologies
Page 2

Notices
© 2006 Agile nt Technologies, Inc.
No part of this manual may be reproduced
in any form or by any means (including
electronic storage and retrieval or translation into a foreign language) without prior
agreement and written consent from Agilent Technologies, Inc. as governed by
United States and international copyright
laws.
Manual Part Number
N2620-90003
Edition
Fourth Edition, June 2006
Agilent Technologies, Deutschland GmbH
Herrenberger Straße 130,
71034 Böblinge n, Ger ma ny.
Warranty
The materi al con ta i ned in this docu ment is provided “as is” , and is su bject to being ch a ng ed witho u t no ti ce
in future editions. Further, to the maximum extent permitt ed by applicable
law, Agilent Technologies disclaims
all warranties of merchantability and
fit ness for a particular purpose. Agilent Technologies shall not be liable
for errors or fo r inc ide n tal or con se quential damages in connection with
the furnishin g, use, or performa nce of
this document or of any of the products to which it pertains. Should Agilent Technologies have a wri tt en
contract with the user and should any
of the co ntract ter m s co n f lict wi t h
these terms the contract terms shall
control.
defined in FAR 2.101(a) or as “Restricted
computer so ftware” as defined in FAR
52.227-19 (June 1987) or any equivalent
agency regulation or contract clause. Use,
duplication or disclosure of Software is
subject to Agilent Technologies’ standard
commercial license terms, and non-DOD
Departments and Agencies of the U.S. Government will receive no greater than
Restricted Rights as defined in FAR
52.227-19(c)(1-2) (June 1987). U.S. Government users will receive no greater than
Limited Righ ts as defined in FAR 52.227-14
(June 1987) or DFAR 252.227-7015 (b)(2)
(November 1995), as applicable in any
technical data.
Safety Notices
CAUTION
A CAUTION notice denotes a hazard. It calls attention to an operating procedure, practice, or the like
that, if not correctly performed or
adhered to, could result in damage
to the product or loss of important
data. Do not proceed beyond a
CAUTION no t ice unt il t he in di cate d
conditions are fully understood and
met.
Technology Licenses
The har dware an d/or s oftw are d escri bed i n
this document are furnished under a
license and m ay be used or copied only in
accorda nce with the terms of such license.
Restricted Rights Legend
If Software is for use in the performance of
a U.S. Government prime contract or subcontract, Software is delivered and
licensed as “Commercial computer software” as defined in DFAR 252.227-7014
(June 1995), or as a “commercial item” as
WARNING
A WARNING notice denotes a
hazard. It calls attention to an
operating procedure, practice, or
the like that, if not correctly performed or adhered to, could result
in personal injury or death. Do not
proceed beyond a WARNING
notice until the indicated conditions are fully understood and met.
Page 3

In This Guide…
This user’s guide contains information for using your FrameScope Pro
handheld network performance analyzer.
Be sure to refer to any user’s manual supplements or release notes that
came with the unit or call your nearest technical support centre
Agilent FrameScope Pro User’s Manual 3
Page 4

4 Agilent FrameScope Pro User’s Manual
Page 5

Contents
1 Introducing the FrameScopePro
Safety Consideration s 10
The FrameScope Pro at a Glance 14
The Main Menu at a Glance 17
Getting Started 19
2 Network Testing with the FrameScope Pro
Network Testing Overview 26
Examining the Network 27
Running an Autotest 29
Changing the Autotest Metrics 32
Using the Stations List 33
Performing a Ping Test 38
Performing a Trace Route 41
Performing SNMP Queri es 44
Viewing Stat ist ic s 4 7
Generating Network Traffic 50
Performance Tests 53
Locating a Port with Blink Port 72
Viewing the Error Log 74
WireMap Adapter Testing 76
Using the Test Database 7 9
Using the Network Database 80
Locating Switch Ports 83
3 Voice Testing with the FrameScope Pro
Voice Testing Overview 86
How the FrameScope Pro Tests Voice Quality 87
Running a Voice Test 88
Interpreting Results 91
Network Settings 93
How to Save and Retrieve Results 94
Agilent FrameScope Pro User’s Manual 5
Page 6

4 System Operations
The Status Display Area 96
The System Menu 97
System Information 98
License Details 99
Storage Setup 100
Battery Status 101
Time and Date Setup 102
User Interface Setup 103
Boot Password 104
Touchscreen Calibration 105
Restore Default Settings 106
Network Settings 108
Restoring the Default MAC Address 113
Remote Control 114
Setting up the Optional Auxiliary Port 118
RFC 2544 Test 120
SNMP Settings 121
Demo Mo de 122
5 Network Performance Analyzer Reference
Network Connection 125
Network Database 126
Network Performance Autotest 129
Statistics 154
Network Tool s 157
Remote Control 161
Memory Req uirements 163
6 Specifications
Physical 166
Environmental 167
Electrical 169
Ports 170
6 Agilent F r ameSc ope P ro U ser ’s M anual
Page 7

7 Glossary
Display 171
172
Glossary 174
Agilent FrameScope Pro User’s Manual 7
Page 8

8 Agilent F r ameSc ope P ro U ser ’s M anual
Page 9

Agilent N262 0A FrameScop e 350 Network Per for m anc e An alyze r
User’s Manual
1
Introducing the FrameScope Pro
Safety Considerations 10
The FrameScope Pro at a Glance 14
Front View 14
Side Views 15
Controls 16
Ports 16
The Main Menu at a Glance 17
Getting Started 19
Switching the FrameScope On and Off 19
Checking Power and Charging the Battery 20
Connecting to the Network and Using the FrameScope Pro 22
Running a Test 22
The Agilent FrameScope Pro Network Performance Analyzer is
a powerful handheld instrument that measures the
performance of your key network resources and troubleshoots
the active network equipments.
With the Voice Quality Analysis Option it allows to measure the
performance of voice over VoIP network resources. The
FrameScope Pro integrates network performance analyzer
features such as auto discovery, network performance testing,
traffic generator and fault finding; with wiremap testing
feature.
Agilent Technologies
9
Page 10

1 Introducing the FrameScope Pro
Safety Considerations
Safety Considerations
The following general safety precautions must be observed
during all phases of operation, service, and repair of this
instrument. Failure to comply with these precautions or with
specific warnings elsewhere in this manual violates safety
standards of design, manufacture, and intended use of the
instrument.
Agilent Technologies Inc. assumes no liability for the customer’s
failure to comply with these requirements.
Before operation, review the instrument and manual, including
the red safety page, for safety markings and instructions. You
must follow these to ensure safe operation and to maintain the
instrument in safe condition.
This instrument is intended for indoor use.
This product is a Safety Class 1 instrument. Product is powered
by an AC/DC adapter.
The protective features of this product may be impaired if it is
used in a manner not specified in the operation instructions.
All Light Emitting Diodes (LEDs) used in this product are Class
1 LEDs as per IEC 60825-1
Environmental conditions
Refer to the Specificatins chapter, Environmental section.
Before applying power
Verify that the product is set to match the available line voltage,
and all the safety precautions are taken.
Do not operate in an explosive atmosphere
Do not operate the instrument in the presence of flammable
gases or fumes
Do not remove the instrument cover
Operating personel must not remove instrument covers.
Component replacement and internal adjustments must be
made only by qualified service personel. Instruments that
10 Agilent F r ameSc ope P ro U ser ’s M anual
Page 11

Introducing the FrameScopePro 1
Safety Considerations
appear damaged or defective should be made inoperative and
secured against unintended operation until they can be
repaired by qualified service personel.
Laser Safety Information for optional Optical Transceivers
The laser sources specified by this user guide are classified
according to IEC 60825-1 (2001)
The laser sources comply with 21 CFR 1040.10 except for
deviations pursuant to Laser Notice No. 50, dated 2001-July-26.
Table 1 Initial Laser Safety Information
HFBR-5701L/LP HFCT-5710L/LP
• Laser Type 850nm VCSEL Long wavelength
• Wavelength 830-860nm 1270-1355nm
• Max. average output
• Beam waist diameter 50-62.5µm 9 or 62.5µm
• Numerical aperture 0.2-0.275 0.2-0.275
• Laser class according to IEC
• 60825-1 (2001)
• Max. permissible average
* Max. average output power means the highest possible optical
CW power thet the laser source can produce at its output
** Max. permissible CW output power is the highest optical
power that is permitted within the appropriate IEC laser class
Laser Class 1 Label
1mW 500µW
power*
Class 1 Class 1
0.8 mW 15,6mW
output power**
CLASS 1 LASER PRODUCT
(IEC 60825-1 / 2001)
Agilent FrameScope Pro User’s Manual 11
Page 12
1 Introducing the FrameScope Pro
Safety Considerations
WARN IN G
Please pay attention to th e following laser safety warnings:
1. Under no circumstances look into the end of an optical cable
attached to the optical output when the device is operating. The
laser radiation can seriously damage your eyesight
2. Do not enable laser when there is no fiber attached to the
optical output connector.
3. The use of optical instruments with this product will increase
eye hazard.
4. The laser module has a built-in safety circuitry which will
disable the optical output in the case of a fault condition
5. Refer servicing only to qualified and authorised personnel.
AC Line Power Supply Requirements
The Agilent FrameScope Pro can operate through the supplied
AC adapter between 100V and 240V ± 10%, at a frequency in the
range from 50 to 60Hz ± 5%. The maximum power consumption
is 30VA.
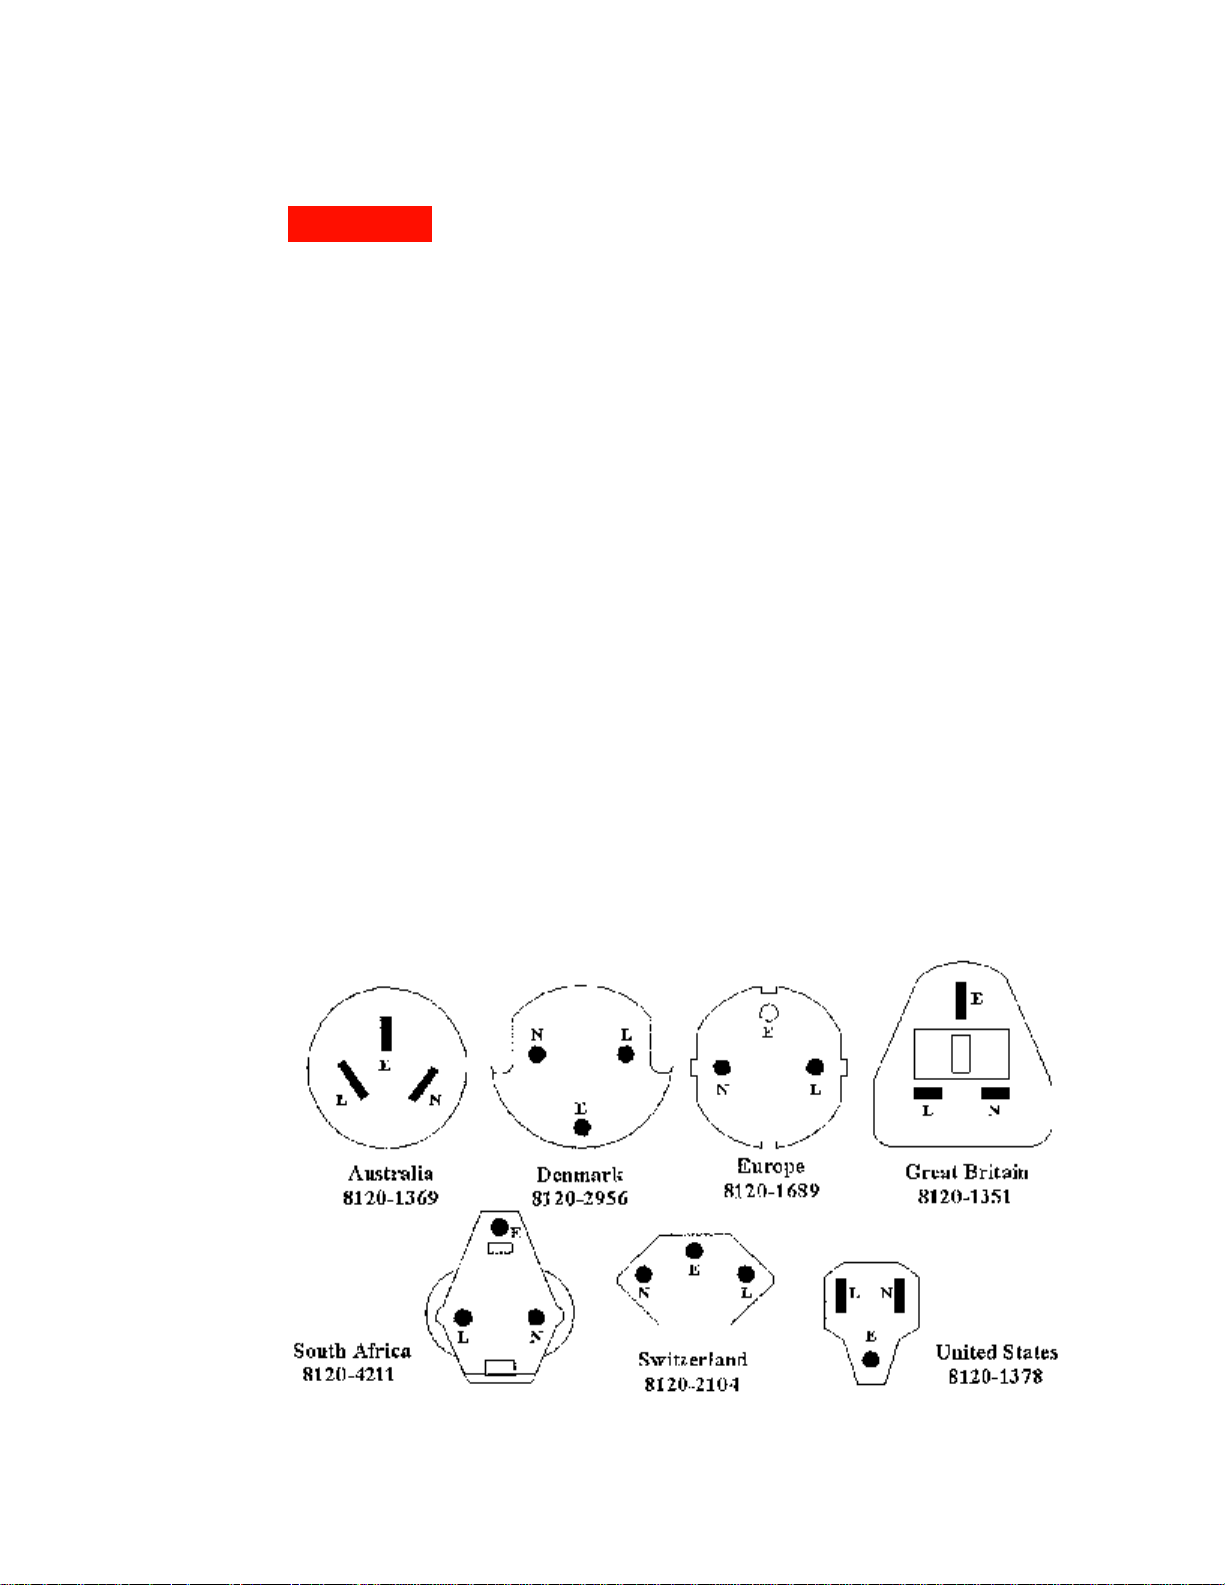
Line power cable
The type of power cable shipped with each instrument depends
on the country of destination.
12 Agilent F r ameSc ope P ro U ser ’s M anual
Page 13

Introducing the FrameScopePro 1
Safety Considerations
WARN IN G
To avoid the possibility of injury or death, you must observe the
following precautions befor e switching on the instrument
1. If the instrument is to be energized via an autotransformer for
voltage reduction, ensure that the common terminal connects to
the earth pole of the power source.
2. Insert the power cable plugonly into a socket outlet provided
with a protective earth contact. Do not negate this protective
action by uing of an extension cord without a protective
conductor.
DC Power Supply Requirements
Please refer to chapter Specifications.
Battery Requirements
Do not disassemble or attempt to open the battery under any
circumstances
The battery can explode, leak or catch fire if heated or exposed
to fire or high temperatures.
Do not short circuit the battery by directly connecting metal
terminals. Be certain that no metal objects such as coins, paper
clips and so on touch the terminals.
Do not drop the battery or subject it to mechanical shock.
NOTE
The batt ery is a co nsum ab le par t a nd is n ot su bjec t to th e F ram eSc ope Pro
warranty.
Battery disposal
LiIon and NiMH Batteries must be disposed of in a responsible
fashion according to the laws in the country where the product
is used.
Operating and Storage Environment
Please refer to chapter Specifications.
Agilent FrameScope Pro User’s Manual 13
Page 14
1 Introducing the FrameScope Pro
The Fram eScope Pro at a Glance
The FrameScope Pro at a Glance
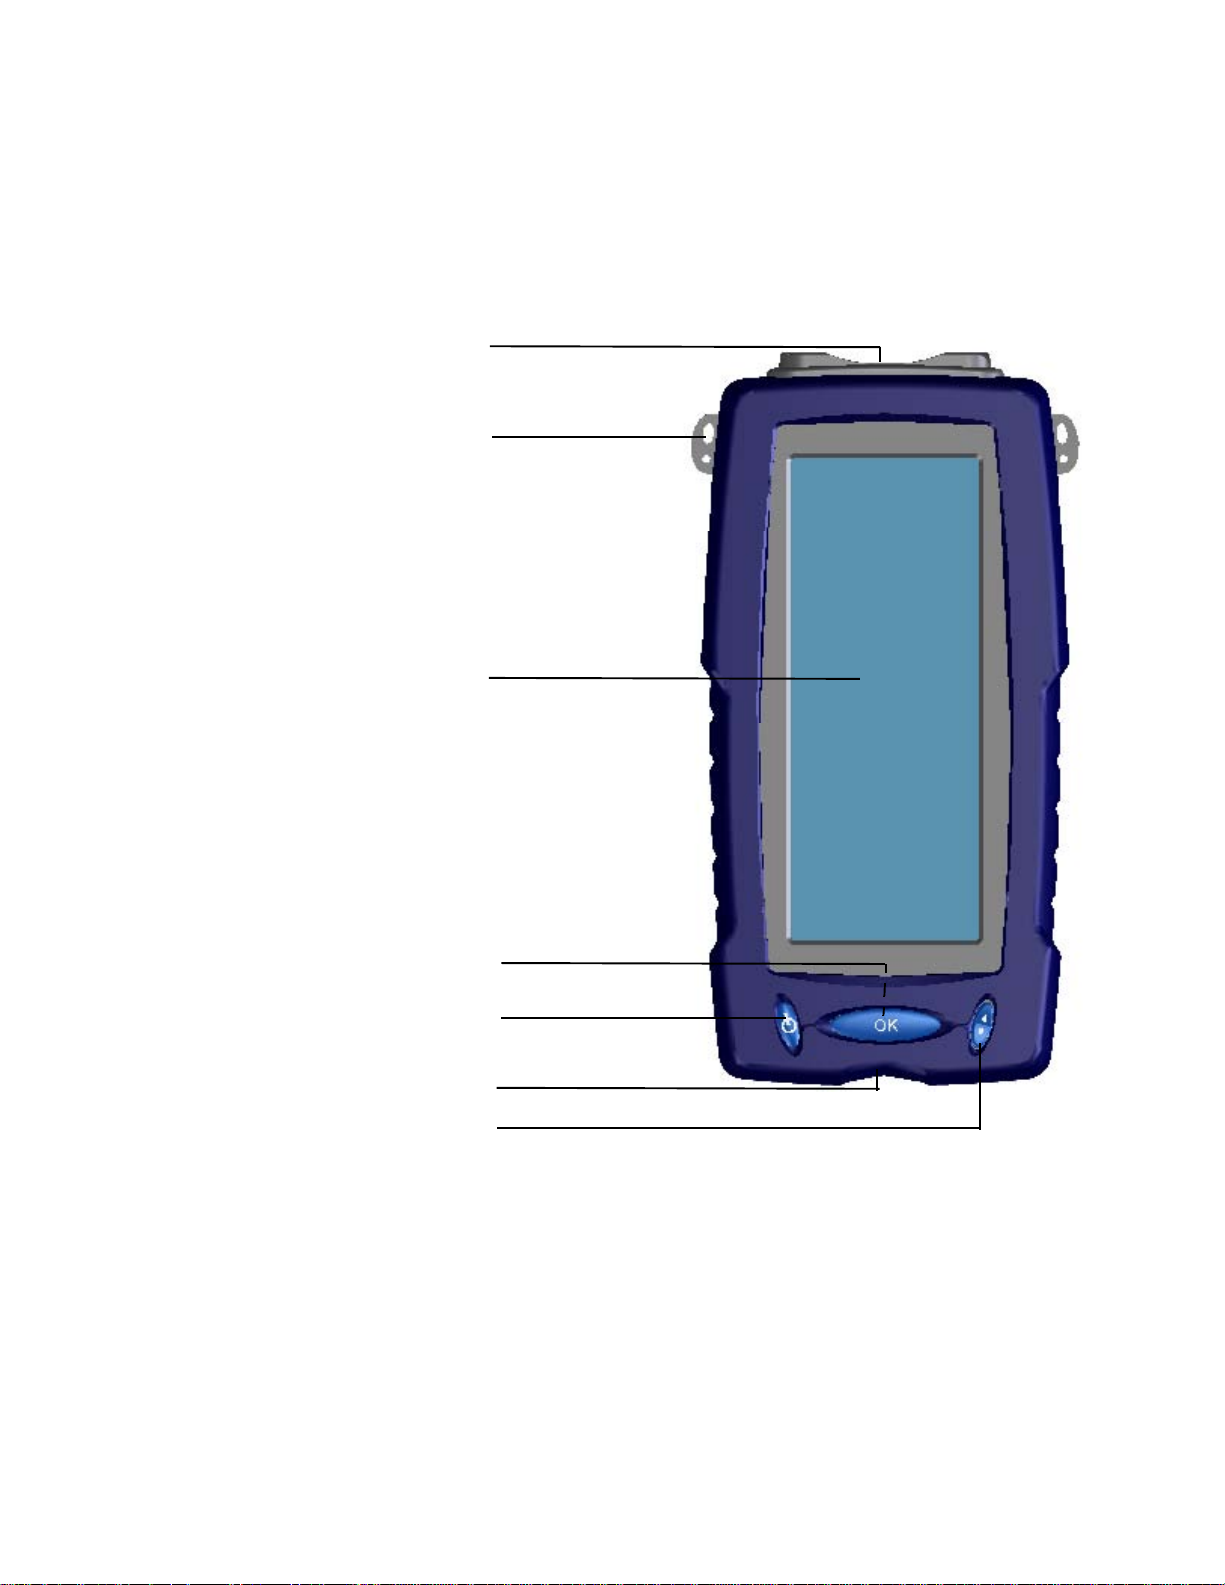
Front View
RJ 45 WireMap /Au x iliar y
Port
Strap Cleat
Touch sensitive
color LCD
Ok Button
Power Button
Compact Flash Memory Slot
Scro ll butt o n
Figure 1 FrameScope Pr o Front View
14 Agilent F r ameSc ope P ro U ser ’s M anual
Page 15
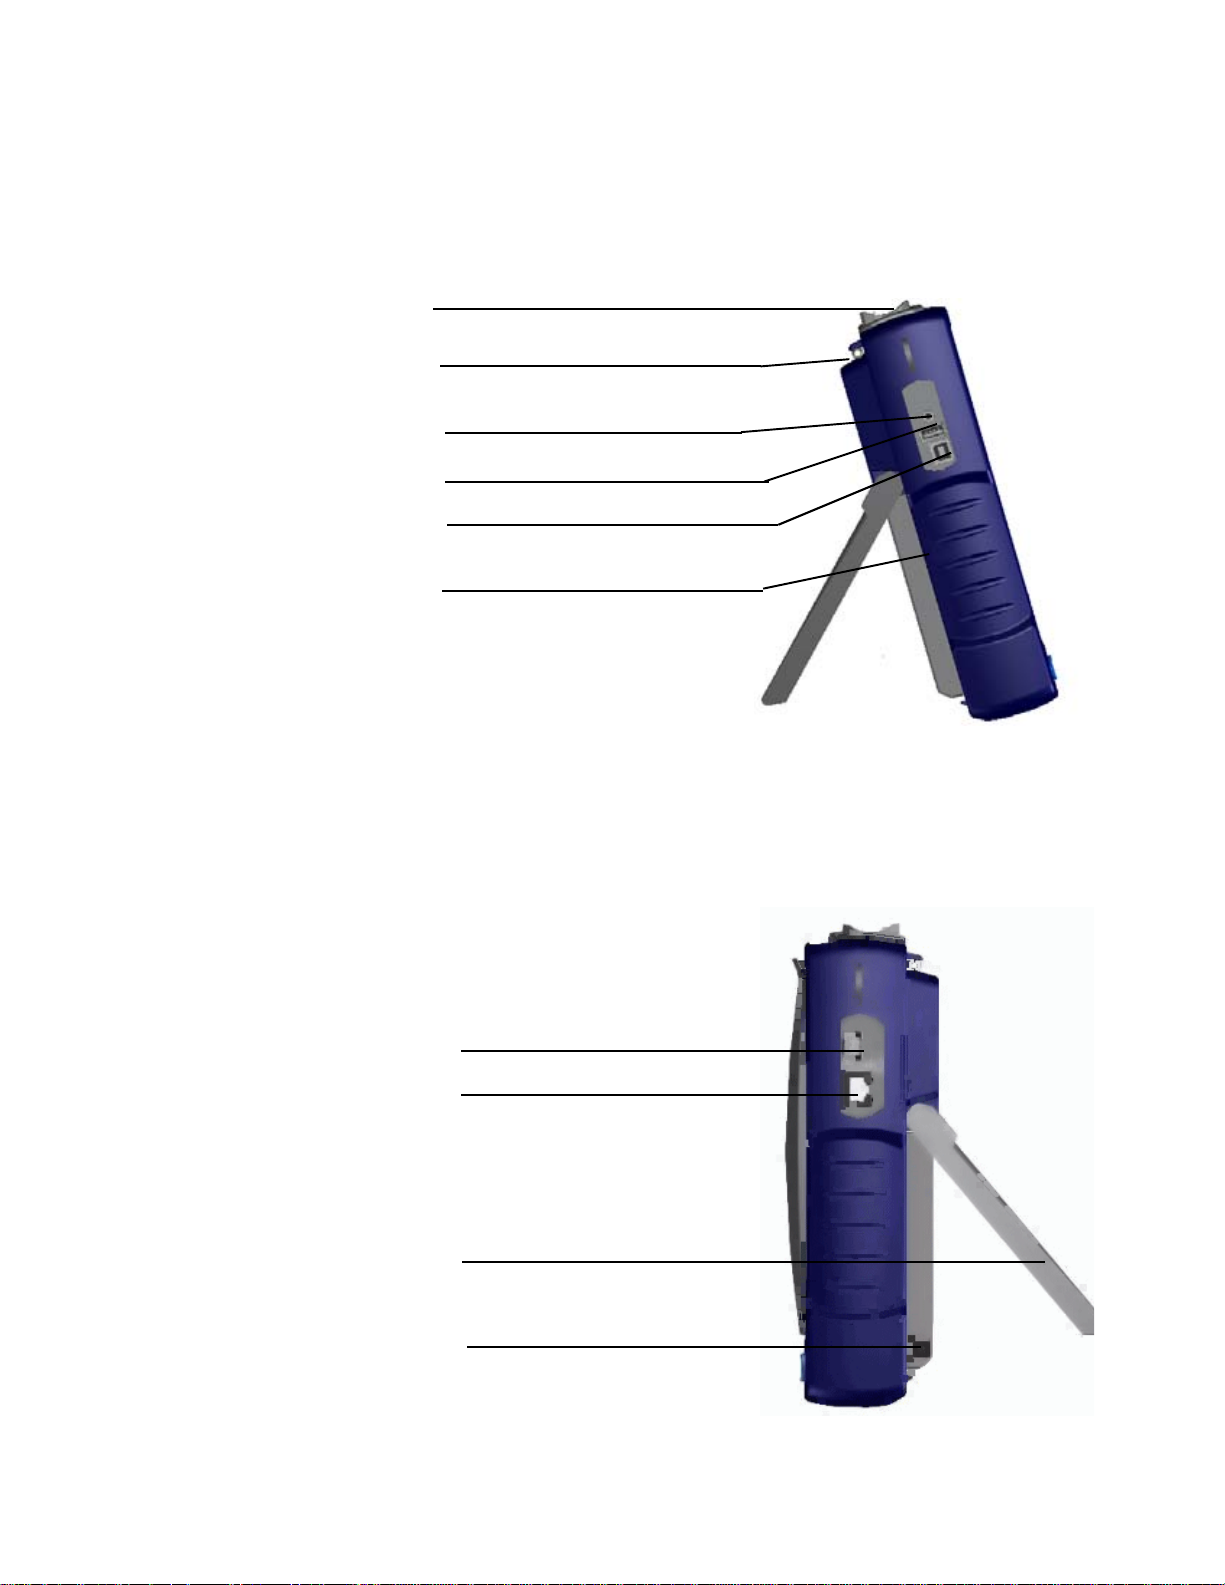
Side Views
Introducing the FrameScopePro 1
The Fram e Scope Pro at a Glance
Card Bus Slot
Stylus clip
Head set Port
USB (Ty pe A )
USB (Type B)
Battery (Backpack)
Figure 2 Left Side
SFP Port
Ethernet RJ 45 Connector
Flip-out stand (back)
Power Jack
Right S ide
Agilent FrameScope Pro User’s Manual 15
Page 16

1 Introducing the FrameScope Pro
The Fram eScope Pro at a Glance
Controls
Color Touch Screen The FrameScope’s touch screen is the main
user interface. Test controls and results are shown here. Simply
press the screen with your finger or a stylus to navigate through
the menus and test controls.
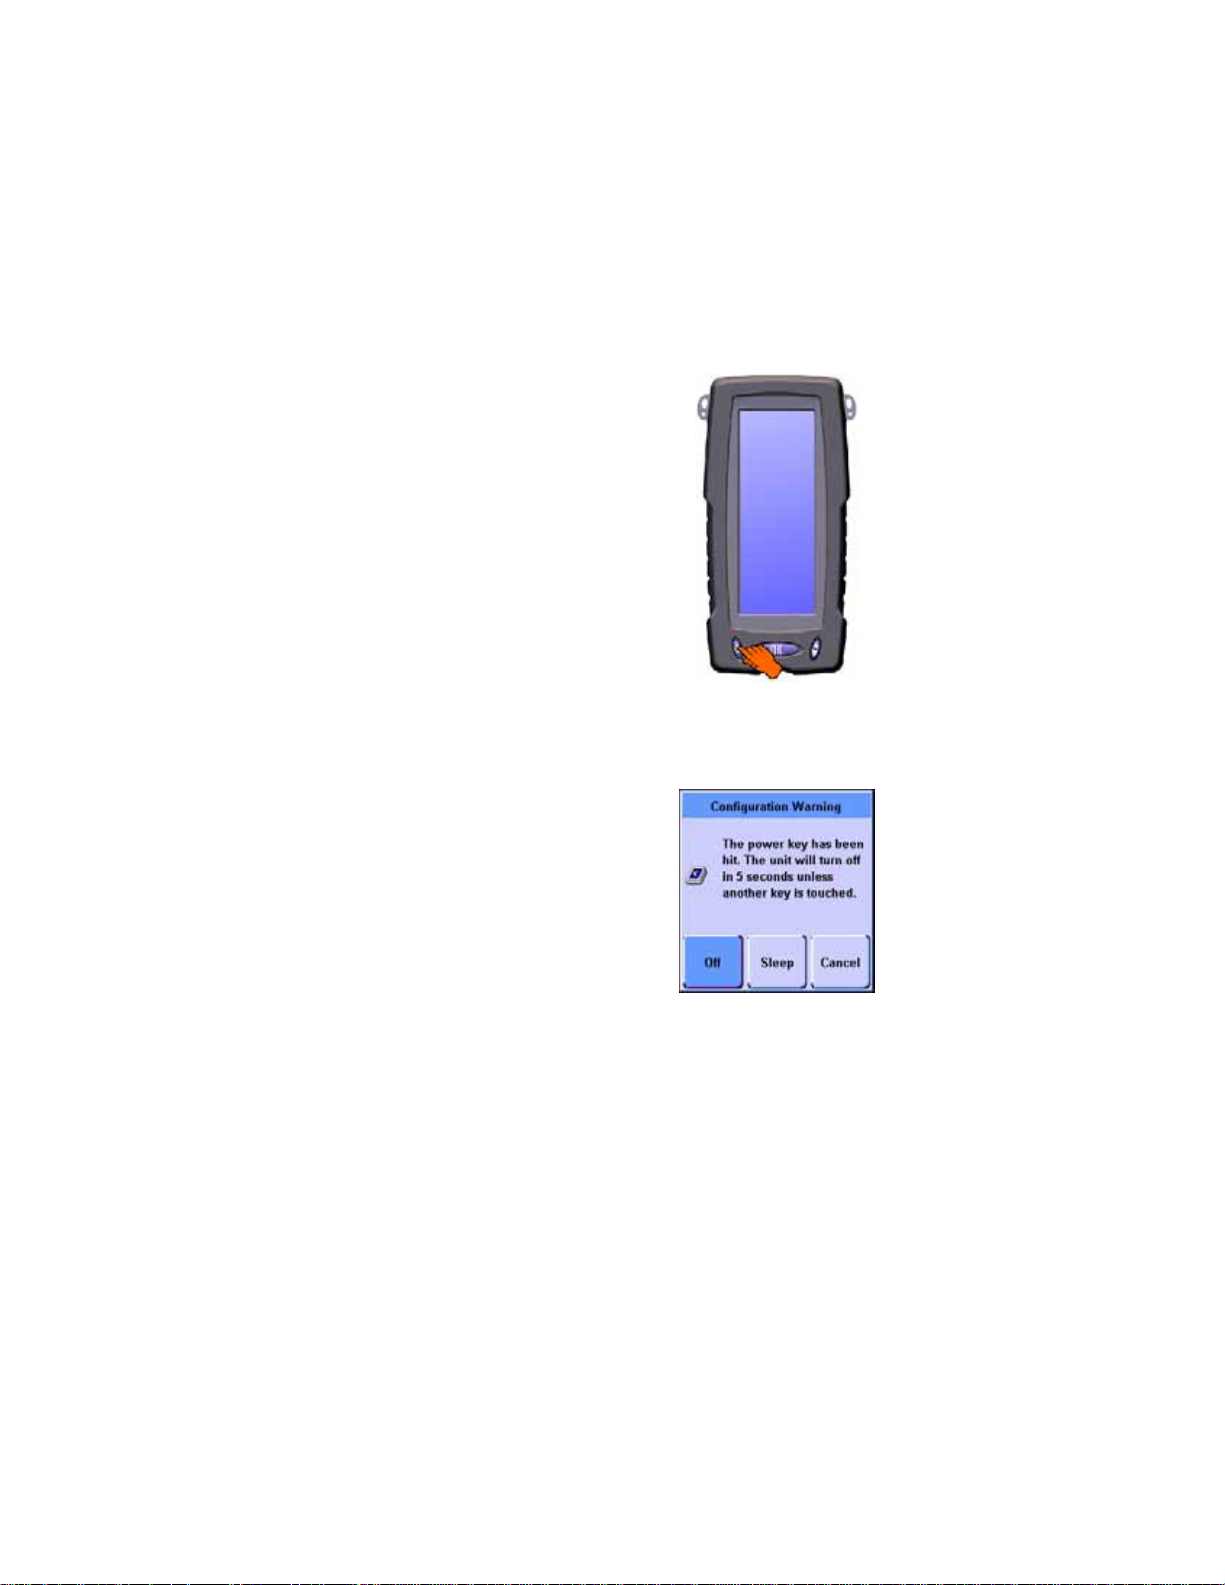
Power Button Press the Power button briefly to switch the unit
on. To switch the unit off, do one of the following:
• Press Power twice.
• Press Power once, wait 5 seconds and the unit powers off.
• Press Power once and hit the Off button on the screen.
OK Button Press the OK button to activate the currently
selected item on the display. Use the OK button to confirm
edits, enter values, and execute selected features.
Ports
CAUTION
Scroll Button The scroll rocker button moves the highlight
cursor on the screen. Use this button to scroll through selected
items on the display.
CompactFlash™ Slot This port on the bottom of the unit
accepts standard CompactFlash™ cards for data storage.
USB Ports The FrameScope provides a universal serial bus
(USB) interface port to connect with PCs and peripherals. The
unit provides a USB Type A port and USB Type B (Hub) port.
Headset Port This port allows you to connect headset to the
FrameScope Pro unit.
DC Power Input The DC power input accepts the Agilent 12 V
DC power adapter/chargers that comes together with your
FrameScope.
Use only the 12 V dc adapter/charger (Agilent part #N2620A-080)
supplied with your FrameScope Pro. Using an incompatible adapter
may violate FrameScope Pro warranty. FrameScope Pro draws
varying amount of current depending on battery charge
condition,accessories attached and type of test executed. Any
inferior adapter may overheat and damage FrameScope Pro, or even
injure the user.
16 Agilent F r ameSc ope P ro U ser ’s M anual
Page 17
The Main Menu at a Glance
Introducing the FrameScopePro 1
The Mai n Me nu at a Glanc e
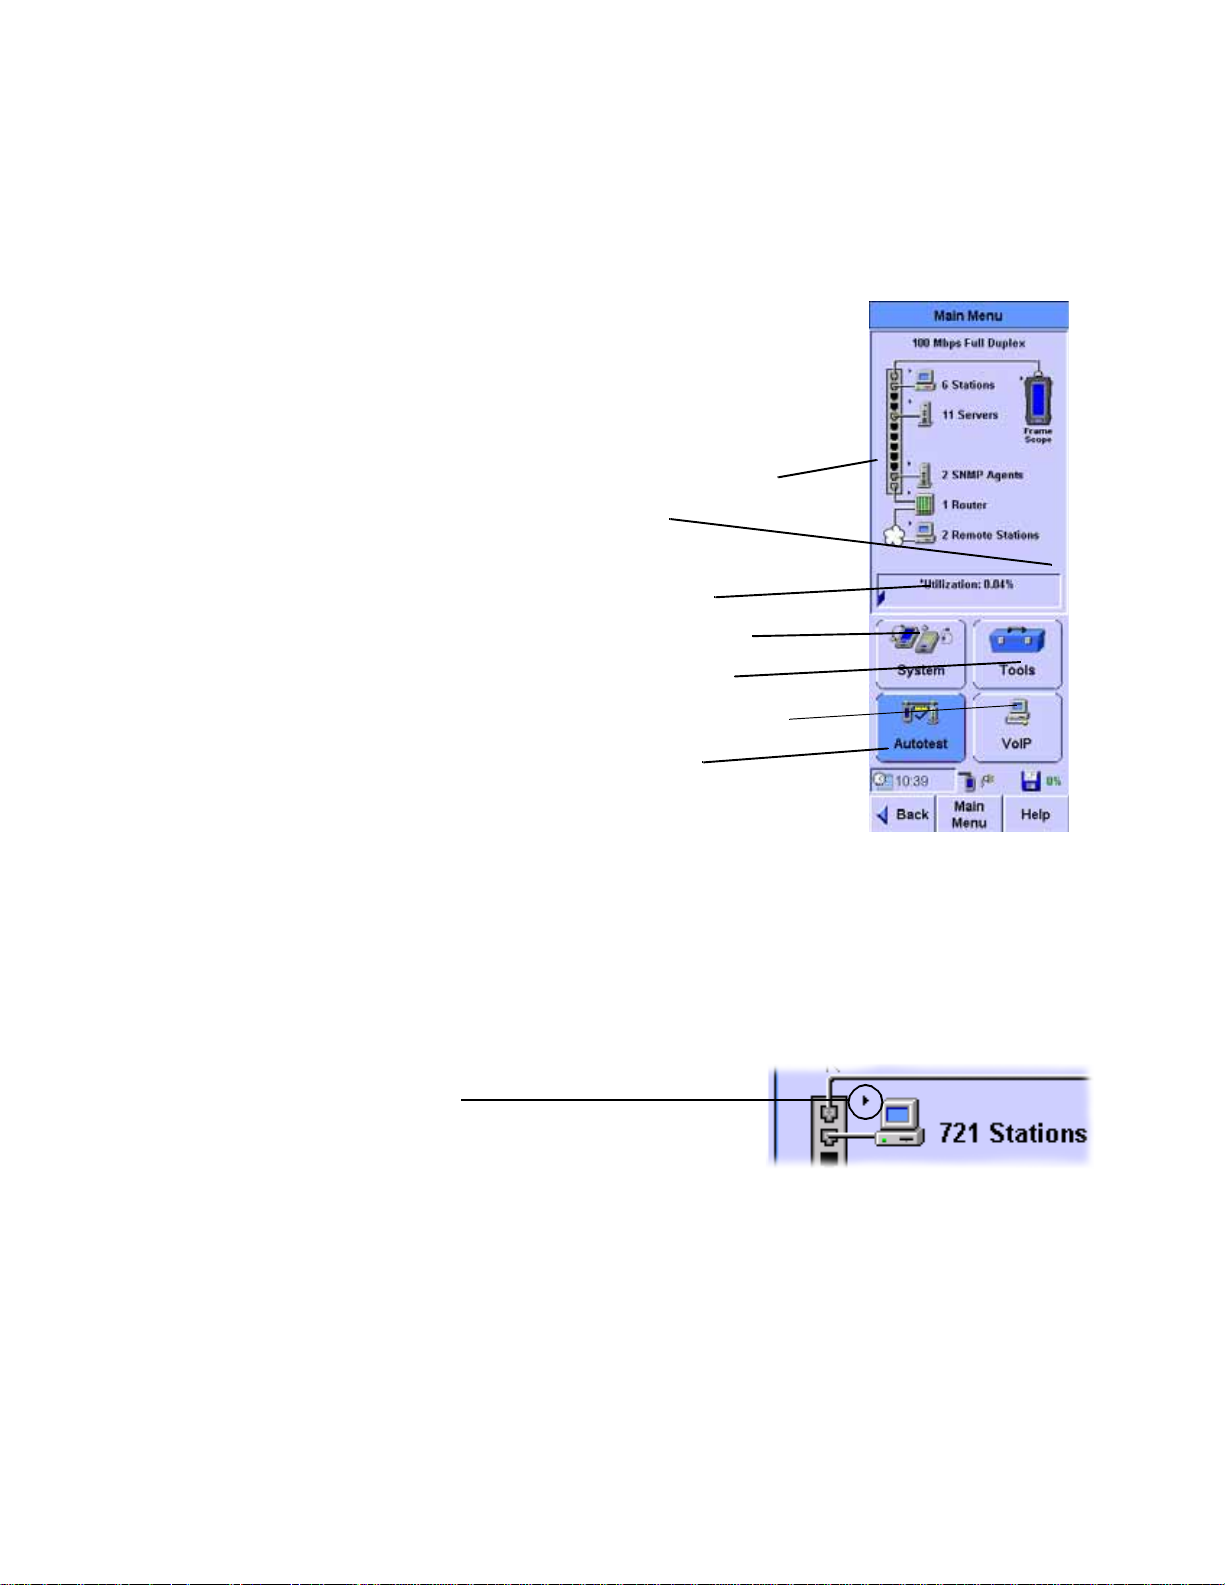
Network resources area
Error Flag
Utilization graph
System menu button
Tools menu button
VoIP menu button(optional)
Autotest button
Figure 3 FrameScope Main Menu
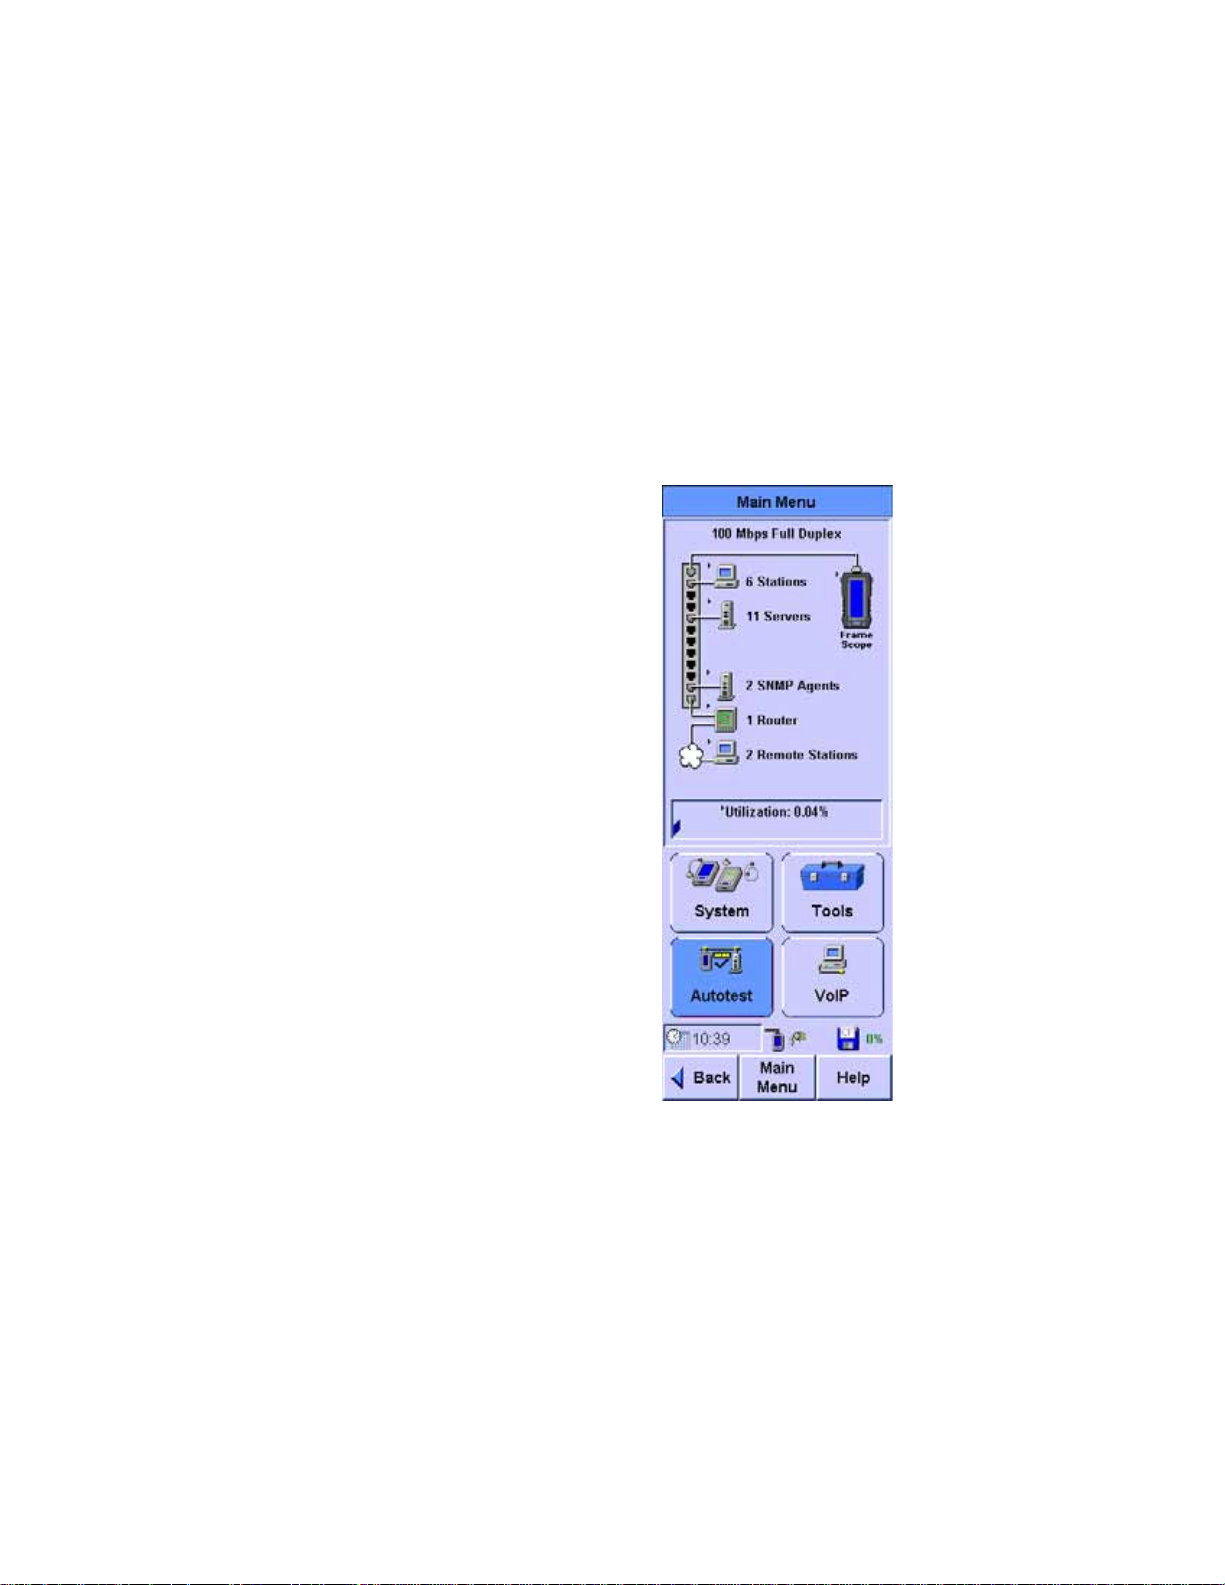
Tab Title Displays the name of the tab.
Network Resource Area Shows all of the detected network
resources. The FrameScope performs auto discovery of network
resources. Resource icons shown with a black triangle (see
below) can be pressed to display more information.
Press icon to view details
Error F lag Displayed when an unacknowledged error is in error
log
Utilization Graph Displays current network usage. Press this
graph to display more statistics.
System Menu Button Calls the System menu.
Tools Menu Button Calls the Tools menu.
Agilent FrameScope Pro User’s Manual 17
Page 18

1 Introducing the FrameScope Pro
The Mai n Me nu at a Glanc e
VoIP Menu Button(optional) Calls the Voice Test menu.
Autotest Button Calls the Network Autotest Setup screen.
18 Agilent F r ameSc ope P ro U ser ’s M anual
Page 19
Getting Started
Switching the FrameScope On and Off
Introducing the FrameScopePro 1
Getting Started
1 To switch the FrameScope on, briefly press the Power button
on the front panel.
The screen will light and a brief tone will sound.
2 While the unit is on, briefly pressing the Power button will
call the Sleep/Shutdown window.
• Press Sleep to put the unit in sleep mode. When the
FrameScope is in sleep mode, briefly press the Power
button or press the screen to reactivate it.
• Press Off or wait five seconds to turn the unit off.
• Press Cancel to go back to the Main Menu.
3 You can also turn the unit off by pressing the Power button
twice.
Agilent FrameScope Pro User’s Manual 19
Page 20
1 Introducing the FrameScope Pro
Getting Started
Checking Power and Charging the Battery
The FrameScope’s battery should provide enough power for a
typical day of testing. The AC power adapter/charger can also
be used to power the unit and to recharge the battery.
NOTE
WARN IN G
To shorten the charging time, Agilent recommends switching off the
FrameScope while charging.
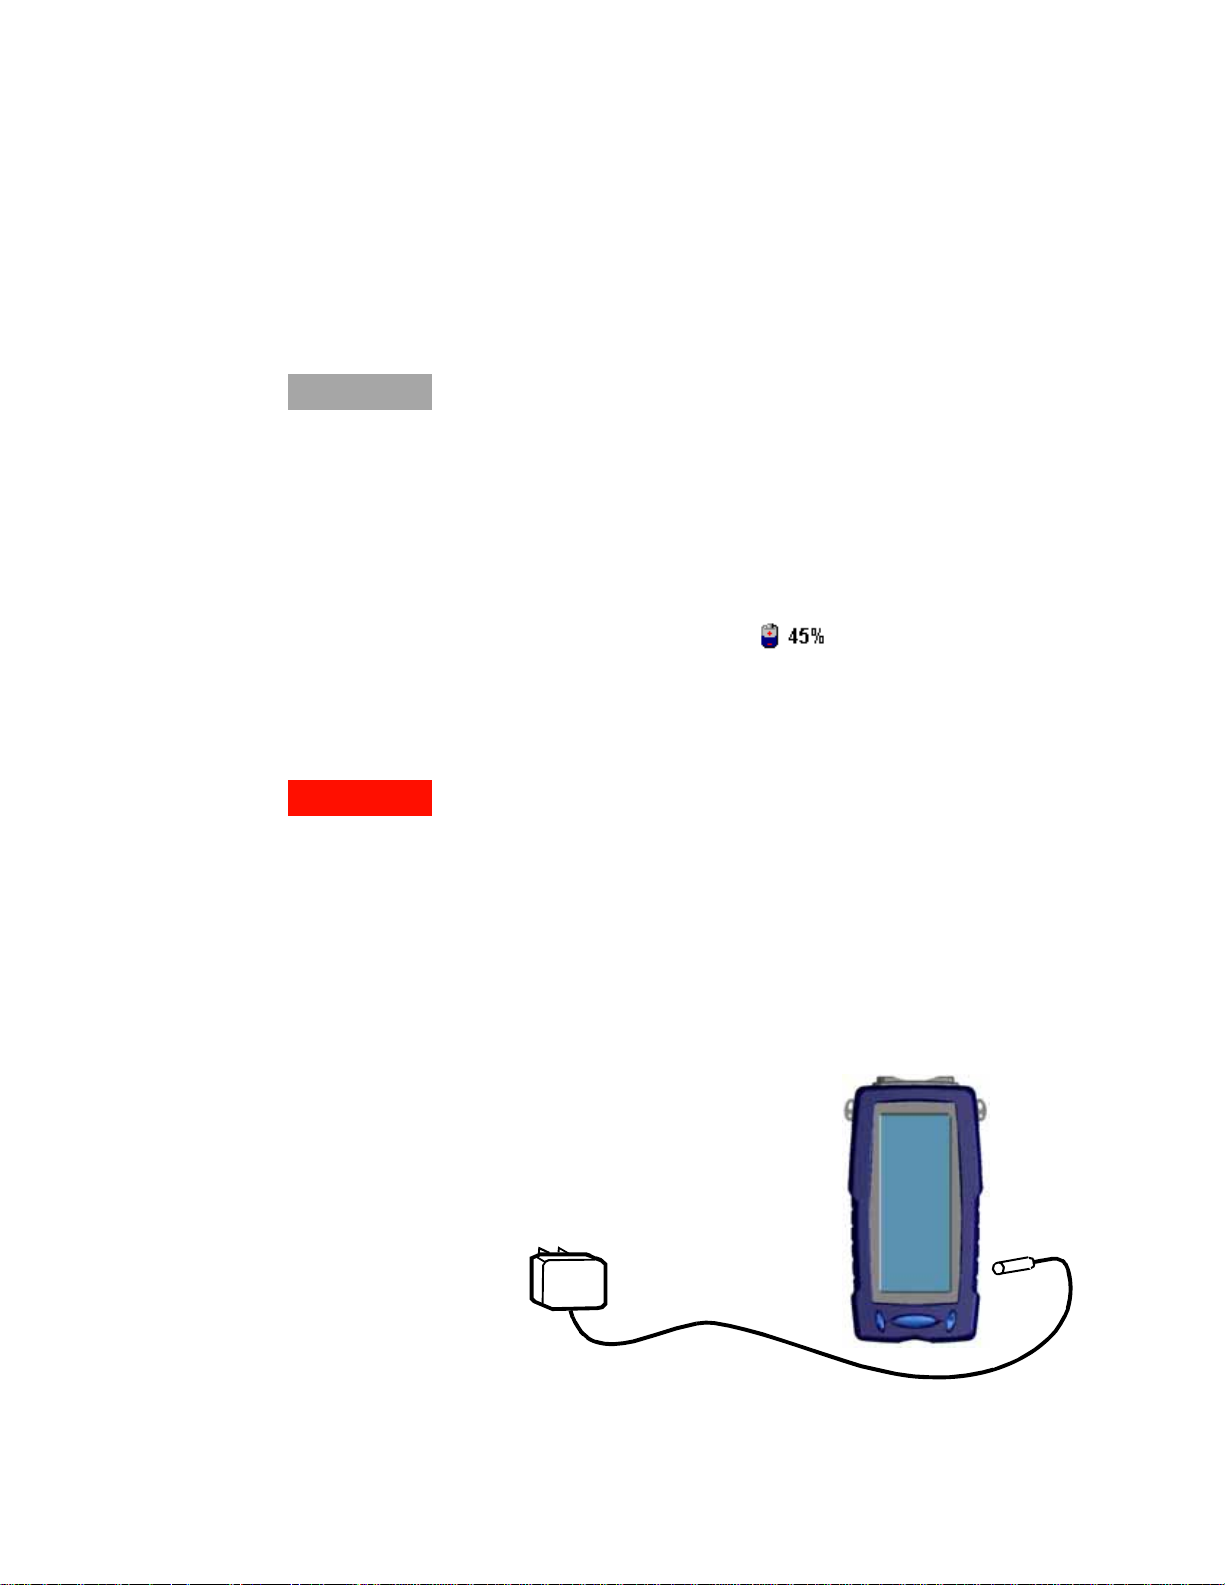
To check the battery’s charge level, perform these steps:
1 Switch on the FrameScope, if necessary, by pressing the
Power button on the front of the unit.
2 Observe the battery icon in the Status display area on the
Main Menu.
The battery icon will show how much charge remains in the
battery (for example, 45%). If the battery is severely depleted,
a low-battery message will be displayed.
Do not operate the FrameScope while the battery is hot
immedia t el y af t er ch arg i n g.
When the battery temperature ex ceeds 55ºC (131º F), a warning
message, for example, “FrameScope too hot”, will appear to alert
the user.
3 To recharge the battery or to power the FrameScope from an
AC power source, plug the DC power connector on the
adapter/charger into the 12 V DC connector on the side of
the battery
20 Agilent F r ameSc ope P ro U ser ’s M anual
Page 21

Introducing the FrameScopePro 1
Getting Started
4
Observe that the AC power icon is displayed in the Status
area.
The AC icon will also indicate the battery’s charge level (for
example 72%).
Agilent FrameScope Pro User’s Manual 21
Page 22

1 Introducing the FrameScope Pro
Getting Started
Connecting to the Network and Using the FrameScopePro
Follow these steps to connect your unit to the network and use
it for testing:
1 Connect the cabling to the FrameScope’s network port.If you
want to perform testing on fiber link, connect the cable on
the SFP port.
2 You operate the FrameScope using its front panel
touchscreen and control buttons. When testing with the unit,
use the following operating tips:
3 Select items on the display by pressing them with your finger
or with a stylus or by scrolling the highlight bar with the
scroll button. The touch screen may not detect a quick press;
you should press firmly.
4 Many screens have lists of items that you can navigate using
the Scroll button. Pressing this button up or down moves the
selection highlight.
Running a Test
5 Selected items are highlighted in dark blue to indicate that
they are selected. Most screens have a default selected item.
6 Execute a selected item by pressing it or by pressing the OK
button.
7 To return the Main Menu at any time, press the Main Menu
button on the bottom of the display.
8 To return to the previous screen, press the Back button on
the bottom of the display.
The basic steps for performing a test with the FrameScope Pro
are described below. For more information on network testing,
see Chapter 2, “Network Testing with the FrameScope Pro”.
1 Switch the unit on. Connect power to charge the battery if
necessary. See “Checking Power and Charging the Battery”
on page 20.
2 Connect the FrameScope to the network under test. See
“Connecting to the Network and Using the FrameScope Pro”
on page 22.
3 Choose the type of test you want by pressing the Autotest,
Tools or VoIP Button.
4 Make any needed configuration changes to match your
testing environment.
22 Agilent F r ameSc ope P ro U ser ’s M anual
Page 23

Operation
About Help
Introducing the FrameScopePro 1
Getting Started
Most basic FrameScope operations execute automatically
and require very little setup. In most cases you can skip this
step.
5 Press the Autotest button or Start Test button or VoIP button to
begin the test.
See “Viewing Details and Statistics” on page 35 for information
on reviewing network test results.
In order to store any test suites or test results on the FrameScope, it is necessary to insert the CompactFlash™ memory
card into the CompactFlash™ card slot. The FrameScope will
operate without it, but no storage is available.
The FrameScope Pro comes with a built-in help system, which
helps you to operate the unit.
1 Press the Help button on Main menu to get to the main page
2 Press the Index button to get all the help available on the
3 From the Index menu, select the topic in which you are
Before you call the technical support hotline, please refer to the
online help system.
Software Upgrade
Agilent will continue to upgrade the FrameScope Pro’s software
to meet your needs. You may obtain the latest software release
from our website:
Use FrameScope Pro Software Upgrade Utility to download the
software into FrameScope Pro. For details about this utility
please refer to the FrameScope Pro Software Upgrade Utility
Manual.
of the help system.
FrameScope Pro.
interested.
http://www.framescope.com
Caution: Do not interrupt the downloading process. Any
interruption may cause corrupted software, and require
repair at the Customer Service Center. To avoid power loss
due to a low battery, the unit should be plugged into AC
power during the upgrade.
Agilent FrameScope Pro User’s Manual 23
Page 24

1 Introducing the FrameScope Pro
Getting Started
Localization
The unit may be shipped with the local language already
installed.
Software versions exist on the Utilities CD supplied which provide for the following languages for the FrameScope:
English
Korean
French
German
Chinese (simplified)
Italian
Spanish
Japanese
To install a language version other than English, use the FrameScope Pro Software Upgrade Utility to upgrade the FrameScope
to the language desired, or using a USB cable.
24 Agilent F r ameSc ope P ro U ser ’s M anual
Page 25

Agilent N262 0A FrameScop e 350 Network Per for m anc e An alyze r
User’s Manual
2
Network Testing with the
FrameScope Pro
Network Testing Overview 26
Examining the Network 27
Network Overview 27
Detailed List 28
Running an Autotest 29
Changing the Autotest Metrics 32
Using the Stations List 33
Viewing Details and Statistics 35
Performing a Ping Test 38
Performing a Trace Route 41
Performing SNMP Queries 44
Viewing Statistics 47
Generating Networ k Traffic 50
Performance Tests 53
Performing RFC 2544 Tests 57
RFC 2544 Test Results 67
Locati ng a Port with Blink Port 72
Viewing the Error Log 74
WireMap Adapter Testing 76
Using the Test Database 79
Using the Network Database 80
Locating Switch Ports 83
This chapter describes how to use your Agilent FrameScope Pro
as a network performance analyzer.
The FrameScope network testing features allow you to create a
list of key network resources and evaluate their performance.
Active discovery and detailed metrics allow you to troubleshoot
problems and pinpoint network bottlenecks.
Agilent Technologies
25
Page 26

2 Network Testing with the FrameScope Pro
Network Testing Overview
Network Testing Overview
The following steps describe the general procedure for
performing network analysis testing using the FrameScope Pro.
1 Power the unit on. See “Switching the FrameScope On and
Off” on page 19.
2 Connect to the network under test. See “Connecting to the
Network and Using the FrameScope Pro” on page 22.
The FrameScope automatically begins to poll the network
and locate devices. See “Examining the Network” on page 27.
3 View details about the detected network resources. See
“Detailed List” on page 28.
4 Perform an Autotest on any or all desired resources. See
“Running an Autotest” on page 29.
5 Select any devices on the network and perform additional
testing, such as:
• Ping test; see page 38.
• Trace Route test; see page 41.
• SNMP Queries; see page 44.
6 Save results as desired, perform other tests or functions.
26 Agilent F r ameSc ope P ro U ser ’s M anual
Page 27
Examining the N etw ork
Network Overview
Network Testing with the FrameScope Pro 2
Examining th e Network
FrameScope will start discovery process on the network as
soon as it is switched ON.
The Network resources area of the display will show a list of
detected network devices.
Agilent FrameScope Pro User’s Manual 27
Page 28
2 Network Testing with the FrameScope Pro
Examining the Network
Detailed List
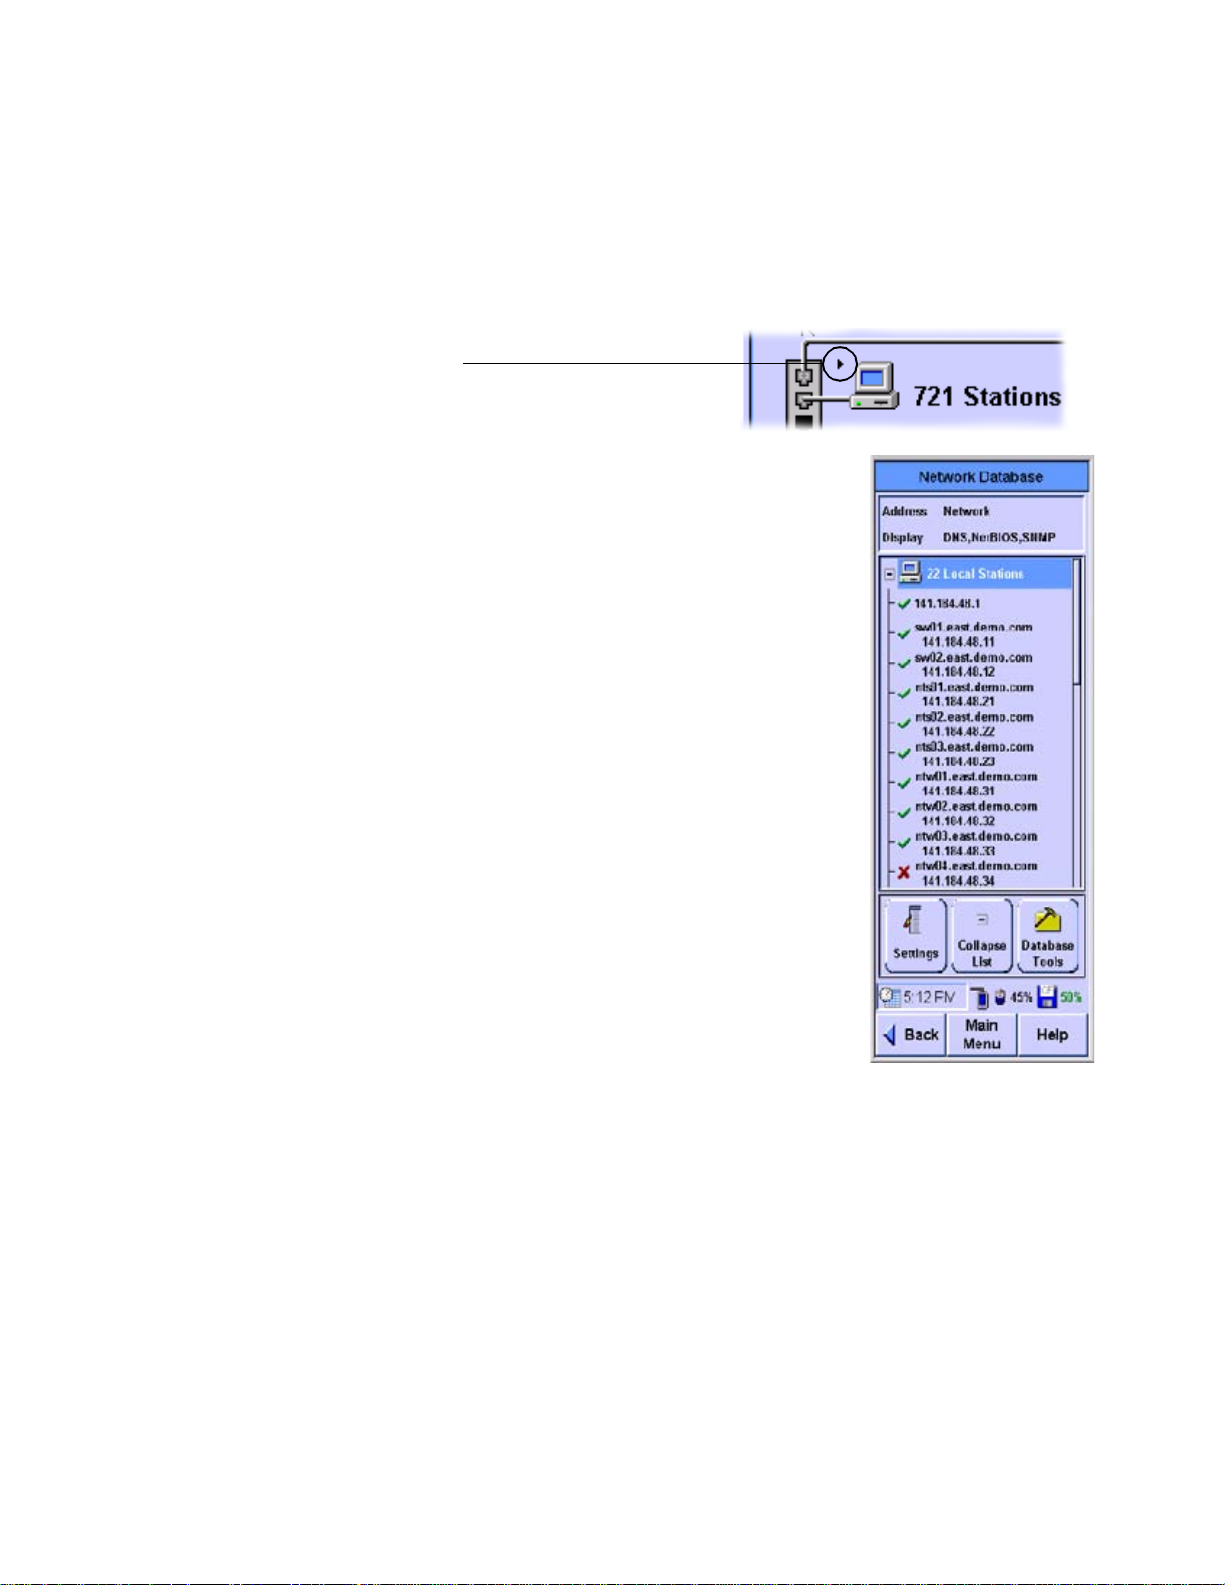
1 To view a detailed list of network resources, press on any
category in the Network Resources area. A triangle indicates
that a list is available for that category.
Press icon to view details
2 Use the Scroll button to select items
in the list. The Collapse List and
Expand List button is renamed View
when the highlight is on a particular
station. Press the View button to see
details of the selected item. A red ‘X’
means that the device wasn’t present
the last time it was checked.
3 Press Back to return to the Network
tab, or press Main Menu to return to
the beginning screen.
28 Agilent F r ameSc ope P ro U ser ’s M anual
Page 29
Running an Autotest
Network Testing with the FrameScope Pro 2
Running an Auto test
This section describes how to run an Autotest on the network
using the FrameScope Pro. The FrameScope can store Autotest
suites that define which network elements to test.
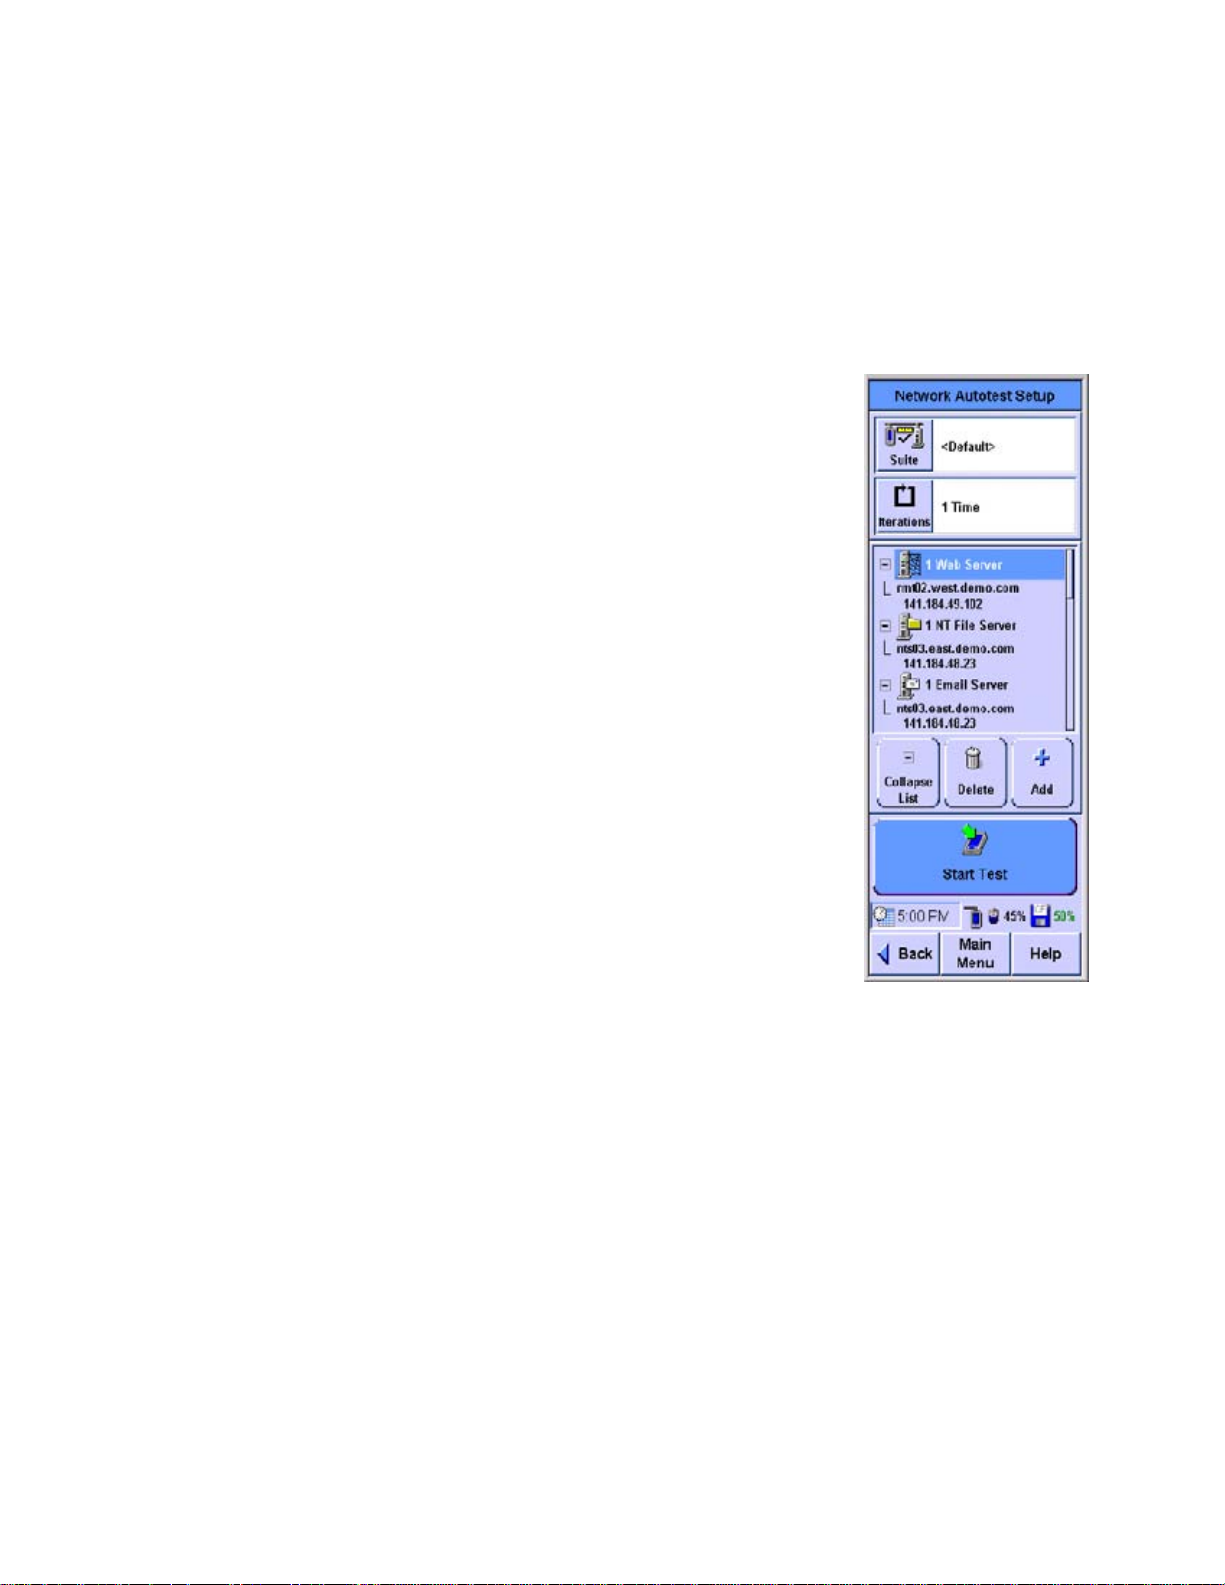
1 From the Network Overview screen
(see page 27) press the Autotest
button. The Network Autotest Setup
screen is displayed.
Agilent FrameScope Pro User’s Manual 29
Page 30
2 Network Testing with the FrameScope Pro
Running an Autotest
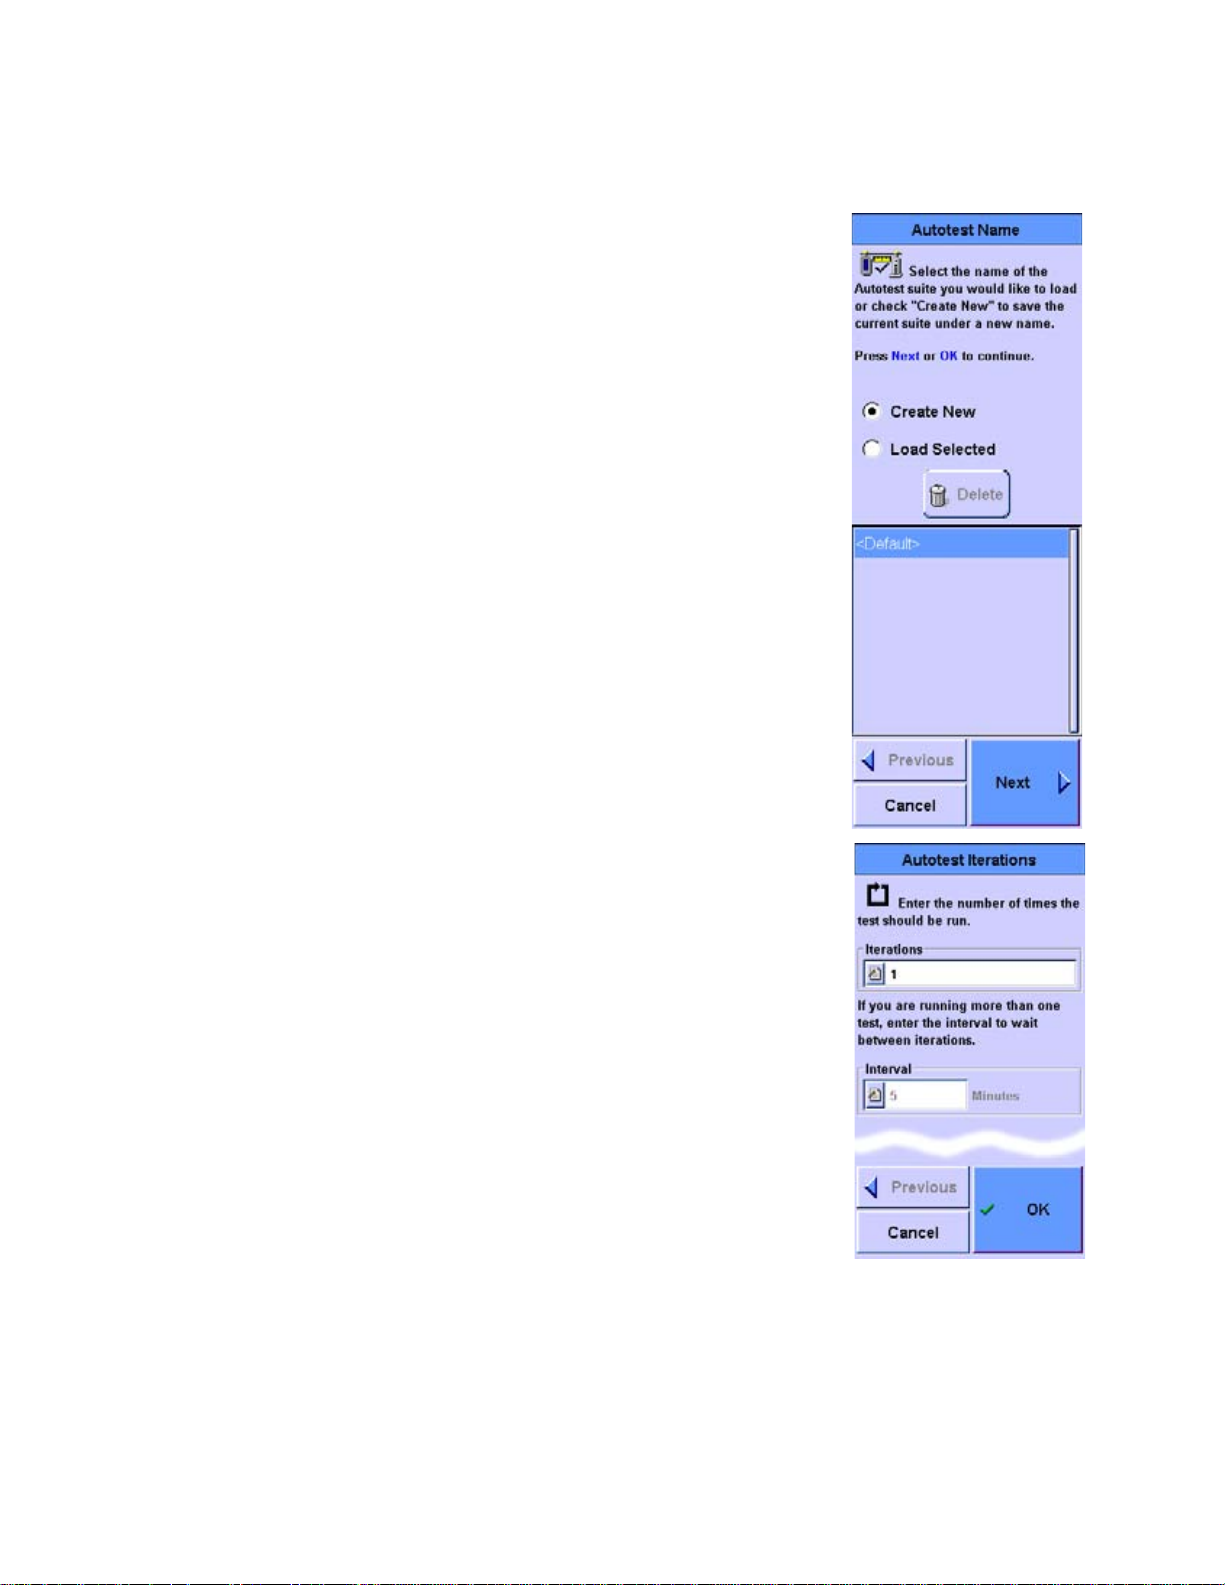
2 If you want to save this Autotest
suite, or load a previously-stored
suite, press the Suite button.
3 Select a stored suite from the list
or select Cre at e N ew, then press
the Next button. You can select
<Default> if you want to reload
the default suite.
4 If you Create New, you will be
prompted to enter a new name.
a On the Network Autotest
Setup window, press the
Iterations button to select how
many times the test is to be
run.
b Enter the number of times you
want the test to run in the
number entry box.
c Enter the time in minutes to
wait between tests in the
Interval text box.
d When you have finished press
OK.
5 On the Network Autotest Setup
screen, use the Delete and Add
buttons to remove or insert
elements from the resources list. You can also use the Add
button to enter new network resources.
6 To change an item on the resources list, select the item and
press the Edit button. You will be able to enter new details for
that network resource.
30 Agilent F r ameSc ope P ro U ser ’s M anual
Page 31

Network Testing with the FrameScope Pro 2
Running an Auto test
For more details, see “Network Performance Autotest” on
page 129.
7 When you have finished setting up
the test, press the Start Test button
(or press OK) on the Network
Autotest Setup screen. The test will
begin.
8 To stop the test at any time press the
Stop Test button.
9 To view information about a network
element’s results, select the element
from the list and press the Details
button.
10 Press the Save Re sults button to store
the test data on the CompactFlash™
card.
The rating numbers will range from 5 to
1, where 5 is best and 1 is worst. A red
‘X’ will be displayed if an error
occurred during the test. See the next
section for how to change the metrics
used to derive the ratings.
Agilent FrameScope Pro User’s Manual 31
Page 32

2 Network Testing with the FrameScope Pro
Changing the Autotest Metrics
Changing the Autotest Metrics
The FrameScope Pro provides a measure of service speed and
efficiency by emulating a client device in the network. By
making a request for service to a key device, and comparing the
results to reasonable expectations, it provides a rating of the
service. However, the default numbers used to determine the
rating may not apply to the network under test.
For example, you may know that the connection to the available
domain name server is over a slow link and this link cannot be
upgraded.
Consequently, it may be more important to have a test that is
less sensitive but provides meaningful results that can be
compared over time. The FrameScope Pro rating can be
changed. After you’ve run the test and received a result, such as
that shown below on the left, you can highlight the server
address and press Details. The screen shown in the middle
provides the measured results of the test. If you double click on
Name Lookup, you can change the rating scale to whatever
values you choose. The screen on which you do that is shown
below on the right. This can be done for all rated measurements.
See Chapter 5, “Network Performance Analyzer Reference”.
32 Agilent F r ameSc ope P ro U ser ’s M anual
Page 33

Using the Stations List
Network Testing with the FrameScope Pro 2
Using the Stations List
When a network resource on the Network tab is shown with a
black triangle, you can press the resource to display the
Network Database screen, which includes the Stations List.
1 On the Network tab, press the resource you wish to view.
Press here to view details
Stations List
2 Use the Scroll button to navigate through the items on the
Station List.
3 Expand or collapse the Station List by selecting a
category and then pressing the Expand (or Collapse)
button.
Agilent FrameScope Pro User’s Manual 33
Page 34

2 Network Testing with the FrameScope Pro
Using the Stations List
NOTE
The Collapse List, Expand List, and View buttons all appear in the same
place on the s creen, dep ending on the currently selected item in the
Station List. See also “Viewing Details and Statistics” on page 35.
4 You can use the Settings button to
reorder the Station List and select
what information is displayed.
5 You can use the Database Tools button
to update, erase, load or save the
Stations List or delete a resource from
the Stations List.
34 Agilent F r ameSc ope P ro U ser ’s M anual
Page 35

Viewing Details and Statistics
1 Select a station on the Station List
and then press the View button.
Network Testing with the FrameScope Pro 2
Using the Stations List
Agilent FrameScope Pro User’s Manual 35
Page 36

2 Network Testing with the FrameScope Pro
Using the Stations List
2 Press the Statistics button to view
statistics about the station.
36 Agilent F r ameSc ope P ro U ser ’s M anual
Page 37

Network Testing with the FrameScope Pro 2
3
On the Station Detail screen,
press Tools to see a list of test
tools that can be used on the
selected station. These tools are
describe in more detail in the
following sections.
Using the Stations List
NOTE
The tools that are displayed on the Station
Tools list will vary depending on what type
of station you are viewing. Not all tools are
availabl e for every type of station.
Agilent FrameScope Pro User’s Manual 37
Page 38
2 Network Testing with the FrameScope Pro
Performing a Ping Test
Performing a Ping Test
The Ping test allows you to check if communications can be
established with a particular remote node. The FrameScope
“pings” a remote node by sending it a request message. If the
remote device is active and reachable it will respond.
Follow these steps to run a Ping test.
1 From the main Network tab or
from a device’s display on the
Station List, press the Tools
button to display a menu of
available network testing tools.
38 Agilent F r ameSc ope P ro U ser ’s M anual
Page 39

Network Testing with the FrameScope Pro 2
2
Press the Ping button to call the
Ping screen.
3 Enter the device you want to ping in
the Target box. You can enter the
device name or address.
4 Select the ping options you want,
selecting IP or IPX, length of the
ping, and the number of iterations.
5 Enter the Time To Live and whether
you want fragmentation in the IP
Options area. Or if you selected IPX
above, select the IPX request type:
Diagnostic or PING.
Performing a Ping Test
Agilent FrameScope Pro User’s Manual 39
Page 40

2 Network Testing with the FrameScope Pro
Performing a Ping Test
6 Press the Start button to begin the
ping test.
The Ping Results screen will be
displayed.
7 Observe the results of the Ping test.
The screen will show the frame
length you selected, the number of
requests (pings) sent and the
number of replies received. Data on
the response times are also
displayed.
8 To run the test again press the Start
button.
40 Agilent F r ameSc ope P ro U ser ’s M anual
Page 41

Performing a Trace Route
Network Testing with the FrameScope Pro 2
Performing a Trace Route
The Trace Route test allows you to determine the path through
the network to a particular device. The FrameScope sends data
packets over the network and returns the routers on the path
and the time it took for each hop.
The following procedure describes how to run a Trace Route
test.
1 From the main Network tab or
from a device’s display on the
Station List, press the Tools
button to display a menu of
available network testing tools.
Agilent FrameScope Pro User’s Manual 41
Page 42

2 Network Testing with the FrameScope Pro
Performing a Trace Route
2 Press the TraceRoute button to call
the TraceRoute screen.
3 Enter the device to which you want
to trace in the Target box. You can
enter the device name or address.
4 Select the maximum number of
hops to be reported.
42 Agilent F r ameSc ope P ro U ser ’s M anual
Page 43

Network Testing with the FrameScope Pro 2
5
Press the Start button to begin the
TraceRoute test.
The TraceRoute Results screen
will be displayed.
6 Observe the results of the
TraceRoute test.
The screen will show the number
and address of each hop. In
addition the delay (in seconds) to
each hop is shown. The delay is
cumulative, but since each
termination is measured
individually, an anomaly may exist
where an intermediate time is
greater than a subsequent time
due to network performance.
7 To run the test again press the
Start button.
Performing a Trace Route
Agilent FrameScope Pro User’s Manual 43
Page 44

2 Network Testing with the FrameScope Pro
Performing SNMP Queries
Performing SNMP Queries
The simple network management protocol (SNMP) query tool
allows you to send a query to the management information
database (MIB) and retrieve the available information for that
host.
The following procedure describes how to run an SNMP Query
using the FrameScope Pro
1 From the main Network tab or
from a device’s display on the
Station List, press the Tools
button to display a menu of
available network testing tools.
44 Agilent F r ameSc ope P ro U ser ’s M anual
Page 45

Network Testing with the FrameScope Pro 2
2
Press the SNMP Queries button to
call the SNMP Query screen.
3 Enter the device to which you want
to query in the Target box. You can
enter the device name or address.
4 The SNMP Settings button allows you
to add SNMP communities and
ports to the default “public”
community and default port 161 or
to change those set up for auto
discovery.
Perf o r m i ng SNMP Qu e r ie s
Agilent FrameScope Pro User’s Manual 45
Page 46

2 Network Testing with the FrameScope Pro
Performing SNMP Queries
5 Press the Start button to begin the
SNMP Query test.
The SNMP Queries Results screen
will be displayed.
6 Observe the returned information on
the SNMP Queries results screen.
The screen will show the
description, ID, and other
information as returned by the
remote host.
7 To run the test again press the Start
button.
46 Agilent F r ameSc ope P ro U ser ’s M anual
Page 47

Viewing Statistics
Network Testing with the FrameScope Pro 2
Viewing Statist ics
You can use the FrameScope to view a variety network
parameters, and see performance statistics for them. The
following procedure describes how to use the FrameScope’s
Statistics tool.
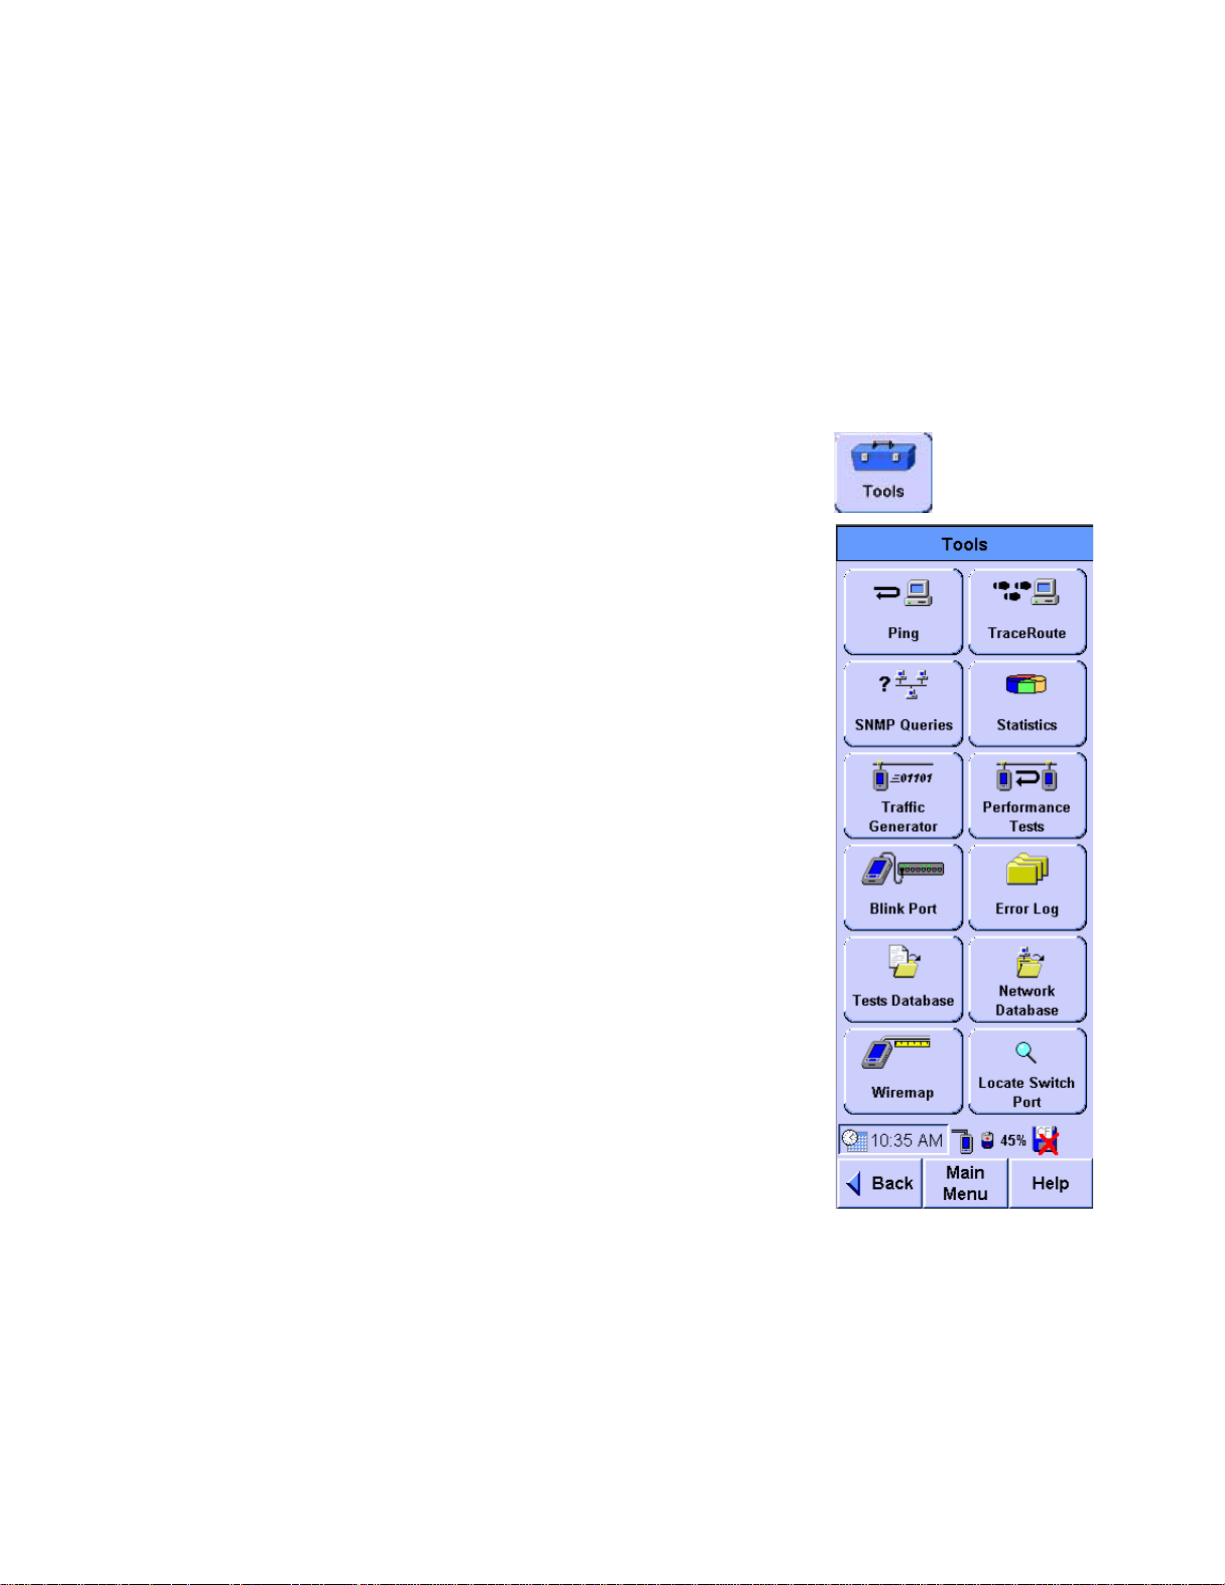
1 Press the Tools button on the main Network tab to display the
Tools menu or use the shortcut from the Network Main Menu
by pressing the Utilization bar
OR
Agilent FrameScope Pro User’s Manual 47
Page 48

2 Network Testing with the FrameScope Pro
Viewing Statisti cs
2 Press the Statistics button to call the Statistics screen.
Press this to view or
change the
Statistics settings.
Press this to view
the list of saved data
or to delete saved
data.
The screen shows network utilization and other traffic data
such as frame counters, and protocol counters.
3 To view additional details, press any item shown with a black
triangle.
• Press Unicasts, Broadcasts, or Multicasts to view the top
talkers for that frame type.
• Press Errors to view a breakdown of the types of errors
detected on the network.
4 Press the Settings button on the Statistics screen to switch
between counts and percentages, protocols and frames.
48 Agilent F r ameSc ope P ro U ser ’s M anual
Page 49

Network Testing with the FrameScope Pro 2
Viewing Statist ics
Set the Interval
between 2 to 1080
seconds. The graphs
display statistics of
data captured within
this time interval and
refreshes every
interval time.
Press Utilization on the Statistics screen to view the top
5
talkers (most active devices) on the network.
Press here to
view details
Saving and Retrieving Statistics Data
The Statistics Data can be saved on the main page of the
statistics function. You can view a list of statistics data saved by
clicking on the Database button.
To retrieve the saved data tables, you can either access the CF
card using a card reader or via the FrameScope Pro configured
as a web server. (Please refer to “Remote Control” on page 114).
Agilent FrameScope Pro User’s Manual 49
Page 50

2 Network Testing with the FrameScope Pro
Generating Network Traffic
Generating Network Traffic
You can use the FrameScope’s Traffic Generator to create
network traffic to stress the network and observe how is reacts
under different loads.
The following procedure describes how to use the Traffic
Generator.
1 Press the Tools button on the
main Network tab to display the
Tools menu.
50 Agilent F r ameSc ope P ro U ser ’s M anual
Page 51

Network Testing with the FrameScope Pro 2
2
Press the Traffic Genera tor button. The
Traffic Generator screen will be
displayed. To add security to the use
of the traffic generator, since it may
disrupt your network, you may
configure a password to prevent
someone without the password from
using the traffic generator.
3 On the Parameters tab, configure
the traffic characteristics as you
desire. Press each parameter (Frame
Length, Frame Rate, and so on) and
enter the value you want in the
on-screen keypad. See “Traffic
Generation” on page 158.
4 To inject errors in the generated
traffic, press the check box for the
type of error you want (CRC, short
frame, or long frame). See “Traffic
Generation” on page 158.
Generating Network Traffic
5 To configure the frame
characteristics of the traffic, press
the Frame tab.
Agilent FrameScope Pro User’s Manual 51
Page 52

2 Network Testing with the FrameScope Pro
Generating Network Traffic
6 Press the box buttons to enter the
Frame Type, MAC source, and MAC
Destination. See “Traffic
Generation” on page 158. Note that
if you select an IP type frame, you
will get additional selections for IP
Source and IP Destination.
7 Press the Start button to begin
generating traffic. The Traffic
Generator activity screen is
displayed.
8 Observe the traffic statistics. For more
information on the results, see “Traffic
Generation” on page 158.
9 If you want to change traffic
parameters press the Back key to
return to the Parameters and Frame
tabs. To restart the test press Start.
52 Agilent F r ameSc ope P ro U ser ’s M anual
Page 53

Performance Tests
Network Testing with the FrameScope Pro 2
Performance Tests
Performance tests comprise of RFC 2544 tests and IP or MAC
Loopback tests. These tests are used to verify the performance
of network between two network points. Using this performance
tests tool, you can perform the following:
• MAC or IP Loopback Test — go to “Performing a MAC or IP
Loopback” on page 55.
• RFC 2544 Throughput Test — go to “RFC 2544 Throughput
Test” on page 57.
• RFC 2544 Round-trip Latency Test — go to “RFC 2544
Round-trip Latency Test” on page 57.
• RFC 2544 Frame Loss Rate Test - go to ““RFC 2544 Frame
Loss Rate Test” on page 58
• RFC 2544 Back To Back Test - go to “RFC 2544 Back to Back
Test” on page 58
NOTE
All performance tests require two FrameScope or a loopback device (for
RFC 2544 test only); one at each end of the network circuit to be tested.
General settings for the master FrameScope
To start off any performance test, follow the steps below:
1 Connect two FrameScope or a FrameScope with loopback
device (for RFC 2544 test only) to the network. Connect one
at each end of the network circuit you want to test. See
“Connecting to the Network and Using the FrameScope Pro”
on page 22.
Agilent FrameScope Pro User’s Manual 53
Page 54

2 Network Testing with the FrameScope Pro
Performanc e Tests
2 On the master FrameScope,
press the Tools button on the
main Network tab.
3 Press Performance Tests button
on the Tools menu.
54 Agilent F r ameSc ope P ro U ser ’s M anual
Page 55

Performing a MAC or IP Loopback
Network Testing with the FrameScope Pro 2
Performance Tests
NOTE
The MAC loopback test only works within the subnet (does not
work across routers).
The master or target FrameScope sends periodic MAC-level or
IP-level messages to the slave FrameScope with user-defined
periodic interval. The slave FrameScope echoes back each of
these messages. The FrameScope will record the number of
transmitted, received and error frames, the current, average,
minimum and maximum delays of frames.
To perform the tests, see the following steps:
1 From the Performance Tests
menu, select MAC Loopback or IP
Loopback
2 There are two options to search
for the slave FrameScope:
Option 1: If you do not know the
MAC or IP address/name of the
slave FrameScope, select Search
for FrameScope.
Option 2: For MAC Loopback, un
check the Search for FrameScope
check box and enter the MAC
address of the slave FrameScope.
For IP Loopback, enter the IP
address or name of the slave FrameScope.
3 In the MAC or IP Loopback menu, press Start or press the OK
button to begin the test.
The FrameScope will search the other FrameScope (which
will be acting as slave) on the network and then report back
the link results.
Agilent FrameScope Pro User’s Manual 55
Page 56

2 Network Testing with the FrameScope Pro
Performanc e Tests
Option 1: Select
Search for
FrameScope to
automatically locate
the slave FrameScope
within the subnet.
Option 2: Un Check
Search for
FrameScope and
enter the MAC
address of the slave
FrameScope.
Press Save to save
current test results.
Search results
displays the MAC
address and current
MAC loopback test
results.
Press Interval to
enter time (in
seconds) between
the start time of a
transmitted frame to
the start time of next
transmitted frame
from the master
FrameScope.
Option 1: Use auto
search to locate the
slave FrameScope
within the subnet.
Option 2: Key in the
name or IP address of
slave FrameScope.
56 Agilent F r ameSc ope P ro U ser ’s M anual
Page 57

4
Press Stop to cancel the test or to review the transmission
information on the MAC Loopback or IP Loopback screen.
Performing RFC 2544 Tests
RFC 2544 tests comprise of round-trip latency test,
point-to-point throughput test, frame loss rate tests and back to
back tests.
Network Testing with the FrameScope Pro 2
Performance Tests
NOTE
For RFC 2544 te sts, if the slave FrameScope unit is in use, for example,
running a frame loss rat e or back to back test, an auto-search from the
master FrameScope unit will result in Search Failed. A specific search
(keying in t he IP addre ss) on a FrameScope unit under test will result in
Remote Busy.
RFC 2544 Throughput Test
This test is designed to determine the maximum throughput
rate in frames per second, bits per second or percentages for
different frame length between two network points with no
frame loss.
The test sends frames at a constant rate in unidirectional or
bi-directional, for a specified number of seconds. If the
transmitted frame count does not match the number of frames
received by the other side, the transmit level is reduced. A
search is conducted to determine the maximum frame rate that
can be forwarded by the network with no loss. The search is
capped by the maximum data rate if it is specified by user,
otherwise will be based on the media maximum rate. During
Bi-directional symmetrical test or loopback mode if the frame is
dropped, regardless of the direction the test will be re-run at a
lower rate and the final result will be single throughput
value.On the otherhand, bi- directional asymmetrical test will
measure the throughput rate for each direction. The test
procedure is repeated for a number of legal frame length to
produce a table of maximum throughput versus frame length.
For better results, adjust the duration to load the device under
test sufficiently.
RFC 2544 Round-trip Latency Test
This test measures the latency experienced by a frame passing
and looping back through the network. A specially tagged frame
is sent and the time that this frame exits and loopbacks to the
FrameScope is recorded. Round trip latency is the difference
Agilent FrameScope Pro User’s Manual 57
Page 58

2 Network Testing with the FrameScope Pro
Performanc e Tests
between the entrance and exit times of the tagged frame. The
reported latency is an average of at least 20 trials. The test is
conducted over a range of frame sizes.
For better results, adjust the duration to load the device under
test sufficiently.
RFC 2544 Frame Loss Rate Test
This test measures the percentage of frames that are not
forwarded by network devices due to lack of resources for entire
range of frame length and data rates.
For a specific frame length, traffic is sent at the maximum rate
(100% load). The number of frames received is compared against
the number of frames transmitted and shown as a percentage of
frames forwarded by the network. The data rate is reduced by
step size of 10% (configurable) until two successive
measurements, without single frame loss or till 10% traffic
level(lowest step size) is reached.
The test is conducted over a range of frame lengths. The test can
be performed either in loopback or unidirectional or
bi-directional mode. Loopback mode is similar to bi-directional
test, the only difference is the destination is a loopback device
instead of another FrameScope.
For better results, adjust the duration to load the device under
test sufficiently.
RFC 2544 Back to Back Test
This test measures the maximum number of back to back
frames that the network can transfer without loss.
For a specific frame length, a burst of back to back frames is
sent to a destination device through the network. Similar to the
throughput test, a binary search of burst sizes is done to find
the maximum burst size that can be forwarded by the network
with no loss of frames. The trial length must be at least 2
seconds and the results of at least 50 trials should be averaged
for the displayed value. The test is conducted over a range of
frame lengths.
The test can be performed either in loopback or unidirectional
or bi-directional mode. Loopback mode is similar to
bi-directional test, the only difference is the destination is a
loopback device instead of another FrameScope.
For better results, adjust the duration to load the device under
test sufficiently.
58 Agilent F r ameSc ope P ro U ser ’s M anual
Page 59

Network Testing with the FrameScope Pro 2
Performance Tests
Setting the network for RFC 2544 Tests
You may also have to adjust the network settings to ensure the
test can run. In particular:
• NAT has to be disabled or should allow the IP and MAC
addresses of the FrameScope™ Pro to pass through.
• Firewalls have to be disabled or should allow the IP and MAC
addresses of the FrameScope™ Pro to pass through.
• ICMP ports need to be freed up for the network under test
(for information request and reply).
• UDP ports 7 (slave UDP port) and 7777 (master UDP port)
needs to be freed up for the network under test.
• During RFC2544 Test, the FrameScope
Pro has a default timeout duration
after a MAC reset. If the peer does not
respond within the stipulated time, the
RFC 2544 test will not start and will
result timeout. Different switches may
have different response time after a
MAC reset. Users should select a
suitable and appropriate timeout
period for the switches under test with
advise from their equipment supplier
or vendor.
Setting the master FrameScope for RFC 2544 Tests
To perform a RFC 2544 test, you will need two FrameScope or
FrameScope and loopback device, one as master and the other
as slave. For initial settings on the master unit, see “General
settings for the master FrameScope” on page 53 and then
continue with the steps below:
1 If the destination is a FrameScope, ensure that the slave
FrameScope is ready for RFC 2544 test. For slave
FrameScope settings, go to “Setting the slave FrameScope for
RFC 2544 Tests” on page 65.
Agilent FrameScope Pro User’s Manual 59
Page 60

2 Network Testing with the FrameScope Pro
Performanc e Tests
2 From the Performance Tests
menu, select RFC 2544 Test.
3 Select Throughput, Frame loss rate,
back-to-back and/or Latency RFC
2544 test options.
Press Suite to load or
create new test suite.
Select RFC 2544 test
options.
To set specific RFC test
parameters, press
Settings.
60 Agilent F r ameSc ope P ro U ser ’s M anual
Page 61

Network Testing with the FrameScope Pro 2
Performance Tests
4
Optional: If you want to save this RFC 2544 Test suite, or
retrieve a previously stored suite, press the Suite button.
Create New option: Select
this if you want to save a new
test suite. You will be
prompted to enter a new
name.
Load Selected option: Select
a stored suite from the list.
You can select <Default> if
you want to reload the default
suite.
5 The initial setting screen is common for all the RFC testing,
which allows user to enter destination device and password.
The screen is shown below “Slave Setup” on page 62.In the
RFC 2544 Test menu, the remote test device can be either
another FrameScope or any loopback device. If loopback
device is selected, user has two options:
Option 1: User can select IP layer loopback device, where he
needs to specify the IP address or name of the device.
Option 2: User can select MAC layer loopback device,where
mac address of the device needs to be entered.
Similarly for slave FrameScope also there are two options:
Option 1: If you do not know the IP address/name of the slave
FrameScope, select Search for FrameScope.
Agilent FrameScope Pro User’s Manual 61
Page 62

2 Network Testing with the FrameScope Pro
Performanc e Tests
Option 2: If you know the IP address/name, enter the
corresponding IP address/name.
6 For specific Throughput, Latency, Frame loss rate,
Back-to-Back test settings, press Next. For details on specific
parameters, go to corresponding sections on “The
Throughput Settings screen.” on page 63 “The Latency
Settings screen.” on page 63, “Frame loss rate settings
screen” on page 64, “Back to Back settings screen” on
page 64 respectively.
Slave
Setup
Or
Select FrameScope or Loopback
for the test
IP Address (or name) of
FrameScope or MAC address of
the Loopback, depending on the
selection
Password Entry
Timeout
62 Agilent F r ameSc ope P ro U ser ’s M anual
Page 63

The Throughput Settings
screen.
Select the frame
direction to measure.(if destination is
loopback only bidirectional options is
present)
Max Data Rate is used for initial
frame speed and performance
calculation. Enter the maximum
data rate of the netwo rk unde r tes t.
If not known, the link speed will be
used.
Network Testing with the FrameScope Pro 2
Performance Tests
Select to measure full range or
specify the upstream and
downstream rates.
Network connection speed
Specif y the frame l ength (mini mum
of 64 bytes to maximum of 1518
bytes) or select full range to collect
all frames of lengths 64, 128, 256,
512, 768, 1024, 1280, and 1518).
The Latency Settings
screen.
The Latency test automatically
uses values set for the
Throughput test.
If a frame length is set for the
throughput test, this cannot be
changed for the latency test.
Duration is the time taken (in
seconds) to transmit frames
that could be of different length,
at different rates.
For better results, adjust the
duration to loa d the dev ice
under test sufficiently.
Specif y the fr a m e le ng th or
select full range to collect all
frame lengths.
Specif y t he nu m b e r of
round-trips for the test.
For better results, adjust the
duration to load the device
under test sufficiently.
Specify the upstream and
downstream utilization rates
when performing the Latency
test.
Agilent FrameScope Pro User’s Manual 63
Page 64

2 Network Testing with the FrameScope Pro
Performanc e Tests
Frame loss rate settings
screen
Select the frame direction to
measure.(for loopback only bi
direction is present)
Max Data Rate is used for initial
frame speed and performance
calculation. Enter the maximum
data rate of the network under
test. If no t known, the link speed
will be used .
Back to Back
settings screen
Select full range to measure
frame loss rate specified by step
size or specific rate
Specify the frame length or
select full range to collect all
frames.
Duration is the time taken (in
seconds) to transmit frames
For better results, adjust the
duration to load the device
under test sufficiently.
Select the frame direction to
measure.(for loopback only
bidirectional is present)
Specify the frame length or
select full range to collect all
frames.
Duration is the time taken (in
seconds) to transmit burst
frames
For better results, adjust the
duration to load the device
under test sufficiently.
7 If a password is preset in the slave FrameScope, press the
Slave Password button on the master FrameScope to enter the
64 Agilent F r ameSc ope P ro U ser ’s M anual
Page 65

Network Testing with the FrameScope Pro 2
Performance Tests
password. You will get a warning, “Permission Denied”, if a
password is set in the slave FrameScope and not entered
correctly in the master FrameScope.
8 Press Start to begin test.
After pressing the Start button, the master FrameScope
starts the activation and synchronization procedures with
the target FrameScope by doing the following actions:
9 Search (if enabled) and check status of the slave FrameScope
10 Activate the slave FrameScope if in idle mode
11 Authenticate the master FrameScope if the password is
enabled
12 Set up the slave FrameScope parameters by synchronizing
the master and slave FrameScope for the test
13 Start test
14 Query test results at end of test
15 Stop test
If the target selected is loopback device, all the test setup is
done in the master device. There will be no authentication
synchronization setup.
Setting the slave FrameScope for RFC 2544 Tests
1 From the Network main menu, press
System.
Agilent FrameScope Pro User’s Manual 65
Page 66

2 Network Testing with the FrameScope Pro
Performanc e Tests
2 From the System Settings Network menu,
press RFC 2544 Test.
3 Select the Enable RFC 2544 Test option. You
may set a password in the slave
FrameScope to enable the master
FrameScope login. Press OK.
The slave FrameScope is now ready to
perform RFC 2544 tests. Do not run
other tests on the slave FrameScope
while RFC 2544 tests are in progress.
66 Agilent F r ameSc ope P ro U ser ’s M anual
Page 67

Network Testing with the FrameScope Pro 2
Performance Tests
.
These are the
screens of th e s l ave
FrameScope when
throughput (left)
and latency (right)
RFC 2544 tests are
running.
RFC 2544 Test Results
For full range frame length and frame rate throughput RFC 2544
tests, a graph can be plotted to display the RFC 2544 test
results. The graph helps analysis of performance between two
points in the network quickly and efficiently. These results can
then be saved to the compact flash card for further analysis.
Agilent FrameScope Pro User’s Manual 67
Page 68

2 Network Testing with the FrameScope Pro
Performanc e Tests
The IP address of the
FrameScope. If the name exists, it
will be displayed. (for MAC
Loopback, MAC address is
displayed)
Program Rate is the fram e ra t e
set by user.
Actual Rate is the real frame rate
during the test. The rate may
differ from Program Rate due to
delay or col lis io ns in the ne tw o rk .
The IP addres s of the
FrameSco pe. If the name exis ts, it
will be displayed. (for MAC
Loopback, MAC address is
displayed)
Upstream - frames sent
from / received by the
master FrameScope.
68 Agilent F r ameSc ope P ro U ser ’s M anual
Page 69

Network Testing with the FrameScope Pro 2
The IP address of the
FrameScope (for loopback
scenarios, MAC address). If the
name exists, it will be displayed.
The throughput/ latency test set,
according to frame size. Press the
left or right button to go to the
previous or next test set
respectively.
Performance Tests
Upstream - throughput
rates of fr ames sent
from master
FrameScope.
Downstream throughput rates of
frames sent from slave
FrameScope.
(For bidirectional,
single through put rates
for both direction will
be plotted.)
Max - maximum
theoretical frame rate.
Belo w f r a m e d irecti o n s
are frame throughput
rates in frames per
Click this to change the Y
axis in the chart
display.eg., display
changes in fps, bps,%
(only for throughput
results)
The minimum, average
and maximum delay of
frame obtain ed fro m an
average of multiple
measurements
depe n d in g o n the
number of iterations
set.
Agilent FrameScope Pro User’s Manual 69
Page 70
2 Network Testing with the FrameScope Pro
Performanc e Tests
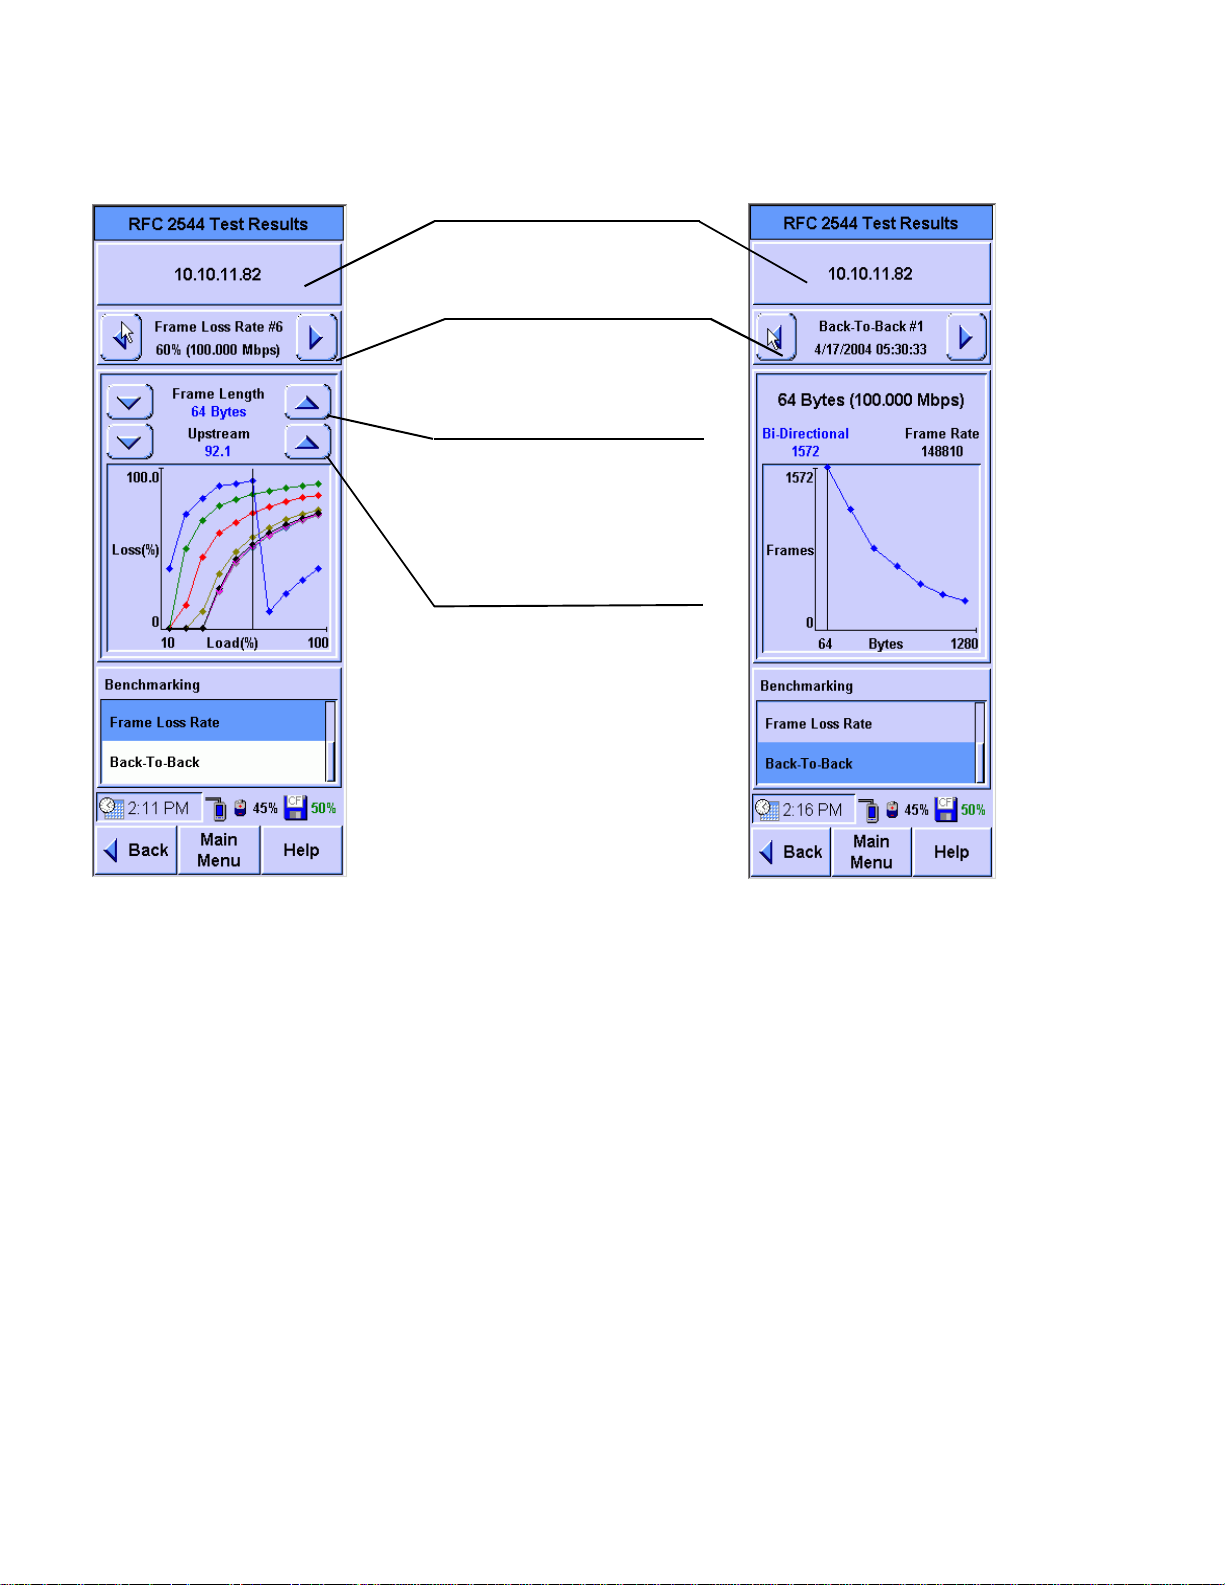
The IP address of the
FrameSco pe. If th e name exist s, it
will be dis played. (mac addr ess for
loopback)
Frame loss rate or back to back
tests. For Frameloss rate, load
percentage will be displayed
along with maximum data rate.
Used to display the result screen
for different frame length. The
graph can be traced easily from
the color of the frame length
display.
Select to browse between graphs
for upstream and downs tre am bidirectional test re su lts ( va li d on ly
for bi directional test
70 Agilent F r ameSc ope P ro U ser ’s M anual
Page 71

Network Testing with the FrameScope Pro 2
Performance Tests
Agilent FrameScope Pro User’s Manual 71
Page 72

2 Network Testing with the FrameScope Pro
Locating a Port with Blink Port
Locating a Port with Blink Port
You can use the FrameScope’s test port, located on the side, to
locate a network connection’s port on a hub or switch. The
FrameScope will toggle the port’s link indicator on and off
causing it to blink.
This section describes how to use the Blink Port feature of the
FrameScope Pro.
1 Connect the FrameScope to the remote end of the circuit
whose hub you want to locate. For example, connect the unit
at the network wall circuit.
2 Press the Tools button on the
main Network tab to display the
Tools menu.
72 Agilent F r ameSc ope P ro U ser ’s M anual
Page 73

Network Testing with the FrameScope Pro 2
Locating a Port with Blink Port
3
Press the Blink Port on the tools
menu to call the Blink Port screen.
4 To begin blinking the port, press the
Start button.
5 Observe the hub or switch and note
which port’s link indicator is
blinking. That will be the port for
the tested circuit.
6 To stop the blink, press the Stop
button on the Blink Port screen.
Agilent FrameScope Pro User’s Manual 73
Page 74

2 Network Testing with the FrameScope Pro
Viewing the Error Log
Viewing the Error Log
This section describes how to view the FrameScope’s error log.
The error log tracks and displays any network problems that are
detected by the FrameScope Pro.
1 From the main Network tab,
press the Tools button to display
the Tools menu.
74 Agilent F r ameSc ope P ro U ser ’s M anual
Page 75

Network Testing with the FrameScope Pro 2
2
Press the Error Log button to call
the Error Log screen. You can
also click on the shortcut, in the
Main Menu to get to this
screen.
3 Observe the errors listed in the
log.
4 Press the Show All button to
expand the error list and view
all errors that were previously
acknowledged by using the Ack
button.
5 Press the Ack button to
acknowledge the errors without
clearing the log.
6 Press the Reset button to clear
the log.
Viewing the Error Log
Or
Agilent FrameScope Pro User’s Manual 75
Page 76

2 Network Testing with the FrameScope Pro
WireMap Adapter Testing
WireMap Adapter Testing
WireMap testing checks for proper continuity and termination
of cables. It is used together with the WireMap Adapter .
The wiremap adapter is connected at the far end of a link or
channel to display and identify point-to-point four twisted pairs
connection.
WireMap Adapter
The four indicator LEDs flash while the test is
being perform and go off after the test is
completed.
Channel or LinkChannel or Link
The test identifies the following faults:
• Short circuit
• Open circuit
• Reversed pairs
• Crossed pairs
• Shield continuity faults
76 Agilent F r ameSc ope P ro U ser ’s M anual
Page 77

WireMap Adapter Operation
When the wiremap adapter is connected to the FrameScope, the
FrameScope sends a sequence of DC, TTL level signals through
the wire pairs in order of a few 100 milliseconds. For each step
of this sequence of signalling, the DC voltage is measured by the
receiver of the FrameScope. The FrameScope software
identifies wiremap information based on the readings.
LED Indicators
The wiremap adapter has four LEDs, each connected to a wire
pair. The wiremap adapter has four LEDs, each connected to a
wire pair. During the test, the LEDs flash. Once the test is
completed, the LEDs turn off.
Procedure for WireMap Testing
1 Connect the FrameScope and cable under test to the
WireMap Adapter.
Network Testing with the FrameScope Pro 2
WireMap Adapter Testing
2 From the Network Main Menu, press
Tools, then press WireMap.
3 Click Start Test.
Agilent FrameScope Pro User’s Manual 77
Page 78

2 Network Testing with the FrameScope Pro
WireMap Adapter Testing
The test will run for a few seconds before displaying the
results. If all tests pass, the results screen will display “Pass”,
similar to the screen below.
Pair number
Wire numbers
Otherwise, results will show “Fail” with details of error in
red.
78 Agilent F r ameSc ope P ro U ser ’s M anual
Page 79
Using the Test Database
Network Testing with the FrameScope Pro 2
Using the Test Databas e
The FrameScope Pro allows you to store (you must have a
CompactFlash™ card installed) Autotest and Performance Test
results for later review and downloading. See page 31 for saving
Autotest results, page 56 for saving loopback test results and
page 72 for RFC 2544 test results. You can recall previously
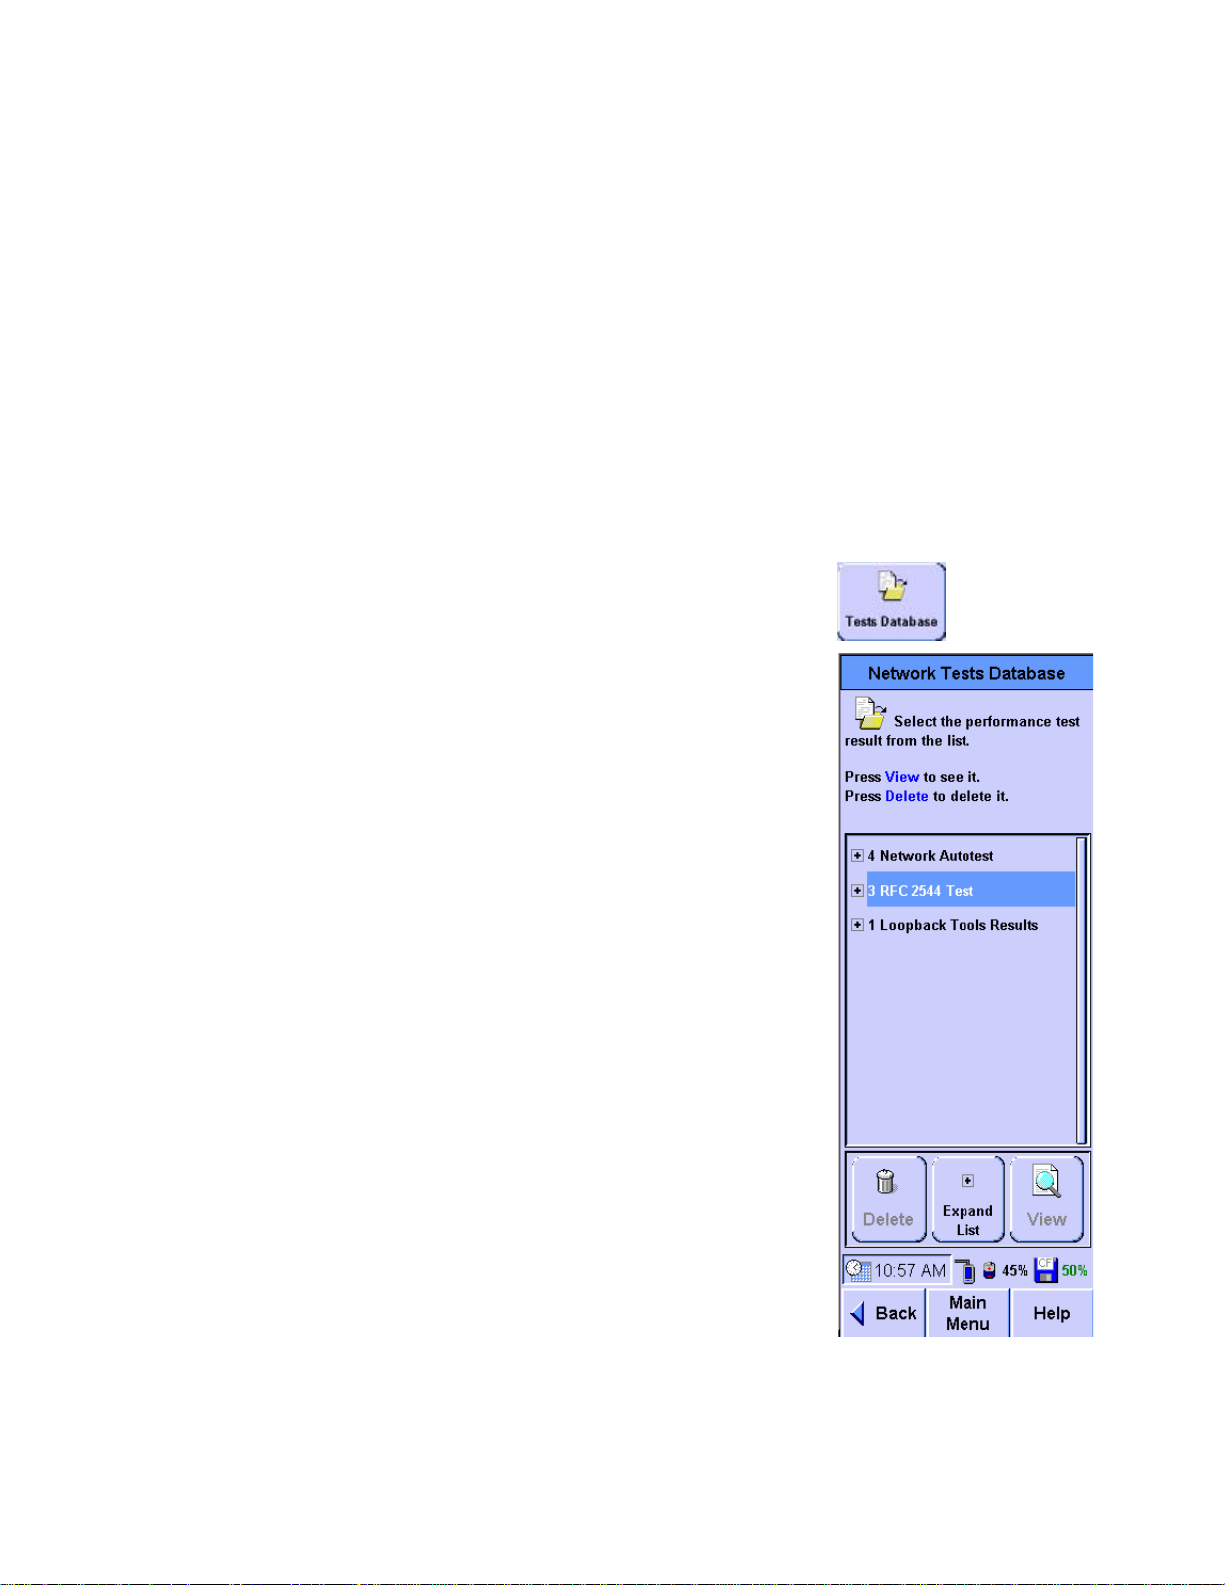
stored test data using the Tests Database tool.
This section describes how to recall and delete stored tests.
1 Press the Tools button to call the Tools menu.
2 On the Tools menu, press the Tests Database button.
Three folders appear in the
Network Test Database screen.
Network Autotest results are
stored in the Network Autotest
folder. RFC 2544 throughput and
latency test results are stored in
the RFC 2544 Test folder. IP and
MAC loopback test results are
stored in the Loopback Tools
Results folder.
The number before the folder
names indicates the number of
stored files in the folder.
3 Select the folder and press the +
sign, or the Expand List button.
4 Select the test results file, then
press the View button to display
the detailed test results.
5 To delete a stored test, select the
test results file and press the
Delete button.
Agilent FrameScope Pro User’s Manual 79
Page 80

2 Network Testing with the FrameScope Pro
Using the Network Database
Using the Network Database
The FrameScope Pro allows you to store (only on a
CompactFlash™) network topologies for later review and
downloading (see “Using the Stations List” on page 33). You can
recall previously stored network data using the Network
Database tool. This section describes how to recall and delete
stored network data.
1 Press the Tools button on the Network Main Menu to call the
Tools menu.
2 On the Tools menu, press the
Network Database button to call the
Network Database screen.
3 Network resources are displayed in
a list. Use the Scroll button or a
stylus to select the resource you
want.
NOTE
4 Use the Expand and Collapse
buttons to show the items under
the selected resource type.
5 When a network resource is
selected, press the View button to
view detailed information about
it.
The Expand, Collapse, and View buttons occupy the same spot on the
screen. The button changes depending on what you have selected in the
network list.
80 Agilent F r ameSc ope P ro U ser ’s M anual
Page 81

Network Testing with the FrameScope Pro 2
6
To access the Database Tools menu
press the Database Tools button.
Using the Network Database
Agilent FrameScope Pro User’s Manual 81
Page 82

2 Network Testing with the FrameScope Pro
Using the Network Database
7 To save the current network, or to
load previously stored network
data, press the Load/Save Station List
button.
8 Use the buttons on the Station List
name screen to store the current
network data, load stored data, or
delete stored data. If you are
storing data, you will be prompted
to enter a name for the data file.
82 Agilent F r ameSc ope P ro U ser ’s M anual
Page 83

Locating Switch P o rt s
Network Testing with the FrameScope Pro 2
Loc at ing Sw itch Po r t s
The FrameScope Pro allows you to identify the switch ports
being accessed by the FrameScope or any address on the
network.
The FrameScope will only locate switches in the same subnet.
Knowledge of the correct community string and port is
essential.
This section describes how to operate the Locate Switch Port
tool.
1 Press the Tools button to call the Tools menu.
2 On the Tools menu, press the
Locate Switch Port button to call the
Locate Switch Port screen.
3 Select the target, either this
FrameScope or enter the name or
address of the device you want to
locate.
4 The SNMP Settings button allows
you to add SNMP communities and
ports to the default “public”
community and default port 161
or to change those set up for auto
discovery.
Agilent FrameScope Pro User’s Manual 83
Page 84

2 Network Testing with the FrameScope Pro
Locating Switch Ports
5 Press Start to see the results of
the Locate Switch Port.
6 Use the Scroll button to scroll
through the list if necessary.
NOTE
The order of the information presented is
not useful and should not be used in
interpreting the list.
84 Agilent F r ameSc ope P ro U ser ’s M anual
Page 85

Agilent N262 0A FrameScop e 350 Network Per for m anc e An alyze r
User’s Manual
3
Voice Testing with the FrameS co pe Pro
Voice Testing Overview 86
How the FrameScope Pro Tests Voice Quality 87
Running a Voice Test 88
Interpreting Results 91
Network Settings 93
License Information 93
How to Save and Retrieve Results 94
The Agilent FrameScope Pro Voice Performance Analyzer is a
powerful handheld instrument that measures the performance
of voice over IP networks.
This chapter deals with voice testing.
Agilent Technologies
85
Page 86

3 Voice Testing with the FrameScope Pro
Voice Testing Overview
Voice Testing Overview
The Voice Quality Analysis software for the Frame Scope Pro,
gives you analysis options for voice-over-IP (VoIP) environments
that traditional tests do not. Including:
• Access, manage, and run Voice Quality Tests end-to-end across
widely deployed Voice networks.
• Test VoIP network components such as routers, gateways,
PBXs, and switches.
• Compare VoIP quality directly with existing toll quality
networks.
• Test VoIP systems to gather end-to-end voice quality
information.
• Augment other traditional telephony test suites such as
Transmission Impairment Measurement Set (TIMS).
• Measure fundamental voice quality metrics such as delay,
Jitter and Mean Opinion Score (MOS).
86 Agilent F r ameSc ope P ro U ser ’s M anual
Page 87

How the Fram eScope Pro Tests Voice Quality
To test voice quality and measure audio circuit characteristics,
the FrameScope Pro VoIP does two things:
• It places and/or answers one telephone call at a time to
establish voice connections. This voice connection (and the
transmission media and equipment of which it is comprised)
becomes the network under test. Think of the FrameScope Pro
VoIP as a telephone or other telephony device positioned at the
ends of voice circuits.
•
Once the FrameScope Pro VoIP has established at least one
telephone call, it transmits audio test packets onto that
circuit and measures how those packets are affected by
traveling through the network under test. The FrameScope
Pro VoIP can send test packets in one direction at a time
depending on how that circuit was established.
Voice Testing with the FrameScope Pro 3
How the FrameScope Pro Tests Voice Quality
Agilent FrameScope Pro User’s Manual 87
Page 88

3 Voice Testing with the FrameScope Pro
Running a Voice Test
Running a Voice Test
This section describes how to run an VoIP Test on the network
using the FrameScope Pro.
From Main Menu, VoIP button has to be pressed to enter the
VoIP Test mode. Once you do so, SIP Settings window will
appear with the configurable parameters.
The settings can be saved and retrieved through the Suite
window/button on the left hand top corner. For additional
settings, click on the Settings button (refer the image on the
next page for detailed description).
NOTE
88 Agilent F r ameSc ope P ro U ser ’s M anual
The user nam e fo r au the nti c ati on with t he S IP serv er may not be t he s a me
unique ID or phone number used for the SIP phone call or test.
Page 89

Codec to be used for data transfer:
G711mlaw or G711A law
If checked
FrameScope will auto
answer incoming call
Voice Testing with the FrameScope Pro 3
Running a Voice Test
Phone number that
FrameScope registers as its
own.
Headsets call for live audio.
The maximum allowed
time between session
refresh requests in a
dialog before the session
will be considered timed
out.
Minimum value that
can be set for the
session interval, this
value is called the
minimum timer
This has to be set to
the en tity (U AC, UAS
etc.) which initiates
reinvite.
Domain name for SIP
server (which requires
name instead of IP),
when DNS is not
pres en t in the
network.
This box, when checked, registers
with Registrars/SIP server.
Otherwise calls directly the IP
address specified in the SIP server
box in the SIP Setting window.
This box, when checked, allows
the end point to send or answer
reinvite and configure the
associated session interval,
min-SE interval and refresher.
Nickname for the mode/option as
determined by the user.
Drop down list allows selecting
different stack options.
Agilent FrameScope Pro User’s Manual 89
Page 90

3 Voice Testing with the FrameScope Pro
Running a Voice Test
When the Start button is
pressed in the SIP Setting
Window, The FrameScope Pro
registers with the registrar/ SIP
Server as per the options
selected by the user in the SIP
setting Window asks to do so,
before placing a call or sending
an Invite message.
Else, it calls directly to the IP
address specified in the SIP
Server window.
The SIP call is placed to the
Target Phone number with
either G711 a-LAW or G711
u-LAW as per user selection on
the Settings screen. After SIP
signaling is completed, data
flows across the network and the
measurement statistics appear
in the Test Result Display
Window. The user can save the
test results to the
CompactFlash
TM
using the Save Results button.
Once the test stops, the SIP signaling log can be seen when user
clicks on Details button. Graphical plots of the VoIP test results
with respect to time can also be viewed offline. For further
information on this topic refer to the section below.
90 Agilent F r ameSc ope P ro U ser ’s M anual
Page 91

Interpreting Results
Voice Testing with the FrameScope Pro 3
Interpreting Results
The statistics measured are
plotted in graphical format. The
graph is plotted offline with
timing info displayed as
iterations (the interval is 500
ms) in X-axis and R-Factor, MOS,
Packet Loss Ratio, Packet Round
Trip delay, Inter Arrival Jitter
values in Y-axis.
Each iterations shown is based
on the RTCP message exchange
during the VoIP test.
• The Inter-arrival jitter, Total
Packet Loss and Packet Loss
Ratio are based on the
received RTP packets. Round
trip delay is based on other
part RTCP packet
information,
• R-FACTOR, MOS are based on
Inter-arrival jitter, total
packet loss and packet loss
ratio and Round trip delay, if
the other part has no RTCP
packet sent, then the Round
Trip Delay will set to zero.
• Total Packets Sent are counts packets sent from the
FrameScope Pro which is displaying the results and not from
the other party.
• Total Packet Lost. This is based on "Cumulative Number of
Packets Lost" in RFC1889/3550.
• Packet Loss Ratio. This is based on "Fraction Lost" in RFC
1889/3550
• Total Packets DiscardedTotal Packets Discarded refers to the
number of packet dropped at the receiving side if there are
erros in RTP header information,
• Packet Discard Ratio.This refers to the interval Packet
Discard Ratio, which is the discarded packet ratio for each
RTCP interval.
Agilent FrameScope Pro User’s Manual 91
Page 92

3 Voice Testing with the FrameScope Pro
Interpreting Results
?
92 Agilent F r ameSc ope P ro U ser ’s M anual
Page 93

Network Settings
License Information
Voice Testing with the FrameScope Pro 3
Network Settings
The FrameScope Pro VoIP software can connect to the network
using Point-to-Point-Protocol Over Ethernet (PPPoE) or IP Over
Ethernet (IPoE). This setting is available in the Network
Settings screen, described in “Network Settings” on page 108.
This shows the features available
in the current version of the
software. When user selects this
from the Systems Menu and
clicks Edit , License Details will
be displayed with all the
available features. User can
enable new features by entering
a license key. To purchase a
license key, please contact your
Agilent salesperson.
Agilent FrameScope Pro User’s Manual 93
Page 94

3 Voice Testing with the FrameScope Pro
How to Save and Retrieve Results
How to Save and Retrieve Results
The FrameScope Pro VoIP test results are saved to the
CompactFlash
You can recall previously stored test data using the Tests
Database tool. This section describes how to recall and delete
stored tests. Press the Tools button to call the Tools menu. On
the Tools menu, press the Tests Database button.
FrameScope Pro VoIP test results are stored in the FrameScope
Tools Results folder. The number before the folder names
indicates the number of stored files in the folder.
Select the folder and press the + sign, or the Expand List
button.
Select the test results file, then press the View button to display
the detailed test results.
To delete a stored test, select the test results file and press the
Delete button.
The VoIP Test results can also be retrieved from the FrameScope
Pro when its web server is enabled. The results are available in
.CSV, HTML or JAVA format. (Please refer to “Remote Control”
on page 114).
TM
.
94 Agilent F r ameSc ope P ro U ser ’s M anual
Page 95

Agilent N262 0A FrameScop e 350 Network Per for m anc e An alyze r
User’s Manual
4
System Operations
The Status Display Area 96
The System Menu 97
System Information 98
License Details 99
Storage Setup 100
Batter y Status 101
Time and Date Setup 102
User Interface Setup 103
Boot Password 104
Touchscreen Calibration 105
Restore Default Settings 106
Network Settings 108
Restoring the Default MAC Address 113
Remote Control 114
SNMP Settings 121
Demo Mode 122
This chapter describes the various system operations of the
FrameScope Pro.
Agilent Technologies
95
Page 96

4 System Operations
The Status Display Area
The Status Display Area
The status display shows the current time set on the
FrameScope Pro, talkset status, battery status, and storage
status.
Clock Display
The clock shows the time of day. It can be set in the Time and
Date section of the System settings menu.
Network Connection Status
FrameScope icon: When in the Network tab, the
FrameScope icon appears. If a red X is shown on the
connection, it means the FrameScope is not connected
to the network.
Battery/Power Display
Ac Power icon: This icon appears when the ac power
adapter is connected to the FrameScope and an ac
power source. The number next to the icon is the
percent of full battery charge.
Battery Charge icon: When the FrameScope
operates using battery power, this icon shows the
current battery state. The percentage figure is the
amount of charge remaining in the battery.
Storage Status
Storage icon: The storage icon indicates the status of
CompactFlash™ and the percentage of store available in it.
= CompactFlash™ Card is installed. In the example,
the card is half full. A red X on the icon means that
the CompactFlash™ card is not installed.
96 Agilent F r ameSc ope P ro U ser ’s M anual
Page 97

The System Menu
System Operations 4
The System Menu
The FrameScope Pro System Menu
is displayed by pressing System in
Network Main Menu.
Agilent FrameScope Pro User’s Manual 97
Page 98

4 System Operations
System Information
System Information
Pressing System In formation then pressing View on either System
Settings menu displays the FrameScope serial number, software
and hardware revision numbers.
98 Agilent F r ameSc ope P ro U ser ’s M anual
Page 99

License Details
System Operations 4
License Details
NOTE
For the License De tail s of F rameS c ope Pr o wi th VoIP Opti on pl ea s e refer to
“License Information” on page93.
This shows the features available in
the current version of the software.
When user selects this and clicks
Edit , License Details will be
displayed with all the available
features. User can enable new
features by clicking the checkbox and
entering the corresponding license
key. For acquiring license key, please
contact the Technical Support Centre
Agilent FrameScope Pro User’s Manual 99
Page 100

4 System Operations
Storage Se tup
Storage Setup
This allows you to see the total capacity
and percentage of usage of
CompactFlash™ and internal flash.If the
user selects next and CompactFlash™ is
present in the system, the option to
format the CompactFlash™ pops up. User
can select YES to proceed with the
format or press cancel.
100 Agilent F r ameSc ope P ro U ser ’s M anual
 Loading...