

Page 1

Agilent Technologies 8935 Series E6380A
CDMA Cellular/PCS Base Station Test Set
Reference Guide
Firmware Version: B.03.10 and above
Agilent Part Number E6380-90019
Revision F
Printed in UK
January 2001
Page 2

Notice
Information contained in this document is subject to change without
notice.
All Rights Reserved. Reproduct i on, adaptation, or translation without
prior written permission is prohibited, except as allowed under the
copyright laws.
This material may be reproduced by or for the U.S. Government
pursuant to the Copyright License under the clause a t DFARS
52.227-7013 (APR 1988).
© Copyright 2001 Agilent Technologies
2
Page 3

Contents
1. General Information
Manufacturer's Declaration . . . . . . . . . . . . . . . . . . . . . . . . . . . . . . . . . . . . . . . . . . . . . . . . . . . . . . . 14
Lifting and Handling . . . . . . . . . . . . . . . . . . . . . . . . . . . . . . . . . . . . . . . . . . . . . . . . . . . . . . . . . . . 18
Consumables . . . . . . . . . . . . . . . . . . . . . . . . . . . . . . . . . . . . . . . . . . . . . . . . . . . . . . . . . . . . . . . . . 18
Product Markings . . . . . . . . . . . . . . . . . . . . . . . . . . . . . . . . . . . . . . . . . . . . . . . . . . . . . . . . . . . . . . . 19
Certification . . . . . . . . . . . . . . . . . . . . . . . . . . . . . . . . . . . . . . . . . . . . . . . . . . . . . . . . . . . . . . . . . . . 20
Agilent Technologies Warranty Statement for Commercial Products . . . . . . . . . . . . . . . . . . . . . 22
E6380A CDMA/Cellular PCS Base Station Test Set . . . . . . . . . . . . . . . . . . . . . . . . . . . . . . . . . . 22
Assistance . . . . . . . . . . . . . . . . . . . . . . . . . . . . . . . . . . . . . . . . . . . . . . . . . . . . . . . . . . . . . . . . . . . . . 24
Power Cables . . . . . . . . . . . . . . . . . . . . . . . . . . . . . . . . . . . . . . . . . . . . . . . . . . . . . . . . . . . . . . . . . . . 25
Product Description . . . . . . . . . . . . . . . . . . . . . . . . . . . . . . . . . . . . . . . . . . . . . . . . . . . . . . . . . . . . . 33
Documentation . . . . . . . . . . . . . . . . . . . . . . . . . . . . . . . . . . . . . . . . . . . . . . . . . . . . . . . . . . . . . . . . . 35
Conventions Used in This Manual . . . . . . . . . . . . . . . . . . . . . . . . . . . . . . . . . . . . . . . . . . . . . . . . 35
What is in This Manual . . . . . . . . . . . . . . . . . . . . . . . . . . . . . . . . . . . . . . . . . . . . . . . . . . . . . . . . 35
Which Document is Required? . . . . . . . . . . . . . . . . . . . . . . . . . . . . . . . . . . . . . . . . . . . . . . . . . . . 36
Trademark Acknowledgments . . . . . . . . . . . . . . . . . . . . . . . . . . . . . . . . . . . . . . . . . . . . . . . . . . . . . 37
2. Getting Started
Before Connecting a Radio . . . . . . . . . . . . . . . . . . . . . . . . . . . . . . . . . . . . . . . . . . . . . . . . . . . . . . . . 41
Changing the Test Set’s Display . . . . . . . . . . . . . . . . . . . . . . . . . . . . . . . . . . . . . . . . . . . . . . . . . . . 42
Changing the Measurement Screen . . . . . . . . . . . . . . . . . . . . . . . . . . . . . . . . . . . . . . . . . . . . . . . 42
Changing the Control Fields . . . . . . . . . . . . . . . . . . . . . . . . . . . . . . . . . . . . . . . . . . . . . . . . . . . . . 44
How do I Verify that the Test Set is Operating Properly? . . . . . . . . . . . . . . . . . . . . . . . . . . . . . . . 49
Instrument Quick Check . . . . . . . . . . . . . . . . . . . . . . . . . . . . . . . . . . . . . . . . . . . . . . . . . . . . . . . . 49
3. Operating Overview
Displaying CDMA Measurements . . . . . . . . . . . . . . . . . . . . . . . . . . . . . . . . . . . . . . . . . . . . . . . . . . 53
Channel Power, Adjacent Channel Power (ACP), Rho,
Error Vector Magnitude (EVM), Average Power . . . . . . . . . . . . . . . . . . . . . . . . . . . . . . . . . . . . . 53
Code Domain Measurements (Power, Fast Power, Power & Noise,
Complex Power, Phase, Timing, Fast Power Synchronization) . . . . . . . . . . . . . . . . . . . . . . . . . 54
I/Q Diagram . . . . . . . . . . . . . . . . . . . . . . . . . . . . . . . . . . . . . . . . . . . . . . . . . . . . . . . . . . . . . . . . . . 55
Displaying Analog Measurements . . . . . . . . . . . . . . . . . . . . . . . . . . . . . . . . . . . . . . . . . . . . . . . . . . 56
RF Measurements . . . . . . . . . . . . . . . . . . . . . . . . . . . . . . . . . . . . . . . . . . . . . . . . . . . . . . . . . . . . . 56
Displaying AF Measurements . . . . . . . . . . . . . . . . . . . . . . . . . . . . . . . . . . . . . . . . . . . . . . . . . . . 57
Displaying Measurement Results on a Meter Scale . . . . . . . . . . . . . . . . . . . . . . . . . . . . . . . . . . . . 59
To display the meter scale . . . . . . . . . . . . . . . . . . . . . . . . . . . . . . . . . . . . . . . . . . . . . . . . . . . . . . 59
To set the meter’s end points and scale intervals . . . . . . . . . . . . . . . . . . . . . . . . . . . . . . . . . . . . 59
Using Channel Numbers to Set Analyzer and Generator Frequencies . . . . . . . . . . . . . . . . . . . . . 60
Calibrating the Channel Power Measurement – CDMA Analyzer . . . . . . . . . . . . . . . . . . . . . . . . 61
Calibrating the Channel Power Measurement – Code Domain . . . . . . . . . . . . . . . . . . . . . . . . . . . 62
Calibrating the Adjacent Channel Power (ACP) Measurement . . . . . . . . . . . . . . . . . . . . . . . . . . 63
Changing the Increment or Decrement Setting . . . . . . . . . . . . . . . . . . . . . . . . . . . . . . . . . . . . . . . 64
Specifying An Increment Value for the Arrow Keys or Knob . . . . . . . . . . . . . . . . . . . . . . . . . . . 64
Using the Factor of 10 Increment/Decrement Keys . . . . . . . . . . . . . . . . . . . . . . . . . . . . . . . . . . 64
Using Measurement Limit Indicators . . . . . . . . . . . . . . . . . . . . . . . . . . . . . . . . . . . . . . . . . . . . . . . 65
To set high and low limits . . . . . . . . . . . . . . . . . . . . . . . . . . . . . . . . . . . . . . . . . . . . . . . . . . . . . . . 65
To reset or remove limits . . . . . . . . . . . . . . . . . . . . . . . . . . . . . . . . . . . . . . . . . . . . . . . . . . . . . . . 65
3
Page 4

Contents
To remove a limit . . . . . . . . . . . . . . . . . . . . . . . . . . . . . . . . . . . . . . . . . . . . . . . . . . . . . . . . . . . . . 66
Setting A Measurement Reference . . . . . . . . . . . . . . . . . . . . . . . . . . . . . . . . . . . . . . . . . . . . . . . . . .67
To set a reference . . . . . . . . . . . . . . . . . . . . . . . . . . . . . . . . . . . . . . . . . . . . . . . . . . . . . . . . . . . . . 67
Averaging Measurements . . . . . . . . . . . . . . . . . . . . . . . . . . . . . . . . . . . . . . . . . . . . . . . . . . . . . . . . . 68
To use measurement averaging . . . . . . . . . . . . . . . . . . . . . . . . . . . . . . . . . . . . . . . . . . . . . . . . . . 68
How the Test Set Averages Measurements . . . . . . . . . . . . . . . . . . . . . . . . . . . . . . . . . . . . . . . . 68
Setting an RF Generator/Analyzer Offset . . . . . . . . . . . . . . . . . . . . . . . . . . . . . . . . . . . . . . . . . . . .69
To set an RF Offset . . . . . . . . . . . . . . . . . . . . . . . . . . . . . . . . . . . . . . . . . . . . . . . . . . . . . . . . . . . . 69
Saving and Recalling Instrument Setups . . . . . . . . . . . . . . . . . . . . . . . . . . . . . . . . . . . . . . . . . . . . .70
To save an instrument setup . . . . . . . . . . . . . . . . . . . . . . . . . . . . . . . . . . . . . . . . . . . . . . . . . . . . 70
To recall an instrument setup . . . . . . . . . . . . . . . . . . . . . . . . . . . . . . . . . . . . . . . . . . . . . . . . . . . 70
To remove (clear) an individual save register . . . . . . . . . . . . . . . . . . . . . . . . . . . . . . . . . . . . . . . 71
To clear all save registers . . . . . . . . . . . . . . . . . . . . . . . . . . . . . . . . . . . . . . . . . . . . . . . . . . . . . . . 71
Register Names . . . . . . . . . . . . . . . . . . . . . . . . . . . . . . . . . . . . . . . . . . . . . . . . . . . . . . . . . . . . . . . 71
Memory Considerations . . . . . . . . . . . . . . . . . . . . . . . . . . . . . . . . . . . . . . . . . . . . . . . . . . . . . . . . 72
Instrument Hardware Changes . . . . . . . . . . . . . . . . . . . . . . . . . . . . . . . . . . . . . . . . . . . . . . . . . . 72
Using USER Keys . . . . . . . . . . . . . . . . . . . . . . . . . . . . . . . . . . . . . . . . . . . . . . . . . . . . . . . . . . . . . . .73
Using Pre-Defined USER Keys . . . . . . . . . . . . . . . . . . . . . . . . . . . . . . . . . . . . . . . . . . . . . . . . . . 73
Assigning and Releasing USER Keys . . . . . . . . . . . . . . . . . . . . . . . . . . . . . . . . . . . . . . . . . . . . . 74
Replacing Batteries . . . . . . . . . . . . . . . . . . . . . . . . . . . . . . . . . . . . . . . . . . . . . . . . . . . . . . . . . . . . . .75
4. Overview of the Test Set’s
Built-In Tools
Using the RF Tools Program . . . . . . . . . . . . . . . . . . . . . . . . . . . . . . . . . . . . . . . . . . . . . . . . . . . . . . .79
Loading and Running RF Tools . . . . . . . . . . . . . . . . . . . . . . . . . . . . . . . . . . . . . . . . . . . . . . . . . . 80
Test Results/BTS Utility Setup . . . . . . . . . . . . . . . . . . . . . . . . . . . . . . . . . . . . . . . . . . . . . . . . . . 81
Swept Gain . . . . . . . . . . . . . . . . . . . . . . . . . . . . . . . . . . . . . . . . . . . . . . . . . . . . . . . . . . . . . . . . . . 83
Discrete Frequency Insertion Loss . . . . . . . . . . . . . . . . . . . . . . . . . . . . . . . . . . . . . . . . . . . . . . . 87
Swept Insertion Loss . . . . . . . . . . . . . . . . . . . . . . . . . . . . . . . . . . . . . . . . . . . . . . . . . . . . . . . . . . 89
Swept Return Loss . . . . . . . . . . . . . . . . . . . . . . . . . . . . . . . . . . . . . . . . . . . . . . . . . . . . . . . . . . . . 92
Cable Fault . . . . . . . . . . . . . . . . . . . . . . . . . . . . . . . . . . . . . . . . . . . . . . . . . . . . . . . . . . . . . . . . . . 97
Replot Data Files . . . . . . . . . . . . . . . . . . . . . . . . . . . . . . . . . . . . . . . . . . . . . . . . . . . . . . . . . . . . 102
Transfer Stored Data . . . . . . . . . . . . . . . . . . . . . . . . . . . . . . . . . . . . . . . . . . . . . . . . . . . . . . . . . 104
SA (Spectrum Analyzer) Self Calibration ON/OFF . . . . . . . . . . . . . . . . . . . . . . . . . . . . . . . . . 105
Catalog PC (Memory) Card . . . . . . . . . . . . . . . . . . . . . . . . . . . . . . . . . . . . . . . . . . . . . . . . . . . . 106
Using the Code Domain Analyzer . . . . . . . . . . . . . . . . . . . . . . . . . . . . . . . . . . . . . . . . . . . . . . . . . .108
Selecting the Code Domain Analyzer’s Controls Menus . . . . . . . . . . . . . . . . . . . . . . . . . . . . . 108
Using the Spectrum Analyzer . . . . . . . . . . . . . . . . . . . . . . . . . . . . . . . . . . . . . . . . . . . . . . . . . . . . .111
Automatic Calibration . . . . . . . . . . . . . . . . . . . . . . . . . . . . . . . . . . . . . . . . . . . . . . . . . . . . . . . . 111
Setting Resolution Bandwidth and Sweep Rate . . . . . . . . . . . . . . . . . . . . . . . . . . . . . . . . . . . . 111
Selecting the Spectrum Analyzer’s Controls Menus . . . . . . . . . . . . . . . . . . . . . . . . . . . . . . . . . 112
Using the Spectrum Analyzer’s Delta Markers . . . . . . . . . . . . . . . . . . . . . . . . . . . . . . . . . . . . 113
Using the Spectrum Analyzer Mask . . . . . . . . . . . . . . . . . . . . . . . . . . . . . . . . . . . . . . . . . . . . . 115
Using the Voltmeter and Audio Frequency Counter . . . . . . . . . . . . . . . . . . . . . . . . . . . . . . . . . . .118
Using the Oscilloscope (Scope) . . . . . . . . . . . . . . . . . . . . . . . . . . . . . . . . . . . . . . . . . . . . . . . . . . . .119
Selecting the Oscilloscope’s Input . . . . . . . . . . . . . . . . . . . . . . . . . . . . . . . . . . . . . . . . . . . . . . . 120
Selecting the Oscilloscope’s Filters . . . . . . . . . . . . . . . . . . . . . . . . . . . . . . . . . . . . . . . . . . . . . . 121
Triggering the Oscilloscope . . . . . . . . . . . . . . . . . . . . . . . . . . . . . . . . . . . . . . . . . . . . . . . . . . . . 121
Using the Oscilloscope’s Marker . . . . . . . . . . . . . . . . . . . . . . . . . . . . . . . . . . . . . . . . . . . . . . . . 121
4
Page 5

Contents
Using IB_UTIL Programs . . . . . . . . . . . . . . . . . . . . . . . . . . . . . . . . . . . . . . . . . . . . . . . . . . . . . . . 122
COPY_PL . . . . . . . . . . . . . . . . . . . . . . . . . . . . . . . . . . . . . . . . . . . . . . . . . . . . . . . . . . . . . . . . . . . 122
FILE_XFER . . . . . . . . . . . . . . . . . . . . . . . . . . . . . . . . . . . . . . . . . . . . . . . . . . . . . . . . . . . . . . . . . 122
RAM_USAGE . . . . . . . . . . . . . . . . . . . . . . . . . . . . . . . . . . . . . . . . . . . . . . . . . . . . . . . . . . . . . . . 122
Securing a Test Procedure . . . . . . . . . . . . . . . . . . . . . . . . . . . . . . . . . . . . . . . . . . . . . . . . . . . . . . . 123
Clearing RAM . . . . . . . . . . . . . . . . . . . . . . . . . . . . . . . . . . . . . . . . . . . . . . . . . . . . . . . . . . . . . . . . . 124
Using the LISTOPTS (list options) Program . . . . . . . . . . . . . . . . . . . . . . . . . . . . . . . . . . . . . . . . 125
Using the DEMO Program . . . . . . . . . . . . . . . . . . . . . . . . . . . . . . . . . . . . . . . . . . . . . . . . . . . . . . . 126
Using the ST_PLT (store or plot) Program . . . . . . . . . . . . . . . . . . . . . . . . . . . . . . . . . . . . . . . . . . 127
5. CDMA Measurements - Screens
and Control Fields
CDMA Measurements . . . . . . . . . . . . . . . . . . . . . . . . . . . . . . . . . . . . . . . . . . . . . . . . . . . . . . . . . . 131
Average Power Measurements . . . . . . . . . . . . . . . . . . . . . . . . . . . . . . . . . . . . . . . . . . . . . . . . . . 131
Adjacent Channel Power Measurements . . . . . . . . . . . . . . . . . . . . . . . . . . . . . . . . . . . . . . . . . . 132
Channel Power Measurements . . . . . . . . . . . . . . . . . . . . . . . . . . . . . . . . . . . . . . . . . . . . . . . . . . 132
Rho Measurements . . . . . . . . . . . . . . . . . . . . . . . . . . . . . . . . . . . . . . . . . . . . . . . . . . . . . . . . . . . 133
Error Vector Magnitude (EVM) Measurements . . . . . . . . . . . . . . . . . . . . . . . . . . . . . . . . . . . . 138
Code Domain Measurements – IS-95 . . . . . . . . . . . . . . . . . . . . . . . . . . . . . . . . . . . . . . . . . . . . . 139
Code Domain Measurements – IS-2000 . . . . . . . . . . . . . . . . . . . . . . . . . . . . . . . . . . . . . . . . . . . 142
IQ Constellation Diagram, IS-2000 only . . . . . . . . . . . . . . . . . . . . . . . . . . . . . . . . . . . . . . . . . . 149
PN Offset Search . . . . . . . . . . . . . . . . . . . . . . . . . . . . . . . . . . . . . . . . . . . . . . . . . . . . . . . . . . . . . 149
Control Fields for CDMA Measurements . . . . . . . . . . . . . . . . . . . . . . . . . . . . . . . . . . . . . . . . . . . 150
# of Frames . . . . . . . . . . . . . . . . . . . . . . . . . . . . . . . . . . . . . . . . . . . . . . . . . . . . . . . . . . . . . . . . . 150
ACP Cal . . . . . . . . . . . . . . . . . . . . . . . . . . . . . . . . . . . . . . . . . . . . . . . . . . . . . . . . . . . . . . . . . . . . 150
ACP Fltr BW . . . . . . . . . . . . . . . . . . . . . . . . . . . . . . . . . . . . . . . . . . . . . . . . . . . . . . . . . . . . . . . . 150
ACP Offset . . . . . . . . . . . . . . . . . . . . . . . . . . . . . . . . . . . . . . . . . . . . . . . . . . . . . . . . . . . . . . . . . . 151
ADCfs or ADC FS . . . . . . . . . . . . . . . . . . . . . . . . . . . . . . . . . . . . . . . . . . . . . . . . . . . . . . . . . . . . 151
Amplitude . . . . . . . . . . . . . . . . . . . . . . . . . . . . . . . . . . . . . . . . . . . . . . . . . . . . . . . . . . . . . . . . . . 151
Analyzer (CDMA analyzer) . . . . . . . . . . . . . . . . . . . . . . . . . . . . . . . . . . . . . . . . . . . . . . . . . . . . . 152
Analyzer (code domain analyzer) . . . . . . . . . . . . . . . . . . . . . . . . . . . . . . . . . . . . . . . . . . . . . . . . 152
Anl Dir . . . . . . . . . . . . . . . . . . . . . . . . . . . . . . . . . . . . . . . . . . . . . . . . . . . . . . . . . . . . . . . . . . . . . 152
Anl Special . . . . . . . . . . . . . . . . . . . . . . . . . . . . . . . . . . . . . . . . . . . . . . . . . . . . . . . . . . . . . . . . . . 153
Auto Zero . . . . . . . . . . . . . . . . . . . . . . . . . . . . . . . . . . . . . . . . . . . . . . . . . . . . . . . . . . . . . . . . . . . 153
Carrier FT or Carrier Feedthru . . . . . . . . . . . . . . . . . . . . . . . . . . . . . . . . . . . . . . . . . . . . . . . . . 153
Chan Num . . . . . . . . . . . . . . . . . . . . . . . . . . . . . . . . . . . . . . . . . . . . . . . . . . . . . . . . . . . . . . . . . . 153
Chan Size . . . . . . . . . . . . . . . . . . . . . . . . . . . . . . . . . . . . . . . . . . . . . . . . . . . . . . . . . . . . . . . . . . . 154
CD pwr unit . . . . . . . . . . . . . . . . . . . . . . . . . . . . . . . . . . . . . . . . . . . . . . . . . . . . . . . . . . . . . . . . . 154
Chn Pwr Cal . . . . . . . . . . . . . . . . . . . . . . . . . . . . . . . . . . . . . . . . . . . . . . . . . . . . . . . . . . . . . . . . 154
Controls . . . . . . . . . . . . . . . . . . . . . . . . . . . . . . . . . . . . . . . . . . . . . . . . . . . . . . . . . . . . . . . . . . . . 155
CW RF Path . . . . . . . . . . . . . . . . . . . . . . . . . . . . . . . . . . . . . . . . . . . . . . . . . . . . . . . . . . . . . . . . . 155
Data Rate . . . . . . . . . . . . . . . . . . . . . . . . . . . . . . . . . . . . . . . . . . . . . . . . . . . . . . . . . . . . . . . . . . . 156
Data Source . . . . . . . . . . . . . . . . . . . . . . . . . . . . . . . . . . . . . . . . . . . . . . . . . . . . . . . . . . . . . . . . . 157
Even Sec In . . . . . . . . . . . . . . . . . . . . . . . . . . . . . . . . . . . . . . . . . . . . . . . . . . . . . . . . . . . . . . . . . 158
Find PN . . . . . . . . . . . . . . . . . . . . . . . . . . . . . . . . . . . . . . . . . . . . . . . . . . . . . . . . . . . . . . . . . . . . 158
Freq Err . . . . . . . . . . . . . . . . . . . . . . . . . . . . . . . . . . . . . . . . . . . . . . . . . . . . . . . . . . . . . . . . . . . . 158
Gain . . . . . . . . . . . . . . . . . . . . . . . . . . . . . . . . . . . . . . . . . . . . . . . . . . . . . . . . . . . . . . . . . . . . . . . 159
Gen Dir . . . . . . . . . . . . . . . . . . . . . . . . . . . . . . . . . . . . . . . . . . . . . . . . . . . . . . . . . . . . . . . . . . . . . 159
Gen Mode . . . . . . . . . . . . . . . . . . . . . . . . . . . . . . . . . . . . . . . . . . . . . . . . . . . . . . . . . . . . . . . . . . . 160
5
Page 6

Contents
Gen Special . . . . . . . . . . . . . . . . . . . . . . . . . . . . . . . . . . . . . . . . . . . . . . . . . . . . . . . . . . . . . . . . . 160
Input Atten . . . . . . . . . . . . . . . . . . . . . . . . . . . . . . . . . . . . . . . . . . . . . . . . . . . . . . . . . . . . . . . . . 161
Input Port . . . . . . . . . . . . . . . . . . . . . . . . . . . . . . . . . . . . . . . . . . . . . . . . . . . . . . . . . . . . . . . . . . 161
Lvl . . . . . . . . . . . . . . . . . . . . . . . . . . . . . . . . . . . . . . . . . . . . . . . . . . . . . . . . . . . . . . . . . . . . . . . . 161
I Power Level . . . . . . . . . . . . . . . . . . . . . . . . . . . . . . . . . . . . . . . . . . . . . . . . . . . . . . . . . . . . . . . 162
Marker Lvl . . . . . . . . . . . . . . . . . . . . . . . . . . . . . . . . . . . . . . . . . . . . . . . . . . . . . . . . . . . . . . . . . 162
Marker Pos . . . . . . . . . . . . . . . . . . . . . . . . . . . . . . . . . . . . . . . . . . . . . . . . . . . . . . . . . . . . . . . . . 162
Meas Intvl or Meas Int . . . . . . . . . . . . . . . . . . . . . . . . . . . . . . . . . . . . . . . . . . . . . . . . . . . . . . . . 162
Meas Order . . . . . . . . . . . . . . . . . . . . . . . . . . . . . . . . . . . . . . . . . . . . . . . . . . . . . . . . . . . . . . . . . 163
Measurement . . . . . . . . . . . . . . . . . . . . . . . . . . . . . . . . . . . . . . . . . . . . . . . . . . . . . . . . . . . . . . . 163
Num Avgs . . . . . . . . . . . . . . . . . . . . . . . . . . . . . . . . . . . . . . . . . . . . . . . . . . . . . . . . . . . . . . . . . . 163
Ofs Trnsfer . . . . . . . . . . . . . . . . . . . . . . . . . . . . . . . . . . . . . . . . . . . . . . . . . . . . . . . . . . . . . . . . . 164
Output Port . . . . . . . . . . . . . . . . . . . . . . . . . . . . . . . . . . . . . . . . . . . . . . . . . . . . . . . . . . . . . . . . . 164
Phase/div . . . . . . . . . . . . . . . . . . . . . . . . . . . . . . . . . . . . . . . . . . . . . . . . . . . . . . . . . . . . . . . . . . . 164
Phse . . . . . . . . . . . . . . . . . . . . . . . . . . . . . . . . . . . . . . . . . . . . . . . . . . . . . . . . . . . . . . . . . . . . . . . 165
PN Incrment . . . . . . . . . . . . . . . . . . . . . . . . . . . . . . . . . . . . . . . . . . . . . . . . . . . . . . . . . . . . . . . . 165
PN Offset . . . . . . . . . . . . . . . . . . . . . . . . . . . . . . . . . . . . . . . . . . . . . . . . . . . . . . . . . . . . . . . . . . . 165
PN Offset or PN Ofs . . . . . . . . . . . . . . . . . . . . . . . . . . . . . . . . . . . . . . . . . . . . . . . . . . . . . . . . . . 166
Pwr Gain . . . . . . . . . . . . . . . . . . . . . . . . . . . . . . . . . . . . . . . . . . . . . . . . . . . . . . . . . . . . . . . . . . . 166
Pwr Intvl . . . . . . . . . . . . . . . . . . . . . . . . . . . . . . . . . . . . . . . . . . . . . . . . . . . . . . . . . . . . . . . . . . . 167
Pwr Ref . . . . . . . . . . . . . . . . . . . . . . . . . . . . . . . . . . . . . . . . . . . . . . . . . . . . . . . . . . . . . . . . . . . . 167
Pwr Scale – IS-95 . . . . . . . . . . . . . . . . . . . . . . . . . . . . . . . . . . . . . . . . . . . . . . . . . . . . . . . . . . . . 167
Pwr Scale – IS-2000 . . . . . . . . . . . . . . . . . . . . . . . . . . . . . . . . . . . . . . . . . . . . . . . . . . . . . . . . . . 167
Pwr Zero . . . . . . . . . . . . . . . . . . . . . . . . . . . . . . . . . . . . . . . . . . . . . . . . . . . . . . . . . . . . . . . . . . . 168
Q Power Level . . . . . . . . . . . . . . . . . . . . . . . . . . . . . . . . . . . . . . . . . . . . . . . . . . . . . . . . . . . . . . . 168
Qual Event . . . . . . . . . . . . . . . . . . . . . . . . . . . . . . . . . . . . . . . . . . . . . . . . . . . . . . . . . . . . . . . . . 168
Rate RC-3 . . . . . . . . . . . . . . . . . . . . . . . . . . . . . . . . . . . . . . . . . . . . . . . . . . . . . . . . . . . . . . . . . . 169
Rate RC-4 . . . . . . . . . . . . . . . . . . . . . . . . . . . . . . . . . . . . . . . . . . . . . . . . . . . . . . . . . . . . . . . . . . 169
Rate RC-5 . . . . . . . . . . . . . . . . . . . . . . . . . . . . . . . . . . . . . . . . . . . . . . . . . . . . . . . . . . . . . . . . . . 169
RF Channel . . . . . . . . . . . . . . . . . . . . . . . . . . . . . . . . . . . . . . . . . . . . . . . . . . . . . . . . . . . . . . . . . 170
RF Gen Freq . . . . . . . . . . . . . . . . . . . . . . . . . . . . . . . . . . . . . . . . . . . . . . . . . . . . . . . . . . . . . . . . 170
RF In/Ant . . . . . . . . . . . . . . . . . . . . . . . . . . . . . . . . . . . . . . . . . . . . . . . . . . . . . . . . . . . . . . . . . . 170
Sprd Fact (Spread Factor) . . . . . . . . . . . . . . . . . . . . . . . . . . . . . . . . . . . . . . . . . . . . . . . . . . . . . 171
Start Frame . . . . . . . . . . . . . . . . . . . . . . . . . . . . . . . . . . . . . . . . . . . . . . . . . . . . . . . . . . . . . . . . . 171
Threshold . . . . . . . . . . . . . . . . . . . . . . . . . . . . . . . . . . . . . . . . . . . . . . . . . . . . . . . . . . . . . . . . . . 171
Time . . . . . . . . . . . . . . . . . . . . . . . . . . . . . . . . . . . . . . . . . . . . . . . . . . . . . . . . . . . . . . . . . . . . . . . 172
Time/div . . . . . . . . . . . . . . . . . . . . . . . . . . . . . . . . . . . . . . . . . . . . . . . . . . . . . . . . . . . . . . . . . . . . 172
Time Offset . . . . . . . . . . . . . . . . . . . . . . . . . . . . . . . . . . . . . . . . . . . . . . . . . . . . . . . . . . . . . . . . . 173
Time Ofs . . . . . . . . . . . . . . . . . . . . . . . . . . . . . . . . . . . . . . . . . . . . . . . . . . . . . . . . . . . . . . . . . . . 173
Trig Event . . . . . . . . . . . . . . . . . . . . . . . . . . . . . . . . . . . . . . . . . . . . . . . . . . . . . . . . . . . . . . . . . . 174
Tune Freq . . . . . . . . . . . . . . . . . . . . . . . . . . . . . . . . . . . . . . . . . . . . . . . . . . . . . . . . . . . . . . . . . . 174
Walsh Chan . . . . . . . . . . . . . . . . . . . . . . . . . . . . . . . . . . . . . . . . . . . . . . . . . . . . . . . . . . . . . . . . . 175
Walsh Order . . . . . . . . . . . . . . . . . . . . . . . . . . . . . . . . . . . . . . . . . . . . . . . . . . . . . . . . . . . . . . . . 175
6. Analog Measurements - Screens and Control Fields
Analog Measurements . . . . . . . . . . . . . . . . . . . . . . . . . . . . . . . . . . . . . . . . . . . . . . . . . . . . . . . . . . . 179
AC Control . . . . . . . . . . . . . . . . . . . . . . . . . . . . . . . . . . . . . . . . . . . . . . . . . . . . . . . . . . . . . . . . . 179
AM Depth Measurement . . . . . . . . . . . . . . . . . . . . . . . . . . . . . . . . . . . . . . . . . . . . . . . . . . . . . . 179
AF Freq Measurement . . . . . . . . . . . . . . . . . . . . . . . . . . . . . . . . . . . . . . . . . . . . . . . . . . . . . . . . 180
6
Page 7

Contents
DC Level Measurement . . . . . . . . . . . . . . . . . . . . . . . . . . . . . . . . . . . . . . . . . . . . . . . . . . . . . . . 180
Distn (Distortion) Measurement . . . . . . . . . . . . . . . . . . . . . . . . . . . . . . . . . . . . . . . . . . . . . . . . 181
FM Deviation Measurement . . . . . . . . . . . . . . . . . . . . . . . . . . . . . . . . . . . . . . . . . . . . . . . . . . . . 181
Frequency Measurement . . . . . . . . . . . . . . . . . . . . . . . . . . . . . . . . . . . . . . . . . . . . . . . . . . . . . . 182
Frequency Error Measurement . . . . . . . . . . . . . . . . . . . . . . . . . . . . . . . . . . . . . . . . . . . . . . . . . 182
TX Power Measurement . . . . . . . . . . . . . . . . . . . . . . . . . . . . . . . . . . . . . . . . . . . . . . . . . . . . . . . 183
FM Deviation Measurement . . . . . . . . . . . . . . . . . . . . . . . . . . . . . . . . . . . . . . . . . . . . . . . . . . . . 183
SINAD Measurement . . . . . . . . . . . . . . . . . . . . . . . . . . . . . . . . . . . . . . . . . . . . . . . . . . . . . . . . . 184
SNR Measurement . . . . . . . . . . . . . . . . . . . . . . . . . . . . . . . . . . . . . . . . . . . . . . . . . . . . . . . . . . . 184
Control Fields for Analog Measurements . . . . . . . . . . . . . . . . . . . . . . . . . . . . . . . . . . . . . . . . . . . 185
#Pts . . . . . . . . . . . . . . . . . . . . . . . . . . . . . . . . . . . . . . . . . . . . . . . . . . . . . . . . . . . . . . . . . . . . . . . 185
AF Anl In . . . . . . . . . . . . . . . . . . . . . . . . . . . . . . . . . . . . . . . . . . . . . . . . . . . . . . . . . . . . . . . . . . . 185
AF Cnt Gate . . . . . . . . . . . . . . . . . . . . . . . . . . . . . . . . . . . . . . . . . . . . . . . . . . . . . . . . . . . . . . . . . 186
AFGen1 Freq . . . . . . . . . . . . . . . . . . . . . . . . . . . . . . . . . . . . . . . . . . . . . . . . . . . . . . . . . . . . . . . . 186
AFGen1 To . . . . . . . . . . . . . . . . . . . . . . . . . . . . . . . . . . . . . . . . . . . . . . . . . . . . . . . . . . . . . . . . . . 187
AFGen2 Freq . . . . . . . . . . . . . . . . . . . . . . . . . . . . . . . . . . . . . . . . . . . . . . . . . . . . . . . . . . . . . . . . 187
AFGen2 To . . . . . . . . . . . . . . . . . . . . . . . . . . . . . . . . . . . . . . . . . . . . . . . . . . . . . . . . . . . . . . . . . . 188
Amplitude . . . . . . . . . . . . . . . . . . . . . . . . . . . . . . . . . . . . . . . . . . . . . . . . . . . . . . . . . . . . . . . . . . 189
Atten Hold . . . . . . . . . . . . . . . . . . . . . . . . . . . . . . . . . . . . . . . . . . . . . . . . . . . . . . . . . . . . . . . . . . 189
Audio In Lo . . . . . . . . . . . . . . . . . . . . . . . . . . . . . . . . . . . . . . . . . . . . . . . . . . . . . . . . . . . . . . . . . 190
Audio Out . . . . . . . . . . . . . . . . . . . . . . . . . . . . . . . . . . . . . . . . . . . . . . . . . . . . . . . . . . . . . . . . . . . 190
Auto/Norm . . . . . . . . . . . . . . . . . . . . . . . . . . . . . . . . . . . . . . . . . . . . . . . . . . . . . . . . . . . . . . . . . . 190
Auto Zero . . . . . . . . . . . . . . . . . . . . . . . . . . . . . . . . . . . . . . . . . . . . . . . . . . . . . . . . . . . . . . . . . . . 191
BW= . . . . . . . . . . . . . . . . . . . . . . . . . . . . . . . . . . . . . . . . . . . . . . . . . . . . . . . . . . . . . . . . . . . . . . . 191
Center Freq . . . . . . . . . . . . . . . . . . . . . . . . . . . . . . . . . . . . . . . . . . . . . . . . . . . . . . . . . . . . . . . . . 191
Controls . . . . . . . . . . . . . . . . . . . . . . . . . . . . . . . . . . . . . . . . . . . . . . . . . . . . . . . . . . . . . . . . . . . . 192
Cont/Single . . . . . . . . . . . . . . . . . . . . . . . . . . . . . . . . . . . . . . . . . . . . . . . . . . . . . . . . . . . . . . . . . 192
DC FM Zero . . . . . . . . . . . . . . . . . . . . . . . . . . . . . . . . . . . . . . . . . . . . . . . . . . . . . . . . . . . . . . . . . 192
De-Emp Gain . . . . . . . . . . . . . . . . . . . . . . . . . . . . . . . . . . . . . . . . . . . . . . . . . . . . . . . . . . . . . . . . 192
De-Emphasis . . . . . . . . . . . . . . . . . . . . . . . . . . . . . . . . . . . . . . . . . . . . . . . . . . . . . . . . . . . . . . . . 192
Detector . . . . . . . . . . . . . . . . . . . . . . . . . . . . . . . . . . . . . . . . . . . . . . . . . . . . . . . . . . . . . . . . . . . . 193
Display . . . . . . . . . . . . . . . . . . . . . . . . . . . . . . . . . . . . . . . . . . . . . . . . . . . . . . . . . . . . . . . . . . . . . 193
Edit Mask . . . . . . . . . . . . . . . . . . . . . . . . . . . . . . . . . . . . . . . . . . . . . . . . . . . . . . . . . . . . . . . . . . . 194
EditPt . . . . . . . . . . . . . . . . . . . . . . . . . . . . . . . . . . . . . . . . . . . . . . . . . . . . . . . . . . . . . . . . . . . . . . 194
Ext Load R . . . . . . . . . . . . . . . . . . . . . . . . . . . . . . . . . . . . . . . . . . . . . . . . . . . . . . . . . . . . . . . . . . 195
Ext (TTL) . . . . . . . . . . . . . . . . . . . . . . . . . . . . . . . . . . . . . . . . . . . . . . . . . . . . . . . . . . . . . . . . . . . 195
Filter 1 . . . . . . . . . . . . . . . . . . . . . . . . . . . . . . . . . . . . . . . . . . . . . . . . . . . . . . . . . . . . . . . . . . . . . 195
Filter 2 . . . . . . . . . . . . . . . . . . . . . . . . . . . . . . . . . . . . . . . . . . . . . . . . . . . . . . . . . . . . . . . . . . . . . 196
FM Coupling . . . . . . . . . . . . . . . . . . . . . . . . . . . . . . . . . . . . . . . . . . . . . . . . . . . . . . . . . . . . . . . . 196
Freq (Delta Mrkr) . . . . . . . . . . . . . . . . . . . . . . . . . . . . . . . . . . . . . . . . . . . . . . . . . . . . . . . . . . . . 197
Freq (mask) . . . . . . . . . . . . . . . . . . . . . . . . . . . . . . . . . . . . . . . . . . . . . . . . . . . . . . . . . . . . . . . . . 197
Freq (normal marker) . . . . . . . . . . . . . . . . . . . . . . . . . . . . . . . . . . . . . . . . . . . . . . . . . . . . . . . . . 198
Freq (Ref Mrkr) . . . . . . . . . . . . . . . . . . . . . . . . . . . . . . . . . . . . . . . . . . . . . . . . . . . . . . . . . . . . . . 198
Gain Cntl . . . . . . . . . . . . . . . . . . . . . . . . . . . . . . . . . . . . . . . . . . . . . . . . . . . . . . . . . . . . . . . . . . . 199
IF Filter . . . . . . . . . . . . . . . . . . . . . . . . . . . . . . . . . . . . . . . . . . . . . . . . . . . . . . . . . . . . . . . . . . . . 199
Input Atten . . . . . . . . . . . . . . . . . . . . . . . . . . . . . . . . . . . . . . . . . . . . . . . . . . . . . . . . . . . . . . . . . 200
Input Gain . . . . . . . . . . . . . . . . . . . . . . . . . . . . . . . . . . . . . . . . . . . . . . . . . . . . . . . . . . . . . . . . . . 200
Input Port . . . . . . . . . . . . . . . . . . . . . . . . . . . . . . . . . . . . . . . . . . . . . . . . . . . . . . . . . . . . . . . . . . 201
Internal . . . . . . . . . . . . . . . . . . . . . . . . . . . . . . . . . . . . . . . . . . . . . . . . . . . . . . . . . . . . . . . . . . . . 201
7
Page 8

Contents
Level (div) . . . . . . . . . . . . . . . . . . . . . . . . . . . . . . . . . . . . . . . . . . . . . . . . . . . . . . . . . . . . . . . . . . 202
Level (mask) . . . . . . . . . . . . . . . . . . . . . . . . . . . . . . . . . . . . . . . . . . . . . . . . . . . . . . . . . . . . . . . . 202
Lvl (Delta Mrkr) . . . . . . . . . . . . . . . . . . . . . . . . . . . . . . . . . . . . . . . . . . . . . . . . . . . . . . . . . . . . . 202
Lvl (marker) . . . . . . . . . . . . . . . . . . . . . . . . . . . . . . . . . . . . . . . . . . . . . . . . . . . . . . . . . . . . . . . . 203
Lvl (normal marker) . . . . . . . . . . . . . . . . . . . . . . . . . . . . . . . . . . . . . . . . . . . . . . . . . . . . . . . . . . 203
Lvl (Ref Mrkr) . . . . . . . . . . . . . . . . . . . . . . . . . . . . . . . . . . . . . . . . . . . . . . . . . . . . . . . . . . . . . . . 204
Marker To Peak+ . . . . . . . . . . . . . . . . . . . . . . . . . . . . . . . . . . . . . . . . . . . . . . . . . . . . . . . . . . . . 204
Marker To Peak- . . . . . . . . . . . . . . . . . . . . . . . . . . . . . . . . . . . . . . . . . . . . . . . . . . . . . . . . . . . . . 204
Marker To . . . . . . . . . . . . . . . . . . . . . . . . . . . . . . . . . . . . . . . . . . . . . . . . . . . . . . . . . . . . . . . . . . 205
Mask Beep . . . . . . . . . . . . . . . . . . . . . . . . . . . . . . . . . . . . . . . . . . . . . . . . . . . . . . . . . . . . . . . . . . 205
Mask Type . . . . . . . . . . . . . . . . . . . . . . . . . . . . . . . . . . . . . . . . . . . . . . . . . . . . . . . . . . . . . . . . . . 205
Mod In To . . . . . . . . . . . . . . . . . . . . . . . . . . . . . . . . . . . . . . . . . . . . . . . . . . . . . . . . . . . . . . . . . . 206
No Pk/Avg . . . . . . . . . . . . . . . . . . . . . . . . . . . . . . . . . . . . . . . . . . . . . . . . . . . . . . . . . . . . . . . . . . 206
Normalize . . . . . . . . . . . . . . . . . . . . . . . . . . . . . . . . . . . . . . . . . . . . . . . . . . . . . . . . . . . . . . . . . . 207
Norm/Delta . . . . . . . . . . . . . . . . . . . . . . . . . . . . . . . . . . . . . . . . . . . . . . . . . . . . . . . . . . . . . . . . . 207
Notch Freq . . . . . . . . . . . . . . . . . . . . . . . . . . . . . . . . . . . . . . . . . . . . . . . . . . . . . . . . . . . . . . . . . 208
Notch Gain . . . . . . . . . . . . . . . . . . . . . . . . . . . . . . . . . . . . . . . . . . . . . . . . . . . . . . . . . . . . . . . . . 208
Offset Freq . . . . . . . . . . . . . . . . . . . . . . . . . . . . . . . . . . . . . . . . . . . . . . . . . . . . . . . . . . . . . . . . . 208
Output Port . . . . . . . . . . . . . . . . . . . . . . . . . . . . . . . . . . . . . . . . . . . . . . . . . . . . . . . . . . . . . . . . . 209
Pk Det To . . . . . . . . . . . . . . . . . . . . . . . . . . . . . . . . . . . . . . . . . . . . . . . . . . . . . . . . . . . . . . . . . . 209
Port/Sweep . . . . . . . . . . . . . . . . . . . . . . . . . . . . . . . . . . . . . . . . . . . . . . . . . . . . . . . . . . . . . . . . . 210
Position . . . . . . . . . . . . . . . . . . . . . . . . . . . . . . . . . . . . . . . . . . . . . . . . . . . . . . . . . . . . . . . . . . . . 210
Pos/Neg . . . . . . . . . . . . . . . . . . . . . . . . . . . . . . . . . . . . . . . . . . . . . . . . . . . . . . . . . . . . . . . . . . . . 211
Ref Level . . . . . . . . . . . . . . . . . . . . . . . . . . . . . . . . . . . . . . . . . . . . . . . . . . . . . . . . . . . . . . . . . . . 211
Ref Mrkr . . . . . . . . . . . . . . . . . . . . . . . . . . . . . . . . . . . . . . . . . . . . . . . . . . . . . . . . . . . . . . . . . . . 211
Reset . . . . . . . . . . . . . . . . . . . . . . . . . . . . . . . . . . . . . . . . . . . . . . . . . . . . . . . . . . . . . . . . . . . . . . 212
RF Channel . . . . . . . . . . . . . . . . . . . . . . . . . . . . . . . . . . . . . . . . . . . . . . . . . . . . . . . . . . . . . . . . . 212
RF Cnt Gate . . . . . . . . . . . . . . . . . . . . . . . . . . . . . . . . . . . . . . . . . . . . . . . . . . . . . . . . . . . . . . . . 212
RF Gen Freq . . . . . . . . . . . . . . . . . . . . . . . . . . . . . . . . . . . . . . . . . . . . . . . . . . . . . . . . . . . . . . . . 213
RF In/Ant . . . . . . . . . . . . . . . . . . . . . . . . . . . . . . . . . . . . . . . . . . . . . . . . . . . . . . . . . . . . . . . . . . 213
Scope To . . . . . . . . . . . . . . . . . . . . . . . . . . . . . . . . . . . . . . . . . . . . . . . . . . . . . . . . . . . . . . . . . . . 214
Sensitivity (RF analyzer) . . . . . . . . . . . . . . . . . . . . . . . . . . . . . . . . . . . . . . . . . . . . . . . . . . . . . . 214
Sensitivity (spectrum analyzer) . . . . . . . . . . . . . . . . . . . . . . . . . . . . . . . . . . . . . . . . . . . . . . . . . 215
Settling . . . . . . . . . . . . . . . . . . . . . . . . . . . . . . . . . . . . . . . . . . . . . . . . . . . . . . . . . . . . . . . . . . . . 215
Span . . . . . . . . . . . . . . . . . . . . . . . . . . . . . . . . . . . . . . . . . . . . . . . . . . . . . . . . . . . . . . . . . . . . . . . 216
Speaker ALC . . . . . . . . . . . . . . . . . . . . . . . . . . . . . . . . . . . . . . . . . . . . . . . . . . . . . . . . . . . . . . . . 216
Speaker Vol . . . . . . . . . . . . . . . . . . . . . . . . . . . . . . . . . . . . . . . . . . . . . . . . . . . . . . . . . . . . . . . . . 216
Squelch . . . . . . . . . . . . . . . . . . . . . . . . . . . . . . . . . . . . . . . . . . . . . . . . . . . . . . . . . . . . . . . . . . . . 217
Time . . . . . . . . . . . . . . . . . . . . . . . . . . . . . . . . . . . . . . . . . . . . . . . . . . . . . . . . . . . . . . . . . . . . . . . 218
Time/div . . . . . . . . . . . . . . . . . . . . . . . . . . . . . . . . . . . . . . . . . . . . . . . . . . . . . . . . . . . . . . . . . . . . 218
Track/Fixed . . . . . . . . . . . . . . . . . . . . . . . . . . . . . . . . . . . . . . . . . . . . . . . . . . . . . . . . . . . . . . . . . 218
Trig-Delay . . . . . . . . . . . . . . . . . . . . . . . . . . . . . . . . . . . . . . . . . . . . . . . . . . . . . . . . . . . . . . . . . . 219
Tune Freq . . . . . . . . . . . . . . . . . . . . . . . . . . . . . . . . . . . . . . . . . . . . . . . . . . . . . . . . . . . . . . . . . . 220
TX Pwr Meas . . . . . . . . . . . . . . . . . . . . . . . . . . . . . . . . . . . . . . . . . . . . . . . . . . . . . . . . . . . . . . . . 220
TX Pwr Zero . . . . . . . . . . . . . . . . . . . . . . . . . . . . . . . . . . . . . . . . . . . . . . . . . . . . . . . . . . . . . . . . 221
Vert/div . . . . . . . . . . . . . . . . . . . . . . . . . . . . . . . . . . . . . . . . . . . . . . . . . . . . . . . . . . . . . . . . . . . . 221
Vert Offset . . . . . . . . . . . . . . . . . . . . . . . . . . . . . . . . . . . . . . . . . . . . . . . . . . . . . . . . . . . . . . . . . . 222
8
Page 9

Contents
7. Configuration - Screens and Control Fields
Configuring the Instrument . . . . . . . . . . . . . . . . . . . . . . . . . . . . . . . . . . . . . . . . . . . . . . . . . . . . . . 225
Setting the Date and Time . . . . . . . . . . . . . . . . . . . . . . . . . . . . . . . . . . . . . . . . . . . . . . . . . . . . . 225
Changing the Beeper’s Volume . . . . . . . . . . . . . . . . . . . . . . . . . . . . . . . . . . . . . . . . . . . . . . . . . . 225
Turning Off User Messages . . . . . . . . . . . . . . . . . . . . . . . . . . . . . . . . . . . . . . . . . . . . . . . . . . . . 225
Configuring for Printing A Screen . . . . . . . . . . . . . . . . . . . . . . . . . . . . . . . . . . . . . . . . . . . . . . . . . 226
Printing a Screen . . . . . . . . . . . . . . . . . . . . . . . . . . . . . . . . . . . . . . . . . . . . . . . . . . . . . . . . . . . . . 226
Control Fields on the Configuration Screens . . . . . . . . . . . . . . . . . . . . . . . . . . . . . . . . . . . . . . . . 227
Abort Print . . . . . . . . . . . . . . . . . . . . . . . . . . . . . . . . . . . . . . . . . . . . . . . . . . . . . . . . . . . . . . . . . . 227
Antenna In . . . . . . . . . . . . . . . . . . . . . . . . . . . . . . . . . . . . . . . . . . . . . . . . . . . . . . . . . . . . . . . . . . 227
Base Freq (User Defined) . . . . . . . . . . . . . . . . . . . . . . . . . . . . . . . . . . . . . . . . . . . . . . . . . . . . . . 228
Beeper . . . . . . . . . . . . . . . . . . . . . . . . . . . . . . . . . . . . . . . . . . . . . . . . . . . . . . . . . . . . . . . . . . . . . 228
Call . . . . . . . . . . . . . . . . . . . . . . . . . . . . . . . . . . . . . . . . . . . . . . . . . . . . . . . . . . . . . . . . . . . . . . . . 229
Chan Space (User Defined) . . . . . . . . . . . . . . . . . . . . . . . . . . . . . . . . . . . . . . . . . . . . . . . . . . . . . 229
CDMA Std . . . . . . . . . . . . . . . . . . . . . . . . . . . . . . . . . . . . . . . . . . . . . . . . . . . . . . . . . . . . . . . . . . 229
Command Escape Character . . . . . . . . . . . . . . . . . . . . . . . . . . . . . . . . . . . . . . . . . . . . . . . . . . . 231
Connection Time-out . . . . . . . . . . . . . . . . . . . . . . . . . . . . . . . . . . . . . . . . . . . . . . . . . . . . . . . . . . 231
Data Length . . . . . . . . . . . . . . . . . . . . . . . . . . . . . . . . . . . . . . . . . . . . . . . . . . . . . . . . . . . . . . . . . 231
Date . . . . . . . . . . . . . . . . . . . . . . . . . . . . . . . . . . . . . . . . . . . . . . . . . . . . . . . . . . . . . . . . . . . . . . . 232
Display User Messages . . . . . . . . . . . . . . . . . . . . . . . . . . . . . . . . . . . . . . . . . . . . . . . . . . . . . . . . 232
Duplex Out . . . . . . . . . . . . . . . . . . . . . . . . . . . . . . . . . . . . . . . . . . . . . . . . . . . . . . . . . . . . . . . . . . 232
Ext Ref In . . . . . . . . . . . . . . . . . . . . . . . . . . . . . . . . . . . . . . . . . . . . . . . . . . . . . . . . . . . . . . . . . . . 233
FF at End . . . . . . . . . . . . . . . . . . . . . . . . . . . . . . . . . . . . . . . . . . . . . . . . . . . . . . . . . . . . . . . . . . . 233
FF at Start . . . . . . . . . . . . . . . . . . . . . . . . . . . . . . . . . . . . . . . . . . . . . . . . . . . . . . . . . . . . . . . . . . 233
Firmware . . . . . . . . . . . . . . . . . . . . . . . . . . . . . . . . . . . . . . . . . . . . . . . . . . . . . . . . . . . . . . . . . . . 233
Flow Control . . . . . . . . . . . . . . . . . . . . . . . . . . . . . . . . . . . . . . . . . . . . . . . . . . . . . . . . . . . . . . . . 234
Frame Clock Output . . . . . . . . . . . . . . . . . . . . . . . . . . . . . . . . . . . . . . . . . . . . . . . . . . . . . . . . . . 234
(Gen)-(Anl) . . . . . . . . . . . . . . . . . . . . . . . . . . . . . . . . . . . . . . . . . . . . . . . . . . . . . . . . . . . . . . . . . . 235
(Gen)-(Anl) (User Defined) . . . . . . . . . . . . . . . . . . . . . . . . . . . . . . . . . . . . . . . . . . . . . . . . . . . . . 235
GPIB Adrs . . . . . . . . . . . . . . . . . . . . . . . . . . . . . . . . . . . . . . . . . . . . . . . . . . . . . . . . . . . . . . . . . . 236
Hold-off Delay . . . . . . . . . . . . . . . . . . . . . . . . . . . . . . . . . . . . . . . . . . . . . . . . . . . . . . . . . . . . . . . 236
IBASIC Echo . . . . . . . . . . . . . . . . . . . . . . . . . . . . . . . . . . . . . . . . . . . . . . . . . . . . . . . . . . . . . . . . 236
Incoming Call Security . . . . . . . . . . . . . . . . . . . . . . . . . . . . . . . . . . . . . . . . . . . . . . . . . . . . . . . . 237
Inst Echo . . . . . . . . . . . . . . . . . . . . . . . . . . . . . . . . . . . . . . . . . . . . . . . . . . . . . . . . . . . . . . . . . . . 237
Lines/Page . . . . . . . . . . . . . . . . . . . . . . . . . . . . . . . . . . . . . . . . . . . . . . . . . . . . . . . . . . . . . . . . . . 237
Mode . . . . . . . . . . . . . . . . . . . . . . . . . . . . . . . . . . . . . . . . . . . . . . . . . . . . . . . . . . . . . . . . . . . . . . . 237
Model . . . . . . . . . . . . . . . . . . . . . . . . . . . . . . . . . . . . . . . . . . . . . . . . . . . . . . . . . . . . . . . . . . . . . . 238
Modem Configuration . . . . . . . . . . . . . . . . . . . . . . . . . . . . . . . . . . . . . . . . . . . . . . . . . . . . . . . . . 238
Modem Initialization/Configuration . . . . . . . . . . . . . . . . . . . . . . . . . . . . . . . . . . . . . . . . . . . . . . 239
Modem Mode . . . . . . . . . . . . . . . . . . . . . . . . . . . . . . . . . . . . . . . . . . . . . . . . . . . . . . . . . . . . . . . . 239
Notch Coupl . . . . . . . . . . . . . . . . . . . . . . . . . . . . . . . . . . . . . . . . . . . . . . . . . . . . . . . . . . . . . . . . . 240
Number to Call . . . . . . . . . . . . . . . . . . . . . . . . . . . . . . . . . . . . . . . . . . . . . . . . . . . . . . . . . . . . . . 240
Opt CDMA TB . . . . . . . . . . . . . . . . . . . . . . . . . . . . . . . . . . . . . . . . . . . . . . . . . . . . . . . . . . . . . . . 240
Parity . . . . . . . . . . . . . . . . . . . . . . . . . . . . . . . . . . . . . . . . . . . . . . . . . . . . . . . . . . . . . . . . . . . . . . 240
Password . . . . . . . . . . . . . . . . . . . . . . . . . . . . . . . . . . . . . . . . . . . . . . . . . . . . . . . . . . . . . . . . . . . 241
Printer Adrs . . . . . . . . . . . . . . . . . . . . . . . . . . . . . . . . . . . . . . . . . . . . . . . . . . . . . . . . . . . . . . . . . 241
Printer Port . . . . . . . . . . . . . . . . . . . . . . . . . . . . . . . . . . . . . . . . . . . . . . . . . . . . . . . . . . . . . . . . . 241
Print Title . . . . . . . . . . . . . . . . . . . . . . . . . . . . . . . . . . . . . . . . . . . . . . . . . . . . . . . . . . . . . . . . . . 241
Range Hold . . . . . . . . . . . . . . . . . . . . . . . . . . . . . . . . . . . . . . . . . . . . . . . . . . . . . . . . . . . . . . . . . 242
9
Page 10

Contents
Ref Select . . . . . . . . . . . . . . . . . . . . . . . . . . . . . . . . . . . . . . . . . . . . . . . . . . . . . . . . . . . . . . . . . . . 243
Remote Mode . . . . . . . . . . . . . . . . . . . . . . . . . . . . . . . . . . . . . . . . . . . . . . . . . . . . . . . . . . . . . . . . 243
Retries . . . . . . . . . . . . . . . . . . . . . . . . . . . . . . . . . . . . . . . . . . . . . . . . . . . . . . . . . . . . . . . . . . . . . 244
RF Chan Std . . . . . . . . . . . . . . . . . . . . . . . . . . . . . . . . . . . . . . . . . . . . . . . . . . . . . . . . . . . . . . . . 244
RF Display . . . . . . . . . . . . . . . . . . . . . . . . . . . . . . . . . . . . . . . . . . . . . . . . . . . . . . . . . . . . . . . . . 245
RF Gen Volts . . . . . . . . . . . . . . . . . . . . . . . . . . . . . . . . . . . . . . . . . . . . . . . . . . . . . . . . . . . . . . . . 245
RF In/Out . . . . . . . . . . . . . . . . . . . . . . . . . . . . . . . . . . . . . . . . . . . . . . . . . . . . . . . . . . . . . . . . . . 246
RF Level Offset . . . . . . . . . . . . . . . . . . . . . . . . . . . . . . . . . . . . . . . . . . . . . . . . . . . . . . . . . . . . . . 246
RF Offset . . . . . . . . . . . . . . . . . . . . . . . . . . . . . . . . . . . . . . . . . . . . . . . . . . . . . . . . . . . . . . . . . . . 247
Save/Recall . . . . . . . . . . . . . . . . . . . . . . . . . . . . . . . . . . . . . . . . . . . . . . . . . . . . . . . . . . . . . . . . . 247
Serial Baud . . . . . . . . . . . . . . . . . . . . . . . . . . . . . . . . . . . . . . . . . . . . . . . . . . . . . . . . . . . . . . . . . 248
Serial_9 In . . . . . . . . . . . . . . . . . . . . . . . . . . . . . . . . . . . . . . . . . . . . . . . . . . . . . . . . . . . . . . . . . . 248
Serial No. . . . . . . . . . . . . . . . . . . . . . . . . . . . . . . . . . . . . . . . . . . . . . . . . . . . . . . . . . . . . . . . . . . . 248
Serial Port . . . . . . . . . . . . . . . . . . . . . . . . . . . . . . . . . . . . . . . . . . . . . . . . . . . . . . . . . . . . . . . . . . 249
Status . . . . . . . . . . . . . . . . . . . . . . . . . . . . . . . . . . . . . . . . . . . . . . . . . . . . . . . . . . . . . . . . . . . . . 249
Stop Length . . . . . . . . . . . . . . . . . . . . . . . . . . . . . . . . . . . . . . . . . . . . . . . . . . . . . . . . . . . . . . . . . 249
Time . . . . . . . . . . . . . . . . . . . . . . . . . . . . . . . . . . . . . . . . . . . . . . . . . . . . . . . . . . . . . . . . . . . . . . . 250
Total RAM . . . . . . . . . . . . . . . . . . . . . . . . . . . . . . . . . . . . . . . . . . . . . . . . . . . . . . . . . . . . . . . . . . 250
8. Signaling Encoder and Decoder - Screens and Control Fields
Signaling Encoder and Decoder Screens . . . . . . . . . . . . . . . . . . . . . . . . . . . . . . . . . . . . . . . . . . . .252
The Decoder’s Signal Source . . . . . . . . . . . . . . . . . . . . . . . . . . . . . . . . . . . . . . . . . . . . . . . . . . . 252
Decoder Frequency Measurements . . . . . . . . . . . . . . . . . . . . . . . . . . . . . . . . . . . . . . . . . . . . . . 252
The Encoder . . . . . . . . . . . . . . . . . . . . . . . . . . . . . . . . . . . . . . . . . . . . . . . . . . . . . . . . . . . . . . . . 252
AMPS-TACS, NAMPS-NTACS Encoder and Decoder . . . . . . . . . . . . . . . . . . . . . . . . . . . . . . . . . .253
Control and Voice Channel Identifiers . . . . . . . . . . . . . . . . . . . . . . . . . . . . . . . . . . . . . . . . . . . 253
Encoder/Decoder Interaction . . . . . . . . . . . . . . . . . . . . . . . . . . . . . . . . . . . . . . . . . . . . . . . . . . . 253
AMPS-TACS, NAMPS-NTACS Decoder . . . . . . . . . . . . . . . . . . . . . . . . . . . . . . . . . . . . . . . . . . 254
Interpreting Decoded Data . . . . . . . . . . . . . . . . . . . . . . . . . . . . . . . . . . . . . . . . . . . . . . . . . . . . 254
DTMF Sequence Encoder and Decoder . . . . . . . . . . . . . . . . . . . . . . . . . . . . . . . . . . . . . . . . . . . . .258
Measurement Limits . . . . . . . . . . . . . . . . . . . . . . . . . . . . . . . . . . . . . . . . . . . . . . . . . . . . . . . . . 258
Function Generator Encoder and Decoder . . . . . . . . . . . . . . . . . . . . . . . . . . . . . . . . . . . . . . . . . . .259
Decoding Considerations . . . . . . . . . . . . . . . . . . . . . . . . . . . . . . . . . . . . . . . . . . . . . . . . . . . . . . 259
Control Fields for the Signaling Encoder and Decoder . . . . . . . . . . . . . . . . . . . . . . . . . . . . . . . . .260
AF Anl In . . . . . . . . . . . . . . . . . . . . . . . . . . . . . . . . . . . . . . . . . . . . . . . . . . . . . . . . . . . . . . . . . . . 260
AFGen2 To . . . . . . . . . . . . . . . . . . . . . . . . . . . . . . . . . . . . . . . . . . . . . . . . . . . . . . . . . . . . . . . . . 260
Arm Meas . . . . . . . . . . . . . . . . . . . . . . . . . . . . . . . . . . . . . . . . . . . . . . . . . . . . . . . . . . . . . . . . . . 260
B/I Delay . . . . . . . . . . . . . . . . . . . . . . . . . . . . . . . . . . . . . . . . . . . . . . . . . . . . . . . . . . . . . . . . . . . 260
Bursts . . . . . . . . . . . . . . . . . . . . . . . . . . . . . . . . . . . . . . . . . . . . . . . . . . . . . . . . . . . . . . . . . . . . . 260
Busy/Idle . . . . . . . . . . . . . . . . . . . . . . . . . . . . . . . . . . . . . . . . . . . . . . . . . . . . . . . . . . . . . . . . . . . 261
Channel . . . . . . . . . . . . . . . . . . . . . . . . . . . . . . . . . . . . . . . . . . . . . . . . . . . . . . . . . . . . . . . . . . . . 261
Data (hex) . . . . . . . . . . . . . . . . . . . . . . . . . . . . . . . . . . . . . . . . . . . . . . . . . . . . . . . . . . . . . . . . . . 261
Data Level . . . . . . . . . . . . . . . . . . . . . . . . . . . . . . . . . . . . . . . . . . . . . . . . . . . . . . . . . . . . . . . . . . 262
Data Rate (analog) . . . . . . . . . . . . . . . . . . . . . . . . . . . . . . . . . . . . . . . . . . . . . . . . . . . . . . . . . . . 262
DSAT . . . . . . . . . . . . . . . . . . . . . . . . . . . . . . . . . . . . . . . . . . . . . . . . . . . . . . . . . . . . . . . . . . . . . . 263
DSAT/DST (hex) . . . . . . . . . . . . . . . . . . . . . . . . . . . . . . . . . . . . . . . . . . . . . . . . . . . . . . . . . . . . . 263
Filler (FOCC) . . . . . . . . . . . . . . . . . . . . . . . . . . . . . . . . . . . . . . . . . . . . . . . . . . . . . . . . . . . . . . . 264
Frequency . . . . . . . . . . . . . . . . . . . . . . . . . . . . . . . . . . . . . . . . . . . . . . . . . . . . . . . . . . . . . . . . . . 265
Gate Time . . . . . . . . . . . . . . . . . . . . . . . . . . . . . . . . . . . . . . . . . . . . . . . . . . . . . . . . . . . . . . . . . . 265
10
Page 11

Contents
Hi Tone . . . . . . . . . . . . . . . . . . . . . . . . . . . . . . . . . . . . . . . . . . . . . . . . . . . . . . . . . . . . . . . . . . . . . 265
Input Level . . . . . . . . . . . . . . . . . . . . . . . . . . . . . . . . . . . . . . . . . . . . . . . . . . . . . . . . . . . . . . . . . . 266
Lo Tone . . . . . . . . . . . . . . . . . . . . . . . . . . . . . . . . . . . . . . . . . . . . . . . . . . . . . . . . . . . . . . . . . . . . . 267
Measure . . . . . . . . . . . . . . . . . . . . . . . . . . . . . . . . . . . . . . . . . . . . . . . . . . . . . . . . . . . . . . . . . . . . 267
Message (FOCC) . . . . . . . . . . . . . . . . . . . . . . . . . . . . . . . . . . . . . . . . . . . . . . . . . . . . . . . . . . . . . 268
Message (FVC) (AMPS-TACS) . . . . . . . . . . . . . . . . . . . . . . . . . . . . . . . . . . . . . . . . . . . . . . . . . . 269
Message (FVC) (NAMPS-TACS) . . . . . . . . . . . . . . . . . . . . . . . . . . . . . . . . . . . . . . . . . . . . . . . . . 270
Message/DST (FVC) . . . . . . . . . . . . . . . . . . . . . . . . . . . . . . . . . . . . . . . . . . . . . . . . . . . . . . . . . . 270
Mode . . . . . . . . . . . . . . . . . . . . . . . . . . . . . . . . . . . . . . . . . . . . . . . . . . . . . . . . . . . . . . . . . . . . . . . 271
Num of Bits . . . . . . . . . . . . . . . . . . . . . . . . . . . . . . . . . . . . . . . . . . . . . . . . . . . . . . . . . . . . . . . . . 271
Off Time . . . . . . . . . . . . . . . . . . . . . . . . . . . . . . . . . . . . . . . . . . . . . . . . . . . . . . . . . . . . . . . . . . . . 271
On Time . . . . . . . . . . . . . . . . . . . . . . . . . . . . . . . . . . . . . . . . . . . . . . . . . . . . . . . . . . . . . . . . . . . . 272
Polarity . . . . . . . . . . . . . . . . . . . . . . . . . . . . . . . . . . . . . . . . . . . . . . . . . . . . . . . . . . . . . . . . . . . . . 272
Pre-Emp . . . . . . . . . . . . . . . . . . . . . . . . . . . . . . . . . . . . . . . . . . . . . . . . . . . . . . . . . . . . . . . . . . . . 273
RECC Data (hex) . . . . . . . . . . . . . . . . . . . . . . . . . . . . . . . . . . . . . . . . . . . . . . . . . . . . . . . . . . . . . 273
SAT Freq (FVC) . . . . . . . . . . . . . . . . . . . . . . . . . . . . . . . . . . . . . . . . . . . . . . . . . . . . . . . . . . . . . . 273
SAT Level (FVC) . . . . . . . . . . . . . . . . . . . . . . . . . . . . . . . . . . . . . . . . . . . . . . . . . . . . . . . . . . . . . 273
Send . . . . . . . . . . . . . . . . . . . . . . . . . . . . . . . . . . . . . . . . . . . . . . . . . . . . . . . . . . . . . . . . . . . . . . . 274
Send DSAT (FVC) . . . . . . . . . . . . . . . . . . . . . . . . . . . . . . . . . . . . . . . . . . . . . . . . . . . . . . . . . . . . 274
Send Filler (FOCC) . . . . . . . . . . . . . . . . . . . . . . . . . . . . . . . . . . . . . . . . . . . . . . . . . . . . . . . . . . . 274
Send Mode . . . . . . . . . . . . . . . . . . . . . . . . . . . . . . . . . . . . . . . . . . . . . . . . . . . . . . . . . . . . . . . . . . 275
Sine Units . . . . . . . . . . . . . . . . . . . . . . . . . . . . . . . . . . . . . . . . . . . . . . . . . . . . . . . . . . . . . . . . . . 275
Single/Cont . . . . . . . . . . . . . . . . . . . . . . . . . . . . . . . . . . . . . . . . . . . . . . . . . . . . . . . . . . . . . . . . . 275
Standard . . . . . . . . . . . . . . . . . . . . . . . . . . . . . . . . . . . . . . . . . . . . . . . . . . . . . . . . . . . . . . . . . . . 276
Status . . . . . . . . . . . . . . . . . . . . . . . . . . . . . . . . . . . . . . . . . . . . . . . . . . . . . . . . . . . . . . . . . . . . . . 276
Stop . . . . . . . . . . . . . . . . . . . . . . . . . . . . . . . . . . . . . . . . . . . . . . . . . . . . . . . . . . . . . . . . . . . . . . . 276
Stop DSAT (FVC) . . . . . . . . . . . . . . . . . . . . . . . . . . . . . . . . . . . . . . . . . . . . . . . . . . . . . . . . . . . . 277
Stop Filler (FOCC) . . . . . . . . . . . . . . . . . . . . . . . . . . . . . . . . . . . . . . . . . . . . . . . . . . . . . . . . . . . 277
Stop Meas . . . . . . . . . . . . . . . . . . . . . . . . . . . . . . . . . . . . . . . . . . . . . . . . . . . . . . . . . . . . . . . . . . . 277
Sym . . . . . . . . . . . . . . . . . . . . . . . . . . . . . . . . . . . . . . . . . . . . . . . . . . . . . . . . . . . . . . . . . . . . . . . . 277
Symbol Frequencies (Hz) . . . . . . . . . . . . . . . . . . . . . . . . . . . . . . . . . . . . . . . . . . . . . . . . . . . . . . 277
Trigger Pattern (bin) . . . . . . . . . . . . . . . . . . . . . . . . . . . . . . . . . . . . . . . . . . . . . . . . . . . . . . . . . . 278
Trig Level . . . . . . . . . . . . . . . . . . . . . . . . . . . . . . . . . . . . . . . . . . . . . . . . . . . . . . . . . . . . . . . . . . . 278
Twist . . . . . . . . . . . . . . . . . . . . . . . . . . . . . . . . . . . . . . . . . . . . . . . . . . . . . . . . . . . . . . . . . . . . . . . 279
Waveform . . . . . . . . . . . . . . . . . . . . . . . . . . . . . . . . . . . . . . . . . . . . . . . . . . . . . . . . . . . . . . . . . . . 280
9. Connectors
Connectors . . . . . . . . . . . . . . . . . . . . . . . . . . . . . . . . . . . . . . . . . . . . . . . . . . . . . . . . . . . . . . . . . . . 282
10 MHz REF OUT . . . . . . . . . . . . . . . . . . . . . . . . . . . . . . . . . . . . . . . . . . . . . . . . . . . . . . . . . . . . 282
16 × CHIP CLOCK 19.6608 MHz OUT . . . . . . . . . . . . . . . . . . . . . . . . . . . . . . . . . . . . . . . . . . . 282
ANALOG MODULATION IN . . . . . . . . . . . . . . . . . . . . . . . . . . . . . . . . . . . . . . . . . . . . . . . . . . . 282
ANT IN . . . . . . . . . . . . . . . . . . . . . . . . . . . . . . . . . . . . . . . . . . . . . . . . . . . . . . . . . . . . . . . . . . . . . 283
AUDIO IN . . . . . . . . . . . . . . . . . . . . . . . . . . . . . . . . . . . . . . . . . . . . . . . . . . . . . . . . . . . . . . . . . . 284
AUDIO OUT . . . . . . . . . . . . . . . . . . . . . . . . . . . . . . . . . . . . . . . . . . . . . . . . . . . . . . . . . . . . . . . . 285
BASEBAND OUT (I and Q) . . . . . . . . . . . . . . . . . . . . . . . . . . . . . . . . . . . . . . . . . . . . . . . . . . . . 285
Chassis Ground . . . . . . . . . . . . . . . . . . . . . . . . . . . . . . . . . . . . . . . . . . . . . . . . . . . . . . . . . . . . . . 285
CHIP CLOCK 1.2288 MHz OUT . . . . . . . . . . . . . . . . . . . . . . . . . . . . . . . . . . . . . . . . . . . . . . . . 285
DATA IN . . . . . . . . . . . . . . . . . . . . . . . . . . . . . . . . . . . . . . . . . . . . . . . . . . . . . . . . . . . . . . . . . . . 286
DUPLEX OUT . . . . . . . . . . . . . . . . . . . . . . . . . . . . . . . . . . . . . . . . . . . . . . . . . . . . . . . . . . . . . . . 286
11
Page 12

Contents
EVEN SECOND SYNC IN . . . . . . . . . . . . . . . . . . . . . . . . . . . . . . . . . . . . . . . . . . . . . . . . . . . . . 286
EXT REF IN . . . . . . . . . . . . . . . . . . . . . . . . . . . . . . . . . . . . . . . . . . . . . . . . . . . . . . . . . . . . . . . . 287
EXT SCOPE TRIG IN . . . . . . . . . . . . . . . . . . . . . . . . . . . . . . . . . . . . . . . . . . . . . . . . . . . . . . . . 288
FRAME CLOCK OUT . . . . . . . . . . . . . . . . . . . . . . . . . . . . . . . . . . . . . . . . . . . . . . . . . . . . . . . . 288
GPIB . . . . . . . . . . . . . . . . . . . . . . . . . . . . . . . . . . . . . . . . . . . . . . . . . . . . . . . . . . . . . . . . . . . . . . 288
MEMORY CARD Slot . . . . . . . . . . . . . . . . . . . . . . . . . . . . . . . . . . . . . . . . . . . . . . . . . . . . . . . . . 288
PARALLEL 15 . . . . . . . . . . . . . . . . . . . . . . . . . . . . . . . . . . . . . . . . . . . . . . . . . . . . . . . . . . . . . . 289
PARALLEL 16 . . . . . . . . . . . . . . . . . . . . . . . . . . . . . . . . . . . . . . . . . . . . . . . . . . . . . . . . . . . . . . 289
RF IN/OUT . . . . . . . . . . . . . . . . . . . . . . . . . . . . . . . . . . . . . . . . . . . . . . . . . . . . . . . . . . . . . . . . . 290
SCOPE MONITOR OUT . . . . . . . . . . . . . . . . . . . . . . . . . . . . . . . . . . . . . . . . . . . . . . . . . . . . . . 290
SERIAL 9, 10, and 11 . . . . . . . . . . . . . . . . . . . . . . . . . . . . . . . . . . . . . . . . . . . . . . . . . . . . . . . . . 291
TRIGGER QUALIFIER IN . . . . . . . . . . . . . . . . . . . . . . . . . . . . . . . . . . . . . . . . . . . . . . . . . . . . 291
VIDEO OUT . . . . . . . . . . . . . . . . . . . . . . . . . . . . . . . . . . . . . . . . . . . . . . . . . . . . . . . . . . . . . . . . 292
10. Accessories, Manuals, Support
Modifications . . . . . . . . . . . . . . . . . . . . . . . . . . . . . . . . . . . . . . . . . . . . . . . . . . . . . . . . . . . . . . . . . .294
Agilent Technologies Accessories . . . . . . . . . . . . . . . . . . . . . . . . . . . . . . . . . . . . . . . . . . . . . . . . . .295
External Monitor . . . . . . . . . . . . . . . . . . . . . . . . . . . . . . . . . . . . . . . . . . . . . . . . . . . . . . . . . . . . 295
Agilent Technologies Manuals (English and Other) . . . . . . . . . . . . . . . . . . . . . . . . . . . . . . . . . 295
Agilent Technologies Test Software . . . . . . . . . . . . . . . . . . . . . . . . . . . . . . . . . . . . . . . . . . . . . 296
Options . . . . . . . . . . . . . . . . . . . . . . . . . . . . . . . . . . . . . . . . . . . . . . . . . . . . . . . . . . . . . . . . . . . . 296
Support for Your Instrument . . . . . . . . . . . . . . . . . . . . . . . . . . . . . . . . . . . . . . . . . . . . . . . . . . . . .297
Getting Help . . . . . . . . . . . . . . . . . . . . . . . . . . . . . . . . . . . . . . . . . . . . . . . . . . . . . . . . . . . . . . . . 297
Customer Training . . . . . . . . . . . . . . . . . . . . . . . . . . . . . . . . . . . . . . . . . . . . . . . . . . . . . . . . . . . 297
11. Error Messages
General Information About Error Messages . . . . . . . . . . . . . . . . . . . . . . . . . . . . . . . . . . . . . . . . .300
Positive Numbered Error Messages . . . . . . . . . . . . . . . . . . . . . . . . . . . . . . . . . . . . . . . . . . . . . 300
Negative Numbered Error Messages . . . . . . . . . . . . . . . . . . . . . . . . . . . . . . . . . . . . . . . . . . . . . 301
IBASIC Error Messages . . . . . . . . . . . . . . . . . . . . . . . . . . . . . . . . . . . . . . . . . . . . . . . . . . . . . . . 301
GPIB Error Messages . . . . . . . . . . . . . . . . . . . . . . . . . . . . . . . . . . . . . . . . . . . . . . . . . . . . . . . . . 302
Text Only Error Messages . . . . . . . . . . . . . . . . . . . . . . . . . . . . . . . . . . . . . . . . . . . . . . . . . . . . . 302
The Message Display . . . . . . . . . . . . . . . . . . . . . . . . . . . . . . . . . . . . . . . . . . . . . . . . . . . . . . . . . 303
Non-Recoverable Firmware Error . . . . . . . . . . . . . . . . . . . . . . . . . . . . . . . . . . . . . . . . . . . . . . . 303
Text Only Error Messages . . . . . . . . . . . . . . . . . . . . . . . . . . . . . . . . . . . . . . . . . . . . . . . . . . . . . 304
12
Page 13

1
General Information
This chapter contains generic information about the product, safety,
warranty, sales and service offices, power cables, and other information.
13
Page 14

General Information
Manufacturer's Declara tion
Manufacturer's Declaration
This statement is provided to comply with the requir ements of the
German Sound Emission Directive, from 18 January 1991.
This product has the following sound pressure emission specification:
• sound pressure Lp <70 dB(A)
• at the operator position
• under normal operation
• according to ISO 7779:1988/EN 27779:1991 (Type Test).
Herstellerbescheinigung
Diese Information steht im Zusammenhang mit den Anf orderungen der
Maschinenlärminformationsverordnung vom 18 Januar 1991.
• Schalldruckpegel Lp < 70 dB(A).
•Am Arbeitsplatz.
• Nor ma l er Betrieb.
• Nach ISO 7779:1988/EN 27779:1991 (Typprüfung).
14 Chapter 1
C:\Spk\Ref\RefGuideRevE\Preface.fm
Page 15

Safety Considerations
GENERAL
This product and related documentation must be reviewed for
familiarization with safety markings and instructions before operation.
This product has been designed and tested in acc ordance with IEC
Publication 61010-1+A1+A2:1992 Safety Requirements for Electrical
Equipment for Measurement, Control and Laboratory Use and has
been supplied in a safe condition. This instruction documentation
contains information and warnings which must be followed by the user
to ensure safe operation and to maintain t he product i n a safe cond ition.
SAFETY EARTH GROUND
A uninterruptible safety earth ground must be provided from the main
power source to the product input wiring terminals, power cord, or
supplied power cord set.
General Information
Manufacturer's Declaration
CHASSIS GROUND TERMINAL
To prevent a potential shock hazard, always connect the rear-panel
chassis ground terminal to earth ground whe n operating this
instrument from a dc power source.
SAFETY SYMBOLS
Indicates instrument damage can occur if indicated oper ating limits are
!
exceeded. Refer to the instructions in this guide.
Indicates hazardous volt ages.
Indicates earth (ground) term inal
WARNING
CAUTION
A WARNING note denotes a hazard. It calls attention to a
procedure, practice, or the like, which, if not correctly
performed or adhered to, could result in personal injury. Do not
proceed beyond a W ARNING s ign until the indicated conditi ons
are fully understood and met.
A CAUTION note denotes a hazard. It calls attention to an operation
procedure, practice, or the like, which, if not correctly performed or
adhered to, could result in damage to or destruction of part or all of the
product. Do not proceed beyond an CAUTION note until the indicated
conditions are fully understood and met.
Chapter 1 15
Page 16

General Information
Manufacturer's Declara tion
Safety Considerations for this Instrument
WARNING
Whenever it is likely that t he pr otect ion has be en impaire d, the
instrument must be made inoperative and be secured against
any unintended operation.
If this instrument is to be energized via an autotransformer (for
voltage reduction), make sure the common terminal is
connected to the earth terminal of the power source.
If this product is not used as specified, the protection provided
by the equipment could be impaired. This product must be used
in a normal condition (in which all means for protection are
intact) only.
No operator serviceable parts in this product. Refer servicing
to qualified personnel. To prevent electrical shock, do not
remove covers.
Servicing instructions are for use by qualified personnel only.
To avoid electrica l shock, do n ot perform any servicing unless
you are qualified to do so.
The opening of covers or removal of parts is likely to expose
dangerous voltages. Disconnect the product from all voltage
sources while it is being opened.
Adjustments described in the manual are performed with
power supplied to the instrument while protective covers are
removed. Energy avai lable at many points may, if contacted,
result in personal injury.
For Continued protection against fire hazard, replace the line
fuse(s) with T 250 V 5.0 A fuse(s) or the same current rating and
type. Do not use repaired fuses or short circuited fuseholders.
16 Chapter 1
C:\Spk\Ref\RefGuideRevE\Preface.fm
Page 17

General Information
Manufacturer's Declaration
WARNING
This product is a Safety Class I instrument (provided with a
!
protective earthing ground incorporated in the power cord).
The mains plug shall only be inserted in a socket outlet
provided with a protective earth contact. Any interruption of
the protective conductor inside or outside of the product is
likely to make the product dangerous. Intentional interruption
is prohibited.
Chapter 1 17
Page 18

General Information
Manufacturer's Declara tion
WARNING
Always use the three-prong ac power cord supplied with this
product. Failure to ensure adequate earth grounding by not
using this cord may cause personal injury and/or product
damage.
This product is designed for use in Installation Category II and
Pollution Degree 3 per IEC 61010 and IEC 60664 respectively.
This product has autoranging line voltage input, be sure the
supply voltage is within the specified range.
To prevent electrical shock, disconnect instrument from mains
(line) before cleaning. Use a dry cloth or one slightly dampen ed
with water to clean the external case parts. Do not attempt to
clean internally.
Ventilation Requirements: When installing the product in a
cabinet, the convection into and out of the product must not be
restricted. The ambient temperature (outside the cabinet) must
be less than the maximum operating temperature of the
product by 4° C for every 100 watts dissipated in the cabinet. If
the total power dissipated in the cabinet is greater than 800
watts, then forced convection must be used.
Lifting and Handling
When lifting and handling the Agilent 8935 CDMA Cellular/PCS Base
Station Test Set use ergonomically correct procedu res. Lift and c arry by
the strap on the side panel.
When moving the Test Set more than a few feet, be sure to replace the
front screen cover.
Consumables
Two AA alkalyne batteries are supplied with the Test Set and must be
replaced periodically. When replacing batteries always dispose of old
batteries in a conscientious manner, following manufacturer’s
instructions.
18 Chapter 1
C:\Spk\Ref\RefGuideRevE\Preface.fm
Page 19

General Information
Product Markings
Product Markings
The CE mark shows that the product complies with all relevant
European legal Directives (if accompanied by a year, it signifies when
the design was proven).
The CSA mark is a registered trademark of the Canadian Standards
Association.
Chapter 1 19
Page 20

General Information
Certification
Certification
Agilent Technologies certifies that this product met its published
specifications at the time of shipment from the factory. Agilent further
certifies that its calibration measurements are traceable to the United
States National Institute of Standards and Technology, to the extent
allowed by the Institute’s calibration facility, and to the calibration
facilities of other International Standards Organization members.
.
20 Chapter 1
C:\Spk\Ref\RefGuideRevE\Preface.fm
Page 21

DECLARATION OF CONFORMITY
According to ISO/IEC Guide 22 and CEN/CENELEC EN45014
Manufacturer’s Name: Agilent Technologies UK Limited
General Information
Certification
Manufacturer’s Address:
Electronic Products Solutions Group - Queensferry
South Queensferry
West Lothian, EH30 9TG
Scotland, United Kingdom
Declares that the product
Product Name
:
Model Number:
Product Options:
CDMA Base Station Test Set
E6380A
This declaration covers all options of the above product as
detailed in TCF A-5951-9852-02.
EMC:
Conforms with the protection requirements of European Council Directive 89/336/EEC on the
approximation of the laws of the member states relating to electromagnetic compatibility,
against EMC test specifications EN 55011:1991 (Group 1, Class A) and EN 50082-1:1992.
As Detailed in: Electromagnetic C ompatibility (EMC)
Technical Construction File (TCF) No. A-5951-9852-02.
Assessed by: DTI Appointed Competent Body
Technical Report Number:6893/2201/CBR, dated 23 September 1997
EMC Test Centre,
GEC-Marconi Avionics Ltd.,
Maxwell Building,
Donibristle Industrial Park,
Hillend,
Dunfermline
KY11 9LB
Scotland, United Kingdom
Safety:
The product conforms to the following safety standards:
IEC 61010-1(1990) +A1(1992) +A2(1995) / EN 61010-1:1993
IEC 60825-1(1993) / EN 60825-1:1994
Canada / CSA-C22.2 No. 1010.1-93
The product herewi th complies with the requirements of the Low Voltage Directive 73/23/EEC,
and carries the CE mark accordingly
South Queensferry, Scotland. 1st November 2000
R.M. Evans / Manufacturing
Engineering Manager
For further information, please contact your local Agilent Technologies sales office, agent, or distributor.
Chapter 1 21
Page 22

General Information
Agilent Technologies Warranty Statement for Commercial Products
Agilent Te chnologies Warranty Statement
for Commercial Products
E6380A CDMA/Cellular PCS Base Station Test Set
Duration of
Warranty: 1 Year
1. Agilent warrants Agilent hardware, accessories and supplies against
defects in materials and work manship fo r the period spec ified above .
If Agilent receives notice of such defects during the warran ty period,
Agilent will, at its option, either repair or replace products which
prove to be defective. Replacement products may be either new or
like-new.
2. Agilent warrants that Agilent software will not fail to execute its
programming instructions, for the period specified above, due to
defects in material and workmanship when properly installed and
used. If Agilent receives notice of such defects during the warranty
period, Agilent will replace software media which does not execute
its programming instructions due to such defects.
3. Agilent does not warrant that the operation of Agilent products will
be uninterrupted or error free. If Agilent is unable, wit hin a
reasonable time, to repair or replace any product to a condition as
warranted, customer will be entitled to a refund of the purchase
price upon prompt return of the product.
4. Agilent products may contain remanufactured parts equivalent to
new in performance or may have been subject to incidental use.
5. The warranty period begins on the date of delivery or on the date of
installation if installed by Agilent. If customer schedules or delays
Agilent installation more than 30 days after delivery, warranty
begins on the 31st day from delivery.
6. Warranty does not apply to defects resulting from (a) improper or
inadequate maintenance or calibration, (b) software, interfacing,
parts or supplies not supplied by Agilent, (c) unauthor ized
modification or misuse, (d) operation outside of the published
environmental specifications for the product, or (e) improper site
preparation or maintenance.
22 Chapter 1
C:\Spk\Ref\RefGuideRevE\Preface.fm
Page 23

General Information
Agilent Technologies Warranty Statement for Commercial Products
7. TO THE EXTENT ALLOWED BY LOCAL LAW, THE ABOVE
WARRANTIES ARE EXCLUSIVE AND NO OTHER
WARRANTYOR CONDITION, WHETHER WRITTEN OR ORAL IS
EXPRESSED OR IMPLIED AND Agilent SPECIFICALLY
DISCLAIMS ANY IMPLIED WARRANTIES OR CONDITIONS OR
MERCHANTABILITY, SATISFACTORY QUALITY, AND FITNESS
FOR A PARTICULAR PURPOSE.
8. Agilent will be liable for damage to tangible prop erty per incident up
to the greater of $300,000 or the actual amount paid for the product
that is the subject of the claim, and for damages for bodily injury or
death, to the extent that all su ch damages are d etermined by a cour t
of competent jurisdiction to have been directly caused by a defective
Agilent product.
9. TO THE EXTENT ALLOWED BY LOCAL L AW, THE REMEDIES
IN THIS WARRANTY STATEMENT ARE CUSTOMER’S SOLE
AND EXCLUSIVE REMEDIES. EXCEPT AS INDICATED ABOVE,
IN NO EVENT WILL Agilent OR ITS SUPPLIERS BE LIABLE
FOR LOSS OF DATA OR FOR DIRECT, SPECIAL, INCIDENTAL,
CONSEQUENTIAL (INCLUDING LOST PROFIT OR DATA), OR
OTHER DAMAGE, WHETHER BASED IN CONTRACT, TORT, OR
OTHERWISE.
FOR CONSUMER TRANSACTIONS IN AUSTRALIA AND NEW
ZEALAND: THE WARRANTY TERMS CONTAINED IN THIS
STATEMENT, EXCEPT TO THE EXTENT LAWFULLY
PERMITTED, DO NOT EXCLUDE RESTRICT OR MODIFY AND
ARE IN ADDITION TO THE MANDATORY STATUTOR Y RIGHTS
APPLICABLE TO THE SALE OF THIS PRODUCT TO YOU.
Chapter 1 23
Page 24

General Information
Assistance
Assistance
Product maintenance agreements and other customer assistance
agreements are available for Agilent Technologies products. For any
assistance, contact your nearest Agilent Technologies Sales and Service
Office.
Table 1-1 Regional Sales and Service Office s
United States of Amer ica:
Agilent Technologies
Test and Measurement Call
Center
P.O. Box 4026
Englewood, CO 80155-4026
(tel) 1 800 452 4844
Japan:
Agilent Technologies Japan
Ltd.
Measurement Assistance
Center
9-1 Takakura-Cho,
Hachioji-Shi,
Tokyo 192-8510 , Ja pa n
(tel) (81) 456-56-7832
(fax) (81) 426-56-7840
Asia Pacific:
Agilent Technologies
24/F, Cityplaza One,
111 Kings Road,
Taikoo Shing, Hong Kong
Canada:
Agilent Technologies Canada
Inc.
5150 Spectrum Way
Mississauga, Ont ario
L4W 5G1
(tel) 1 877 894 4414
Latin America:
Agilent Technologies
Latin America Region
Headquarters
5200 Blue Lagoon Drive,
Suite #950
Miami, Florida 33126
U.S. A.
(tel) (305) 267 4245
(fax) (305) 267 4286
Europe:
Agilent Technologies
European Marketing
Organization
P.O. Box 999
1180 AZ Amstelveen
The Netherlands
(tel) (3120) 547 9999
Australia/New Zealand:
Agilent Technologies
Australia Pty Ltd.
347 Burwood Highway
Forest Hill, Victoria 3131
(tel) 1 800 629 485
(Australia)
(fax) (61 3) 9272 0749
(tel) 0 800 738 378
(New Zealand)
(fax) (64 4) 802 6881
(tel) (852) 3197 7777
(fax) (852) 2506 923 3
24 Chapter 1
C:\Spk\Ref\RefGuideRevE\Preface.fm
Page 25
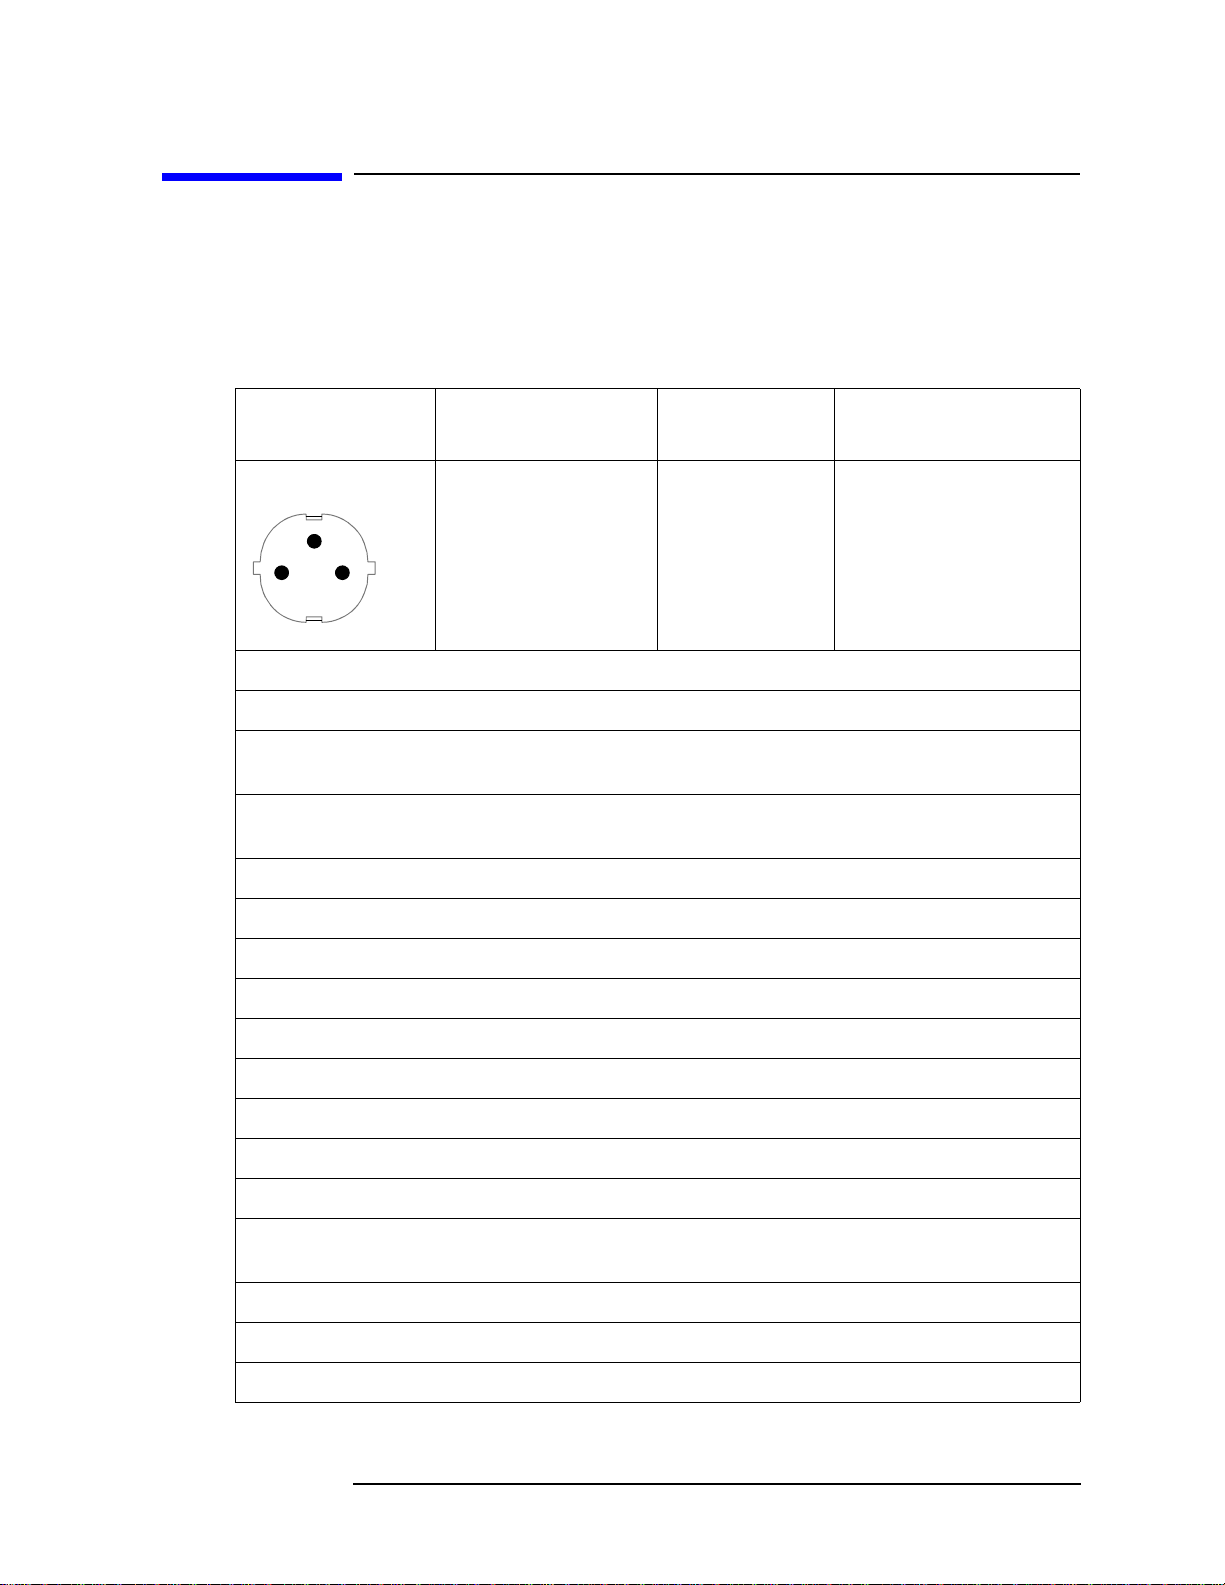
Power Cables
Power
Cables
Table 1-2 Power Cables
General Information
Power Cables
Plug Type Plug Descriptions
male/female
Straight/Straight
Earth Ground
Line Neutral
Used in the following locations
Afghanistan, Albania, Algeria, Angola, Armenia, Austria, Azerbaijan, Azores
Bangladesh, Belgium, Benin, Bolivia, Boznia-Herzegovina, Bulgaria, Burkina Faso,
Burma, Burundi, Byelarus
Cameroon, Canary Islands, Central AfricanRepublic, Chad, Chile, Comoros, Congo,
Croatia, Czech Republic, Czechoslovakia
Denmark, Djibouti
East Germany, Egypt, Estonia, Ethiopia
Finland, France, French Guiana, French Indian Ocean Areas
Straight/90°
Agilent Part #
(cable & plug)
8120-1689
8120-1692
Cable Descriptions
79 inches, mint gray
79 inches, mint gray
Gabon, Gaza Strip, Georgia, Germany, Gozo, Greece
Hungary
Iceland, Indonesia, Iran, Iraq, Israel, Italy, Ivory Coast
Jordan
Kazakhstan, Korea, Kyrgystan
Latvia, Lebanon, Libya, Lit h uan ia, Lu xe mbo urg
Macedonia, Madeira Islands, Malagasy Republic, Mali, Malta, Mauritania, Miquelon,
Moldova, Mongolia, Morocco, Mozambique
Nepal, Netherlands, Netherlands Antilles, Niger, Norway
Oman
Pakistan, Paraguay, Poland, Portugal
Chapter 1 25
Page 26
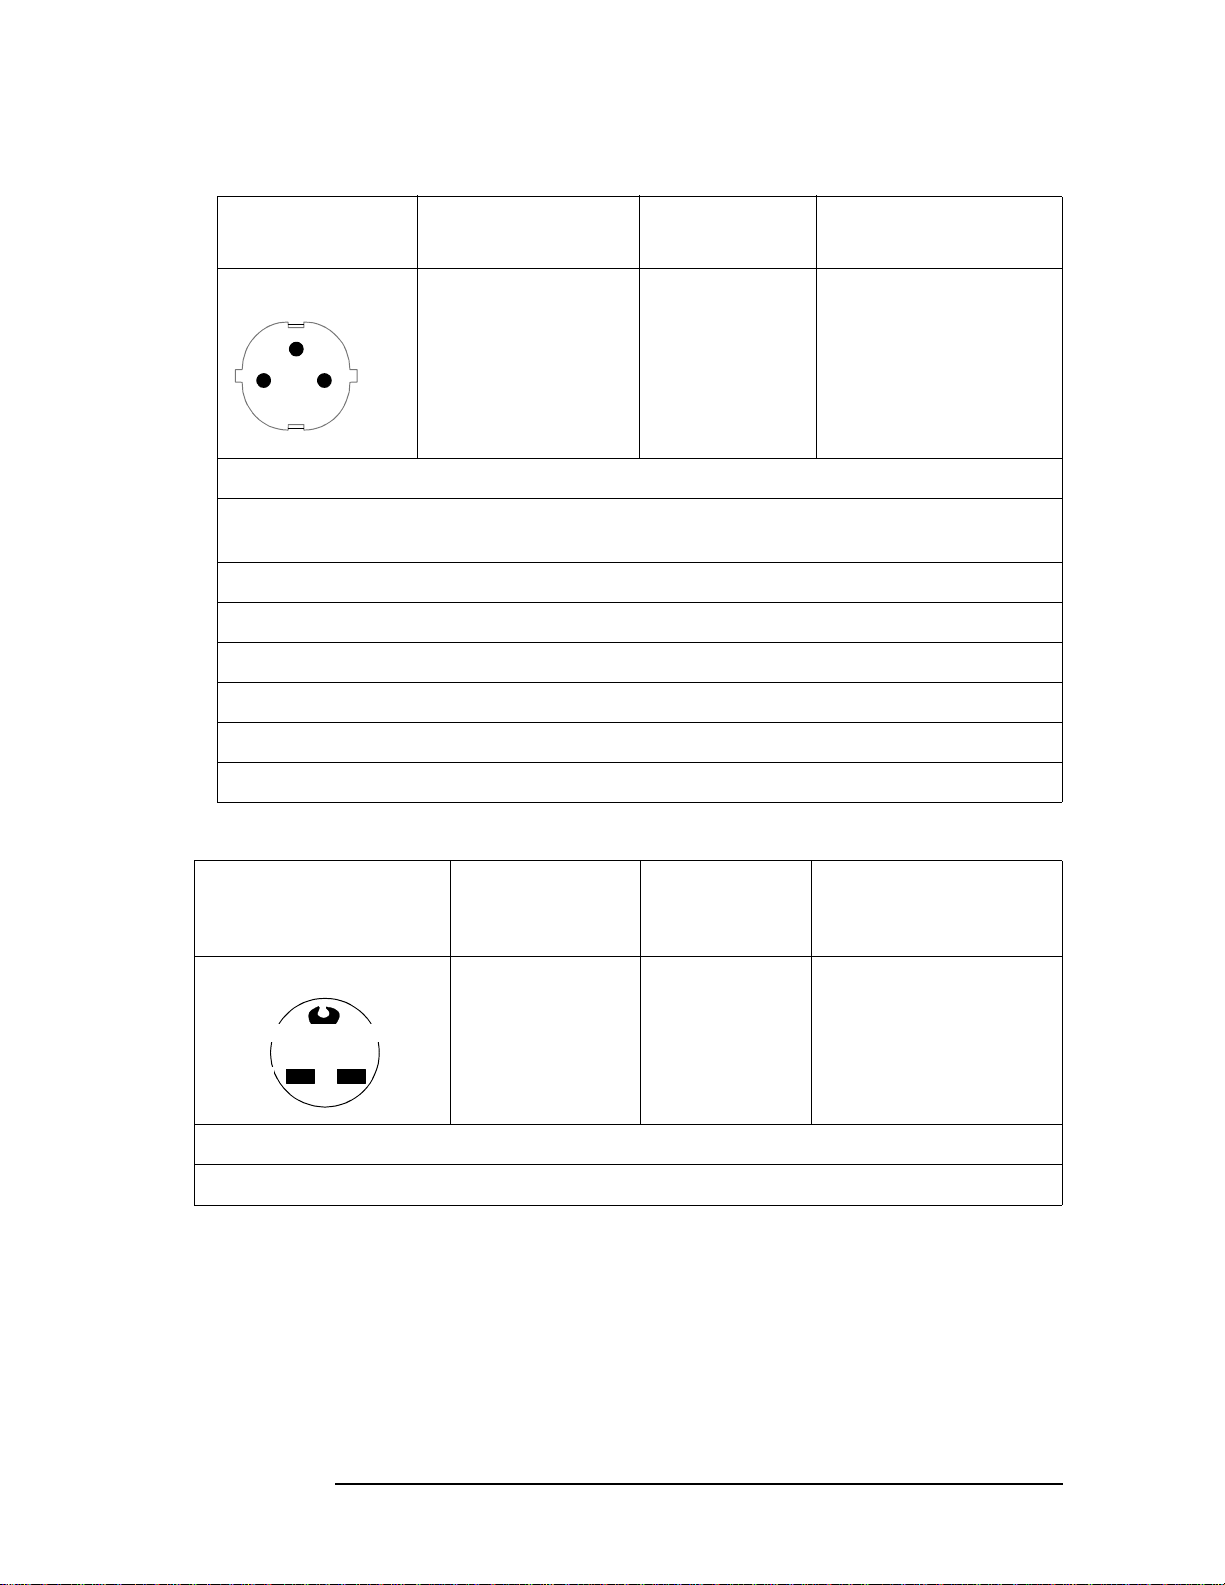
General Information
Power Cables
Table 1-2 Power Cables
Plug Type Plug Descriptions
male/female
Straight/Straight
Earth Ground
Line Neutral
Straight/90°
Agilent Part #
(cable & plug)
8120-1689
8120-1692
Cable Descriptions
79 inches, mint gray
79 inches, mint gray
Rep. South Africa, Romania, Russia, Rwanda
Saudi Arabia (220V), Senegal, Slovak Republic, Slovenia, Somalia, Spain, Spanish
Africa, Sri Lanka, St.Pierce Islands
Sweden, Syria
Tajikistan, Thailand, Togo, Tunisia, Turkey, Turkmenistan
USSR, Ukraine, Uzbekistan
Western Africa, Western Sahara
Yugoslavia
Zaire
Table 1-3 Power Cables
Plug Type Plug
Descriptions
male/female
Straight/Straight 8120-0698 90 inches, black
Earth Ground
Line
Used in the following locations
Peru
Line
Agilent Part
#
(cable & plug)
Cable Descriptions
26 Chapter 1
C:\Spk\Ref\RefGuideRevE\Preface.fm
Page 27
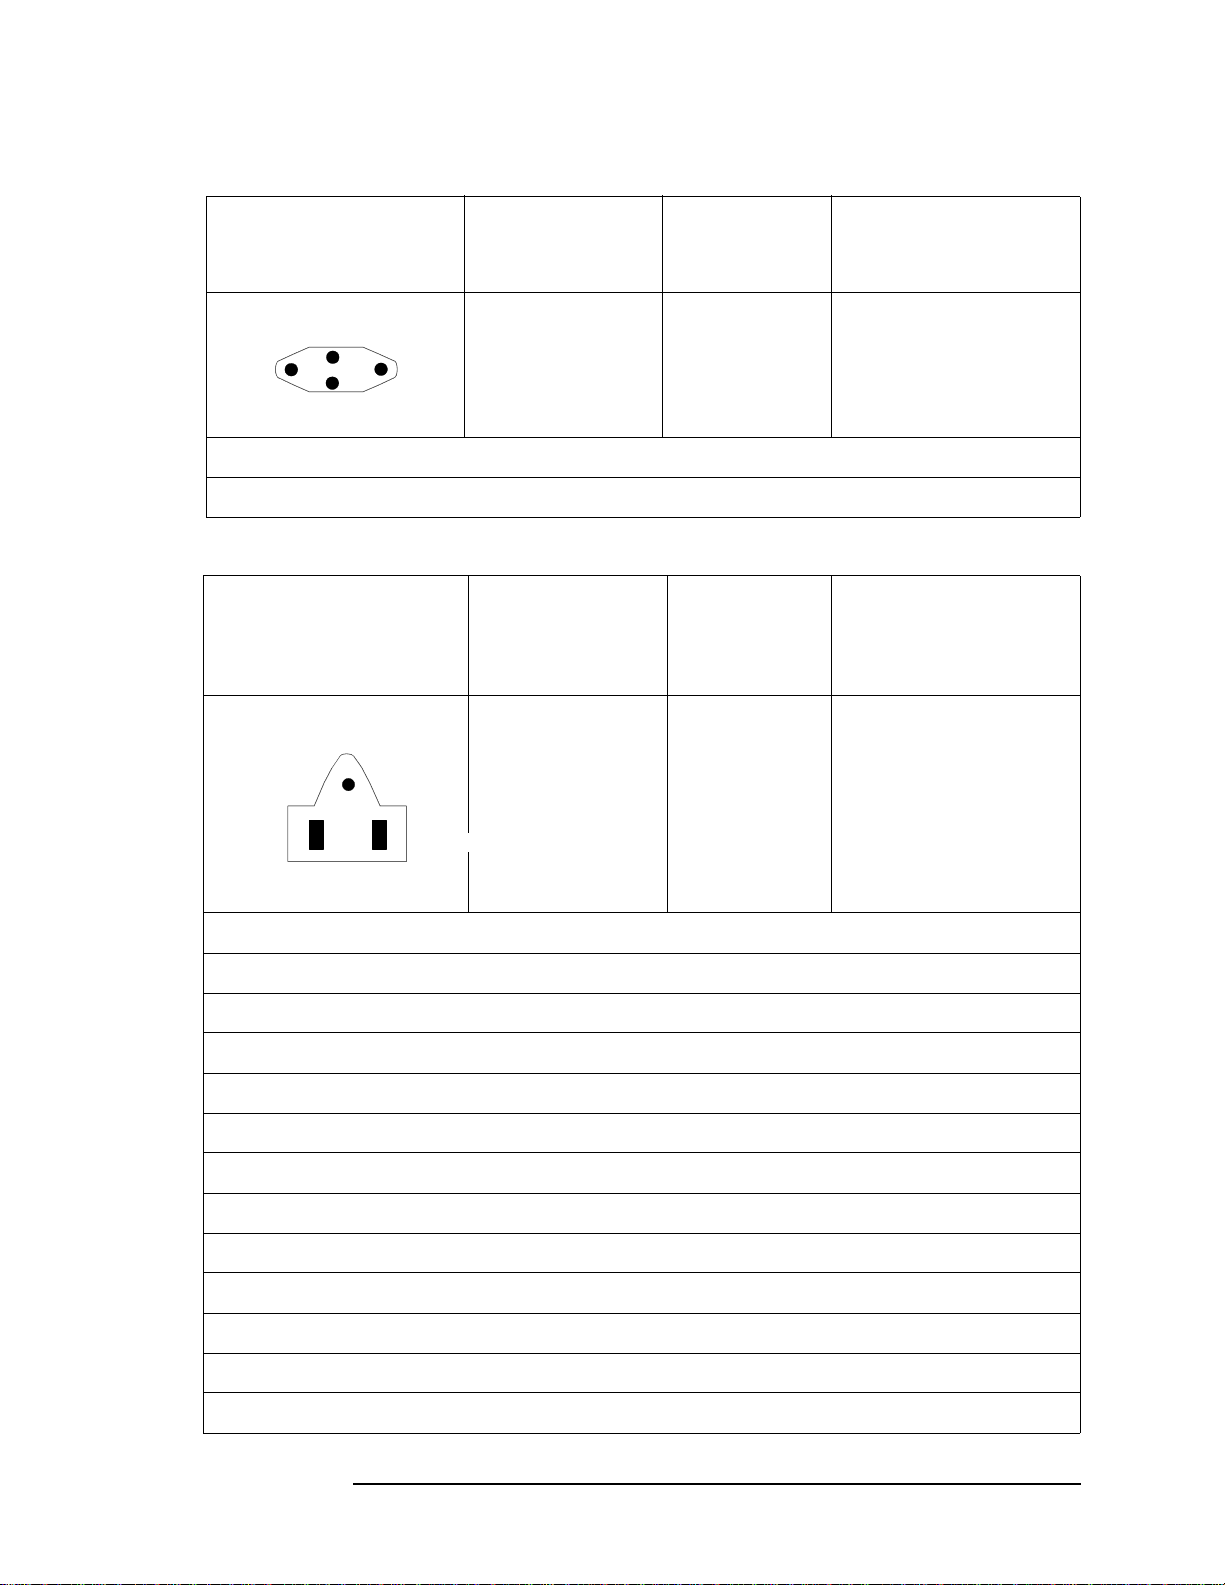
Table 1-4 Power Cables
General Information
Power Cables
Plug Type Plug
Descriptions
male/female
Straight/Straight
Straight/90°
Line
Earth Ground
Neutral
Used in the following locations
Switzerland
Table 1-5 Power Cables
Plug Type Plug
Descriptions
male/female
Straight/Straight
125V
Earth Ground
Straight/90
Straight/Straight
Agilent Pa rt #
(cable & plu g)
8120-2104
8120-2296
Agilent Part
#
(cable &
plug)
8120-1378
8120-1521
8120-1751
Cable Descriptions
79 inches, gray
79 inches, gray
Cable Descriptions
90 inches, jade gray
90 inches, jade gray
90 inches, jade gray
Neutral
Line
Used in the follow in g locations
American Samoa
Bahamas, Barbados, Belize, Bermuda, Brazil,
Caicos, Cambodia, Canada, Cayman Islands, Columbia, Costa Rica, Cuba
Dominican Republic
Ecuador, El Salvador
French West Indies
Guam, Guatemala, Guyana
Haiti, Honduras
Jamaica
Korea
Laos, Leeward and Windward Is., Liberia
Mexico, Midway Islands
Chapter 1 27
Page 28
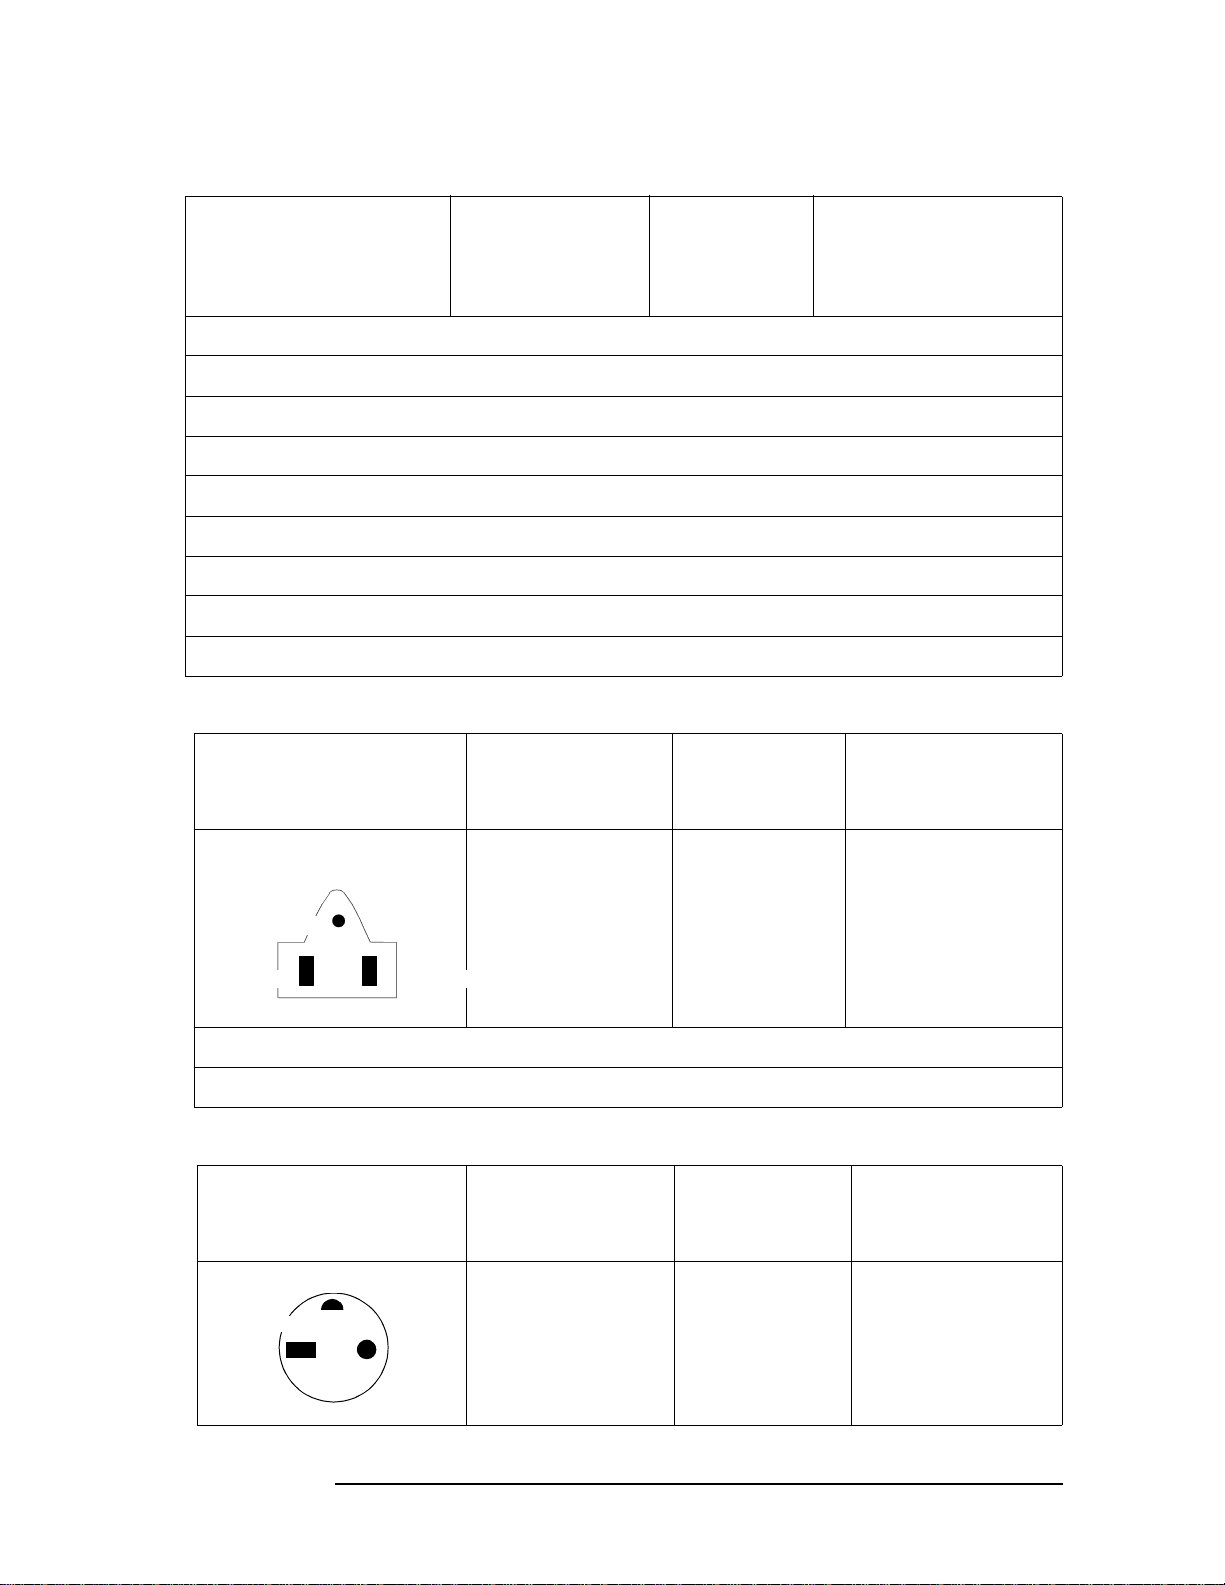
General Information
Power Cables
Table 1-5 Power Cables
Plug Type Plug
Descriptions
male/female
Nicaragua
Other Pacific Islands
Panama, Philippines, Pu ert o Rico
Saudi Arabia (115V,127V), Surin ame
Taiwan, Tobago, Trinidad, Trust Territories of Pacific Islands
Tu rks Is land
United States
Venezuela, Vietnam, Virgin Islands of the US
Wake Island
Table 1-6 Power Cables
Plug Type Plug
Descriptions
male/female
Agilent Part
#
(cable &
plug)
Agilent Part #
(cable & plug)
Cable Descriptions
Cable
Descriptions
JIS C 8303, 100 V
Earth Ground
Neutral
Line
Used in the following locations
Japan
Table 1-7 Power Cables
Plug Type Plug
Earth Ground
Neutral
Line
Straight/Straight
Straight/90°
Descriptions
male/female
90° /S
TRAIGHT
90°/90°
Straight/Straight
8120-4753
8120-4754
Agilent Part #
(cable & plug)
8120-2956
8120-2957
8120-3997
90 inches, dark gray
90 inches, dark gray
Cable
Descriptions
79 inches, gray
79 inches, gray
79 inches, gray
28 Chapter 1
C:\Spk\Ref\RefGuideRevE\Preface.fm
Page 29

Table 1-7 Power Cables
General Information
Power Cables
Plug Type Plug
Descriptions
male/female
Used in the following locations
Denmark
Greenland
Table 1-8 Power Cables
Plug Type Plug Descriptions
male/female
Straight/Straight
Straight/90°
Earth Ground
Line
Used in the follow in g locations
Botswana
Neutral
Agilent Part #
(cable & plug)
Agilent Part #
(cable & plug)
8120-4211
8120-4600
Cable
Descriptions
Cable Descriptions
79 inches, mint gray
79 inches, mint gray
India
Lesotho
Malawi
South-West Africa (Namibia), Swaziland
Zambia, Zimbabwe
Table 1-9 Power Cables
Plug Type (Male) Plug
Descriptions
male/female
Earth Ground
Line
Used in the follow ing locations
Bahrain, British Indian Ocean Terr., Brunei
90°/Straight
90°/90°
Neutral
Agilent Part #
(cable & plug)
8120-1351
8120-1703
Cable Descriptions
90 inches, mint gray
90 inches, mint gray
Canton, Cyprus
Chapter 1 29
Page 30
General Information
d
Power Cables
Table 1-9 Power Cables
Plug Type (Male) Plug
Descriptions
Agilent Part #
(cable & plug)
Cable Descriptions
male/female
Enderbury Island, Equatori al Gu in e a
Falkland Islands, Fre n ch Pacific Islands
Gambia, Ghana, Gibraltar, Guinea
Hong Kong
Ireland
Kenya, Kuwait
Macao, Malaysi a, Mauritius
Nigeria
Qatar
Seychelles, Sierra Leone, Singapore, Southern Asia, Southern Pacific Islands, St. Helena,
Sudan
Tanzania
Uganda, United Arab Emirates, United Kingdom
Yeman (Aden & Sana)
Table 1-10 Power Cables
Plug Type Plug
Descriptions
male/female
Earth Groun
Line
Neutral
Used in the follow in g locations
Argentina, Australia
China (People’s Republic)
New Zealand
Papua New Guinea
Straight/Straight
Straight/90°
Agilent Part #
(cable & plug)
8120-1369
8120-0696
Cable
Descriptions
79 inches, gray
80 inches, gray
Uruguay
30 Chapter 1
C:\Spk\Ref\RefGuideRevE\Preface.fm
Page 31

Table 1-10 Power Cables
General Information
Power Cables
Plug Type Plug
Descriptions
male/female
Western Samoa
Table 1-11 Power Cables
Plug Type Plug
Descriptions
male/female
Earth Ground
Line
Neutral
Used in the following locations
System Cabinets
Straight/Straight
Straight/Straight
Straight/90°
Straight/90°
Agilent Part #
(cable & plug)
Agilent Part #
(cable & plug)
8120-1860
8120-1575
8120-2191
8120-4379
Cable
Descriptions
Cable Descriptions
60 inches, jade gray
30 inches, jade gray
60 inches, jade gray
15.5 inches, jade gray
Chapter 1 31
Page 32

General Information
Power Cables
ATTENTION
Static Sen sitive
Devices
This instrument was constructed in an ESD (electro- static discharge) protected
environment. This is because mos t of the semiconductor devices used in this
instrument are susceptible to damage by static discharge.
Depending on the magnitude of the charge, device substrates can be punctured
or destroyed by contact or mere proximity of a static charge. The result can
cause degradation of device performance, early failure, or immediate
destruction.
These charges are generated in numerous ways such as simple contact,
separation of materials, and normal motions of persons working with static
sensitive devices.
When handling or servicing equipment containing static sensitive devices,
adequate precautions must be taken to prevent device damage or destruction.
Only those who are thoroughly familiar with industry accepted techniques for
handling static sensitive devices should attempt to service circuitry with these
devices.
32 Chapter 1
C:\Spk\Ref\RefGuideRevE\Preface.fm
Page 33

General Information
Product Description
Product Description
The Agilent Technologies 8935 Series E6380A CDMA Cellular/PCS
Base Station Test Set offers full signal generation and analysis
capability and support for cellular frequency bands and international
PCS frequency bands.
You can perform the following CDMA measurements using the Test Set:
• Signal Quality Measurements
—Rho (ρ)
—Time Offset
— Frequency Error
— Carrier Feedthrough
• Code Domain Measurements (IS-95)
— Code Domain Power
— Code Domain Timing
— Code Domain Phase
• Code Domain Measurements (IS-2000)
— Code Domain Power
— Code Domain Fast Power
— Code Domain Complex Power
— Code Domain Power & Noise
— Code Domain Fast Power Synchronization
• Average Power
• Channel Power
• Error Vector Magnitude
The Test Set’s CDMA generator also has the following capabilities:
• Reverse Channel Source with Data Buffer
• AWGN (built-in calibrated E
b/No
levels)
The Test Set also supports CDMA reference clocks and triggers.
Chapter 1 33
Page 34

General Information
Product Description
In addition to its CDMA measurements and capabilities, the Test Set
also provides the following analog measurements:
• AC Level
•AM Depth
•AF Frequency
•DC Level
• Distortion
• Frequency and Frequency Error
• Transmitter Power
•FM Deviation
• Audio Frequency
•SINAD
•SNR
34 Chapter 1
C:\Spk\Ref\RefGuideRevE\Preface.fm
Page 35

General Information
Documentation
Documentation
Conventions Used in This Manual
The following conventions are used throughout this manual to help
clarify inst ructions and reduce unnecessary text:
• “Test Set” refers to the Agilent 8935 CDMA Cellular/PCS Base
Station Test Set.
NOTE
• Test Set keys are indicated like this:
• Test Set screen information, such as a measurement result or an
error message, is shown like this: TX Channel Power -1.3 dBm
HP-IB and GPIB are one and the same.
Preset
What is in This Manual
• Chapter 2, “Getting S ta rted,” on p a g e 39 familiarizes you with the
front panel controls. I t introduces the diffe rent type s of co ntrol fi elds
that are used to make measurements
• Chapter 3 , “Operating Overview,” on page 51 provides general
information about how to change measurement screens and change
control field settings. This chapter also provides some utility
procedures: calibrating channe l power, setting a reference, setting
measurement limits, setting a generator/analyzer offset, averaging
measurements, saving and recalling setups, and using USER keys.
• Chapter 4 , “Overview of the Test Set’s Built-In Tools,” on page 77
introduces the RFTOOLS program. This program automates some
measurements: cable fault location, swept return loss, swept and
discrete insertion loss, spectrum analyzer self-calibration. The
program also includes utilities for printing and data collection.
Basic operation of the built-in signal strength meter, spectrum
analyzer, oscilloscope, and code domain analyzer is also included in
this chapter.
• Chapter 5 , “CDMA Measurements - Screens and Control Fields,” on
page 129 explains the measurements that can be made from these
screens and the fields that control the measurement’s paramet ers.
CDMA measurements include average power measurements,
channel power measurements, rho measurements (including
frequency error, time offset, and carrier feedthrough), EVM
measurements (including phase error and magnitude error), and
code domain me asurements (both IS-95 and IS-2000 sta ndards).
Chapter 1 35
Page 36

General Information
Documentation
• Chapter 6, “Analog Measurements - Screens and Control Fields,” on
page 177 explains the measurements that can be made from these
screens and the fields that control the measurement’s paramet ers.
Analog measurements include ac/dc level, AM depth, AF frequency,
distortion, frequency and frequency error , transmitter power, FM
deviation, SINAD, and SNR.
• Chapter 7, “Configuration - Screens and Control Fields,” on page
223 explains the configuration controls for the T est Set.
• Chapter 9, “Connectors,” on page 281 describes the function and
physical attributes of each connector on the Test Set.
• Chapter 10, “Accessories, Manuals, Support,” on page 293 desc ribe s
any available upgrades, accessories, training and support for the
Test Set.
• Chapter 11, “Error Messages,” on page 299 provides any available
information about error recovery when messages are displayed.
Which Document is Required?
The following documents are part of the Agilent 8935 document set.
Use the table to help you decide which document you need.
Table 1-12 Document Navigati on
Document Part Number Usage
CDMA Application
Guide
AMPS Application
Guide
Reference Guide E6380-90019 Use this manual for screen and field
GPIB Syntax
Reference Guide
Programmer’s Guide E6380-90018 Use this manual to learn GPIB syntax and for
Assembly Level Repair
Guide (this manual)
E6380-90016 Use this manual for basic CD MA
E6380-90017 Use this manual for making AM PS base
E6380-90073 Use this manual as a reference to th e syntax
E6380-90015 Use this manual to perfo r m calibration on the
measurements and for getting started wit h
the Test Set.
station measurements.
descriptions and general operation
information about the Test Set.
and use of all available GPIB commands.
learning how to program the Test Set.
Test Set and for general service information.
Technical
Specifications
Publication
CDROM E6380-90027 Includes all of the abov e d ocumen ts.
36 Chapter 1
5966-0512E Test Set’s specifications data sheet
C:\Spk\Ref\RefGuideRevE\Preface.fm
Page 37

General Information
Trademark Acknowledgments
Trademark Acknowledgments
Hewlett-Packard and HP are registered trademarks of
Hewlett-Packard Company.
Microsoft‚ Windows, and MS-DOS‚ are registered trademarks of
Microsof t C orporatio n.
ProComm‚ is a registered trademark of D a taStorm Technologies, Inc.
HyperTerminal is a registered trademark of Hilgraeve, Incorporated.
Pentium is a registered trademark of Intel Corporation.
Chapter 1 37
Page 38

2 Getting Started
Chapter 2
39
Page 39

Getting Started
• “Before Connecting a Radio” on page 41
• “Changing the Measurement Screen” on page 42
• “Changing the Control Fields” on page 44
• “Instrument Quick Check” on page 49
40
Chapter 2
Page 40

Getting Started
Before Connecting a Radio
Before Connecting a Radio
NOTE The RF IN/OUT port should be used for all transmitter te sts when the radi o is connected
directly to the Test Set. (All UUT transm it te r pow e r mea su re m ent s are m ad e thr o ugh
this port). Off-the-air measurements can be made using the ANT IN port.
CAUTION Overpower Damage — Refer to the Test Set’s side panel for maximum input power level
at the RF IN/OUT, DUPLEX OUT, and ANT IN connectors. Exceeding these levels can
cause permanent instrument damage.
Chapter 2
41
Page 41

Getting Started
Changing the Test Set’s Display
Changing the Test Set’s Display
Changing the Measurement Screen
The measurement screen is changed using the titlebar at the top of the screen and the
cursor-control knob, using the GENERATOR/ANALYZER keys, or by using the UTILS
keys. Rotate the knob to move the cursor from field to field or to change settings. Press
the knob to make selections (see “Changing the Control Fields” on page 44 for more
information about fields).
Figure 2-1 Using the cursor-control Knob or Screen Keys
Titlebar
Push the knob to make a
selection. Rotate the
knob to move the cursor,
or change the settings.
Press one of the
GENERATOR/ANALYZER
or UTILS keys for a shortcut
to the measurem ent or
configuration screens.
42
Chapter 2
Page 42

To change the measurement screen
Getting Started
Changing the Test Set’s Display
Step 1.
Select the titlebar at t he top of th e screen (p lacement of the ti tleb ar may vary sli ghtly on
some screens).
Step 2. Select the measurement screen from the list of choices.
OR
Step 1.
Press a screen key: CDMA Gen, CDMA Anl, Code Dom, RF Gen, RF Anl, Spec Anl, AF
Anl, Scope, Prev, Inst Config, Help, Printer Config, I/O Config, Error Message.
AF Anl, Scope, Printer Config, I/O Config, and Error Message are shifted functions
(labeled in blue above a key). You must press and release the blue
below the blue label to access the screen (or other function) labeled in blue.
Pressing the
key displays the previous screen.
Prev
key then the key
Shift
Chapter 2
43
Page 43

Getting Started
Changing the Test Set’s Display
Changing the Control Fields
There are several types of control fields in t h e Test Set. This section describes some of
the different type s of fiel ds.
Unit-of-Measure Field
Unit-of-measure can be changed to display measurements in different values or
magnitudes. The unit-of-measure field can also be used to turn a measurement on or off
(use the
Figure 2-2 Unit-of-Measure Field
On/Off Yes
key).
Unit-of-Measure
Step 1.
Step 2.
To change a unit-of-measure field
Position the cursor at the unit field on the display.
Press a key labeled with a different unit-of-measure
(such as W).
If the new units are valid, the measurement value is displayed in the unit.
If the new units are not valid, the message Invalid ke ystroke. is displayed and the
units are not changed.
44
Chapter 2
Page 44

Underlined Entry Field
Underlined entry fields provide a choice of two settings (toggle).
Figure 2-3 Underlined Entry Field
Underlined
Entry Field
Getting Started
Changing the Test Set’s Display
Step 1.
Step 2.
To Change an underlined entry
Position the cursor at the field.
Push the cursor-control knob or the
key to move the underline under the desired
Enter
choice.
The underlined set ting is immediately activated when selected.
Chapter 2
45
Page 45

Getting Started
Changing the Test Set’s Display
One-of-Many Field
One-of-many fields display a list of choices when selected.
Figure 2-4 One-of-Many Field
One-of-Many
Field
Step 1.
Step 2.
Step 3.
Step 4.
To make a one-of-many choice
Position the cursor at the field.
Push the cursor-control knob or the
key to display the choices.
Enter
Move the cursor through the choices by turning the knob.
key to make the c h oice.
Push the cursor-control knob or the
Enter
The choice is immediately activate d wh en se lect ed.
46
Chapter 2
Page 46

Numeric-Entry Fields
Values for numeric entry fields can be entered and changed using various methods,
depending on your testing needs.
Figure 2-5 Numeric-Entry Field
Getting Started
Changing the Test Set’s Display
Numeric Entry Field
Step 1.
Step 2.
Step 3.
Step 4.
Step 5.
Step 6.
Step 7.
Step 8.
Step 9.
To change a value
Position the cursor at the field.
Key in the desired number using the DATA ENTRY keys.
to select the choice.
Enter
Press
OR
Position the cursor at the field.
Push the cursor-control knob (the flashing >> cursor appears).
Turn the knob to increment or decrement the value. (The current increment value may
not be appropriate for your operation. See “Changing the Increment or Decrement
Setting” on page 64)
Push the cursor-control knob or the
key to select the choice.
Enter
OR
Position the cursor at the field.
Use the up-arrow or down-arrow keys to increment or decrement the value.
Chapter 2
47
Page 47

Getting Started
Changing the Test Set’s Display
Decimal Values
Decimal values are used for most numeric entry fields. The acceptable entries for
decimal values are
through 9,. ,
0
+/-
, and
EEX
.
The
The
you would enter
key is used for entering negative numbers.
+/-
key is used to enter values in exponential notation. For example to enter 10-9
EEX
1, 0, EEX (Shift, +/-
),
+/-, 9
.
Hexadecimal Values
Hexadecimal (Hex) values are used for entering some signaling parameters. The
acceptable entries value s are 0 throug h 9 and A thro ugh F. No unit-of-measure is
associated with th ese values.
Hexadecimal values are either entered from the keypad (A through F are shifted
functions) or for some fields, values are selected from a list of choices.
48
Chapter 2
Page 48

Getting Started
How do I Verify that the Test Set is Operating Properly?
How do I Verify that the Test Set is Operating Properly?
If your Test Set powers-up and displays the CDMA ANALYZER screen, but you suspect
an instrument problem, use the Instrument Quick Check to verify operation of the basic
instrument f u nc t i o n s.
If no failure is indicated by this test, but you still suspect a problem, refer to the
“Performance Tests” information in the Assembly Level Repair Manual.
Instrument Quick Check
Step 1.
Step 2.
Step 3.
Set up the quick check:
Remove any connected cables (except for AC or DC power).
a.
Turn instrument power on (if it is not already on).
b.
Press
c.
Press
d.
Press
e.
Set the Tune Freq field to 800 MHz.
f.
Set the Anl Dir field to Fwd.
g.
Press
h.
Set the RF Gen Freq field to 800 MHz.
i.
Set the Amplitude field to −40 dBm
j.
Set the Gen Dir. field to Fwd. (The EQ In/Out field is displayed.)
k.
Check the following reading:
Rho should be greater than 0 .96 .
a.
Press
Spec Anl
You should see the characteristic CDMA spectrum.
.
Preset
Inst Config
CDMA Anl
CDMA Gen
and set the RF Display field to Freq.
and select the Avg Pwr field, then select Rho from the Choices: menu.
and set the Output Port field to RF Out.
to access the SPEC ANL screen.
Chapter 2
49
Page 49

Getting Started
How do I Verify that the Test Set is Operating Properly?
Figure 2-6 CDMA Spectrum
50
Chapter 2
Page 50

3
Operating Overview
51
Page 51

Operating Overview
• “Displaying CDMA Measurements” on page 53
• “Displaying Analog Measurements” on page 56
• “Usin g C h annel Number s to Set Analyzer and Generator
Frequencies” on page 60
• “Calibrating the Channel Power Measurement – CDMA Analyzer”
on page 61
• “Changing the Increment or Decrement Setting” on page 64
• “Using Me a su rement Limit In d i ca t ors” on page 65
• “Setting A Measurement Reference” on page 67
• “Averaging Measur e m ents” on pag e 68
• “Setting an RF Generator/Analyzer Offset” on page 69
• “Saving and Recalling Instrument Setups” on page 70
• “Using USER Keys” on page 73
• “Rep lacing Batteries” on page 75
52 Chapter 3
C:\Spk\Ref\RefGuideRevE\Opoverv.fm
Page 52

Operating Overview
Displaying CDMA Measurements
Displaying CDMA Measurements
Channel Power, Adjacent Channel Power (ACP), Rho, Error Vector Magnitude (EVM), Average Power
You can select channel power, ACP, rho, EVM, or average power on the
CDMA ANALYZER or CDMA GENERATOR screen as shown in
Figure 3-1. For more information about these measurements see
“CDMA Measurements” o n page 131.
Figure 3-1 Displaying Channel Power, ACP, Rho, EVM, or Average Power
ADC Full Scale (ADC FS)
When you select Avg Pwr or Chan Pwr, the ADC FS measurement is also
displayed.
Time Offset, Frequency Error, PN Offset, Carrier Feedthrough
When you select Rho, the Time Offset, Freq Err or PN Offset, (see
Figure 3-1) and Carrier Feedthru measurements are displayed. Thes e
measurements are also displayed on the CODE DOM screen.
Figure 3-2 Frequency Error, and PN Offset
Chapter 3 53
Page 53

Operating Overview
Displaying CDMA Measurements
Magnitude Error, Phase Error
When you select EVM, the Magnitude Error and Phase Error
measurements are displayed.
Code Domain Measurements (Power, Fast Power,
Power & Noise, Complex Power, Phase, Timing, Fast
Power Synchronization)
Code domain measurements are displayed on the CODE DOM screen.
To select a code domain meas urement, first p ress the Ins t Config button
and then select the s tandard fo r which you want to make a c ode domai n
measurement: IS-95 or IS-2000.
For more information about code domain measurements see “Code
Domain Measurements – IS-95” on page 139 or “Code Domain
Measurements – IS-2000” on page 142 respectively.
The measurements available in the code domain under IS-95 only, are:
• Power
•Fast Power
•Timing
•Phase
The measurements available in the code domain under IS-2000 are:
• Power
•Fast Power
• Power & Noise
• Complex Power
• Fast Power Synchronization
Now go to the CODE DOM screen and select a measurement from the
Measurement field in the Main controls menu. Figure 3-3 shows the
measurement selection for IS-95.
54 Chapter 3
C:\Spk\Ref\RefGuideRevE\Opoverv.fm
Page 54

Displaying CDMA Measurements
Figure 3-3 Selecting Code Do ma i n M e as u r em e n t s
Operating Overview
I/Q Diagram
Displays the I/Q convergence for the current measurement. See “IQ
Constellation Diagram, IS-2000 only” on page 149 for additional
information.
Figure 3-4 IQ Constellation Diagram
Chapter 3 55
Page 55

Operating Overview
Displaying Analog Measurements
Displaying Analog Measurements
RF Measurements
Frequency Error, Frequency
RF Frequency Error and RF Frequency are displayed on the RF
ANALYZER, RF GENERATOR, and AF ANALYZER screens.
Figure 3-5 Displaying RF Frequency Error or RF Frequency, and TX
Power
Choices:
Freq Error
Frequency
CAUTION
TX
Power
Transmitter (TX)Power
TX Power is only measured and displayed here when the Input Port
on the RF ANALYZER screen is set to RF In. If Ant (antenna) is
selected, the measurement is replaced by four dashes (- - - -).
You can measure low power levels on the ANT IN port using the
spectrum analyzer.
Refer to “TX Power Measurement” on page 183 and “TX Pwr Zero” o n
page 221 for more information on m easuring tra nsmitter powe r.
Connecting a signal of >60 mW to the ANT IN (antenna) port can cause
instrument damage (although internal protection circuits can typically
withstand a short-duration signal of 1 or 2 Watts). If the overpower
circuit is triggered, remove power from the ANT IN port and turn the
Test Set off and on to reset it.
56 Chapter 3
C:\Spk\Ref\RefGuideRevE\Opoverv.fm
Page 56

Displaying Analog Measurements
Displaying AF Measurements
FM Deviation, AM Depth, AC Level
The AF Anl In setting determines the AF analyzer’s input and the
measurement displayed in the top-right corner of the measurement
area (see Figure 3-6). These measurements are displayed on the RF
GENERATOR, RF ANALYZER, and AF ANALYZER screens.
Table 3-6 lists the measurement displayed for each AF Anl In setting.
Figure 3-6 Displaying FM Deviation, AM Depth, or AC Level
Choices:
FM Demod
AM Demod
SSB Demod
Audio In
Ext Mod
FM Mod
AM Mod
Operating Overview
Table 3-1
Measurement AF Anl In Setting
FM Deviation FM Demod, FM Mod
AM Depth AM Demod, AM Mod
AC Level SSB Demod, Audio In, Ext Mod, Audio Out
SINAD, Distortion, SNR, AF Frequency, DC Level,
These measurements are available on the RF GENERATOR,
RFANALYZER, and AF ANALYZER screens. See Figure 3-7 on page
58.
Chapter 3 57
Page 57

Operating Overview
Displaying Analog Measurements
Figure 3-7 Displaying SINAD, Distortion, SNR, DC Level, or
AF Frequency
Choices:
SINAD
Distn
SNR
AF Freq
DC Level
The Distortion and SINAD measurements use the variable frequency
notch filter (audio analyzer screen frequency range 300 Hz – 10 kHz).
Selecting SNR (Signal/Noise Ratio) turns off any other audio
measurement. For more information on making this measurement, see
“RF Gen F req” on page 21 3.
58 Chapter 3
C:\Spk\Ref\RefGuideRevE\Opoverv.fm
Page 58

Displaying Measurement Result s on a Meter Scale
Displaying Measurement Results on a Meter
Scale
Figure 3-8 Displaying the Meter Scale
Operating Overview
Unit-of -Measure
Fields
Measurement results can be displayed on a meter scale. The digital
numeric value is still displayed (but smaller) under the meter scale.
To display the meter scale
1. Move the cursor to the unit-of-measure field for the measurement
you want displayed on the meter.
2. Press and release the blue
the meter function.
Shift
key, then the
Meters:
On/Off
Lo End
Hi End
Intervals
Incr Set
key to access
3. Select On/Off from the Meters: menu (or press the
On/Off
key).
To set the meter’s end points and scale intervals
1. Use the knob to select the unit- of-measure field for the measurement
you want displayed on the meter.
Shift
2. Press and release the blue
key, then the
the meter function.
3. Select Hi End, Lo End, or Interval from the Meters: menu and
enter the value for your selection, then press the
4. Repeat steps 2 and 3 until you have set the desired parameters for
the meter’s scale.
Chapter 3 59
Incr Set
Enter
key to access
key.
Page 59

Operating Overview
Using Channel Numbers to Set Analyzer and Generator Frequencies
Using Channel Numbers to Set Analyzer and
Generator Frequencies
RF analyzer and RF generator frequencies can be entered by channel
number (the default setti n g ) or by discrete frequen ci e s (in MHz). The
RF Display field on the INSTRUMENT CONFIGURE screen controls
which way frequencies are entered. This screen is accessed by pressing
the
Inst Config
If the RF Display field is set to Chan for channel tuning, you also need
to set the RF Chan Std field to indicate the standard for your base
station (such as North American PCS). This automatically sets the
correct frequency off se t needed to genera te r evers e channel signals and
analyze forward channel signals for base stations.
If you do not know the channel number of your base station, but know
the transmit and receive frequencies, set the RF Display field to Freq.
You can then en ter these frequencies direct l y for the RF generator and
RF analyzer during tests.
key.
Figure 3-9 Configuration to Use Channel Numbers for RF Generator and
Analyzer Settings
Set the
to turn on channel tuning.
Select the
display a list of system types.....
..and then select the channel standard
for testing you r base st at i ons.
RF Display
RF Chan Std
field to
field to
Chan
60 Chapter 3
C:\Spk\Ref\RefGuideRevE\Opoverv.fm
Page 60

Operating Overview
Calibrating the Channel Power Measurement – CDMA Analyzer
Calibrating the Channel Power Measurement
– CDMA Analyzer
To calibrate a channel power measurement using the internal CDMA
generator:
Step 4.
Step 5.
Step 6.
Step 7.
Remove power from the RF IN/OUT (or ANT IN) port.
Go to the CDMA ANALYZER screen and choose the Chan Pwr
measurement.
Set the Tune Freq field (or RF Channel field) to the center frequency of
your CDMA signal.
Select the Chn Pwr Cal field and wait until the calibration is complete.
Chapter 3 61
Page 61

Operating Overview
Calibrating the Channel Power Measurement – Code Domain
Calibrating the Channel Power Measurement
– Code Domain
To calibrate a channel power measurement using the internal CDMA
generator:
Step 8.
Step 9.
Step 10.
Step 11.
Remove power from the RF IN/OUT (or ANT IN) port.
Go to the CODE DOMAIN screen and choose the CD Setup (IS-95 o nly)
or Reference (IS-2000) control.
Select Abs from the CD pwr unit field.
Select the Chn Pwr Cal field and and press th e knob to start
calibration. Wait until the calibration is complete.
62 Chapter 3
C:\Spk\Ref\RefGuideRevE\Opoverv.fm
Page 62

Operating Overview
Calibrating the Adjacent Channel Power (ACP) Measurement
Calibrating the Adjacent Channel Power
(ACP) Measurement
To calibrate an ACP measurement using the internal CDMA generator:
Step 12.
Step 13.
Step 14.
Step 15.
Remove power from the RF IN/OUT (or ANT IN) port.
Go to the CDMA ANALYZER screen and choose the ACP measurement.
Set the Tune Freq field (or RF Channel field) to the center frequency of
your CDMA signal.
Select the ACP Cal field and wait until the calibration is complete.
Chapter 3 63
Page 63

Operating Overview
Changing the Increment or Decrement Setting
Changing the Increment or Decrement Setting
Specifying An Increment Value for the Arrow Keys or Knob
Incr Set
The
increment value may use different units than the field you are
incrementing/decrementing. For instance; if the RF generator’s
Amplitude setting is displayed in dB µV, you could increment in units
of dB or mV.
To change the increment/decrement value
key is used to assign a specific increment value. The
Step 1.
Step 2.
Step 3.
Move the cursor to the numeric entry field to be changed.
Press
Incr Set
, and enter the desired incremental value and
unit-of-measure using the DATA ENTRY keys.
Use the down-arrow and up-arrow keys or cursor control
knob to increment the field’s value. The field’s value changes by the
value you set for each key press or knob click.
Using the Factor of 10 Increment/Decrement Keys
Incr
The
× 10 and
by a factor of 10.
For example, if you set the increment for Tune Freq to 10 MHz for
every click of the knob or push of the down-arrow or up-arrow keys,
pushing
Incr ×××× 10
Incr ÷÷÷÷10
keys change the increment/decrement value
changes the increment value to 100 MHz.
64 Chapter 3
C:\Spk\Ref\RefGuideRevE\Opoverv.fm
Page 64

Operating Overview
Using Measurement Limit Indicators
Using Measurement Limit Indicators
Step 1.
The
Lo Limit
and
Hi Limit
functions are used to define a measurement
“window.” You can set a high limit, a low limit, or both. When limits are
assigned, Lo, Hi or both are indicated on the screen.
A measurement that goes above or below the defined limits causes
three things to happen:
1. A message appears at the top of the screen indicating a limit was
exceeded.
2. The Lo or Hi indicator flashes.
3. The beeper beeps (if it is has been enabled in the INSTRUMENT
CONFIGURE screen).
Limits are helpful when you can’t watch the Test Set’ s display while you
are making an adjustment on the equipment you are testing or
repairing. They are also a convenient way of alerting you to long-term
measurement drift.
To set high and low limits
Position the cursor in front of the unit-of-measur e for the measurement
for which you are setting limits.
Shift
Step 2.
Step 3.
Press and release the
Lo Limit
unit-of-measure.
function, and enter the measurement’s low-limit value and its
1
Press and release the
Limit
function, and enter the measurement’s high-limit value and its
unit-of-measure.
1
key, then the down-arrow key to access the
Shift
key, then the up-arrow key to access the
To reset or remove limits
To reset a limit that has been exceeded
Step 4.
Step 5.
Step 6.
1. The fundamental unit for the limits does not have to be the same as the measurement’s units. For
instance; when measuring AC Level in Volts, you can set high and low limits in units of dBm.
Position the cursor in front of the measurement’s unit-of-measure.
Shift
Press and release the
to access the
Press
Enter
Lo Limit
Shift
or
then
key, then the down-arrow (or up-arrow key)
Hi Limit
(or
Hold
) function.
to access the
Meas Reset
function.
Hi
Chapter 3 65
Page 65

Operating Overview
Using Measurement Limit Indicators
remove
To
a limit
Step 1.
Step 2.
Position the cursor in front of the unit-of-measure for the assigned
limit.
Shift
Press and release the
to access the
Lo Limit
key, then the down-arrow (or up-arrow key)
(or
Hi Limit
) function, then press the
On/Off
key.
66 Chapter 3
C:\Spk\Ref\RefGuideRevE\Opoverv.fm
Page 66

Operating Overview
Setting A Measurement Re fe rence
Setting A Measurement Reference
The reference set (Ref Set) function establishes a measurement
reference point. This al l ows you to make a dir e ct comparis on between
two measurement results, or between a meas urement stand ard and the
actual measurement results.
Depending on the type of measurement, referenced me asurements are
displayed in one of two ways:
1. Displayed value = Measur ement − Reference. The difference between
the measured value and the reference value is displayed.
or
2. Displayed value = Measurement ÷ Reference. A ratio of the measured
value to the reference value is displayed. This ratio is expressed in
dB.
Step 1.
Step 2.
Step 3.
Step 4.
Step 5.
To set a reference
Position the cursor in front of the unit-of-measur e for the measurement
you want to set the reference for.
Shift
Press and release the
Set
function.
key, then the
Enter a reference value, then press
measured value as a reference, just press
The Reference indicator shows that an internal reference has been set.
To turn the reference off press and release the
10
key to access the
Ref Set
function, and then press the
Incr ÷÷÷÷ 10
Enter
. (To use the cu rrently
Enter
key to access the
.)
Shift
key, then the
On/Off
Incr ÷
key.
Ref
÷
÷ ÷
Chapter 3 67
Page 67

Operating Overview
Averaging Measurements
Averaging Measurements
Avg
The
number of measurements. You enter the number of measurement
samples used to calculate and display the measurement average. This
dampens the effects of rapidly changing measurements, providing a
more usable measurement display.
To use measurement averaging
(average) function allows you to display the average value of a
Step 1.
Step 2.
Step 3.
Step 4.
Position the cursor in front of the measurement’s unit-of-measure.
Press and release the
Shift
key, then the
Incr ×
× 10
× ×
key to access the
Avg
function.
Enter the desired number of measurement samples to be used for
calculating the average, then press the knob or the
Enter
key.
or
Press
On/Off
to use the currently-displayed number of samples.
To turn averaging off, position t he cursor in fron t of the unit- of-measure
and press and release the
Avg
function, then press the
Shift
key, then the
On/Off
key.
Incr ×
× 10
× ×
key to access the
How the Test Set Averages Measurements
When the averaging function is first enabled, a numeric average is
calculated and displayed each time a measurement is made. This
continues until the specified number of samples is reached. From that
point on, the averaging function performs an exponential filtering
operation that mimics an RC filter.
Because of the exponential response, any large measurement changes
result in a displayed value that ramps up or down to the actual
measured value.
A measurement reset clears the measurement history for all
measurements and starts the averaging process over. (Press and
release the
Shift
key then the
Hold
key (
Meas Reset
) to reset the
measurement.)
68 Chapter 3
C:\Spk\Ref\RefGuideRevE\Opoverv.fm
Page 68

Operating Overview
Setting an RF Generator/Analyzer Offset
Setting an RF Generator/Analyzer Offset
You can set a fixed frequency offset between the RF generator and the
RF analyzer. This feature is convenient for testing radios with a fixed
transmit/receive frequency offset.
To set an RF Offset
Step 1.
Step 2.
Step 3.
Step 4.
Step 5.
Step 6.
Step 7.
Go to the INSTRUMENT CONFIGURE screen.
Set the RF Display field to Freq.
Set the RF Offset field to On.
Select the (Gen)-(Anl) field and enter the frequency off set value.
Go to the RF GENERATOR screen.
Select the RF Gen Freq field, and rotate the cursor contr ol knob to vary
the RF generator’s frequency.
Go to the RF ANALYZER screen. Notice that the Tune Freq value
changes to maintain the offset between the generator and the analyzer.
Prev
(You can use the
screens.)
key to switch between the generator and analyzer
Chapter 3 69
Page 69

Operating Overview
Saving and Recalling Instrument Setups
Saving and Recalling Instrument Setups
The save and recall functions allow you to store different instrument
setups and retrieve them later, eliminating the task of re-configuring
the Test Set.
The number of available save registers depends on how many changes
were made to th e base instrument setup for each save. (See “BASE
Settings” on page 72.) The smaller the number of changes, the greater
the number of save registers that can be used (typically over 200).
Save/Recall register settings can be saved to internal RAM or to a PC
card. Saving registers to a PC card allows y ou to “back up” the settings
in case you need to clear them from memory for running large
programs, or when a firmware upgrade is performed (see “Memory
Considerations” on page 72).
To save an instrument setup
Step 1.
Step 2.
Step 3.
Step 4.
Step 5.
Step 1.
Step 2.
Step 3.
Step 4.
Go to the I/O CONFIGURE screen.
Select the storage media using the Save/Recall field. (The default is
internal memory.)
Make any changes to the instrument that you want to save in a regi ster .
Press and release the
Shift
key then the
Recall
key to access the
Save
function.
Use the DATA ENTRY keys or the Save: menu to enter the register’s
name.
To recall an instrument setup
Select the I/O CONFIGURE screen.
Select the media to recall settings from using the Save/Recall field.
The default is internal memory.
Recall
Press
Use the knob to select the desired setup to be recalled from the Recall
menu.
.
70 Chapter 3
C:\Spk\Ref\RefGuideRevE\Opoverv.fm
Page 70

Operating Overview
Saving and Recalling Instrument Setups
To remove (clear) an individual save register
Step 1.
Step 2.
Step 3.
Step 4.
Step 5.
Step 1.
Step 2.
Step 3.
Specify where the register is stored using the Save/Recall field on the
I/O CONFIGURE screen.
Recall
Press
.
Use the knob to position the cursor in front of the regist er to be removed
from the Recall menu at the bottom-right of the screen. The register
name and percentage of memory oc cupied by that re gist er are i ndicated
at the top of the screen.
Press
Yes On/Off
. A prompt appears, asking if you want to delete the
save register.
Press
Yes On/Off
.
To clear all save registers
Recall
Press
Use the knob to position the cursor in front of the *Clr All* entry in
the Recall menu at the bottom-right of the screen.
Press the knob or press
to verify that you want to clear all registers.
.
Enter
. A prompt appears at the top of the screen
Step 4.
Press
Yes On/Off
.
Register Names
You can use any number, letter, or combination of numbers and letters
as a name for storing instrument settings. For instance; if you want to
save a setup for testing a “Vulcan7” radio, you can save the setting as
“VULCAN7”.
Two register names are reserved for special purposes: POWERON and
BASE.
POWERON Settings
When the Test Set is turned on, it u ses a set of instrument set u p
parameters specified at the time of manufacture. You can have the
instrument power up in a differe nt state by maki ng the desired changes
to the original settings, and then saving them using the name
POWERON.
The next time the instrument is turned on, the instrument returns to
the state present when you saved t he POWERON setti ng. For inst ance;
if the SCOPE screen was displa ye d whe n POWERON was saved, it is
the screen that is displayed when you turn the instrument on.
Chapter 3 71
Page 71

Operating Overview
Saving and Recalling Instrument Setups
BASE Settings
The BASE register contains any field settings the user has saved that
are different from the instrument preset state. It establishes a
reference po int for all f u tu re saves. If a base is not saved, the preset
state is used as the reference.
When you save an instrument setup, the new setup is compared to the
base settings, and any differences are stored under the register name
you supply. Because only differences are stored, a much larger number
of instrument setups can be saved than if the contents of ever y field was
saved.
When you recall an instrument setting, every field is reset to the base
settings. The saved settings are then used to re-establish the desired
instrument setup.
You can define your own base setting. If your desired settings are very
different from the preset values, you may want to change the BASE
register. This will decrease the amount of memory used to save each
setup, and allow you to sa ve many more setups.
CAUTION
Since each save/recall register only contains the differences between
the setup being saved and the present base register settings, changing
the base settings causes all other saved setups to be erased from
memory (including the POWERON setting if one has been saved).
Unless you consistently change the same fields to the same value each
time you use the instrument, you should avoid creat ing your own BASE
settings.
Memory Considerations
When the Save/Recall field of the I/O CONFIGURE screen is set to
Internal, programs are saved to the same non-volatile RAM used to
create RAM disk(s) and run IBASIC programs. By saving a large
number of instrument setups, you reduce the amount of RAM available
to run programs. If you get a “memory overflow” message while trying
to load a program, you must clear one or more save/recall registers to
free RAM space.
Instrument Hardware Changes
Recalling a saved register that uses a hardware option that has been
removed results in unspecified operation. Re-install the needed option
before atte m pting to recal l the associ ated register( s).
72 Chapter 3
C:\Spk\Ref\RefGuideRevE\Opoverv.fm
Page 72

Operating Overview
Using USER Keys
Using USER Keys
You can use user keys to move quickly between fields on the same
screen, and to access fields that are not normally available on the
screen you are using.
Local user keys are used to move between settings on t he scr een t hat is
displayed. Five local user keys are available for each screen:
k4
, and k5. When the user key is pressed, the c urs or insta ntly moves to,
k1, k2, k3
and selects, the assigned field; eliminating the need to turn and push
the knob. Using these keys removes any other local user keys you may
have set up.
Global user keys are used to access settings that are not available on
the current screen. Three global user keys are available:
(Use the
Shift
key to access the global user keys)
k1', k2'
, and
Using Pre-Defined USER Keys
,
k3'
.
Shift
Step 1.
Press and release the
key, the k4 key; then the
numbers 1 through 5 appear in front of various fields. (See Figure 3-10.)
k1
Step 2.
Press the USER keys (
to k5) and notice how the cursor immediately
moves to the corresponding field.
Step 3.
To stop using the default user k eys, press and re lease the
the
k5
key to access the
Release
function; then press the
Figure 3-10 An Example of Pre-Assigned Local User Keys
USER
Assign
Release
k1’
k1
k2’
k2
k3’
k3
k4
k5
Enter
key. The
Shift
key, then
Enter
key.
Chapter 3 73
Page 73

Operating Overview
Using USER Keys
Assigning and Releasing USER Keys
Step 1.
Step 2.
Step 1.
Step 2.
Step 1.
When defining user keys, the
definitions; the
Release
function removes the defi nitions. Re-assigning a
Assign
function is used to create key
user key to a different field automatically releases it from its previous
setting.
To assign local user keys
Move the cursor to the field that you want to assign to a local user key.
Shift
Press and release the
key, then the k4 key to access the
function. Then press a USER ke y (
k1-k5
). The user key number appears
Assign
in front of the field you assigned it to. (Since the cursor is at the newly
assigned field, the USER key number is hidden until the cursor is
moved.)
To release local user keys
Display the screen containing the user key assignment to be removed.
Shift
Press and release the
key, then the k5 key to access the
function; then press the USER key (
k1-k5
).
Release
To assign global user keys
Move the cursor to the field you want to assign a global USER key to.
Step 2.
Step 1.
Step 2.
Press and release the
function. Then press
Shift
key, then the k4 key to access the
Shift
and a USER key (
k1'- k3'
). Unlike a local user
Assign
key, the user key number does not appear at this field; instead, a
prompt appears at the top of the scr een confirming the key assignment.
To release global user keys
Move the cursor to the field with the global user key assigned to it.
Press and release the
function. Then press
Shift
key, then the k5 key to access the
Shift
and the user key to be released.
Release
74 Chapter 3
C:\Spk\Ref\RefGuideRevE\Opoverv.fm
Page 74

Operating Overview
Replacing Batteries
Replacing Batteries
Test Set backs up its RAM using two battery types.
One type is a set of two AA batteries mounted inside the rear panel of
the Test Set. You must periodically change these batteries.
The second type of RAM backup battery is not user serviceable.
CAUTION
NOTE
Failure to take prompt action may result in loss of RAM data including
IBASIC programs and SAVE / RECALL states stored in the RAM.
Do not use rechargeable batteries.
To change the AA batteries, use the following procedure:
1. Turn off power and unplug the Test Set.
2. Remove the six screws in the rear panel using a TX-15 TORX (R)
screwdriver.
3. Remove the rear panel.
4. Replace the AA batteries as indicated in the battery holder.
5. Replace the rear panel. Dispose of used batteries properly.
Chapter 3 75
Page 75

4
Overview of the Test Set’s Built-In Tools
77
Page 76

Overview of the Test Set’s Built-In Tools
• “Using the RF Tools Program” on page 79
• “Using the Code Domain Analyzer” on page 108
• “Using the Spectrum Analyzer” on page 111
• “Using the Voltmeter and Audio Frequency Counter” on page 118
• “Using the Oscilloscope (Scope)” on page 119
• “Securing a Test Procedure” on page 123
• “Clearing RAM” on page 124
• “Using the LISTOPTS (list options) Program” on page 125
• “Using the DEMO Program” on page 126
• “Using the ST_PLT (store or plot) Program” on page 127
78 Chapter 4
C:\Spk\Ref\RefGuideRevE\Tools.fm
Page 77

Overview of the Test Set’s Built-In Tools
Using the RF Tools Program
Using the RF Tools Program
The RF Tools program resides in the Test Set’s ROM. This guide
supports RF Tools version B.02.11.
• “Loading and Running RF Tools” on page 80
• “Test Results/BTS Utility Setup” on page 81
• “Swept Gain” on page 83
• “Discrete Frequency Insertion Loss” on page 87
• “Swept Insertion Loss” on page 89
• “Swept Return Loss” on page 92
• “Cable Fault” on page 97
• “Rep lot Data File s” on page 102
• “Transfer Stored Data” on page 104
• “SA (Spectrum Analyzer) Self Calibration ON/OFF” on page 105
• “Catalog PC (Memory) Card” on page 106
Chapter 4 79
Page 78

Overview of the Test Set’s Built-In Tools
Using the RF Tools Program
Loading and Running RF Tools
1. Press the MENU key to display the SOFTWARE MENU screen
(shown below).
Figure 4-1 SOFTWARE MENU Screen
Choices:
Card
ROM
RAM
Choices:
RFTOOLS
2. Position the cursor at t he highlighted area under Select Procedure
Location and push the knob to select it. A Choices menu appears.
3. Position the cursor at ROM and select it.
4. Position the cursor at t he highlighted area under Select Procedure
Filename and select it. A Choices menu appears.
5. Position the cursor at RFTOOLS and select it.
(Run Test). The software is now loading. Wait for the RF
6. Press
k1
Tools Main Menu screen (Figure 4-2).
7. Select an item from the menu.
Figure 4-2 RF Tools Main Menu Screen
80 Chapter 4
C:\Spk\Ref\RefGuideRevE\Tools.fm
Page 79

Overview of the Test Set’s Built-In Tools
Test Results/BTS Utility Setup
Use this setup to configure a method for measurement data collection.
Measurement results may be collected using a printer, a laptop, or a PC
card.
Figure 4-3 Test Results/BTS Utility Setup Screens
Test Results/BTS Utility Setup Screen
(BTS Laptop Utility Off)
RF Tools Main Menu
Test Results/BTS Utility Setup Screen
(BTS Laptop Utility On)
Using the RF Tools Program
Chapter 4 81
Page 80

Overview of the Test Set’s Built-In Tools
Using the RF Tools Program
To use a laptop and the BTS Laptop Utility for data collection:
This function of RF Tools is used with the BTS Laptop Utility program.
Test results can b e st o re d as ASCII or plot data. Fo r m o re i nf ormation
on this utility, refer to the on-line help accompanying the BTS Laptop
Utility software.
1. Position the cursor at Use BTS Laptop Utility and select it (see
Figure 4-3 on page 81). The screen changes to show only the
appropriate options.
2. Position the cursor at Serial Port Settings 9 and select it. The
serial port settings appear. Serial baud, parity, data length, stop
length, and flow control c an be edited.
3. Confirm that these serial port settings match the BTS Laptop Utility
settings on the laptop.
4. Press
(Return) to return to the Test Results/BTS
k5
Utility/Printer/Serial Setup.
5. Press
(Return) to exit the setup.
k5
To use a printer for data collection:
1. If Use BTS Laptop Utility is set to Yes, change it to No by
selecting the field.
2. Position the cursor at Send Test Results to Printer at and
select it. A Choices menu appears.
3. Position the cursor at the correct port and select it.
4. Position the cursor at Print Setup and select it. Lines per page and
form feed locations can be edited.
(Return) to go back to the previous menu.
5. Press
k5
82 Chapter 4
C:\Spk\Ref\RefGuideRevE\Tools.fm
Page 81

Overview of the Test Set’s Built-In Tools
Using the RF Tools Program
To use a laptop interface other than the BTS Laptop Utility
1. If Use BTS Laptop Utility is set to Yes, change it to No by
selecting the field.
2. Position the cursor at Send Test Results to and select it. A
Choices menu appears.
3. Position the cursor at Serial 9 and select it.
4. Position the cursor at Serial Port Settings 9 and select it. A list
of serial port settings appea rs.
5. Confirm that these serial port settings and the settings on the laptop
match.
(Return) to return to the Test Results/BTS
6. Press
k5
Utility/Printer/Serial Setup.
NOTE
7. Press
(Return) to exit t h e setup.
k5
Swept Gain
Measuremen t Description
This test measures the gain of a device by s weeping it over the specified
frequency range. Gain is the ratio of the output power to the inpu t
power. For the swept gain test, gain is measured in dB. The gain is the
output power in dBm minus the input power in dBm. For exampl e, if
the amplifier has an output of 22 dBm and an input of 4 dBm, it has a
gain of 18 dB.
Making the Measurement
This test radiates a test signal when testing antennas or cables with
antennas attached to them. Verify that the level and frequency span
used for the test cannot result in i nterference to othe r nearby antennas.
To minimize interference when running the program, set the power
level at the DUPLEX OUT port to the minimum value needed for good
measurement resolution. Set the frequency range carefully.
1. Select Swept Gain from the Select Test (Main) Menu. The Swept
Gain Measurement menu will appear.
Chapter 4 83
Page 82

Overview of the Test Set’s Built-In Tools
Using the RF Tools Program
Figure 4-4 Selecting t he Swept Gain Mea surement Test
2. Position the cursor at Start Frequency in MHz and select it. Enter
a value for the start of the frequency sweep from 0.4 MHz to
1000 MHz or 1700 MHz to 2000 M Hz.
3. Position the cursor at Stop frequency in MHZ and select it. Enter
a value from 0.4 MHz to 1000 MHz or 1700 MHz to 2000 MHz. This
value should be larger than the start frequency and in the same
frequency band.
4. Position the cursor at Plot scale in dB/div and select it. A
Choices menu appears. The available choices are 1, 5 or 10.
5. Position the cursor at Maximum Expected Gain in dB and select it.
Enter a value in the range of − 50 to +40 dB. This parameter sets t he
expected worst case power for the ANT IN port. It is very important
to overestimate the expected gain to avoid damage to the ANT IN
port. This parameter also determines plot resolution by setting the
upper limi t.
84 Chapter 4
C:\Spk\Ref\RefGuideRevE\Tools.fm
Page 83

Overview of the Test Set’s Built-In Tools
Using the RF Tools Program
6. Position the cursor at DUPLEX OUT Level in dBm and select it.
Enter the power level, − 54 to +10 dBm, at which the test should be
conducted. If you are testing a power sensitive device, enter a low
level value to avoid damage to that device.
CAUTION
Damage may result if the power input to the Test Set’s ANT IN port
exceeds 60 mW (which is equivalent to 18 dBm). Damage may also
result to the unit-under-test if it is overdriven by the DUPLEX O UT
power level. To avoid damage to the unit under test, enter a low power
level for the DUPLEX OUT level in dBm parameter.
7. Press
(Begin Tst).
k1
Figure 4-5 Swept Gain Setups
Calibration Setup
PARALLEL PORT 15
ANT IN
6dB Pad
AUDIO OUT
ANALOG
SCOPE
MODULATION
MONITOR
IN
OUT
8935
ANT IN DUPLEX OUT
DUPLEX OUT
HI
EXT SCOPE
TRIG IN
AUDIO IN
VIDEO
16X
CHIP CLOCK
19.6608
MHz OUT
LO
OUT
CHIP CLOCK
1.2288
MHz OUT
6dB Pad
BASEBAND OUT
QI
EVEN
FRAME
TRIGGER
SECOND
CLOCK
QUALIFIER
SYNC IN
OUT
IN
SERIAL 9
DATA
PARALLEL PORT 16
SERIAL 10
IN
SERIAL 11
RF IN/OUT
10 MHz
EXT
REF OUT
REF IN
ANT IN
6dB Pad
Measurement Setup
PARALLEL PORT 15
BASEBAND OUT
AUDIO OUT
HI
ANALOG
SCOPE
EXT SCOPE
MODULATION
MONITOR
TRIG IN
IN
OUT
8935
ANT IN DUPLEX OUT
DUPLEX OUT
AUDIO IN
VIDEO
OUT
16X
CHIP CLOCK
19.6608
MHz OUT
LO
CHIP CLOCK
MHz OUT
6dB Pad
DATA
PARALLEL PORT 16
IN
QI
EVEN
FRAME
TRIGGER
SECOND
CLOCK
QUALIFIER
10 MHz
1.2288
OUT
EXT
SYNC IN
IN
REF OUT
REF IN
SERIAL 9
SERIAL 10
SERIAL 11
RF IN/OUT
sweptg.eps
Cal Cable
Test Device
Cal Cable
Barrel
Connector
8. A setup screen appears with a di agram of the necessar y connecti ons,
similar to the Calibration Setup of Figure 1-2. This test requires two
6-dB pads (attenuators). The pads are put on the Test Set’s ANT IN
and DUPLEX OUT ports to reduce impedance mismatch error at
these ports. A reference level is obtained by connecting a short
calibration cable between the pads on the DUPLEX OUT and ANT
IN ports. Set up the hardware, then press
(Proceed) or the knob
k1
to continue.
9. Another setup screen appears similar to the Measurement Setup of
Figure 4-5. Attach the device to be tested between the calibration
cable and one of the pads. In this step, a meas urement is made of the
additional gain from the reference level. Press
(Proceed) or the
k1
knob to continue.
Chapter 4 85
Page 84

Overview of the Test Set’s Built-In Tools
Using the RF Tools Program
10. The trace of the device gain over the frequency range swept is
displayed. If the gain exceeds 40 dB, it will not appear on the trace.
The maximum gain is also displayed as text on the screen. To save
the plot to a PC card, press
a filename. Press
(Scr Dump) to send the image to a printer or to
k5
(Save Plot) and use the knob to enter
k4
the BTS Laptop Utility. Directions will appear at the top of the
screen. Press PRINT and allow the image to print to the connected
device. Then, press PAUSE/CONTINUE. Press
you are ready to continue.
Figure 4-6 Example of a Swept Gain Plot Screen
(Proceed) when
k1
11.The swept gain results screen (see Figure 4-7) appears with the test
results. If the BTS Laptop Utility is in use, this data is collected by
the laptop. If y o u wish to rep eat the test us ing the same cali brated
devices and test parameters, p ress
screen, press
press
(Return).
k5
(Disp Plot). To return to the Select Test Menu,
k3
(Repeat). To re-display the plot
k1
Figure 4-7 Example of a Swept Gain Results Screen
86 Chapter 4
C:\Spk\Ref\RefGuideRevE\Tools.fm
Page 85

Overview of the Test Set’s Built-In Tool s
Using the RF Tools Program
Specifications
• Frequency Range: 0.4-1000 MHz, 1.7-2.0 GHz
• Swept Signal Level: -54 dBm to +10 dBm
Discrete Frequency Insertion Loss
Measuremen t Description
The discrete frequency inser tion loss test measure s the loss of a c able or
device at a specific frequency. DSP (Digital Signal Processing) is used to
determine the results of this test, making it more accurate than the
Swept Insertion Loss test.
Making the Measurement
1. Select Discrete Freq Insertion Loss from the Select Test (Main)
Menu. The Discrete Frequency Insertion Loss Test menu will
appear.
Figure 4-8 Selecti ng the Discre te Frequenc y Insertion Loss Test
Select Test Menu
Discrete Frequency
Insertion Loss
2. Position the cursor at Test frequency in MHz and enter the
specific frequency to be tested.
Chapter 4 87
Page 86

Overview of the Test Set’s Built-In Tools
Using the RF Tools Program
3. Position the cursor at DUPLEX OUT Level in dBm and enter the
power level at which the test should be conducted.
4. Press
(Begin Tst) to begin the test.
k1
Figure 4-9 Discrete Frequency Insertion Loss Setups
sweptg.eps
ANT IN
6dB Pad
Cal Cable
Calibration Setup
AUDIO IN
AUDIO OUT
LO
HI
SCOPE
EXT SCOPE
VIDEO
ANALOG
MONITOR
TRIG IN
OUT
MODULATION
OUT
IN
8935
16X
FRAME
ANT IN DUPLEX OUT
CHIP CLOCK
CHIP CLOCK
1.2288
19.6608
MHz OUT
MHz OUT
DUPLEX OUT
6dB Pad
CLOCK
OUT
PARALLEL PORT 15
BASEBAND OUT
QI
EVEN
TRIGGER
SECOND
QUALIFIER
SYNC IN
IN
SERIAL 9
DATA
PARALLEL PORT 16
SERIAL 10
IN
SERIAL 11
RF IN/OUT
10 MHz
EXT
REF OUT
REF IN
ANT IN
6dB Pad
Cal Cable
Measurement Setup
AUDIO OUT
SCOPE
ANALOG
MONITOR
MODULATION
OUT
IN
8935
ANT IN DUPLEX OUT
DUPLEX OUT
5. A screen appears with a setup diagram. (Figure 4-9) This test
requires tw o 6-dB pads. Th e pads are put on the ANT IN and
DUPLEX OUT ports on the Test Set to reduce impedance mismatch
error at these ports. A reference level is obtained by connecting a
short calibration cable between the pads on the DUPLEX OUT and
ANT IN ports. Press
(Proceed).
k1
HI
EXT SCOPE
TRIG IN
AUDIO IN
VIDEO
OUT
16X
CHIP CLOCK
19.6608
MHz OUT
LO
FRAME
CHIP CLOCK
CLOCK
1.2288
OUT
MHz OUT
6dB Pad
PARALLEL PORT 15
BASEBAND OUT
QI
EVEN
TRIGGER
SECOND
QUALIFIER
SYNC IN
IN
DATA
IN
10 MHz
REF OUT
REF IN
Connector
PARALLEL PORT 16
EXT
Barrel
SERIAL 9
SERIAL 10
SERIAL 11
RF IN/OUT
Test Cable
or Device
NOTE
6. After the Test Set has finished calibrating, a second diagram
appears on the screen. Connect the test cable or device to be tested
between the calibration cable and one of the pads. Press
k1
(Proceed).
7. The discrete frequency insertion loss results screen appears with the
results of the test . The l oss is expressed as a negative number in t his
particular test.
The insertion loss at the specified frequency is displayed twice. The
second display is enlarged for easier reading.
8. Press
(Proceed) when you are finished with this screen. The
k1
Discrete Frequency Insertion Loss Test menu appears. If you would
like to repeat the measurement press
(Begin Tst). The
k1
calibration step will be skipped if none of the parameters were
changed. To exit the test press
(Return).
k5
88 Chapter 4
C:\Spk\Ref\RefGuideRevE\Tools.fm
Page 87

Overview of the Test Set’s Built-In Tool s
Using the RF Tools Program
Swept Insertion Loss
Measuremen t Description
This test measures the loss of a cable or device by sweeping it over the
specified frequency range. This test uses the Spectrum Analyzer to
make measurements.
Making the Measurement
1. Select Swept Insertion Loss from the Select Test (Main) Menu. A
Swept Insertion Loss Information menu will appear.
Figure 4-10 Selecting th e S wept Insertion L os s M ea s u re m en t
Select Test Menu
Swept Insertion Loss
2. Position the cursor at Start frequency in MHz and select it. Enter
a value for the start of the frequency sweep from 0.4 MHz to
1000 MHz or 1700 MHz to 2000 M Hz.
3. Position the cursor at Stop frequency in MHz and select it. Enter a
value from 0.4 MHz to 1000 MHz or 1700 MHz to 2000 MHz. This
value should be larger than the start frequency.
Chapter 4 89
Page 88

Overview of the Test Set’s Built-In Tools
s
Using the RF Tools Program
4. Position the cursor at Max expected loss in dB and enter the
greatest loss expected through you r device. The ins ertion loss will be
displayed from 0 dB to the value entered in this field. Therefore, if
the Max expected loss in dB is set higher than the measured
insertion loss, the plot will not display any test data. Enter the
appropriate value.
5. Position the cursor at DUPLEX OUT level in dBm and enter the
appropriate value. Unless you are measuring loss through a power
sensitive device, the default level should work correctly.
6. Press k1(Begin Tst) to begin the test.
Figure 4-11 Swept Insertion Loss Setups
weptg.eps
ANT IN
6dB Pad
Cal Cable
Calibration Setup
LO
VIDEO
OUT
16X
CHIP CLOCK
19.6608
MHz OUT
6dB Pad
CHIP CLOCK
MHz OUT
BASEBAND OUT
EVEN
FRAME
SECOND
CLOCK
1.2288
SYNC IN
OUT
AUDIO OUT
ANALOG
SCOPE
MODULATION
MONITOR
IN
OUT
8935
ANT IN DUPLEX OUT
DUPLEX OUT
AUDIO IN
HI
EXT SCOPE
TRIG IN
7. A calibration setup screen appears with a diagram of the necessary
connections (Figure 4-11). This test requires two 6-dB pads . The
pads are put on the ANT IN and DUPLEX OUT ports on the Test Set
to reduce impedance mism atch error at the se ports. A re ference lev el
is obtained by connecting a short calibration cable between the pads
on the DUPLEX OUT an ANT IN ports. Setup the hardware, then
press
Measurement Setup
PARALLEL PORT 15
SERIAL 9
DATA
PARALLEL PORT 16
QI
TRIGGER
QUALIFIER
IN
SERIAL 10
IN
SERIAL 11
RF IN/OUT
10 MHz
EXT
REF OUT
REF IN
ANT IN
6dB Pad
AUDIO OUT
ANALOG
SCOPE
MODULATION
MONITOR
IN
OUT
8935
ANT IN DUPLEX OUT
DUPLEX OUT
HI
EXT SCOPE
TRIG IN
AUDIO IN
VIDEO
OUT
16X
CHIP CLOCK
19.6608
MHz OUT
LO
FRAME
CHIP CLOCK
CLOCK
1.2288
OUT
MHz OUT
6dB Pad
Cal Cable
(Proceed) or the knob to continue.
k1
PARALLEL PORT 15
BASEBAND OUT
QI
EVEN
TRIGGER
SECOND
QUALIFIER
SYNC IN
IN
DATA
PARALLEL PORT 16
IN
10 MHz
EXT
REF OUT
REF IN
Connector
Barrel
SERIAL 9
SERIAL 10
SERIAL 11
RF IN/OUT
Test Cable
or Device
8. After the Test Set has finished cal ibrat ing, a second di agram sim ila r
to the Mea s u rement Setup of Figure 4-11 appears on the screen.
Connect the test cable or device to be tested between the calibration
cable and one of the pads. Press
(Proceed) or the knob to
k1
continue.
90 Chapter 4
C:\Spk\Ref\RefGuideRevE\Tools.fm
Page 89

Overview of the Test Set’s Built-In Tool s
Using the RF Tools Program
9. The trace of the cable loss over the frequency range swept is
displayed. The average loss is also displayed on the screen. To save
the plot to a PC card, press
a filename. Press
(Scr Dump) to send the image to a printer or to
k5
(Save Plot) and use the knob to enter
k4
the BTS Laptop Utility. Directions will appear at the top of the
screen. Press PRINT and allow the image to print to the connected
device. Then, press PAUSE/CONTINUE. Press
(Proceed) when
k1
you are ready to proceed
10.The swept insertion loss results screen appears with the test results.
If the BTS Laptop Utility is in use, this data is collected by the
laptop. If you wish to repeat the test using the same calibrated
devices and test par ameter s, press
(Repeat). To redisplay the plot
k1
screen, press k3(Disp Plot). To return to the Select Test (Main)
Menu, press
(Return).
k5
Estimating Swept Insertion Loss Using a Single Connection
Rather than directly measuring the transmitted signal (requiring
connections at both ends), a known high-quality short can be put at the
end of the cable. Knowing that this will reflect 100% of the signal, the
Swept Return Loss test (page 92) can be used and the measured ret urn
loss in dB can simply be divided by 2 to get the system’s estimated
insertion loss. If the return loss is not in dB, the square root of the
measurement would be the system’s insertion loss. An open can also be
used instead of a short, but the results will not be as precise.
Specifications
• Frequency Range: 0.4-1000 MHz, 1.7-2.0 GHz
• Swept Signal Level: -54 dBm to +10 dBm
• Insertion Loss Accuracy: +/- 0.75 dBm
Chapter 4 91
Page 90

Overview of the Test Set’s Built-In Tools
Using the RF Tools Program
Swept Return Loss
Measuremen t Description
Swept return loss is a measure of reflection characteristics. The
purpose of the swept return loss test is to detect problems in the
antenna feedline system and the antenna itself. A portion of the
incident power will be reflected back to the source from each
transmission line fault as well as t he antenna. The ratio of the ref lected
voltages to the incident voltage is called the reflection coefficient. The
reflection coefficient is a complex number, meaning it has both
magnitude and phase information.
The return loss is defined as the magnitude part of the reflection
coefficient and is expressed in decibels (dB). Therefore, the return loss
is a measure of how l arge the re flected w a ve is to the original incid e n t
wave. Remember that this measurement is in terms of loss, therefore a
large number means that very little signal was reflected back. A loss of
0 dB indicates that all of the incident wave is reflected, whereas a
return loss of 40 dB, for example, would indicate that very little of the
signal is reflected. When a device is f requency swept, a graph similar to
Figure 4-14 on page 95 is obtained. This is an example of a radio
transmitting at a particular frequency. It can be seen that the return
loss at that frequency is a very large number which tapers off to small
return losses at all other frequencies.
NOTE
Another way of looking at the same information is the SWR (also
known as VSWR: Voltage Standing Wave Ratio). VSWR is stated as a
ratio. For example: 1.2:1 or “one point two to one” VSWR. The first
number in the ratio is a value between 1 and infinity. 1 indicates that
none of the incident wave is reflected. Infinity implies that all of the
incident wave is reflected. Therefore, the closer this number is to 1, the
better the feedlin e system p erformance. The sec ond number in the r atio
is always one.
Making the Measurement
When testing antennas or cables with antennas atta ched to them, a test
signal is radiated. Verify that the level and frequency span used for the
test cannot result in interference to other nearby systems. To minimize
interference when running the program, set the power level at the
DUPLEX OUT port to the minimum value needed for good
measurement resolution. Set the frequency range carefully.
1. Select Swept Return Loss from the Select Test (Main) Menu. The
Swept Return Loss Information menu will appear.
92 Chapter 4
C:\Spk\Ref\RefGuideRevE\Tools.fm
Page 91

Overview of the Test Set’s Built-In Tool s
Using the RF Tools Program
Figure 4-12 Selecting th e S wept Return Loss Measureme nt
Select Main Menu
Swept Return Loss
2. Position the cursor at Start frequency in MHz and select it. Enter
a value for the start of the frequency sweep from 0.4 MHz to
1000 MHz or 1700 MHz to 2000 M Hz.
3. Position the cursor at Stop frequency in MHz and select it. Enter a
value from 0.4 MHz to 1000 MHz or 1700 MHz to 2000 MHz. This
value should be larger than the start frequency and in the same
frequency band.
4. Position the cursor at Max expected loss in dB and select it. The
return loss will be displayed from 0 dB to the value entered in this
field. Therefore, if the Max expected loss in dB is set higher than
the measured return loss, the plot will not display any test data.
Enter the appropriate value.
5. Position the cursor at DUPLEX OUT Level in dBm and select it.
Enter the power level at which the test should be conducted.
Chapter 4 93
Page 92

Overview of the Test Set’s Built-In Tools
Using the RF Tools Program
CAUTION
Damage may result if the power input to the Test Set’s ANT IN port
exceeds 60 mW (which is equivalent to 18 dBm). Damage may also
result to the unit-under-test if it is overdriven by the D U PLEX O UT
power level. To avoid damage to the ANT IN port, enter an
over-estimate gain value for t he Max expected gain in dB parameter .
To avoid damage to the unit under test, ensure a low power level for the
DUPLEX OUT level in dBm parameter.
(Begin Tst) or position the cursor at Begin and select it.
6. Press
k1
Figure 4-13 Swept Return Loss Setups
Calibration Setup
PARALLEL PORT 15
AUDIO OUT
AUDIO IN
LO
HI
ANALOG
SCOPE
EXT SCOPE
VIDEO
MODULATION
MONITOR
TRIG IN
OUT
IN
OUT
8935
16X
FRAME
ANT IN DUPLEX OUT
ANT IN
CHIP CLOCK
CHIP CLOCK
1.2288
19.6608
MHz OUT
MHz OUT
DUPLEX OUT
CLOCK
OUT
6dB Pad 6dB Pad
BASEBAND OUT
DATA
QI
EVEN
TRIGGER
SECOND
QUALIFIER
SYNC IN
IN
SERIAL 9
PARALLEL PORT 16
SERIAL 10
IN
SERIAL 11
RF IN/OUT
10 MHz
EXT
REF OUT
REF IN
Measurement Setup
AUDIO OUT
AUDIO IN
LO
HI
ANALOG
SCOPE
EXT SCOPE
VIDEO
MODULATION
MONITOR
TRIG IN
OUT
IN
OUT
8935
16X
FRAME
ANT IN DUPLEX OUT
ANT IN
6dB Pad 6dB Pad
CHIP CLOCK
CHIP CLOCK
1.2288
19.6608
MHz OUT
MHz OUT
DUPLEX OUT
CLOCK
OUT
PARALLEL PORT 15
BASEBAND OUT
DATA
QI
EVEN
TRIGGER
SECOND
QUALIFIER
SYNC IN
IN
SERIAL 9
PARALLEL PORT 16
SERIAL 10
IN
SERIAL 11
RF IN/OUT
10 MHz
EXT
REF OUT
REF IN
VSWR Bridge
REFL.
OUT
TEST PORT
IN
VSWR Bridge
REFL.
OUT
TEST PORT
IN
Short
Attach device to
be tested.
7. A setup screen appears with a di agram of the necessary connecti ons,
similar to Figure 4-13. This is the calibration phase of the test to
obtain a reference level for the device being tested. A VSWR bridge
or a directional coupler and two 6 dB pads are connected to the Test
Set. The pads are used to reduce impedance mismatch errors
between the VSWR bridge and the DUPLEX OUT and ANT IN ports
on the Test Set. A reference level is measured first with a short on
the DUT (Device Under Test) port of the VSWR bridge. An open can
be used as well, but the open must not be blocked in any way that
might cause the signal to be reflected back. For example, using the
open setup inside a van or other enclosed area may introduce
inaccuracies in the measurement. Setup the hardware, then press
(Proceed) or the knob to continue.
k1
8. Another setup screen appears. Attach the device being tested. Press
(Proceed) or the knob to continue.
k1
sretloss.eps
94 Chapter 4
C:\Spk\Ref\RefGuideRevE\Tools.fm
Page 93

Overview of the Test Set’s Built-In Tool s
Using the RF Tools Program
9. The plot screen appears. The trace showing return loss over the
frequency band selected is displayed on the s creen. Measured values
for best and worst case return loss and VSWR are printed at the top
of the screen. To save the plot to a PC card, press
use the knob to enter a filename. Press
(Scr Dump) to send the
k5
image to a printer or to the BTS Laptop Utility. Directions will
appear at the top of the screen. Press PRINT and allow the image to
print to the connected device. Then, press PAUSE/CONTINUE.
Press
(Proceed) when you are ready to proceed.
k1
Figure 4-14 Example of a Swept Return Loss Plot Screen
(Save Plot) and
k4
10.The swept return loss results screen app ears with the tes t results. If
the BTS Laptop Utility is in use, this data is collected by the laptop.
If you wish to repeat the test using the same calibrated devices and
test paramete rs, press
press
press
(Disp Plot). To return to the Select Test (Main)Menu,
k3
(Return).
k5
(Repeat). To redisplay the plot screen,
k1
Chapter 4 95
Page 94

Overview of the Test Set’s Built-In Tools
Using the RF Tools Program
Figure 4-15 Example of an Swept Return Loss results screen
Estimating Antenna Return Loss
If you are measuring the return los s of an antenna c onnected to the end
of a known good feed line, you can determine the approximate return
loss of the antenna by subtracting twice the line loss. For example, if
you measure a return loss of 24 dB and the line is known to have 2 dB
loss, the estimated return loss of the antenna is 20 dB (since there is a
total of 4 dB of loss from the feed line). For this estimate to be correct,
the coaxial line and connect ors must have a much s maller l oss t han t he
total return loss.
Specifications
• Frequency Range: 0.4-1000 MHz, 1.7-2.0 GHz
• Swept Signal Level: -54 dBm to +10 dBm
• Swept Return Loss Accuracy: +/- 2dB +/--10% of reading, for
readings between 0 dB and 30 dB
96 Chapter 4
C:\Spk\Ref\RefGuideRevE\Tools.fm
Page 95

Overview of the Test Set’s Built-In Tool s
Using the RF Tools Program
Cable Fault
Measuremen t Description
A frequency-swept signal is tra nsmitted from the DUPLEX OUT port of
the Test Set through a resistive power divider to the cable-under-test.
The signals reflected from fault s in the cable ar e combined in t he power
divider with th e transmitted signal and received at the ANT IN port.
The changing interference of the transmi tted and reflected sig nals, over
the swept frequency band, conta ins information about the distance to
one or more faults. The software uses a Fast Fourier Transform (FFT)
to convert the frequency domain into the t ime domain. The informat ion
in the time domain can be used to find the physical distances. The
distance displayed on the Test Set’s CRT is the physical distance to the
fault with correction for the velocity factor of the cabl e. This test allows
the operator to identify, characterize, and isolate potential problem
locations by viewing it in units of distance.
NOTE
Test Signal Can Cause Interference
When testing cables attached to antennas, test signals will b e radiat ed.
Verify that the signal used for the test cannot result in interference to
another antenna.
Chapter 4 97
Page 96

Overview of the Test Set’s Built-In Tools
Using the RF Tools Program
Making the Measurement
1. Select Cable Fault from the Select Test (Main) Menu. The Cable
Fault Information menu will appear.
Figure 4-16 S el ec ti n g th e Ca ble F a u lt M e a sur em e n t
Select Main Menu
Cable Fault Measurement
2. Position the cursor at Sweep center frequency (MHz) and select.
A Choices menu appears.
• 505 MHz - Use this center frequency for high resolution, short
range cable tests. The cable lengths can range from 10 to 1000 ft.
• 850 MHz - Use this center frequency for cable tests at cellular
frequencies. This should be used for frequency sensitive devices,
such as filters, and has a cable length range of 150 to 1000 ft.
• 1850 MHz - Use this center frequency for cable tests at PCS
frequencies. This should also be used for frequency sensitive
devices and has a cable length range of 150 to 1000 ft.
3. Position the cursor at Cable length and enter the appropriate
value.
98 Chapter 4
C:\Spk\Ref\RefGuideRevE\Tools.fm
Page 97

Overview of the Test Set’s Built-In Tool s
Using the RF Tools Program
NOTE
The greatest accuracy is obtained when you enter a cable length
slightly greater than the cabl e length begin tested. If you are not sure of
the cable length, enter a value 1.5 times the estimated length.
Depending on the return loss of the antenna or device at the end of the
cable, you may see a high relative mismatch displayed at the actual
length of the cable. For example, a 50 foot cable was tested to generate
the plot in Figure 4-18 on page 101.
4. Position the cursor at Cable length units. Pressing the knob
toggles the selection between feet and meters.
5. Position the cursor at Cable class and select it. A Choices menu
appears allowing selection of Heliax, RG, and custom options. Select
the appropriate cable class. (They can also be selected by pressing
(HELIAX), k3(RG), or k5(Custom).
k1
6. The next menu varies depending on Cable class:
•If Heliax is selected: Position the cursor at Cable type and
select. A Choices menu appears with foam, air, and flex of
varying thickness. Use the knob to select the desired cable type.
•If RG is selected: Position the cursor at Cable type with the
example [RG 58/U = 58] and select.
•If Custom is selected:
a. Position the cursor at Cable velocity propagation const
and select it. Enter the appropriate value. Cables that use
polyethylene dielectric typically have a propagation velocity of
0.66, cables that use a teflon dielectric typically have a
propagation velocity of 0.70. The propagation velocity must be
a value between 0 and 1.
b. Position the cursor at Cable atten. dB/100 ft. (or
meters) at 500 MHz and select it.
c. If the cable attenuation is unknown, enter 0 dB p er 100 feet (or
meters). Entering 0 dB/100 will produce return loss values
lower than actual, but fault distance can be accurately
detected.
(Begin Tst).
7. Press
k1
Chapter 4 99
Page 98

Overview of the Test Set’s Built-In Tools
Using the RF Tools Program
Figure 4-17 Cabl e Fau lt Setu ps
ANT IN
Calibration Setup
AUDIO OUT
AUDIO IN
LO
HI
EXT SCOPE
VIDEO
ANALOG
SCOPE
TRIG IN
MONITOR
IN
ANT IN DUPLEX OUT
OUT
OUT
8935
16X
FRAME
CHIP CLOCK
CHIP CLOCK
SECOND
CLOCK
1.2288
19.6608
SYNC IN
OUT
MHz OUT
MHz OUT
MODULATION
DUPLEX OUT
Resistive Splitter
OUT OUT
50 Ohm
Termination
8. A setup screen appear s with a diagram of the necessary connections
Measurement Setup
EVEN
BASEBAND OUT
PARALLEL PORT 15
SERIAL 9
DATA
PARALLEL PORT 16
SERIAL 10
IN
QI
TRIGGER
QUALIFIER
IN
SERIAL 11
RF IN/OUT
10 MHz
EXT
REF OUT
REF IN
ANT IN
AUDIO OUT
ANALOG
SCOPE
MODULATION
MONITOR
IN
OUT
8935
ANT IN DUPLEX OUT
DUPLEX OUT
AUDIO IN
LO
HI
EXT SCOPE
VIDEO
TRIG IN
OUT
16X
FRAME
CHIP CLOCK
CHIP CLOCK
CLOCK
1.2288
19.6608
OUT
MHz OUT
MHz OUT
Resistive Splitter
IN
Attach device to
be tested.
BASEBAND OUT
DATA
IN
QI
EVEN
TRIGGER
SECOND
QUALIFIER
10 MHz
SYNC IN
IN
REF OUT
OUT OUT
IN
PARALLEL PORT 15
PARALLEL PORT 16
EXT
REF IN
SERIAL 9
SERIAL 10
SERIAL 11
RF IN/OUT
(see Figure 4-17). It is very important that the power divider is a
2-way resistive device. Press
(Proceed) or the knob after the
k1
hardware is con n e cted.
cablef.eps
9. After the Test Set has finished calibrating, a second diagram
appears on the screen. Connect the cable to be tested. Press
(Proceed) or the knob to continue.
k1
10.The plot screen appears similar to Figure 4-18 on page 101. To save
the plot to a PC card, press k4 (Save Plot) and use the knob to enter
a filename. Press
(Scr Dump) to send the image to a printer or to
k5
the BTS Laptop Utility. Directions will appear at the top of the
screen. Press PRINT and allow the image to print to the connected
device. Then, press PAUSE/CONTINUE. Press
(Proceed) when
k1
you are ready to continue.
100 Chapter 4
C:\Spk\Ref\RefGuideRevE\Tools.fm
Page 99

Overview of the Test Set’s Built-In Tool s
Figure 4-18 Example of a Cable Fault Plot Screen
11.The cable fault result screen appears with the test results (see
Figure 4-19 for an example). If the BTS Laptop Utility is in use, this
data is collected by the laptop. If you wish to repeat the test using
the same calibrated devices and test parameters, press
To re-display the plot screen, press
Select Test (Main) Menu, press
k3
k5
Using the RF Tools Program
(Repeat).
k1
(Disp Plot). To retu rn to the
(Return).
Figure 4-19 Example of a Cable Fault Results Screen
Chapter 4 101
Page 100

Overview of the Test Set’s Built-In Tools
Using the RF Tools Program
Typical cable fault return loss measurements
Return loss is a ratio of input power to reflected power. For example, if
100 W a tts was applied t o a cabl e and 10 Watts was ret urned, the retur n
loss is 10 dB (10 log(100/10)). In the same example, if 1 Watt was
returned, the return loss is 20 dB (10 log(100/1)). Typical return loss
measurements for the cable loss test are listed below:
• Open-Circuit Cable = 0 dB (ignoring line loss)
• Short-Circuit Cable = 0 dB (ignoring line loss)
• 50-Ohm Terminated Cable = 40 to 60 dB
• Antenna = 10 to 20 dB (in the frequency band for which it was
designed)
Return loss measurements greater than 20 dB should be considered
good.
Cable Fault Performance
Measurements of the cable fault location can typically be made up to
500 feet on low-loss cables and 300 feet on higher-loss cables.
Resolution of the fault location is approximately 0.4 feet for cable
lengths up to 50 feet and then linearly increases to 4 feet for a 500 foot
cable.
Specifications
• Cable Types Tested: Helia x, RG, Cust o m
• Cable Length Range: 0 to 1000 feet, 0 to 300 meters
• Distance accuracy: +/-5% of the cable length value entered by the
user
Replot Data Files
This utility allows you to easily retrieve and display plots which were
previously stored on an SRAM PC card. One or two plots may be
displayed at one time. No measurements are performed.
102 Chapter 4
C:\Spk\Ref\RefGuideRevE\Tools.fm
 Loading...