

Page 1

Agilent 86140BSeries
Optical Spectrum Analyzer
User’s Guide
Page 2
© Copyright
Agilent Technologies 2001
All Rights Reserved. Reproduction, adaptation, or translation without prior written
permission is prohibit ed ,
except as allowed under copyright laws.
Agilent Part No. 86140- 90 06 8
Printed in USA
January 2002
Agilent Technologies
Lightwave Division
3910 Brickway Boulevard,
Santa Rosa, CA 95403, USA
Notice.
The information contained in
this document is subject to
change without notice. Companies, names, and data used
in examples herein are fictitious unless otherwise noted.
Agilent Technologies makes
no warranty of any kind with
regard to this material, including but not limited to, the
implied warranties of merchantability and fitness for a
particular purpose. Agilent
Technologies shall not be liable for errors contained herein
or for incidental or consequential damages in connection with the furnishing,
performance, or use of this
material.
Restricte d Ri ghts Legend.
Use, duplication, or disclosure by the U.S. Government
is subject to res tric tio ns as se t
forth in subparagraph (c) (1)
(ii) of the Rights in Technical
Data and Computer Software
clause at DFARS 252.227-7013
for DOD agencies, and subparagraphs (c) ( 1) and (c) (2 )
of the Commercial Computer
Software Restricted Rights
clause at FAR 52.227-19 for
other agencies.
Warranty.
This Agilent Technologies
instrument product is warranted against defects in
material and workmanship for
a period of one y ear f rom date
of shipment. During the warranty period, Agilent Technologies will, at its option, either
repair or replace products
which prove to be defective.
For warranty service or repair,
this product mu st be re tur ned
to a service facility designated by Agilent Technologies. Buyer shall prepay
shipping charges to Agilent
Technologies and Agilent
Technologies shall pay shipping charges to return the
product to Buyer. However,
Buyer shall pay all shipping
charges, duties, and taxes for
products returned to Agilent
Technologies from another
country.
Agilent Technologies warrants that its software and
firmware designated by Agilent Technologies for use with
an instrument will execute its
programming instructions
when properly installed on
that instrument. Agilent Technologies does not warrant that
the operation of the instrument, or software, or firmware
will be uninterrupted or errorfree.
Limitation of Warranty.
The foregoing warranty shall
not apply to defects resulting
from improper or inadequate
maintenance by Buyer, Buyersupplied software or interfacing, unauthorized modification or misuse, ope ra tio n
outside of the environmental
specifications for the product,
or improper site preparation
or maintenance.
No other warranty is
expressed or implied. Agilent
Technologies specifically disclaims the implied warranties
of merchantability and fitness
for a particular purpose.
Exclusive Remedies.
The remedies provided herein
are buyer's sole and exclusive
remedies. Agilent Technologies shall not be liable for any
direct, indirect, speci a l, inci-
dental, or consequential damages, whether based on
contract, tort, or any other
legal theory.
Safety Symbols.
CAUTION
The caution sign denotes a
hazard. It calls attenti on to a
procedure which, if not correctly performed or adhered
to, could result in damage to
or destruction of the product.
Do not proceed beyond a caution sign until the indicated
conditions are fully understood and met.
WARNING
The warning sign denotes a
hazard. It calls attenti on to a
procedure which, if not correctly performed or adhered
to, could result in injury or
loss of life. Do not proceed
beyond a warning sign until
the indicated conditions are
fully understood and met.
The instruction manual symbol. The product is marked wit h this
warning symbol when
it is necessary for the
user to refer to the
instructions in the
manual.
The laser radiation
symbol. This warning
symbol is marked on
products which have a
laser output.
The AC symbol is used
to indicate the
required nature of the
line module input
power.
| The ON symbols are
used to mark the positions of the instrument
power line switch.
The OFF symbols
are used to mark the
positions of the instrument power line
switch.
The CE mark is a registered trademark of
the European Community.
The CSA mark is a registered trademark of
the Canadian Standards Association.
The C-Tick mark is a
registered trademark
of the Australian Spectrum Management
Agency.
This text denotes the
ISM1-A
instrument is an
Industrial Scientific
and Medical Group 1
Class A product.
Typographical Conventions.
The following conventions are
used in this book:
Key type for keys or text
located on the keyboard or
instrument.
Softkey type for key names that
are displayed on the instrument’s screen.
Display type for words or
characters displayed on the
computer’s screen or instrument’s display.
User type for words or charac-
ters that you type or enter.
Emphasis type for words or
characters that emphasize
some point or that are used as
place holders for text that you
type.
ii
Page 3

General Safety Considera tions
General Safety Considerations
This product has been designed and tested in accordan c e w ith the standards
listed on the Manufacturer’s Declaration of Conformity, and has been supplied
in a safe condition. The documentation contains infor mation and warnings
that must be followed by the user to ensure safe operation and to maintain the
product in a safe condition.
Install the ins trument according to the enclosure protection provided.
This instrument does not protect ag a inst the ingress of wa te r.
This instrument protects against finger access to hazardous parts within the
enclosure.
WARNI NG If this product is not used as specified, the protection provided by the
equipment could be imp aired. This product must be used in a normal
condition (in which all means for protection are intact) only.
WARNI NG No operator serviceable parts inside. Refer servicing to qualified
service personnel. To prevent electrical shock do not remove covers.
WARNI NG This is a Safety Class 1 Product (provided with a protectiv e earthing
ground incorporated in the power cord). The mains plug shall only be
inserted in a socket outlet provided with a protective earth contact.
Any interruption of the protective c o nductor inside or outside of the
instrument is likely to make the instrument dangerous. Intentional
interruption is prohi bited.
WARNI NG To prevent electrical shock, disconnect the instrument from mains
before cleaning. Use a dr y cloth or one slightly dampened with water
to clean the external case parts. Do not attempt to clean internally.
CAUTION Fiber-optic connectors are easily damaged when connected to dirty or
damaged cables and accessories. The Agilent 86140B series’s fr ont-pa nel INPUT
connector is no exception. Whe n y o u use im proper cleaning and handling
techniques, you risk expensive instrument repairs, damaged cables, and
compromised measurements. Before you connect any fiber-optic cable to the
Agilent 86140B se ri es , re fe r to “Cleaning Connection s for Accurate
Measurements” on page 6-8.
iii
Page 4

General Safety Considera tions
CAUTION This product i s designed for use in Installation Category II and Pollution
Degree 2 per IEC 61010- 1C and 664 respectively.
CAUTION Do not use too much liquid in cleaning the optical spectrum analyzer. Water can
enter the fron t-panel keyboard, damaging sensitive electronic compon ents.
CAUTION VENTILA TION RE QUIREMENTS: When installing t he product in a cabinet, the
convection into and out of the product must not be restricted. The ambient
temperature (outside the cabinet) must be less than the maximum operating
temperatur e of the product by 4
° C for every 100 watts dissipated in the
cabinet. If the total power dissipated in the cabinet is gr eater than 800 watts,
then forced convection must be used.
CAUTION Install the instrument so that the detachable power cord is readily identifiable
and is easily reached by the operator. The detachable power cord is the
instrument disconne cti ng d evice. It disconnects the mains circui t from the
mains supply befo re other parts of the instrument. The front pane l switch is
only a standby switch and is not a LINE switch. Alternatively, an externally
installed switch or circuit breaker (which is readily identifiable and is easily
reached by the operator) may be used as a disconnecting device.
CAUTION Always use the three-prong AC power cord supplied with this instrument.
Failure to ensure adeq uate earth grounding by not us ing this cord may cause
instrument damage .
CAUTION Do not connect ac power until you have verified the line voltage is correct as
described in “Line Power Requirements” on page 1-11. Dam a ge to the
equipment could result.
CAUTION This instrument has autoranging line voltage input. Be sure the supply voltage
is within the specified range.
CAUTION The Agilent 86140B, 86141B, 86144B, 86146B and 86142B Option 004/005/006
EELED sources contain an IEC Class 1 LED, according to IEC 60825.
CAUTION Use of controls or adjustment or performance of procedures othe r than those
specified herein may result in hazardous radiation exposure.
iv
Page 5

Contents
1 Getting Started
Product Overview 1-2
Setting Up the Analyzer 1-8
Making a Measurement 1-13
The Menu Bar 1-17
The Softkey Pane ls 1 - 1 8
Laser Safety Considerations 1-29
Product Options and Accessories 1-30
2 Using the Instrument
Setting Up Measurements 2-2
Calibrating Wavelength Measurements 2-14
Saving, Recalling, and Managing Fi le s 2- 19
Analyzing Measurement Data 2-27
Analyzer Operating Mo des 2-30
3 Function Reference
4 Remote Front Pan el Operation
Remote Front Panel 4-2
5 Status Listings
Overview 5-2
Error Reporting Behavior 5-4
SCPI-Defined Errors 5-5
OSA Notices 5-1 6
OSA Warnings 5-17
Application -Specific Warnings 5-29
OSA Status Errors 5-35
OSA Errors 5-36
Firmware Errors 5-38
6 Maintenance
Changing the Printer Paper 6-2
Printer Head Cleaning Procedure 6-4
Cleaning Connections for Accurate Measurements 6-8
Returning the Instrument for Service 6-21
Contents-1
Page 6

Contents
7 Specifications and Regulatory Information
Definition of Terms 7-3
Specifications 7-5
Regulatory Information 7-21
Declaration of Conformity 7-22
Contents-2
Page 7

1
Product Overview 1-2
Setting Up the Analyzer 1-8
Making a Measurement 1-13
The Menu Bar 1-17
The Softkey Pane ls 1-18
Laser Safety Considerations 1-29
Product Options and Accessories 1-30
Getting Started
Page 8

Getting Started
Product Overview
Product Overview
The 86140B series of optical spectrum analy z er s provide fast, accurate, and
comprehensive measurement capabilities for spectral analysis.
• Full-featured SCPI c omm a nd s f or pr ogramming instruments over LAN
• Display-off feature for making faster measurements
• Remote file saving and printing for outputting measure m ent results
• Filter mode for accurate and flexible measurements
• Built-in applications for accelerating test times
Filter Mode The Agilent 861 44B and 86146B filter mode allows single dense wavelength
division mul ti plexing (DWDM) to be isolated and routed to external test
equipment. The filter mode capability is built-in to internal applications to
allow for fast and easy implementation of channel dropping. For Agilent
86146B instruments, this mode also allows the ability to measure time resolve
chirp (TRC).
Built-in
Applications
Built-in applications allow fast, repeatable measurements for WDM systems,
lasers, amplifiers, a nd pas sive components. These applications can be added
through a firmware upgrade.
WDM Application
This application allows you to measure DWDM sub-system components, (such
as transmission sub-systems, optical add/drop multiplexers, and multiplexers/
de-multiplexers) for param et er s suc h as opti cal sig nal - to-noise ratio (OSNR),
channel wavelength, channel power, and span tilt.
Passive Component Test Application
This applicati on simplifies the testing of passive c o m p onents, such as fi lte rs,
couplers, and isolators by defining a test plan that measures parameter s such
as insertion and return loss, bandwi dth, and filter shape.
1-2
Page 9

Getting Started
Product Overview
Source Test Application
This application offers automated optical source and laser characterization.
Amplifier Test Application
This applicatio n simplifies the process of characterizin g ga in and noise figure
of optical amplifiers such as EDFA’s, SOA’s and Raman amplifiers.
1-3
Page 10
Getting Started
Product Overview
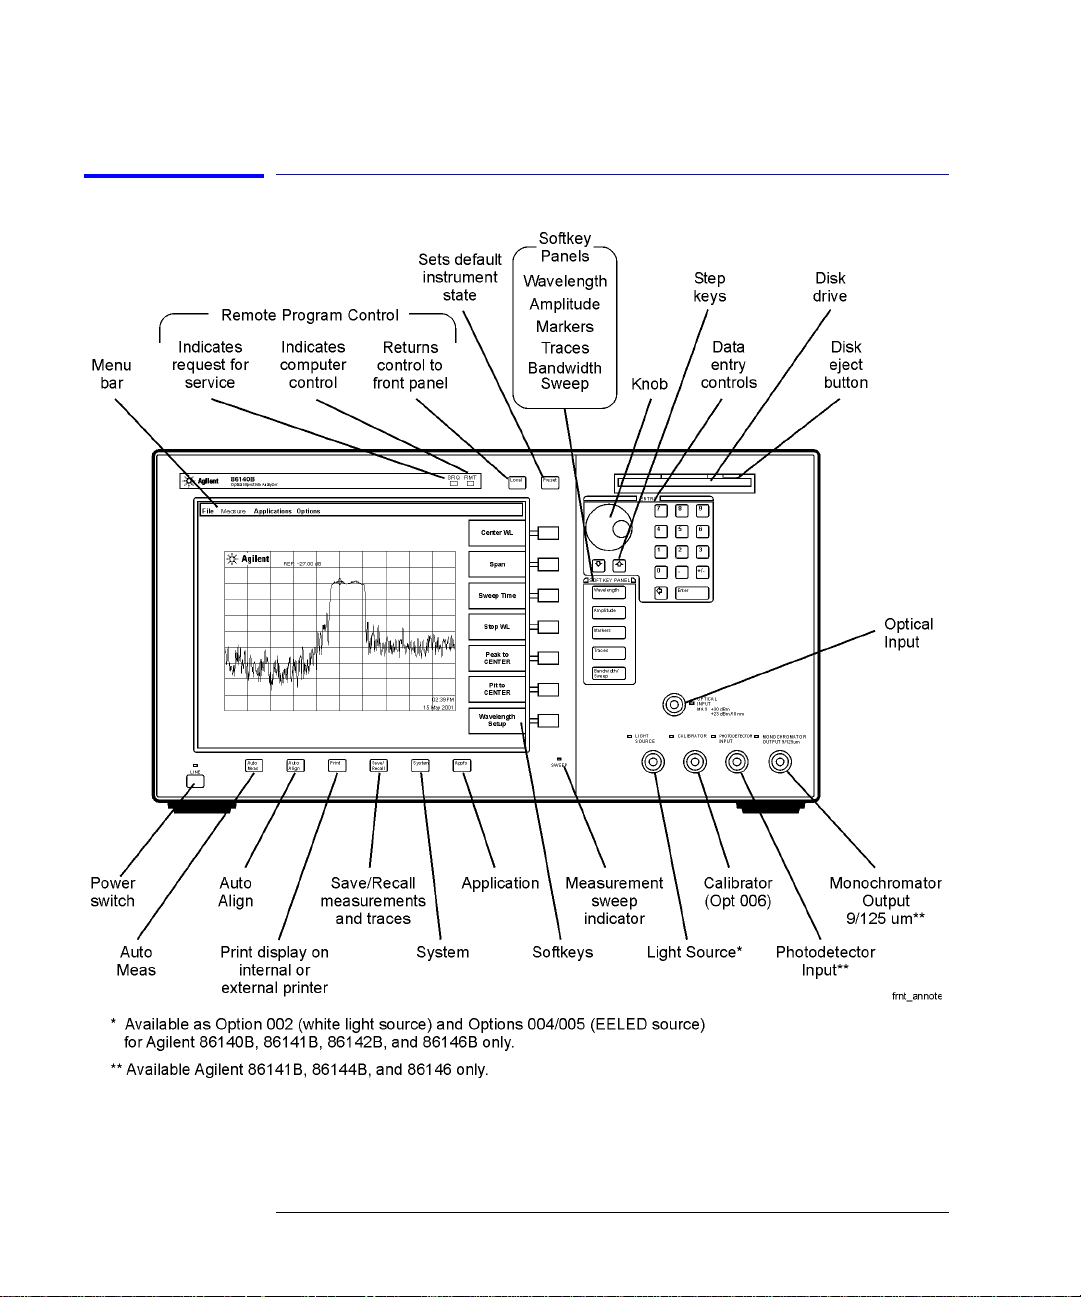
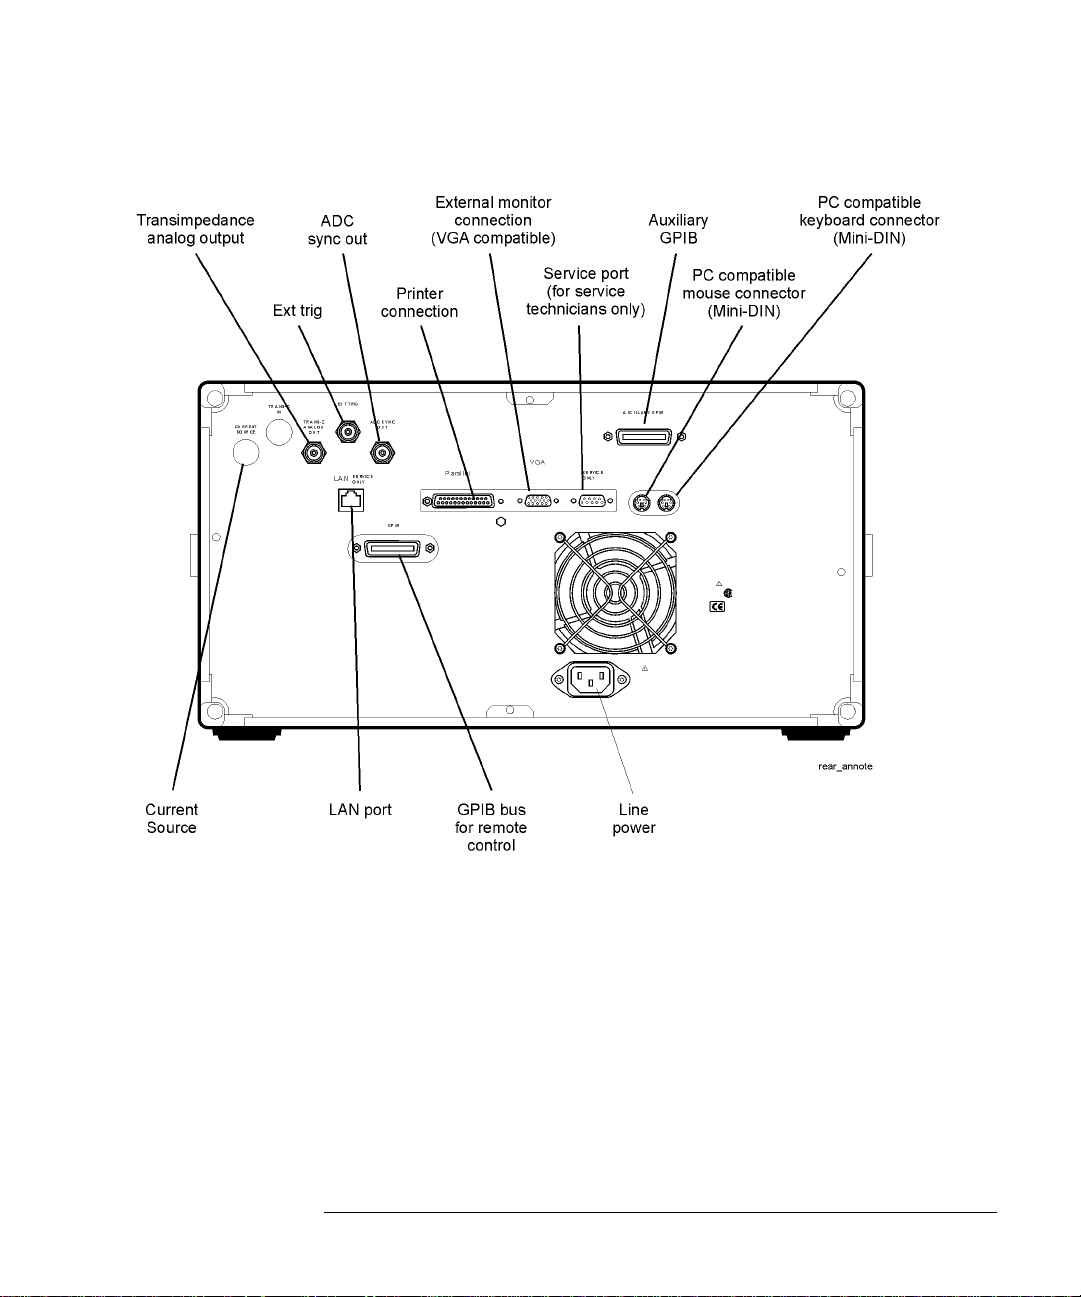
Agilent 86140B Front and Rear Panels
1-4
Page 11
Getting Started
Product Overview
1-5
Page 12

Getting Started
Product Overview
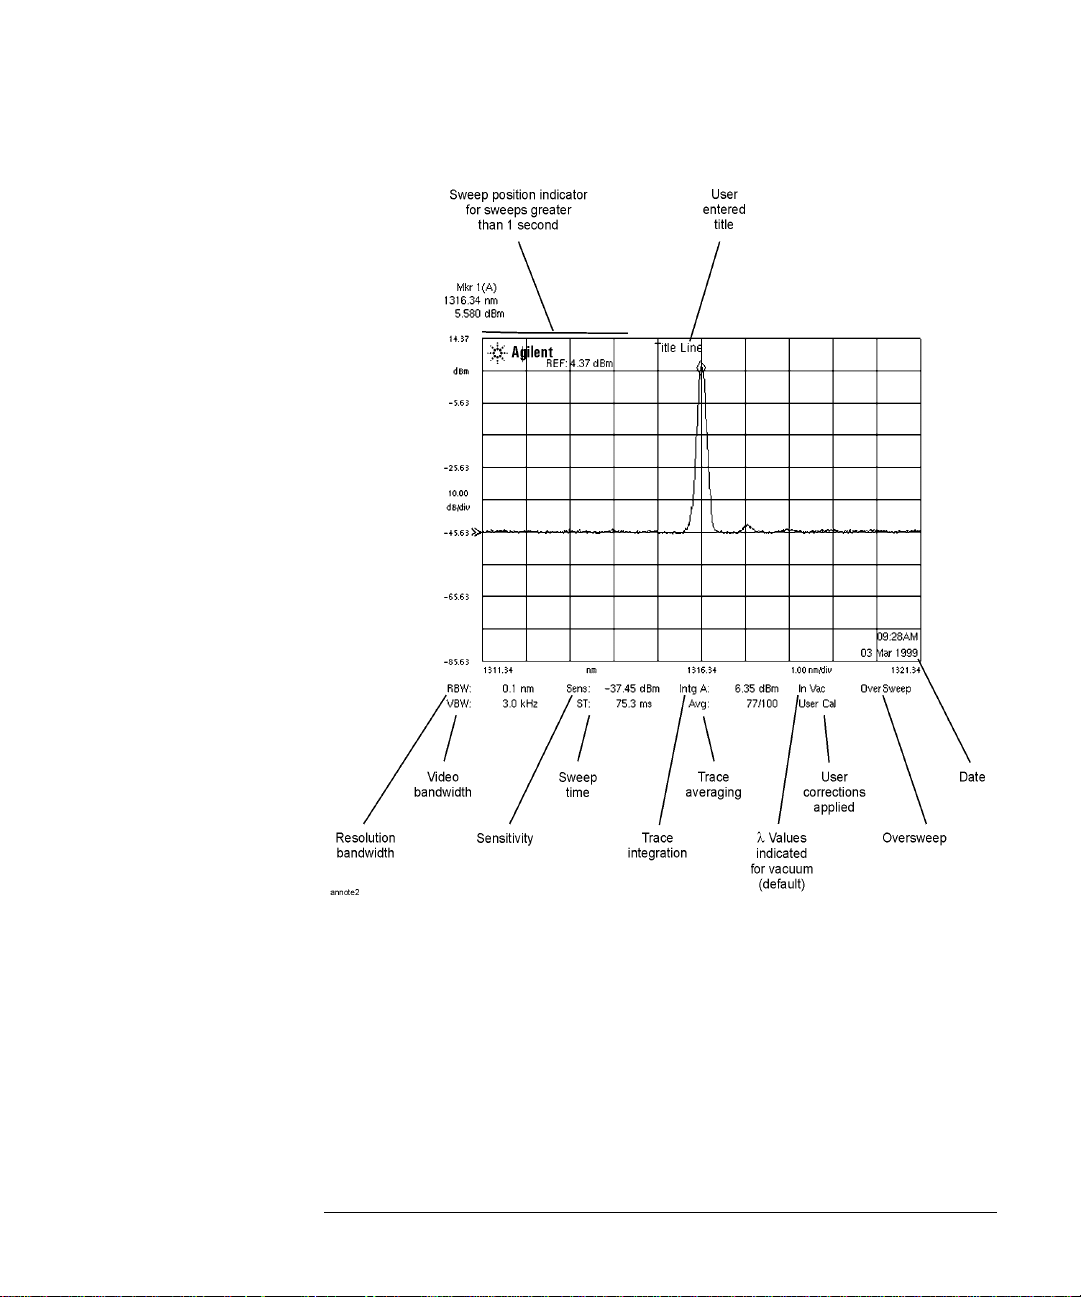
Optical Spectrum Analyzer Display
Figure 1-1. Optical Spectrum An aly zer Display
1-6
Page 13
Getting Started
Product Overview
Figure 1-2. Display Annotations
1-7
Page 14
Getting Started
Setting Up the Ana lyzer
Setting Up the Analyzer
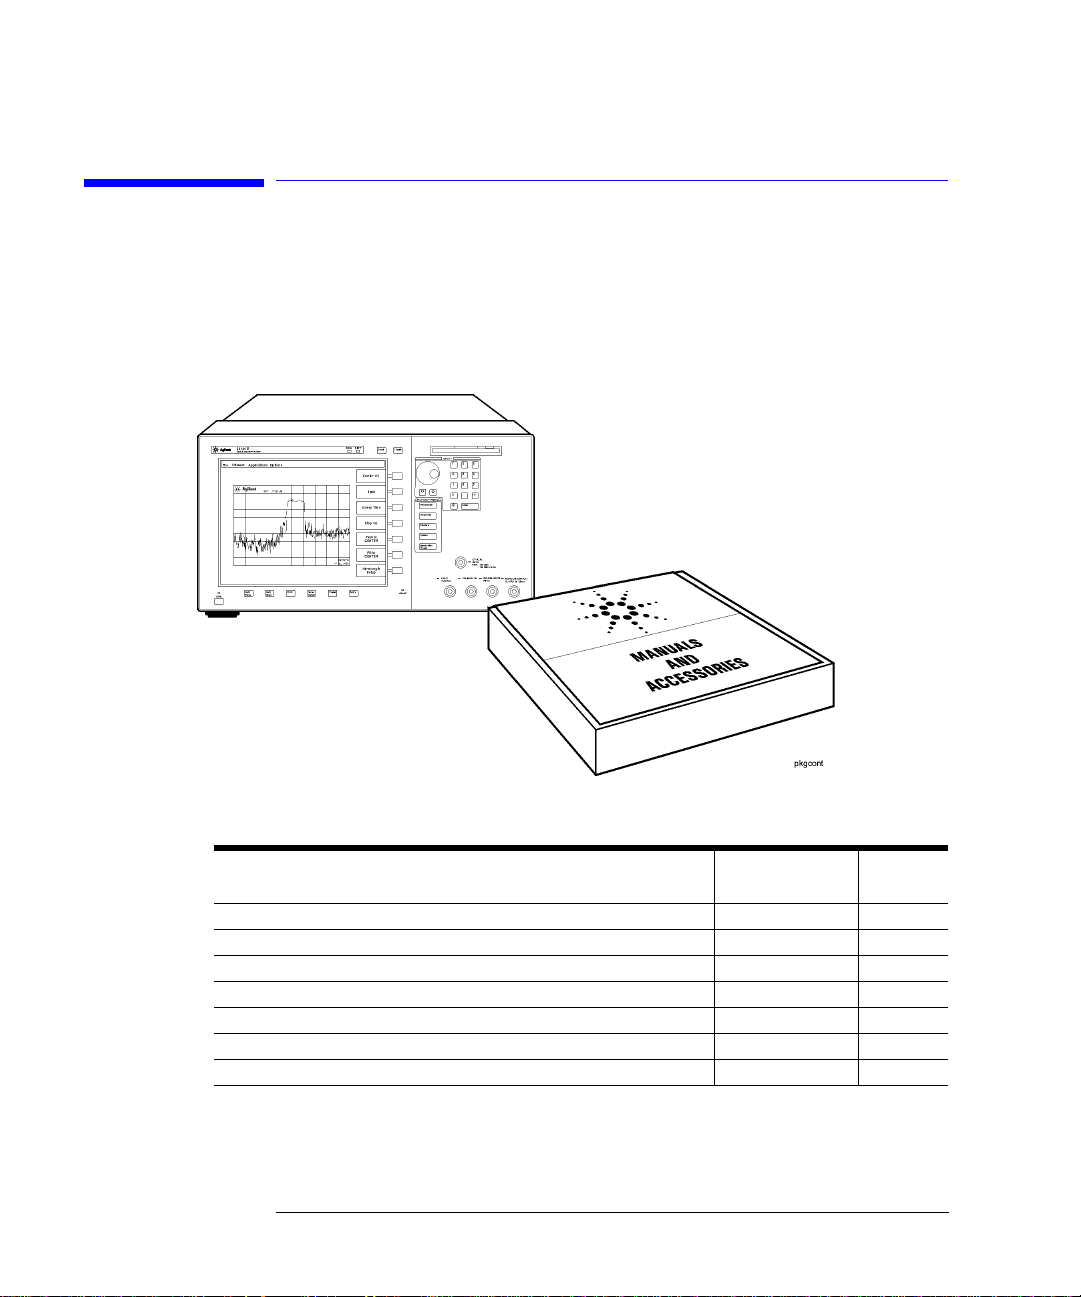
Step 1. Receive and Inspect the Shipment
Table 1-1.Items in a Standard Agilent 86140B Series Shipment
Description Product Number
BNC Cable (24 inches) 8120-1839 1
GPIB Cable 8120-3444 1
FC/PC Dust Cap 1401-0291 2
English User’s Guide Manual 86140-90068 1
Application Guide 86140-90071 1
Programming Guide 86140-90069 1
Quick Start Card 86140-90087 1
1-8
Item
Quantity
Page 15

Getting Started
Setting Up the Analyzer
Inspect the shipping container for damage.
Inspect the instrume nt.
Verify that you received the options and accessories you ordered.
Keep the shipping container and cushioning material until you have inspected
the contents of the shipment for completeness and have checked the optical
spectrum anal yz er mechanical ly and electrical ly.
If anything is missing or de fe ctive, contact your nearest Agile nt Tech nologies
Sales Office. Refer to “Returning the Instrument for Service” on page 6-21. If
the shipment was damaged, contact the carrier, then contact the nearest Agilent Technologies Sales Office. Keep the shipping materials for the carrier’s
inspection. The Agilent Technologies Sales Offi c e wi ll a rra nge for repair or
replacement at Ag ilent Technologies’ option without waiting for claim settl e-
ment.
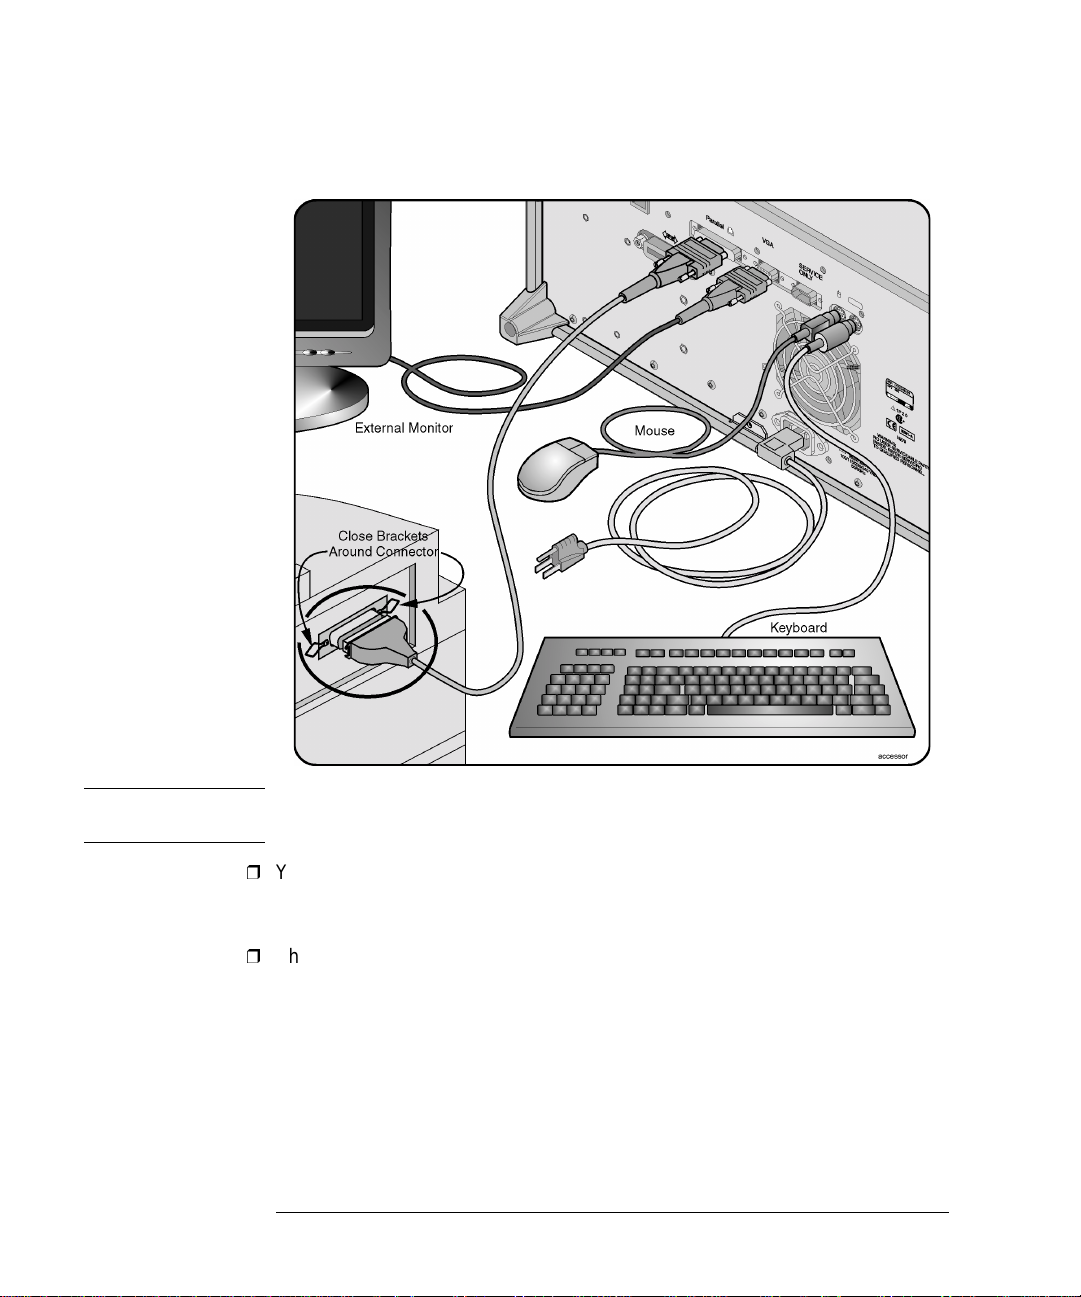
Step 2. Connect Accessories and Power Cord
Although you can operate all instrument functions using only the front-panel
keys, and trackball on portabl e m odels, these accessories make your op tical
spectrum analyzer easier to use. Connect any standard PC-compatible mouse
(or other pointing device), keyboard, or external VGA-comp a t ible display.
1-9
Page 16
Getting Started
Setting Up the Ana lyzer
CAUTION Do not stack other objects on the keyboard; this will cause self-test failures on
power-on.
You can connect a PCL-language printer (for example, an HP1 LaserJet) to the
instrument’s rear panel Parallel connector. Use a parallel Centronics printer cable, such as an HP C2950A (2 m) or HP C2951A (3 m).
The line cord provided is matched by Agilent Technologi es to the country of
origin on the order. Refer to “Accessories” on page 1-31.
1. HP and Hewlett-Packard are U.S. registered trademarks of Hewlett-Packard Company.
1-10
Page 17

Getting Started
Setting Up the Analyzer
Table 1-2. Line Power Requirements
Power 115 VAC: 110 VA MAX. / 60 WATT S MAX. / 1.1 A MAX.
230 VAC: 150 VA MAX. / 70 WATTS MAX. / 0.6 A MAX.
Voltage nominal: 115 VAC / 230 VAC
range 115 VAC: 90–132 V
range 230 VAC: 198–254 V
Frequency nominals: 50 Hz / 60 Hz
range: 47–63 Hz
Step 3. Apply Power to Instrument
Press the power switch at the lower left-hand corner of the front panel.
After a short ini tiali zation p eriod , the dis play wil l look simi lar to the pict ure on
this page.
Allow the instrument to warm up for at least 1 hour.
Step 4. Clean Connectors and Prepare for Measurements
CAUTION Fiber-optic connectors are easily damaged when connected to dirty or
damaged cables and accessories. The front-panel INP UT c o nnector of the
Agilent 86140B series is no exception. When you use improper cleaning and
handling techniques , y o u ri sk expensive instrument repairs, damaged cables,
and compromised measureme nts . Before you connect any fiber-optic cable to
the Agilent 86140B series o ptical spectrum ana lyzer, refer t o “Cleaning
Connections for Accurate Measurements” on page 6-8.
CAUTION A front-panel connector saver is provided with Agilent 86140B series
instruments. Attach the connector saver to the front-panel INPUT connector of
the instrument. You can now make your connections to the connector save r
instead of the instrument. This will help prevent damage to the front-panel
INPUT connector of the instrument. Damage to the front-panel INPUT connector
is expensive in terms of both repair costs and down-time. Use the front-panel
connector saver to prevent damage to the front-panel INPUT connector.
Note
All product specifications apply to measurements made without using the front-panel
connector saver.
After the instrument has warmed up for at least 1 hour, perform an auto align
1-11
Page 18
Getting Started
Setting Up the Ana lyzer
by pressing the fron t panel Auto Align button. This will ensure o ptimal amplitude accuracy, and can correct for any mis-alignment caused by the instrument
shipment.
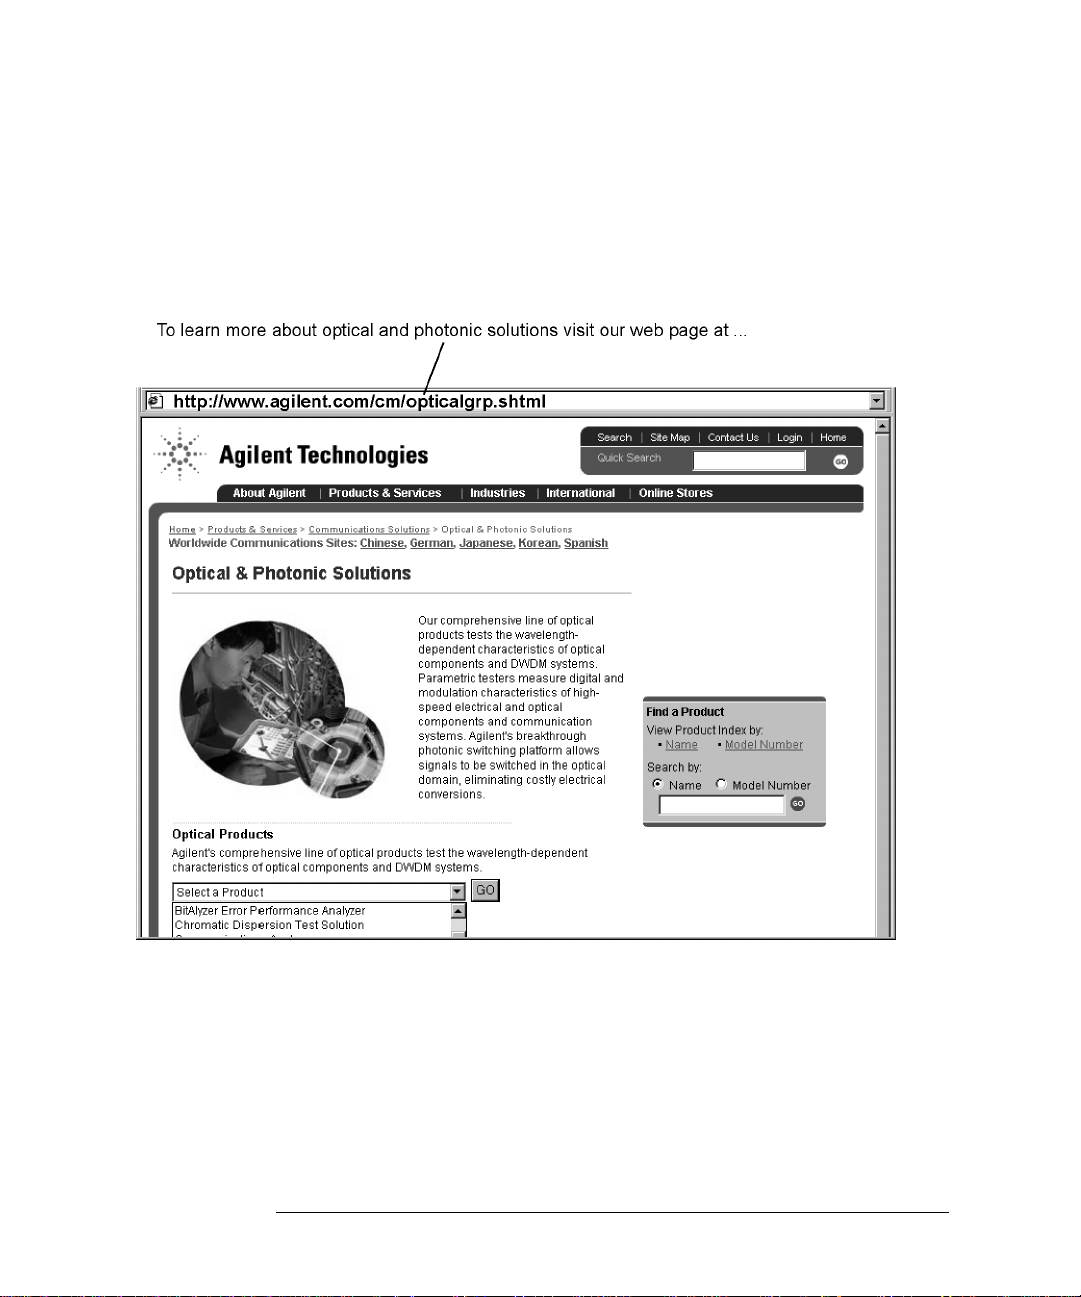
T o learn more about this or any Agilent Technologies product, visit our web
site at http://www.agilent.com/ c m / in dex.shtml. Or, to learn more about fiber
optic test equipment, follow this path from the address listed:
1 Click Communications Produ cts.
2 Click Lightwave Measu rement Solutions.
3 Click Communications Solutions and then select Optical and Photonic
Solutions.
1-12
Page 19
Getting Started
Making a Measureme nt
Making a Measurement
This procedure will introduce you to the A gile nt 86140B series optical spectrum analyzer front panel controls. By following this procedure you will do the
following:
• Perform an auto alignment
• Perform a peak search
• Use a delta marker
• Print the display
Refer to “The Menu Bar” on page 1-17 and “The Softkey Panels” on page 1-18.
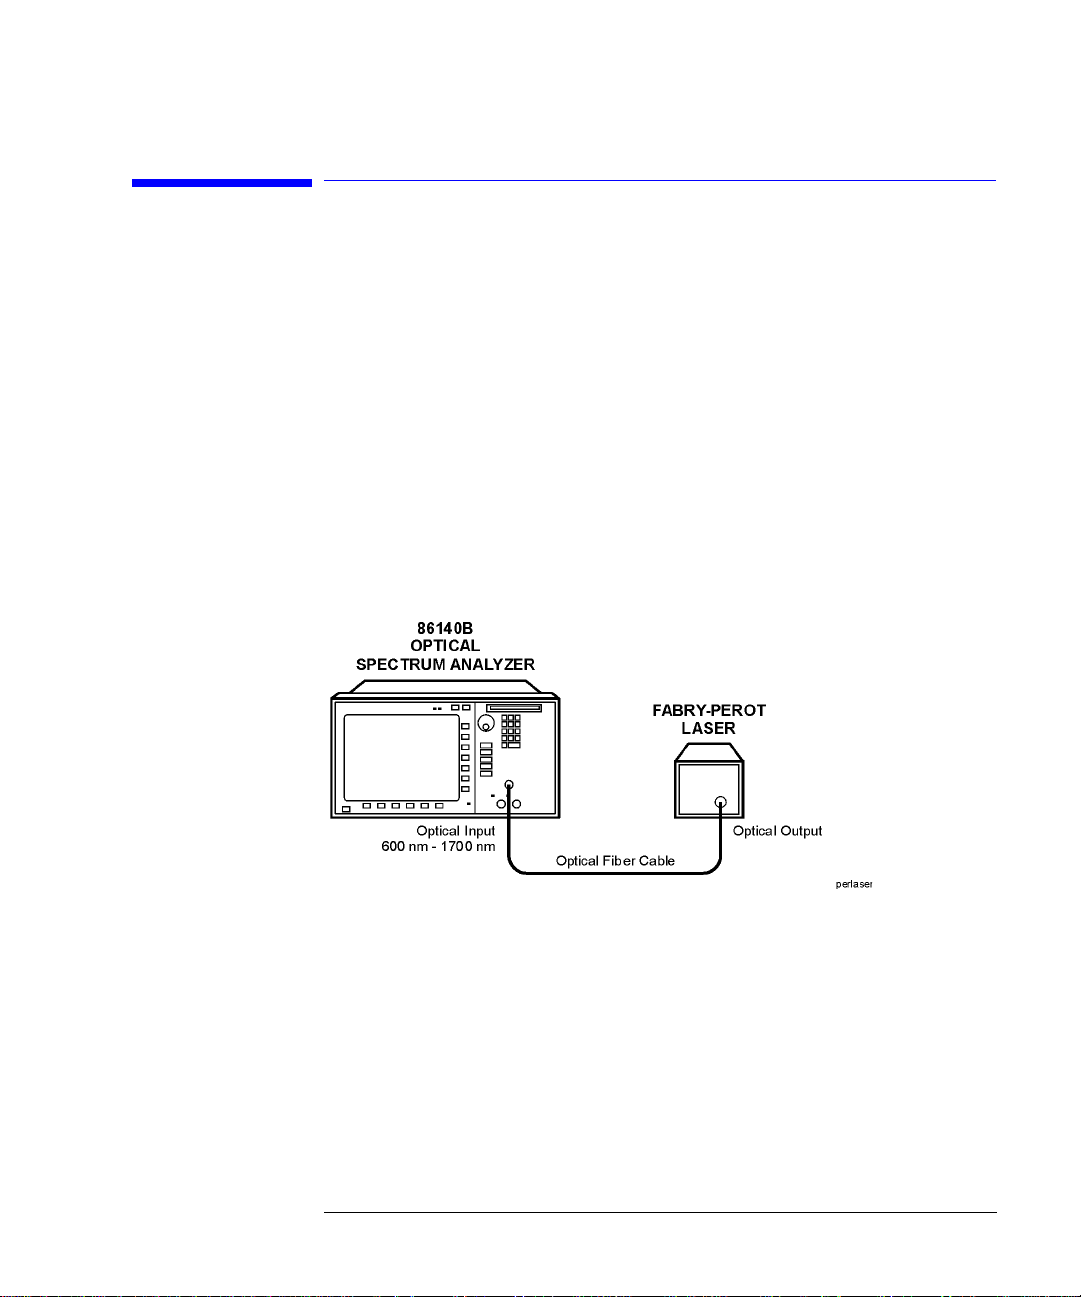
Instrument setup
A source signal must be present at the input of the optical spectrum analyzer.
In this procedure a Fabry-P erot laser is used as the source . You ca n use
another source or the optional 1310/1550 nm
used, the displa y w ill differ from tho s e sh ow n.
To set the OSA to a known state
• Press the front-panel Preset key to set the instrument to a known state. For
a complete description of preset conditions, see page 3-65.
EELED. If another source is be ing
1-13
Page 20

Getting Started
Making a Measurement
To perform an Auto Align
For maximum amplitude accuracy, perform an automatic alignment whenever
the optical spectrum analyzer has been moved, subjected to large temperature
changes, or fol lowing warm-up. See “Auto Align” on page 3-10 for more information.
1 Connect a fiber from the source to the input connector of the optical spectrum
analyzer. Be sure to follow the good connector practices described in “Cleaning
Connections for Accurate Measurements” on page 6-8.
2 Enable the source. Pre ss Markers > Peak Search to find the pe a k signal power.
3 Press the front-panel Auto Align key to optimize the detection of the incoming
signal. This takes a few mo ments to complete.
To perform a peak search
4 Press the front-panel Auto Meas key to locate and zoom-in on the si gnal. Plea se
wait until the Auto Measure routine is complete. A marker is placed on the peak
of the displayed signal.
Trace with normal marker.
1-14
Page 21
Getting Started
Making a Measureme nt
To zoom in on the signal
Press the Span softkey and then use the knob, step keys, or numeric keypad to
zoom in on the signal.
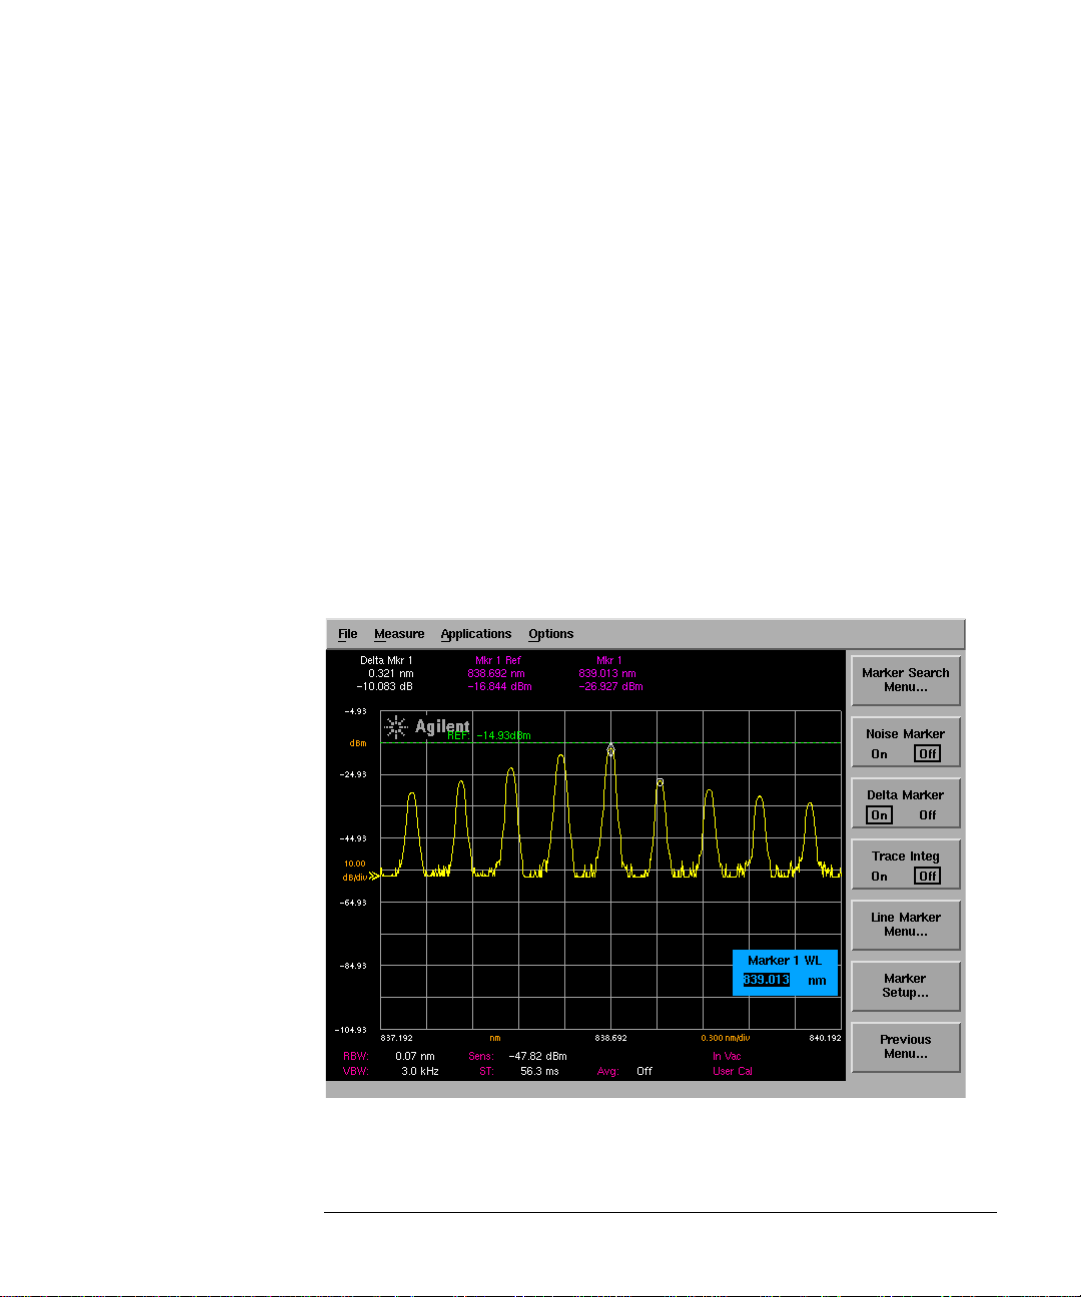
Using the delta marker
The optical spectrum analyzer has four types of markers; normal markers,
bandwidth markers, delta markers and noise markers. The marker currently
being displayed is a normal marker. In the next step we will use it as a delta
marker.
5 Press the front- panel Markers key.
6 Press the More Marker Functions.... softke y.
7 Press the Delta Marker softkey to activate the delta marker and the act iv e
function area.
8 Use the knob, step keys or nu meric entry pad to move the delta marker.
9 The reference marker remains station a ry.
Trace with delta marker.
1-15
Page 22

Getting Started
Making a Measurement
Printing the display
10 Press the Print key to print a copy of the display. The output will be sent to the
internal or external printer, depending on the printer selected.
1-16
Page 23
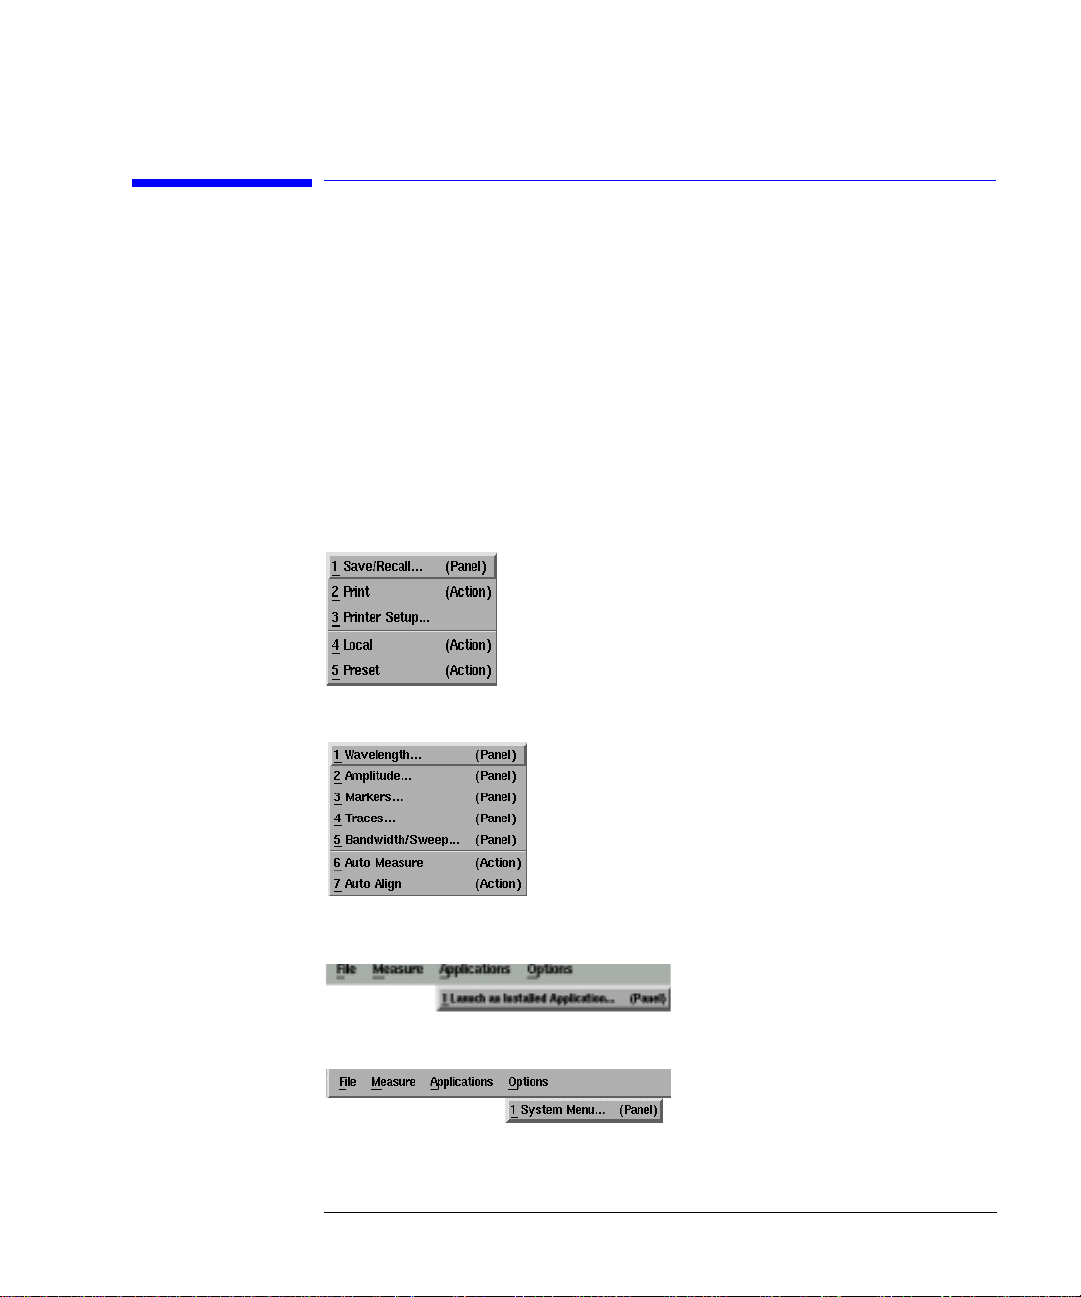
The File Menu
Getting Started
The Menu Bar
The Menu Bar
The Menu bar includes the File, Measure, Application, and Options drop-down
menus. Each menu selection includes a descriptive label.
(Action) Indicates the selection will perform an action such as
making a measurement or printing the display.
(Panel) Indicates th e selection will open a softkey panel.
The Measure
Menu
The Applications
Menu
The Options Menu
1-17
Page 24

Getting Started
The Softkey Pan els
The Softkey Panels
You can acce ss the soft key pane l s using eithe r the front-panel keys or the
menu bar. This section includes brief descriptions of the following menus. See
Chapter 3, “Function Reference” for additional information on each of the
OSA functions.
The Amplitude Menus 1-19
The Applications Menus 1-20
The Bandwidth/Sweep Menus 1-22
The Markers Menus 1-23
The Save/Recall Menus 1-24
The Systems Menus 1-25
The Traces Menus 1-27
The Wavelength Menus 1-28
1-18
Page 25
Getting Started
The Softkey Panels
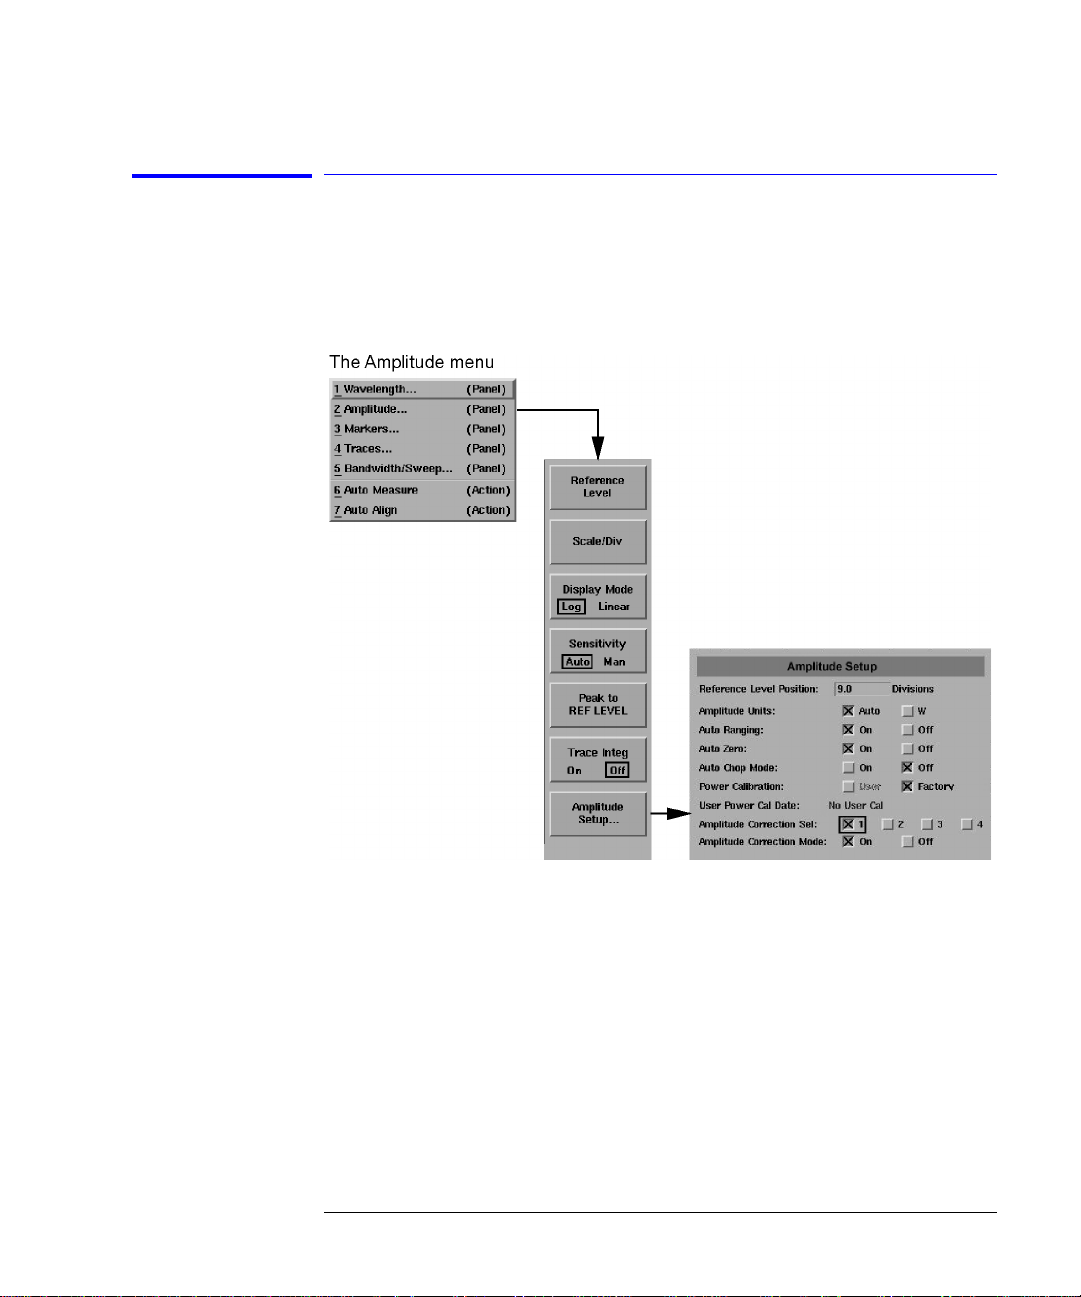
The Amplitude Menus
You can access the Amplitude softkeys using the front-panel Amplitude key or
the Measure menu Ampli tude selection on the menu bar.
1-19
Page 26

Getting Started
The Softkey Pan els
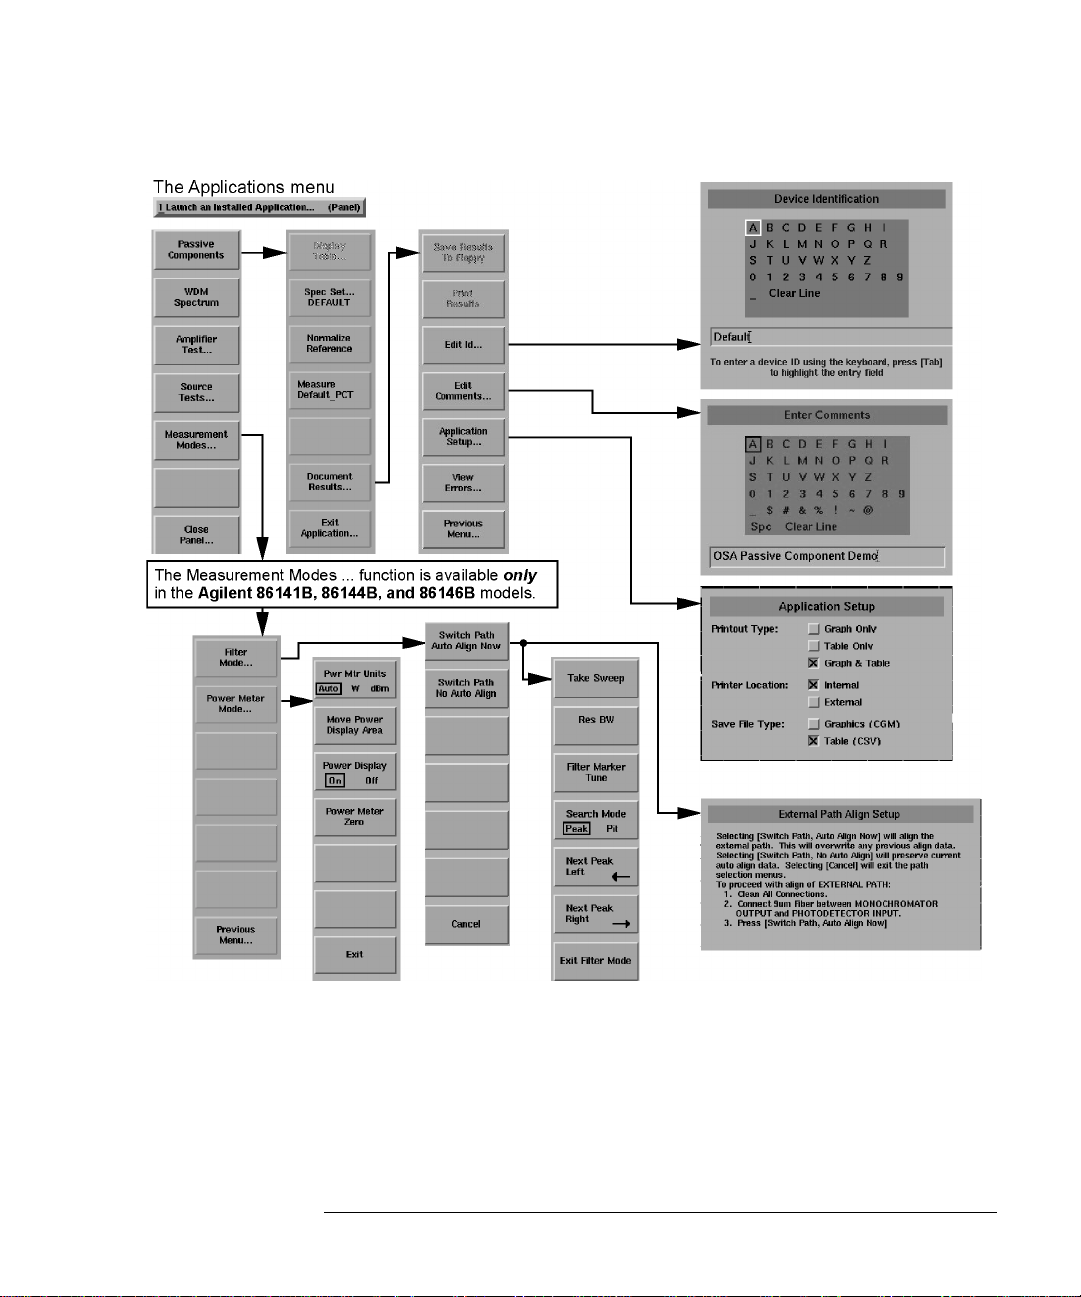
The Applications Menus
You can access the Applications (Appl’s) softkeys by using the front-panel
Appl’s key or the Applications menu Launch an Installed Application section on
the menu bar. For a complete description of the appli cations, refer to the Agilent 86140B Series Measurement Applications User’s Guide that came w it h
your instrument .
1-20
Page 27
Getting Started
The Softkey Panels
1-21
Page 28
Getting Started
The Softkey Pan els
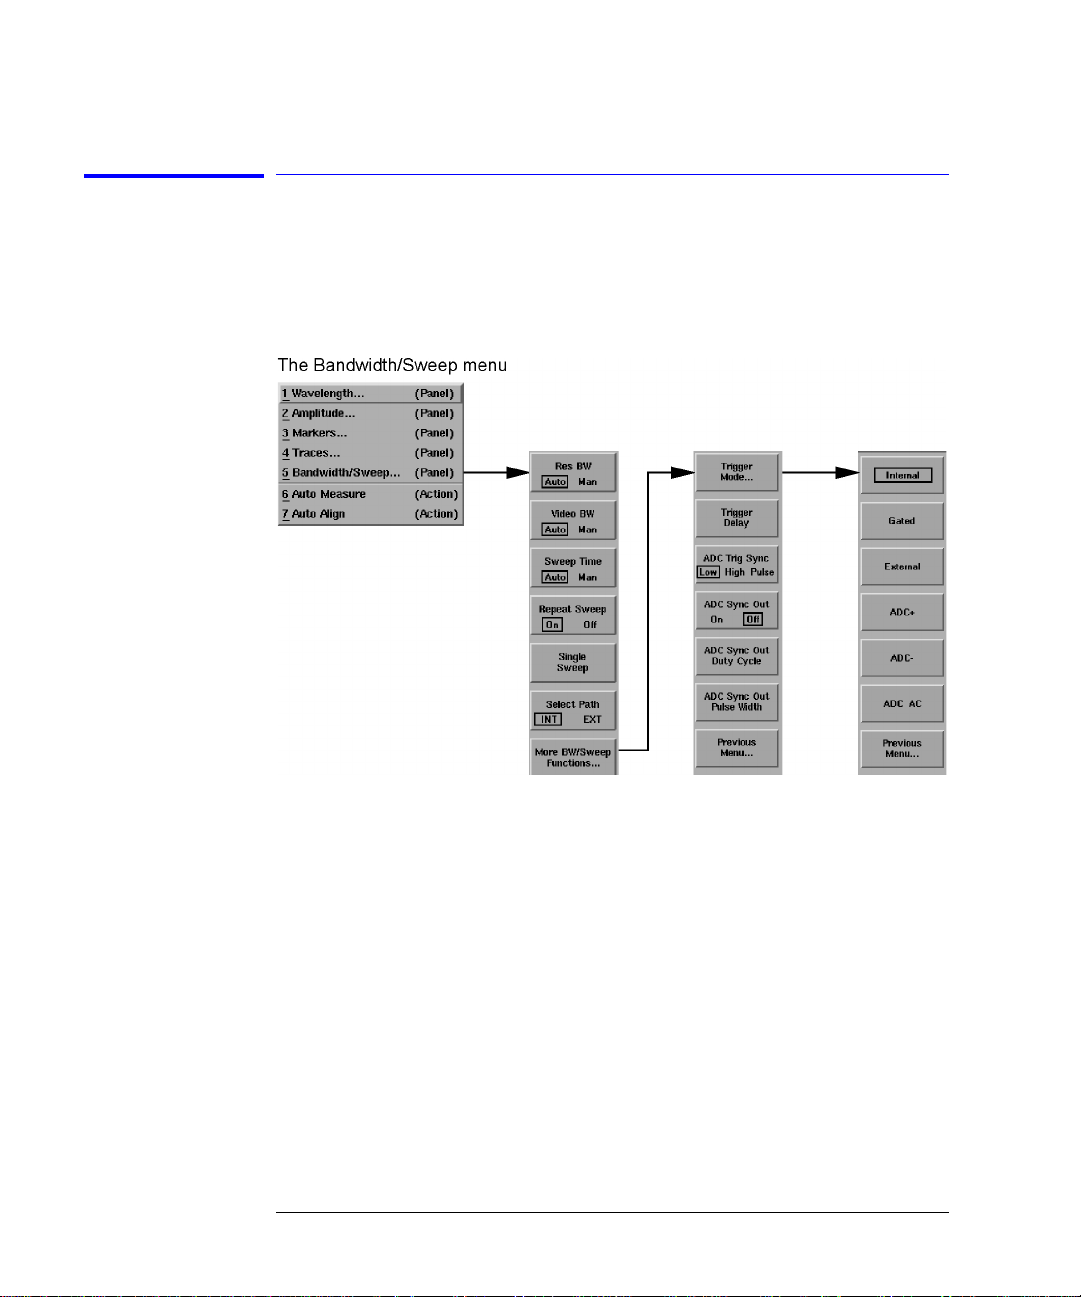
The Bandwidth/Sweep Menus
You can access the Bandwidth/Sweep softkeys by using the front-panel Bandwidth/Sweep key or the Measure menu Bandwidth/Sweep selection on the
menu bar.
1-22
Page 29
Getting Started
The Softkey Panels
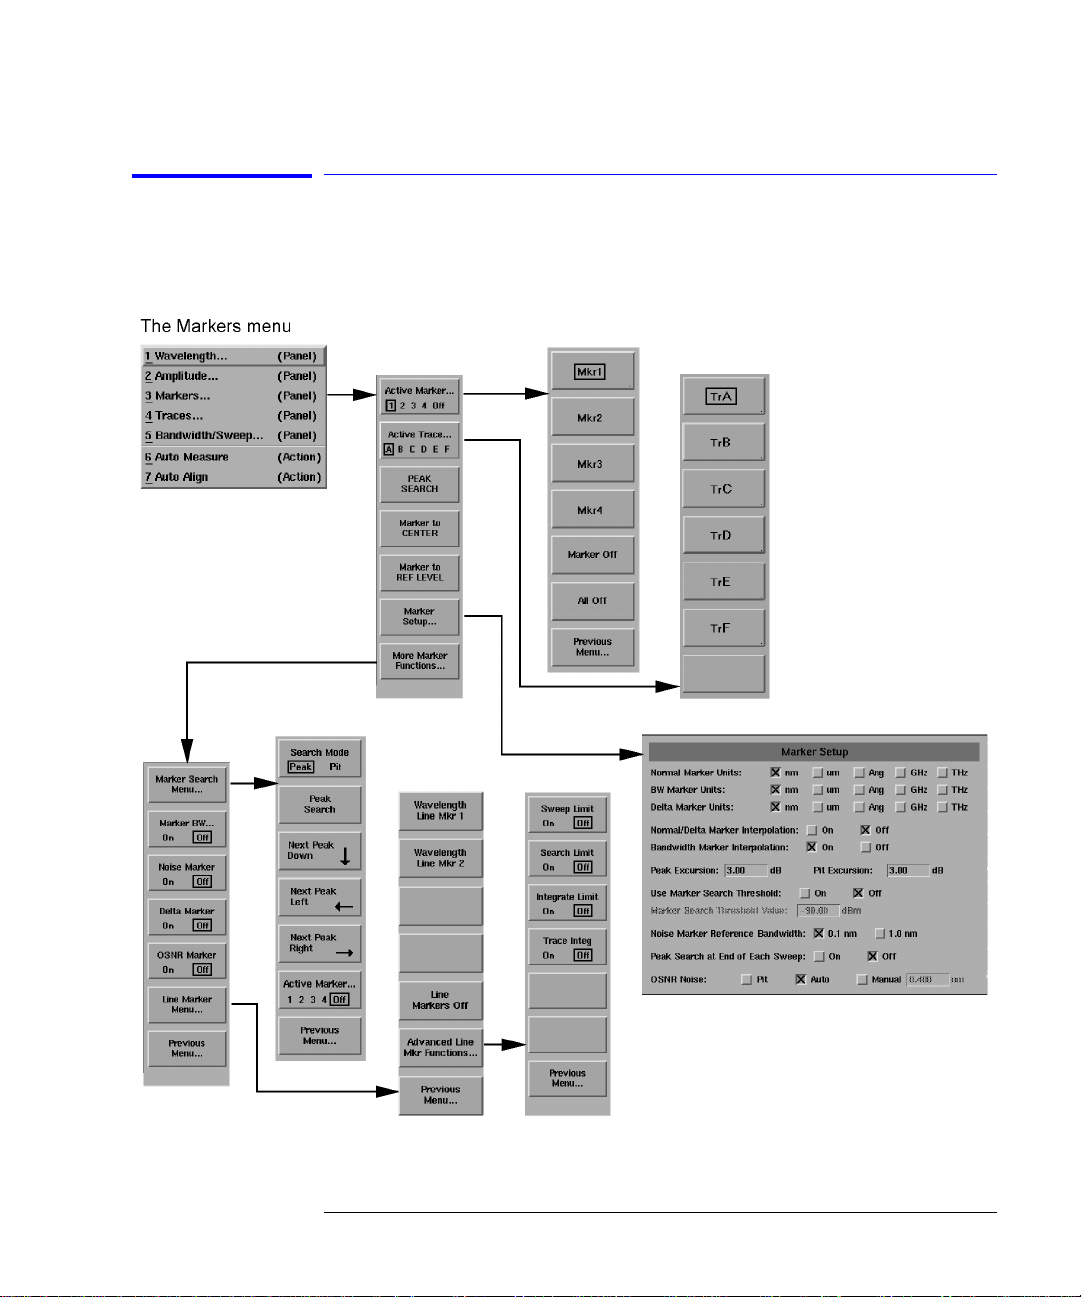
The Markers Menus
You can access the Markers softkeys by using the front-panel Markers key or
the Measure menu Marker s se lection on the menu bar.
1-23
Page 30
Getting Started
The Softkey Pan els
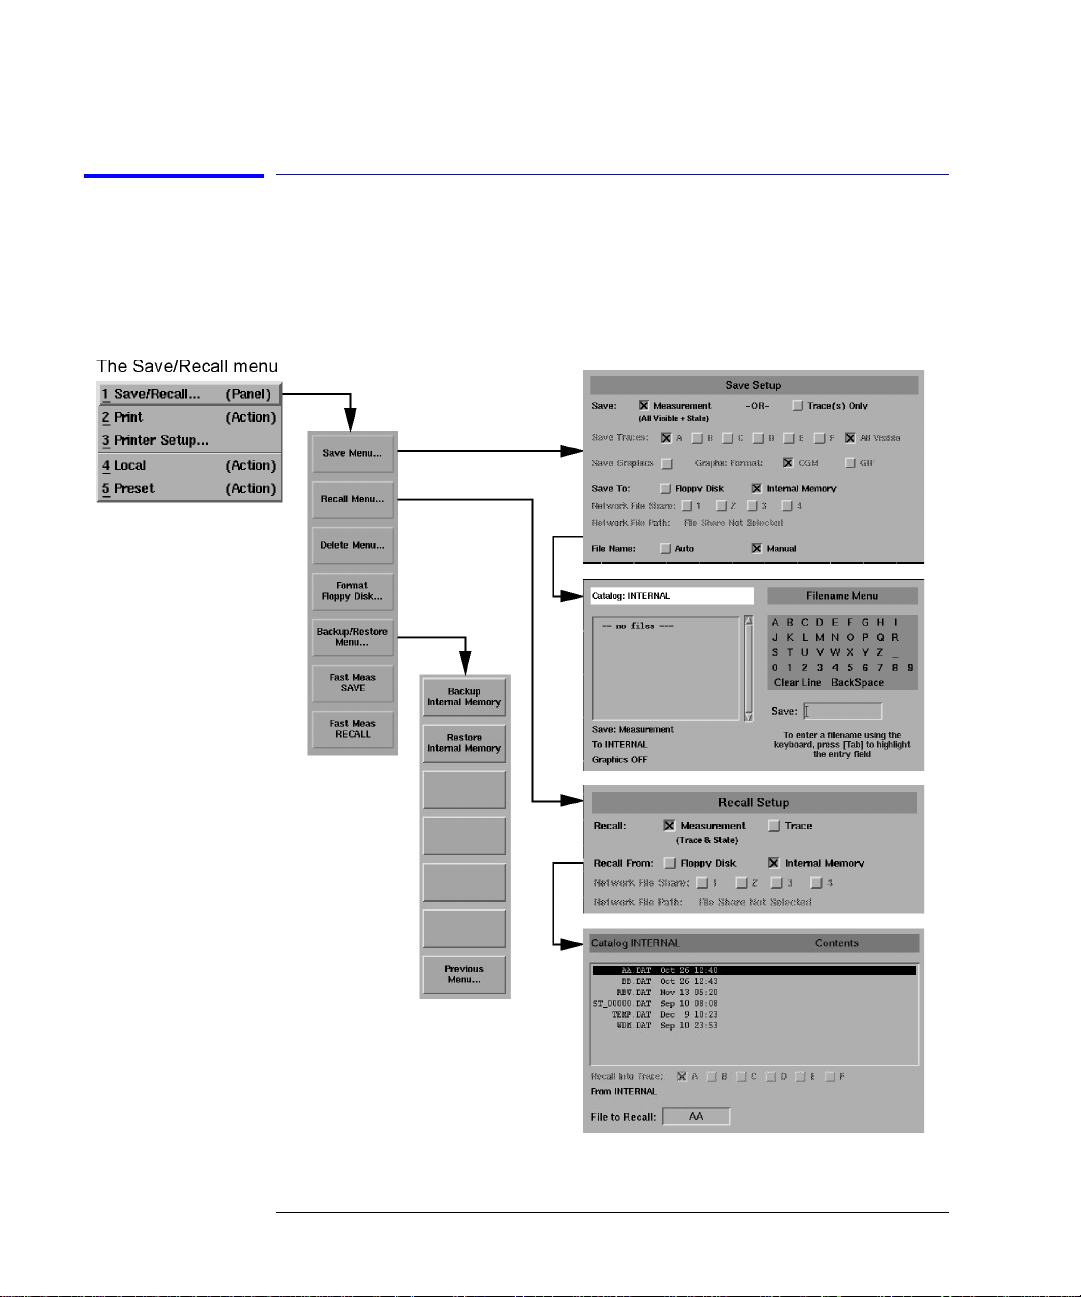
The Save/Recall Menus
You can acce ss the Save/ Recal l so ftke y s and s et up pane l s by using the drop down File menu Save/Recall selection or the front-panel Save/Recall key. Use
these functions to save, recall and print the measurement results.
1-24
Page 31

Getting Started
The Softkey Panels
The Systems Menus
Y ou can access the System softkeys by using the front-panel System key or the
Options menu System selection on the menu bar.
1-25
Page 32

Getting Started
The Softkey Pan els
The Systems Menus, continued....
1-26
Page 33

Getting Started
The Softkey Panels
The Traces Menus
You can access the Traces softkeys by using the front-panel Traces key or the
Measure menu Traces selection on the menu bar.
1-27
Page 34

Getting Started
The Softkey Pan els
The Wavelength Menus
You can access the Wavelength softkeys by using the front-panel Wavelength
key or the Measure me nu Wavelength sel ection on the menu bar.
1-28
Page 35

Getting Started
Laser Safety Consideratio ns
Laser Safety Considerations
NOTE Refer to the Tunable Laser Modules User’s Guide for complete laser safety
information.
Laser Safety Las e r radiation in the ultraviolet and far infrared parts of the spectrum can
cause damage primarily to the cornea and lens of the eye. Laser radiation in
the visible and near infrared regions of the spectrum can cause damage to the
retina of the eye.
WARNI NG Do NOT, under any c ircumsta nces, look into th e optica l output o r any
fiber/device attache d to the output while the laser is in operation.
This system should be serviced only by authorized personnel.
Do not enable the las er unless fiber or an equivalent device is attached to the
optical output connector.
CAUTION Use of controls or adjustments or performance of procedures other than those
specified herein can result in hazardous radiation exposure.
Electrical Safety The electrical safety considerations are documented in the section “General
Safety Considerations” on page -iii. Familiarize yo u rs elf with the safety mark-
ings and instru c tions before operating this system.
1-29
Page 36

Getting Started
Product Option s an d Accessories
Product Options and Accessories
Options Agilent 86140B, 86141B,
86142B, 86146B
Benchtop
Agilent 86143B, 86144B,
86145B
Portable
Instrument System Options
Current Source
White Light Source
Built-in 1310 & 1550 nm EELED Source
Built-in 1550 nm EELED Source
Wavelength Calibrator
Time Resolved Chirp Application
DWDM Spectral Analysis Application
Passive Component Test Application
Amplifier Test Application
Source Tes t Application
Opt. 001
Opt. 002
Opt. 004
Opt. 005
Opt. 006
Opt. TRC
Included
Included
Included
Included
a
Alternative Connector Inter face
FC/PC
HMS-10
DIN
ST
SC
Multimode Fiber Input
b
Standard
Opt. 011
Opt. 013
Opt. 014
Opt. 017
Opt. 025 (Agilent 86140B) Opt. 025 (Agilent 86143B)
Certificate of Cal ibr ation Included Included
a. Option available for 86146B only.
b. 50µm multimode input available on Agilent 86140B and 86143B OSA’s only.
----
----
----
---Opt. 006
Not Applicable
Included
Included
Included
Included
Standard
Opt. 011
Opt. 013
Opt. 014
Opt. 017
1-30
Page 37

Getting Started
Product Options and Accessories
Table 1-3.Accessories
Option Descriptio n Product Number
Connector Accessories
011 HP/HMS-10 Connector Adapter
HMS-10 Dust Cap
012 FC/PC Connector Adapter
FC/PC Dust Cap
Angled to Flat, FC/PC Adapter
013 DIN Optical Connector Adapter
DIN Dust Cap
014 ST Optical Connector Adapter
ST Dust Cap
017 SC Optical Connector Adapter
SC Dust Cap
08154-61701
1401-0291
08154-61702
1401-0291
1250-3175
08154-61703
1401-0291
08154-61704
1401-0291
08154-61708
1401-0291
Power Selection
900 Power Cord (United Kingdom) 8120-8705 1
901 Power Cord (Australia, New Zealand, China) 8120-0696 1
902 Power Cord (Europe) 8120-1692 1
903 Power Cord (United States) 8120-1521 1
906 Power Cord (Switzerland) 8120-2296 1
912 Power Cord (Denmark) 8120-2957 1
917 Power Cord (South Af rica, India) 8120-4600 1
918 Power Cord (Japan) 8120-4754 1
919 Power Cord (Israel) 8120-5181 1
920 Power Cord (Argentina) 8120-6868 1
921 Power Cord Chilean)( 8120-6979 1
922 Power Cord (China) 8120-8377 1
Documentation and Manuals
ABC Traditional Chinese User’s Guide
Traditional Chinese Application Guide
86140-90067
86140-90066
Certification of Calibration and Service
1BM Standard Commercial Calibration Certificate N/A 1
UK6 Commercial Calibration Certificate with Test Data N/A 1
W30 Extended Warranty to 3 Years Return for Service N/A 1
Item
Quantity
3
3
3
3
1
3
3
3
3
3
3
1
1-31
Page 38

Getting Started
Product Option s an d Accessories
Table 1-4. Available Fiber Sizes
Model
Number
86143B
Opt 025
86145B
86140B
Opt 025
86142B
b
86141B
86144B/
86146B
a. Options 002, 004, and 005 are exclusive
b. Only one option is avail ab l e on the 86141B
Optical
Input
Option 002
(White Light
Source)
µm
9
50
µm
9
µm
9 µm
50
µm
9
µm 62,5 µm 9 µm 9 µm 9 µm
N/A N/A N/A
N/A N/A N/A
62,5 µm
62,5
µm
50 µm 62,5 µm 9 µm 9 µm 9 µm 62,5 µm 62,5 µm
µm 62,5 µm 9 µm 9 µm 9 µm 50 µm 9 µm
9
Table 1-5. Additional Parts and Accessories
a
Option 004
(1310/1550
EELED)
9 µm
9
µm
a
Option 005
(1550
EELED)
9 µm
9
µm
a
Option 006
(Calibrator)
9 µm
9
µm
9 µm
9 µm
9
µm
Photo-
diode
Input
N/A N/A
N/A N/A
N/A N/A
N/A N/A
Mono
Output 1
Agilent Benchtop OSA
86140B, 86141B, 86142B,
86146B
Printer Paper (5 rolls/box) 9270-1370
Additional Connector Interfaces See Agilent 81000 series
Agilent Portable OSA
86143B, 86144B, 86145B
9270-1370
See Agilent 81000 series
External 10 dB Attenuator (FC/PC) Opt. 030 Opt. 030
Rack-Mount Flange Kit Opt. AX4 N/A
Transit Case 9211-2657
9211-5604
Soft Carrying Case N/A Opt. 042
BenchLink Lightwave Software
a. Agilent N1031A BenchLink Lightwave allows transfer of measurement results over a GPIB Interface to a PC for the purposes of
archiving, printing, and further analysis.
a
Standard Standard
1-32
Page 39

Front Panel Fiber-Optic Adapters
Getting Started
Product Options and Accessories
Front Panel
Fiber-Optic Adapter
Description Agilent Part Number
Diamond HMS-10 08154-61701
a
FC/PC
SC 08154-61708
DIN 08154-61703
ST 08154-61704
Biconic 08154-61705
a. The FC/PC is the default front-panel optical connector.
08154-61702
1-33
Page 40

Getting Started
Product Option s an d Accessories
1-34
Page 41

2
Setting Up Measurements 2-2
Calibrating Wavelength Measurements 2-14
Saving, Recalling, and Managing Fi le s 2-19
Analyzing Measurement Data 2-27
Analyzer Operating Mo des 2 -30
Using the Instrument
Page 42

Using the In s tr ument
Setting Up Measurements
Setting Up Measurements
This section con t a ins the following information that wi ll help you set up a
wavelength measurement:
• Adjusting Setup Conditions
• Operating the Internal White Light Sour c e
• Averaging Traces
• Setting Video Bandwidth
• Using Span to Zoom In
• Setting the Sensitivity
• Triggering a Measur em e nt
• Moving the Active Function Area
• Indicating an Update is Needed
2-2
Page 43

Using the softkeys
Using the Instrument
Setting Up Measurements
Adjusting Setup Conditions
Setup panels allow you to adjust setup conditions which are not frequently
changed. Refer to “Preset” on page 3-65.
Arrows allow you to navigate from field to field in the di a log box. The highlighted parameter can be changed. The front-panel number keys, step keys,
and knob allows the use r to enter a numeric value in the highlighted fi el d.
Select selects the highlighted parameter. You can enter values for a selected
parameter using the front panel knob or numeric entry pad.
Defaults resets the para m eters to their default condition.
Close Panel saves the current setup and returns you to the previous menu.
2-3
Page 44

Using the In s tr ument
Setting Up Measurements
Operating the Internal White Light Source
For Option 002 only
Option 002 provides a built-in white light source which is a stable, broadband
light source for swept-wavele ng th stimulus response testing from 900 nm to
1700 nm. The light source is ideal to perform stimulus-response measurements, and measure photod etector responsivity. Refer to “Light Source” on
page 3-33.
Note Although the light source’s lamp lasts an exceptionally long time, turn off the
light when not in use to extend the lamp’s lifetime. On the front pa n el, press
System, Optimum, Li ght Source, Select off.
1 From the front panel, pres s Sy ste m > Opti ons > Light Source > Select Off.
Performing Stimulus-Response Measurements
Stimulus-response measurements characterize optical components for loss
(or gain) versus wavelength. You can characterize devices such as couplers,
switches, filt ers, fibers, and ampl ifiers.
To perform stimulus-response measurements, you must have an amplitudestable broadband light source. Although a white-light source provides the widest wavelength input for stimulus-re spo nse meas ure m e nts , y ou can also use
an LED or the spontaneous emission from an optical amplifier.
The displayed response is a convolution of the analyzer’s resolution bandwid th
and the amplitude response of the device under test. Because of thi s convolution, the analyzer’s resolution bandwidth af f e c t s both dynamic range and the
ability to reso lv e la rge amplitude cha nges versus wavelength. Wide resolution
bandwidths increase the ability to resolve large amplitude changes.
You can display two responses at the same time. The output response versus
wavelength is displayed. The displa y ed trace shows the rati o of the output
power to the input power expressed as a logarithm (dB).
output power
response (dB) = 10 log
Making ratioed measurements is sometimes referred to as normalization. Normalized measurements are used to negate wavelength dependencies in the
source. The ratio is achieved through simple trace su bt ra c tion using logarithmic amplitude sca les. This is possible because of the following logarithmic
equality:
2-4
æö
------------------------------------
èø
input power
Page 45

Using the Instrument
Setting Up Measurements
A
æö
---
log
èø
log A log B–()=
B
1 Connect the Light Source Output to the Monochromator Input using the short
62.5/125
µm fiber. The standard connector interface is FC /P C .
2-5
Page 46

Using the In s tr ument
Setting Up Measurements
Averaging Traces
Tr a c e a ve ra ging improves your measurement repeat a bility by smoothing out
noise. For measurements involv ing slow polarization scrambling, using video
filtering to imp rov e repeatability w ill require a very narrow video bandwidt h
(less than 10 Hz). This would result in a long measurement time, where trace
averaging would be faster. Refer to “Averaging” on page 3-14.
1 From the front panel, press Traces > Averaging.
2 Toggle to select the Averaging on or off.
3 Select from the 10, 20, 50 or 100 softkeys or use the knob, step keys, or numeric
entry pad to enter the desi re d average count.
Note For measurements with fas t po lariza tion s cramb ling, vid eo filt erin g (adju sting
video bandwidth) is generally faster than trace averaging for similar
repeatability re quirement.
2-6
Page 47

Using the Instrument
Setting Up Measurements
Setting Video Bandwidth
Video bandwidth filtering occurs after the detection of the light. In the auto
coupled mode, the video bandwidth has an extremely wide rang e. This allows
the instrument to avoid unnecessary filtering that would reduce the sweep
speed more than required. Refer to “Video B W” on page 3-99.
The instrument has two de tection techniques: peak (auto mo de) and sample
(manual mode). Peak det ect ion is ben efici al f or mai nta ining the f ast est s weep
times and displaying narr ow aspect ratio signals. Sample detecti on is beneficial for obtaining best measurement accuracy and measuring low level signals.
Peak detection finds and displays th e m a ximum signal level present during
each trace poin t interval. Peak detection is used if v ideo filtering is no t
required to achieve the desired level of sensitiv ity. However, there is one
exception: if an auto-coupled sweep time is limited by either maximum motor
speed or a 50 ms auto- c oupling limit, then sample detection is used with as
narrow a digital video bandwidth as poss ib le in order to achieve maximum
sensitivity for the chosen sweep time. This exception only applies when both
sweep time and video bandwidth are auto-coupled.
Sample detectio n displays a filtered version of th e sa mp led data at the end of
each trace point interval. The filter function is varied with the video bandwidth function from 100 mHz to 3.0 kHz, or the bandwid th of the currently
selected transimpedance amplifier, whichever is less. Increased filtering provides greater sensitivity .
The detection mode is automatically determined by the instrument. You can
adjust the settings of video bandwidth, sensitivity, or sweep time to obtain the
desired detection mode. Sample detection can be forced at any time by putting video bandwidth in manual. Pe ak detection can usually be obtaine d by
placing sensitivity a nd video bandwidth in auto.
The following fun c ti o ns affect video bandwidth:
• changing the se nsitivity value
• changing the reference level
• turning auto ranging on or off
The range of video band w idths available in auto mode is much greater than
can be set manually from the front panel. A lower video bandwidth valu e
requires a longer sweep time. Because of the interdependence between the
2-7
Page 48

Using the In s tr ument
Setting Up Measurements
video bandwidth and sensitivity, it is recommended that either the sensitivity
or the video bandwidth be changed, whichever is the most important to th e
measurement task being perf ormed.
To reduce noise, you can select a narrower video bandwidth to improve
repeatability and sensitivity or select a wider video bandwidth to shorten overall measurement time. This selection allows the choice between repeatability
and measurement time based on your measurement requirements. The narrower the video bandwidth, the longer the sweep time.
1 From the front panel, press Bandwi dth/Sweep > Video BW.
2 Toggle to sele c t the video bandwidt h au tomatically or manually.
3 Use the knob, step keys, or numeric entry pad to enter the desired value.
Note For measurements with slow polarization scrambling, use trace averaging to
improve measurement repeatabilit y. T ra c e av eraging is faster than video
filtering for the sl ow polarization scram b ling application.
Using Span to Zoom In
To see a more detailed view of the device’s response, decrease the wavelength
span to expand the trace. This will enable you to precisely focus in on the
desired measurement area. Refer to “Span” on page 3-86.
Press Wavelength > Span and reduce the sp an by entering the value of 2
nm.
2-8
Page 49

Using the Instrument
Setting Up Measurements
Setting the Sensitivity
Setting sensitivity requests the lowest amplitude signal that can be measured
relative to the highe st amplitude signal d is p layed. It is defined as the signal
that is six times the RMS noi se. The mi nimum set tin g is –100 dB. An error will
be reported for values outside of this range and the sens itivity will round to
the nearest valid sensitivity. Refer to “Sensitivity” on page 3-81.
Manual allows manual input of sensitivities and enables auto gain ranging.
The “top of screen” and the sensitivity setting determines the requested
dynamic range. The system will sweep once per gain stage and may require up
to three sweeps to achieve the re q uested dynamic range.
Auto automatic ally c hoose s a sensit ivit y and a si ngle gain ran ge base d on “top
of screen”. This will re sult in approximately 40 dB of dynamic rang e.
The sweep time that is displ ayed in the lower porti on of t he displa y is the t ime
for the OSA to sweep over one gain stage. The OS A may tak e up to three
sweeps in three different gain stages to make the measurement. This depends
on the settings for sensitivity, reference level, auto range and also the particular device bein g mea sur ed. T he f inal d at a tra ce i s a b lend ed co mpos ite o f eac h
trace taken in the different gain stage s.
An increase in sensitivity may also require a narrower video bandwidth, which
will slow the sweep speed. Normally, the optical spectrum analyzer selects the
greatest sensitivity possible that does not require amplification changes during the sweep. If you manually increase the sensitivity level, the sweep pauses
to allow this change in gain.
The settings for sensitivity, video bandwidth and sweep time interact. If the
sensitivity is set to manual, the video b a nd w idth and sweep time may be
forced to Auto mo de. If the video bandw idth is set to manual, the sensitivity
and sweep time may b e forced to Auto. If the sw eep speed is set to manua l
and is set too fast, the over sweep indicator will come on in the display area.
Since these sett in gs interact, it is recommended th a t onl y on e of the settings
be changed, whic hever setting is most important to the m easurement task
being performed.
Press Amplitude, Sensitivity, toggle to manual, and enter a value.
2-9
Page 50

Using the In s tr ument
Setting Up Measurements
Triggering a Measurement
Tr igger ing a me asu rem ent sy nchr onize s the sta rt o f t he s weep to a n i nter na lly
generated trigger signal. Internal triggering ensures continuously triggered
sweeps with th e shortest delay between sweeps. Refer to “Trigger Mode,
Internal” on page 3-96.
In some measurements, the spectrum at a particular time within the modulation period is more important than the average spectrum. Gated triggering can
be used to synchronize the data acquisition portion of the OSA to a gating trigger connected to the rear-panel EXT TRIG IN connector. Gated triggering
requires a TTL-compatible signal wit h a mi n imum o f 0 Vdc and a maximum of
+5 V.
Gated triggering ignores the spectrum when the trigger input is low. It usually
is used in conjunc ti o n w i th the Max Hold function during several sweeps.
Gated triggering is used to select data samples containing valid information.
When the gating s ignal is high, the data sample is accepted. When the gati ng
signal is low, the data sample is replaced by a data point with a value of
–200 dBm. Processing con tinues according to the functions selected, suc h a s,
video bandwidth, max hold, and so forth.
If the low level exists for longer that the time needed for the grating to move
from one trace po in t to the next, then the trace will have “gaps”. There are
two ways to eliminate the gaps. You can increase the sweep time to at least:
(1.2–2 times the product trace lengt h)
2-10
× (the longest “low level” period)
Page 51

Using the Instrument
Setting Up Measurements
The display will have at least one data sample marked as valid (high level) per
trace point. Or else you can use the Max Hold function to complete a trace
over several sweeps. Multiple sw eeps fill the gaps beca use the high and low
levels of the gating signal occur independent of the grating position.
Gated triggering has no time limit for the high or low level. It can be used to
characterize pulses as narrow as a few microseconds, or to obtain a spectrum
whose timing exceeds the maximum 6.5 ms delay o f the
ADC trigger mode.
1 On the front panel press Bandwidth > Sweep > More BW Sweep > Functions >
Trigger Mode.
2 Select from int, gated, and ext.
2-11
Page 52

Using the In s tr ument
Setting Up Measurements
Moving the Active Function Area
The active function area on the display can be moved to eight different locations. This allo w s y o u to place the active area in a location that will no t interfere with the trace information. Refer to “Active Function Area Assist” on
page 3-2.
1 Press the front-panel System key.
2 Press the Move Active Area softkey. Each press of the softkey moves the
active function area to one of eight onscreen location s.
2-12
Page 53

Using the Instrument
Setting Up Measurements
Indicating an Update is Needed
This feature alerts you to take a sweep after changing any sweep related
parameters when the a nalyzer is not in sweep mode. For example, if you
change the resolution ba ndwi d th, the new resolution band width is displayed
on the bottom of the screen, but the trace data displa y ed on the screen used
the previous resolution bandwidth value.
Changing the following sweep parameters will set the Update Needed Indicator to on:
• start wavelength
• stop wavelength
• sensitivity auto/manual
• auto range enable/disable
• sensitivity
• video bandwidth auto/manual
• resolution bandwidth
• video bandwidth
• gated sweep enable/disable
• sweep continuous/single
• sweep time auto/manual
• sweep time
• sweep trace length
• reference level
• dB per division
• reference level position
• Y scale linear/log mode
• amplitude correction enable/disable
• current active ampcorr correction set
• ampcor interpolation method
• vacuum or air
• wavelength offset
• number of averages for trace avera g ing
The Update Needed Indicator, “*’”, is displayed in the upper right hand corner
of the graticule. After a sweep is taken, the Update Needed Ind ic a tor will be
set to off.
2-13
Page 54

Using the In s tr ument
Calibrating Wavelength Measurements
Calibrating Wavelength Measurements
Environmental variations such as air pressure, temperature, and humidity can
affect the index of refraction of air in the monochromator of the optical spectrum analyzer (OSA). This section discusses calibration methods that you can
use to improve the wavelength accuracy in the Agilent 8614X OSA’s. Refer to
“Calibration” on page 3-17 and to “Calibrator Multi-Pt Align” on page 3-18.
Note Many aspects of remotely programming the optical spectrum analyzers are discussed
in Product Note 86140-2R, Wavelength Calibration for the 86140X Series Optical
Spectrum Analyzers (Lit erature part number 5980-0043E).
Overview Wav elen gth cal ibra tio n ro uti nes i mpr ove w avele ng th ac cura cy b y det er minin g
errors and correcting them with offsets, using linear interpolation when necessary. For maximum wavelength accuracy, calibration points spaced a maximum of 10 nm apart are recommended.
You can perform a wavelength calibration by using one of the following methods:
• Manual Method using Internal Calibrator
• Remote Method using Internal Calibrator
• Manual Method using an Ex te rnal Single Wavelength Sou rce
• Remote Method using an External Single Wavelength Source
• External Multipoint Wavelength C a libration
These calibration routines should only be performed after the instrument’s
temperature has been stabilized by a minimum of 1 hour of continuous operation.
2-14
Page 55

Using the Instrument
Calibrating Wavelength Measure m ents
Internal Wavelength Calibration
The optional internal calibrator (1513 to 1540 nm) provides a convenient
method for increasing wavelength accuracy when used wi th an in te rnal
Enhanced Wavelength Calibration (EWC) process. The wavelength accuracy
of the OSA will be ±0.2 nm over the full wavelength range of the instrument,
with ±10 pm over 1480 to 1570 nm and ±25 pm accuracy over 1570 to 1620
nm.
The EWC range can b e se lected for either the “full” OSA range of 605 nm to
1670 nm, or the “telecom” range of 1270 to 1670 nm, a smaller span more relevant to telecommunications. EWC must be enabled for the wavelength accuracy specifications to apply in th e range selected. S etting the range to F U LL
will require a longer calibration time for an internal calibration, but will provide enhanced wavelength accuracy over the full range.
Manual method using the internal calibrator
1 Access the EWC setup panel:
System > More System Functions > Service Menu > Adv Service Functions
> More Adv Service Menu > Enhanced Wvl Cal Setup
2 Enable the functio n, if necessary, an d select the desired calibration ra n g e.
3 Clean all connec tors and connect the internal calibrator to the OSA input.
4 Access the Wavelength Calibration setup panel:
System >Calibration > Wavelength Cal Setup
5 Set the signal source to Calibrat or.
6 Press Perform Calibration.
Remote method using the internal calibrator
CALibration:WAVelength:EWC:FUNCtion ON !Enable enhanced wav e len gth
calibration.
CALibration:WAVelength:EWC:RANGe TELE !Select telecom (1270-1670) nm range
for enhanced wavelength calibration.
CALibration:WAVelength:INTernal:NORMal !Perform internal wavelength
calibration.
!The internal calibrator must be
connected before sending this
command.
2-15
Page 56

Using the In s tr ument
Calibrating Wavelength Measurements
External Single Wavelength Calibration
Using an external single-point calibration source allows the calibration to be
done at a specific wavelength. This single wavelength user calibration can be
repeated as often as necessary to correct for envir onme ntal variations and
existing multipoint wavelength offsets will be adjust ed accor di ngly. After a
single wavelength calibration, wavelength accuracy will be ±10 pm within 10
nm of the reference signal.
The Enhanced Wavelength Calibration (EWC) process can also be us ed to
increase the accuracy of the single-point calibration.
Manual method using an external source
1 Connect the external source to the O SA input.
2 Auto align the OSA to the input signal.
3 Access the Wavelengt h Ca libration setup panel:
System > Calibration > Waveleng th Cal Se tup
4 Select Air or Vacuum re fe rence for the signal source .
5 Set the signal source to Ex ternal.
6 Select the desi red Calibration Wa velength. This wavelength must be with in
±2.5 nm of the source wavelength.
7 Select Perfor m Calibration.
Remote method using an external source
• For a source with a single peak:
CALibration:WAVelength:VALue <param> !Set calibration wavelength
CALibration:WAVelength !Calibrate signal at wavelength
• For a source with multiple peaks:
CALibration:WAVelength:VALue <param> !Set calibration wavelength
CALCulate:MARKer[1|2|3|4]:X:WAVelength
<param>
CALibration:WAVelength:MARKer !Calibrate signal at marker
2-16
!Set marker wavelength
Page 57

Using the Instrument
Calibrating Wavelength Measure m ents
External Multipoint Wavelength Calibration
An external multipoint wavelength calibration can be performed over any
specified wavelength range, up to and including the full wave le ng th ran ge of
the OSA (600 nm to 1700 nm). Narrow measur ement spans can be chosen to
provide greater accuracy over a selected range. Calibrating the wavelength
every 10 nm within the desired wave length range is usua lly sufficient to
improve wavelength accuracy. After a multipoint wavelength calibration,
wavelength accuracy will be ±10 pm within 10 nm of each calibration wavelength. Refer to “Calibrator Multi-Pt Align” on page 3-18.
Note For a full explanation of external multipoint wavelength calibration, along with a
sample program to perform the calibration, refer to Product Note 86140-2,
Wavelength Calibration for the 86140X Series Optical Spectrum Analyzers
(Literature part number 5980-0043E).
The following steps outline one method for an external multipoint wavelength
calibration routine. This assumes a program executed on a external PC co ntroller. The steps outlined are those written in the pro g ra m.
1 A signal is sent from a tunable laser source into a multi-wavelength meter and
the OSA simultaneously.
2 The wavelength of the input signal is measu re d on both in struments.
3 The two measured values are co m p a red.
4 Taking the multi-wavelength meter readings as actual, the software calculates
the error offs ets at each wavelength using the equation:
WL Error = (OSA indicated WL) – (multi-wavelength meter actual WL)
5 The previous st e p s ar e repeated over the ent ir e w a velength range.
6 The data is aver aged over narrow wavelength spans to provide a suitable
correction for each span. The example below demonstrates this technique.
Once the instrument is calibrated, the new wavelength accuracy can be main-
tained for many hours without recalibration, assuming a stable temperature
environment.
Tip If the OSA is tur ne d off , the mul tip oin t da ta wi ll be ret ain ed at t he n ext p owe r-
on, but the internal thermal shift can introduce inaccuracies to the calibration
data. To help compensate for this, a single point calibra tion using the Offs et
feature in the Wavelength Calibration Setup panel can be used to adjust the
multipoint data. Access this feature by selecting Syst em > Calibration >
2-17
Page 58

Using the In s tr ument
Calibrating Wavelength Measurements
Wavelength Cal Setup and choosing the Offset option before running the single
point calibra tion. T o ins ure this offset process has pr ovided suffi cient accurac y ,
the wavelength readings of the multi-wavelength meter and the OSA should be
compared to verify the wavelength accuracy and determine if a full multipoint
wavelength recalibration is necessary.
2-18
Page 59

Using the Instrument
Saving, Recalling, and Managing Files
Saving, Recalling, and Managing Files
The functions and methods available for saving, recalling, and managing file s
that contain measurement setups and results are as follows:
• Adding a Title to the Display
• Backing Up or Restoring the Int er nal Memory
• Saving Measurement Trace Data
• Recallin g M easurement Tra c e Data
• File Sharing and Printing over a Network
Adding a Title to the Display
Refer to “Title (Display Setup Panel)” on page 3-92 and to “Date/Time (Display Setup Panel)” on page 3-20.
1 Press the front- panel System key.
2 Press the Set Title.... softkey . The Title Setup panel appears.
The Title Setup panel
3 To view the titl e o n the display, press More System Functions >Display
Setup and ch ec k the Title On box.
2-19
Page 60

Using the In s tr ument
Saving, Recall ing, and Managing Fil es
Backing Up or Restoring the Internal Memory
1 Press the front-panel Save/Recall key.
2 Press the Backup/Restore Menu.... softkey.
Note The auto span value will not be saved with the measurement. Refer to “Backup
Internal Me mory” on page 3-15.
Softkey Pan e l
Selections
Backup Internal Memory
a The analyzer Backup Utility screen appears asking you to insert a formatted
floppy disk in the external drive. The disk will not be viewable on a PC and
no trace or measurement files can be saved onto the disk until it is reformatted.
b The Backup Internal Memory function overwrites the floppy disk with a new
image. Any exist ing files or ca talogs on the flo ppy disk will be de stroyed. Any
successive backup operations will overwrite the previous backup information, so only the latest backup information can be recovered through the Restore Internal Memory operation.
Restore Internal Memory
The analyzer Restore Utility sc reen appears. Th is operation wil l re move all
files from internal memory and replace them with files from backup floppy
disks.
Saving Measurement and Trace Data
You can save measurement and trace data using the following methods:
• Fast Measurement Save Mode
• Save Setup Panel Mode
Saving Data in Fast Meas Save Mode
1 Press the front-panel Save/Recall key.
2 Press the Fast Meas SAVE softkey.
3 The instrument saves the curren t measurement state to internal memory as
FASTSAVE.dat. O nly one FASTSAVE .dat file exi sts, so perfor ming a Fast Meas
2-20
Page 61

Saving, Recalling, and Managing Files
Save will overwrite any currently existing Fast Save file.
Note The auto span value w ill not be saved with the measurement.
Saving Measurement and Trace Data
1 Press the front- panel Save/Recall key.
2 Press the Save Menu.... softkey.
3 The Save Setup panel opens. Refer to “Adjusting Setup Conditions” on page 2-3
for information on changing and se le cting items in the setup panel .
Using the Instrument
The Save Setup panel
Note The auto span value w ill not be saved with the measurement.
Save Setup Panel
Selections
Save: Measurement
Saves the measurement dat a in a binary format (.dat file). This includes the
traces and all measurement conditions. The dat file format can only be read by
the analyzer. You will not be able to v ie w this file on your PC. When the file is
recalled, the instrument state will be set to the same state as when the file was
saved.
Save: Trace(s) Only
The Trace(s) Only files are saved in comma separated variable (.csv) format
and are auto named starting with TR_00000.cs v. State files are auto named
starting with ST_00000.csv.
When the T rac e(s) Only fil e is reca lled, the tr ace dat a will be displayed under
the current instrument settings.To view the inst rum ent settings, press System > More System Functions > State Info.
2-21
Page 62

Using the In s tr ument
Saving, Recall ing, and Managing Fil es
Save Tr aces
Selects the traces to be saved.
Save Graphics
Allows you to save gra p hic data in one of two formats. These selec t ions are
valid only when sav ing to the floppy drive.
CGM (Computer Graphics Metafile format) is a vector graphics format that
describes pictures and graphical elements in geometric terms. The file is
saved with .cgm extension.
GIF (Graphics Interchange Format) is a cross-platform graphic standard.
GIF formats are commonly used on many di ffe rent platforms and readable
by many differen t kinds of sof tware. The fi le is saved with .gif extensio n. GIF
supports up to 8-bit color (256 colors).
Save to
Allows you to choose between saving data to a floppy disk or to internal memory.
File Name
Selects manual or automatic mode for choosing a file name.
4 If you have chosen Auto to select the file name, press the Auto Save softkey.
The analyzer will generate a filename and save the file.
5 If you have chosen Manual to select the file name, press the Choose File to
Save softkey. The Filename Menu setup panel opens.
The Filename Menu setup panel
2-22
Page 63

Saving, Recalling, and Managing Files
Entering a Filename Using the Arrow Keys
Using the Instrument
• Use the front-pa nel step keys (
Ý and ß) and the arrow softkeys (→ and ←)
to highlight eac h le tter of the filename.
• When the desired le tter or function is sel ected, press the Select softkey.
• Select the BackSpace function to delete individual letters.
• Select the Clear Line function to delete the entire filename.
• When you finish ent ering the filename, press the SAVE FILE softkey.
Entering a Filename using an External Keyboard
There must be a PS-2 keyboard conne c ted to the analyzer p rior to bootup.
• Press [TAB] on the keyboard to highlight the entry field.
• Enter the filename us ing the keyboard.
• When you finish ent ering the filename, press the SAVE FILE softkey.
2-23
Page 64
Using the In s tr ument
Saving, Recall ing, and Managing Fil es
Recalling Measurement and Trace Data
You can recall measurement and trace data using the following methods:
• Fast Measurement Recall Mode
• Recall Setup Panel Mode
Refer to “Recall (Recall Setup Panel)” on page 3-67.
Recalling Data in Fast Meas Recall Mode
1 Press the front-panel Save/Recall key.
2 Press the Fast Meas RECALL softk ey.
3 The instrument reca lls the measurement state previously sa v ed as
FASTSAVE.dat by the Fast Meas Save functio n.
Note The auto span value will not be saved with the measurement.
Recalling Measurement and Trace Data
Note To insu re accurate measure m e nts, a waveleng th cal ibration should be
performed each time measurement data is recalled from memory.
1 Press the front-panel Save/Recall key.
2 Press the Recall Menu.... softkey.
3 The Recall Setup pane l op ens.
The Recall Menu setup panel
Note The auto span value will not be saved with the measurement.
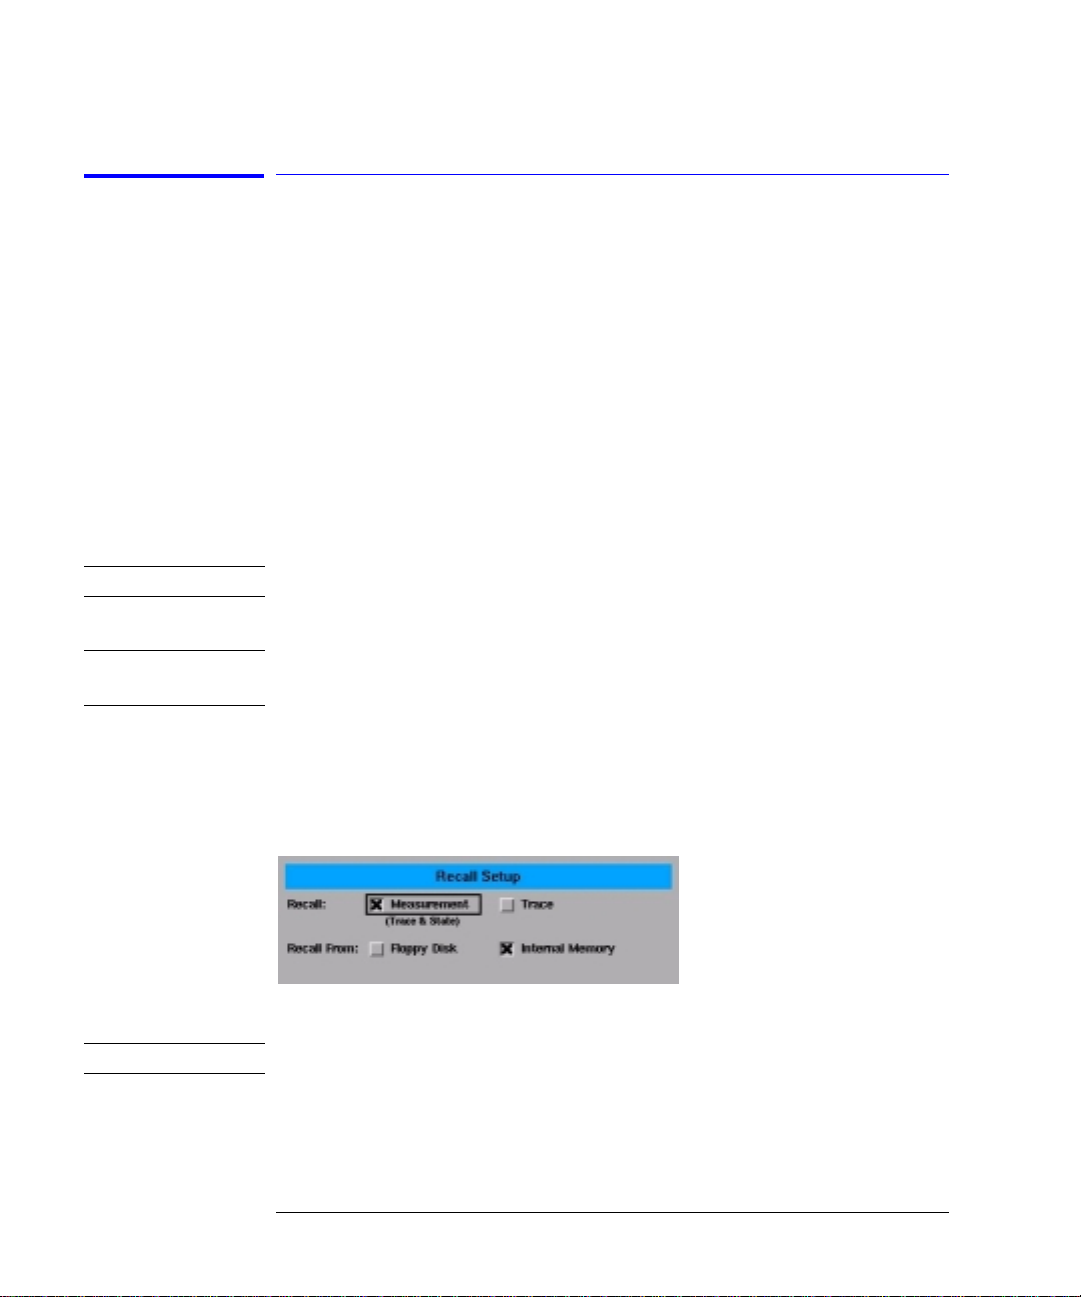
Recall Setup Panel
Selections
Recall
Selects whethe r a me a surement or trace w ill be recalled.
2-24
Page 65

Using the Instrument
Saving, Recalling, and Managing Files
Recall From
Selects whether to recall from a floppy disk or from internal memory.
4 When you are satisfied with your selections, press the Choose File to Recall
softkey. The Catalog setup panel opens.
The Catalog setup panel
5 Use the arrow keys or Prev File, Next File softkeys to highlight the desired
file. Press RECALL FILE to load the selected file.
2-25
Page 66

Using the In s tr ument
Saving, Recall ing, and Managing Fil es
File Sharing and Printing over a Network
This function uses the LAN to print to network printers and st ore, recall or
delete data on remote hard drives. The da ta can then to be acces se d a nd
shared among the users and printed on designated printers.
To access the file and printer share softkeys, you must first configure the network and enter the user share identity/user profile information for remote
shares. The softkeys for file and printer share will then become available for
selection.
Create a file or print share.
1 Configure the network. Refer to “Setting Up the OSA for Remote Operation” on
page 4-4 for instructions on how to configure the network.
2 From the front panel, pres s System > More System Functions > GPIB &
Network Setup > User Share Identity.
3 Enter the User Name, Password, and Wo rkgroup. Use the key board to enter t he
information or press Edit Field to access the User Workgroup Setup panel then
close the panel.
4 From the Network Setup, press File Share and enter the Share Path and
optional IP address. The format of the share path is \\server\”share name.”
Please note tha t yo u c a nn ot specify directories within the share. Up to four
remote file shares are available.
5 Press Printer Shares and enter the share path and optional IP address. Use the
keyboard to enter the informat io n or press Edit Field to access the User
Workgroup Setup panel. Up to four re m ote printer shares are available.
6 To activate the printer share, press System > Printer Setup and select the
configured share. To activate the file share, press Save/Recall then either
Save, Recall or Delete and select th e c o nfigured share. Note if you have no t
configured the share the Network File Share buttons will not be act iv e.
2-26
Page 67

Using the Instrument
Analyzing Measurement Data
Analyzing Measurement Data
This section provides advice and information on the following analyzer functions that allow you to analyze the meas ure d am plitude wavelength data.
• Tips for Using Traces and Markers
• Measuring the Delta between Traces
• Using Trace Math to Measure Wavelength Drif t
Tips for Using Traces and Markers
The analyzer provides the ability to display up to six traces wi t h up to fo ur
markers. Knowing a few tips makes trace and marker manipulation m uch e asier. Refer to “Traces” on page 3-95, “Marker BW” on page 3-37, “Marker Searc h
Menu” on page 3-38, “Marker Setup” on page 3-39, and “More Marker Functions” on page 3-45.
• Markers are a lw a ys placed on the currently selected active trace. Therefore,
use the Acti ve Trace fun ction to acti vate the des ired trace, th en select an a ctive
marker to be placed on that trace.
• When multiple markers are currently used on multiple traces, the Marker Status area (located at the top of the display) makes it easy to identify the state of
each marker.
Information provided for each marker in cludes:
• Wavelength
• Amplitude
• The trace associated with the marker.
For example, if marker 1 is on Trace A then the annotation will show
Mkr 1 (A).
In addition, if there are two markers on, then the delta of the wavelength and
amplitude for the two different markers is also displayed. For example, Mkr
2-27
Page 68

Using the In s tr ument
Analyzing Measurement Data
(2-1) 0.206 nm, -0.002 dB.
The color of the annotation de notes different characteri stics of the markers:
• White annotation denotes the status of the currently active mar ke r.
• Green annotation denotes the status of all currently used markers.
• Red annotation denotes that some type of an error occurred with the marker
measurement.
Moving the Active Marker from One Trace to Another
The following procedure shows you how to move the active marker (marker 1)
from Trac e A to Trace B.
1 From the front pan el, pr ess Markers > Active Trace > TrB to make Trace B
the active trace.
2 Press Active Marker > Mkr 1.
Measuring the Difference between Traces
The following procedure shows you how to find the amplitude and wavelength
difference between the maximum peaks of two different traces. Refer to “Nor-
mal/Delta Marker Interpol ati on (Marker Setup Panel)” on page 3-50.
1 From the front pa nel, press Markers > Active Trace and select the first trace
to place a marker.
2 Press Active Marker > Mkr 1 > Peak Search to place the marker on the
highest peak of the active trace.
3 Press Active Trace and select the second trace to place a marker.
4 Press Active Marker > Mkr 2 > Peak Search to pl a ce the marker on the
highest peak of the second trace.
5 View the results of th e m easur emen t fr om th e mar ker ann otat io n at t he to p of
the display.
The wavelength and amplitude of each trace marker is shown, as well as the
amplitude and wavelength difference of the peak s of the two traces.
2-28
Page 69

Using the Instrument
Analyzing Measurement Data
Using Trace Math to Measure Wavelength Drift
1 From the front panel, press Traces > Ac tive Trace > TrA.
2 Press Single Sweep, Bandwidth Swe e p , Single Sweep to update Trace A
then press Traces, Update A off.
3 Press Active Trace > TrB.
4 Press Sweep > Repeat Sweep On to continuously update the measured
response on Trace B.
5 Press Traces > Trace Math, Default Math Trace C > Log Math C = A – B.
You can now monitor the wavelength drift of your device over time.
Also Refer to “Log Math C=A–B” on page 3-35, “Log Math C=A+B” on
page 3-35, and “Log Math F=C–D” on page 3-36.
2-29
Page 70

Using the In s tr ument
Analyzer Operating Modes
Analyzer Operating Modes
This section discusses the following analyzer modes that you can use in specific measurement applications.
• Filter Mode (For Agilent 86144B/86146B only)
• Filter Mode (For Agilent 86141B only)
• Time Resolved Chirp
Filter Mode
For Agilent 86144B/86146B only
The Agilent 86144B and 86146B filter mode allows a single channel from a
dense wavelength division multiplex (DWDM) signal to be isolated and routed
to another measurement instrument. The filter mode capability is built-in to
internal applic at ions to allow for fast and easy measurements. Th e filtering is
accurate and f lexib le. It has l ow pol ariza tion d epend ent los s (PDL), adjust able
filter bandwidth, and a wide tuning range.
1 Switch to filter mode by pressing Appl > Measurement Modes > Filter Mode.
2 Select a filter bandwidth in the BW/sweep > Res BW menu .
3 Select an active tuning marker and tune it to a wavelength position.
The filter marker becomes the current marker and has the active area focus.
All other markers stay on. In the filter mode, the analyzer acts as a fixedtuned, variable wavelength, variable bandwidth, bandpass filter. It filters the
input light at a specified wavelength. The filtered light is available at the frontpanel monochrom a tor output connector. One application of the filter mod e is
the filtering (select in g) of on e particular mode of a laser source. Refer to “Fil-
ter Mode” on page 3-29, “Filter Mode Instruction Panels” on page 3-29, and
“Filter Marker Tune” on page 3-28.
2-30
Page 71

Using the Instrument
Analyzer Operating Modes
When the analyz er enters the filter mode, the sweep stops wi th the analyzer
filter tuned to the center wavelength. (If a marker is on, the analyze r filte r i s
tuned to the marker wavelength.) The last trace remain s displayed to show
the input spectrum before the filtering. A marker shows the wavelength of the
preselection. Y ou can change the filtered output (preselection) wavelength by
adjusting th e m a rk e r ’s position, then c on necting the monochromator outp ut
to another instrument. If the input spectrum changes, rec onne ct the monochromator output, then press the Take Sweep softkey to capture a new sweep.
The single mode filter can be used in conjunction with the Agilent 86130A bitalyzer error performance analyzer and/or the Agilent 86100A infinium digital
communication analyzer. Time res olve chirp (TRC) mea surements use the
Agilent 86146B Option TRC and the Agil e nt 86100A digital communication
analyzer.
2-31
Page 72

Using the In s tr ument
Analyzer Operating Modes
Table 2-6. Differences Between Agilent 86141B and 86144B/86146B
86141B Unique Operation (Internal 50 µm Fiber Switch)
Filter mode initializat ion:
• Previous settings are lost
• A single sweep is taken
Markers used:
• The marker is set to the reference level
Functions limited to:
• Taking a single sweep
• Changing resolution bandwidth
• Resolution bandwidth is Marker 1
Filter mode functions available:
• Exit recalls the last selected state parame te rs prior to entering filter mode
86144B/86146B Unique Operation (External 9
Filter mode initializat ion:
µm Fiber Connection)
• No default settings
Markers used:
• Filter marker is the normal no ise marker
• OSNR marker is the center marker
• Bandwidth marker is the center wavelength mar ker
Functions limited to:
• Fiber selection
• Applications
• Calibration
• ADC
Filter mode functions available:
• Transfer and restore state file in fi lt er mode
• Save in filter mode
2-32
Page 73

Using the Instrument
Analyzer Operating Modes
Accessing the filter mode (for 86144B/86146B only)
Note Filter mode will no t function in zero span. The filter mod e se lection will be
shaded out. The cu rrent state before entering fil ter mode will not be saved. A
sweep will not be taken . Th e reference level will not change.
1 Connect the light so urce to the optical spectrum analyz e r ’s front panel
monochromator input conne ctor.
2 Connect the monochromator output to the photodete ctor input.
3 Press Appl’s > Measurement Modes > Filter Mode. Follow the exter nal
path align setu p instruc tions an d select ei ther the Switch Pa th Auto Al ign Now
or Switch Path No Auto Align.
• Select the Switch Path Auto Align Now to perform an automatic align-
ment of the external path.
• Select Switch Path No Auto Align if you do not have the monochromator
output connected to the photodiode input, or to preserve previous align data.
Switch Path Auto Align Now switches to the 9
µm filter mode path and
performs an Auto Align. This aligns the output of the monochromator with the
photodetector input for improved amp li tude accuracy. The automatic alignment procedure sh ould be performed whenever the instrument has been:
• moved
• subjected to large temperature changes
• turned off, then on, and warmed up for an hour
The automatic alignment requires the connection of an external light source.
This can be a broadband or narrowband source. If there is insufficient signal
power, the automatic alignment will not be performe d and an error message
will be reported.
The Auto Align function saves and restores the current instrument state. This
allows the auto align to be used in the middle of a measurement routine.
If markers are turned on, auto align attempts to do the automatic alignment at
the wavelength of the active marker.
Note Auto Align Now will overwrite any previous align data.
2-33
Page 74

Using the In s tr ument
Analyzer Operating Modes
The data returned by the alignment is stored for both the external (9 µm) and
the internal (50
µm) path. With the data stored for both paths, the al i gnm ent
for the internal path is improved due to the increased resolution bandwidth of
the external path . O n c e t he align is complete or if you select No Auto Al ign,
the instrument will be ready to detect data through the external path.
4 After the routine has finished, chec k that the display shows the wavelength
range of interest of the external path. Adjust if necessary.
5 Press Res BW. Use the knob, step keys, or numer ic keypad to e nter the desir ed
amount of reso lution bandwidth filtering.
The 9
µm optical path for filter mode uses the 0.04 nm resolution bandwidth.
The resolution bandwidths include 0.04
µm, 0.5 µm, 1 µm, 2 µm, 5 µm, and 10 µm.
0.3
µm, 0.05 µm, 0.07 µm, 0.1µm, 0.2 µm,
6 Press Take Sweep to update the displ a y to sho w th e results of the new
resolution bandwidth filtering.
The light is o utp ut f rom th e op tic al s pec tru m ana lyzer ’s front panel monochro-
mator output conn ec tor. This light is filtered (by the re solution bandwidth)
and attenuated (by the monochrom a tor loss) light that is input to the front
panel optical input connector.
7 Press Optical Filter Marker Tune. Turn the fron t panel knob or press the
step keys to tune th e preselector to any di splayed wavelengt h.
8 Connect the monochromator output to an instrume nt.
9 If the input light changes, or if you change the span of the optical sp ec trum
analyzer, reconnect the monochromator output to the photode te c tor input,
and press Take Sweep to update the displayed trace with valid waveform data.
10 Press Exit Filter Mode to return to normal optical spectrum analyzer
operation.
The filter mode Save/Recall function for the Agilent 86144B/86146B will work
only between the se t wo models.
2-34
Page 75

Using the Instrument
Analyzer Operating Modes
Note If the file saved in filter mode is recalled into an instrument with firmware
revision B.04. 02, a critic al error oc curs, ind icating a gra ting posit ioning fa ilure.
Restart the instrumen t to cle a r the error and then continue maki ng
measurements.
Filter Mode
For Agilent 86141B only
In the filter or instrument mode, the analyzer acts as a fixed-tuned, variable
wavelength, variable bandwidth, bandpass filter. It filters the input light at a
specified wavelength. The filtered light is available at the front-panel monochromator outpu t co nnector. Adjust the analyzer’s resolutio n ba ndwidth to
change the amou nt of fi lter ing. (An y of th e re solu tio n ba ndwid ths may be cho sen.) One application of the preselector mode is the filtering (that is, selecting) of one partic ular mode of a laser source.
When the presel e c to r mode is entered, the sweep stops with the a n alyzer fixtuned at the center wavelength. (If a marker is on, the analyzer is fix-tuned at
the marker wavelength.) The last trace remain s di spl ay ed to show th e in put
spectrum before the filtering. A marker shows the wavelength of the preselection. You can change the filtered output (pr eselection) wavelength by adjusting the marker’s position. If th e input spectrum chang es, a softkey, Take
Sweep, is provided for capturing a new sweep.
Preselecting a light source (for 86141B)
1 Connect the light so urce to the optical spectrum analyz e r ’s front panel
monochromator input conne ctor.
2 Press Au to Meas. After the r outine has f inished, c heck that t he displa y shows
the wavelength range of interest. Adjust if nece ss ary .
3 Press Applications > Measurement Mo de s > Filter M ode > Res BW. Use
the knob, step keys, or numeric keypad to en te r the des ir ed amou nt of
resolution bandwidth filtering.
4 Press Take Sweep (App licati ons > Measur ement M odes > Filter M ode > T ake
Sweep) to update the disp lay to show the results of the new resol uti on
bandwidth filt ering.
2-35
Page 76

Using the In s tr ument
Analyzer Operating Modes
The light is o utp ut f rom th e op tic al s pec tru m ana lyzer ’s front panel monochro-
mator output connector. This light is a fi ltered (by the resolution bandwidth)
and attenuated (by the monochrom ator loss) light input to the front pane l
monochromator input conne ctor.
5 Press Marker Tune (Applications > Measurement Modes > Filter Mode >
Marker Tune). Turn the front panel knob to tune the preselector to any
displayed wavelength.
6 If the input light changes, or if you change the span of the optical sp ec trum
analyzer, press Take Sweep to update the displayed trace with valid waveform
data.
7 Press Previous Menu to return to normal optical spectrum analyzer
operation.
To use a single mode output cable
This procedure ensures the be st launching of the output light f rom the 50
monochromator output connector into a 9
µm fiber optic cab le.
1 Connect the light source to the optical spectrum analyzer’s front panel
monochromator input connector. Use a 9 µm fiber optic cable.
µm
2 Connect a 9
µm fiber optic cable between th e front panel monochromator
output and photodetector input connectors.
3 Press Auto Meas. After the routine has ended, check that the display shows the
wavelength range of interest. Adjus t if nece ss ary . Th e l ight re sponse to be
preselected should be displayed on the screen.
4 Press Applications > Meas ur ement Modes >
2-36
Page 77

Using the Instrument
Analyzer Operating Modes
Time Resolved Chirp
For Agilent 86146B option TRC only
The Agilent 861 46 B , with the filter mod e c a pability, will measure side mode
suppression ratio (SMSR), wave l eng th, and power. With the addition of an
Agilent 86100 Infinium Digita l Comm uni cations Analyzer (DCA), dedicated
software (86146B Option TRL), and a personal computer, time resolved chirp
(TRC) of a modulated laser can be ca lc u la t ed .
TRC provide s frequency (or wavelength) vs time information about a modulated lightwave signal. Also called dynamic chirp, the TRC graph provides useful information on the ability of a modulated signal to propagate over long
distances in optical fiber. In dense wavelength division multiplexing (DWDM)
systems, excessive chirp also can cause inter-channel interference. The two
significant factors of chirp are:
• dispersion which is a function of the transmission link’s length and fiber type
• cross talk caused by chirp due to closely spaced channels
A measurement could show the modulated signal (square wave) and the
chirp. The chirp fluctuates with time and the frequency change, seen at the
falling and rising ed ge of the time domain. The time resolved chirp solution
measures:
• intensity versus tim e
• frequency versus time
• calculates the alpha factor
The alpha factor is also referred to as linewidth enhancement factor. One definition of
α is:
α 2P ∆f()∆p()⁄=
During initialization, the instrument does an auto peak, gathe rs inf o rma tion
about the peaks, and tunes the fil te r m a rke r. The unmodulated data in shown
in the square wave pattern and the chirp is the frequency which runs through
the square wave pattern.
To smooth the chirp signal, increase the averages taken which will dec rease
the noise found on the signal. Increasing the number of averages and using the
longer pattern s will increase the measurement processing time. To shorten
the measurement processing time, either increase the power or decrease the
number of averag es. See the TRC Optio n U ser’s Guide for more details.
2-37
Page 78

Using the In s tr ument
Analyzer Operating Modes
2-38
Page 79

3
Function Reference
Page 80

Function Reference
Function Reference
Function Reference
This chapter is a n a lphabetical refer ence of front panel key s, softkeys, and
setup panel parameters. It is designed for quick information access. For example, during an operation you may find a key whose functio n is un fa miliar to
you. Note the key name and look the key up in this chapter.
Active Function Area Assist
Sets the active function area to the first or top softkey function. When this
function is on, the active area is automatically set. For example, when you
press the fron t-panel Wavelength key, the active function area assist will set
the active function to the Cen ter WL. Yo u can immediately enter th e de sired
center wavelength without pressing the Center WL softkey. If this function is
off, the active dialog box will not appear on the display. To a c c ess the individ ual dialog box, press the desired softkey function.
Key Path System > More System Functions > Display Setup
Related Functions Move Active Area
3-2
Page 81

Function Reference
Active Marker
Active Marker
Accesses the menu that allows you to se lect an active mark er. Selectin g a
marker always places that marker on the center wavelength of the active
trace. Up to four markers can be simultaneously displayed. If multiple markers
are displayed, the active marker appears as a white diamond and the othe r
markers appear as green diamonds. The Mkr notation on top of th e graticule
area indicates the trace where the marker is located. For example, Marker 2
on trace B would read Mkr 2(B).
See “Tips for Using Traces and Markers” on page 2-27, and “Measuring the Dif ference between Traces” on page 2-28.
Key Path Markers > Active Marker
Related Functions Active Trace, Peak Search, Pit Search, Marker to Center, Marker to Refer-
ence Level
Remote
Commands
CALCulate[1|2|3|4|5|6]:MARKer[1|2|3|4]:STATe
CALCulate[1|2|3|4|5|6]:MARKer[1|2|3|4]:AOFF
Active Trace
Accesses the menu that allows you to select an active trace for viewing, updating, or storing . The trace must be active before you can put a marker on it or
make changes to it. There are six traces available.
See “Tips for Using Traces and Markers” on page 2-27, and “Measuring the Dif ference between Traces” on page 2-28.
Key Path Traces > Active Trace
Markers > Active Trace
Related Functions Trace Math, View (Trace), Update (Trace)
Remote
Commands
CALCulate[1|2|3|4|5|6]:MARKer[1|2|3|4]:TRACe
TRACe:FEED:INPute TRA,2
TRACe:FEED:CONTrol:TR A, ALWays
DISPlay:WIND o w :TRACe TRA, ON
3-3
Page 82

Function Reference
Adv Service Functions
Adv Service Functions
Accesses the following functions:
• Grating Orde r
• More Adv Service Menu
• Wavelength Limit
• Zero Now
Key Path System > More System Functions > Service Menu > Adv Service Functions
Advanced Line Mkr Functions
Accesses the following functions:
• integrate limit
• search limit
• sweep limit
• trace integ
Key Path Markers > More Ma rker Functions > Line M arker Menu > Advance d Line
Mkr Functions
Agilent Logo (Display Setup Panel)
Accesses the pane l t ha t al lows you to turn the Agilent logo on or off. Wh en
this function is on, the Agilent logo appears on the display’s upper, left corner
of the graticule a nd on printouts.
Key Path System > More System Functions > Display Setup
All Math Off
Turns all the trace math functions off.
Key Path Traces > Trace Math Off > All Math Off
3-4
Page 83

All Off
Turns all the active markers off.
Note If filter mode is on, this function is not available.
Key Path Markers > Active Marker > All Off
Function Reference
All Off
Remote
Commands
CALCulate[1|2|3|4|5|6]:MARKer[1|2|3|4]:AOFF
Amplitude
Accesses the menu of keys that allow you to control the instrument’s sensitiv-
ity and amplitude sc a les. The function keys include:
• amplitude setup
• display mode
• peak to ref level
• reference level
• scale/div
• sensitivity
• trace integ
Key Path Amplitude
3-5
Page 84

Function Reference
Amplitude Setup
Amplitude Setup
Accesses the Amplitude Setup panel that allows you to specify amplitude
related fu nctions:
• amplitude correction mode
• amplitude correction sel
• amplitude units
• auto chop mode
• auto ranging
• auto zero
• power calibration
• reference level position
• user power cal date
The Amplitude Setup panel
3-6
Page 85

Function Reference
Amplitude Setup
Setup Panel
Selections
Reference Level Position
The value sele cted f or the Re fer ence Lev el Posit ion d etermin es th e posi tion o f
the reference lev el on the graticule. Setting this value t o zer o d iv isions places
the reference level on the very bottom of the grid. Setting the r eference level
to 10 divisions plac es the reference leve l a t th e top of the grid. Pressing the
front-panel Preset key rese ts the reference level to 9.0 divisions.
Note When using the knob or st ep keys, the value will automatically chan ge. When
using the numeric entry pad, enter a terminator that is selected from the
softkey panel.
Amplitude Units
Selecting Auto for amplitude units allows power to be sh own i n dB m when
using the logarithmic scale, and in watts when using the linear scale. Selecting
W forces the immediately displayed information to be in watts, regardless of
the amplitude scaling.
Auto Ranging
The Auto Range function allows the OSA to automatically change the gain of
the transimpedance amplifier during a sweep. This allows measurements to be
made at the largest dy na m ic range and at the fastest sweep speed.
Pressing the front-panel Preset key turns Auto Ranging
ON.
Note It is recommended that Auto Ranging always be turned on.
Auto Zero
Turns Auto Zero
be zeroed between sweeps. Selecting
ON and OFF. Auto Zero ON ena bles the internal amplifiers to
OFF disables this feature. Pressing the
front-panel Preset key resets th i s function to
ON.
3-7
Page 86

Function Reference
Amplitude Setup
Note Tu rning Au to Zer o off allow s the instru ment to sweep f aste r, but results in less
accuracy on low level signals. The optical spectrum analyzer performs a more
complete zeroing w hen the instru ment is first turn ed on. Y ou can run this mor e
complete routin e a nytime by pressing the Zero Now softkey.
Auto Chop Mode
(Not available on 86144B/86146B models)
Enables the optical spectrum analyzer chop mode. Chop mode increases
dynamic range f or long sweep times by subtracting amb ien t light. Subtracting
the ambient light can improve sensitivity but slows down the sweep speed.
Pressing the front-panel Preset key turns this function
OFF.
Note Sweep times of 50 msec × the # of trace poin ts, or longer, use a special “chop”
mode. Chop mode increases dynamic range, stabilizes measurements against
drift, and reduces effects of stray light. This special chop mode is enabled by
setting the Auto Chop mo de to on.
Power Calibration
Power Calibration allows you to use amplitude correction factors either from
the factory calibration or from the last successful user calibration. Pressing
the front-panel Preset key resets this function to User. If a user calibration has
not been performed, the factory calibration data is used.
User Power Cal Date
The User Power Ca l Date displays the date of the last succ essful user-performed amplitude c a li bration.
Amplitude Correction Sel
Allows you to selec t a cor recti on se t to be appl ied to th e mea suremen t resu lts.
Only one set can be selected at a time. Refer to “Amplitude Correction Remote
Commands” on page 5-16 for an overv i ew o f the amplitude correc tion remote
commands.
Amplitude Correction Mode
Allows you to turn the AMPCOR ON or OFF.
3-8
Page 87

When AMPCOR is turned on, the correction points are applied across the
active measurement range and added to all measurement results. Between
points, the correction values are interpolated linearly or logarithmically. When
measuring at wav elengths outside the first a nd last correction points, the first
or last value (as approp riate) is used as the correction value.
Whenever AMPCOR is active, the currently selected correction set is displayed in the lower left corner of the screen. For example, if correction set
number one is selected, “A1” is displayed. Re fe r to “Amplitude Correction
Remote Commands” on page 5-16 for an overview of the amplitude correction
remote commands.
Key Path Amplitude > Amplitude Setup...
Related Functions Reference Level, Sensitivity
Function Reference
Amplitude Units (Amplitude Setup Panel)
Remote
Commands
(Amplitude Display Mode):DI SP la y:WINDow:TRA C e:Y:SCALe LINear
DISPlay:WINDow:TRACe:Y:SCALe LOGarithmic
(Amplitude Units):UNIT:POWer
(Auto Zero):CALibration:ZERO
(Reference Level Positio n ) :DISPlay:WINDow:TRACe:Y:SCALe:RPOSition
Amplitude Units (Amplitude Setup Panel)
Selects the amplitude scale’s units. Selecting Auto for amplitude units allows
power to be shown in dB when using the logarithmic scale and in watt s when
using the linear sc ale. Sele cting W forc es the reado ut to be in watts, regardles s
of the amplitude scaling.
Key Path Amplitude > Amplitude Setup > Amplitude Units
Related Functions Display Mode, Trace Marker, Scale/Div
Remote
Commands
UNIT:POWer
3-9
Page 88

Function Reference
Auto Align
Auto Align
Pressing the auto align button on the front panel of the instrument performs
an automatic alig nm ent of the instrument using the larges t si gnal found in a
full span sweep. This aligns the output of the monochromator with the photodetector for impro v e d amplitude accuracy. To ensure maximum amplitude
accuracy and stability, connect an input signal to the instrument, mark the
peak of the signal, and then press Auto Align. This starts an automatic alignment procedure that should be performed whenever the instrument has been:
• moved
• subjected to a 2
• restarted and warmed up at the start of each day
The automatic alignment requires the connection of an external, broadband or
narrowband, ligh t source. If there is ins ufficient signal power, the automatic
alignment will not b e performed and an error message will be repo rted.
The auto align function saves and restore s the current instrument state. This
allows the auto align function to be used in the middle of a measurement routine.
If markers ar e tur ne d on , the au t o ali gn fu n cti on a tte mpt s to do th e au tom at ic
alignment at the wavelength of the active marker. If the instrument is in zero
span, the alignment is performed at the center wavelength.
° temperature change
Key Path Auto Align
Related Functions Auto Meas
Auto Align & Add to Trajectory
Calibrator Multi-Pt Align
User Source Multi-Pt Align
Remote
Commands
CALibration:ALIGn
CALibration:ALIGn:MARKer[1|2|3|4]
3-10
Page 89

Function Reference
Auto Align & Add to Trajectory
Auto Align & Add to Trajectory
Allows alignment at several wavelengths, ensuring amplitude accuracy of your
measurements. B efore initiating the alignment, connect a b roa dband light
source to the front-panel input connector. (You may add and/or update th e
existing points in the trajectory table.) Press Auto Align Preset to clear the
table.
Tu r n on a n a c tive marker and manually place the marker at the desired wave length. If an active m a rker is not turned on, the instrument will automatically
turn on an active marker and auto align at the largest input signal. The minimum recommended spacing between points is 5 nm for the external, single
mode fiber (Agilent 86144B/86146B onl y) and 50 nm for the internal, multimode fiber. The span must be >3 nm for the single mode fiber and >25 nm for
the multi-mode fiber.
Note Error 5001, Auto align cannot find input signal, will occur if a broadband light
source is not connected to th e fr ont-panel input connector.
Error 5070, T ra jectory Add Fail ed, will occur if the trajector y table is full o r the
computed traj ectory table is invalid.
Key Path Systems > More System Functions > Service Menu > Adv Service Functions
>More Adv Service Menu > Multi-Point Align > Auto Align & Add to Trajectory
Related Functions Auto Align P reset
Calibrator Multi-Pt Align
User Source Mutli-Pt Align
Remote
Commands
CALibration:ALIGn:TADD
Auto Meas
Pressing the Auto Meas button on the front panel of the in strument performs
an automatic measurement of the largest signal found in a full span sweep and
places a marker at th e signal peak. The signal must have at least 10 dB of
excursion. (Refer to “Peak Excursion (Marker Setup Panel)” on page 3-57 for
additional inf ormat ion .) Auto meas ure r equir es t he con nec tion o f a n ext ernal ,
3-11
Page 90

Function Reference
Auto Meas
broadband or n arrowba nd light s ource. If there is in suffic ient sign al power, the
automatic measurement will not be performed, and a warning message will be
reported. This automatic measurement routine is nor ma l ly the best way to
adjust sensiti vity while maintaining the fastest sweep rates.
The auto measure f unction uses trace A to perform the measurem ent. Since
the auto measure function can alter the instrument state, we recommend that
this operation be performed before a measurement sequence is started.
Auto Measure Setup panel allows you to m od ify the auto measure span a n d
the vertical scale, tune to the wavelength indicated by th e m a rke r, and optimize the sensitivity.
Span selects the wavelength span for viewing the signal located by the auto
measure function. If auto is specified, the span is set wide enough to display
most of the signal. If a particular span is desired, deselect auto and put the
desired span in the nm dialog box. The default selection for span is auto.
Note If the span is set too narrow, the auto measure operation m ay not complete
successfully. If this happens a warning message is displayed.
Scale/Div selection sets the verti c al scale to be used after performing the
auto measure function. If auto is specified, the measurement function sets the
vertical scale to a value based on the dynamic range of the signal. If a particular vertical scale is desired, deselect auto and put the desired dB/div in the dB
dialog box. The default selection for dB/div is auto.
AutoMeas at Marker turns the auto measure marker on or off. Selecting the
on state for auto measure at marker causes the auto measure function to perform its operation at the wavelength of the active marker. This allows you to
measure a signal ot her than the largest on e fo und in a full span sweep. Th e
default selection for auto measure at marker is off.
Optimize Sensitivity, when turned on, causes the auto measure function to
set the sensitiv it y so the resulting measurement has a minima l amount of
noise. It does this by finding the minimum in th e measurement trace and comparing this valu e to the known sensitivity of the instrument at that wavelength. Sensitiv ity is then reduced unti l the signal is close to this minimum
sensitivity or the swee p ti me beco mes to o long. Th e Opti mize Sensi tiv ity f unction is useful when viewing high dynamic range signals. The drawback to turning this function
better sensitivity. The default selection for Optimize Sensitivity is
ON is that it generally requires a longer sweep time to get
OFF.
3-12
Page 91

Function Reference
Auto Ranging (Amplitude Setup Panel)
Note None of the Automeasure Setup parameters are affected by the front-panel
Preset key. They are not sa ved as part of the measurement setup.
Key Path Auto Meas
Related Functions Auto Align
Remote
Commands
DISPlay[:WINDow[1]]:TRACe:ALL[:SCALe][:AUTO]
DISPlay[:WINDow[1]]:TRACe:X{:SCALe]:AUTO:SPAN
DISPlay[:WINDow[1]]:TRACe:Y{:SCALe]:AUTO:PDIVision
DISPlay[:WINDow[1]]:TRAC e:ALL[:SCALe] [:AUTO]:MARK e r OF F |ON|0|1
Auto Ranging (Amplitude Setup Panel)
When on, the au to r anging allows the O SA to achieve the d esired sens itivity by
taking several sweeps and switching between gain stages. The final trace data
is a blended composite of each trace taken in the different gain stages.
Note The sweep time (ST) that is displayed in the lower portion of the display is the
time that it takes for the OSA to sweep over one gain stage. The OSA may take
up to three sweeps in three different gain stages to make the measurement.
This depends on the settings for sensitivity, reference level, auto range and also
the particular device being measured. The final data trace is a blended
composite of each trace taken in the different gain stages. For more
information, refer to “Sweep Time ” on page 3-89.
Setting Auto Range to off will force the OSA to use a single gain stage and
achieve the desired sensitivity by applying a digital filter.
Key Path Amplitude > Amplitude Setup > Auto Range
Remote
Commands
SENSe:POWer:DC:RANGe:AUTO
3-13
Page 92

Function Reference
Auto Zero (Amplitude Setup Panel)
Auto Zero (Amplitude Setup Panel)
Turns Auto Zero on and off. Auto Zero on enables the internal amplifiers to be
zeroed between sweeps. In this mode, the instrument compensates for temperature-related current drift between each sweep. Although this “zeroing”
increases amplitude accuracy, it also increases the time between sweeps. If
amplitude acc uracy is not critical to your measurement, turning off auto zero
will improve throughput. Pressing the front-panel Preset key resets this function to on.
Tip: The instrument performs a more com plete zeroing when the instrument
is first turn e d on. You can run th i s mor e comp le te ro ut ine a nyt ime by pr essi n g
the Zero Now (System > More Syst em Fu nc t io ns > Service Menu > Adv Service Functions > Zero Now) softkey.
Key Path Amplitude > Amplitude Setup > Auto Zero
Related Functions Zero Now
Remote
Commands
CALibration:ZERO
Averaging
When averaging is on, you can select the number of measurement sweeps to
be averaged, using the 10, 20, 50, 10 0 so ftkeys. You can also enter averaging
values other than those displayed by using the numeric keypad or the knob.
When the number of sweeps taken is less than the count, the following formula is used to calculat e th e da t a :
AVG
If the number of sweeps is greater than or equal to the count, th e fol l o wi ng
formula is used to calculate the data:
æö
ç÷
New average
èø
3-14
sum of current sweeps
-----------------------------------------------------------------------------=
number of averages selected
count 1–
----------------------- -
count
×=
last average
new measuremen t
-----------------------------------------------------+
count
Page 93

Key Path Traces > Averaging
Function Reference
Backup Internal Memory
Remote
Commands
CALCulate[1|2|3|4|5|6]:AVERage:COUNt
CALCulate[1|2|3|4|5|6]:AVERage:STATe
Backup Internal Memory
Allows you to make a complete backup of user memory onto a floppy disk. All
user files (measurement, trace, and specification sets) are saved. You can
recall the backup contents into the instrument with the Restore Internal Memory function. Refer to “Backing U p or R estoring the Inter na l Memory” on
page 2-20
A screen appears asking you to insert a forma tted floppy disk into the floppy
drive. The disk will not be viewable on a PC and no trace or measurement files
can be saved onto the disk until it is reformatted. The backup internal memory
function overwrites the floppy disk with a new image, so only the latest
backup information can be recovere d thr ough the Restore Internal Memory
operation. Any existing files or catalogs on the fl o pp y disk will be dest ro yed.
Key Path Save/Recall > Backup/Restore Menu > Backup Internal Memory
Backup/Restore Menu
Accesses the instrument utilities used to backup or restore internal memory.
Key Path Save/Recall > Backup/Restore Menu
3-15
Page 94

Function Reference
Bandwidth Marker Interpolation (Marker Setup Panel)
Bandwidth Marker Interpolation (Marker Setup Panel)
Turns the bandwidth marker interpolation on or of f. When on, the bandwi dth
markers will be placed at the exact number of dB (NDB) from the normal
marker, if within the trace ra nge. The position of the marker will be linearly
interpolated bet w een the two nearest trace data points. The def a ult state is
on. If interpol a t e is off, for negative number of dB (NDB) value s, the bandwidth markers will be at value s closest to and more negative th en the NDB
value. For positive NDB values, the bandwidth markers will be at values closest to and more positive than the NDB values. This will typically result in a
wider bandwidth measurement.
Key Path Markers > Marker Setup > Bandwidth Marker Interpolation
Related Functions Active M a rker, Delta Mark er, Bandwidth Mark er
Remote
Commands
CALCulate[1|2|3|4|5|6]:MARKer[1|2|3|4]:FUNCtion:BANDwidth
:INTerpolation
Bandwidth/Sweep
Accesses the menu th at allow s you to change ban dwidth , sweep se ttings , fiber
selection, tr igger mode, and ADC sync. You can also access these functi ons
from the Measure menu Bandwidth/Sweep selection. The function keys
include:
• more BW/sweep functions
• repeat sweep
• res BW
• select fiber
• single sweep
• sweep time
• video BW
3-16
Page 95

BW Marker Units (Marker Setup Panel)
BW Marker Units (Marker Setup Panel)
Sets the bandwidth marker X-axis readout for fre q uency or wavelength when
the instrument i s in a non-ze ro span. The availab le selectio ns are nm,
GHz, and THz. The default unit is nm (nanometers). This setting controls all
four bandwidth markers. The normal and de lta offset markers have their own
settings.
Key Path Markers > Marker Setup > BW Marker Units
Related Functions Marker BW
Function Reference
µm, Ang,
Remote
Commands
CALCulate[1|2|3|4|5|6]:MARKer[1|2|3|4]:FUNCtion:BANDwidth:READout
Calibration
Accesses the Power Cal Setup and Wavelength Calibration Setup softkeys.
The Power Calib ra ti o n Setup panel will show th e date of the last factory performed power cali bration and the date of the last successful user-performed
power calibration. It also allows you to set the calibration power and wavelength used for the next calibration. Refer to “Calibrating Wavelength Mea-
surements” on page 2-14
Set Calibration Power is the exact ampl itude of the calibration source tha t
will be used for the next power calibration. The power entered must be within
+10 dBm and –3 dBm of the amplitude mea su re d using t he factor y cal ib ratio n.
Set Calibration Wavelength is the approximate wavelength of the calibration source that will be used for the next user po wer calibration. The wavelength entered must be within 2.5 nm of the wa v el ength measured usi ng the
factory calibration.
Pressing the Perform Calibration softkey will display on-screen instructio ns
for performin g the calibration.
Key Path Systems > Calibration
Remote
Commands
CALibration:POWer:POWer
CALibration:POWer:Wavelength
3-17
Page 96

Function Reference
Calibrator Multi-Pt Align
Calibrator Multi-Pt Align
Adjusts the mechanical position of the instrument’s internal optical components ensuring amplitude accuracy of your measurements. Before initi a ti ng
the alignment, connect the internal calibrator to the front-panel input connector. Refer to “External Multipoint Wavelength Calibration” on page 2-17
The instrument automatically sets the start wavelength at 1490 nm, stop
wavelength at 1590 nm, span, and reference level, and then perf orms a fully
automatic, internal auto align. The input signal is aligned at equally spaced
alignments (mi nimum 50 nm spacing b etween points) for th e i n te rnal, multimode fiber or (minimum 5 nm spacing between points) for the external, single-mode fiber (Agilent 86144B/86146B only).
Note Error 5056, Trajectory align cannot find input signal, will occur if a broadband
light source is not connected to the front-panel input connector.
Error 5060, Trajectory align failed, will occur if the align procedure fail ed .
Key Path System > More System Functions > Service Menus > Adv Service Functions
> More Adv Service Menu > Multi-Point Align > Calibrator Mul ti -Pt Align
Related Functions Auto Align & Add To Trajectory
Auto Align Preset
User Source Multi-Pt Align
Remote
Commands
CALibration:ALIGn:INTernal
Center Wavelength (WL)
Sets the center wavelength using the knob, step keys, or numeric keys. The
span remains constant. The center wavelength and the start and stop wavelength settings are related as follows:
stop wavelength start wavelength
Center Wavelength
Key Path Wavelength > Center WL
3-18
-------------------------------------------------------------------------------------------------------- -=
+
2
Page 97

Related Functions Start WL, Stop WL, Span
Function Reference
Center Wavelength Step Size (Wavelength Setup Panel)
Remote
Commands
SENSe:WAVelength:CENTer
Center Wavelength Step Size (Wavelength Setup Panel)
Specifies the center wavelength step size. This is used for incrementing center
wavelength using the
Key Path Wavelength > Wavelength Setup > Cen ter Wavelength Step Size
Remote
Commands
SENSe:WAVelength:CENTer:STEP:INCRement
↑ and ↓ keys.
Configure Network
Starts a utility that allows you to enable and configure networking. Enter this
menu only if you have all the necessary networking parameters. Refer to “File
Sharing and Printing over a Network” on page 2-26
Key Path System > More System Functions > GPIB & Network Setup > Configure Net-
work
Current GPIB Address (Remote Setup Panel)
Displays the GPIB a ddress currently be ing used. To change the address, use
the numeric keys, ste p keys, or knob to enter th e new GPIB address information in the Remote Setup panel.
Key Path System > More System Functi ons > GPIB & Network Setup > GPIB Address
3-19
Page 98

Function Reference
Current Source Setup
Current Source Setup
Accesses the Current Source Setup panel that allows you to turn on or off the
current source, set the current limit, enable pulse width, duty ratio, and synchronize the ADC sync output. Refer to “Ope rating the Interna l White Light
Source” on page 2-4
Key Path System > Options > Current Source Setup
Related Functions ADC sync, current limit, pulse width, duty ratio
Remote
SOURce:CURRent:PULSe:STATe ON|OFF
Commands
Date/Time (Display Setup Panel)
Turns the date and time on the display on or off. When on, the date and time
will appear on the display’s lower, right corner of the displa y an d on pri n tou ts.
Key Path System > More System Functions > Display Setup
Related Functions SYSTem:TIMe
Default Math Trace C
Defines the math ex pr ession to be used and turns the math operation on:
-B, C=A
C=A
LOG
The math operation is performed in linear units.
See “Using Trace Math to M easure Wavelength Drift” on page 2-29.
Key Path Traces > Trace Math Off > Default Math Trace C
+B, C=A
LOG
-B, or C=A
LIN
+B. The result is placed in Trace C.
LIN
Remote
Commands
CALCulate3:MATH: STATE OFF|ON|0|1
3-20
Page 99

Default Math Trace F
Defines the math ex pr ession to be used and turns the math operation on:
-D. The result is p la c ed in T ra c e F. The math operation is performed in
F=C
LOG
linear units.
See “Using Trace Math to Mea sure Wavelength Drift” on page 2-29.
Key Path Traces > Trace Math Off > Default Math Trace F
Function Reference
Default Math Trace F
Remote
Commands
CALCulate6:MATH: STATE OFF|ON|0|1
Delete From (Delete Setup Panel)
Selects whether to delete a fil e fro m a floppy disk, internal memory, or a networked file share.
Key Path Save/Recall > Delete Menu > Delete File From
Remote
Commands
MMEMory:DELete
Delete Menu
Accesses the Delete Setup panel that allows you to delete files from a floppy
disk, internal memory, or a networked file share.
Key Path Save/Recall > Delete Menu
Remote
Commands
MMEMory:DELete
3-21
Page 100

Function Reference
Delta Marker On/Off
Delta Marker On/Off
This toggle func tion fixes the posit ion of the referenc e m a rk e r an d activates
the delta marker. This measures the di fference b etween t he active (r eference)
marker and the delta marker. The front knob, step keys, or keypad can be
used to move the delta marker to the desired location. Refer to “Measuring the
Difference between Traces” on page 2-28
If the delta function is turned on and no marker is active, Marker #1 will be
turned on and placed at the center wavelength as a reference for the delta
marker.
Note For Agilent 86144B/86146B only, if filter mode is enabled, the noise marker,
delta marker, and OSNR marker are disabled.
Key Path Markers > More M a rker Functions > De lta Marker
Remote
Commands
CALCulate[1|2|3|4|5|6]:MARKer[1|2|3|4]:FUNCtion:DELTa:STATe
Delta Marker Units (Marker Setup Panel)
Sets the delta marker X-axis readout for frequency or wavelength when the
instrument is in a non-zero span. The available selections are nm,
GHz, and THz. The default units are nm (nanometers). This setting controls
all four delt a ma rk ers. The normal and bandwidth markers have their own settings.
Key Path Markers > Marke r Setup > Delta Mark e r U n its
Related Functions Delta Marker
Remote
Commands
CALCulate[1|2|3|4|5|6]:MARKer[1|2|3|4]:FUNCtion:DELTa:X:READout
µm, Ang,
3-22
 Loading...