

Page 1

Agilent
Technologies, Inc. www.agilent.com
24001
E.
Mission
Liberty
take,
WA
99019
..':Pi;..
,.**:*%,
:
Agilent Technologies
Innovating
June
Dear Customer,
As of November
semiconductor products, health care solutions, and chemical analysis became a new company,
Agilent Technologies. Now, many
Agilent Technologies.
At Agilent Technologies, we are working diligently to make this transition
you. However, as a result of this transition, the products and related documentation contained in this
shipment may be labeled with either the Hewlett-Packard name and logo, the Agilent Technologies
name and logo, or a combination
(HP), but applies to your Agilent Technologies product. Hewlett-Packard and Agilent branded
products with the same model number are interchangeable.
the
8,2000
HP
Way
1
,
1999,
four of Hewlett-Packard's businesses, test and measurement,
of your Hewlett-Packard products and services are in the care
as
of
both. Information in this package may refer to Hewlett-Packard
of
smooth as possible for
Whatever logo you see, the information, products, and services come from the same reliable source.
If
you have questions about Agilent Technologies products and services, please visit our website at
http://www.aailent.com.
Sincerely,
Rebranding Team
Page 2

,
HP
8901B
MODULATION ANALYZER
Operation and Calibration Manual
2314A
SERIAL
This
manual provides complete information for
struments with serial-number prefixes:
and
Above
Information for
instruments with serial-number prefixes not listed
in
For additional important information about serial
numbers, refer
THIS
and
all
MAJOR
MAJOR
the above range.
to
MANUAL”
“INSTRUMENTS
in
NUMBERS
changes that apply
rev.
28MA
Y93
changes is also provided for
COVERED
Section
Sixth
1.
Edition
to
in-
your
BY
instrum
ent.
This
material
Government pursuant
der the clause at DFARS 52.227-7013
Copyright@HEWLETT-PACKARD
EAST
24001
MISSION AVENUE, LIBERTY LAKE, WASHINGTON, U.S.A.
Operation
Other Documents Available:
Service Manual (Volume 2,3,4) HP Part 08901-90114
Basic Operation
Microfiche operation and Calibration Manual HP Part 08901-901 15
Microfiche Service Manual HP Part 08901-90116
and
Calibration Manual HP Part 08901-90113
and
Application Guide 08901-901
may
be reproduced by
to
17
the Copyright License
or
for the
(AF’R
COMPANY
U.S.
un-
1988).
1989
99019-9599
Printed in U.S.A. : May 1995
HEWLETT
Fa
PACKARD
Page 3

1
Regulatory Information
(Updated March
1999)
1
Page 4

Regulatory Information (Updated March
Safety Considerations
GENERAL
This product and related documentation must be reviewed for familiarization with safety
markings and instructions before operation.
1999)
This product
"Safety Requirements for Electronic Measuring Apparatus," and
safe condition. This instruction documentation contains information and warnings which
must be followed by the user to ensure safe operation and
condition.
SAFETY EARTH GROUND
A uninterruptible safety earth ground must be provided from the main power source to the
product input wiring terminals, power cord, or supplied power cord set.
SAFETY
A
Indicates instrument damage can occur
A
Indicates hazardous voltages.
Indicates earth (ground) terminal
WARNING
has
been designed and tested in accordance with
SYMBOLS
~~~~~
A
WARNING
practice, or the like, which,
could result in personal
note denotes a hazard. It calls attention to a procedure,
IEC
Publication
has
been supplied in
to
maintain the product in a safe
if
indicated operating limits are exceeded.
if
not correctly performed or adhered to,
injury.
Do
not proceed beyond a
WARNING
1010,
sign until the indicated conditions are fully understood and met.
a
CAUTION
A CAUTION note denotes a hazard.
procedure, practice, or the like, which, if not correctly performed or adhered
to
to, could result in damage
not proceed beyond an CAUTION note until the indicated conditions are fully
understood and met.
or
It
calls attention
destruction of part or
to
an operation
all
of the product.
Do
2
Chapter
1
Page 5

Regulatory Information
(Updated
March
1999)
Safety Considerations
WARNING
This product
protective earthing ground incorporated in the power cord). The
mains plug shall only be inserted
protective earth contact. Any interruption of the protective
conductor inside or outside of the product
product dangerous. Intentional interruption
Whenever
instrument must be made inoperative and be secured against any
unintended operation.
If
this
instrument is to be energized via an auto transformer (for
voltage reduction), make sure the common terminal
the earth terminal of the power source.
If
this product
the equipment could be impaired. This product must be used in a
normal condition (in which all means
No
operator serviceable
qualified personnel.
covers.
for
this Instrument
is
a Safety Class I instrument (provided with a
it
is
likely that the protection has been impaired, the
is
not used
in
a socket outlet provided with a
is
likely to make the
is
prohibited.
is
connected to
as
specified, the protection provided by
for
protection are intact) only.
parts
To
prevent electrical shock, do not remove
in this product. Refer servicing to
Servicing instructions are
for
use by qualified personnel only.
To
avoid electrical shock, do not perform any servicing unless you are
qualified to do
so.
The opening of covers or removal of parts is likely to expose
dangerous voltages. Disconnect the product from
while
The power cord
live for
it
is
being opened.
is
connected
5
seconds after disconnecting the plug
to
internal capacitors that
all
from
voltage sources
my
remain
its
power supply.
For Continued protection against fire hazard, replace the line fuse(s)
only
with
example, normal blow or time delay).
250
V
fuse(s) or the same current rating and type (for
Do
not use repaired fuses or
short circuited fuseholders.
Always use the three-prong ac power cord supplied with this
product. Failure
to
ensure adequate earth grounding by not using
this cord may cause product damage.
This product
Pollution Degree
INDOOR
is
USE
designed
2
per
ONLY.
for
IEC
use in Installation Category
1010
and
IEC
664
respectively.
11
and
FOR
This product has autoranging line voltage input, be sure the supply
voltage
is
within the specified range.
Chapter
1
3
Page 6

Regulatory Information (Updated March
To
prevent electrical shock, disconnect instrument from mains (line)
before cleaning. Use a dry cloth or one slightly dampened with water
to clean the external case parts.
Ventilation Requirements: When installing the product in a cabinet,
the convection into and out
The ambient temperature (outside the cabinet) must be less than the
maximum operating temperature of the product by
watts dissipated in the cabinet.
cabinet is greater than
used.
Product Markings
1999)
Do
not attempt to clean internally.
of
the product must not be restricted.
If
the total power dissipated in the
800
watts, then forced convection
4"
C
for every
must
100
be
CE - the CE mark
is
a registered trademark
of
the European Community. A CE mark
accompanied by a year indicated the year the design was proven.
CSA
-
the
CSA
mark
is
a registered trademark
of
the Canadian Standards Association.
4
Chapter
1
Page 7

CERTIFICATION
Hewlett-Packard Company certifies that this product met its published specifications at the time
from the factory. Hewlett-Packard further certifies
that
its calibration measurements are traceable to
of
shipment
the
United
States National Bureau of Standards, to the extent allowed by the Bureau’s calibration facility, and to the
calibration facilities of other International Standards Organization members.
WARRANTY
This Hewlett-Packard instrument product
of one year from date of shipment. During the warranty period, Hewlett-Packard Company will at its option,
either repair or replace products which prove
For warranty service or repair, this product must
prepay shipping charges
shall pay
HP warrants that its software and firmware designated by HP for use with an instrument will execute
programming instructions when properly installed on
of
all
shipping charges, duties, and taxes for products returned
the instrument, or software, or firmware will be uninterrupted or error free.
to
HP and HP shall pay shipping charges
is
warranted against defects in material and workmanship for a period
to
be defective.
be
returned
that
to
a service facility designated by HP. Buyer
to
return the product
to
HP from another country.
instrument. HP does not warrant that the operation
to
Buyer. However, Buyer
shall
its
LIMITATION OF WARRANTY
The foregoing warranty shall not apply
Buyer-supplied software
specifications for the product, or improper site preparation or maintenance.
or
interfacing, unauthorized modification or misuse, operation outside of the environmental
to
defects resulting from improper or inadequate maintenance
by
Buyer,
NO OTHER WARRANTY
WARRANTIES
OF
IS
EXPRESSED OR IMPLED. HP SPECIFICALLY DISCLAIMS THE IMPLED
MERCHANTABILITY AND FITNESS FOR A PARTICULAR PURPOSE.
EXCLUSIVE REMEDIES
THE REMEDIES PROVIDED HEREIN ARE BUYER’S SOLE AND EXCLUSIVE REMEDIES. HP
NOT BE LIABLE FOR ANY DIRECT, INDIRECT, SPECIAL, INCIDENTAL, OR CONSEQUENTIAL
DAMAGES, WHETHER BASED ON CONTRACT, TORT, OR ANY OTHER LEGAL THEORY.
SHALL
ASSISTANCE
Product maintenance agreements and other customer assistance agreements are available for Hewlett-Packard
products.
For
any assistance, contact your nearest Hewlett-Packard Sales and Service Office. Addresses are provided at
the back of this manual.
iii
Page 8

Saftey
Considerations Model
SAFETY CONSIDERATIONS
GENERAL
This product and related documentation must be reviewed for familiarization with safety markings and
instructions before operation.
This product
with a protective earth terminal).
BEFORE APPLYING POWER
Verify that the product
line voltage and the correct fuse is installed.
SAFETY EARTH GROUND
An uninterruptible safety earth ground must be provided from the main power source to the product input
wiring terminals, power cord,
set.
SAFETY SYMBOLS
A
is necessary for the user to refer to the instruction
manual (refer to Table of Contents).
f
procedure, practice,
performed
jury.
Do
the indicated conditions are fully understood and met.
is
a
Safety Class I instrument (provided
is
set to match the available
or
supplied power cord
Instruction manual symbol: the product will
be marked with this symbol when it
Indicates hazardous voltages.
Indicates earth (ground) terminal.
The WARNING sign denotes
hazard. It calls attention to a
or
the like, which, if not correctly
or
adhered to, could result in personal in-
not proceed beyond a WARNING sign until
Any interruption of the protective (grounding)
conductor (inside
ment)
terminal will cause a potential shock hazard
that could result in personal injury. (Grounding one conductor of a two conductor outlet
is not sufficient protection).
Whenever it
been impaired, the instrument
inoperative and be secured against any unintended operation.
If this instrument is to be energized via an
autotransformer (for voltage reduction) make
sure the common terminal is connected to the
earth terminal of the power source.
Servicing instructions are for use by servicetrained personnel only.
electric shock, do not perform any servicing
unless qualified to do
Adjustments described in the manual are per-
formed with power supplied to the instrument
while protective covers are removed. Energy
a
available at many points may,
sult
Capacitors inside the instrument may still be
charged even if the instrument has been disconnected from its source of supply.
or
disconnecting the protective earth
is
likely that the protection has
in
personal injury.
or
outside the instru-
musl
To
avoid dangerous
so.
if
contacted, re-
8901B
be made
The CAUTION sign denotes a haz-
ard. It calls attention to an
operating procedure, practice,
correctly performed
age to or destruction of part
not proceed beyond a CAUTION sign until the indi-
cated conditions are fully understood and met.
iv
or
adhered to, could result in dam-
or
the like, which, if not
or
all
of
the product.
Do
For
continued protection against fire hazard,
replace the line fuse(s) only with
of the same current rating and type (for exam-
ple, normal
repaired fuses
fuseholders.
blow,
time delay, etc.).
or
short circuited
250V
Do
fuse(s)
not use
Page 9

Model
8901B
Saftey Considerations
ATTENTION
Static Sensitive
Devices
This instrument was constructed
charge) protected environment.
conductor devices used in this instrument are susceptible to damage
by static discharge.
Depending on the magnitude of the charge, device substrates can
be punctured
charge. The results can cause degradation of device performance,
early failure,
These charges are generated in numerous ways such
tact, separation of materials, and normal motions of persons
working with static sensitive devices.
When handling
devices, adequate precautions must be taken to prevent device darnage
or
Only those who are thoroughly familiar with industry accepted
techniques for handling static sensitive devices should attempt to
service circuitry with these devices.
In all instances, measures must be taken to prevent static charge
build-up on work surfaces and persons handling the devices.
For
further information on ESD precautions, refer to “SPECIAL
HANDLING CONSIDERATIONS
DEVICES”
or
destroyed
or
immediate destruction.
or
destruction.
in
Section VIII Service Section.
by
servicing equipment containing static sensitive
in
This
contact
an ESD (electro-static dis-
is
because most of the semi-
or
mere proximity of a static
as
simple con-
FOR
STATIC SENSITIVE
V
Page 10
Model
8901B
Contents
CONTENTS
Section
Introduction
Operation and Calibration Manual
Service Manual
Specifications
Safety Considerations
Recommended Test Equipment
Instniments Covered
Options
SerialNumbe
Documentation Updating
A
Description
Signing Up for the Documentation Update Service
Hewlett-Packard Interface Bus (HP-IB)
Compatibility.
Selecting the HP-IB Address
Additional Equipment Information
Options
Accessories Supplied
Electrical Equipment Available
Mechanical Equipment Available
Description
RF
RF Fkequency Measurements
Modulation Measurements
Filters, De-emphasis Networks and Modulation Calibrators
Additional Features
Specialhctions
Extending Measurement Range
Programmability
Principles
RF Circuitry
LOCircuitry
IFCircuitry
Audio Circuitry
Modulation Basics
Amplitude Modulation
Exponential Modulation
Other Considerations
to
This Manual
............................................
.......................................
..................................................
.....................................................
................................................
...........................................
by
This Manual
.......................................
......................................................
rs
..................................................
.............................................
of
the Manual Update Packet
.................................................
.........................................
.........................................
......................................................
...............................................
........................................
.......................................
of
the Modulation Analyzer
Power Measurements
...........................................
.........................................
..........................................
..............................................
................................................
........................................
................................................
of
Operation Using A Simplified Block
...................................................
..................................................
..................................................
................................................
.................................................
............................................
............................................
.............................................
1
.
General Information
................................
.....................................
......................................
Diagram
.............................
.........................
...........................
1-1
1.1
1-1
1.2
1.2
1.2
1.2
1-2
1-2
. 1-2
. 1-2
. 1-3
. 1-3
. 1-3
. 1-3
1-3
1-3
1-4
. 1-4
. 1-5
1-6
. 1-6
. 1-7
. 1-7
1-7
. 1-7
1-8
. 1-8
. 1-8
1-8
1-9
1-11
1-11
1-11
1-12
1-12
1-15
1-17
vii
Page 11

Contents Model 8901B
Section
Introduction
Initial Inspection
Preparation for Use
Power Requirements
Power Cables
Line Voltage and Fuse Selection
HP-IB Address Selection
Interconnections
Mating Connectors
Operating Environment
Bench Mounting
RackMounting
Removal and Installation
Storage and Shipment
Environment
Packaging
to
This Section
............................................
...................................................
.................................................
...............................................
...................................................
........................................
............................................
.................................................
...............................................
.............................................
.................................................
..................................................
of
Operating Information Pull-Out Cards
................................................
...................................................
.....................................................
Section
Introduction
Local
Remote Operation Section
Basic finctional Checks Section
Detailed Operating Instructions Section
Other Sources of Operating Information
Operating Characteristics
Operator’s Information
Fbes
Time Base 10 MHz Input and Time Base 10 MHz Output
Description
Turn-On Procedure
Instrument Features
Front-Panel Features
Rear-Panel Features
Remote Operation
Introduction to the Section
How to Use this Section to Make a Measurement
Programming the Modulation Analyzer
Overview
Valid
Invalid Characters
Programming Syntax
Code String Syntax (Sequence Dependency)
Programming Examples
Reference Tables
Data Output
Data Output Format
HP-IB Information
HP-IB Capabilities
HP-IB Address
to
This Section
Operation Section
............................................
.............................................
...........................................
.........................................
....................................
....................................
of
the Measuring Receiver
...............................
........................................................
....................................................
..................................................
.................................................
...............................................
...............................................
VIA
the Hewlett-Packard Interface Bus (HP-IB)
..........................................
.....................................
....................................................
Programming Codes
...........................................
...............................................
.............................................
............................................
................................................
....................................................
..............................................
................................................
..............................................
.................................................
2
3
................................
.
Installation
.....................
.
Operation
...............................
;
...............
.........................
.....................
.............................
2.1
2.1
2.1
2.1
2.2
2.4
2.4
2.8
2.8
2.8
2.8
2-8
2.8
2.9
2.9
2-9
3.1
3.1
3.1
3.1
3.2
3.2
3.2
3.2
3-2
3-3
3-3
3-3
3-4
3-6
3-9
3-13
3-13
3-13
3-13
3-13
3-13
3-14
3-15
3-16
3-17
3-17
3-18
3-18
3-19
3-19
3-20
viii
Page 12
Model
8901B
Contents
Section
Modulation Analyzer Remote Capabilities (IEEE-488)
Triggering Measurements
Trigger Modes
Triggers
Clear
Remote/Local
Mode Descriptions
Mode Transitions
Local Lockout
Clear Lockout/Set Local
Service Request Message (SRQ)
SRQ MASK (Special Fbnction
StatusB
Abort
Pass Controlflake Control
Status Bit
Additional Information
Annunciators
Reading the HP-IB Address Switch and
TALK and LISTEN
Code Execution in the Modulation Analyzer
Basic bctional Checks of the Modulation Analyzer
Description
Equipment
Procedure
Basic bctional Checks
Description
Initial Setup
Equipment
Procedures
Detailed Operating Instructions
Introduction
Section Organization
How
FW
Frequency Measurements (RF, LO.
Modulation Measurements Contents
Audio Measurements Contents
Additional Capabilities Contents
(T2.
......................................................
yte
......................................................
to
Find Information About a Specific Measurement
Power and Level Contents
(TO
and
T3.
GET. and the CLEAR Key)
.................................................
...............................................
...............................................
.................................................
...................................................
...................................................
..................................................
...................................................
...................................................
....................................................
...................................................
..................................................
...................................................
...................................................
to
This Section
...........................................
..........................................
T1)
........................................... 3-26
.......................................
22)
......................................
..........................................
..............................................
Status
of
Descriptions
the Hewlett-Packard Interface Bus (HP-IB)
..........................................
.........................................
.............................................
........................................
IF)
.......................................
......................................
3
.
Operation (cont’d)
...............................
SRQ
Status
..................................
................................
Contents
....................................
.............................
............................
..............................
...................
.........................
.............................
3-20
3-21
3-22
3-23
3-24
3-25
3-25
3-25
3-25
3-26
3-29
3-31
3-32
3-32
3-32
3-32
3-32
3-33
3-34
3-34
3-47
3-47
3-47
3-47
3-56
3-56
3-57
3-57
3-57
3-67
3-67
3-67
3-67
3-69
3-109
3-133
3-197
3-205
Introduction
Equipment Required
Performance Test Record
Calibration Cycle
Abbreviated Performance
.....................................................
.................................................
...................................................
Section
4
.
Performance Tests
..............................................
Testing
..........................................
4.1
4.1
4.1
4.1
4.1
ix
Page 13
Contents
Model
8901B
Performance Test
Performance Test
Performance Test
Performance Test
Performance
Performance Test
Performance Test
Performance Test
Performance Test
Performance Test
Performance
Performance Test Record
1
.
AM
2
.
FM
3
.
cPM
4 . Audio Filters
Test
5 . Audio Measurements
6 . Power Reference (Using Reference Comparison
7
.
Power Reference (Using DC Substitution)
8
.
Power Meter
9
.
SWR
10 . High-Selectivity (Options
Test
11
.
High-Selectivity Gain (Option Series
Section
..............................................
..............................................
.............................................
............................................
.............................................
4
........................................
........................................
Section
Introduction
Safety Considerations
Wipment Required
F'actory-Selected Components
Post-Repair Tests, Adjustments, and Checks
Related Adjustments
Adjustment
Adjustment
Adjustment
Adjustment
Adjustment
Adjustment
Adjustment
Adjustment
Adjustment
Adjustment
Adjustment
Adjustment
Adjustment
Adjustment
Adjustment
Adjustment
Adjustment
Adjustment
Adjustment
Adjustment
Adjustment
Adjustment
.....................................................
................................................
.................................................
............................................
.................................................
1
.
Power Supply
2 . Internal Reference
3
.
RF Level Detector Offset
4 . Sampler Efficiency and Offset
5
.
LO
Doubler Output Power and Balance
6
.
Voltmeter Offset
7
.
15
kHz
and
8
.
ALC
Reference
9
.
FM Calibrator
10 . FM Sensitivity
11
.
FM Flatness
12 . FM Distortion and Incidental
13 . cPM Sensitivity
14
.
AM
Calibrator
15
.
AM
16 . FM Distortion and Incidental AM . 455
17 . Tkack-The Mode Offset
18 . Power Reference (Using Reference Comparison
19 . Power Reference (Using DC Substitution
20 . Power Meter
21
22 . Battery Backup
Sensitivity
.
Audio True RMS Detector and Notch
............................................
.........................................
and
>20
Sensitivity
kHz
Low-Pass Filter Gain
..........................................
..........................................
.........................................
...........................................
.........................................
..........................................
.........................................
...........................................
.........................................
.
Performance Tests (cont'd)
...................................
.....................
.......................
032
and
033)
........................
030)
.......................
5
.
Adjustments
....................................
.....................................
...................................
............................
................................
..........................
AM
.
1.5
MHz
IF'
......................
kHz
IF
.......................
....................................
.......................
...........................
Filter
......................
Gain
4.2
4.8
4-14
4-18
4-20
4-25
4-26
4-29
4-31
4-33
4-38
4-40
5.1
5.1
5.1
5.2
5.2
5.2
5.5
5.6
5.7
5.8
5-10
5-12
5-14
5-15
5-16
5-17
5-18
5-19
5-21
5-23
5-24
5-25
5-27
5-28
5-30
5-33
5-35
5-37
X
Page 14

General
Information
Model
8901B
MODEL
LINE POWER CABLE
8901B
1-0
Figure
1-1.
HP
8901B
Modulation Analyzer and Supplied Accessories
Page 15

Model 8901B General Information
GENERAL INFORMATION
1-1.
INTRODUCTION TO THIS MANUAL
The HP 8901B
and the three volume
install, operate,
The information
5
are contained in this
Application Guide)
Service Manual
Service Manual Request Card
The Modulation Analyzer
Modulation Analyzers supplied with Options 001,002,003,004, and series 030.
Operation and Calibration Manual
Section
instrument description, options, accessories, specifications and other basic information. This section
also
1,
contains instrument theory of operation on a simplified block diagram level.
Operating and Service Manual
Service Manual.
test,
adjust, and service the Hewlett-Packard Model 8901B Modulation Analyzer.
to
operate and service this instrument
Operation and Calibration Manual
which is provided with each instrument. Sections 6 through 8 are contained in the
that
is
not included with the instrument but which can be obtained by mailing in the
is
General Information
Section
These four volumes contain
included in this manual.
shown in Figure
describes the instruments documented by this manual and covers
1-1
1
is comprised of an
is
made available
with all supplied accessories. These manuals document
Operation and Calibration Manual
all
the information required
as
follows: Sections 1 through
(that includes the
Basic Operation and
to
Section
address selection for remote operation), and storage and shipment.
Section
operating instructions for both local and remote operation.
Section
instrument against the critical specifications in Table
Section
2,
Installation
3,
Operation
4,
Performance Tests
5,
Adjustments
provides information about panel features and includes operating checks, and
provides information about initial inspection, preparation for use (including
provides the information required
1-1.
provides the information required
to
properly adjust the instrument.
to
check performance of the
Service Manual
Section
Section
tion information.
Section
Additional copies of the
separately through your nearest Hewlett-Packard office. The part numbers are listed on the title page
of this manual.
6,
Replaceable Parts
7,
Instrument Changes
8,
Service
provides the information required
provides ordering information for
provides backdating information, and retrofitting and modifica-
to
repair the instrument.
Operation and Calibration Manual
all
or the
replaceable parts and assemblies.
Service Manual
can be ordered
1-1
Page 16

General Information Model 8901B
1-2.
SPECIFICATIONS
Instrwnent specifications are listed in Table
against which the
acteristics,
information for the user.
1-3.
SAFETY CONSIDERATIONS
This product is a Safety Class I instrument (that is, provided with a protective earth terminal).
The Modulation Analyzer
safety markings
the beginning of
Safety information pertinent
adjustment
1-4.
RECOMMENDED TEST EQUIPMENT
Table
and servicing the Modulation Analyzer.
instruments with equivalent minimum specifications may be substituted. Table 1-2 also includes
some alternate equipment listings. Table 1-3 lists
those contained in the Service Accessory Kit, HP 08901-60287.
1-5.
INSTRUMENTS COVERED
are not warranted specifications but are typical characteristics included as additional
and
this
or
service) is found throughout these manuals.
1-2
lists the test equipment
1-1.
instrum
ent may be tested. Information listed in this table as
and
all related documentation
instructions before operation. Refer
manual for a
summary
to
the task at hand
and
accessories recommended for use in testing, adjusting,
If
BY
THIS MANUAL
of the safety information.
any of the recommended equipment is unavailable,
These are the performance standards,
Supplemental
must
be reviewed for familiarization with
to
the
Safety
(installation,
a
number of accessories required in addition
Considerations
operation, performance testing,
page found at
or
limits,
Char-
to
Opt
ions
Electrical options 001,002,003,004, series 030, and various mechanical options
these manuals. The differences are noted under paragraph 1-8,
Parts,
Serial Numbers
Attached
The fist four digits
that is unique
having the same serial number prefix(es) as listed under SERIAL NUMBERS on the respective
manual title pages.
For information concerning a serial number prefix not listed on the title page
Changes supplement, contact
1-6.
MANUAL UPDATING
This manual may be revised as needed
changes. The latest revision
shown below.
are
documented in
Options,
and in the schematic diagrams in Section 8.
to
the instrument is a serial number plate. The serial number is in the form 1234A00123.
and
the letter are the serial prefix. The last five digits form the sequential
to
each instrument. The contents
your
nearest Hewlett-Packard office.
to
make corrections and
of
the manual
of
these manuals apply directly
to
document hardware and firmware
can
be purchased from the Hewlett-Packard locations
in Table 6-3,
to
or
in the Manual
Replaceable
suffix
instruments
1-2
rev.28MA
Y93
Page 17

Model 8901B General Information
Inside the U.S.A.
Call
HP Parts Direct Ordering
available.
at 800-227-8164. They can
also
help determine
if
a new revision is
Outside the U.S.A.
Contact the local Hewlett-Packard Sales and Service office for ordering information.
1-7.
HEWLETT-PACKARD INTERFACE BUS (HP-IB)
Corn pati bil ity
The Modulation Analyzer’s capabilities are defmed by the following interface functions: SH1, AH1,
T5, TEO,
via open-collector
Standard 488- 1978,
the identical ANSI Standard
For
Remote Operation, Hewlett-Packard Interface
Selecting the
The HP-IB address switches
five-bit binary number. This number represents the talk and listen address characters which the
controller
talk only
HP-IB Address Selection
1-8.
ADDITIONAL EQUIPMENT INFORMATION
0
pt i ons
Options are variations on the standard instrument which can be ordered during the purchase. The
following list defines all currently available options. Refer
section for retrofit part numbers
L3, LEO,
SR1, RL1, PPO, DC1,
TTL
circuitry.
An
IEEE Standard and Digital Interface for Programmable Instrumentation
MC
1.1.
more detailed informationrelating
HP-IB
must
or
to
Address
are
located within the Modulation Analyzer. The switches represent a
generate.
listen only. A table in Section 2 shows all HP-IB talk and listen addresses. Refer
In
addition,
in Section 2 of this
that
DT1,
CO.
The Modulation
explanation of the compatibility code may be found in
to
programmable control
Bus
in Section 3 of this
two
more switches allow the Modulation Analyzer
Operation and Calibration
to
can be ordered after the purchase.
Analyzer
of
the Modulation Analyzer, refer
Operating Information
interfaces with the bus
manual.
manual.
to
be set
Electrical Equipment Available
IEEE
or
to
to
to
in this
rev.
Option
PUT, SENSOR input, MODULATION OUTPUT/AUDIO INPUT, and
CALIBRATION OUTPUTS.
Option
place of the standard reference oscillator.
rear panel.
28MA
Y93
001.
This option provides rear-panel (instead of front-panel) connections for RF
002.
This option provides a high-stability
In
addition, a
(1
x
10-g/day) internal reference oscillator in
10
AMYFM
MHz time base output
and
RF
POWER
is
provided on the
IN-
1-3
Page 18

General Information Model
8901B
Option
for an external local oscillator signal. Both connections are located on the rear panel.
provided automatically with option
Option
at frequencies greater than
Option
sideband carrier noise
output for the internal local oscillator and an input for an external local oscillator signal
with these options.) This option
Options
Option
the
003.
This option provides both an output for the internal local oscillator signal and an input
004.
This option allows operation at line frequencies ranging from
030.
The High Selectivity Measurement option provides the capability
Option
Option
Option
Option
032.
This option provides a
033.
This option provides a
035.
This option provides a
037.
This option provides a carrier noise filter.
907-909.
910.
This option provides an extra copy of both the
Service Manual.
030
series instruments.)
66
Hz
is
restricted
(AM
or phase) quickly and accurately up
is
ordered with one of the following filter options:
These options are described in
to
12.5
kHz adjacent channel filter.
25
kHz adjacent channel filter.
30
kHz (Cellular Radio) alternate channel filter.
48
to
less than
126.5
Vac line input.
to
1.3
GHz with an external
Mechanical Equipment Available.
Operation and Calibration Manual
(This
400
Hz. Operation
to
measure single-
output
LO.
is
provided
is
(An
and
Accessories Supplied
The Accessories Supplied are pieces of equipment which are shipped automatically with every
Modulation Analyzer.
Line Power Cable.
on the destination of the original shipment. Refer
Information
Fuses.
2110-0043)
of original destination. Refer
Information
manual.
Fbes with a
are supplied. One fuse
manual.
The line power cable may be supplied in several plug configurations, depending
to
2.5A
rating for
is
factory installed according
to
Line Voltage
115
Vac
Power Cables
(HP
2110-0083)
and
he Selection
in Section 2 of this
and a 1.5A
to
the voltage available in the country
in Section 2 of this
rating for
230
Electrical Equipment Available
This equipment
HP-IB Controller.
compatible computing controller or computer for automatic systems applications.
Sensor Module.
using a single input connector. Switching back and forth between the Modulation Analyzer’s SENSOR
input and RF INPUT connectors happens automatically with these modules (which contain an internal
switch). The HP
range
50
MHz to
is taken with each sensor module
isolates the power sensor from the source-under-test, reducing mismatch. Microwave hardware and a
selected RF input cable further improve SWR and insertion loss.
is
available
The Modulation Analyzer has an HP-IB interface and can be used with any HP-IB
The HP
11722A
26.5
to
be ordered for the Modulation Analyzer
11722A
covers the Erequency range
GHz and
and
11792A
is
intended for use with the HP
to
minimize input
after
Sensor Modules enable you
100
kHz
to
2.6
GHz; the HP
11793A
SWR
and resulting errors. A low SWR attenuator
Down
the time of sale.
to
characterize a signal
11792A
Converter. Special care
Operating
Vac (HP
Operating
covers the
1-4
Page 19

Model 8901B General Information
Down Converter.
The HP 11793A Down Converter, when used with a suitable local oscillator, extends
the useful range of the Modulation Analyzer into the microwave region. Provisions have been made in
to
the Modulation Analyzer
account for the frequency of the local oscillator and provide direct display
of the frequency of the microwave input signal.
Test Source.
high rates as well
adjusting the Modulation Analyzer; however,
The HP 11715A AMFM Test Source produces extremely linear AM and
as
a low-noise
CW
signal. This source
it
is
is
required for performance testing and
an excellent stand-alone instrument for generating
FM
at
very low-distortion FM in the broadcast band.
Service Accessory Kit.
accessories (such
Front-to-Rear-Panel Connectors Retrofit Kit (Option
as
components and full instructions for converting front-panel connections
A
Service Accessory Kit (HP 08901-60287)
is
available which contains
extender boards and cables) useful in servicing the Modulation Analyzer.
001).
This kit contains all the necessary
to
rear-panel connections.
Order HP part number 08901-60282.
Rear-to-Front-Panel Connectors Retrofit Kit (Standard).
This kit contains
all
the necessary
components and full instructions for converting Option 001 instruments with rear-panel connections
to
instruments with front-panel connections. Order
High-Stability, Internal-Reference Retrofit Kit (Option
HP
part number 08901-60283.
002).
This kit contains all the necessary
components and full instructions for installation of the high-stability, internal-reference oscillator.
Order HP part number 08901-60281.
Rear-Panel Local Oscillator Connections Retrofit Kit (Option
003).
This kit contains all the
necessary components and full instructions for installation of rear-panel local oscillator connections.
Order HP part number 08901-60280. (These connections are already included in all Option 030
Series instruments.)
Conversion to
frequencies greater than 66 Hz may be converted
However, operation at line frequencies greater than 66 Hz will be restricted
or equal
installation, performance will be identical
400
Hz Line Operation.
to
126.5 Vac. To convert to
Modulation Analyzers not equipped
to
operate at line frequencies from 48
400
Hz operation, order HP part number 08901-60095. After
to
the HP 8901B Option 004.
to
operate at line power
to
line voltages less than
Mechanical Equipment Available
The following
they were not ordered with the original shipment and are now desired, they can be ordered from the
nearest Hewlett-Packard office using the appropriate part number.
Front-Handle Kit (Option
part number 5061-9690 for the basic kit and 2190-0048 for lockwashers
Rack-Flange Kit (Option
rack using the flange kit. Order HP part number 5061-9678.
Rack-Flange and Front-Handle Combination Kit (Option
a rack-flange kit packaged together;
Order HP part number 5061-9684 for the basic kit and 2190-9609 for lockwashers
kits
might have been ordered and received with the Modulation Analyzer
907).
Ease of handling is increased with the front-panel handles. Order HP
(8
required).
908).
The Modulation Analyzer can be solidly mounted
909).
it
is composed of a unique part which combines both functions.
This
is
not a front-handle kit and
as
to
the instrument
(8
required).
to
440
options.
Hz.
If
1-5
Page 20

General Information Model
8901B
Chassis Slide-Mount Kit.
mounted. Access to internal circuits and components
the instrument from the rack. Order HP part number
order adapters for non-HP rack enclosures, use HP
Chassis-Tilt, Slide-Mount Kit.
also allows the tilting of the instrument up
(17
in.) tilting slides. To order adapters for non-HP rack enclosures, use HP part number
1-9.
DESCRIPTION OF
The HP Model
characterizing signals in the
of
four separate instruments in its ability
the characteristics of the demodulated audio signal
flexibility allows you
a signal.
The Modulation Analyzer can measure an RF signal's frequency, frequency
(broadband, and off-channel), amplitude modulation (AM), frequency modulation (FM), phase
modulation (@M), and AM and FM noise components.
measure the audio signal's frequency and distortion.
The Modulation Analyzer
single key. The Modulation Analyzer's large digital display shows measurement results with excellent
resolution and
measurement results can be transferred
Hewlett-Packard's implementation of
THE
8901B
is
easy
This kit
This kit
is
extremely useful when the Modulation Analyzer
or
is
the same
or
down
the rear panel
1494-0017
part
number
as
the Chassis Slide Mount Kit above except
90".
Order
for
1494-0023.)
HP
is
possible without removing
432
mm
part number
(17
in.) fixed slides. (To
1494-0025
MODULATION ANALYZER
Modulation Analyzer
150
kHz
to
to
make those measurements most commonly needed
is
fully automatic and all major measurements can be made by pushing a
to
read. All Modulation Analyzer operations can be controlled and
via
IEEE
is
a complete measurement system
1300
MHz frequency range. It combines the capabilities
to
measure
the Hewlett-Packard Interface
Standard
RF
power, carrier frequency, modulation and
(as
well
as
those of external audio signals). This
It
recovers the modulating signal and can
488
and ANSI Standard
to
totally characterize
drift,
Bus
(HP-IB). (HP-IB
MC1.l.)
is
for
432
1494-0023.
for
accurately
power level
rack
it
mm
all
is
RF Power Measurements
The Modulation Analyzer delivers the accuracy and resolution of a high-performance power meter.
The HP
at frequencies from
limits using other power sensors. The HP
extended measurement capability.)
Input Power Protection.
damage from the accidental application of excessive power.
equipment used
Protection
opens and protects sensitive components, and the Modulation Analyzer displays an error message. The
circuit automatically resets whenever
RF Power Calibration.
available in every instrument. Also, the front-panel ZERO function enables you
module without removing it from the source-under-test. After the ZERO key
offsets are stored automatically.
RF
into the Modulation Analyzer's non-volatile memory. The instrument automatically compensates for
the power sensor's efficiency and mismatch loss at each frequency.
8901B,
Power Calibration Factors.
with the HP
100
kHz
to
measure transmitters.) The Modulation Analyzer is
is
provided by limiting diodes and an RF relay. When excessive power
11722A
to
2.6
Sensor Module, measures power from
GHz. (Refer
to
890lB
The Modulation Analyzer
a
key
is
depressed.
RF Power Calibration
RF Power Calibration Factors can be entered from the power sensor
is
Table
1-1,
Specifications,
also accepts all HP
is
equipped with input power protection
(This
8480
is
a common cause
tested
accomplished with the
+30
dBm
to
for specified frequencies
series power sensors
of
for inputs up
is
applied, the relay
50
MHz, 1 mW standard
to
zero the sensor
is
pressed, the new zero
-20
dBm
for
to
prevent
damage in
to
2W.
1-6
Page 21

Model 8901B General Information
High Selectivity Measurements.
HP
8901B Modulation Analyzer. Used with a low-noise external
accurate single-sideband (SSB) carrier noise measurements
Options 030-037 add selective power measurement capability
LO,
the
HP
8901B performs fast,
to
1.4 GHz.
RF Frequency Measurements
In automatic operation, the Modulation Analyzer
1300 MHz frequency counter. The frequency counter automatically adjusts itself
is
changes. There
Analyzer is usually used
signals with significant levels of AM.
no need
to
manually set or adjust the input attenuator. Because the Modulation
to
measure modulated signals,
has
the performance
its
frequency counter
of a high-quality, 150 kHz
as
the input level
also
accurately measures
Modulation Measurements
The Modulation Analyzer has extremely low internal noise. Incidental AM, FM, and QM can be
measured on a wide range of simple and complex modulated signals. To complement
measurement capability, the HP 8901B characterizes audio signal level, frequency, and distortion.
(These features are also available for external audio signals.)
its
Filters, De-emphasis Networks and Modulation Calibrators
Post-Detection Audio Filters.
filters
detection audio
in
combination. Their cutoff frequencies have been chosen
or
as
such
overshoot for square-wave modulation
measured.
transmitter or signal generator testing. The
for filtering the recovered modulation. These filters can be selected individually
The Modulation Analyzer has
>20
kHz filter
so
that this type of modulating waveform can
two
high-pass and three low-pass post-
to
match those needed for applications
is
a Bessel filter.
It
also
be accurately
to
the
to
modulation
minimizes
De-Emphasis Networks.
in
used
50, 75, and 750
You can select whether the de-emphasis network affects the deviation measured. The ability
either the actual or “de-emphasized deviation” increases the usefulness of the Modulation Analyzer in
many applications.
Modulation Calibrators.
measurements
calibration standard. In all instruments, a precise AM and FM modulation standard
When the output of the calibrator
of modulation
automatically compensate
measured modulation
addition
to
ps.
of
AM
is
measured to create a calibration factor. The calibration factor can be used
The Modulation Analyzer contains four de-emphasis networks
the audio filters. These are the ones commonly used
When selected, the de-emphasis networks always affect the demodulated output.
One of the most difficult problems involved in making very accurate
depth or FM deviation
is
connected
all
subsequent measurements. The calibration factor is the ratio of the
to
the internally-computed modulation of the calibrator, expressed in
is
generating a precisely modulated signal
to
the Modulation Analyzer’s input, the amount
in
FM communications-25,
is
included.
Additional Features
Tuning Features.
signal and measures it.
In manual operation, you can determine the frequency
Entering the approximate frequency on the keyboard causes all but very close interfering signals
eliminated. This allows the Modulation Analyzer
A track mode feature enables you to track a signal,
manual tune operation.
In automatic operation, the Modulation Analyzer automatically tunes
to
which the Modulation Analyzer tunes.
to
selectively measure signals other ‘than the largest.
as
it
changes frequency, from either automatic or
to
that
can be
to
to
use as
7%.
the input
select
a
to
to
be
1-7
Page 22

General Information Model 8901B
Store and Recall functions.
in non-volatile memory and recall them
Display Flexibility.
power can be displayed in watts, am, V, dBV, mV, dBmV, pV, and
LOG/LIN
the keyboard. These features eliminate the need for recalculating measurement results.
keys
The Modulation Analyzer offers numerous data-display formats. For example, RF
to
display results in
These functions enable you
as
needed.
dB
or
7%
relative
to
either a measured value or a value entered from
to
store eight complete instrument settings
dBpV.
Use
the RATIO and
Special Functions
The Modulation Analyzer can do more than
accessed using the numeric keys and a Special Function key. The Special hctions provide access
to
other measurements and functions, manual control of instrument functions, instrument operation
verification, and service
All
instrument functions not set using these Special Functions remain in the automatic mode. This
to
allows you
key alone, the display shows ten digits that indicate which functions are in automatic and the
those manually set.
There are also numerous Special Functions that can be used
various sections are operating properly. These, along with service special functions, make diagnosing
and repairing the Modulation Analyzer faster and easier.
Those Special Functions that are most commonly used in operating the Modulation Analyzer are
described on the
select any combination of manual or automatic operations. By depressing the special
Special hnction Information
aids.
is
apparent from the front panel. Many functions
in
verifying that the instrument and
pull-out card under the front panel.
state
are
of
its
Extending Measurement Range
Operation
path. This system then functions as a single instrument making microwave modulation, frequency,
power, and level measurements. You control operation from the Modulation Analyzer's front panel.
When the external
controller
Offset mode for your microwave power sensor.
to
42
GHz
is
LO
to
make the change. A separate, non-volatile calibration factor table
Programmability
The Modulation Analyzer
IB).
This, coupled with the diversity
with which these measurements can be made, and the flexibility of the Special bctions, make the
instrument ideal for systems applications. In many instances
in a system, speed measurements, reduce complexity and improve accuracy.
When the Modulation Analyzer is in remote, the front-panel annunciators make
determine the state the instrument is in; whether
1-10.
PRINCIPLES
The Modulation Analyzer
signal
the Modulation Analyzer contains an
and bandpass filter, a demodulator (detector or discriminator), and audio filters (tone controls). The
Modulation Analyzer, however, contains additional features which make
to
automatic tuning,
selectable measurement mode: signal frequency, power level, or modulation (AM, FM, or Phase
Modulation (@MI),
selectable audio detector (peak, average, or
audio counter,
OF
OPERATION USING
a
fixed, intermediate frequency
accomplished when an external
frequency must be changed, the Modulation Analyzer requests an external
is
completely programmable
of
measurements the Modulation Analyzer can make, the speed
A
SIMPLIFIED
is
a calibrated, superheterodyne receiver, which converts the incoming
(IF),
RF
amplifier, a local oscillator
LO
and mixer are included
via
the Hewlett-Packard Interface Bus (HP-
it
can reduce the number of instruments
it
is
in the talk, listen, or service request
which
rms
responding),
BLOCK
is
then demodulated.
DIAGRAM
(LO),
a
it
much more versatile:
in
the measurement
is
available in Frequency
it
very easy
state.
As
in a radio receiver,
mixer, an
IF'
amplifier
to
1-8
Page 23

Model 8901B General Information
0
audio distortion analyzer,
0
measurement calibrators (AM, FM, or power level), and
0
HP-IB programmability.
The entire operation of the instrument
sets up the instrument at turnon, interprets keyboard entries, executes changes in internal hardware,
and displays measurement results and error messages. The computing capability of the Controller
also used
the AM or FM generated by the AM and FM Calibrators, and converts measurement results into ratios
(in
RF
Circuitry
The RF input signal normally enters an external Sensor Module such
Figure
input connector of the Modulation Analyzer. For the RF Power measurement, the input
directly into the Power Sensor, which converts the RF power absorbed by the RF Power Sensor into
a low-frequency, chopped, ac voltage whose amplitude
Power Meter amplifies the chopped signal and converts
voltmeter. (The voltmeter includes the Audio Peak Detector, Audio Average Detector, Voltage-to-Time
Converter, and Counter.) The calibration of the Power Meter can be verified by connecting the Sensor
Module
Power Reference Oscillator
%
to
simplify circuit operation. For example,
or
dB).
The Controller
1-2.)
For all measurements except RF Power, the Sensor Module routes the signal
to
the CALIBRATION
also
is
an accurate 1 mW reference.)
The Power Sensor
sudden, large overloads. Refer to Table
Characteristics, RF Power Ranges of HP
HP
11
722A
Sensor Module,
is
governed by a microprocessor-based Controller. The Controller
it
forms the last stage of the Counter, calculates
contains routines useful for servicing the instrument.
as
an HP 11722A. (See
signal
is
proportional
it
to
a
dc voltage which
RF
POWER OUTPUT connector on the front panel. (The 50 MHz
is
unprotected against and
1-1
under RF Power, Supplemental
8901B
for
information on maximum operating lemls.
Modulation Analyzer with
to
the average RF power. The
is
easily damaged
is
then measured by the
by
to
the
passes
is
FW
When the RF Peak Detector senses that the input signal level exceeds lW,
Relay. This
by the voltmeter,
The Input Mixer converts the input signal
than 10 MHz, the
frequency; an IF of 455 kHz can be manually selected for this frequency range. The 455 kHz
selected automatically for input signals between 2.5 MHz and 10 MHz. Below 2.5 MHz, the input
passes directly through the Input Mixer without down-conversion.
The instrument can be manually tuned
filtering may be necessary since low-frequency signals pass directly into the
Filter can be inserted (via a Special Function)
To measure the input frequency, the Counter measures the frequency of the LO and the frequency
of the
difference between the
which equals the input frequency.
is
done without intervention of the Controller. The output from the
is
used
to
set the Input Attenuator
to
the intermediate frequency
IF
is
1.5
MHz with the Local Oscillator
For
the input signal to pass through the Input Mixer without down-
conversion, the
LO
frequency of
respond to input frequencies
between
IF
from the output of the IF Amplifier and Filter. The Controller computes and displays the
150
LO
must still be present to turn the mixer
101.5
MHz
is
arbitrarily used. Thus the instrument will
of
kHz
and
2.5
MHz.
to
a desired signal even in the presence of larger signals, although
two
frequencies. For input frequencies below 2.5 MHz, only the
to
optimize the level applied
(LO)
tuned
NOTE
100
or
103
MHz
as
well
in
the RF path for this purpose.
it
opens the Overpower
RF
Peak Detector, read
to
the Input Mixer.
(IF).
For frequencies greater
1.5
MHz above the input
diodes
as
on. An
frequencies
IF.
The
RF
IF
IF
is
High-Pass
is counted,
1-9
Page 24

w
w
0
I
I
SWITCH
MODULATION
lNPU1
POWER
SENSOR
ANALYZER
OVERPOWER RF
POWER
PO!!!
POWER REFERENCE
OSCILLATOR
INPUT
tNPUl
HP
'I
I
2,
-1
kHI
e.~
OR
2.5
Ynz
LP
FILTER OEYOOULAlOR
CI-
CI
-
-
CI-
L1
IF
AM
AM
OR
I
IF
PEAK
OElECTOR
II
I
AUDIO
FILTERS
AND
6A1N CONTROL
I
CHANNEL
FILTERS OElECTOR
iopiiow
'DP!!?!!
SERIES
IF
030
O!.!".
ONLY)
RYS
\
OlSlORTlON
I I
COUNlER
AUOlO
OElEClOR
AUDIO
DETECTOR
AUOIO
AV6
PEAK
AUDIO
RYS
WIDE
,
455
Page 25

Model
8901B
LO
Circuitry
The
LO
LO
drives the high-level port of the Input Mixer and
has
four main modes of operation:
a
tuning
keyboard (manual tune mode),
a
automatically searching for an input signal, then tuning the LO
down-convert the signal (automatic tune mode),
a
automatically searching for an input signal, then configuring the
automatically tracks the signal (automatic tune track mode), and
a
tuning
keyboard, then configuring the LO in a feedback loop
(manual tune track mode).
to
the frequency required to down-convert a signal whose frequency
to
the frequency required
to
down-convert a signal whose frequency
is
one of several inputs
that
automatically tracks the input signal
General Information
to
the Counter. The
is
entered from the
to
the frequency required
LO
in
a feedback loop that
is
entered from the
to
The manual tune track mode
of other signals. The non-track modes are used when the
IF
Circuitry
The gain of the
1.5
the
nominal center frequency
455
In instruments with Option Series
also include
Filters set the
by entering a series of Special Functions which establish
Filter, then allow the relative
offset.
MHz
kHz Bandpass Filter (with a bandwidth of
IF
Amplifier
IF
is
selected, the
a
precision, variable-gain amplifier) and detected by the
IF
bandwidth and gain for the Selective Power measurement. The measurement
is
is
fixed. The
of
1.5
IF
useful when
IF
Filters determine the frequency response of the
IF
filter consists of a 150
MHz). When the
030,
the
IF
level
to
be displayed
Audio Circuitry
The modulation on the
is
recovered
The demodulated signal
filters
processed signal
and the voltmeter.
by
integrating the demodulated FM in the Audio
are
selected from the front panel, and for FM, the filtering may also include de-emphasis. The
is
passed
IF
is demodulated by either the AM or the FM Demodulator. Phase modulation
is
amplified and filtered in the Audio
to
the front-panel MODULATION OUTPUT/AUDIO INPUT connector
it
is
desired to follow an unstable signal in the presence
LO
noise (residual FM) must be minimized.
kHz
to
2.5
MHz bandpass filter (with a
455
kHz
IF
is
200
signal
selected, the
kHz).
is
further processed by the Channel Filters (which
IF
RMS Detector. The Channel
an
IF
reference in the center of the Channel
as
the
IF
frequency
Filters
Filters
is
detuned
and Gain Control circuitry.
and Gain Control circuitry. The
IF
filter
by
a
pre-determined
is
IF.
When
the Wide
is
made
The audio signal from the Audio Filters and Gain Control
Peak Detector, the Audio Average Detector or the Audio RMS detector. The Audio Average and RMS
Detectors are used primarily for measuring noise. The output from the detectors is routed into the
Voltage-to-Time Converter.
The Voltage-to-Time Converter within the voltmeter converts the dc input into a time interyal. During
is
the interval, the 10 MHz Time Base Reference
represents the dc voltage. Other inputs
an audio level detector and the AM calibrator.
The Distortion Analyzer measures the distortion of either the internal demodulated signal or an audio
to
signal applied externally
of
the input signal must be either 1 kHz or
measuring the amplitude of the signal before and after a notch filter that
two
ac signals are converted
Distortion
(The Audio RMS Detector can also be used
or the ac level of an external audio signal applied to the MODULATION OUTPUT/AUDIO INPUT
connector.)
is
computed
the MODULATION OUTPUT/AUDIO INPUT connector. The frequency
to
dc by a the Audio RMS Detector and then measured by the voltmeter.
as
the ratio of the voltage out of the notch filter
to
the voltmeter, which are not shown, include outputs from
counted by the Counter, and the resultant count
400
Hz. The distortion on the signal
to
measure the demodulated AM, FM,
is
converted
to
a dc voltage by the Audio
is
determined by
is
set
to
1
kHz
or
400
to
the voltage into the filter.
or
OM internally
Hz.
The
1-11
Page 26

General Information Model 8901B
The frequency of the audio signal at the MODULATION OUTPUT/AUDIO INPUT connector,
or
whether internal
the input signal
function is
during the count is read by the Controller which computes and displays the signal frequency.
The AM and FM Calibrators provide a nominal 10.1 MHz signal with a precisely known amount of
or
AM
or
via the Sensor Module), the modulation is measured and the calibration factor of the AM
Demodulator
demodulation of the calibrator signal.
also
FM. When this
external,
is
used
used by the Voltage-to-Time Converter.) The number of time base pulses received
is
computed and displayed. Related front-panel functions are automatically set for proper
is
measured by a reciprocal-type Audio Counter. In the Audio Counter,
to
gate the 10 MHz Time Base Reference into the main Counter. (This gating
signal
is
applied
to
the instrument’s RF INPUT connector (either directly
or
FM
P
(a)
BASEBAND SIGNAL
1.5
1
.o
0.5
0
Figure
1-1
1.
MODULATION
The Modulation Analyzer can demodulate and measure three types of modulation: amplitude
modulation (AM), frequency modulation (FM), and phase modulation (@M). In general, modulation is
that
characteristic of a signal which conveys the information. A signal without modulation
continuous-wave (CW)
frequency. These
conveyed
or
both of these parameters
The RF signal which
baseband signal and can be of any arbitrary form (for example, voice, tone, noise). Demodulation
the process of recovering the baseband signal from the modulated carrier. The Modulation Analyzer
can measure the modulation on carriers in the range of
is specified
present
by
at
the MODULATION OUTPUT connector.
Amplitude Modulation
1-3.
BASICS
two
them
for
modulation
(b)
AMPLITUDE MODULATED CARRIER
I
A Baseband Signal and the Corresponding Amplitude Modulated Carrier
is
said to be
signal.
parameters, however, are static (time invariant). Consequently, the information
is
scant-you know only that a signal
is
CW signals contain
is
altered as a function of time, the signal
modulated is called the carrier. The modulating signal
rates
generally between
two
information-carrying parameters: amplitude and
is
present at a certain frequency. When one
is
said
to
150
kHz to 1300 MHz. Measurement accuracy
20
Hz
and
100
kHz.
The demodulated signal
be modulated.
is
referred to
as
a
the
is
is
1-12
As
the name implies, a carrier is amplitude modulated when its amplitude
time. Figure 1-3 shows a carrier with amplitude modulation and, for reference, also shows the baseband
As
signal.
This trace
minimum called the trough. A quantity which describes the amount of AM
you can see, the tips of the carrier trace out a waveform that resembles the baseband signal.
is
called the envelope. The envelope rises to a maximum called the peak and drops
is
varied
or
the AM depth
as
a function of
is
to
the
a
Page 27

Model
8901B
General Information
modulation index. If the peak amplitude is called P and the trough amplitude is called
index
rn
(usually expressed in
In the example
of
Figure 1-4 shows
Figure
AM
signals with modulation indexes varying from 0 to
1-3,
%)
is
P
=
m=
defined
m=-
1.5
and T =
1.5
-
1.5
+
as
P-T
+
0.5
x
0.5
(a)
x
100%.
0.5;
100%
0%
AM
therefore,
=
50%.
(CW)
100%.
T,
the modulation
(b)
(c)
(d)
30%
70%
100%
AM
AM
AM
Figure
1-4.
AM
for
Various
Depths
1-13
Page 28
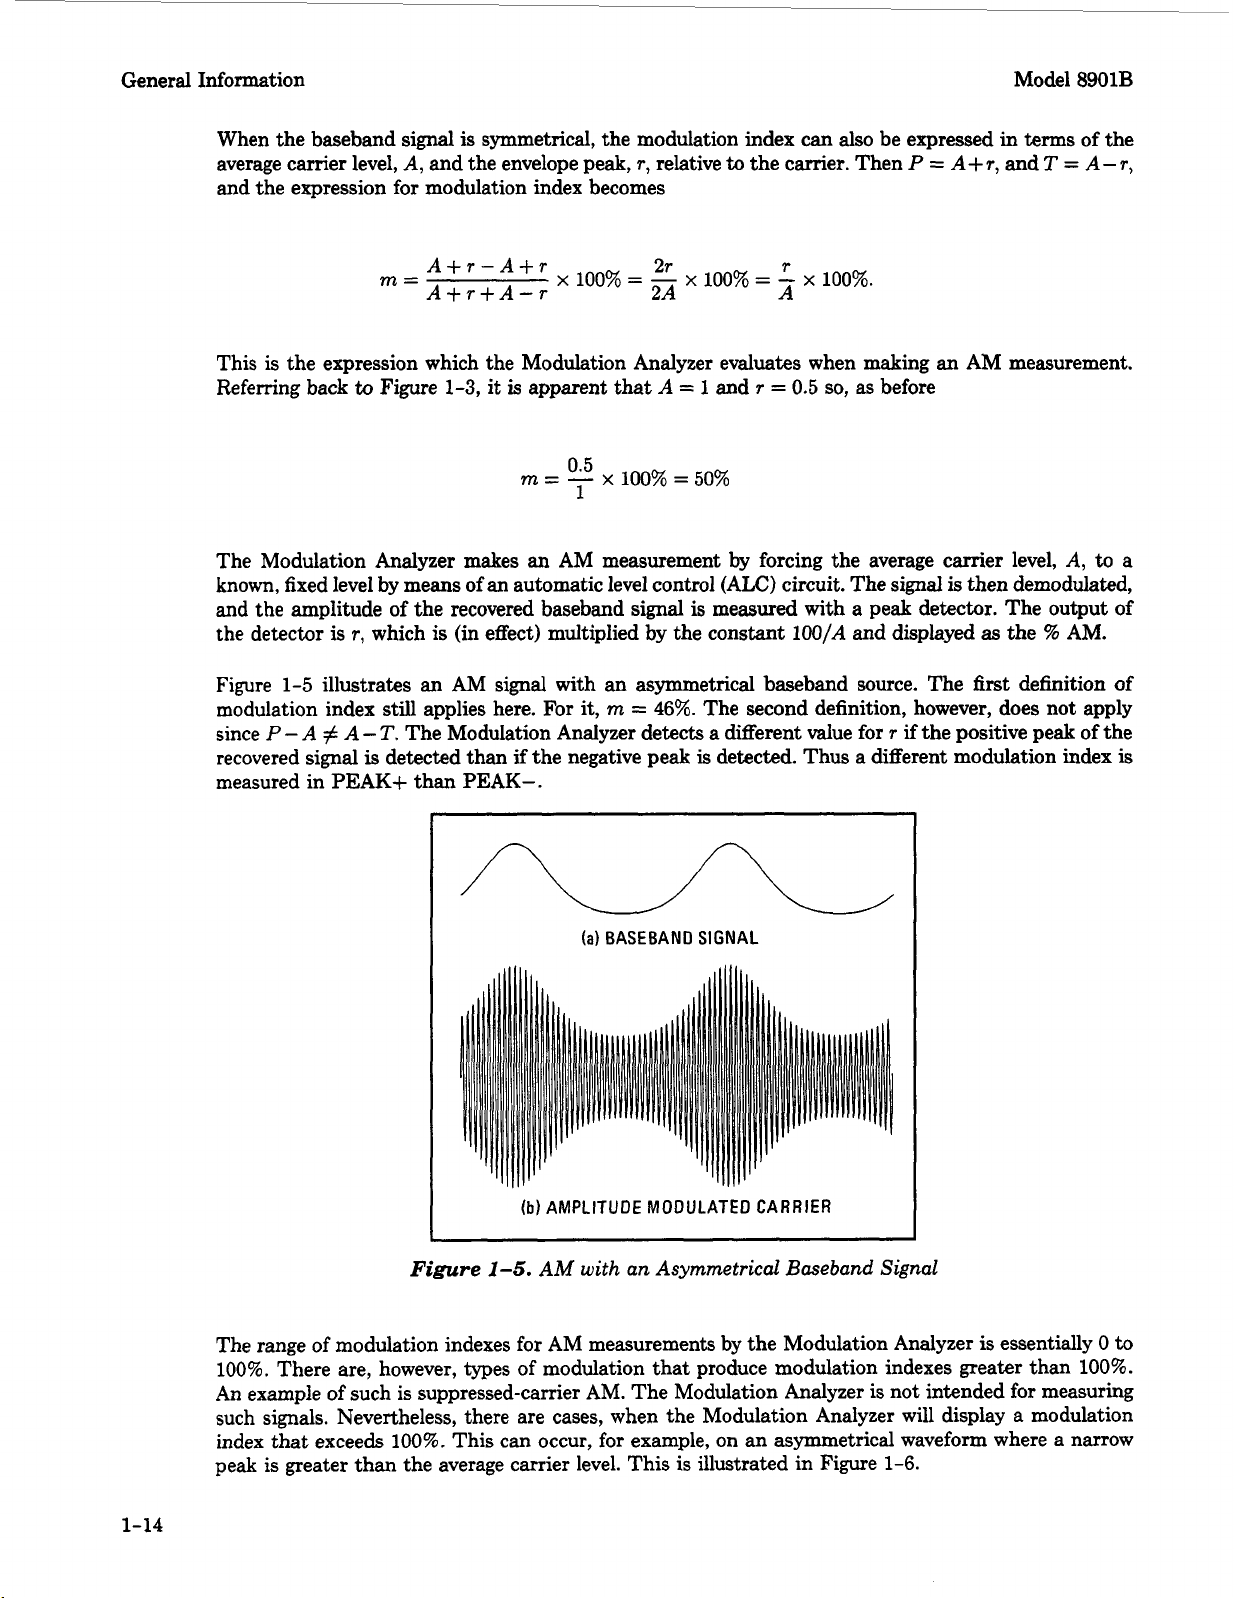
General Information Model 8901B
When the baseband
average carrier level,
and the expression for modulation index becomes
This
is
the expression which the Modulation Analyzer evaluates when making an AM measurement,
Referring back
The Modulation Analyzer makes an AM measurement
known, fixed level by means of
and the amplitude of the recovered baseband
the detector
is
signal
A,
and the envelope peak,
A+r-A+r
m=
A+r+A-r
to
Figure 1-3, it
r,
which
is
is
symmetrical, the modulation index can
T,
relative
x
=
-
2A
100%
signal
27
A
=
x
=
is
100%
1
50%
x
100%
is
apparent that
m
=
-
0.5
1
an
automatic level control (ALC) circuit. The signal
(in
effect) multiplied by the constant
also
be expressed
to
the carrier. Then
r
=
-
x
100%.
A
and
T
=
0.5
so,
by
forcing the average carrier level,
measured with a peak detector. The output of
1OO/A
P
=
as
before
and displayed
in
terms of the
A+r,
and
T
=
A,
is
then demodulated,
as
the
9%
AM.
A-
to
r,
a
I
r
(a)
BASEBAND SIGNAL
(b)
I
Figure
The range
100%.
An example of such is suppressed-carrier AM. The Modulation Analyzer
such signals. Nevertheless, there are cases, when the Modulation Analyzer will display a modulation
index that exceeds
peak
of
modulation indexes
There are, however, types of modulation that produce modulation indexes greater than 100%.
100%.
is
greater than the average carrier level. This is illustrated in Figure 1-6.
This can occur,
AMPLITUDE MODULATED CARRIER
1-5.
AM with an Asymmetrical Baseband Signal
for
AM measurements by the Modulation Analyzer
for
example, on an asymmetrical waveform where a narrow
is
essentially 0 to
is
not intended for measuring
1-14
Page 29

Model 8901B General Information
Figure
I
1-6.
AM with Modulation Exceeding
100%
as
Measured
I
by
the PEAK+ Detector
Exponential Modulation
Exponential (or angular) modulation
is
or phase of the carrier
is
impossible
analyzing the received signal unless specific information about the baseband
It
is
certainly true
a frequency modulator.
when the varactor bias
is
generated by a phase modulator. A varactor diode across an
varactor
driven from a well-buffered carrier source. This modulator simultaneously produces
The signal from both modulators will show readings on the Modulation Analyzer when in both the
FM
and
deviation, which
measuring
the average carrier phase. Phase and frequency have the relationship
frequency or frequency
QM
by integrating the demodulated FM.
This relationship
signal shown
an
FM,
assumed
The frequency goes up on the positive peak of the baseband signal and down on the negative peak. The
phase modulated signal, however,
a discontinuity where the baseband signal switches amplitude. The waveform of the figure was contrived
so
that
will occur when the baseband signal switches amplitude, but the phase shift
does not need
is
the constant zero except for a positive spike (impulse) where the baseband signal switches positive
and
a
negative spike where the square wave switches negative.
Now look
the baseband signal slopes upward and a continually decreasing frequency
The phase modulator produces a signal that resembles the signal from the frequency modulator for the
square wave baseband signal. This
is
slope
upward. When the slope is negative, the phase shift
frequency shift. For the triangle wave baseband signal, the shift in frequency when the slope changes
is proportional
to
tell
bias
is
varied.
QM measurement modes. When
is
QM,
the peak phase deviation
is
is
a
square wave. The three waveforms under
QM, and
that the phase modulator doesn't produce AM-only
a
180"
at
positive, the phase shift
AM
phase shift occurred exactly at a zero crossing of the carrier. In general, a discontinuity
to
occur at a zero crossing of the carrier. Mathematically, the derivative of a square wave
the triangle wave. The frequency modulator produces a continually increasing frequency
to
the change in slope.
varied. Frequency and phase modulation are very closely related. In fact,
whether the signal was produced by a frequency modulator or phase modulator by
to
say that a signal
A
varactor diode across the tank circuit of an
is
varied. It
(It
is
assumed
the maximum frequency excursion from the average carrier frequency. When
is
the derivative of the phase. In fact, the Modulation Analyzer demodulates
most easily visualized by some examples. Look at Figure 1-7. The
modulator respectively. (The
is
the generic name given
is
frequency modulated when the modulation
is
also true
that
that
the carrier
a
signal
is
on the slope of the filter and
to
modulation in which the frequency
signal
is
given.
is
generated by
LC
oscillator
is
phase modulated when the modulation
RF
filter
will
will
produce
produce QM when the
that
the
AM.)
in
FM, the quantity being measured
is
measured, which
is
the maximum phase excursion from
that
phase
is
the peak frequency
is
the integral of the
first
it
are the result of applying this signal
AM
waveform
is
peculiar. The frequency
is
because the derivative of a constant slope
is
continually increasing, thus producing a uniform frequency shift
is
is
continually decreasing and produces a downward
is
included only for reference.)
QM.
The
FM
waveform
generally constant throughout except for
is
not necessarily 180" and
as
the signal slopes downward.
is
a
is
as
constant. When the
it
FM
filter
is
baseband
to
It
is
expected.
as
1-15
Page 30

General Information Model
uu
BASEBAND SIGNAL
BASEBAND SIGNAL
8901B
SIGNAL FROM FREQUENCY M
SIGNAL FROM PHASE MODULATOR
SIGNAL FROM AMPLITUDE MODULATOR
(a)
SQUARE WAVE BASEBAND SIGNAL
Now
note
the sine wave
the same except for the
frequency is highest when the baseband signal
phase modulated signal, the frequency
a positive direction. This occurs
is
when the slope
most negative.
0 D U LATO
of
Figure 1-7(c). The signals from the frequency and phase modulators
90'
phase shift between the
R
is
highest when the slope of the baseband signal
at
the positive-going zero crossing. Similarly, the frequency
SIGNAL F
SIGNAL FROM AMPLITUDE MODULATOR
(b)
Figure
is
most positive and lowest when most negative.
two.
1-7.
For
RO
M F REQU ENCY MO DU LATO
SIGNAL FROM PHASE MOOULATOR
TRIANGLE WAVE BASEBAND SIGNAL
Signals from
the frequency modulated signal, the
Requency,
Phase,
is
steepest
R
For
is
lowest
and
look
the
in
1-16
If
in the last example, the rate, but not the amplitude,
and lowest frequencies
often. However, for the signal from the phase modulator, not only do the frequency peaks occur more
often, but the excursions are large because the slopes
crossings. See Figure 1-7(d).
The
maximum
400
rad
or
baseband waveform will result in different readings in
frequency deviation which can be measured
400
kHz divided by the modulation rate, whichever is smaller.
of
the signal from the frequency modulator stay the same-they just occur more
of
the baseband signal
of
the baseband signal are steeper
is
400
kHz. The maximum phase deviation is
PEAK+
than
PEAK-.
As
is
increased, the highest
with
AM,
at
the zero
an asymmetrical
Page 31

Model
8901B
General Information
BASEBAND SIGNAL
SIGNAL FROM FREQUENCY MODULATOR
SIGNAL FROM PHASE MODULATOR
W
BASEBAND SIGNAL
SIGNAL FROM FREQUENCY MODULATOR
SIGNAL FROM PHASE MODULATOR
W
W
SIGNAL FROM AMPLITUDE MODULATOR
(c)
SINE WAVE BASEBAND SIGNAL
~~
SIGNAL FROM AMPLITUDE MODULATOR
(d)
SINE WAVE BASEBAND SIGNAL:
3/2
THE RATE OF
Amplitude Modulators for Various Baseband Signals
Other Considerations
In practice,
of AM-called incidental AM or AM-on-FM. Likewise, an AM signal usually contains
amount of incidental FM and cPM. In order
Modulation Analyzer itself must not contribute to
and FM rejection.
A
typical CW signal also contains a
modulation
FM specifications quantify the residual modulation internal
Residual modulation affects the modulation readings in a manner which depends on the detector used,
the nature
the peak detector
ratio. This
3.
When the average detector
square root
insignificant, however, when the signal-to-noise ratio rises above a few
by filtering the demodulated signal.
it
is
difficult
is
generated by such things as line hum, noise, and microphonics. The residual AM and
of
the residuals, and the signal-to-noise ratio.
is
is
discussed under
of
the sum
to
produce an FM or cPM
to
accurately measure this incidental modulation, the
small
amount of residual AM, FM, and ckM. The residual
used, the residuals add in a way
Residual Noise Effects
is
used, the residuals add approximately in an
of
the squares
of
the noise and the signal. The effect
signal
it.
in the
which does not also have a small amount
This contribution is specified
to
the Modulation Analyzer.
If
that
the residual
is
statistically related
is
predominately noise, when
Detailed Operating Instructions
rms
dB.
Noise can be further reduced
as
AM rejection
to
the signal-to-noise
manner, that
of
this noise becomes
a
small
in Section
is,
the
(c)
1-17
Page 32

General Information Model 8901B
In FM broadcasting and communications, the signal-to-noise ratio is improved
a
signal
boost
75
the demodulated FM can be de-emphasized
the display.
high-frequency boost before applying
is
a simple
ps
(which corresponds to
6
dB
per octave with the
a
3
dB
comer of
it
to
the modulator. This
3
dB
comer specified by a time constank
2.12
kHz) for commercial broadcast
to
equalize the signal at the modulation output and
is
called pre-emphasis. The
by
giving the baseband
for
example,
FM.
If
desired,
at
1-18
Page 33
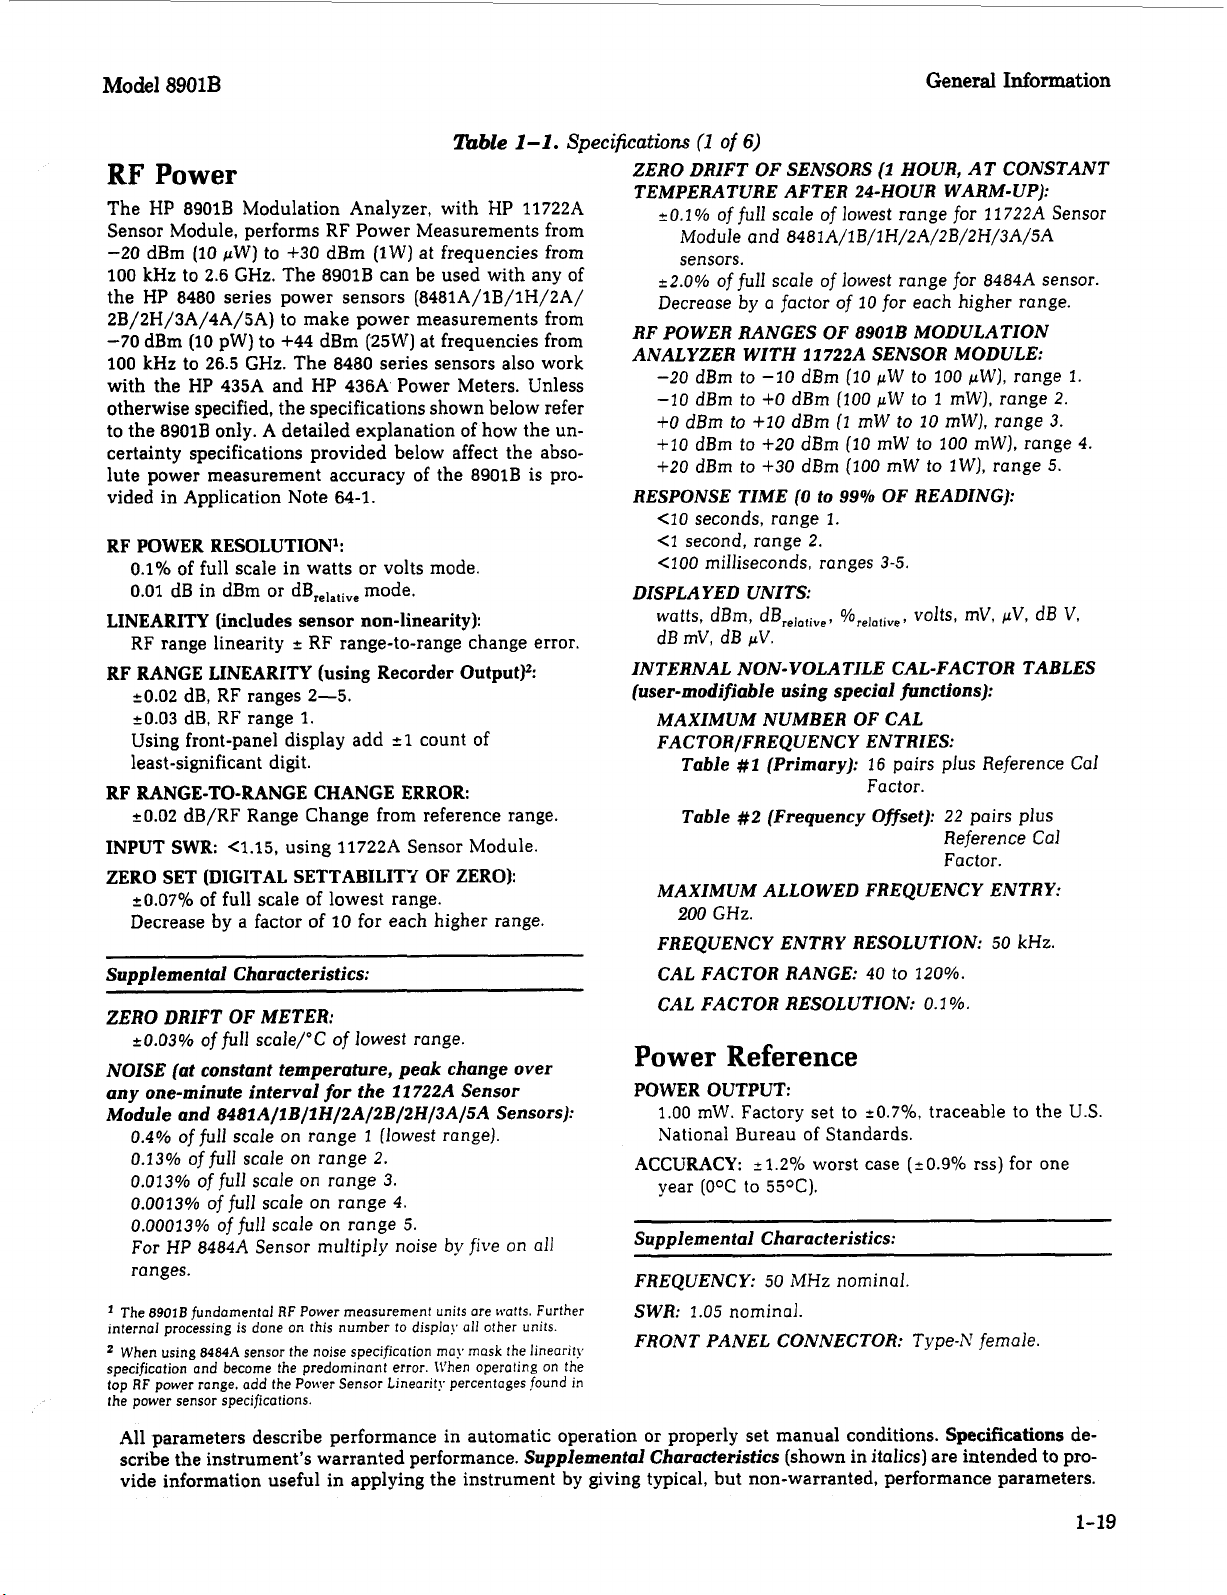
Model
8901B
General
Information
RF
Table
Power
1-1.
Specifications
The HP 8901B Modulation Analyzer, with HP 11722A
Sensor Module, performs RF Power Measurements from
-20 dBm
100
kHz to
(10
pW)
to
+30 dBm (1W) at frequencies from
2.6
GHz. The 8901B can be used with any of
the HP 8480 series power sensors (8481A/lB/lH/2A/
2B/2H/3A/4A/5A) to make power measurements from
-70 dBm
100
(10
pW) to +44 dBm (25W) at frequencies from
kHz
to 26.5 GHz. The 8480 series sensors also work
with the HP 435A and HP 436A Power Meters. Unless
otherwise specified, the specifications shown below refer
to the 8901B only. A detailed explanation of how the uncertainty specifications provided below affect the absolute power measurement accuracy of the
vided in Application Note
64-1.
8901B
is pro-
RF POWER RESOLUTION':
0.1%
of full scale in watts
0.01
dB in dBm
LINEARITY
RF range linearity
or
dBTelative mode.
(includes sensor non-linearity):
2
RF RANGE LINEARITY
or
volts mode.
RF range-to-range change error.
(using Recorder Outputfi
20.02 dB, RF ranges 2-5.
20.03 dB, RF range
Using front-panel display add
1.
21
count of
least-significant digit.
RF RANGE-TO-RANGE CHANGE ERROR:
20.02 dB/RF Range Change from reference range.
INPUT SWR:
ZERO SET (DIGITAL SETTABILITP
c1.15, using 11722A Sensor Module.
OF
ZERO):
50.07% of full scale of lowest range.
Decrease by a factor of
Supplemental Characteristics:
__
ZERO
DRIFT OF METER:
20.03%
of
full scale/"C of lowest range.
10
for each higher range.
NOISE (at constant temperature, peak change over
any one-minute interval for the
Module and
0.4%
0.13%
0.013%
0.0013%
0.00013%
8481AIlBIlH/2A/2B/2H/3A/SA
of full scale
of
full scale
of
full scale
of
ojfull scale
full
on
range 1 (lowest range).
on
range
on
range
scale
on
on
For HP 8484A Sensor multiply noise
2.
range
range
11
722A Sensor
3.
4.
5.
by
Sensors):
five
on
all
ranges.
The
8901B
internal processing is done
When using
specification and became the predominont error. \\'hen operating
top AF power range. add the Power Sensor Linearity percentages
the power sensor specifications.
fundamental RF Power measurement units are watts. Further
8484A
on
this number
sensor the noise specification may mask the linearity
to
displa!, all other units.
on
found
the
in
(1
of
6)
ZERO DRIFT OF SENSORS
(1
HOUR,
AT CONSTANT
TEMPERATURE AFTER 24-HOUR WARM-UP):
20.1%
offull scale of lowest range
Module and
848
IA/lB/l H/ZA/ZB/ZH/3A/SA
for
11722A Sensor
sensors.
22.0%
of full scale
Decrease
RF
'OWE'
by
RANGES
ANALYZER WITH
-20
dBm to
-10
dBm to
$0
dBm
to
+10
+IO
dBm to
f20
dBm
to
RESPONSE TIME
<IO
seconds, range
<I
second, range
<100
milliseconds, ranges
a
factor
-10
+O
$20
$30
of
lowest range
of
10
for
OF
8901B
11
7224 SENSOR MODULE:
dBm
(10
pW
dBm
(100
pW
dBm
(1
mW
dBm
(10
mW
dBm
(100
mW to
(0
to
99%
OF READING):
1.
2.
3-5.
for
each higher range.
MoDULATzoN
to
100
to
1
mW),
to
10
mW), range
to
100
lW),
8484A sensor.
pW),
range
range
2.
3.
mW), range
range
5.
1.
4.
DISPLAYED UNITS:
volts,
mV,
pV,
dB
watts, dBm,
dB
mV,
dB
dBreiotive,
%re
pV.
,,,,,
V.
INTERNAL NON-VOLATILE CAL-FACTOR TABLES
(user-modifiable using special functions):
MAXIMUM NUMBER OF CAL
FACTORIFREQUENCY ENTRIES:
Table
#1
(Primary):
16
pairs plus Reference
CaI
Factor.
Table #2 (Frequency Offset):
22
pairs plus
Reference
CaJ
Factor.
MAXIMUM ALLOWED FREQUENCY ENTRY:
200
GHz.
50
FREQUENCY ENTRY RESOLUTION:
CAL FACTOR RANGE:
40
to
120%.
CAL FACTOR RESOLUTION:
Power
POWER
1.00
Reference
OUTPUT:
mW.
Factory set to
20.7%
0.1
%.
traceable to the
kHz.
U.S.
National Bureau of Standards.
ACCURACY:
year
~ ~~ ~~~
21.2% worst case (20.9%
[OOC
to
55OC).
rss)
for one
Supplemental Characteristics:
FREQUENCY:
SWR:
1.05
FRONT PANEL CONNECTOR:
50
iMHz
nominal.
nominal.
Type-i\l
female.
All parameters describe performance in automatic operation or properly set manual conditions. Specifications describe the instrument's warranted performance. Supplemental Characteristics (shown in italics) are intended to provide information useful in applying the instrument by giving typical, but non-warranted, performance parameters.
1-19
Page 34

General
Information
Amplitude Modulation
RATES:
20
Hz to
10
kHz,
150
kHz
Sf,<
20
Hz to
100
kHz,
10
MHz
5fcl
DEPTH:
ACCURACY3*
I
I
I
*0.3%
to
99%.
4*
5:
AM
Accuracy
‘2%
Of
reading
21
digit
23%
of
reading
21
digit
”%
Of
reading
21
digit
+’%
Of
reading
21
digit
Flatness Frequency Range Rates
of
reading
21
digit
Frequency Range Rates Depths
150 kHz-10 MHz 50 Hz-10 kHz
150 kHz-10 MHz
I
I
10 MHz-1300 MHz I 50 Hz-50 kHz I 5%-99%
I
10 MHz-1300 MHz I 20 Hz-100 kHz
MHz-1300
I
MHz
Table
10
MHz.
1300 MHz.
20 Hz-10 kHz
90
Hz-10 kHz
1-1.
Specifications
5%-99%
I
to
99%
I
to
99%
Depths
20%-80%
(2
of
6)
FM Accuracy Frequency Range Rates
I
I
22’”,10f~$lng
I
+’%
I
I
Of
+l
pr5Xadlng
21
For
I
250 kHz-10 MHz
reading
dlglt
dlglt
rms detector add 23%
10 MHz-1300 MHz
I
I
10 MHz-1300 MHz
I
1
50 Hz-100 kHz I 5400
I
20
of
DEMODULATED OUTPUT DISTORTION8,
I
I
THD
<0.1%
<0.1%
I
Frequency Range
I
400
kHz-10 MHz
10
MHz-1300 MHz
I
I
20
Model
Deviations
20
Hz-10 kHz I 540
Hz-200 kHz
reading.
Rates
20 Hz-10 kHz
Hz-100 kHZ <lo0 kHZ
I
5400
9:
I
Deviations
I
<lo
8901B
kHzpeak
kHZpeak
kHZpeak
kHz
I
I
I
I
I
DEMODULATED OUTPUT DISTORTION:
<0.3% THD
<O.S%
FM
REJECTION
RESIDUAL AM
Supplemental Characteristics:
DETECTORS:
average
MAXIMUM DEPTH, RESOLUTION, AND MAXIMUM
DEMODULATED OUTPUT SENSITIVITY ACROSS
AN OPEN CIRCUIT
Maximum
Resolution
0.1%
0.01%
0.001
1
(rms detector
But not
detector.
generated by the Analyzer.
accuracy by
6
input signal.
’
tic impedonce.
to
Peak residuals must be accounted for in peak readings.
For peak measurements only:
Flatness is the variation in indicated
For optimum flatness. cables should be terminated trith their choracteris-
for
550%
depth.
THD for
[rms
%
exceed:
0.1%
595%
depth.
(50
Hz TO 3 kHz BW)4:
(50
HZ
to
3
kHz BW):
+peak, -peak, kpeak/2, peak hold,
sinewave calibrated), rms.
(600Q
OUTPUT IMPEDANCE)’:
Maximum
Demodulated Output
Sensitivity
0.01
V/percent
0.1
V/percent
I
0.1
only)
50
Hz to
of reading for each
V/percent
40
kHz rates for stoted accuracy with rms
AM
accuracy may be affected b!. distortion
In
the worst case this distortion can decrease
0.1%
of
distortion.
AM
depth for constant depth
<O.Ol%,,,.
Depths
I
AMpeak?40.
AMpeak<40.0%
AMrms<3.0%
0%
1-20
on
AM
Rejection Frequency Range Rates
<20
HZ
peak
deviation
RESIDUAL FM
<8
Hz,,, at
frequency
Supplemental Characteristics:
MAXIMUM FM DEVIATION, RESOLUTION, AND
MAXIMUM DEMODULATED OUTPUT SENSITIVITY
ACROSS AN OPEN CIRCUIT
IMPEDANCEI7:
Maximum
Resolution
100
10
1
1
I
0.1
(rms detector
Resolution is increased one digit with
de-emphasis and pre-display on.
The demodulated output signal present at the
Modulation Out/Audio In connector is increased in
ampliiude
But
not
1Vith
to exceed:
750
de-emphasis filter.
for modulation outputs
mum deviation for a measurement ronge. at rates
150 kHz-1300 MHz
(50
Hz
to
1300
MHz, decreasing linearly with
to
<I
Hz,,,
Maximum
Demodulated Output Deviations
Sensitivity
I
Hz
Hz
HZ
Hz
FS
de-emphasis and pre-display
only)
by
a factor
20
I
0.01
0.1
1.0
1.0
kHz rates and
>4V
peak. This condition can occur near maxi-
~ ~~
3
kHz BW):
for
100
mV/Hz
mV/Hz
mV/Hz
mV/Hz
of
10
with
40
400
Hz
or
1 kHz
MHz and below.
(600Q
OUTPUT
I
aF,,,r40
4.0
dF,,,,c40
AF,,,<4
4(ms<0.3
750
750
ps
de-emphasis.
kHz peak deviations with
“off.”
distortion is
<2
kHz.
ps
AM
kHz
not
Depths
550%
(4
F)
kHz
I
kHz
kHz
kHz
750
specified
j~s
Page 35
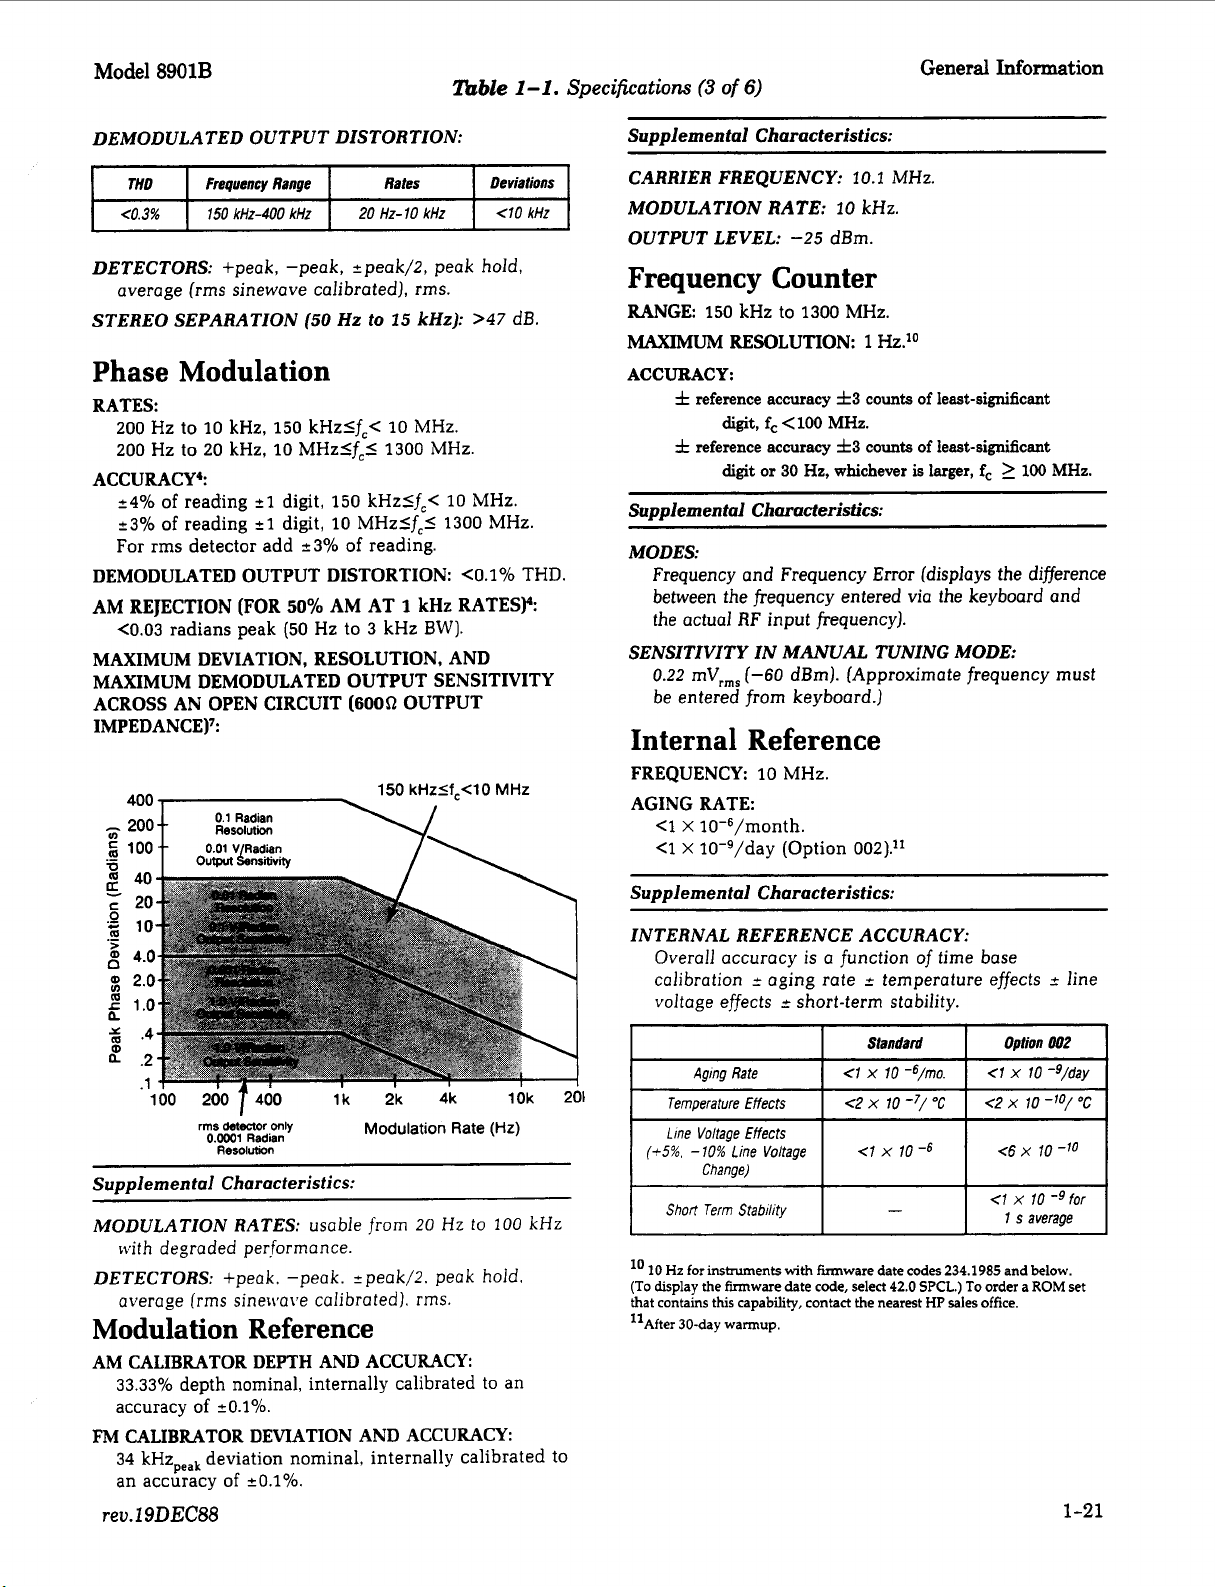
Model
-
DETECTORS:
STEREO SEPARATION
8901B
THD
4.3%
average
Frequency Range
150
kHZ-400 kHZ
Rates Deviations
20
HZ-10 kHZ 40 kHz
+peak, -peak, -.peak/2, peak hold,
(rms
sinewave calibrated],
(50
Hz
to
25
rms.
kHz):
lbble
>47
1-1.
dB.
Phase Modulation
RATES:
200
Hz
to
10
kHz,
150
kHzlfc<
200
Hz
to
20
kHz,
10
MHzlf,l
ACCURACY4:
24%
of reading
+3%
of
reading
For
rms
detector add
DEMODULATED OUTPUT DISTORTION:
AM
REJECTION
<0.03
radians peak
MAXIMUM DEVIATION, RESOLUTION, AND
MAXIMUM DEMODULATED OUTPUT SENSITIVITY
ACROSS AN OPEN CIRCUIT
IMPEDANCE)':
400
-
200
u)
:
100
.-
n
Output
(FOR
0.1
Radian
Resolution
0.01
VARaBRaqin
21
21
nravlh,
digit,
digit,
23%
50%
(50
Hz
150
kHzlf,<
10
MHzlfcS
of
reading.
AM AT
to
3
kHz
(600Q
150 kHzSf,<lO
10
MHz.
1300
MHz.
I
kHz
BW).
OUTPUT
10
MHz.
1300
MHz.
<O.l%
RATESY:
MHz
THD.
Specifications
Supplemental Characteristics:
~~
(3
of
6)
CARRIER FREQUENCY:
MODULATION RATE:
OUTPUT LEVEL:
Frequency Counter
RANGE
MAXIMUM
ACCURACY:
Supplemental Characteristics:
MODES:
SENSITIVITY
150
kHz
RESOLUTION:
f
reference accuracy
digit, fc
f
reference accuracy
digit or
Frequency and Frequency
between the frequency entered via the keyboard and
the actual
RF
input frequency).
IN
0.22
mVrmP
(-60
be entered from keyboard.)
Internal Reference
FREQUENCY
AGING RATE:
<1
x
<1
x
Supplemental Characteristics:
10
10-6/month.
10-g/day (Option
10.1
10
-25
dBm.
to
1300
MHz.
f3
<lo0
MHz.
f3
30
Hz,
whichever
MANUAL
General
MHz.
kHz.
1
Hz.'O
counts of least-significant
counts of least-significant
is
larger,
Error
[displays the difference
TUNING MODE:
Information
fc
2
100
MHz.
dBm). [Approximate frequency must
MHz
002).11
.1
P
100
200
7
rrns
detector
O.OOO1
Resolution
400
Radian
only
lk 2k 4k
Modulation
Rate
Supplemental Characteristics:
MODULATION RATES:
usable
from
20
Hz
nith degraded performance.
DETECTORS:
average
+peak. -peak. +peak/2. peak
(rrns
sinewave calibrated).
rrns.
Modulation Reference
AM CALIBRATOR DEPTH AND ACCURACY:
33.33%
accuracy
FM
34
an accuracy
rev.
depth nominal, internally calibrated to an
of
+0.1O/0.
CALIBRATOR DEVIATION AND ACCURACY:
kHzpeak
deviation nominal, internally calibrated to
of
-.0.1%.
19DEC88
(Hz)
to
hold.
10k
100
kHz
201
Agmg Rate
Lme Voltage Effects
(4%.
-10%
Change)
Short Term Stability
lo
10
Hz
for
(To
that
"After
instmments
display
the
contains
this
30-day warmup.
Standard
<1 x 10
Line Voltage
<1
x
-6/mo.
10
-
with
firmware date code, select 42.0
capability, contact the nearest
firmware date codes 234.1985 and below.
-6
SPCL.)
To
HP
sales office.
Option
<1
x
10
<6
X
<I
x
10
1 s average
order a
ROM
002
-9/day
10
-lo
-9
for
set
1-21
Page 36

General Information Model
Table
1-1.
Specifications
(4
of
6)
8901B
Audio Frequency Counter
FREQUENCY RANGE:
20
Hz
to 250
kHz.
(Usable to
600
kHz.1
MAXIMUM EXTERNAL INPUT VOLTAGE:
Accuracy (For Demodulated Signal~l:'~
I
23
(3
Accuracy (For External Signals):11
~
+3
Accuracy
counts of least-significant digit
+Internal Reference Accuracy
20.02
Hz
t
Internal Reference Accuracy
-0.2
HZ
2
Internal Reference Accuracy
kHz
low-pass filter inserted)
Accuracy
counts of least-significant digit
+Internal Reference
20.02
Hz
z
Internal Reference Accuracy
I
Frequency I Modulation (Peak)
>1
kHz
@M
dl
kHz
@M
1.5%
53
kHz
0
Frequency Level
>1
kHz 2100
51
kHz
Supplemental Characteristics:
DISPLAYED RESOLUTION: 6 digits.
MEASUREMENT RATE:
2
reading+.
COUNTING TECHNIQUE:
Reciprocal with internal
AUDIO INPUT IMPEDANCE:
10
MHz
100
time
kR
nominal.
base.
Audio Distortion
FUNDAMENTAL FREQUENCIES:
400
Hz
2
5%
and
1
kHz
25%.
MAXIMUM EXTERNAL INPUT VOLTAGE:
DISPLAY RANGE:
0.01%
to
IOO.Ooio
DISPLAYED RESOLUTION:
ACCURACY:
SENSITIVITY:
Modulation:
External:
RESIDUAL NOISE AND DIST0RTIONI3:
0.3'0
(-50
Supplemental Characteristics:
MEASUREMENT 3 dB BANDWIDTH:
DETECTION:
MEASUREMENT RATE:
AUDIO INPC'T IMPEDA'VCE:
(-80.00
2
1
dB of reading.
0.15
kHz
0.6
radian peak
100
myrms.
dB).
temperature
True
rrns.
dB
to
0.01%
peak
FLI.
&XI.
<4O0C.
I
rradinp/s.
100
0.00
or
1.5%
k!!
dB).
0.01
peak
20
nominal.
3Vrms.
AM
210%
FM
21.0 kHz
2
1.5
AM
210%
FM
2
1.0 kHz
21.5
d
AM
0
15 kHz
<
1.0
15
radian d @M
<
1
5
radians
mV,,,
rlOO
mVrms
3V.
dB.
AM
Hz
to
radians
radians
<
10%
5
FM
kHz
or
50
kHz.
Audio
FREQUENCY RANGE:
VOLTAGE RANGE:
ACCURACY:
Supplemental Characteristics:
I
RMS
2
4.0%
Level
50
100 mV
of
reading.
Hz
to
to
40
3V.
kHz.
FULL RANGE DISPLAY: .3000V, 4.000v.
AC CONVERTER: true-rms responding for signals with
crest factor of
MEASUREMENT RATE:
AUDIO INPUT IMPEDANCE:
13.
2
reading+.
100
kR
nominal.
Audio Filters
DE-EMPHASIS FILTERS:
750
ps.
De-emphasis filters are single-pole, low-pass
filters with
3183
750
gs.
50
HZ HIGH-PASS FILTER
Flatness:
300
HZ HIGH-PASS FILTER
Flatness:
3
kHz LOW-PASS FILTER
Flatness:
15
kHz LOW-PASS FILTER
Flatness:
>20
kHz LOW-PASS FILTER
Flatness:
Supplemental Characteristics:
3
Hz
for
50
<I% at rates?
<I%
<I%
<I%
~~
dB frequencies
ps.
at rates? 200
at rates
at rates
at rates
DE-EMPHASIS FILTER TIME CONSTANT
ACCURACY:
23%.
HIGH PASS AND LOW
FREQUENCY ACCURACY:
>20
kHz LOW PASS FILTER:
3
dB
Cutoff
Frequency:
OVERSHOOT ON SQUARE WAVE MODULATION":
<IO/b.
12
I\'ith
the
loi~.pass
readings.
13
For
dernodulol~d
must
br
uccounled
o.\l
j
14
The
>?O
squurwoix=
and
signals.
for
in
iHz
lon.pass filter
nodulotion
25
2122
11
510
110
PASS
high-puss
the
residuol
distortion
is
ps,
50
ps,
of
6366
Hz
for
75
gs.
(2
POLE):
Hz.
(2
POLE]:
1
kHz.
(5
POLE):
kHz.
(5
POLE):
kHz.
(9
POLE BESSEL)I4:
kHz.
FILTER
23%.
100
kHz
nominal.
audio
fillers used
noise
measuremrnts
intended
generaled
for
minimum
75
ps,
Hz
and 212
3
dB
lo
stabilize
ii.e
residual
and
for 25
Hz
frequency
b!.
the
A.M.
overshoot
ps,
for
8901B
F.M
with
or
1-22
Page 37
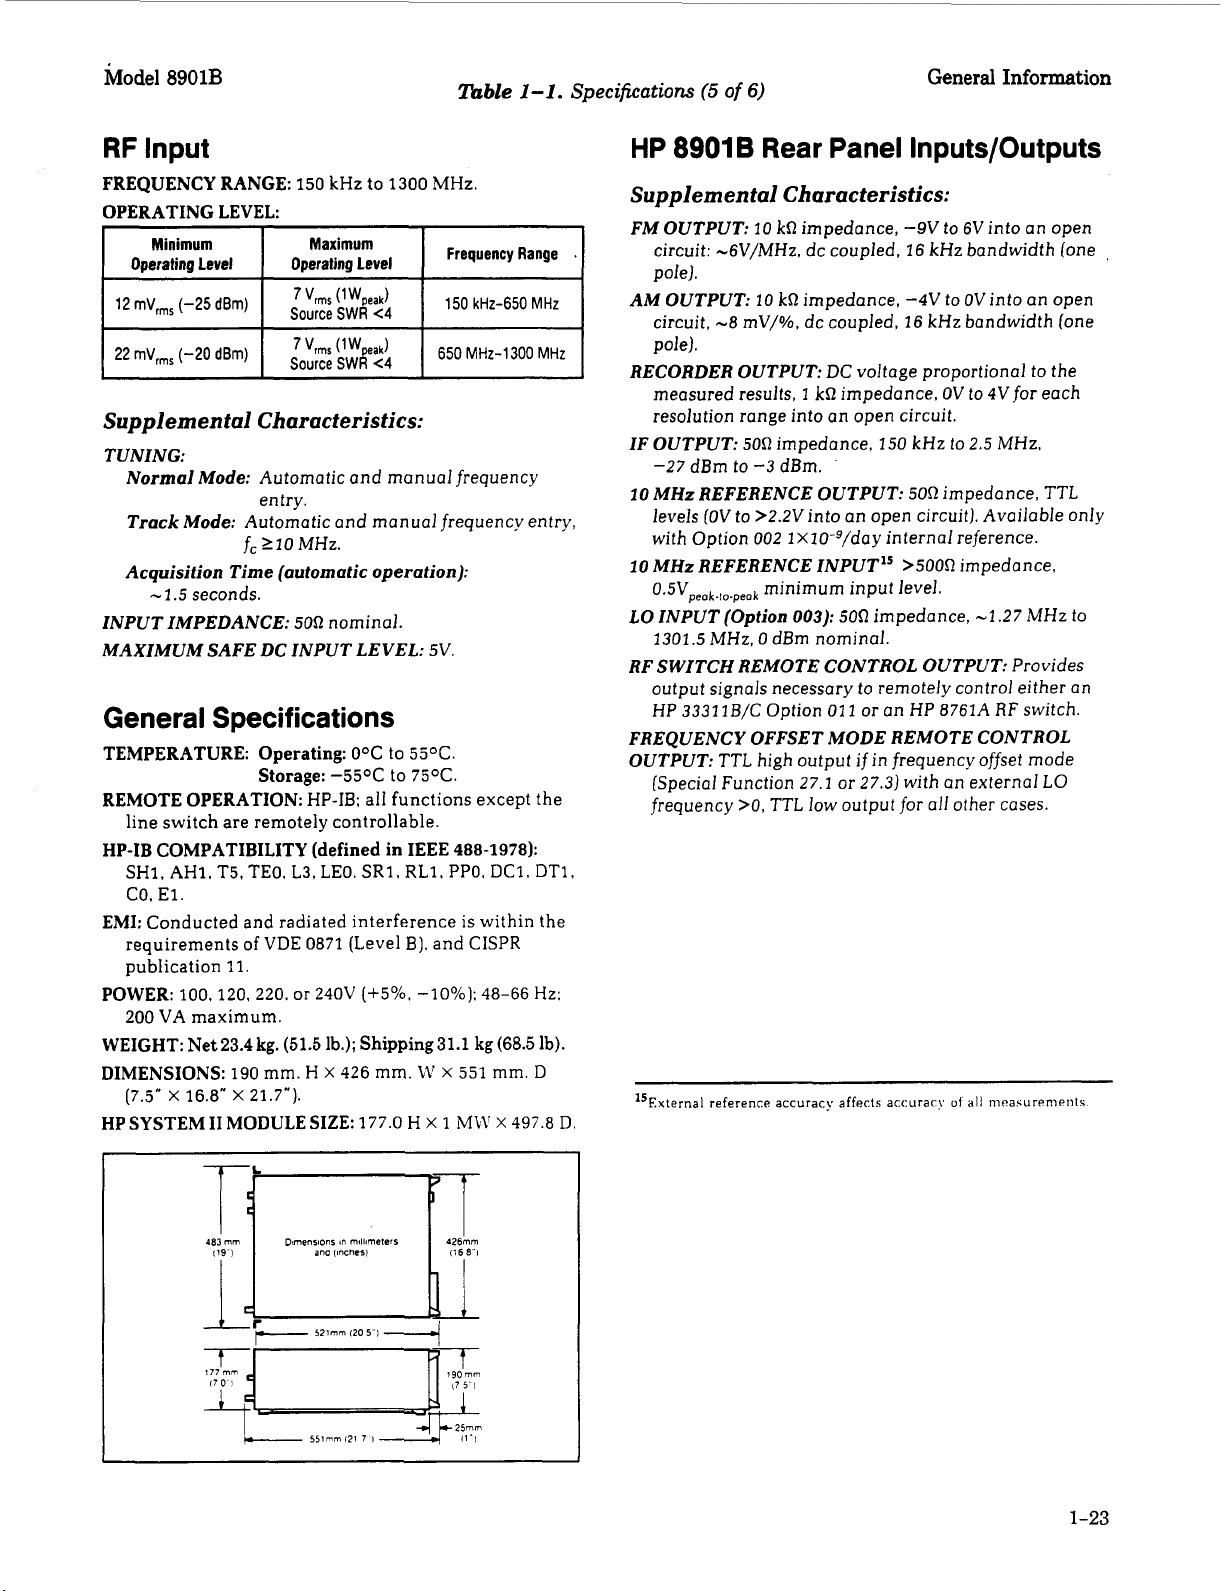
Model
8901B
lbble
1-1.
Specijications
(5
of
6)
General Information
RF Input
FREQUENCY RANGE:
OPERATING LEVEL:
Minimum
I
12
I
Operating
mVrms
level
(-25
dBm)
Supplemental Characteristics:
TUNING:
Normal Mode:
Track Mode:
Acquisition Time (automatic operation):
-I
.5
seconds.
INPUT IMPEDANCE:
MAXIMUM SAFE DC INPUT LEVEL:
150
kHz to
Maximum
I
Operating
'lms
Source
I
Automatic and manual frequency
entry.
Automatic and manual frequency entry,
f,
210
MHz.
50R
nominal.
level
("peak)
SWR
1300
e4
General Specifications
TEMPERATURE:
REMOTE OPERATION:
line switch are remotely controllable.
HP-IB COMPATIBILITY
SHI, AHI,
CO,
El.
EMI:
Conducted and radiated interference
requirements
publication
POWER:
WEIGHT:
DIMENSIONS:
HP SYSTEM I1 MODULE SIZE:
100.120,
200
VA maximum.
Net
(7.5"
X
16.8"
Operating:
Storage:
T5,
TEO.
of
11.
220.
23.4
kg.
190
X
21.7").
L3,
VDE
or
(51.5
mm.
O°C
-55%
HP-IB;
alI
(defined in
LEO.
SRI,
0871
(Level
240V
(+5%.
lb.);
Shipping 31.1 kg
H
X
426
mm.
177.0
to
55OC.
to
75OC.
functions except the
IEEE
RLI.
B).
-lO0/o):
M'
H
MHz.
Frequency
I
I
150
5V.
488-1978):
PPO.
is
and
X
551
X
1
MLY
Range
kHz-650 MHz
DC1.
DT1,
within the
CISPR
48-66
Hz:
(68.5
lb).
mm.
D
X
497.8
D.
HP
8901
B
Rear Panel Inputs/Outputs
Supplemental Characteristics:
FM OUTPUT:
circuit: -6V/MHz, dc coupled, 16 kHz bandwidth (one
pole).
AM OUTPUT:
circuit,
pole).
RECORDER OUTPUT:
measured results,
resolution range into an open circuit.
IF
OUTPUT:
-27 dBm to
10
MHz REFERENCE OUTPUT:
levels
with Option
10
MHz
0.5Vpeak.lo.peak
LO
INPUT (Option
1301.5
RF SWITCH REMOTE CONTROL OUTPUT:
output signals necessary to remotely control either an
HP
3331
FREQUENCY OFFSET MODE REMOTE CONTROL
OUTPUT:
(Special Function
frequency
'5~xternai reference
10
kR
impedance,
10
kR impedance,
-8
mV/%, dc coupled, 16 kHz bandwidth (one
DC
1
kR
impedance,
50R
impedance,
-3
dBm.
(OV
to
>2.2V
into an open circuit). Available only
002
Ixlo-g/day internal reference.
REFERENCE INPUT15
minimum input level.
003):
5OR
MHz, 0 dBm nominal.
1B/C Option
TTL
high output if in frequency offset mode
>O,
01
27.1
TTL
low output for
accuracy
or
affects
-9V
to 6V into an open
-4V
to
OV
into an open
voltage proportional to the
OV
to 4VfOr each
150
kHz
to
2.5
50R
impedance,
>500R
impedance,
impedance,
1
or
an HP 8761A RF switch.
27.3)
with an external
accuracy
-1.27
all
other cases.
ut
ail
iiie~asurements.
MHz,
TTL
MHz
Provides
LO
,
to
1-23
Page 38
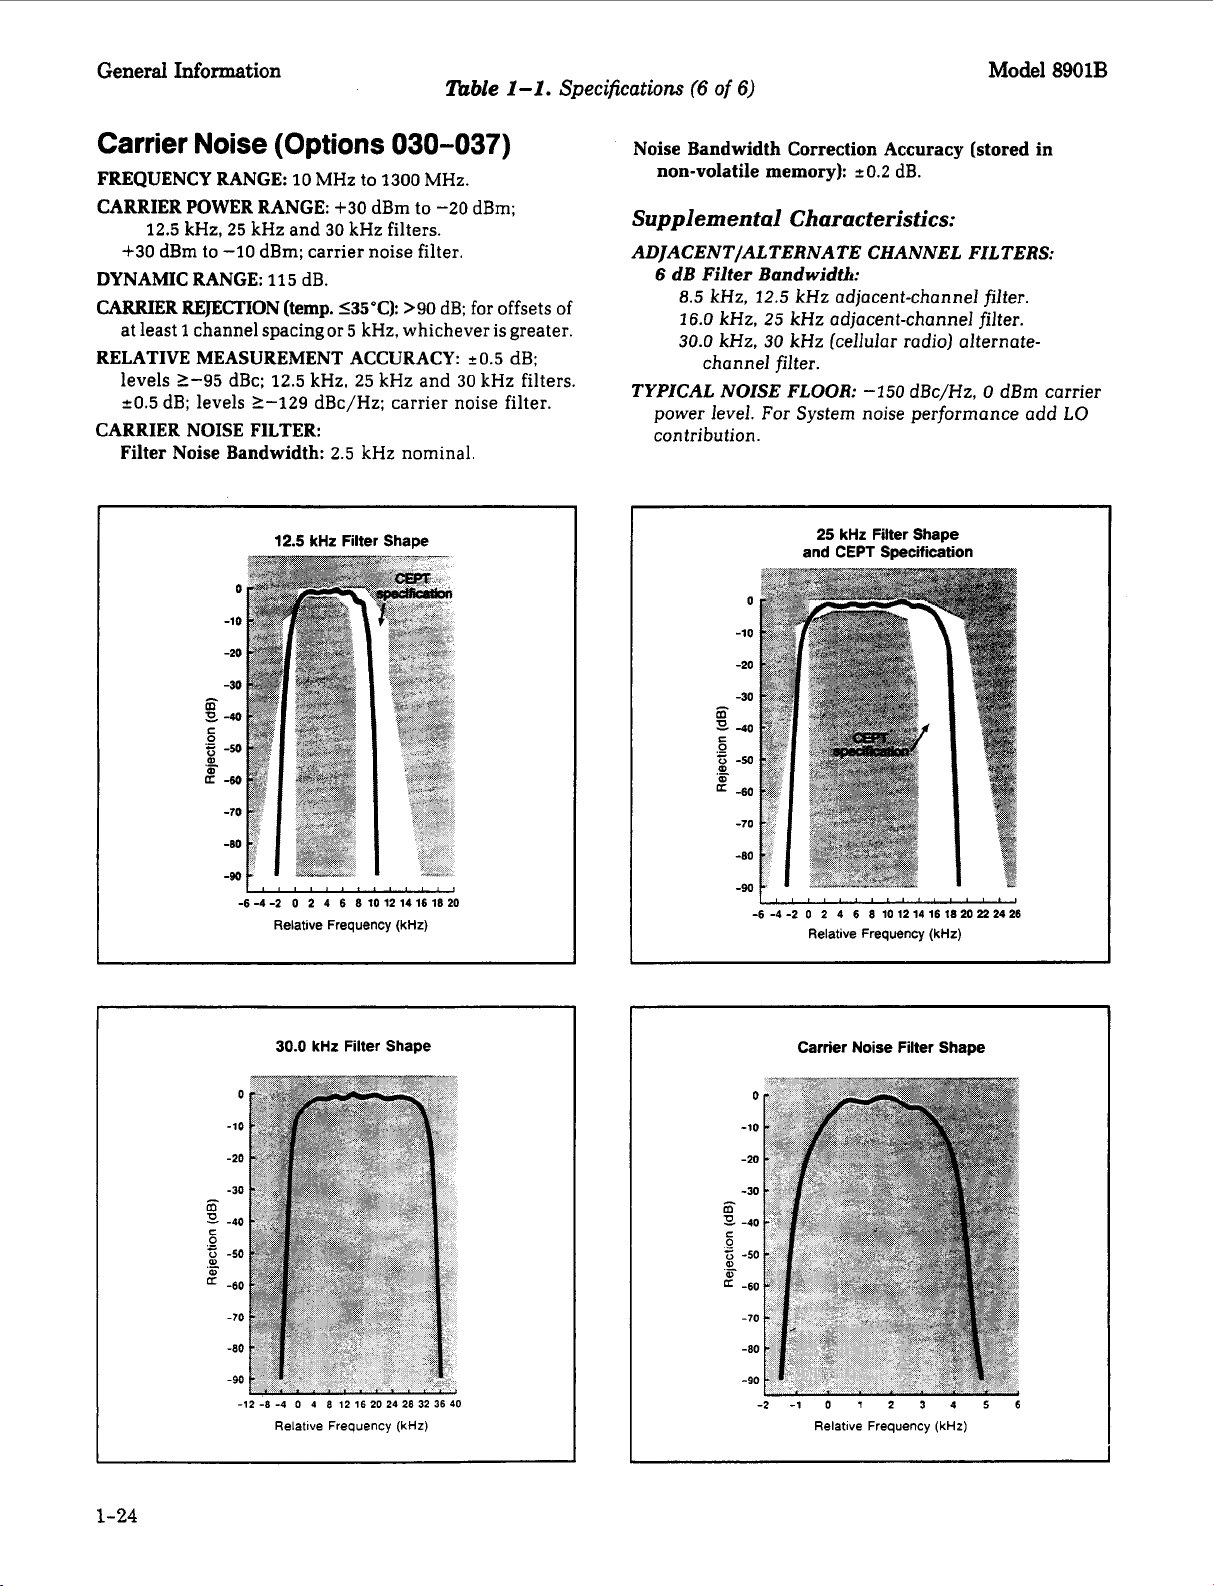
General Information
Table
1-1.
Specifications
(6
of
Model
6)
8901B
Carrier Noise
FREQUENCY RANGE:
CARRIER POWER RANGE:
12.5
kHz,
+30
dBm to
DYNAMIC RANGE:
CARRIER REJECI'ION (temp. 135'C)
at least
1
channel spacing
(Options
10
MHz to
25
kHz and
-10
dBm; carrier noise filter.
115
dB.
1300
+30
dBm to
30
kHz filters.
or
5
kHz, whichever
030-037)
MHz.
-20
>90
dB; for offsets of
RELATIVE MEASUREMENT ACCURACY:
levels
2-95
dBc;
12.5
kHz,
25
kHz and
50.5
dB; levels
1-129
dBc/Hz; carrier noise filter.
CARRIER NOISE FILTER:
Filter Noise Bandwidth:
0
-10
-20
-30
E
0
-40
C
.-
5
-50
m
'3
a-w
-70
-80
-90
-6
-4 -2 0 2 4
2.5
kHz nominal.
12.5
kHz Filter Shape
6
8
10 12 14 16 18 20
Relative Frequency
(kHz)
dBm;
is
greater.
5
0.5
dB;
30
kHz filters.
Noise Bandwidth Correction Accuracy (stored in
non-volatile memory):
Supplemental
Characteristics:
20.2
dB.
ADJACENTIALTERNATE CHANNEL FILTERS:
6
dB Filter Bandwidth:
8.5
kHz,
12.5
kHz adjacent-channel filter.
16.0
kHz,
25
kHz adjacent-channel filter.
30.0
kHz,
30
kHz (cellular radio) alternate-
channel filter.
TYPICAL NOISE FLOOR:
power level.
For
System noise performance add
-150
dBc/Hz, 0 dBm carrier
contribution.
25
kHz Filter Shape
CEPT
Specification
6
8
10 12 14 16 1820222426
(kHz)
-
k
0
._
0
.-
a
0
-10
-20
-30
40
-50
-60
-70
-80
-90
-6
and
-4 -2 0 2 4
Relative Frequency
LO
1-24
30.0
kHz Filter Shape
-12 -8 -4 0 4 8 12
Relative Frequency
16
20 24 28 32
(kHz)
Carrier Noise Filter Shape
0
-10
-20
-30
-
!i
-40
C
0
i5
-50
%
a
-60
-70
-80
-90
36
40
-2-1
Relative Frequency
0
f
2
3
4
5
6
(kHz)
Page 39

Model 8901B
General Information
Instrument
Type
AM/FM Test
Source
Table
~~ ~~~~ ~ ~
Carrier Frequency: within range
Output Level:
FM Deviation: 400 kHz peak maximum
FM Distortion:
<
-72
dB at
rate
<
-72
dB at 400 MHz carrier and
rate
FM Flatness:
10.1%
k0.2570
CW Residual FM:
incidental AM:
AM Depth:
AM Distortion:
AM Flatness:
iO.1%
f0.25%
incidental QM:
Residual AM:
AM Linearity:
fO.l
3~0.2% at
from 20 Hz to
to
200
560 MHz
and 1 kHz rate in a
5%
<
-66
dB at
<
-60 dB at
from
from
kHz rate in a
YO
at
<95%
49%
1-2.
Recommended Test Equipment
Critical Specifications
>
-20
dBm
12.5
MHz carrier with
100
kHz rates
kHz rates
<3
Hz rms in a
<0.08%
to
-30%
45%
50
20
<0.008
50
<0.01%
AM at
50
Hz to 3 kHz bandwidth
99%
AM at 20 Hz to
AM at
Hz to 50 kHz
Hz
to
100
kHz
rad peak at 12.5 MHz with
Hz to 3 kHz bandwidth
rms in a 50 Hz to 3 kHz bandwidth
AM
AM
100
20
10
to
400
50
MHz with
Hz to
(1
1300
MHz
12.5
kHz deviation and 40 kH
kHz deviation at
Hz to 3 kHz bandwidth at
40
kHz peak deviatioi
100
kHz rates
100
kHz rates
50%
400
AM at a
of
kHz
1
4)
Suggested
Model
HP
11715A
Attenuator,
3
dB
(2
required)
Attenuator,
6
d0
Audio
Analyzer
*C=Operator'$
Frequency:
SWR Maximum:
(Used as alternate equipment.)
Frequency Range:
SWR Maximum:
Attenuation Accuracy:
Fundamental Frequency Range:
Distortion Range:
Distortion Accuracy:
Low-Pass Filters:
Oscillator Level:
Oscillator Distortion:
Oscillator Frequency Accuracy: f2%
hecks; P=Performance Tests: A=Adjustments; T=Troubleshooting
30
MHz
1.2
0.15
1.2
f0.4
-70
f2
30
and
3V
maximum into
<
to
1300
MHz
dB
20
dB minimum
dB
80
kHz
-70 dB
Hz to
600R
100
kHz
HP
8491A
Option
HP
8491A
Option
HP
89038
03
06
1-25
Page 40

General Information Model
8901B
~
Instrument
Type
Audio
Synthesizer
Computing
Controller
Digital
Multimeter
nble
1-2.
Recommended Test Equipment
Critical Specifications
Frequency Range: 20 Hz to 400 kHz
Output Level: +16 dBm (50R) maximum
Frequency Accuracy:
Attenuator Accuracy:
Level Flatness:
f0.015 dB from 90 Hz to 10 kHz
f0.3 dB from
f0.07 dB from
Distortion: < -50
HP-IB compatibility as defined by
ANSI Std MC1.l: SH1, AH1, T2, TEO,
Cl,
2,
3,
and
DC Range: 0 to 50V
DC Accuracy: f0.01% at
AC Range: 0 to lOOV
AC Accuracy: f0.01
Ohms Range:
Ohms Accuracy: fl%
4,5.
fO.l
O/O
fO.l
dB from 0 to 20 dB
50
Hz to 100 kHz
20 Hz to
dB from 20 Hz to 200 kHz
0
to 1 Mfl
200
kHz
1V
YO
at 2V and 2 kHz
IEEE
L2,
(2
Std 488 and the identical
LEO,
SRO,
PPO, DCO, DTO,
of
4)
HP 3336C
Option
HP 9825A and
HP 98034A and
HP 98213A
HP 858 Option
HP 3455A
Suggested
Model
005
or
00;
Divider
Probe
(2
required)
Extender
Cable
Frequency
Standard
Oscilloscope
‘C=Operator’!
Divider Ratio:
Input Impedance: 1 MR
Input Capacitance:
No substitution
Accuracy:
Bandwidth: less than 3 dB down 0 to
Sensitivity: 5 mV per division minimum
Input Impedance: 10 MR and 500
Triggering: External and Internal
:becks;
P=Performance Tests: A=Adjustments; T=Troubleshooting
1O:l
<lo
is
recommended.
kO.l
ppm recommended
pF
100
MHz
HP 10040A
~ ~
HP 08901 -60179
House Standard
HP 1740A
1-26
Page 41

Model
8901B
General
Information
Instrument
Type
Power Meter
Thermistor
Mount
Power
Reference
Power Supply
Range
Cali brator
~~ ~
RF
Spectrum
Analyzer
Sensor
Module
Table
Power Range: 1 mW
Transfer Accuracy (input-to-output): 0.2%
SWR: 1.0550 MHz
f
Accuracy:
Power Output: 1
Accuracy: f(1.2% worst case +0.9% rss) for one year; 0 to
Output Range:
Calibration Functions: outputs corresponding to power displays
10
Calibration Uncertainty: f0.25% in all ranges
Frequency Range:
Input Level:
Display Range: 60 dB
Compatible with HP 8901 B
Input SWR:
4.3,
4.5, at RF Input, RF Range 3
4.3, at RF Input, RF Range 3 with Modulation Analyzer’s
Special Function 1.9
0.5% at 50 MHz
pW,
100 pW, 1 mW, 10 mW, and 100 mW
ffO
at RF Input, RF Ranges 1 and 2
1-2.
Recommended Test Equipment
Critical Specifications
.OO
mW, factory set to f0.770, NBS calibrated
0
to 25 Vdc
0
to
2
GHz
dBm maximum
(3
50’
of
of
C
4)
Suggested
HP 432A
HP 478A-H75** or
HP 478A-H76***
HP 435A
Option
HP 6215A
HP 11683A
HP 8559A and
HP 182T
HP 11722A
Model
KO5
No
Service
Accessory
Kit
Signal
Generator
‘C=Operator’s
“HP 478A-H75 must be calibrated at the National Bureau
“‘HP 478A-H76 includes HP standards lab calibration to f0.58% at
substitution recommended.
Frequency Range:
Output Level:
dBm
$19
+13 dBm maximum to 11
Output Level Accuracy:
Frequency Accuracy: fl%
Frequency Resolution: 1 kHz
Modulation Capability: AM and FM
AM Depth:
AM Accuracy: f10%
FM Range:
FM Accuracy:
:hecks; P=Performance Tests; A=Adjustments; T=Troubleshooting
0
0.5
to 11
00
MHz
maximum to
to 95%
0
to 400 kHz peak deviation
500
fl
00
dB
MHz
MHz
f10%
of
Standards (NBS) for this accuracy.
HP 08901 -60287
HP 86408
Options
002
I
50 MHz (traceable to NBS).
001
and
rev.21
JUL87
1-27
Page 42
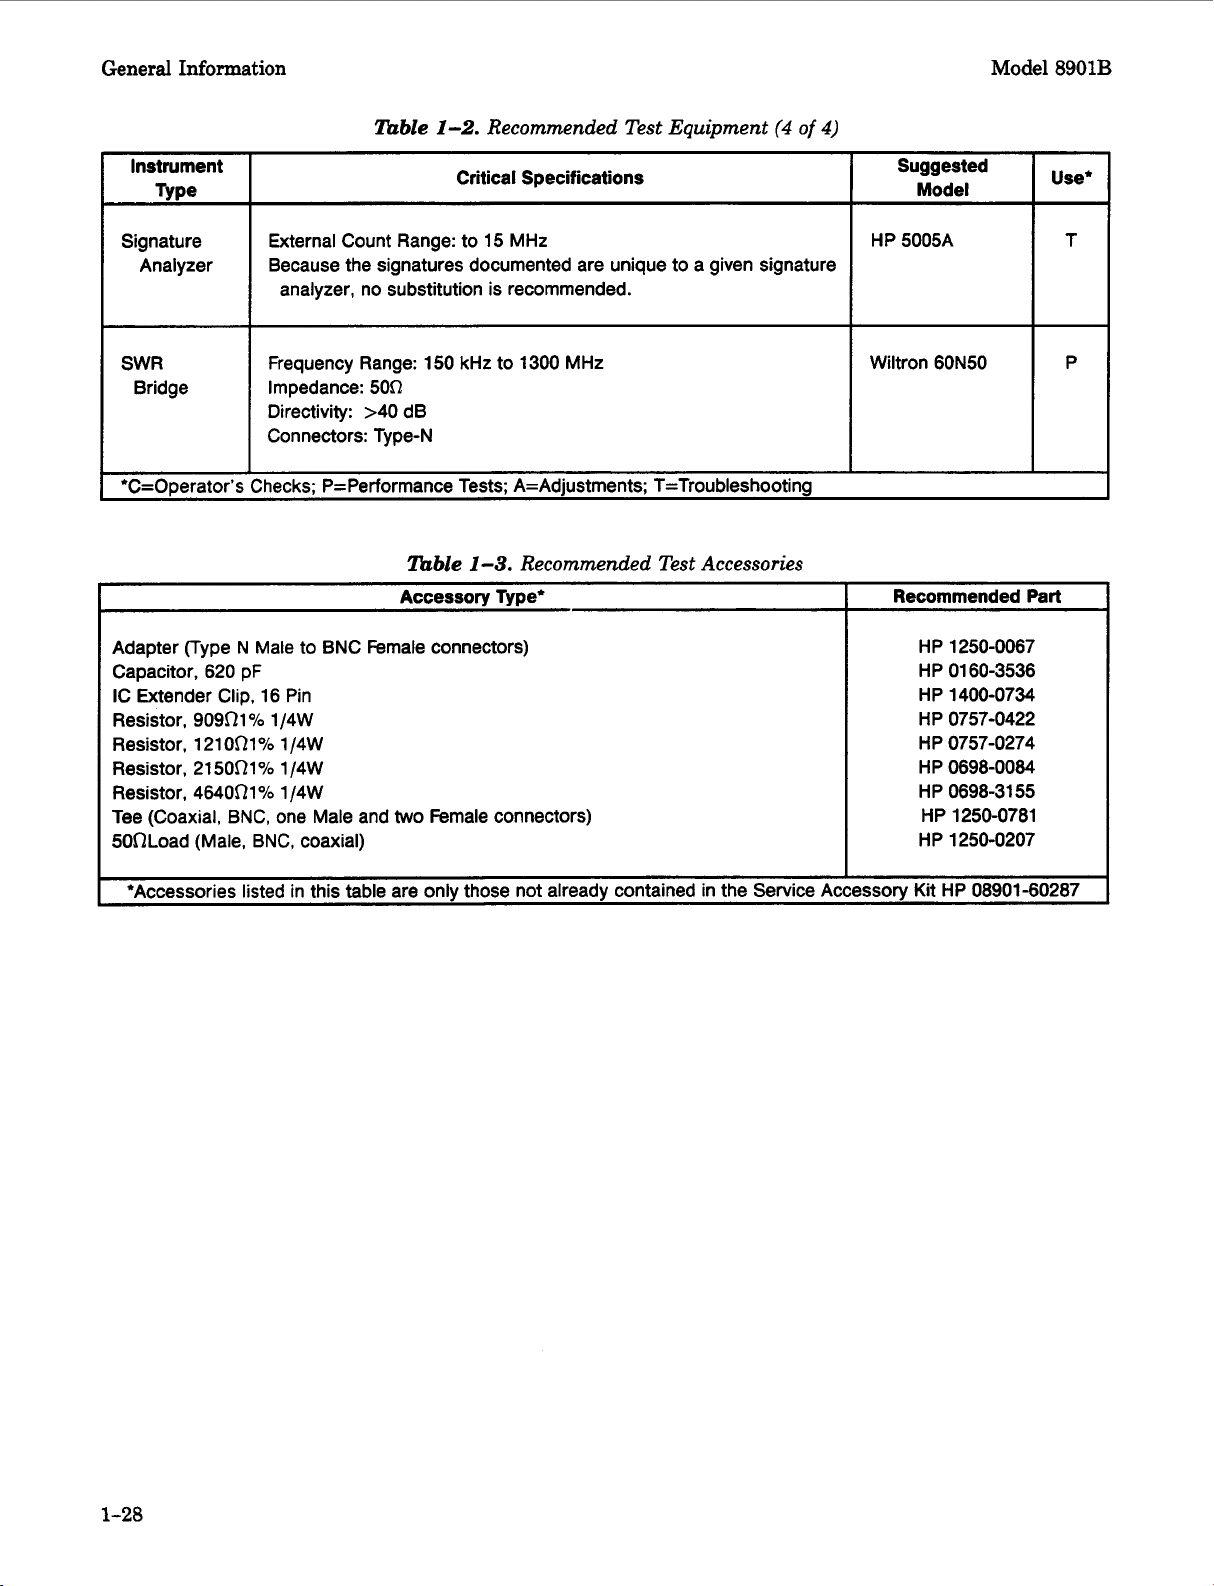
General Information
Model
8901B
Instrument
Type
Signature
Analyzer
llable
External Count Range: to
Because the signatures documented are unique to a given signature
1-2.
Recommended Test Equipment
Critical Specifications
15
MHz
(4
of
4)
analyzer, no substitution is recommended.
SWR
Bridge
Frequency Range:
Impedance:
Directivity:
50R
>40
dB
150
kHz to
1300
MHz
Connectors: Type-N
I
I
*C=Operator's Checks; P=Performance Tests; A=Adjustments; T=Troubleshooting
Accessory Type*
Adapter (Type N Male to BNC Female connectors)
620
Capacitor,
IC Extender Clip,
Resistor,
Resistor,
Resistor,
Resistor,
Tee (Coaxial, BNC, one Male and
50nLoad (Male,
pF
16
90901
O/O
121 001
YO
21 5001%
464001
O/O
BNC,
Pin
1
/4W
1
1
1
/4W
/4W
/4W
coaxial)
two
Female connectors)
I
*Accessories listed in this table are only those not already contained in the Service Accessory
Suggested
Model
HP 5005A
Wiltron
60N50
Recommended
HP
1250-0067
HP
01 60-3536
HP
1400-0734
HP
0757-0422
HP
0757-0274
HP
0698-0084
HP
0698-3155
HP
1250-0781
HP
1250-0207
Kit
HP
Use*
T
P
I
Part
08901-60287
1-28
Page 43

Model 8901B
Installation
2-1.
INTRODUCTION TO THIS SECTION
This section provides the information needed
information pertinent to initial inspection, power requirements, line voltage selection, power cables,
interconnection, operating environment, instrument mounting, storage and shipment. This section also
contains
for removing the pull-out cards.
2-2.
INITIAL INSPECTION
Inspect the shipping container for damage.
damaged,
and the instrument has been checked mechanically and electrically. Procedures for checking electrical
performance are given in Section
or defect, or
Hewlett-Packard office. If the shipping container
of stress, notify the carrier
carrier's inspection.
Section
2
INSTALLATION
to
install the Modulation Analyzer. Included
a
procedure for setting the internal HP-IB talk and Iisten address switches and a procedure
To
avoid hazardous electrical shock, do not perform electrical tests when
of
there are signs
(covers, panels, meters).
it
should be kept until the contents of the shipment have been checked for completeness
if
the instrument does not pass the electrical performance test, notify the nearest
shipping damage to any portion
If
the shipping container
4.
If
the contents are incomplete,
is
damaged, or the cushioning material shows
as
well as the Hewlett-Packard office. Keep the shipping materials for the
of
the outer enclosure
or
cushioning material is
if
there
is
mechanical damage
signs
is
2-3.
PREPARATION
Power
Requirements
The Modulation Analyzer requires a power source
66
Hz single phase. Option
only). Power consumption
FOR
USE
To
avoid the possibility
instrument at line voltages greater than
66
004
is
Hz.
200
greater than
3.5
mA.
of
Leakage currents at these line settings
also operates from
VA
maximum.
pbmimq
hazardous electrical shock, do not operate this
126.5
Vac with line frequencies
may
exceed
(+5%
to -10%) of 100, 120,220, or
48
to
440
Hz
single phase, 120 Vac,
240
(+5%
Vac,
to
48
to
-10%
2-
1
Page 44

Installation Model 8901B
IWARN'NOI
This
is
a Safety
terminal).
the
main power source to
supplied power cord set. Whenever
impaired,
any unintended operation.
If
this
instrument
sure
the
autotransformer's common terminal
pole of
the
Class
I
product (that
An
uninterruptible safety earth ground
the
product input wiring terminal-s, power cord,
the
product
power source.
must
be made inoperative and be secured against
is
to be energized via an external autotransformer, make
it
is,
is
likely
provided with a protective earth
must
be provided from
or
that
the protection has been
is
connected to the earthed
Power
Cables
IWARN'NGI
BEFORE CONNECTING THIS INSTRUMENT,
terminals
of the (Mains) power cord. The Mains plug
outlet provided with
not be negated
protective conductor (grounding).
This instrument is equipped with a three-wire power cable. When connected
power receptacle, this cable
each instrument depends on the country
power cables available.
of
this instrument
a
protective earth contact.
by
the
grounds
the instrument cabinet. The type
must
be connected to
shall
use of an extension cord (power cable) without a
of
destination. Refer
the
the
protective conductor
only be inserted
The
protective action
to
Table
protective earth
in
a socket
must
to
an
appropriate ac
of
power cable plug shipped with
2-1
for the part numbers of the
2-2
Page 45

Model
8901B
Table
2-1.
AC Power Cables Availiable (P/O ERRATA)
Installation
Plug
Type
250V
250V
8
ho
250V
125V
1
oov
(Same plug as above)
250V
250V
Cable
HP
Part
Number
-
8120-1351
81 20-1 703
81 20-1 369
81 20-0696
81 20-1 689
81 20-1 692
81 20-1 378
81 20-1 521
81 20-1 751
81 20-4753
81 20-4754
81 20-21
81 20-2296
81 20-3997
81 20-0698
Description
0
90°/STR BS1363A'
4
9oo/900
o
STRISTR
4 I NZSSl98/ASC112*
STR/90°
7
STR/STR'
2
STR/90°
STR/STR NEMA5-15P'
1
6
STR/90°
1
STR/STR
2
STR/STR
3
STR/90°
STR/STR SEVl 01 1 79 Gray
3
04
1959-24507
Type 12
4
STR/90°
4
STR/90°
STR/STR NEMA6-15P 90 Black United States,
6
Plug
Cable
90 Mint Gray United Kingdom,
90 Mint Gray Cyprus, Nigeria,
Cable For Use
Rhodesia,
Singapore
Austrailia,
New Zealand
II
79
79
80 Jade Gray United States,
80 Jade Gray Canada, Mexico,
90 Jade Gray U.S./Canada
90 Dark Gray Japan only
90 Dark Gray Japan only
79
177 Gray
Mint Gray East and West
Mint Gray Europe, Saudi
Arabia, Egypt,
(unpolarized
manv nations)
Phillipines, Taiwan
Switzerland
Gray
Canada
in
0
00
250V
250V
m
250V
Part number shown for plug
cable including plug.
rev.07JUL.87
81 20-2956
81 20-2957
81 20-3997
81 20-421 1
81 20-4600
8120-1860
81 20-1 575
8120-2191
81 20-4379
is
E
=
Earth Ground:
inc
90°/STR 79 Gray Denmark
3
4
9oo/900
4
STR/STR
I
7
STR/STR*IEC83-B1
8
STR/90°
STR/STR*CEE22-V1 Jade Gray
(Systems Cabinet Use)
STR/STR Jade Gray
0
8
8
-
identifier for plug only. Number shown for cable
d
L
=
Line: N = Neutral;
II
I
I
STR
=
79
Straight
I
I
Jade Gray
Jade Gray
Black
is
I
HP
Part Number for complete
South Africa, India
2-3
Page 46

Installation Model 8901B
Line Voltage and Fuse Selection
BEFORE PLUGGING THIS INSTRUMENT into the Mains (line) voltage,
be sure the correct voltage and fuse have been selected.
Verify
Figure 2-1,
that
the line voltage selection card and the fuse are matched
Line Voltage and he Selection.
hses may be ordered under HP
operation
and
2110-0043,
1.5A
(250V normal blow) for 230 Vac operation.
to
the power source. Refer
part
numbers 2110-0083, 2.5A (250V normal blow) for
Operating voltage
in
module window.
is
shown
115
to
Vac
Selection
1.
Open cover door,
2.
Remove the Line Voltage Selection Card. Position the card so the line voltage appears at top-left
corner.
3.
Rotate the
Push
FUSE
pull
the card
PULL
the
firmly
FUSE
into the slot.
lever
to
of
Operating Voltage and
PULL
its
normal position. Insert a fuse
Close the cover door.
HP-IB
Address Selection
The HP-IB address switches
Figure
2-1.
are
located within the Modulation Analyzer. The switches represent
five-bit binary number. This number represents the
In
controller must generate.
talk
only or to listen only.
addition,
two
Fuse
Replacement
lever and rotate to left. Remove the fuse.
of
the correct value
Line Voltage and Fuse Selection
talk
and listen address characters which
more switches allow the Modulation Analyzer
in
the holder.
an
to
HP-IB
be set
a
to
2-4
Page 47
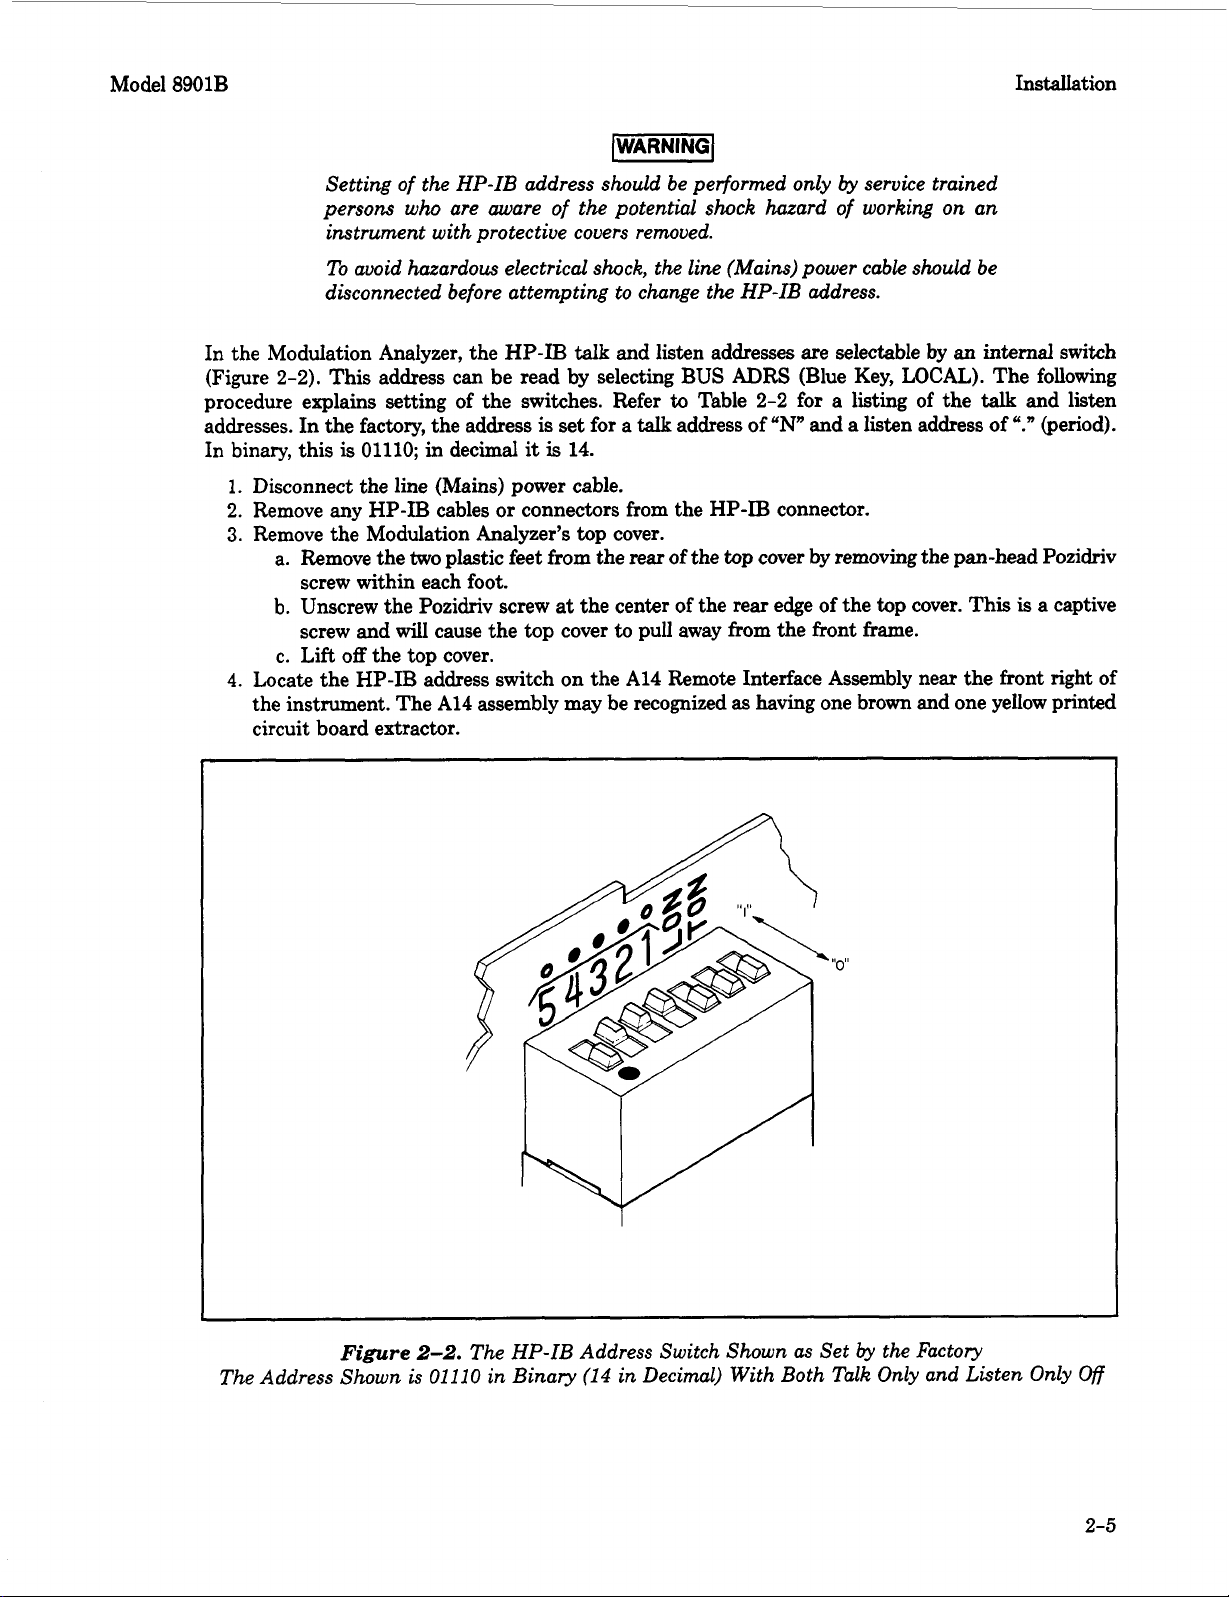
Model
8901B
Installation
Setting of the HP-IB address should be performed only
persons who are
aware
of
the potential shock hazard
by
service trained
of
working on an
instrument with protective covers removed.
To avoid hazardous electrical shock, the line (Mains) power cable should be
disconnected before attempting to change the HP-IB address.
In t,,e Modulation Analyzer, the HP-Il3
(Figure
procedure explains setting of the switches. Refer
addresses. In the factory, the address
In binary, this
2-2).
This address can be read by selecting BUS
is
01110;
1.
Disconnect the line (Mains) power cable.
2.
Remove any HP-Il3 cables or connectors from the HP-E3 connector.
3.
Remove the Modulation Analyzer’s
a. Remove the
screw within each foot.
b.
Unscrew the Pozidriv screw
screw and
c.
Lift
off
4.
Locate the HP-IB address switch on the A14 Remote Interface Assembly near the front right of
the
instrument. The A14 assembly may be recognized
circuit board extractor.
the
in
decimal
two
plastic feet from the rear of the
will
cause the top cover
top
cover.
talk
and listen addresses
ADRS
to
Table
is
it
is
set for a
14.
top
at
talk
address of
cover.
top
the center of the rear edge of the
to
pull away from the front frame.
as
are
selectable by an internal sw.xh
(Blue Key,
2-2
for a listing of the
“N”
and
cover by removing the pan-head Pozidriv
having one brown and one yellow printed
LOCAL).
a
listen address of
top
cover. This
The following
talk
and listen
“.”
(period).
is
a
captive
The Address
Figure
Shown
is
2-2.
The HP-IB Address Switch Shown
01
11
0
in Binary
(14
in
Decimal)
as
Set
by
the Factory
With
Both Talk Only and Listen Only
Off
2-5
Page 48

Installation Model
5.
Use a pencil
Only (LON) condition. The switch
switch (marked with
toward the printed circuit board places
both set
all
set
cycle. (Setting
6.
Reinstall the
7.
Connect the line (Mains) power cable
to
the HP-IB connector.
8.
To confirm the address,
confirm a
in
the form AAAAA.TLS where
talk, listen, and service request
to
to
set the switches
a
“5”)
to
“l”,
the Talk Only setting will override.
“l”,
the Modulation Analyzer will output one byte (the
all
switches
top
cover by reversing the procedure in previous step
turn
talk
only or listen only setting, key
lbble
to
the desired HP-IB address and Talk Only (TON) or Listen
is
illustrated in Figure
is
the most significant address bit
it
in
its
“1”
position. If the TON and LON switches are
If
the address switches and the TON switch are
to
“1”
defeats HP-IB operation.)
to
the Line Power Module and reconnect the HP-IB cable
on the instrument and select BUS
in
21.0
AAAM
status.
2-2.
is
the HP-IB address
Allowable
HP-IB
Address Codes
2-2.
Facing the board, the left hand
(A5
in Table
status
2-2).
Setting a switch
byte)
each measurement
3.
ADRS
(Blue Key, LOCAL). To
SPCL. The display shows a binary number
in
binary and T,L, and S indicate
8901B
A
-
95
-
0
0
0
0
0
0
0
0
0
0
0
0
0
0
0
0
1
1
1
1
1
ire
-
94
-
0
0
0
0
0
0
0
0
1
1
1
1
1
1
1
1
0
0
0
0
0
8s
-
43
-
0
0
0
0
1
1
1
1
0
0
0
0
1
1
1
1
0
0
0
0
1
itcl
-
A2
-
0
0
1
1
0
0
1
1
0
0
1
1
0
0
1
1
0
0
1
1
0
‘S
-
A1
-
0
1
0
1
0
1
0
1
0
1
0
1
0
1
0
1
0
1
0
1
0
Talk
Address
Character
@
A
B
C
D
E
F
G
H
i
J
K
L
M
N
0
P
Q
R
S
T
Listen
Address
Zharacter
SP
!
#
$
%
&
(
1
+
-
I
0
1
2
3
4
Decimal
Equivalen
0
1
2
3
4
5
6
7
8
9
10
11
12
13
14
15
16
17
18
19
20
2-6
1
1
1
1
1
1
1
1
1
1
1
-
0
0
0
1
1
1
1
1
1
1
1
-
1
1
1
0
0
0
0
1
1
1
1
-
0
1
1
0
0
1
1
0
0
1
1
-
1
0
1
0
1
0
1
0
1
0
1
-
U
v
W
X
Y
Z
r
\
1
..
Invalid
5
6
7
8
9
c
- -
>
Invalid
21
22
23
24
25
26
27
28
29
30
31
Page 49

__
Model
8901B
SHOULD BE GROUNDED
NEAR TERMINATION
OF
OTHER WIRE
TWISTED PAIR
OF
SIGNAL
GROUND
P/O TWISTED PAIR WITH
P/O TWISTED PAIR WITH
P/O TWISTED PAIR WITH
P/O TWISTED PAIR WITH
P/O TWISTEO PAIR WITH
P/O TWISTED PAIR WITH
REN
010
DIO
DIO
DIO
ISOMETRIC
THREAD
M3.5
-
x
0.6
11
10
9
8
7
6
8
7
6
5
SHIELD -CONNECT TO
ATN EARTH
SRO
IFC
NDAC
NRFD
DAV
EO1
Dl0 4
DIO
DIO
010
24-PIN MICRO-RIBBON
(SERIES
3
2
1
57)
GROUND
CONNECTOR
Installation
The Hewlett-Packard interface Bus logic levels are
and the false
Programming and Output Data Format
Refer to Section 3 "Operation".
Mating Connector
HP 1251 -0293; Amphenol 57-30240
Mating Cables Available
HP 10833A, 1 meter (3.3 ft.), HP 108338 2 meters (6.6
HP 10833C 4 meters (13.2
Cabling Restrictions
1.
A
instrument.
(0) state is 2.5 Vdc to
ft.),
HP 10833D,
Hewlett-Packard interface
+5
Vdc.
Bus
system may contain no more than 2 meters (6.6
0.5
meters (1.6
TTL
compatible, that is, the true (1) state
ft.)
ft.)
ft.)
is
0.0
Vdc to +0.4 Vdc
of connecting cable per
rev.
15MAY89
Figure
2-3.
Hewlett-Packard
Interface
Bus
Connection
2-7
Page 50

Installation Model 8901B
Interconnections
Interconnection data for the Hewlett-Packard Interface Bus
is
provided in Figure 2-3.
Mating Connectors
Interface Connector.
screws are metric.
Coaxial Connectors.
50R
BNC male connectors
in
US
MIL-(2-39012.
The application note, “Principles of Microwave Connector Care” (HP part number 5958-7442) can help
you improve measurements and reliability. Suggestions in the application note will help you get the best
performance from
connectors (in order
microwave connections (improving the accuracy and repeatability of all your measurements).
The HP-IB mating connector
Coaxial mating connectors used with the Modulation Analyzer should be the
or
50R
Qpe-N male connectors that are compatible with those specified
all
microwave connectors.
to
preserve their precision and extend their life) and how
It
will
is
shown in Figure 2-3. Note that
show what
to
look for when cleaning and inspecting
two
to
make the best possible
Operating Environment
The operating environment should be within the following limitations:
Temperature..
Humidity
Altitude
..........................................................
................................................................
.......................................................
.4570
-0°C
meters
<95%
(15
securing
to
+55”C
relative
000
feet)
Bench Mounting
The instrument cabinet
(The plastic feet are shaped
raise the front of the instrument for easier viewing of the front panel.
has
plastic feet and fold-away
to
ensure self-aligning of the instruments when stacked.) The tilt
tilt
stands
for convenience in bench operation.
Rack Mounting
The Modulation Analyzer
exercised when lifting to avoid personal injuv. Use equipment slides when
rack mounting.
Rack
mounting information is provided with the rack mounting kits.
as
the instrument
to paragraph 1-8,
rack mounting the Modulation Analyzer, the
bottom of the instrument) must
procedure that follows.
options, they may be ordered through the nearest Hewlett-Packard office. (Refer
Additional Equipment Information
first
is
heavy for its size
Operating Information
be removed. To remove the pull-out card assembly, refer
(23.6
kg,
52
lb). Care must be
If
the kits were not ordered with
under
Mechanical Equipment Available.
pull-out tray (attached
Removal and Installation of Operating Information Pull-Out Cards
Steps for Removal.
card assembly:
1.
Remove the
2. Remove the Operating Information tray assembly by sliding the tray toward the rear of the
instrument and then down.
3.
Remove the information cards by bowing them slightly in the middle and pulling
(away from the tray).
Follow the procedure below
two
front feet of the instrument.
to
remove the
Operating Information
stands
Before
to
to
pull-out
it
straight up
the
the
2-8
Page 51

Model 8901B Installation
Steps
card assembly:
2-4.
STORAGE AND SHIPMENT
for
Installation.
1.
Install the information card by bowing
into the plastic guide slots near the front of the tray.
2.
Push the information card
3.
Place the information tray assembly between the rear feet of the instrument and slide it forward
until the tabs are locked under the rear feet.
4.
Replace the front feet of the instrument.
Environment
The instrument should be stored in a clean,
to
apply
both storage and shipment:
Temperature..
Humidity
Altitude..
...................................................
Packaging
Original Packaging.
through Hewlett-Packard offices.
attach
number. Also mark the container FRAGILE
the instrument by model number and full serial number.
a
tag indicating the iype of service required, return address, model number and full
Follow the procedure below
it
all
the way into.the tray.
dry
to
reinstall the
slightly in the middle and carefully guiding the edges
environment. The following environmental limitations
Operating Information
.........................................................
................................................................
.15
300
Containers and materials identical
If
the instrument
to
assure careful handling.
to
those used
is
being returned
in
factory packaging are available
to
Hewlett-Packard for servicing,
In
any correspondence refer
-55°C
~95% relative
meters (50
pull-out
to
+75OC
000
feet)
serial
to
Other Packaging.
cially available materials:
1.
Wrap the instrument
center, attach a tag indicating the service required, return address, model number and
number.)
2.
Use a strong shipping container. A double-wall carton made of 1.9 MPa (275 psi) test
is
adequate.
3.
Use enough shock-absorbing
instrument
with cardboard.
4.
Seal the shipping container securely.
5. Mark the shipping container FRAGILE
The following general instructions should be used for re-packaging with commer-
in
heavy paper or plastic.
material
to
provide firm cushion and prevent movement
(75
(If
shipping
to
100 mm layer;
to
assure careful handling.
to
in
the container. Protect the front panel
a
Hewlett-Packard office
3
to
4
in.) around
or
full
material
all
service
serial
sides of
rev.
16JUN87
2-9
Page 52

Model 8901B Operation
3-1.
INTRODUCTION TO THIS SECTION
This section provides advanced operating information for the Modulation Analyzer. Included in this
section are descriptions of all front
local operator’s checks, operating instructions, and operator’s maintenance.
Local Operation Section
Information regarding front-panel operation of the Modulation Analyzer is provided in the sections
described in the following paragraphs.
to
refer
Once familiar with the general operation of the instrument, use the
for
the separate
the most in-depth and complete information on operating the Modulation Analyzer.
Remote Operation Section
The Modulation Analyzer is capable
(HP-IB). Provided in this section are instructions pertinent
considerations and instructions (including capabilities, address formats, input and output formats, the
status byte, and service requests).
and formats.
Section
3
OPERATION
and
rear-panel controls, connectors, and indicators, remote and
To
most rapidly learn the basic operation of the instrument,
Basic Operation and Application Guide
of
remote operation via the Hewlett-Packard Interface Bus
to
At
the end
of
the discussion
and/or perform the
Detailed Operating Instructions
HP-IB operation including
is
a complete summary of all codes
Operator’s Checks.
all
specific
HP-IB information concerning remote information
is
setting
Operating Information
in the
paragraph,
discussed in Section
Detailed Operating Instructions.
Local Operation Section.)
pull-out card, and a list
2,
a summary
(Detailed Operating Instructions are described above in the
also
appears in several other locations. Address
of
HP-IB codes and output formats appears on the
of
relevant program codes for each function appears
Basic Functional Checks Section.
Basic finctional Checks
verify the proper operation of the Modulation Analyzer’s main functions and HP-IB capabilities.
These checks can also be used
measurements and HP-IB capabilities.
Basic Functional Checks
controlled functions are being properly executed by the Modulation Analyzer. The checks require the
use of a sensor module, a signal generator, an oscilloscope, and interconnecting cables and adapters.
Basic Functional Checks
This series of procedures requires only an HP-IB compatible computing controller and an HP-IB
interface and connecting cable. The
been
verified (for example, by performing the
are simple procedures designed
to
familiarize the first-time operator with basic Modulation Analyzer
Two
procedures are provided
of
the Modulation Analyzer.
of
the Hewlett-Packard Interface Bus (HP-IB)
HP-IB finctional Checks
Basic finctional Checks).
to
be performed by the operator. These checks
This procedure assures that most front-panel
assume that front-panel operation has
3-1
Page 53

Operation Model 8901B
Detailed Operating Instructions Section
The
Detailed Operating Instructions
lyzer user. The instructions are organized into tabbed sections oriented
types. Besides information on the various measurements, the instructions contain individual discus-
sions of nearly all controls, inputs, and outputs. Also included are instructions for using the many
A
user special functions.
instructions themselves.
guide
provide a complete operating reference for the Modulation Ana-
to
using the
toward
Detailed Operating Instructions
specific measurement
is
provided ahead of the
Other Sources of Operating Information
Pull-Out
flexible plastic reference sheets attached
front panel. They contain a brief summary of front-panel operation and displays.
cards
functions. The cards show a simplified block diagram for the Modulation Analyzer and provide basic
instructions for RF Power and AM and FM Measurements. The pull-out cards are intended
reference for the user who already has a basic understanding of front-panel operation.
Supplemental Information.
its fullest capabilities, are contained
Diagram” (in paragraph 1-10) is a fundamental description of what the Modulation Analyzer
how
the
the way the Modulation Analyzer makes modulation measurements.
provide a basis for applying the Modulation Analyzer
3-2.
OPERATING CHARACTERISTICS
The major operating characteristics of the Modulation Analyzer are provided
Description,
section in this manual.
3-3.
OPERATOR’S INFORMATION
Cards.
is
a
complete listing
it
works. This information supplements the block diagrams provided
The
Operating Information
Detailed Operating Instructions.
and Table
to
the Modulation Analyzer by a tray located beneath the
of
HP-IB codes,
Other information, pertinent
1-1
,
Specifications.
data,
in
Section
“Modulation Basics”
OF
THE MEASURING RECEIVER
For information on HP-IB capabilities, refer
and
Special finction Information Pull-Out Cards
Also
included on the
and error output formats, error codes, and user special
to
be
to
operating the Modulation Analyzer
1.
“Principles of Operation for a Simplified Block
is
and
on
the pull-out card and
(in
paragraph
to
various measurement situations.
1-11)
is
a discussion about
All
of this information helps
in
paragraph 1-6,
to
Remote
are
a
to
in
to
3-2
Fuses
For
continued protection against fire hazard, replace the line fuse only with
a
250V
normal blow fuse of the same rating. Do not use repaired fuses
short-circuited fuseholders.
The only maintenance the operator should normally perform
fuse located within the Line Power Assembly (A30). For instructions on how
1
and
to Figure 2-1, steps
Fuses can be ordered using HP part number 2110-0083, 2.5A (250V, normal blow) for 100/120 Vac
or
operation
2110-0043, 1.5A (250V, normal blow)
3.
for
220/240 Vac operation.
is
the replacement of the primary power
to
or
change the fuse, refer
Page 54

Model 8901B Operation
Time Base
10 MHz
Input and Time Base
10
MHz
Output
[-I
Do
not apply greater than 20Vpeak (ac + dc) into the TIME BASE
MHz
INPUT
Do
not apply greater than 3 Vdc
BASE
10
or
MHz
damage to the instrument may result.
or
OUTPUT
greater than
or
damage to the instrument may result.
+20
dBm into the TIME
Description
Time Base
input is ac coupled and requires an input signal ievel greater than
approximately 5000.
The time-base circuitry of the Modulation Analyzer automatically switches
when an external time base
When using an external time base reference, the accuracy of
of the external reference. Frequency-related measurements are most noticeably affected by time-base
inaccuracy.
To determine whether the Modulation Analyzer has actually switched in the externally applied time
base, select 15.1
time base is being used, the display will show
10
MHz
SPCL.
Input.
If
an
Provides an input for an external 10 MHz time base reference. This
0.5
Vpp. The input impedance
to
the external time base
of
sufficient amplitude
external time base
is
applied.
all
is
being used, the display
0.
measurements depends on the accuracy
wilI
show
10
1.
If the internal
is
If the Modulation Analyzer
the time base oven is warm enough
0
if
the time base oven
To
drive several instruments from a single external reference, simply use a BNC tee at the Modulation
Analyzer’s TIME BASE 10 MHz INPUT.
If the internal time base fails,
to TIME BASE
to ON.
Time Base
002.)
output
When driven from an external reference, the Modulation Analyzer outputs the internal reference (not
the external input signal). TIME BASE 10 MHz INPUT provides an input for
time base reference. This input
The input impedance is approximately 500fl.
10
MHz
Provides an output for the internal
(OV
to
greater than 2.2V into an open circuit).
is
10
MHz INPUT, then switch the instrument’s POWER
Output.
3-4. TURN-ON PROCEDURE
Before the Modulation Analyzer
of the power source,
paragraph
2-3,
is
using the internal, Option 002 time base, you can determine whether
to
create a stable source by selecting 15.0. The display
adequately warm. The display
an
external time base may still be used. Connect the external time base
(This output
is
ac coupled and requires an input signal level greater than 0.5 Vpp.
or
Power Requirements.
is
available only with the high-stability reference, Option
10
MHz reference. The output
is
switched on, it must be set to the voltage
damage to the instrument may result. Refer to
will
show Error 12
if
the time base
switch
is
a
to
500,
an
STBY
TTL
external 10 MHz
will
show
is
cold.
and back
compatible
a
Do
not apply greater than
damage to the instrument may result.
40V
(ac + dc) to the RF INPUT connector
or
3-3
Page 55

Operation Model 8901B
Before the Modulation Analyzer
is
switched on, all protective earth terminals, extension cords, auto-transformers, and devices connected to
be connected to a protective earth socket. Any interruption of the protective
earth grounding will cause a potential shock hazard that could result in
personal
For
injury.
continued protection against fire hazard, replace the line fuse with a
250V normal blow fuse of the same rating. Do not use repaired fuses
short-circuited fuseholders.
The Modulation Analyzer
an
internal power supply
002) the supply energizes the internal reference oven.
Check
POWER
that
the line voltage setting matches the power source. (See Figure
in, set the
1.
has
is
activated. In instruments supplied with the high-stability reference (Option
switch to
a
standby state and
ON.
If
the power cable is not plugged 'in, follow these instructions:
an
he Selection.)
2.
Check that the fuse rating
and fie Selection.)
this section.
3.
Plug in the power cable.
4.
Set the
POWER
switch
is
appropriate for the line voltage used. (See Figure 2-1,
fise ratings are provided in the paragraph
to
ON.
NOTE
on
state.
Whenever the power cable
If
the Modulation Analyzer
it
shouM
or
is
plugged in,
is
already plugged
2-1,
Line Voltage and
Line Voltage
Operator's Maintenance
in
When the POWER switch
for approximately
operated.
3-5.
INSTRUMENT FEATURES
Front-panel controls, indicators, and connectors are illustrated and referenced
The text for this figure describes the various functions of the Modulation Analyzer.
description is
Rear-panel features are shown and referenced to text in Figure
a quick reference for rear-panel signal levels and frequencies and also includes the impedances at the
rear-panel connections.
The information in parenthesis
a
Operating Instructions
reference
relevant
is
set to
10
seconds after which the instrument
to
a
detailed operating instruction
at
the end of each feature summary provides the title of the
to
the feature.
ON,
all front-panel indicators
that
contains more details on this topic.
3-2.
The text for this figure provides
is
ready to be
to
light
text in Figure
At
the end of each
Detailed
3-1.
3-4
Page 56
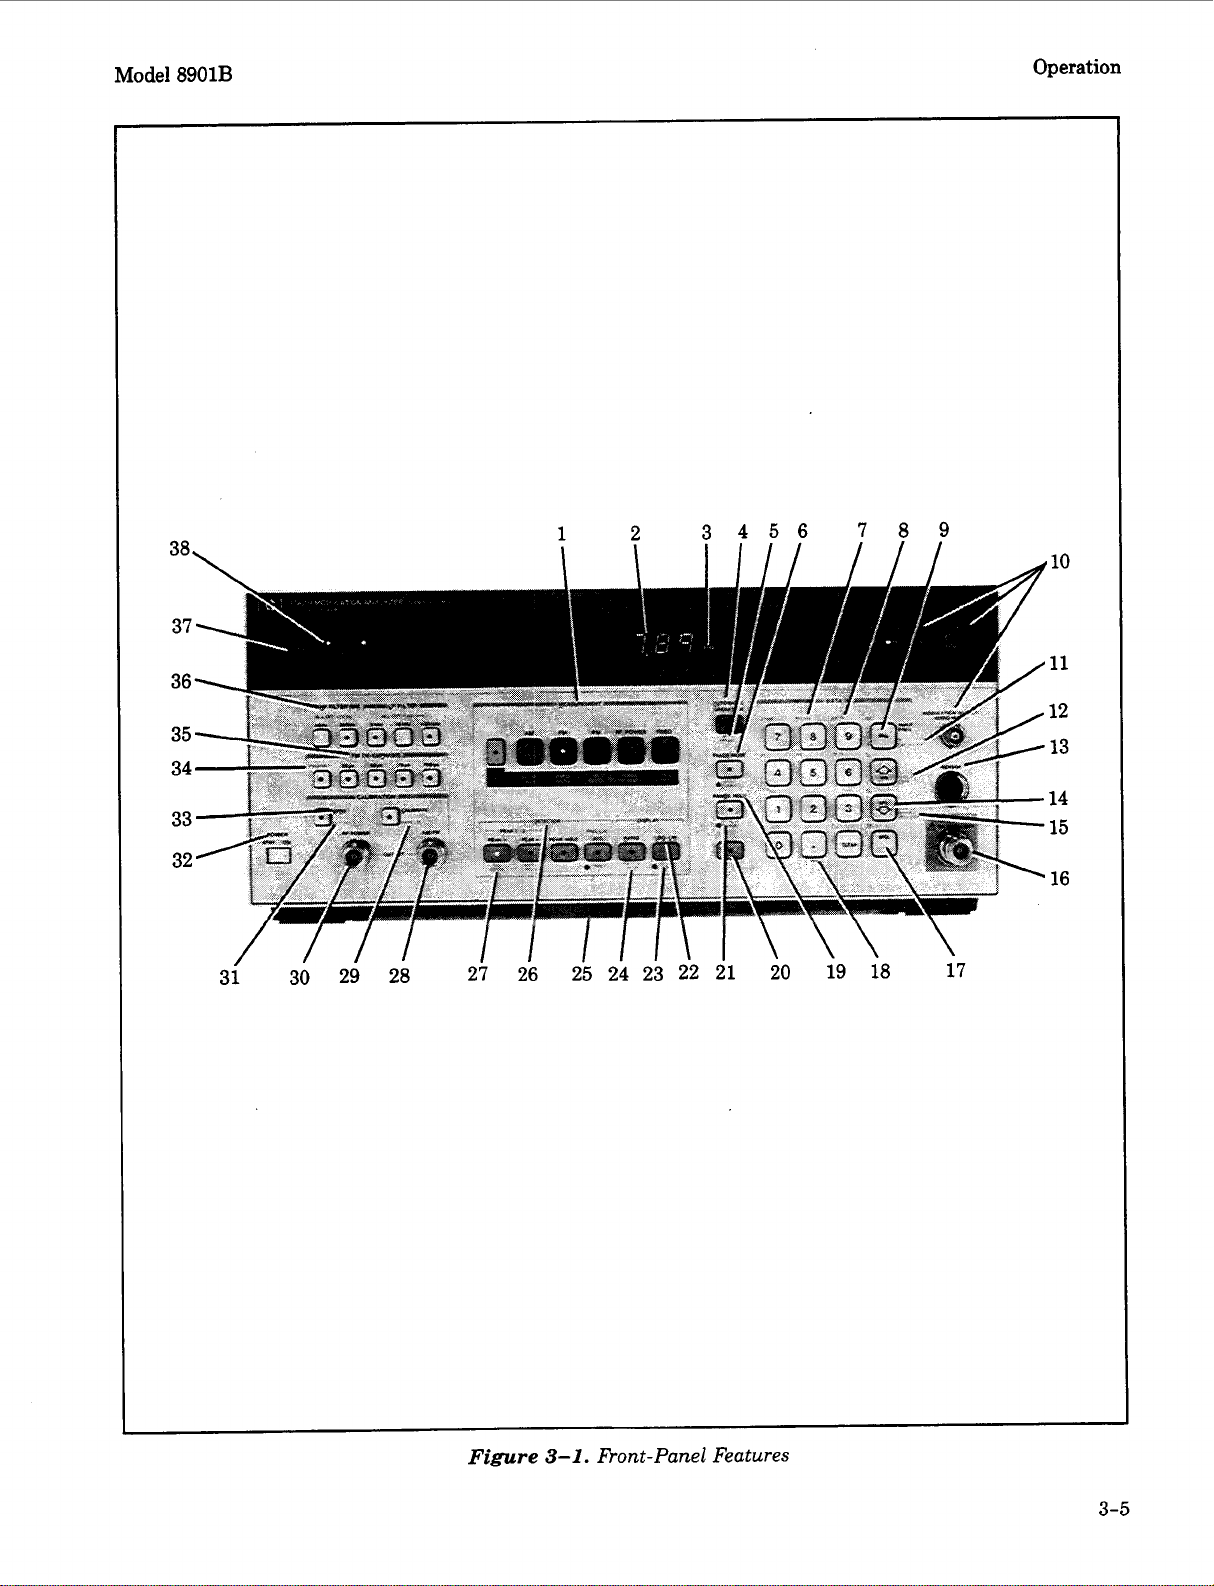
Model
8901B
Operation
38
37
36
35
34
33
32
3i 30 29
28
1
27
26 25 24 23 22
2
3456 7
8
9
10
11
12
13
14
15
16
21
20
19 18 17
Figure
3-1.
l+ont-Panel
Features
3-5
Page 57

Operation Model 8901B
Front-Panel Features
The following list provides a brief description of each feature. The information
the title of the
Detailed Operating Instructions
relevant to the feature. The index lists page numbers
in
brackets provides
for the instructions.
1.
MEASUREMENT keys enable the Modulation Analyzer
measurement. [See
AM, FM,
@M,
RF Power, RF Input FYequency, Audio FYequency, Audio
to
make and display the selected
Distortion, IF Level, Tuned RF Level, RF FYequency Error.]
2.
Numeric Display shows measurement results, error codes,
or
instrument
or
Special Function
status.
3.
Display Annunciators indicate the measurement result units. They also indicate that some
measurement functions are enabled. All these annunciators are displayed when the Modulation
is
Analyzer
4.
AUTOMATIC OPERATION enables the Modulation Analyzer
autorange to make the selected measurement. [See
5.
INSTR PRESET (Blue Key) configures the Modulation Analyzer to
first turned on.
to
automatically tune and
Automatic Operation.]
its
power-up condition. [See
Instrument Preset.]
6.
TRACK
Analyzer. [See
7.
STORE (Blue Key) and RECALL (Blue Key) enable the Modulation Analyzer
up to eight measurement states. [See
8.
WATTS, pV, mV, and VOLTS keys (all used with the Blue Key) enable selection of different
units
MODE
for
level measurements.
and
RF
FYequency Tuning.]
AUTO
TUNING (Blue Key) select the tuning mode of the Modulation
to
store and recall
Store/Recall.]
to
9.
MHz completes the keyboard entry
to
complete the entry of frequencies used with RF Power calibration factors. [See
nning, FYequency Offset Mode,
RF
of
frequencies for various functions. This key
Power.]
is
also used
RF FYequency
10. MODULATION OUTPUT/AUDIO INPUT connector provides either an output for the modulation recovered from the RF INPUT connector
an input for external audio signals
to
be
or
processed by the audio circuitry. The MODULATION OUTPUT annunciators indicate the type
of
recovered modulation available as the output. The AUDIO INPUT key selects whether the
internally demodulated signal
Analyzer’s audio circuitry. [See
Distortion
11.
7%
CAL FACTOR (Blue Key) causes the Modulation Analyzer to display the current calibration
and
Level, SINAD.]
or
an external audio signal
is
to be processed by the Modulation
Modulation OutputlAudio Input, Audio FYequency, Audio
factor for the selected measurement. This key is also used to complete the entry of calibration
factors for various functions. [See
12.
DISPLAY FREQ (Blue Key) causes the Modulation Analyzer to display the RF frequency that
it tuned to last. [See
FFequency Offset Mode, RF Power Calibration Factors.]
13. SENSOR connector provides the input for the power sensor. [See
14.
kHz 0 and kHz 4 complete keyboard entry of frequency step-size (in kHz) for step tuning,
change the frequency in the increments specified. [See
15.
DISPLAY FREQ INCR (Blue Key) causes the Modulation Analyzer to display the increment
step-size. [See
RF Frequency Tuning.]
16. INPUT couples the RF input signal into the instrument. [See
AM Calibration, FM Calibration, RF Power.]
RF Power.]
or
RF FYequency Tuning.]
RF Input Requency.]
’
3-6
17. SPCL completes entry
of
Special Function codes that access additional instrument operations.
Without a preceeding numeric entry, the SPCL key causes a display
Functions
1
through
10.
[See
Special finctions.]
of
the status
of
Special
Page 58

Model
8901B
18.
19.
20.
21.
22.
23.
24.
25.
Operation
(-)
(Blue Key) enables input
RANGE HOLD freezes the current ranges being used
data
to
be entered
as
a negative value.
by
the Modulation Analyzer. [See
Range Hold.]
Blue Key is a shift key that enables some keys
printed in blue can be selected when the key associated with
at
(The Blue Key flashes
the current measurement rate whenever it
DISABLE ERROR (Blue Key) disables Error
to
have
two
01
through Error
different functions. Any function
it
is
pressed after the Blue Key.
is
pressed.)
04.
[See
Error Message
Disable Control.]
LOG/LIN causes measurements to alternate between logarithmic and linear units. [See
LoglLin.
dB
or gain. [See
RATIO and PREVIOUS
reference. [See
Operating Information
]
EXT ATTEN (Blue Key) enables level measurements
External Attenuation.]
RATIO
(Blue Key) cause the current measurement
Ratio and LoglLin.1
pull-out cards are quick operating references that list Special Function,
to
be offset with external attenuation
to
be compared
Ratio and
to
HP-IB, and Error codes, show a simplified block diagram for the Modulation Analyzer, and
RF
provide basic information for
Power
and
AMFM Calibration.
a
DETECTOR keys select the audio detector used
26.
to
measure the modulation.
[See
Audio Distortion and Level, SINAD.]
27.
1
kHz DISTN (Blue Key) and
make audio measurements on either 1 kHz
400
Hz DISTN (Blue Key) enable the Modulation Analyzer
or
400
Hz audio
signals.
[See
Audio Distortion and
Level, SINAD.]
CALIBRATION AMFM OUTPUT makes available a precisely modulated signal used
28.
the Modulation Analyzer’s AM or FM accuracy. [See
CALIBRATE and SAVE CAL (Blue Key) enable the Modulation Analyzer
29.
the resulting calibration factor for either
RF
initiates tuned RF level calibration operations. [See
CALIBRATION RF POWER OUTPUT makes available a
30.
to
precisely determine the sensitivity of the external power sensor. [See
31.
SET
REF (Blue Key) is not a Modulation Analyzer function.
POWER switch applies power
32.
Preset.
ZERO causes the Modulation Analyzer
33.
sensor. [See
PRE DISPLAY enables FM deviation
34.
]
RF Power.]
to
the Modulation Analyzer when set
to
cancel any dc offset that may be present in the power
to
be measured before
AM Calibration, FM Calibration.]
to
Power, AM, or FM. The CALIBRATE key
AM Calibration, FM Calibration, RF Power.]
50
MHz, 1 mW power reference
RF Power.]
to
ON. [See
or
after de-emphasis. [See
De-Emphasis.]
FM DE-EMPHASIS networks equalize pre-emphasized FM. [See
35.
FM De-Emphasis.]
Audio Detectors,
to
to
improve
calibrate and save
also
used
Instrument
FM
HP (High-Pass) and LP (Low-Pass) FILTERS limit the demodulated signal bandwidth. [See
36.
Audio Filters.]
LOCAL returns the Modulation Analyzer to keyboard control from remote (HP-IB) control.
37.
HP-IB Annunciators indicate remote operation status.
38.
3-7
Page 59

Operation
Model
8901B
1
234
16 15 14 13 12 11 10
5
678
9
3-8
Figure
3-2.
Rear-Panel Features
Page 60
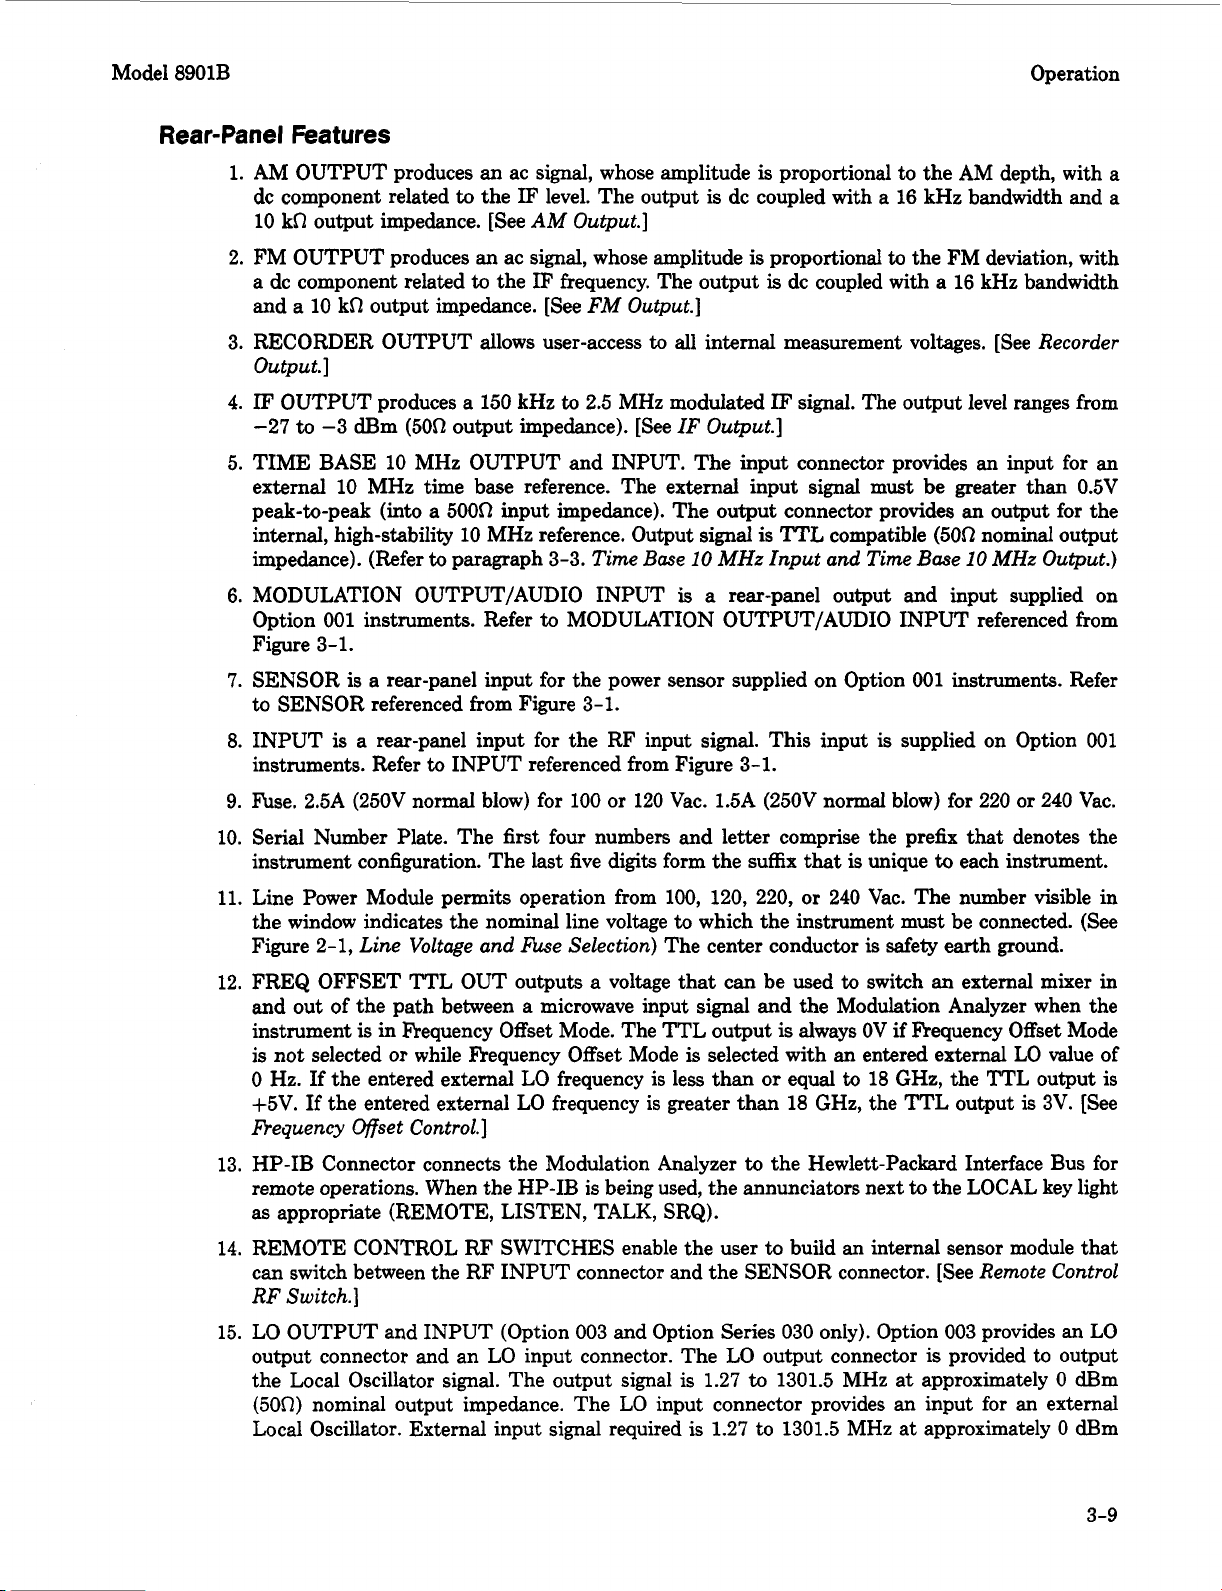
Model 8901B
Rear-Panel Features
1.
AM OUTPUT produces an ac signal, whose amplitude
dc component related
10 kR output impedance. [See
2.
FM OUTPUT produces an ac signal, whose amplitude
a dc component related
and
3.
RECORDER OUTPUT allows user-access
Output.]
4.
IF
OUTPUT produces a 150 kHz
-27
TIME BASE 10 MHz OUTPUT and INPUT. The input connector provides an input for an
5.
external 10 MHz time base reference. The external input signal must be greater than 0.5V
peak-to-peak (into a
internal, high-stability
impedance). (Refer
to
the
IF
level. The output
AM Output.]
to
the
IF
frequency. The output
a
10 kR output impedance. [See
to
-3 dBm (500 output impedance). [See
500n
input impedance). The output connector provides an output for the
10
MHz reference. Output signal
to
paragraph 3-3.
FM Output.]
to
2.5 MHz modulated
Time
is
proportional to the AM depth, with a
is
dc coupled with a 16
is
proportional
is
dc coupled with a 16 kHz bandwidth
to
all internal measurement voltages.
IF
signal.
to
The output level ranges from
IF Output.]
is
TTL
compatible
Base
10
MHz Input and Time Base
Operation
kHz
bandwidth and a
the FM deviation, with
[See
Recorder
(500
nominal output
10
MHz Output.)
MODULATION OUTPUT/AUDIO INPUT
6.
Option 001 instruments. Refer
Figure 3-1.
SENSOR
7.
to SENSOR referenced from Figure 3-1.
INPUT
8.
instruments. Refer
F’use. 2.5A (250V normal blow) for 100 or 120 Vac.
9.
Serial Number Plate. The
10.
instrument configuration. The last five digits form the suffix
Line Power Module permits operation from 100, 120, 220, or 240 Vac. The number visible in
11.
the window indicates the nominal line voltage
Figure 2-1,
FREQ OFFSET TTL OUT outputs a voltage that can be used
12.
and out of the path between a microwave input signal and the Modulation Analyzer when the
instrument
is
not selected
0
Hz. If the entered external LO frequency is less than or equal
+5V.
is
a rear-panel input for the power sensor supplied on Option
is
a rear-panel input for the RF input
to
INPUT referenced from Figure 3-1.
Line Voltage and he Selection)
is
in Frequency Offset Mode. The TTL output
or
while Frequency Offset Mode
If
the entered external LO frequency is greater than
to
MODULATION OUTPUT/AUDIO INPUT referenced from
first
four numbers and letter comprise the prefix
is
a
rear-panel output and input supplied on
001
instruments. Refer
signal.
to
which the instrument must be connected. (See
The center conductor
is
selected with an entered external LO value of
This input
1.5A
(250V normal blow) for 220
that
is
always
18
GHz, the TTL output
is
supplied on Option 001
is
unique
is
safety earth ground.
to
switch
OV
if
to
18 GHz, the TTL output is
or
that
denotes the
to
each instrument.
an
external mixer in
Frequency Offset Mode
is
Bequency offset Control.]
HP-IB Connector connects the Modulation Analyzer
13.
remote operations. When the HP-IB is being used, the annunciators next
as appropriate (REMOTE, LISTEN, TALK, SRQ).
to
the Hewlett-Packard Interface Bus for
to
the LOCAL key light
240 Vac.
3V. [See
REMOTE CONTROL RF SWITCHES enable the user
14.
can switch between the RF INPUT connector and the SENSOR connector. [See
to
build an internal sensor module that
Remote Control
RF Switch.]
LO OUTPUT and INPUT (Option 003 and Option Series 030 only). Option 003 provides an
15.
output connector and an LO input connector. The LO output connector
the Local Oscillator
(50R) nominal output impedance. The LO input connector provides an input for an external
Local Oscillator. External input signal required
signal.
The output signal is 1.27
is
1.27 to 1301.5 MHz at approximately 0 dBm
to
1301.5 MHz at approximately 0 dBm
is
provided to output
LO
3-9
Page 61

Operation Model 8901B
(50R)
nominal input impedance (LO Input and LO Output).
to
the internal LO signal
be routed
to
the LO input connector when no external
Two
jumpers are provided
LO
is
in
to
allow
use.
The Option Series
connector and
connected but the
output connector. [See
Do
not apply reverse power into the
instrument may result.
RFpower into the
16. CALIBRATION OUTPUT RF PWR and AMFM produces a rear-panel output for
and AM and FM calibrators. This output
standard front-panel connection. Refer
CALIBRATION AMFM OUTPUT referenced from Figure 3-1.
030
instruments are provided with an
a
remotely controllable switch which selects between them.
signal
is
not in use, the switch routes the external LO signal back out the LO
LO
input connector, an
High Selectivity Measurements.]
u)
LO
Do
not apply greater than
INPUT
or damage to the instrument
is
supplied on Option
to
both CALIBRATION RF POWER OUTPUT and
OUTPUT
or damage to the
40
Vdc
or
may
001
If
an
external
+5
dBm
of
result.
instruments instead of the
LO
RF
output
LO
is
Power
3-10
Page 62

HP
8901B
Modulation Analyzer
Basic Operation and Application Guide
HEWLETT
PACKARD
Page 63
HP
89078
Modulation Analyzer
Basic Operation and Application Guide
OHEWLETT-PACKARD COMPANY 1986
EAST 24001 MISSION AVENUE, TAF C-34, SPOKANE, WASHINGTON, USA. 99220
Basic Operation
and
Application Guide Part
First
Ednion
Printed: Juiy
Number
1986
08901-90117
HEWLETT
PACKARD
Page 64

Table
1.
Learning to Operate the
Chapter
each
2.
More about
of
Contents
HP
1
provides an easy step-by-step guide to learning
of
the
HP
8901Bs
RF
basic measurement capabilities.
Frequency and
Frequency Error Measurements
Chapter
enable you to adapt the
measurements to the special conditions
3.
More about Modulation and
2
describes the
HP
8901Bs
RF
Frequency and Frequency Error
special capabilites that
Audio Measurements
Chapter
that enable
measurements to the special conditions
3
describes the
you
to adapt the Modulation and
HP
8901B’s
special capabilites
890
1B
of
your application.
Audio
of
you application.
4.
More about
Chapter
enable you to adapt the
conditions
5.
Measurement Examples
Chapter
demonstrate how the versatility
you to use it
Appendix
Appendix
4
describes the
5
contains specific measurement examples that
A
B - Calibration Factors
Appendix C
RF
Power Measurements
HP
RF
of
your application.
in
a wide range
-
Installation
-
Other Publications
8901Bs
Power measurements to the special
of
special capabilites that
of
the
HP
8901B
measurement applications.
enables
Page 65

Learnina
to
ODerate
I
The
The
HP 8907B
Easy
Solution
way
the
HP
This
Basic Operation and Application Guide
a quick and easy way to learn to operate the
Analyzer.
to
use the
Modulation, Audio, and
(2
through
enable you to extend the operation of the
recommend that you first familiarize yourself with
referring to the reference chapters. Once you are comfortable with the basic
operation of the instrument, it
implement the many additional features that the
The hands-on approach in
versatility of the
actually puts the capabilities of several instruments at your fingertips.
Many of the measurement capabilities
included in the HP 8901B.
8907B'
is
designed to provide
HP
8901B Modulation
Chapter
HP
4)
2
will
provide you with all the information you need
8901Bs basic measurement capabilities:
RF
Power. The subsequent reference chapters
are devoted to the special functions and features that
HF'
8901B. We strongly
will
be easier for you to understand and
this
chapter demonstrates the extreme
HP
8901B. Placing the HP 8901B on your bench
of
the following products are
RF
Frequency,
Chapter
HP
8901B has to offer.
2
before
0
RF
Frequency Counter,
0
Modulation Analyzer,
0
Audio Analyzer,
0
RF
Power Meter,
The
HP
8901B combines many of the capabilities required for calibration,
troubleshooting, and design
HP 8901B's many special function capabilities enable you to adapt
its measurements to the demands of a wide range of test conditions.
to 1 Hz resolution
AM,
FM,
and
frequency, distortion, and level
as accurate as the best
into
a single instrument.
...............
................
@M
................
........
In
addition, the
(1-5)
(1-9)
(1-15)
(1-18)
Page 66

7-2
The
The
HP
HP
8907B
7
1722A
Diagram
To get ready to learn to use the HP 8901B, connect the HP 8901B, an
HP 11722A Sensor Module, and a signal generator together as shown
in Diagram
If you are unpacking a new HP 8901B you will want to refer to the
installation suggestiqns provided in
The procedures in this guide are written for use
Sensor Module. There are many power sensors that can be used
with the HP 8901B as well.
(rather than a Sensor Module), refer to your HP 89018 Operation
and Calibration Manual for information on which power sensors
can be used and how to operate them
The
Once the HP 8901B
if
the calibration data for the Sensor Module you are using has been
stored in the
whether the correct calibration data has been entered into the HP 8901B.
(Refer to
the Sensor Module you are using has been entered into the HP 8901B.)
1-1.
Setup for
1-1.
Calibration Data
HP
8901B.
Appendix
B
Learning
Basic
Operation
Appendix A.
with
an HP 11722A
If
you
are using a power sensor
with
the
HP
8901B.
is
up
and running, you
Appendix
if
you are not certain that the calibration data for
B
contains a procedure for determining
will
need
to
first
detennine
Page 67

1-3
The
Signal Generator
And
You
Note
The procedures in this guide are best performed using a signal generator
that generates a single, stable
steps from at least 100
AM,
also have
If
you are now sitting comfortably in front of your
ready to begin. Start on the next page and follow the step-by-step guide to
learning to operate the
can increase both the ease and speed
FM
MHz
and (if available)
If you plan to selectively refer to portions
RF
signal that is tunable in 1 MHz
to
200
MHz.
The signal generator should
cPM
capability at a
HP
8901B. You will soon discover how the
of
many of your measurements.
of
1
HP
8901B, you are
Chapter
kHz
I,
rate.
rather
HP
8901B
than perform all of the procedures in sequence, we recommend
that you complete the procedures in the Frequency Counter
portion
of
this chapter firsf. The Frequency Counfer portion
contains an introduction to the tuning and reset capabilities
that are important to all of the
HP
8901Bs
measurements.
Page 68
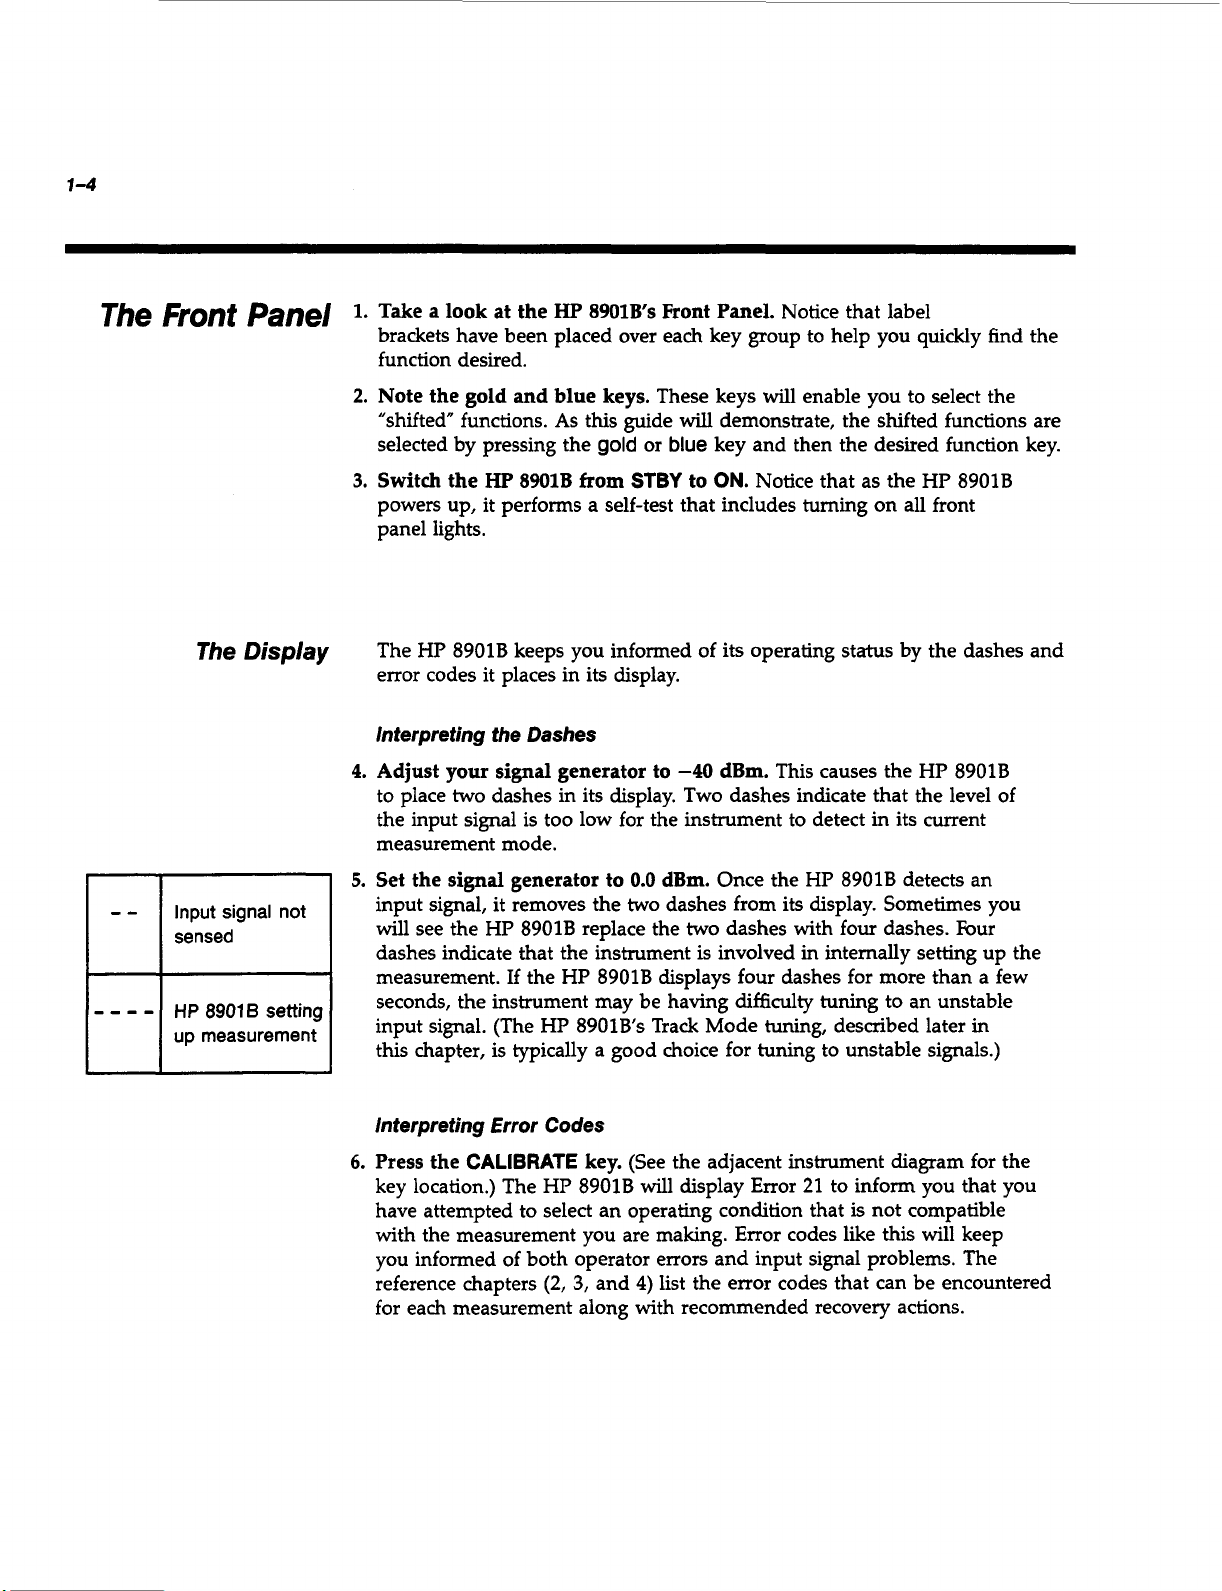
1-4
The
Front
--
----
Input signal not
sensed
HP
up measurement
The
89016
Panel
Display
-
setting
Take a look at the
1.
brackets have been placed over each key group to help you quickly find the
function desired.
2.
Note the gold and blue keys.
"shifted" functions.
selected by pressing the
3.
Switch the
powers up, it performs a self-test that includes turning on all front
panel lights.
The HP 8901B keeps you informed of its operating status by the dashes and
error codes it places in its display.
Interpreting the Dashes
4.
Adjust your signal generator to
to place
the input signal is too low for the instrument to detect
measurement mode.
5.
Set the signal generator to
input signal, it removes the
will see the HP 8901B replace the
dashes indicate that the instrument is involved in internally setting up the
measurement.
seconds, the instrument may be having difficulty
input signal. (The HP 8901Bs Track Mode tuning, described later in
this chapter, is typically a good choice for tuning to unstable signals.)
HP
two
dashes in its display. Two dashes indicate that the level of
8901B
If
the
HI'
8901Bs
As
this guide
gold
from
HP
8901B displays four dashes for more than a few
Front Panel.
These keys will enable you to select the
will
or
blue
key and then the desired function key.
STBY
to
ON.
-40
dBm.
0.0
dBm.
Once the HP 8901B detects an
two
dashes from its display. Sometimes you
two
Notice that label
demonstrate, the shifted functions are
Notice that as the HP 8901B
This causes the HP 8901B
in
its current
dashes with four dashes. Four
tuning
to an unstable
Interpreting Error Codes
6.
Press the
key location.) The
have attempted to select an operating condition that
with the measurement you are making. Error codes like this will keep
you informed of both operator errors and input signal problems. The
reference chapters (2,
for each measurement along with recommended recovery actions.
CALIBRATE
HP
key.
(See the adjacent instrument diagram for the
89018
3,
and
will
display Error 21 to inform you that you
is
not compatible
4)
list the error codes that can be encountered
Page 69

Frequency
Counter
1-5
Frequency
Measuring
RF
When your signal source testing requires an accurate
RF
frequency counter,
the HP 8901B is a convenient solution. The HP 8901B makes it easy
to tune to and measure the frequency of complex modulated signals.
If
you haven’t set-up your HP 8901B, Sensor Module, and
in
signal generator as shown
need to do
so
in order to perform the following procedures.
Diagram
1-1
(page
1-2)
you
will
Adjust Your Signal Generator
RF
Frequency
Frequency Increment
Amplitude
Modulation
1.
Press the FREQ key
on the
an
HP
RF
counter. Notice that the HP 8901B automatically tunes to and
displays the frequency of
....................
............
.......................
......................
and
the green
8901B.
That‘s all it takes to configure the HP 8901B as
the
100
MHz
.1
MHz
0.0 dBm
Off
AUTOMATIC OPERATION
input signal (approximately
100
MHz; the
absolute value depends on the accuracy of your signal generator and
the accuracy of the HP 8901Bs time base reference.) Note also that
AUTO TUNING (the green LED on the front panel) is on. This LED
you
know
lets
that the instrument is
in
its automatic tuning mode.
key
1
Hz
Resolution
Measurement Ranges
2.
To
increase the
7.4
SPCL * by pressing the digit keys 7
adjacent instrument diagram for key locations).
digit, simply press the
HP
8901B’s
CLEAR
display resolution to
0
4
and
1
the
Hz,
SPCL
key in
If you enter a wrong
key and begin again. Note that the
key (see the
key remains lit to show that a special function has been manually set.
*
If
the
HP
8901B
to
provide 1 Hz
display resolution.
counter resolution. Enter
displays Error
23
when you enter
7.1
7.4
SPCL
instead to select
SPCL,
it
is
not equipped
10
That’s all it takes to make an accurate frequency count on a stable signal
throughout the
Input
Frequency
150
kHz
650
MHz
to
to
following
650
MHz
1300
MHz
ranges:
Amplitude
Range
-I-30
to
+30
to
-25
-20
dBm
dBm
SPCL
Hz
Page 70

1-6
Frequency Counter
Choosing
Tuning
Mode
a
Manual Tuning Mode
Proper tuning is the key to making successful RF Frequency as well as other
tuned measurements with the HP 8901B. The optimum tuning mode for
your measurement will depend on the characteristics of the input signal.
3.
Adjust your signal generator to
automatically tune to the new input signal. (Note that four dashes are
placed in the display while the HP 8901B is tuning to the input signal.)
Key
110
4.
the
keying in an RF frequency and pressing the
the instrument’s Manual Tuning mode. The HP 8901B’s tuning is now set
at 110 MHz.
The Manual Tuning mode can also be selected by pressing the
itself. When you press the
the HP 8901B’s tuning is set at the frequency currently being displayed.
Adjust your signal generator to
5.
an Error 01 to let you know that the input signal is no longer within the
tuning range of the frequency
set to.
MHz into the
MHz
key.
Note that AUTO TUNING (the green LED) is now
HP
MHz
110
MHz.
The HP 8901B should
8901B
by pressing the digit keys
MHz
key, you have selected
key without keying in a frequency value,
112
MHz.
The HP 8901B
(1
10 MHz) that the instrument was manually
will
1 1
MHz
display
0
and
off.
key by
By
Auto
Tuning Mode
Press the
6.
key.
(Notice that the AUTO TUNING, green LED is on again.) The HP 89018
is now tuned to the frequency of the input signal. (The Auto Tuning
mode is the right choice when measuring a single, stable input signal.)
Track Mode
Press the
7.
input signal.
Increment your signal generator from
8.
steps.
frequency. (Track Mode is the right choice when you are measuring a drifting
or noisy signal.)
Measurement
Selected
RF
Freauencv.
Modulation or Single, drifty or noisy
Audio
Frequency Error All Cases Manual Tuning
or
RF
I.
Power
Input Condition
Single, stable signal
MultiDle. stable sianals
.,
sianal
>
Multiple, drifty or noisy
I
sianals
Blue
Shift
key and the
You
have placed the instrument back in its Auto Tuning mode.
TRACK MODE
The HP 8901B is now able to track the input signal as it changes
Tuning Mode
I
Auto Tuning
I
-
10
MHz Track Mode
>
10
MHz
Manual Tunina
Auto Tuning
Manual Tuning
I
Track Mode
key.
to
Select
AUTO TUNING (TRACK MODE)
In Track Mode, the HP 8901B is locked to the
112
MHz
to
100
MHz
in 1 MHz
HP
8901B
Tuning set at manually tuned frequency
-
Tuning locked to input signal
Operation
Page 71
Frequency
Counter
1-7
Measuring
Frequency Error
Remember
The HP
two-step process. Adjust your signal generator to
1.
Key
of
2.
Press the gold S key, and then the
(both keys should remain lit).
the frequency difference (in kHz) between the manually tuned
frequency
generator. (Note that the instrument displays a negative difference
when the input frequency
and a positive difference when the input frequency
8901B
100
MHz into the
your
signal generator
(100
makes checking
HP
MHz) and the actual output frequency of your signal
RF
frequency error a simple
8901B
(100
is
to manually tune it to the frequency
MHz).
FREQ
The HP
less than the HP
ERROR
8901B
8901B’s
100
MHz.
(FREQ)
is now displaying
is
key
manual setting
greater.)
Manual tuning is always the right choice when measuring Frequency
Error
because it establishes a known frequency reference. Also, the
Frequency
Error
measurement should only be made on a stable
input signal.
That’s all it takes to make Frequency Error measurements with
the HP
8901B.
10
Hz
Automatic
Resolufion
Reset
Operation
3.
To
display
the digit keys
remains lit to indicate that a special function has been invoked.
The HP
functions to their automatic operating condition. The following procedures
demonstrate the two reset functions.
4.
Press the green
the instrument back in its Auto Tuning mode (green
you have disabled Special Function
Pressing the
1
through
the instrument to its Auto Tuning mode (not the best choice for
Frequency Error measurements, remember). Note that the instrument
is
still
10
Hz
counter resolution, enter
7
0
1
and the
89018
provides you with two ways to return its operating
AUTOMATIC OPERATION
AUTOMATIC OPERATION
10
to their Automatic Operation condition and returns
in the Frequency Error measurement mode (gold S key lit).
SPCL
key.
7.1
7.1
SPCL
by pressing
Note that the
key.
(SPCL
key no longer lit).
key resets Special Functions
You
have placed
LED
SPCL
on) and
key
Page 72

1-8
Frequency Counter
instrument
70
Learn More...
Preset
5.
Now
press the Blue Shift key and then the green
(AUTOMATIC OPERATION)
key.
Note that the instrument is reset to
the Frequency measurement mode (gold
S
key
INSTR PRESET
off).
INSTR
resets the entire instrument to its power-up default condition.
Key
AUTOMATIC
OPERATION
1.
Selects Auto Tuning
Mode.
Function
1
I
Provides operator error
recovery
operating functions that
2.
Resets special functions
1
through
10
to their
can cause an error
condition.
Automatic Operation
condition.
INSTR PRESET
Resets
functions.
Chapter
RF
2
in this guide provides reference information about the
Frequency and Frequency Error measurements and the
tuning capabilities. Refer to
all
operating
Chapter
Sets all operating
functions to their defined
2
when you want to find out
more about:
PRESET
Contribution
by
resetting the
HP
8901B's
0
Tuning
Modes
-
Further information about the
HP
tuning modes.
0
Extending Operation
enable you to adapt the
-
The special operating capabilities that
RF
Frequency and Frequency Error
measurements to the specific conditions of your input signal.
0
Help
-
Solutions to setup or operating problems encountered
RF
when making
Refer to
Chapter
Frequency
5
for examples of RF Frequency measurement applications.
or
Frequency Error measurements.
8901B's
Page 73

Modulation Analyzer
1-9
Mo&/&jon
Ana'Yzer
Measuring
AM
The HP 8901B offers complete modulation analyzer capability to
AM,
FM
and
(PM
meet your
measurements such as signal-to-noise and incidental
can be made with ease and superb accuracy using the HP 8901B.
Set up your HP 89018, Sensor Module, and signal generator as shown
in Diagram
1-1.
measurement needs. Even difficult
AM
and
FM
Adjust Your Signal Generator
RF
Frequency
Amplitude
Modulation
Depth
Rate
1.
Press the
PEAK+
approximately
mode (green AUTO TUNING
found and tuned to the modulated
a good choice for making most modulation and audio measurements.)
2.
Key
key.
input signal (green LED
measuring modulation in the presence
...........................
.............................
in
100
The instrument is now manually tuned to the frequency of the
....................
.......................
.................
AM
key, the green
detector key.
50%.
Notice that the instrument
MHz
by pressing the digit keys
100 MHz
0.0
dBm
.....AM
.50%
1
kHz
AUTOMATIC OPERATION
The instrument should display an
is
in
the Auto Tuning
LED
on). The HP 8901B automatically
RF
signal. (The Auto Tuning mode is
1
0
0
and the
off).
(Manual Tuning is a good choice when
of
multiple
RF
input signals.)
key, and the
AM
index
MHz
of
Selecting a Detector
The HP 8901B provides six detector functions for measuring your
modulation and audio signals.
Peak
Detector
3.
Press the
allows you to check modulation symmetry.
4.
Press both the
both detector keys at the same time allows you to display the average
value of the positive and negative peak readings. (PEAK
5.
Press the
detector captures and holds the peak modulation level detected by the
Peak+
6. Increase the modulation depth
and then reduce it
continues
Hold detector is ideal for detecting short modulation transients.
PEAK-
PEAK+
or
Peak- detector.
to
key.
Switching between the Peak+ and Peak- detector
PEAK+
display the maximum modulation level. The Peak
and
PEAK-
key and then the
of
back
to
50%.
Notice that the HP 8901B
keys at the same time.
PEAK
HOLD
the signal generator to
f/2).
key.
The Peak Hold
Pressing
75%
Page 74

1-1
0
Modulation Analyzer
Average Detector
7.
Now
press the
You
have selected an average responding detector that is calibrated to
read the
approximately
RMS
8.
Press the
below the
detector. The Average detector and the RMS detector are good choices
when measuring noise or residual modulation where the
generally more desirable than the peak value. The true-RMS detector
can be used to measure modulation rates up to
one more
detector is also
rms
Detector
AVG
key to select the average-responding detector.
value of a sinewave. The HP 8901B should be displaying
35%
AM
with the signal generator set at
Blue
Shift
key and then the
RMS
key will come on).
digit
of resolution than the Average Detector. The true-RMS
a
good choice for measuring non-sinusoidal signals.
RMS (AVG)
You
have now selected a true-RMS
40
50%
AM.
key (the red
nns
value is
kHz and provides
LED
AM
Measurement
Ranges
Measuring
FM
Simply select AM and any of the above detector functions to make AM
measurements within the following ranges:
1
RF
Carrier Frequency
150
kHz
to
9.999$99
10
MHz
to
1300
1.
Turn
off
AM
on the signal generator
deviation at a
2.
Press the
PEAK+
25
yellow FM MODULATION OUTPUT LED is lit. This indicates that the
demodulated FM signal is available at the front-panel MODULATION
OUTPUT/AUDIO INPUT port. (Connecting another audio analyzer
to this
demodulated signal while monitoring modulation with the HP 89018.)
detector key.
kHz. Notice that in the upper right comer of the instrument the
port
1
FM
key, the green
will enable
MHz
MHz
kHz
rate.
The HP 89018 should display a reading of about
I
Modulation Rate
20
Hz
to
10
kHz
20
Hz
to
100 kHz
and
turn on
AUTOMATIC OPERATION
you
to make audio measurements on the
25
kHz
key,
I
of
Max-
FM
and
Depth
99%
the
Page 75

Modulation
Analyzer
7-7
7
Measuring
Pre-emphasized FM
Inserting Audio Filters
To accomodate your pre-emphasized
with four separate de-emphasis filters. (Each
labeled with a time constant corresponding to the
FM
signals, the
HI'
FM
DE-EMPHASIS
3
dB
89018
is equipped
key
comer frequency of
that de-emphasis filter.)
3.
Press the
press
after it has been de-emphasized. (The de-emphasized
it
75ps
FM
DE-EMPHASIS
too).
The display now shows the level of the demodulated signal
key (if the
PRE-DISPLAY
FM
signal is now
key is not lit,
available at the front-panel MODULATION OUTPUT/AUDIO INPUT port.)
4.
Press the
PRE-DISPLAY
key again to turn Pre-Display
off.
Notice that the display now shows the level of the demodulated
FM
signal before it
is
de-emphasized. The demodulated signal is
now being applied to the de-emphasis filter after it is measured
by the
HP
8901B.
(The de-emphasized signal
is
still
present at
the MODULATION OUTPUT/AUDIO INPUT port, however.)
5.
Press the
function.
To
remove undesired signals such as harmonics, noise, and spurs
75ps
key again
to
turn
off
the
FM
De-emphasis
Repeat step 3 to select any of the four de-emphasis filters.
from the demodulated signal, insert the selectable high-pass and lowpass audio filters when making modulation or audio measurements.
To minimize overshoot from square-wave modulation, such as
(FSK),
frequency shift keying
select the
>20
kHz Bessel Filter.
is
6. Press the
bandwidth of
300
HZ key and the
300
Hz
response of each audio filter.
7.
Press the 300
Hz
key and the
these filters.
to
3
kHz.
3
kHz key to set
Diagram
3
kHz
key
1-2
agah
a
typical measurement
shows the typical frequency
to remove
Page 76

7-72
100
Modulation
Typical
50
Analyzer
Hs
High-Paar Filter
Reaponae
Typicel
300
Hr
High-Paas
Filter
Reaponae
80
-
E
I
5M
Y
1w
80
e
I
p
4a
0
0
50
100
MODULATION RATE
Typical
3
kHz
Low-Para Filter
1
2
MODULATION
FM
Measurement
150
(Hi)
Reaponre
3
RATE
BH2)
Diagram
Ranges
a,
E
::
$a,
Y
200
250
4 5
1-2.
0
Typical
The typical frequency response
That's all it takes to make
out the following ranges:
2004mBwm1(Wo
MODULATION RATE
15
kHr
Low-Peas Filter
(H2)
Reaponae
of
each Audio Filter
FM
measurements and select
Typical
>20
kHr
Low-Paas Filter
MODULATION RATE
audio
Reaponae
IkHZ)
filters through-
RF
Carrier Frequency
150
kHz
to
9.99999
10
MHz
to
1300
MHz
MHz
Modulation Rates
20
Hz
to
10
kHz
20
Hz
to
200
kHz
Max.
40
kHz peak
400
Deviation
kHz peak
Page 77
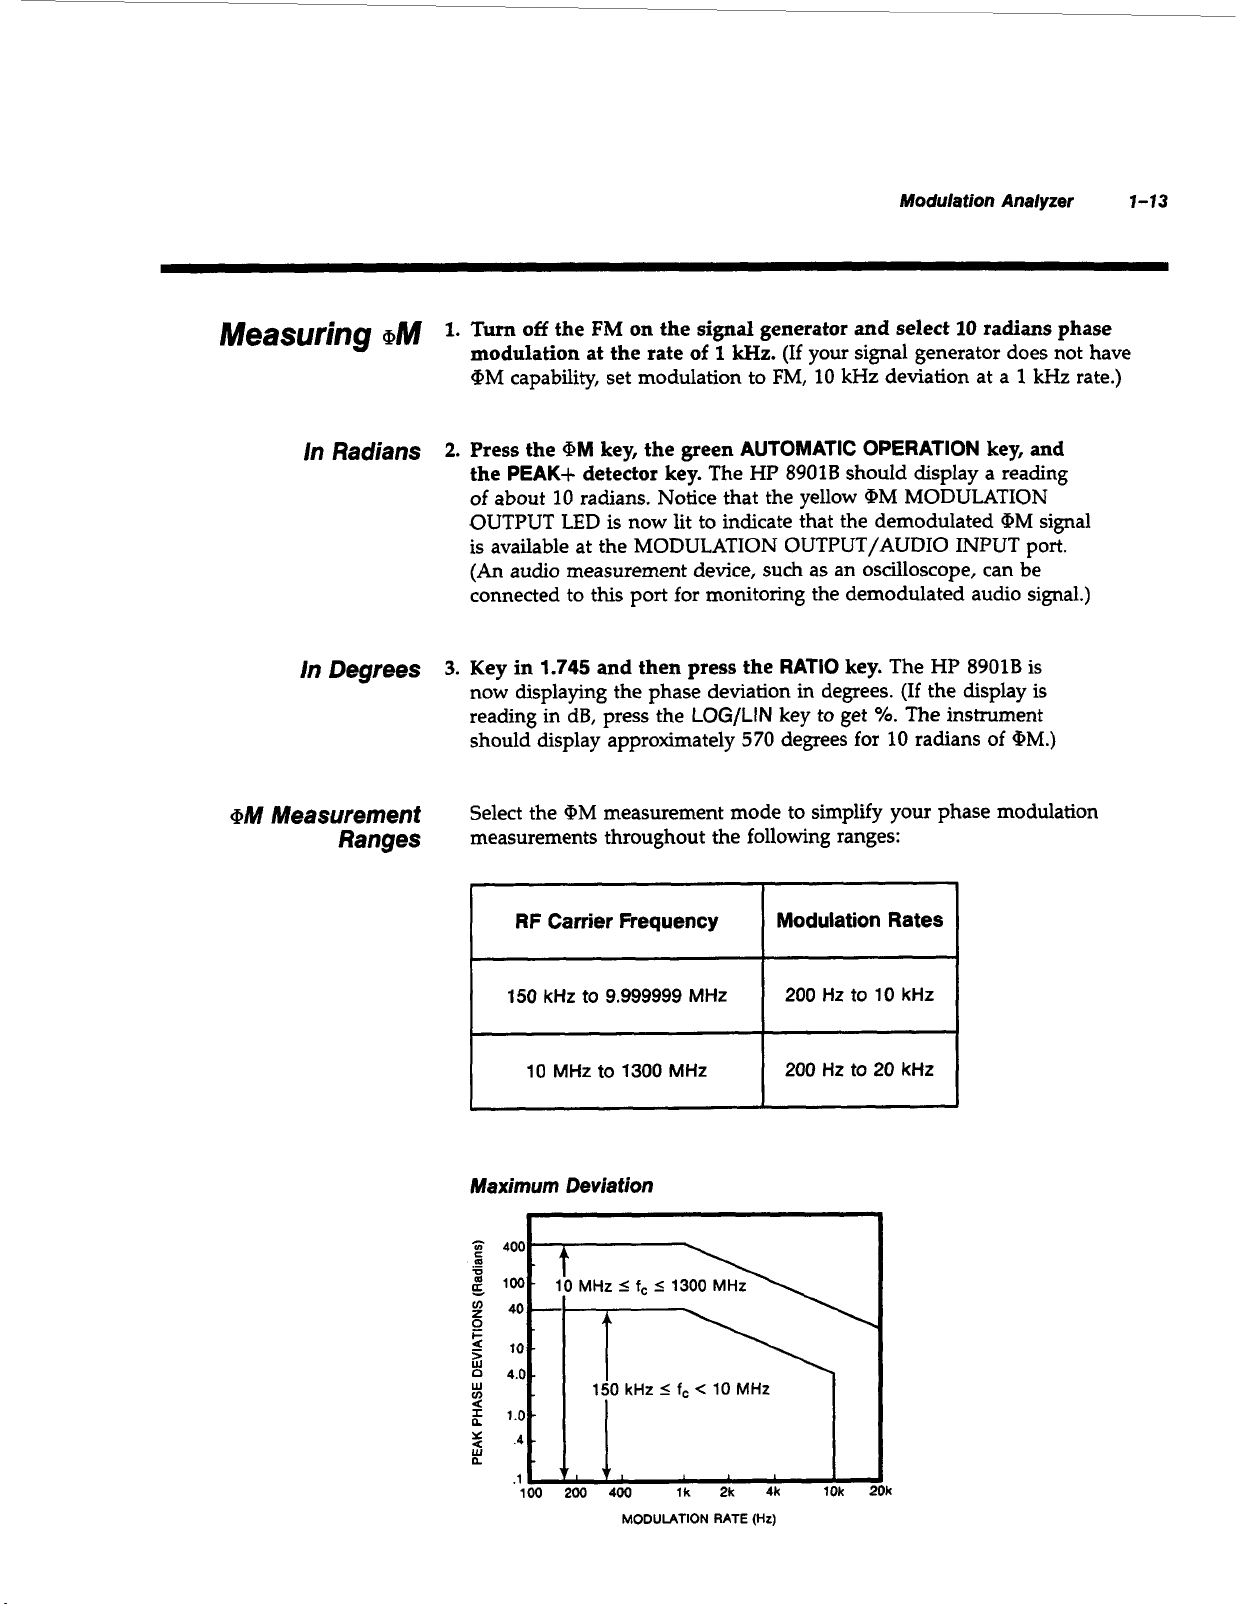
Modulation
Analyzer
1-13
Measuring
/n
Radians
In Degrees
(PM
Measurement
Ranges
oM
1.
Turn
off
the
FM
on the
modulation
(PM
capability, set modulation to FM, 10
2.
Press the
the
PEAK+
of
about
OUTPUT LED is now lit to indicate that the demodulated
is available at the MODULATION OUTPUT/AUDIO INPUT port.
(An
audio measurement device,
connected to this port for monitoring the demodulated audio signal.)
3.
Key
in
now displaying the phase deviation in degrees. (If the display is
reading in dB, press the
should display approximately
Select the
measurements throughout the following ranges:
at the rate
(PM
key, the green
detector key.
10
radians. Notice that the yellow OM MODULATION
1.745
and then press the
@M
measurement mode to simplify your phase modulation
signal
of
LOG/LIN
generator
1
kHz.
(If your signal generator does not have
AUTOMATIC OPERATION
The
HP
8901B
such
RATIO
key to get
570
degrees for
and
kHz
should
as an oscilloscope, can be
key.
select
10
deviation at a
display a reading
The
HP
8901B is
YO.
The instrument
10
radians of
radians
1
key, and
(PM
(PM.)
phase
kHz
signal
rate.)
RF Carrier Frequency
150
kHz to
10
Maximum
I
400t
100
4
.1
.4u-l
100
9.999999
MHz
to
1300
Deviation
10
MHz
5
I
I
200
400
fc
5
MHz
MHz
1300
lk
MHz
2k
Modulation Rates
200
Hz to
10
kHz
200
Hz
to 20
kHz
4k 1Ok
:
MODULATION
RATE
(Hr)
Page 78
1-14
Modulation
Analyzer
To
Learn More...
Chapter
modulation measurements. Refer to
3
in this guide provides additional information about the
Chapter
3
when you want to find
out more about:
0
Calibration
FM
measurements.
0
Extending Operation
-
The procedure
-
to
calibrate your
AM
and
The special operating capabilities that enable
you to adapt the Modulation measurements to the specific conditions
your input signal.
0
Help
-
Solutions to setup and operating problems encountered when
making modulation measurements.
Refer
to
Chapter
5
for examples
of
modulation measuremerit applications.
of
Page 79
Audio
Analyzer
1-15
Audio
Measuring
Audio
Demo&/ated
Frequency
Analyzer
Audio
The HP 8901B enables you to measure your audio signal sources as well
RF
as your
distortion, and level measurements.
Set up your HP 8901B, Sensor Module, and signal generator as shown
in Diagram
Adjust Your Signal Generator
RF
Frequency
Amplitude
Modulation
Depth
Rate
The HP 8901B enables you to accurately count the frequency of the
internally-demodulated audio signal or of an external audio signal
connected to the MODULATION OUTPUT/AUDIO INPUT port.
1.
Press the
Entering the AM measurement mode first, selects the
measuring the AM input signal. The HP 8901B uses the last demodulator
selected before entering an audio measurement mode to make its audio
measurements. (Notice that the yellow AM MODULATION OUTPUT LED
is lit. When you are making audio measurements, the MODULATION
OUTPUT LEDs will
signal sources. Use the
1-1.
....................
.......................
......................
...........................
.............................
AM
key and then the green
show
you which demodulator
HP
8901B to make audio frequency,
100
MHz
0.0
dBm
AM
.50%
1
kHz
AUTOMATIC OPERATION
AM
demodulator for
is
selected.)
key.
External
Audio
2.
Press
the
gold
S
key
and then
keys should remain lit).
the frequency of the demodulated audio signal (approximately
1
kHz). The demodulated audio signal is also available at the
front-panel MODULATION OUTPUT/AUDIO INPUT port.
Press the
OUTPUT port to
to make its audio measurements on an external audio signal source
connected to the AUDIO INPUT port. Press the
key again to convert the port back to a modulation output and
continue measuring the internally demodulated audio signal.
AUDIO INPUT
an
AUDIO INPUT port.
key (key lit) to convert the MODULATION
AUDIO
The HP 8901B
FREQ
(AM)
is
now displaying
The HP 8901B is
AUDIO
key (both
INPUT
now
able
Page 80
1-1
6
Audio
Analyzer
Audio
Frequency
Measurement Ranges
Measuring
Audio Distortion
That’s all it takes to measure intemally-demodulated or external audio
frequencies throughout the
-~
Use the HP
Audio Max. External
Frequency Input Voltage
20
Hz
to
250
kHz
(usable
to
600
8901B
kHz)
to measure distortion on either a
following
ranges:
3
Vrms
400
Hz or a
signal. Distortion measurements can be made on either the internally
demodulated signal or on an external audio signal connected to the
AUDIO
1.
Press the gold S key and the
should remain lit).
distortion
the
INPUT port.
of
the 1 kHz demodulated signal. Notice that
1
kHz annunciator
AUDIO DISTN
(FM)
key (both keys
The instrument is now displaying the measured
in
the display,
is
lit. The true-RMS detector is used to make
this measurement.
2.
Press the
annunciator should be
to measure the distortion level
Blue
Shift
key and the
lit
in the display).
of
400
a
Hz
DISTN (PEAK-)
400
Hz
signal.
The instrument
key (the
is
now ready
1
kHz
400
Hz
Audio
Distortion
Measurement Ranges
Measuring
Audio
Level
That’s all it takes to measure audio distortion throughout the following
measurement ranges:
0.01%
100.Oo/o
Display
Range
(-80.0
(0.00
of
port.
an
audio source
dB)
to
dB)
external
(Audio level
Audio Max. External
Frequency Input Voltage
400
Hz
and
1
I
The HP
8901B
kHz
is able to measure the
3
Vrms
I
I
rms
voltage level
audio signals applied directly to the AUDIO INPUT
measurements cannot
1.
When you need to measure audio level, connect
be
made on internally demodulated signals.)
to the AUDIO INPUT port.
I
Page 81

2.
Key in
of
keys
3.
Press
30.0
SPCL.
the input signal. (Press the
pV
(4),
mV
(5),
any
measurement function key to exit the
measurement mode.
The instrument
Blue
or
Volts
(6)
to select the desired voltage units.)
Audio
will
display the rms voltage level
Shift
key and the voltage unit
Audio
Level
Analyzer
1-17
Learn
More...
Audio
Chapter
Audio measurement capabilities. Refer to
50
Hz
Frequency
to
40
kHz
3
in this guide provides additional information about the
Input Voltage
100
mV
to
3V
Chapter
3
when you want to know
more about:
0
Extending Operation
-
The special operating capabilities that enable
you to adapt the Audio measurements to the specific conditions of your
input signal.
0
Help -
Solutions to setup and operating problems encountered when
making Audio measurements.
Refer to
Chapter
5
for examples
of
Audio measurement applications.
HP
8901B
Page 82

1-18
RF
Power
Meter
RF
Power Meter
RF
Calibration
Power
The HP 8901B provides you with the capability and accuracy
best power meters. With a single keystroke, the HP 8901B autoranges
to the input signal, measures its power, compensates for power
in
sensor flatness, and displays the results
Adjust Your Signal Generator
RF Frequency
Amplitude
Modulation
Like all power meters, the HP 89018 must first be calibrated. An
internal
Module and the HP 8901B’s Power Meter to an internal
1
.OO
mW reference signal. The following calibration procedure must
be performed only one time to calibrate your Sensor Module.
means you do not need to perform this procedure again as long
as you are using the same Sensor Module. To ensure the highest
possible measurement accuracy, allow the HP 8901B to warm up for
at least thirty minutes before performing the calibration procedure.
1.
Press the
....................
.......................
......................
RF
Power Calibrator enables you to calibrate the Sensor
RF
POWER
key on your HP 8901B.
100
0.0
Off
the units of your choice.
MHz
dBm
50
of
MHz,
This
the
Error
Note
7
5
If
the HP 8901B is displaying Error
to make RF Power measurements. (Refer to
Calibration Factor Entry procedure before going on with this procedure.)
The calibration factors
stored in the
RF
Power measurements.
calibration factors are stored in the instrument, refer to Appendix
2.
Connect the HP 11722A Sensor Module to the
OUTPUT
reference signal. (Disregard Error
Press the
3.
sensor reading to be displayed briefly.
for any dc offset error inherent within the measurement system.
port
on the
ZERO
HP
key.
for
8901B
in order
If
HP
8901B.
Wait approximately 8 seconds for the zeroed
15,
it has not yet been configured
Appendix B and perform the
the Sensor Module
for
it to make calibrated, automatic
you
are not certain that the correct
This port outputs the
11
when it
The
HP 8901B
you
RF
POWER
is
displayed.)
are using must be
1.00
is
correcting
mW
B.
Page 83

Remember
RF
Power
Meter
As
a
good rule of thumb, press the
10
minutes when making
RF
ZERO
key approximately every
Power measurements to compensate for
any changes in the ambient operating conditions. The zeroing process
is most efective if the
ZERO
key is pressed with the
HP
11722A
Sensor Module connected to the signal source being measured.
4.
Press the
to be displayed. The HP 8901B
CALIBRATE
key. Wait for a stable, calibrated reference reading
is
creating a correction factor that
enables the instrument to equate its power measurement reading to the
1.00 mW reference.
5.
Press the
Blue
Shift
key
and
then the
SAVE CAL (CALIBRATE)
key.
This stores the calibrated reference in the instrument’s non-volatile memory.
6.
Press the
CALIBRATE
key again.
This
turns
off
the calibrator.
You
have
completed the calibration procedure.
7-79
Measuring
RF
Power
Changing frequency
7.
Connect
the
Sensor Module to the
signal
generator. The HP 8901B
now calibrated to make accurate power measurements with the Sensor
Module you are using. Erom now on, you need only repeat step
RF
maintain
1.
Press the
1000
-06W (1000 pW) with the signal generator set to 0.0 dBm.
2.
Press the
logarithmic
measurement readings to voltage units when you select the
and a voltage units key
Shift
key and then the
3.
Adjust the frequency
Manual
4.
Key the new output frequency
Hp
8901B
key. The HP 8901B must be set to the same frequency as
Power calibration.
RF
POWER
LOG/LIN
(dBm)
Tuning
key. The instrument should read approximately
key to toggle the display reading between
and linear (watts) units. The instrument also converts
such
as
WATTS
of
the
(9)
signal
by pressing the digit keys
Blue
pV
(4),
mV
(5),
or
V
(6).
Press the
key to exit the voltage units mode.
generator to
of
the
signal
1
1
9
119
MHz.
generator into the
and
then
the
MHz
the
input
signal to enable the instrument to select the correct calibration factor.
2
to
Shift
Blue
is
key
Page 84
7-20
RF
Power
Remember
Meter
Auto
Tuning
5.
You
can
also
allow the
input frequency by pressing the
and
the
AUTO
TUNING
displays the new input frequency, press the
the
RF
POWER
If
the frequency of the input signal changes, always change the
key to re-enter the
frequency setting
6.
To
verify that the frequency setting
as
the frequency
and
then the
DlSP FREQ
of
HP
(TRACK
of
the
the
signal
8901B
HP
to automatically tune to the new
FREQ
MODE)
RF
Power measurement mode.
8901B as
of
generator, press the
(kHz
$)
key.
You
key, the
key.
Blue Shift
After the
MHz
key and then
HP
well.
the
HP
8901B
is the same
Blue Shift
can use this method to
check frequency tuning when in any of the measurement modes.
key,
8901B
key
RF
power
Measurement Ranges
To
Learn More...
From now on, simply select
RF
Power to make accurate, calibrated
measurements throughout the following ranges using an HP
Sensor Module:
Input Frequency
100
kHz
to
2.6
GHz
(HP
11722A)
I
Chapter
4
in this guide provides information about the HP 8901B’s
additional capabilities when in the
find
you want to
0
Calibration
0
Extending Operation -
out more about:
-
The RF Power calibration technique.
you to adapt the
Input Amplitude
-20
dBm
(10
pW)
to
+30
dBm
(1
W)
I
RF
Power mode. Refer to
I
The special operating capabilities that enable
RF
Power measurement to the specific conditions of
your input signal.
0
Help
-
Solutions to setup or operating problems when making
Power measurements.
RF
11
722A
Chapter
Power
4
when
RF
Refer to
Chapter
5
for examples
of
RF
Power measurement applications.
Page 85
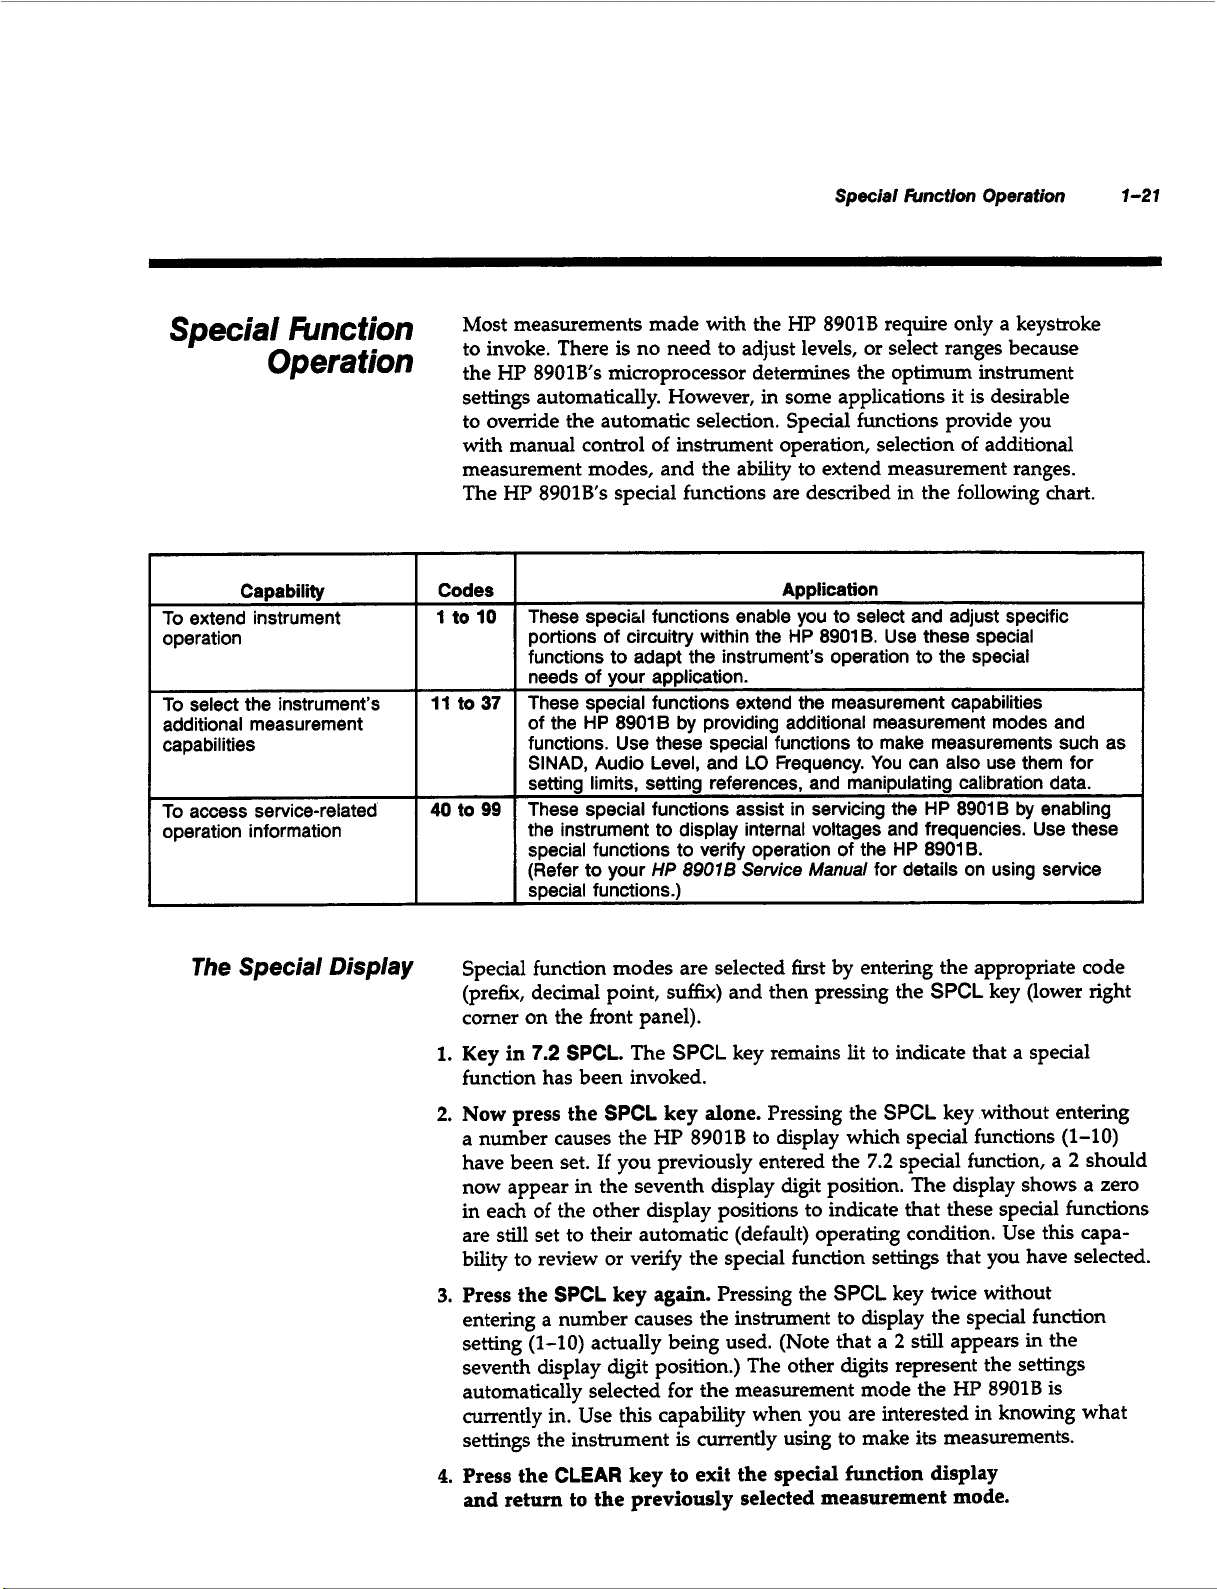
Special krncth Operation
1-21
Special
mnction
Opefation
Capability
To
extend instrument
operation
To select the instrument’s
additional measurement
capabilities
To access service-related
operation information
Most measurements made with the
HP
8901B
require only a keystroke
to invoke. There is no need to adjust levels, or select ranges because
the HP
8901Bs
microprocessor determines the optimum instrument
settings automatically. However, in some applications it is desirable
to
override the automatic selection. Special functions provide you
with manual control of instrument operation, selection of additional
measurement modes, and the ability to extend measurement ranges.
The HP
Codes Application
1
to
10
11
to
40
to
8901Bs
These specihl functions enable you to select and adjust specific
portions of circuitry within the HP
functions to adapt the instrument’s operation
needs of your application.
These special functions extend the measurement capabilities
37
of the HP
functions. Use these special functions to make measurements such as
SINAD, Audio Level, and LO Frequency. You can also use them for
setting limits, setting references, and manipulating calibration data.
These special functions assist in servicing the HP
99
the instrument to display internal voltages and frequencies. Use these
special functions to verify operation of the HP
(Refer to your
special functions.)
special functions are described in the
8901 B
UP
89018.
by providing additional measurement modes and
8907B
Service
Manual
Use these special
to
the special
8901B.
for details on using service
following
8901
B
chart.
by enabling
The Special Display
Special function modes are selected first by entering the appropriate code
(prefix, decimal point,
on
comer
1.
Key in
the front panel).
7.2
SPCL.
The
suffix)
SPCL
and then pressing the
SPCL
key (lower right
key remains lit to indicate that a special
function has been invoked.
2.
Now
press the
a number causes the HP
have been set.
SPCL
key alone.
8901B
If
you previously entered the
Pressing the
to display which special functions
SPCL
key without entering
(1-10)
7.2
special function, a 2 should
now appear in the seventh display digit position. The display shows a zero
of
in each
the other display positions to indicate that these special functions
are still set to their automatic (default) operating condition. Use this capa-
bility to review or verify the special function settings that you have selected.
3.
Press the
SPCL
key again.
Pressing the
SPCL
key twice without
entering a number causes the instrument to display the special function
setting
(1-10)
actually being used.
(Note
that a
2
still
appears in the
seventh display digit position.) The other digits represent the settings
8901B
automatically selected for the measurement mode the HP
is
currently in. Use this capability when you are interested in knowing what
settings the instrument
4.
Press the
CLEAR
is
currently using to make
its
measurements.
key to exit the special function display
and return to the previously selected measurement mode.
Page 86
1-22
hEtiOn
Special Function Operation
The
Special
hfOffPlafiOn
PUll-OUf
card
The Special Function Information pull-out card enables an experienced
user to quickly access special function operating information. A block
diagram on the card shows which portions of the
by special functions 1-10. A table of operating conditions for each
special function
functions
description of their function. (Refer to the measurement reference
chapters
special functions can help you expand your measurement capabilities.)
11-39
(2
through
circuitry
(1-10)
are listed above the block diagram along with a brief
is provided below the block diagram. Special
4)
and the applications chapter
(5)
are controlled
to find out how
&fofs,
and
Dashes
Other
Help
Congfat&tions
The HP 8901B Modulation Analyzer keeps
operating status by placing error and dash codes
Operating Information pull-out card enables you to quickly access a
brief description of each code. The. measurement reference chapters
(2
through
conditions for each of the measurement modes. Each code listing includes
a description and recommended recovery action. (Refer to reference
chapters
You
are now familiar with each of the basic measurement capabilities of
the HP 8901B. From now on, you can rely on the HP 8901B for making
your frequency, modulation, audio, power, and level measurements.
The rest
8901Bs
HP
your applications goes beyond the contents of this guide, refer to
the
HP
4)
in
this guide provide a listing of the errors and problem
(2
through
of
this guide will enable you to expand and extend the
measurement capabilities even further.
8901B Operation and Calibration Manual for further details.
4)
for help
in
solving your measurement problems.)
you
informed of
in
its display. The
If
the scope of
its
Page 87

More about
RF
Frequency and
/n
This
Chapter
The Directory
Frequency
This
chapter introduces the HP
that enable you to tailor its
measurements to your specific test conditions. (To use these special
capabilities effectively, you should first become familiar with the
basic operating capabilities and measurement ranges described in
Chapter 1 for the
This
chapter enables you to reference directly to the information you
are interested in. The information is organized into three subject areas.
0
Tuning
HP
0
Extending Operation
capabilities that enable you to adapt the
conditions of your input signal.
0
Help -
encountered in
Use the directory diagram below to quickly locate the subject you are
interested
when appropriate. Use the look-up table to reference to the topics included
for that subject.
Modes
8901B’s
Refer here for help in
in. A look-up table
Error
RF
Frequency and Frequency Error measurements.)
-
Refer here for further understanding of the
tuning modes.
RF
Frequency or Frequency Error measurements.
Measurements
8901B’s
RF
Frequency and Frequency Error
-
Refer here for the special operating
is
located on the first page of each subject area
special operating capabilities
HP
solving
8901B
setup or operating problems
to the specific
RF FREQUENCY
FREQUENCY
ERROR
TUNING
MODES
k=3
OPERATION
Page 88

2-2
Tuning
Modes
Tuning
Auto
Modes
Tuning
If
You
Need
0
How
the Auto Tuning Mode operates
0
How
the Manual Tuning Mode
operates
0
How
Track Mode operates..
Auto tuning allows the HP
input signal. It is automatically selected on Power-Up, or when the
AUTOMATIC OPERATION
mode is also selected by pressing the
TUN
I
NO
When the HP
input signal below
instrument then begins sweeping its local oscillator
down to
created
the IF passband. If no signal
instrument places
by
to
Know:
. .
. .
. . . . . . . . . . . . .
key.
8901B
2.5
MHz.
the mixing of the
enters the Auto Tuning mode, it
2.5
h4Hz.
The
two
dashes in its display while it continues to sweep.
Refer
Auto
. .
. . . . . . . . .
.
. . . . . . . .
8901B
or
INSTR PRESET
If no signal
LO
continues sweeping until a difference frequency,
LO
and the
is
detected after multiple sweeps, the
.
Manual Tuning (2-4)
Track
to automatically find and tune to the
Blue
Shift
is
detected below
RF
to:
Tuning (2-2)
Mode
(2-4)
key
is
pressed. Auto Tuning
key and then the
first
checks for an
2.5
MHz,
(LO)
from
1300
input signal, appears within
AUTO
the
MHz
When a signal does appear within the IF passband, the instrument performs
is
a series of tests to determine whether the signal it has found
This
appropriate signal to tune to.
Tune to the fundamental in harmonically-rich specbums or to a carrier
AM.
with high-depth
the correct frequency, the
oscillator to ensure high-stability, low-noise measurements. If the input
signal changes after the
Tuning mode, the
Tuning mode
Keep in mind that certain input
for the HP
choice when these conditions exist. For a
refer to
is
8901B
Table
2-1. Input Conditions that
Once the instrument determines that it
HP
LO
has been locked to the
LO
automatically begins the sweep search again. Auto
a good choice when measuring a single, stable input signal.
to Auto Tune. The Manual Tuning mode is a good
testing enables the HP
89018’s
LO
signal
conditions can make it difficult
is locked to an internal crystal
listing
May
crystal
of these conditions,
Require
Manual
the
89018
to Auto
is
tuned to
oscillator in Auto
Tuning.
Page 89

Input Condition
Table
2-1.
Input Conditions That May
Description
HP
8901B’s
Require
Manual Tuning.
Response
Tuning
Recommendation
Modes
2-3
Multiple input signals
Level
of
2nd or 3rd
harmonic is greater
-10
than
Input signals above
measurement
range
dBc*
(1300
MHr).
For input signals whose
amplitudes are all between
+30
-25 dBm and
and are within approximately
15
dB of one another, the
8901
HP
to the signal at the highest
frequency rather than the
signal with the highest level.
The HP
these as fundamental signals
and tune to the signal at
the highest frequency.
Harmonics from the HP
8901B’s
signals above
produce beat frequencies
within the IF passband.
B may auto tune
8901 B
LO may mix with
dBm,
may interpret
1300
MHz to
Instrument will measure
and display characteristics
of input signal at the
highest frequency.
Instrument may measure
and display characteristics
of
input signal at the
highest frequency.
Instrument may measure
and display characteristics
1300
of signal above
MHz.
If
the desired signal is
not the highest-frequency
signal, manually tune to
the desired frequency or
place a bandpass filter at
8901
B’s
the HP
block the unwanted signals.
If
the desired signal is
not the highest-frequency
signal, manually tune to
the desired frequency.
Manually tune to the RF
signal below
place a low pass filter at the
8901
HP
unwanted high frequencies.
B’s input to block thc
input to
1300
MHz, or
Low-rate, high-
deviation FM
Low-level carrier
with low-rate, high-
depth (percentage)
amplitude modulation
dBc = decibels referenced to the carrier level.
While auto tuning, the
8901
B
rate
(c
may mistake
20
Hz) high-
(>
400
kHz)
8901B’s
HP
low
deviation
FM for signal drift.
The AM may cause the
carrier level to move in
and out of the HP
measurement range.
Instrument may continuously
display four dashes.
Instrument may continuously
display two dashes or
it
may alternately display
or
two dashes then four dashes.
0
MHz,
Manually tune to the carrier
frequency or remove the
FM until the instrument has
auto tuned to the signal.
Manually tune to the
carrier frequency to
increase measurement
sensitivity. (Refer to
increasing
this chapter to extend the
measurement range further.)
Sensitivity
in
Page 90

2-4
Tuning
Modes
Manual Tuning
Track
Mode
The Manual Tuning mode allows you to set the
at a desired frequency.
frequency and then pressing the
This
is done by keying in the desired
MHz
key. The manual tuning
mode can also be entered by pressing the
locks the instrument at the frequency it
In Manual Tuning mode, the HP
to the HP
8901B’s
present or not. Once the
internal crystal oscillator whether an input signal is
LO
is locked to the crystal oscillator in Manual
is
8901Bs
Tuning mode, tuning does not change unless a new frequency
MHr
in and the
using one
key is pressed, or tuning
of
the increment keys,
tkHz
is
or
HP
MHz
key by itself.
8901B’s
tuning
This
currently tuned to.
local oscillator (LO) is locked
is
keyed
incremented up or down
UkHz.
(Set an increment by
keying in the desired increment value and pressing one of the increment
keys. The instrument
one of the increment keys
AUTOMATIC OPERATION
the
will
increment by the keyed-in value each time
is
pressed.) Press the
AUTO TUNING
key to exit the Manual Tuning mode.
key or
Manual Tuning is a good choice when measuring an input signal
whose amplitude is less than
RF
multiple
signals are present.
-25
dBm or unstable, or where
If
the input signal is
drifty,
however, it may be necessary to select the Track Mode function.
The Track Mode function enables the
signals from
10
MHz to
1300
MHz. Track mode can be selected with
either Auto Tuning or Manual Tuning by pressing the
key.(A drifting signal will cause the
in its display when Auto Tuning is selected or Error
HP
HP
8901B
8901B
to track drifting input
TRACK
MODE
to place four dashes
01
when the
instrument is manually tuned.)
In Track Mode the Local Oscillator
(LO)
is
locked to the input signal.
The instrument remains locked to the signal throughout each of the
LO’S
tuning octaves. When an input frequency change causes the
to cross into a new octave, lock may be broken. If the instrument
in Auto Tuning Track Mode, the HP
signal.
the instrument
is
in
Manual Tuning Track Mode, the LO
If
return to the manually tuned setting after lock
boundaries occur at
2.5, 5,
10,
Track Mode is the right choice when measuring
8901B
20, 40,
will relock to the input
is
broken. The octave
80, 160, 320,
640,
drifty
input signals.
and
1280
LO
is
will
MHz.
However, certain operating limitations are present when using Track Mode.
These limitations are listed below:
0
Not allowed below
0
Not allowed with
0
Raises residual
0
Attenuates low-rate
FM
10
MHz
455
kHz
level
FM
on input signal
IF
(use
for
FM
rates
>1
kHz only)
Page 91

Table
2-1.
Input Conditions That May
Require
Manual
Tuning.
Tuning
Modes
2-3
Input Condition
Multiple input signals
Level
of
2nd or 3rd
harmonic is greater
than
-10
dBc*
Input signals above
measurement
(1300
range
MHz).
Description
For input signals whose
amplitudes are all between
-25
dBm and +30 dBm,
and are within approximately
15 dB of one another, the
HP 8901 B may auto tune
to the signal at the highest
frequency rather than the
signal with the highest level.
The HP 8901 B may interpret
these as fundamental signals
and tune to the signal at
the highest frequency.
Harmonics from the HP
8901B’s
signals above 1300 MHz to
produce beat frequencies
within the IF passband.
LO may mix with
HP
8901B’s
Instrument will measure
and display characteristics
of input signal at the
highest frequency.
Instrument may measure
and display characteristics
Response
of input signal at the
highest frequency.
Instrument may measure
and display characteristics
of signal above 1300 MHz.
Recommendation
If the desired signal is
not the highest-frequency
signal, manually tune to
the desired frequency or
place a bandpass filter at
the HP 8901 B’s input to
block the unwanted signals.
If
the desired signal is
not the highest-frequency
signal, manually tune to
the desired frequency.
Manually tune to the
signal below 1300 MHz, or
place a low pass filter at the
HP 8901 B’s input to block th’
unwanted high frequencies.
RF
Low-rate, highdeviation FM
Low-level carrier
with low-rate, high-
depth (percentage)
amplitude modulation
dBc = decibels referenced to the carrier level.
While auto tuning, the
HP 8901 B may mistake
(c
20
(>
Hz) high-
400
kHz)
low rate
deviation
FM for signal drift.
The AM may cause the
carrier level to move in
and out of the HP 8901B’s
measurement range.
Instrument may continuously
display four dashes.
Instrument may continuously
0
display two dashes or
it
may alternately display
or
two dashes then four dashes.
MHz,
Manually tune to the carrier
frequency or remove the
FM until the instrument has
auto tuned to the signal.
Manually tune to the
carrier frequency to
increase measurement
sensitivity. (Refer to
lncreaslng
this chapter to extend the
measurement range further.)
Sensitivity in
Page 92

Extending Operation
2-5
Extending
Operation
If
You
Need
to
Frequency
How
to tune to the input signal
when other
are present..
0
How
frequency
How
How
How
input signals above
How
input signals below
RF
.........................
to retune to a
............................
to tune to a noisy input signal.
to track a
to measure the frequency of
to measure the frequency of
Amplitude
Know:
signals
new
drifty
1300
150
or
harmonics
input
input signal
MHz
......
kHz
......
Refer
Increasing Selectivity
Changing Frequency
Noisy Signal
.
.
Driffy
Frequency Overrange
Frequency Underrange
to:
Signal
(2-5)
(2-6)
(2-6)
(2-7)
(2-7)
(2-7)
Increasing Selectivity
How
to tune to an input signal whose
amplitude is very unstable..
The HP
the fundamental in a harmonically-rich spectrum as long as the fundamental
is at least
HP 8901B will also auto tune to the input signal
all
not meet these criteria, the HP 8901B may have
desired input signal.
desired input signal, manually tune the HP 8901B to the input frequency by
keying in the frequency of
To minimize the possibility of unwanted low-frequency, harmonic,
or spurious signals entering the
bandpass
combination selections.
8901Bs
Auto Tuning mode is able to automatically find and tune to
10
dB
above the level of the second and third harmonics. The
non-harmonically-related
If
the instrument does not display the frequency of the
IF
filters can be selected. Table
........
RF
signals.
the
input signal and then pressing the
IF
passband, a high-pass
Unstable Signal
if
it is at least
If,
however, your input signal does
difi5culty
2-2
shows the possible filter
(2-7)
30
dB above
auto tuning to the
MHz
key.
RF
filter and
Page 93
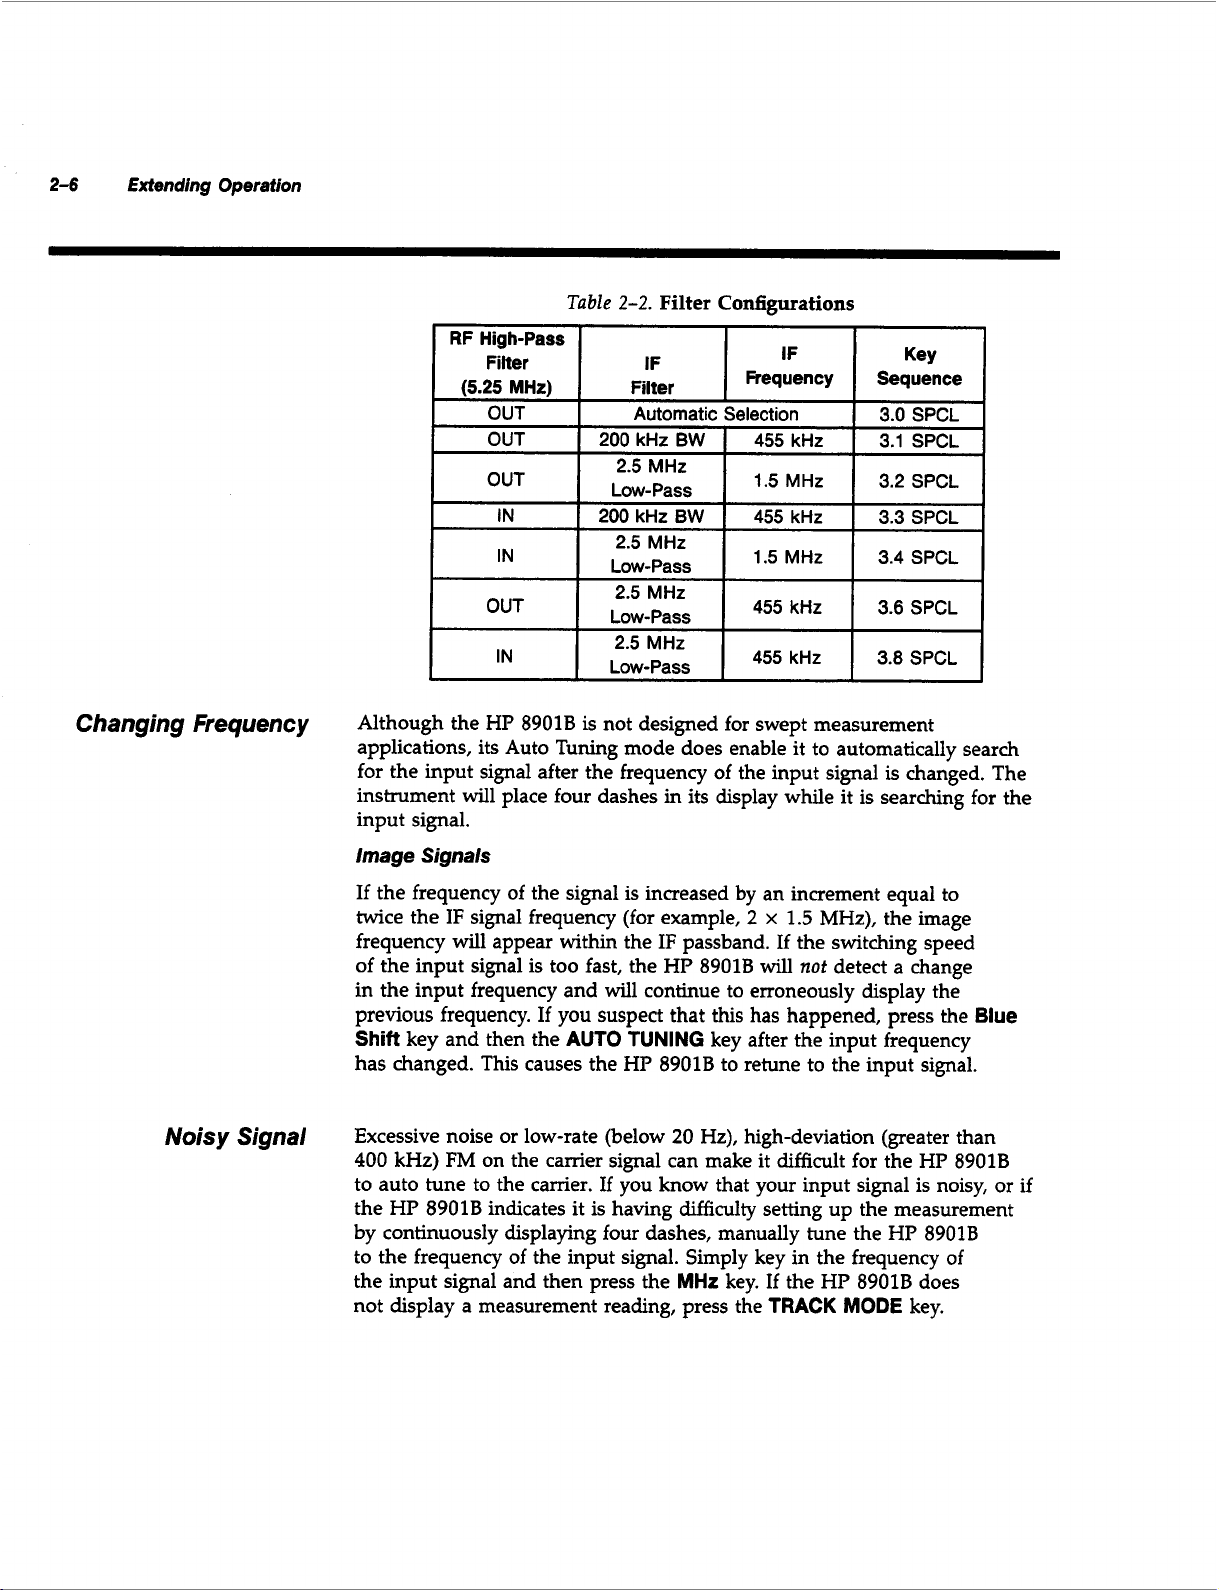
2-6
Extending Operation
RF High-Pass
Filter
(5.25
MHr)
OUT
OUT
IN
Table
2-2.
Filter Configurations
Filter
Automatic
2.5
MHz
Low-Pass
2.5
MHz
Low-Pass
2.5
MHz
Low-Pass
2.5
MHz
Low-Pass
Selection
1.5
1.5
455
455
MHz
MHz
kHz
kHz
3.0
3.1
~ ~
3.2
3.3
3.4
3.6
3.8
SPCL
SPCL
__
SPCL
SPCL
SPCL
SPCL
SPCL
Changing
Noisy
Frequency
Signal
Although the HP 8901B is not designed for swept measurement
applications, its Auto Tuning mode does enable it to automatically search
for the input signal after the frequency of the input signal is changed. The
instrument will place four dashes in its display while it is searching for the
input signal.
Image Signals
If
the frequency of the signal is increased
twice the IF signal frequency (for example,
by
an increment equal to
2
x
1.5
MHz), the image
frequency will appear within the IF passband. If the switching speed
will
not
of the input signal is too fast, the HP 8901B
detect a change
in the input frequency and will continue to erroneously display the
previous frequency.
Shift
key and then the
If
you suspect that this has happened, press the
AUTO TUNING
key after the input frequency
Blue
has changed. This causes the HP 8901B to retune to the input signal.
Excessive noise or low-rate (below
400
kHz) FM on the carrier signal can make it difficult for the HP 8901B
to auto tune to the carrier.
If
the HP 8901B indicates it is having
20
Hz), high-deviation (greater than
you know that your input signal is noisy, or if
difficulty
setting up the measurement
by continuously displaying four dashes, manually tune the HP 8901B
of
to the frequency
the input signal and then press the
the input signal. Simply key in the frequency
MHz
key.
not display a measurement reading, press the
If
the HP 8901B does
TRACK
MODE
of
key.
Page 94

Extending
Operation
2-7
Drifty Signal
Frequency Overrange
Frequency Underrange
A drifty or noisy input signal can cause the instrument to continuously
or
display four dashes (Auto Tuning mode)
mode). Press the
TRACK
MODE
key to select the wide-IF-bandwidth
display Error 01 (Manual Tuning
track mode function. Track Mode can be selected with either the Auto
or Manual tuning modes. Note that the Track Mode function reduces
the low frequency response of modulation measurements and increases
the level of residual modulation. (For details on the capabilities and
Track
Mode
limitations of Track Mode operation, refer to
in this chapter.)
There are three techniques for extending the HP 8901B's frequency
range above
MHz: internal harmonic
mixing,
external local
1300
oscillator and mixer down-conversion, and down-conversion with
a spectrum analyzer. All three techniques extend the measurement
capabilities of the HP 8901B to microwave frequencies. (Refer to
Chapter
If
range, the instrument
limit of the RF Frequency measurement is
can extend this measurement range
Audio Counter. Connect
OUTPUT/AUDIO INPUT port and press the
should remain lit). Press the gold
Audio Counter will accurately count input signals from
5
for measurement examples using these tuning techniques.)
the input frequency is below the HP 8901B's frequency measurement
will
display
your
Error
10. The specified low frequency
150
kHz.
However, you
to
20
Hz
by simply selecting the
signal source to the MODULATION
S
key and the
AUDIO INPUT
AUDIO
FREQ
20
Hz to
key (key
key. The
250
kHz.
Unstable Signal
If
you
are measuring an input signal whose
above
-20
dBm to
-25
dBm, (for example, a low level signal with
high-depth AM or a signal that
is
being pulsed on and
RF
level does not remain
off),
select the
Manual Tuning mode by keying in the frequency of your input signal and
MHz
pressing the
key. In Manual Tuning mode, the instrument
locked at the manually tuned frequency after the input signal
will
is
turned
remain
off.
Page 95

NO
Sensor
Help
Module
If
You
Need to
0
How
to measure frequency without
using
a Sensor Module..
How
to make automated frequency
measurements.
How
to connect an external time base
Know:
.............
.......................
Refer
No
UP-IB
Time Base
to:
Sensor Module
(2-8)
(2-8)
(2-8)
Measurement
0
How
to interpret an error code, dashes
or
questionable measurement..
A
Sensor Module is not required for making
Frequency Error measurements. To make measurements without a
Sensor Module, simply connect a
the HP 8901B’s
INPUT
port to the output of your signal source.
......
50R
Solving
Problems
RF
cable and Type-N adapter from
Measurement
(2-9)
Frequency or
Time
HP-/B
Base
The HP 8901B enables you to fully automate your measurements. Refer
to your HP 8901B Operation and Calibration Manual for setup and
programming information.
A
time base input
input allows you
time base. The time base
switches to the external time base and turns
when an external time base
at the input. To verify that an external time base is being used, key
in
15.1
SPCL.
is
base
being used
is
provided on the rear panel of the
to
connect the HP 8901B to an external 10
circuitry
The instrument will display a
or
a
0
if
the internal time base
within the HP 8901B automatically
off
its time base output
of
sufficient amplitude
1
if
HP
8901B.
MHz
(0.5
Vpp) is applied
the external time
is
being used.
This
Page 96

Solving Measurement
Problems
Help
The
HP
8901B has been designed to feed back information about its
operating status. When the
HP
89018 detects that the input signal or
operating conditions are preventing it from making an accurate, reliable
measurement, it alerts you by placing an error or dash code in its display.
2-9
The circumstances that can cause the
two
classified into one of
0
Input Problem,
0
Operating Problem,
categories:
caused by input signal conditions, or
caused by the selection of incompatible
HP
8901B to display an error code are
operating functions.
Certain errors are caused
only
by
an operating problem,
The errors that can be caused
can be caused
If
your instrument
Table
2-3.
onZy
RF
Frequency
is
only
by
an input problem,
other errors are caused
and some errors can be caused by either.
only
by
by
an operating problem
an input problem
are listed in the chart below.
and the errors that
displaying one of these errors, proceed
and
Frequency Error, Error Codes,
directly
and take the
recovery action recommended.
Error
If
you
Input
Problem
I
1
did
not find your error listed in the
10
I
I
09,
Operating
Problem
12,
20
thru
chart
24,
or
26
or
if
your instrument
displaying dashes or a questionable measurement, continue with the
following procedure.
to
is
1.
Press the
function settings that can cause the
2.
Compare the operating status of your
AUTOMATIC OPERATION
green
AUTOMATIC OPERATION
key with the following condition descriptions.
key.
This cancels all
I-IP
8901B to display an error code.
HP
8901B
after
pressing the
After you have identified the description that best describes your
instrument’s condition, take the action recommended for that condition.
Page 97

2-70
Help
Same Error
No
Error
New Error
Remember
If the error or reading remains the same after the
TION
key has been pressed, the error is being caused by an input problem.
2-3
Look up the error code in Table
and take the action recommended for
AUTOMATIC OPERA-
"Input Problem".
If
the error goes away after the
been pressed, the error was caused by an operating problem.
up the error code in Table
AUTOMATIC OPERATION
2-3
and take the action recommended for
key has
Look
"Operating Problem".
If
the error is replaced by a different error or dash code after the
MATIC OPERATION
key has been pressed, the original error was being
AUTO-
caused by a combined input problem and operating problem. Look up the
after
the
error code displayed by the instrument
AUTOMATIC OPERATION
key was pressed. Take the action recommended for "Input Problem".
Because
flexibility of the
recovery actions
determine the cause
of
the wide variety
HP
8901B,
for
each error code. After using the table to
of
of
input signals and the operating
it is not possible to list all
the problem,
you
may discover other error
recovery procedures that are better suited to your application.
Display
Code
Questionable
Measurement
01
Table
2-3.
RF
Frequency
Problem Description
and
Frequency Error, Error Codes
Instrument does not display frequency of the
input signal.
Input signal level out of measurement range.
and
is
attempting to set
up
measurement.
Continuous display indicates instrument
I
is
having difficulty-tuning to input signal
I
IF
signal within
IF
passband but not centered
well enough to guarantee measurement accuracy
(due to manual tuning).
High
AM
depth
(>95%)
on low-level carrier.
____
~~
Input Problem
Check tuning mode.
Refer
to
Selectivity
Drifty
Increasing
(2-5)
Signal
(2-7).
or
Adjust input signal
level
or change
measurement
Manually
input signal.
Noisy Signal
tune
Refer
(2-6).
sensitiviq
to
to
Increase input signal
level or decrease AM.
(1
of
2)
Operating Problem
Recheck
conditions being used.
Decrease
attenuation.
Re-check operating
conditions
Press the MHz key
to center
in
IF
passband.
If
problem persists,
signal may be
drifting.
Drifty
Refer to
Signal
operating
RF
being
used.
IF
signal
(2-7).
Page 98

Table
2-3.
RF
Frequency and Frequency Error, Error Codes
(2
of
2)
Help
2-1 1
Display
Code
02
03
06
09
Problem Description Input Problem
Input circuits overdriven. Increase RF
Input circuits underdriven. Decrease RF
Input circuits overdriven.
High stability time base problem (Option 002
instruments only).
Frequency
measurement range.
Indicates internal time base oven
cold lODtion 002 instruments onlv).
IF level not within its measurement range.
Frequency entered exceeds measurement range.
Invalid entry.
Invalid Special Function prefix entered.
Invalid Special Function suffix entered.
of
input signal is not within
input attenuation.
input attenuation.
Input level exceeds
7
Vrms
(1
Decrease level
of input signal.
Adjust frequency of
input signal to within
measurement ranae, or
increase measurejnent
range. Refer to
Frequency Overrange
(2-7)
Underrange
Input signal level during
reference measuremeni
must be between
1.25V and 2.50V.
(Option
W
and Frequency
030
peak).
(2-7).
only.)
Operating Problem
Increase RF
attenuation.
Check internal time
base for malfunction.
Wait for oven to warm
for hiahest accuracv.
(When making Ratio
measurements,
allow instrument to
complete the reference
measurement.)
Re-enter frequency
within measurement
range. (In Ratio mode,
reference measurement
of zero is invalid.)
Check compatibility of
function@) with selected
measurement mode.
Check Special Function
number and re-enter.
Check Special Function
number and re-enter.
E
Page 99

More about Modulation and
Audio Measurements
/n
This
The
Chapter
Directory
This chapter introduces the
enable you to adapt its modulation and audio measurements to your specific
test conditions. (To use these special capabilities effectively, you should
first become familiar with the basic operating capabilities and measurement
ranges described in
This
chapter enables you to reference directly to the information you
are interested in. The information
0
Calibration
F'M
measurements.
0
Extending Operation
that enable you to adapt the
of your input
0
Help
-
Refer here for help in solving setup or operating
problems encountered in Modulation or Audio measurements.
Use the directory diagram below to quickly locate the subject you are
interested in.
when appropriate. Use the look-up table to reference to the topics included
for that subject.
Chapter
-
Refer here for the procedure to calibrate your AM and
signal.
A
look-up table
HP
8901B's
1
for the Modulation and Audio measurements.)
-
Refer here for the special operating capabilities
is
located on the first page of each subject area
special operating capabilities that
is
organized into three subject areas.
HP
8901B
to meet the specific conditions
MODULATION
CALIBRATION
Page 100

3-2
Calibration
Calibration
The
HP
8901B meets its specified
without needing any additional calibration other than the recommended
procedure performed annually to re-calibrate the entire instrument.
The following calibration procedure allows you to further enhance
the accuracy of your AM and
AM
and FM measurement accuracy
FM
measurements, however.
AM
and FM
Calibration
By making comparative measurements against a known modulation
level (provided by the AM/FM CALIBRATION output port),
the instrument creates a calibration factor that can be used to
minimize measurement error. Once the calibration factor has been
created, you have control over when it is used by the instrument.
(There is not a calibration procedure for the @M measurement.)
The following chart lists the special function codes for enabling, disabling,
or displaying the calibration factor; After you have enabled the calibration
HP
factor, the
FM
measurements.
Calibration
I
Disable
Enable
Display
89018 will automatically apply it
AM
I
16.0 SPCL 17.0 SPCL
16.1 SPCL 17.1 SPCL
16.2
SPCL 17.2 SPCL
I
FM
to
its
AM
or
Note
To
ensure the highest possible measurement accuracy, allow the
HP
8901B
the calibration procedure.
circuitry is fully settled, allow the
to warm up at least thirty minutes before performing
Also,
to ensure that the measurement
HP
8901B
to update the
calibration factor at least three times before completing the
calibration procedure. (The calibration factor is updated
approximately every
17
seconds while the Calibrator
is
on.)
 Loading...