

Performance Tests and
Adjustments Manual
HP
8568B Spectrum Analyzer
HEWLETT
PACKARD
HP Part No. 08568-90118
Printed in USA
September 1993

@Copyright Hewlett-Packard Company 1993
All Rights Reserved. Reproduction, adaptation, or translation without
prior written permission is prohibited, except as allowed under the
copyright laws.
1212 Valley House Drive, Rohnert Park, CA 94928-4999, USA

Certification
Hewlett-Packard Company certifies that this product met its
published specifications at the time of shipment from the factory.
Hewlett-Packard further certifies that its calibration measurements
are traceable to the United States National Institute of Standards and
Technology, to the extent allowed by the Institute’s calibration facility,
and to the calibration facilities of other International Standards
Organization members.
Warranty
This Hewlett-Packard instrument product is warranted against defects
in material and workmanship for a period of one year from date of
shipment. During the warranty period, Hewlett-Packard Company
will, at its option, either repair or replace products which prove to be
defective.
For warranty service or repair, this product must be returned to a
service facility designated by Hewlett-Packard. Buyer shall prepay
shipping charges to Hewlett-Packard and Hewlett-Packard shall pay
shipping charges to return the product to Buyer. However, Buyer shall
pay all shipping charges, duties, and taxes for products returned to
Hewlett-Packard from another country.
Hewlett-Packard warrants that its software and firmware designated
by Hewlett-Packard for use with an instrument will execute
its programming instructions when properly installed on that
instrument. Hewlett-Packard does not warrant that the operation
of the instrument, or software, or firmware will be uninterrupted or
error-free.
LIMITATION OF WARRANTY
The foregoing warranty shall not apply to defects resulting from
improper or inadequate maintenance by Buyer, Buyer-supplied
software or interfacing, unauthorized modification or misuse,
operation outside of the environmental specifications for the
product, or improper site preparation or maintenance.
NO OTHER WARRANTY IS EXPRESSED OR IMPLIED.
HEWLETT-PACKARD SPECIFICALLY DISCLAIMS THE IMPLIED
WARRANTIES OF MERCHANTABILITY AND FITNESS FOR A
PARTICULAR PURPOSE.
EXCLUSIVE REMEDIES
THE REMEDIES PROVIDED HEREIN ARE BUYER’S SOLE AND
EXCLUSIVE REMEDIES. HEWLETT-PACKARD SHALL NOT BE
LIABLE FOR ANY DIRECT, INDIRECT, SPECIAL, INCIDENTAL, OR
CONSEQUENTIAL DAMAGES, WHETHER BASED ON CONTRACT,
TORT, OR ANY OTHER LEGAL THEORY.
. . .
III

Assistance
Product maintenance agreements and other customer assistance
agreements are available for Hewlett-Rwkard products.
Fbr
any assistance, contact your nearest
Service
OJke.
Hewlett-Packard
Sales and

Safety Symbols
The following safety symbols are used throughout this manual.
Familiarize yourself with each of the symbols and its meaning before
operating this instrument.
Caution
Warning
General Safety Considerations
Warning
The caution sign denotes a hazard. It calls attention to a procedure
which, if not correctly performed or adhered to, could result in
damage to or destruction of the instrument. Do not proceed beyond a
caution sign until the indicated conditions are fully understood and
met.
The warning
procedure which, if not correctly performed or adhered to, could
result in injury or loss of life. Do not proceed beyond a
sign until the indicated conditions are fully understood and met.
Before this instrument is switched on,
properly grounded through the protective conductor of the ac
power cable to a socket outlet provided with protective earth
contact.
Any interruption of the protective (grounding) conductor, inside
or outside the instrument, or disconnection of the protective
earth terminal can result in personal injury.
sign denotes a hazard. It calls attention to a
warning
make sure it has been
Warning
Caution
There are many points in the instrument which can, if contacted,
cause personal injury. Be extremely careful.
Any adjustments or service procedures that require operation
of the instrument with protective covers removed should be
performed only by trained service personnel.
Before this instrument is switched on, make sure its primary power
circuitry has been adapted to the voltage of the ac power source.
Failure to set the ac power input to the correct voltage could cause
damage to the instrument when the ac power cable is plugged in.
V

HP
8568B
Spectrum Analyzer
Documentation
Outline
Included with the HP Model
manuals: the Installation and Verification Manual, the Operating and
Programming Manual, and the Performance Tests and Adjustments
Manual.
8568B
Spectrum Analyzer are three
HP
8568B
HP
and Programming
Performance
Adjustments Manual
HP
85680B
Troubleshooting and
HP
85662A
Troubleshooting and
Installation
and Verification
Manual
8568B
Operating
Manual
HP
8568B
Tests
RF Section
Repair Manual
IF-Display
Section
Repair Manual
General information, installation, specifications, characteristics, and
operation verification.
Manual and remote operation, including complete syntax and
command description. Accompanying this manual is the separate,
pocket-sized Quick Reference Guide.
Electrical performance tests and adjustment procedures.
and
RF Section service information.
IF-Display Section service information.
vi

Contents
1. General Information
Introduction
Instruments Covered by this Manual
Operation Verification
Option 462 Instruments
Option 857 Instruments
2. Performance Tests
Introduction
Verification of Specifications
Calibration Cycle
Equipment Required
Test Record
1. Center Frequency Readout Accuracy Test ....
2. Frequency Span Accuracy Test
3. Sweep Time Accuracy Test
4. Resolution Bandwidth Accuracy Test
5. Resolution Bandwidth Selectivity Test
6. Resolution Bandwidth Switching Uncertainty Test
7. Input Attenuator Switching Uncertainty Test . .
8. Frequency Response Test
9. RF Gain Uncertainty Test
10. IF Gain Uncertainty Test
11. Log Scale Switching Uncertainty Test .....
12. Amplitude Fidelity Test
13. Average Noise Level Test
14. Residual Responses Test
15. Spurious Responses Test
16. Residual FM Test
17. Line-Related Sidebands Tests
18. Calibrator Amplitude Accuracy Test
19. Fast Sweep Time Accuracy Test
20.
21. Frequency Reference Error Test
‘Ihble
2-19. Performance Test Record
Test 1. Center Frequency Readout Accuracy Test ...
Test 2. Frequency Span Accuracy Test
Test 3. Sweep Time Accuracy
Test 4. Resolution Bandwidth Accuracy
Test 5. Resolution Bandwidth Selectivity
Test 6. Resolution Bandwidth Switching Uncertainty
Test
Test 7. Input Attenuator Switching Uncertainty Test
Test 8. Frequency Response Test
Test 9. RF Gain Uncertainty Test
Test 10. IF Gain Uncertainty Test
.....................
.........
................
...............
...............
.....................
.............
..................
................
....................
.........
(220
ms)
............
............
...........
............
...........
............
............
...............
.........
(~20
1st
LO Output Amplitude Test
......................
.........
........
..........
........
............
.......
.......
..........
..........
..........
......
......
......
......
ms) ....
.
l-l
l-l
l-2
1-2
l-2
2-l
2-l
2-l
2-2
2-2
2-3
2-6
2-9
2-13
2-15
2-18
2-20
2-22
2-31
2-33
2-39
2-41
2-45
2-47
2-49
2-56
2-60
2-62
2-63
2-66
2-67
2-69
2-70
2-71
2-72
2-73
2-74
2-75
2-76
2-77
2-78
2-79
Contents-l

Test 11. Log Scale Switching Uncertainty Test
Test 12. Amplitude Fidelity Test
Test 13. Average Noise Level Test
Test 14. Residual Responses Test
Test 15. Spurious Responses Test
Test 16. Residual FM Test
Test 17. Line-Related Sidebands Test
...........
..........
...........
..........
..............
.........
Test 18. Calibrator Amplitude Accuracy Test
Test 19. Fast Sweep Time Accuracy Test
Test 20.
1st
LO Output Amplitude Test
Test 21. Frequency Reference Error Test
Adjustments
3.
(~20
ms)
........
.......
Introduction .....................
Safety Considerations .................
Equipment Required .................
Adjustment Tools ...................
Factory-Selected Components
.............
Related Adjustments .................
Location of Test Points and Adjustments
........
1. Low-Voltage Power Supply Adjustments ......
2. High-Voltage Adjustment (SN
2. High-Voltage Adjustment (SN
3. Preliminary Display Adjustments (SN
3001A
and Below) . .
3004A
and Above) . .
3001A
Below) .....................
3. Preliminary Display Adjustments (SN
3004A
Above) .....................
4. Final Display Adjustments (SN
4. Final Display Adjustments (SN
3001A
3004A
and Below)
and Above)
5. Log Amplifier Adjustments ............
6. Video Processor Adjustments ...........
7. 3 MHz Bandwidth Filter Adjustments .......
8. 21.4 MHz Bandwidth Filter Adjustments .....
9. 3 dB Bandwidth Adjustments ..........
10. Step Gain and 18.4 MHz Local Oscillator
Adjustments ..................
11. Down/Up Converter Adjustments ........
12. Time Base Adjustment (SN
32
17AO5568
and Above)
12. Time Base Adjustment (SN
2840A
and Below, also
.............
2848A
to
3217A05567)
13. 20 MHz Reference Adjustments .........
14. 249 MHz Phase Lock Oscillator Adjustments
15. 275 MHz Phase Lock Oscillator Adjustment ....
16. Second IF Amplifier and Third Converter
Adjustment ...................
17. Pilot Second IF Amplifier Adjustments ......
18. Frequency Control Adjustments .........
19. Second Converter Adjustments .........
20. 50 MHz Voltage-Tuned Oscillator Adjustments
2 1. Slope Compensation Adjustments ........
22. Comb Generator Adjustments ..........
23. Analog-To-Digital Converter Adjustments .....
24. Track and Hold Adjustments ...........
25. Digital Storage Display Adjustments .......
Low-Noise DC Supply
................
....
.....
. .
and
and
.
.
...
. .
2-82
2-83
2-84
2-85
2-86
2-87
2-88
2-89
2-90
2-91
2-92
3-l
3-2
3-2
3-2
3-3
3-4
3-4
3-25
3-29
3-39
3-45
3-52
3-59
3-61
3-65
3-69
3-72
3-77
3-84
3-87
3-92
3-95
3-99
3-103
3-107
3-110
3-112
3-116
3-119
3-123
3-130
3-133
3-136
3-139
3-142
3-145
3-150
Contents-2

Crystal Filter Bypass Network Configuration . . . . . 3-151
4. Option 462
Introduction . . . . . . . . . . . . . . . . . . . . .
4. 6 dB Resolution Bandwidth Accuracy Test . . . . .
4. Impulse and Resolution Bandwidth Accuracy Test
5. 6 dB Resolution Bandwidth Selectivity Test . . . .
5. Impulse and Resolution Bandwidth Selectivity Test .
6. Impulse and Resolution Bandwidth Switching
Uncertainty Test . . . . . . . . . . . . . . . .
Test 4. 6 dB Resolution Bandwidth Accuracy Test (p/o
Table
2-19, Performance Test Record) . . . . . . .
Test 4. Impulse and Resolution Bandwidth Accuracy
Test (p/o
Table
2-19, Performance Test Record) . .
Test 5. 6 dB Resolution Bandwidth Selectivity (p/o
‘Ihble
2-19, Performance Test Record) . . . . . . .
Test 5. Impulse and Resolution Bandwidth Selectivity
(p/o Table 2-19, Performance Test Record) . . . . .
Test 6. Impulse and Resolution Bandwidth Switching
Uncertainty (p/o
‘Iable
2-19, Performace Test
Record) . . . . . . . . . . . . . . . . . . . . .
9. 6 dB Resolution Bandwidth Adjustments . . . . .
9. Impulse Bandwidth Adjustments . . . . . . . . .
4-l
4-2
4-4
.
4-10
4-13
4-16
4-18
4-19
4-21
4-22
4-23
4-24
4-27
5. Option 857
Introduction . . . . . . . . . . . . . . . . . . . . .
12. Option 857 Amplitude Fidelity Test . . . . . . .
Performance Test Record . . . . . . . . . . . . . . .
Test 12. Option 857 Amplitude Fidelity Test . . . . .
6.
Major Assembly and Component Locations
IF-Display Section Figure Index . . . . . . . . . . . .
RF Section Figure Index . . . . . . . . . . . . . . .
5-l
5-2
5-7
5-8
6-l
6-2
Contents-3

Figures
l-l. Service Accessories, HP Part Number 08568-60001
2-l.
Center Frequency Accuracy Test Setup
2-2. Center Frequency Readout Error Measurement
2-3. Frequency Span Accuracy Test Setup
2-4. Sweep Time Accuracy Test Setup
2-5.
Penlift
Output Signal
2-6. Resolution Bandwidth Measurement
2-7. 60 dB Bandwidth Measurement
2-8. Bandwidth Switching Uncertainty Measurement
2-9. Attenuator Switching Uncertainty Test Setup
2-10. Attenuator Switching Uncertainty Measurement
2-l
1. Frequency Response Test Setup (20 MHz to 1.5
2-12. Frequency Response Measurement (20 MHz to 1.5
2-13. Frequency Response Test Setup (100 kHz to 20 MHz)
2-14. Frequency Response Measurement (100 kHz to 20 MHz)
2-15. Frequency Response Test Setup (100 Hz to 100
2-16. RF Gain Uncertainty Measurement
2-17. IF Gain Uncertainty Test Setup
2-18. IF Gain Uncertainty Measurement
2-19. IF Gain Uncertainty Measurement (2
2-20. Log Scale Switching Uncertainty Measurement
2-21. Amplitude Fidelity Test Setup
2-22. Amplitude Fidelity Measurement
2-23. Average Noise Level Measurement
2-24. Residual Responses Measurement
2-25. Harmonic Distortion Test Setup
2-26. Intermodulation Distortion Test Setup
2-27. Intermodulation Distortion Products
2-28. Bandwidth Filter Slope Measurement
2-29. Slope Detected Residual FM
2-30. Peak-to-Peak Amplitude Measurement
2-31. Line Related Sidebands Measurement
2-32. Calibrator Amplitude Accuracy Test Setup
2-33. Fast Sweep Time Accuracy
2-34. Fast Sweep Time Measurement
2-35.
1st
LO Output Amplitude Test Setup
2-36.
Frequency Reference Test Setup
3-l.
Low-Voltage Power Supply Adjustments Setup
3-2. IF-Display Section Low-Voltage Adjustments (SN
and Below) ...................
3-3. IF-Display Section Low-Voltage Adjustments (SN
and Above) ...................
3-4. Location of RF Section Low-Voltage Adjustments
3-5. High Voltage Adjustment Setup
3-6. Location of High Voltage Adjustments
3-7. Location of Label and Test Point . . . . . . . . . . .
................
...........
............
.............
(~20
ms Test Setup)
(~20
........
........
..........
.........
.....
.........
...........
..........
.......
dB)
..........
..........
..........
...........
........
.........
........
........
........
......
.......
ms)
.........
...........
...........
........
. .
....
...
...
GHz)
GHz)
kHz)
....
....
....
3001A
3004A
...
l-8
2-3
2-4
2-6
2-9
2-11
2-14
2-16
2-19
2-20
2-21
2-22
.
2-24
2-25
.
2-26
2-27
.
2-32
2-33
2-35
2-36
2-40
2-41
2-43
2-46
2-48
2-50
2-52
2-53
2-57
2-58
2-58
2-61
2-62
2-63
2-64
2-66
2-68
3-25
3-26
3-26
3-27
3-30
3-31
3-32
Contents-4

3-8. Location of
AlA
Components ...........
3-9. CRT Cut-Off Voltage
3-10. Waveform at AlA3TP5’ : : : : : : : : : : : : : :
3-11. Discharging the CRT Post-Accelerator Cable
3-12. High Voltage Adjustment Setup
...........
3-13. Location of High Voltage Adjustments
3-14. Location of
AlA
Label and Test Point
........
3-15. Discharging the CRT Post-Accelerator Cable
3-16. Preliminary Display Adjustments Setup
3-17. Location of
3-18.
AlA2, AlA4,
3-19. X+ and X- Waveforms
3-20. Composite X Deflection Waveform
AlA2, AlA4, AlA5,
and
AlA
Adjustment Locations
...............
and
A3A2
..........
.....
........
.....
.......
.....
....
3-21. Rise and Fall Times and Overshoot Adjustment
Waveform
3-22.
5OV,-,
Signal ....................
3-23. Preliminary Display Adjustments Setup
3-24. Location of
3-25.
AlA
Adjustment Locations
3-26. X+ and X- Waveforms
3-27. Composite X Deflection Waveform
...................
.......
AlA
and
A3A2
............
.............
...............
..........
3-28. Rise and Fall Times and Overshoot Adjustment
Waveform
3-29.
5OV,-,
Signal ....................
3-30. Location of Final Display Adjustments on
and
AlA5.
3-31. Final Display Adjustments Setup
3-32. Location of Final Display Adjustments on
3-33. Log Amplifier Adjustments Setup
3-34. Location of Log Amplifier Adjustments
3-35. Video Processor Adjustments Setup
3-36. Location of Video Processor Adjustments
3-37. 3 MHz Bandwidth Filter Adjustments Setup
...................
AlA2, AlA4,
...................
...........
AlA
...
..........
........
.........
.......
.....
3-38. Location of Center, Symmetry, and 10 Hz Amplitude
Adjustments
3-39. Location of 3 MHz Peak Adjustments
3-40. 21.4 MHz Bandwidth Filter Adjustments Setup
3-41. Location of
3-42. Location of
3-43. Location of
A4A4
A4A4
A4AS
Adjustments
3-44. Location of
A4A8
3-45. Location of 3 dB Bandwidth Adjustments
..................
.........
....
21.4 MHz LC Filter Adjustments . .
21.4 MHz Crystal Filter Adjustments
21.4 MHz LC Filter and Attenuation
..................
21.4 MHz Crystal Filter Adjustments
......
3-46. Step Gain and 18.4 MHz Local Oscillator Adjustments
Setup
......................
3-47. Location of IF Gain Adjustment ...........
3-48. Location of 10 dB Gain Step Adjustments
3-49. Location of .l dB Gain Step, 18.4 MHz LO, and +
Adjustments
..................
......
1OV
3-50. Down/Up Converter Adjustments Setup .......
3-51. Location of Down/Up Converter Adjustments
.....
3-52. Time Base Adjustment Setup ............
3-53. Location of
A27Al
Adjustment ...........
3-54. Time Base Adjustment Setup ............
3-55. Location of
A27A2
Adjustment ...........
:
3-34
3-35
3-36
3-38
3-40
3-41
3-42
3-44
3-46
3-47
3-47
3-48
3-49
3-49
3-51
3-53
3-54
3-54
3-55
3-56
3-56
3-58
3-60
3-61
3-62
3-65
3-66
3-69
3-70
3-72
3-73
3-75
3-77
3-78
3-79
3-80
3-81
3-85
3-87
3-88
3-89
3-91
3-92
3-93
3-95
3-98
3-99
3-102
Contents-5
3-56. 20 MHz Reference Adjustments Setup ........
3-57. Location of 20 MHz Reference Adjustments .....
3-58. Typical Signal at
A16TP3
..............
3-59. 249 MHz Phase Lock Oscillator Adjustments Setup . .
3-60. Location of 249 MHz Phase Lock Oscillator Adjustments
3-61. 275 MHz Phase Lock Oscillator Adjustment Setup ...
3-62. Location of 275 MHz PLO Adjustment ........
3-63. Second IF Amplifier Adjustments Setup .......
3-64. Location of 301.4 MHz BPF and 280 MHz AMPTD
Adjustments ..................
3-65. 301.4 MHz Bandpass Filter Adjustment Waveform . .
3-66. Minimum Image Response at 258.4 MHz .......
3-67. Pilot Second IF Amplifier Adjustments Setup .....
3-68. Location of 269 MHz Bandpass Filter Adjustments . .
3-69. 269 MHz
Bandpass
Filter Adjustments Waveforms . .
3-70. Frequency Control Adjustments Setup ........
3-71. Location of Frequency Control Adjustments .....
3-72. Second Converter Adjustments Setup ........
3-73. Location of Second Converter Adjustments ......
3-74. Typical PILOT
3-75. Typical PILOT
3-76. Typical
3-77. Typical
Bandpass
Bandpass
3-78. 50 MHz Voltage-Tuned Oscillator Adjustments Setup
2ND
IF Bandpass (SHIFT t)......
2ND
IF Bandpass (SHIFT 1)......
(SHIFT t).............
(SHIFT 1).............
.
3-79. Location of 50 MHz VT0 Adjustments ........
3-80. Slope Compensation Adjustment Setup ........
3-81. Location of
A22R66
TILT Adjustment ........
3-82. Slope Compensation Adjustment Waveforms .....
3-83. Location of Comb Generator Adjustments ......
3-84. Comb Teeth Display .................
3-85. Analog-To-Digital Converter Adjustments Setup ....
3-86. Location of Analog-To-Digital Converter Adjustments .
3-87. Track and Hold Adjustments Setup .........
3-88. Location of Track and Hold Adjustments .......
3-89. Digital Storage Display Adjustments Setup ......
3-90. Location of Digital Storage Display Adjustments ...
3-91. Sample and Hold Balance Adjustment Waveforms ...
3-92. Waveform Before Adjustment ............
3-93. Low-Noise DC Supply ................
3-94. Crystal Filter Bypass Network Configurations .....
4-l.
Resolution Bandwidth Measurement .........
4-2. Impulse Bandwidth Test Setup ............
4-3. 6 dB Resolution Bandwidth Measurement ......
4-4. 60 dB Bandwidth Measurement ...........
4-5. 60 dB Bandwidth Measurement ...........
4-6. Bandwidth Switching Uncertainty Measurement ...
4-7. Location of Bandwidth Adjustments .........
4-8. Location of Bandwidth Adjustments .........
5.1. Option 857 Amplitude Fidelity Test Setup ......
6-l.
RF Section, Top View ................
6-2. RF Section, Front View ...............
6-3. RF Section, Bottom View ..............
6-4. IF Section, Top View (SN
6-5. IF Section, Top View (SN
3001A
and Below) .....
3004A
and Above) .....
6-6. IF Section, Front View ...............
3-103
3-104
3-106
3-107
3-108
3-110
3-111
3-112
3-114
3-l
14
3-115
3-116
3-118
3-118
3-119
3-120
3-123
3-124
3-127
3-127
3-128
3-128
3-130
3-131
3-133
3-135
3-135
3-136
3-137
3-139
3-140
3-142
3-143
3-145
3-146
3-147
3-147
3-150
3-151
4-3
4-4
4-8
4-11
4-14
4-17
4-25
4-28
5-2
6-4
6-5
6-6
6-7
6-8
6-9
Contents-6

6-7. IF Section, Bottom View . . . . . . . . . . . . . .
6-10
Contents-7

lhbles
2-l.
Performance Test Cross-Reference ..........
2-2. Center Frequency Readout Error Test Record .....
2-3. Wide Span Error ..................
2-4. Span Error .....................
2-5. Sweep Time Accuracy, Sweep Times
2-6. Sweep Time Accuracy, Sweep Times
2-7. Sweep Time Accuracy, Sweep Times
220
ms .....
~20 s
220
......
ms (Alternate
Procedure) ...................
2-8. Bandwidth Accuracy ................
2-9. Resolution Bandwidth Selectivity ..........
2-10. Bandwidth Switching Uncertainty ..........
2-11. Input Attenuator Switching Uncertainty .......
2-12. IF Gain Uncertainty, 10 dB Steps ..........
2-13. IF Gain Uncertainty, 2 dB Steps ...........
2-14. IF Gain Uncertainty, 0.1 dB Steps ..........
2-15. Log Scale Switching Uncertainty ...........
2-16. Log Amplitude Fidelity ...............
2-
17. Linear Amplitude Fidelity ..............
2-18. Fast Sweep Time Accuracy
(~20
ms) .........
3-1. Adjustment Cross Reference .............
3-2. Adjustable Components ...............
3-3. Factory-Selected Components ............
3-4. Standard Value Replacement Capacitors .......
3-5. Standard Value Replacement 0.125 Resistors .....
3-6. Standard Value Replacement 0.5 Resistors ......
3.5. Initial Adjustment Positions .............
3-6. Initial Adjustment Positions .............
3-7. Parts for Low-Noise DC Supply ...........
3-8. Crystal Filter Bypass Network Configuration for
and
A4A8
(21.4 MHz) ..............
3-9. Crystal Filter Bypass Network Configuration for
(3 MHz)
4-l.
6 dB Resolution Bandwidth Accuracy ........
.....................
A4A4
A4A7
4-2. Impulse Bandwidth Accuracy ............
4-3. 6 dB Resolution Bandwidth Accuracy ........
4-4. 6 dB Resolution Bandwidth Selectivity ........
4-5. Impulse and Resolution Bandwidth Selectivity ....
4-6. Bandwidth Switching Uncertainty ..........
5-l.
Log Amplitude Fidelity (10 Hz RBW; Option 857) ...
5-2. Log Amplitude Fidelity (10 kHz RBW; Option 857) . .
5-3. Linear Amplitude Fidelity . . . . . . _ . . . . . . .
2-2
2-5
2-7
2-8
2-11
2-12
2-12
2-14
2-17
2-19
2-21
2-35
2-36
2-38
2-40
2-42
2-44
2-65
3-3
3-5
3-13
3-20
3-21
3-23
3-59
3-62
3-150
3-151
3-151
4-3
4-8
4-9
4-12
4-15
4-17
5-4
5-5
5-6
Contents-E

General Information
1
Introduction
Warning
This HP
Performance Tests and Adjustments Procedures. The Performance
Tests provided should be performed for the following reasons:
w
If the test equipment for the Operation Verification Program is not
available.
n If the instrument does not pass all of the Operation Verification
tests.
w
For complete verification of specifications not covered by the
Operation Verification program.
The adjustment procedures should be performed for the following
reasons:
w
If the results of a performance test are not within the specifications.
w
After the replacement of a part or component that affects electrical
performance.
The adjustment procedures require access to the interior of the
instrument and therefore should only be performed by qualified
service personnel. There are voltages at many points in the
instrument which can, if contacted, cause personal injury. Be
extremely careful. Adjustments should be performed only by
trained service personnel.
8568B
Tests and Adjustments Manual contains two sections:
Instruments Covered
by this Manual
Power is still applied to this instrument with the LINE switch in
STANDBY. There is no OFF position on the LINE switch. Before
removing or installing any assembly or printed circuit board,
remove the power cord from the rear of both instruments and
wait for the MAINS indicators (red
Capacitors inside the instrument may still be charged even if the
instrument has been disconnected from its source of power.
Use a non-metallic tuning tool whenever possible.
This manual contains procedures for testing and adjusting HP
Spectrum Analyzers, including those with Option 001 (75 Ohm RF
INPUT), Option 400 (400 Hz operation), Option 462, and Option 857
installed. The procedures in this manual can also be used to adjust HP
8568A
Spectrum Analyzers that have been converted into HP
Spectrum Analyzers through the installation of an HP
Kit (formerly HP 8568A+
OlK
Retrofit Kit).
LEDs)
to go completely out.
8568AB
General Information
8568B
8568B
Retrofit
l-1

Operation Verification
A high confidence level in the instrument’s operation can be achieved
by running only the Operation Verification Program, since it tests
most of the instrument’s specifications. It is recommended that the
Operation Verification Program be used for incoming inspection and
after repairs, since it requires much less time and test equipment.
A description of the program can be found in the Installation and
Verification manual.
Option 462
Instruments
Option 857
Instruments
Option 462 instruments require that the performance tests and
adjustment procedures listed below be performed instead of their
standard versions included in chapters two and three. Information on
Option 462 versions are located in Chapter 4, Option 462.
6 dB Bandwidths:
Test 4, 6 dB Resolution Bandwidth Accuracy Test
Test 5, 6 dB Resolution Selectivity Test
Adjustment 9, 6 dB Bandwidth Adjustments
Impulse Bandwidths:
Test 4, Impulse and Resolution Bandwidth Accuracy Test
Test 5, Impulse and Resolution Selectivity Test
Test 6, Impulse and Resolution Bandwidth Switching Uncertainty
Test
Adjustment 9, Impulse Bandwidth Adjustments
Option 857 instruments require that the performance test procedure
listed below be performed instead of the standard version included in
Chapter 2. Information on Option 857 is located in Chapter 5, Option
857.
Test 12, Option 857 Amplitude Fidelity Test
l-2
General Information

‘Ihble
l-l. Recommended Test Equipment (1 of 5)
Instrument
SIGNAL
SOURCES
Synthesized
Sweeper
Signal
Generator
Frequency
Synthesizer
Critical Specifications for
Equipment Substitution
Frequency: 10 MHz to 1500 MHz
Output Power: + 10 dBm maximum (leveled)
Aging Rate: ~1 x 10mg/day
Spurious Signals:
135
dBc
125
(~7 GHz)
dBc
(<20 GHz)
Amplitude Modulation: dc to 100 kHz
Leveling: Internal, External Power Meter
Frequency: 20 MHz to 450 MHz
SSB Phase Noise: >130 dB below carrier at
20 kHz away
Stability:
(HP
~10
ppm/lO min.
8340A
may be substituted)
Frequency: 200 Hz to 80 MHz
Stability: f 1 x
lo-‘/day
Amplitude Range: + 13 to -86 dBm with 0.01
resolution
Attenuator Accuracy: <
f0.07 dB
(+ 13 to -47 dBm)
dB
Zecommended
Model
HP
8340A
HP
8640B
HP
3335A
Perf.
Test
X
X
4dj.
X
X
Pulse
Generator
Function
Generator
Frequency
Standard
Pulse Width: 10 nsec to 250 nsec
Rise and Fall Times: ~6 nsec
Output Level: +
Output: Sine Wave and Triangle Wave,
2.5V
2Vp-p
Range: 100 Hz to 500 kHz (Sweep Function Available)
Output: 1, 2, 5, or 10 MHz
Accuracy:
Aging Rate: ~1 x
<fl
x
lo-lo/day
10-l’
HP
HP
HP
8116A
3312A
5061B
X
X
X
X
X
General Information 1-3
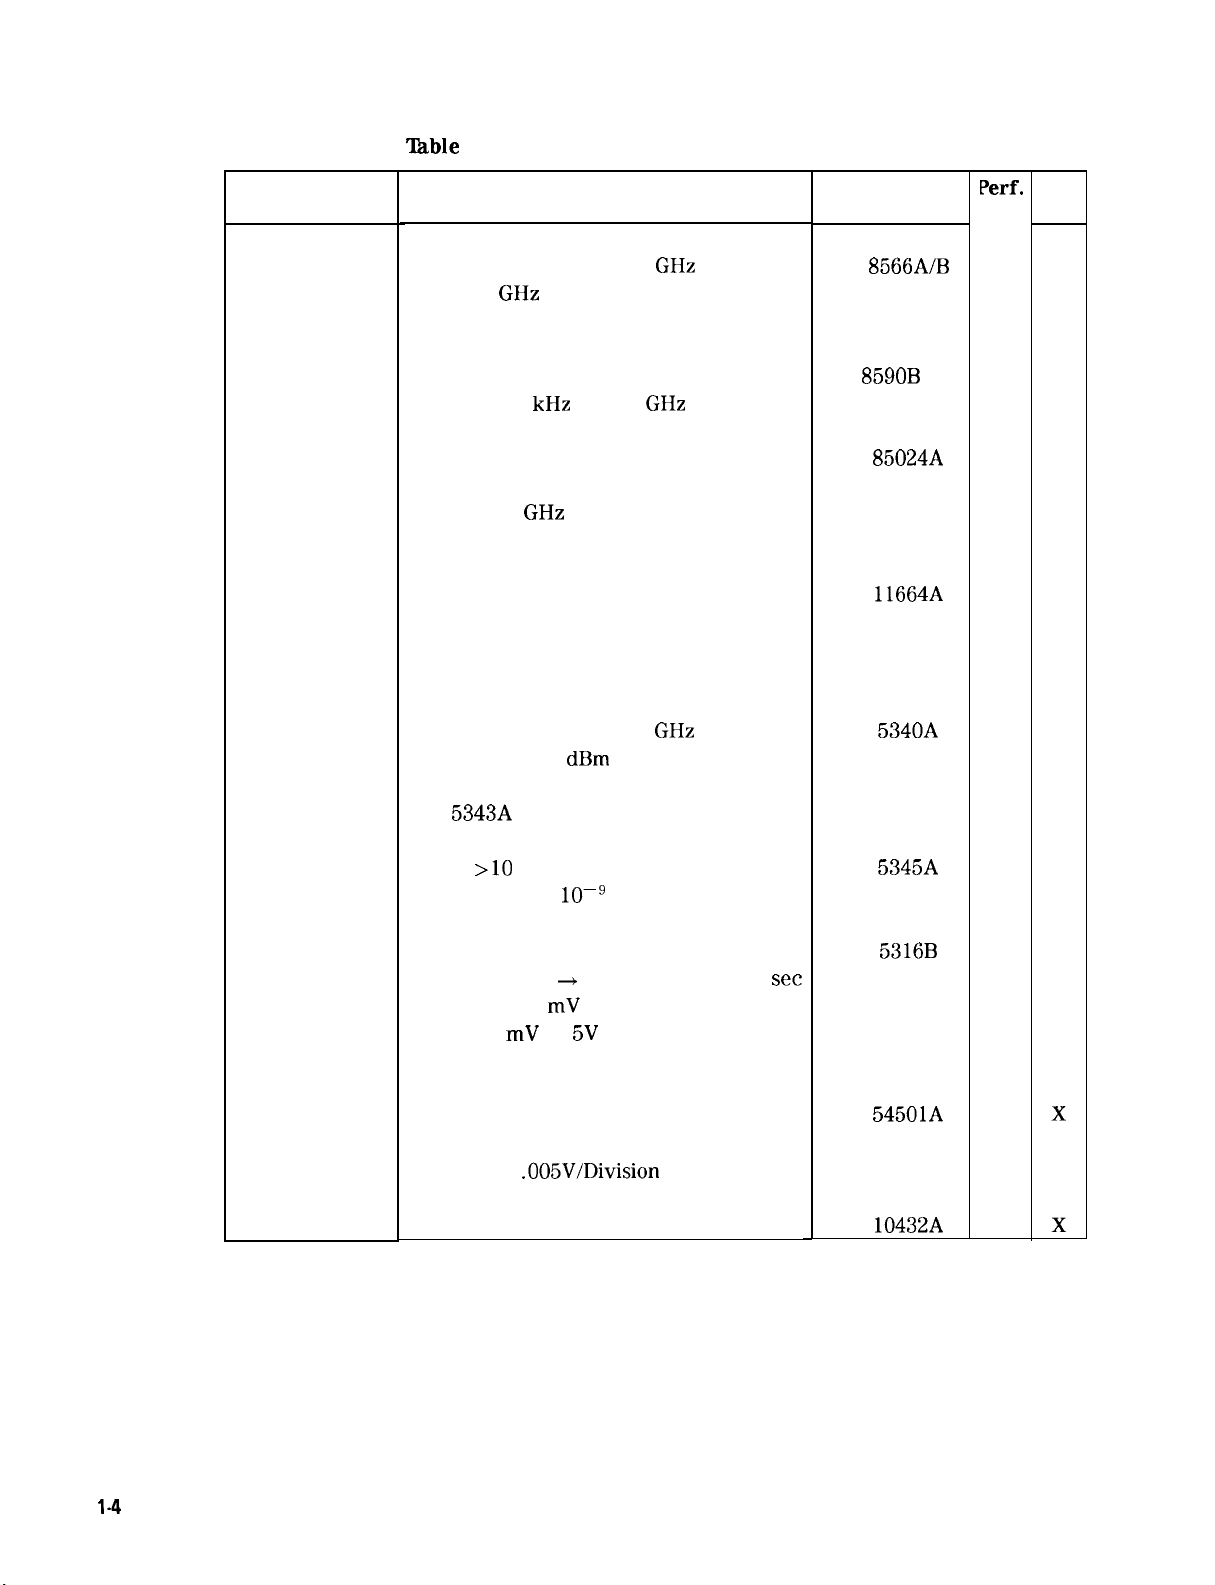
‘Ihble
l-l. Recommended Test Equipment (2 of 5)
Instrument
ANALYZERS
Spectrum
Analyzer
Spectrum
Analyzer
AC Probe
Scalar
Network
Analyzer
Detector
(2 required)
COUNTERS
Frequency
Counter
Critical Specifications for
Equipment Substitution
Frequency: 100 Hz to 2.5
2 to 22
GHz
Preselected
RF Spectrum Analyzer
Frequency: 9 kHz to 1.8
GHz
High Frequency Probe
10 MHz-l10
GHz
Compatible with HP 8757E
Frequency: 10 MHz to 18
Sensitivity: -30 dBm
HP-IB Compatible
5343A
(HP
may be substituted)
GHz
GHz
Recommended
Model
HP
8566A/B
8590B
HP
85024A
HP 8757E
11664A
HP
HP
5340A
Perf.
Test
Adj.
X
X
X
X
X
X
Electronic
Counter
j = Universal
Counter
OSCILLOSCOPE
Oscilloscope
Probe
Range:
Resolution: 2 x
>lO
MHz
lo-’
gate time
Ext. Time Base: 1, 2, 5, or 10 MHz
Frequency: dc to 100 MHz
Time Interval A
+
B: 100 nsec to 200
set
Sensitivity: 50 mV rms
Range: 30 mV to 5V p-p
Digitizing OSCOPE, 4 Channel
Frequency: 100 MHz
Sensitivity:
.005V/Division
10: 1 Divider, compatible with oscilloscope
HP
HP
HP
HP
5345A
5316B
54501A
10432A
X
X
l-4
General Information


‘Ihble
l-l. Recommended Test Equipment (4 of 5)
Instrument
ATTENUATORS
(Cont’d)
20
dB
Attenuator
TERMINATIONS
Termination
FIWERS
Low-Pass
Filter
Low-Pass
Filter
Low-Pass
Filter
Critical Specifications for
Equipment Substitution
?requency:
rype
Impedance: 500; BNC
?latness:
Cut-off Frequency:
Xejection: >40 dB at 1750 MHz
ht.-off
Cut-off Frequency: 50 MHz
200 Hz to 18
N Connectors
ho.25 dB
2400
Frequency: 300 MHz
GHz
MHz and ~500 MHz
Recommended
Model
HP
8491B,
Option 020
11593A
HP
Telonic
TLS450-7EE
HP 0955-0455
HP 0955-0306
Perf.
Test
X
X
X
1dj.
MISCELLANEOUS
DEVICES
Power
Splitter
Directional
Bridge
SPECIAL
DEVICES
Display
Adjustment
PC Board
Low-Noise
DC Supply
Crystal Filter
Bypass Network
(4 required)
Frequency:
backing:
Required for preliminary display adjustments
Zefer to Figure 70
(Optional)
Xefer
1 MHz to 1500 MHz
~0.2 dB
to Figure 71
HP
11667A
HP
8721A
HP85662-60088
X
X
X
X
X
X
l-6
General Information

‘Ihble
l-l. Recommended
Test
Equipment (5 of 5)
Instrument
Critical Specifications for
Recommended Perf. Adj
Equipment Substitution
Model
Test
CABLES
Cable Assembly Frequency Range: 200 Hz to 22
GHz
HP 8120-4921
X
APC 3.5 Male Connectors
Length: 91 cm (36 inches)
SWR:
cl.4
at 22
Cable BNC, 122 cm (48 in.) (3 required)
Test Cable *
BNC (m) to SMB Snap-On (f)
Test Cable SMA (m) to SMA (m)
Test Cable SMA (m) to SMA (m)
GHz
10503A
x x
HP 85680-60093
HP 85680-20094
HP5061-5458 X X
ADAPTERS
Adapter Type N (f) to BNC (m) HP1250-0077 X
Adapter Type N (m) to BNC (m) HP1250-0082 X
Adapter Tee, SMB Male Connectors HP 1250-0670
Adapter Type N (m) to N (m)
(f)(2
Adapter
Type N (m) to BNC
required) HP1250-0780 X
Adapter BNC Tee (m) (f) (f)
Adapter Type N (m) to SMA (f)
Adapter Type N (f) to BNC
Adapter
Adapter
APC-3.5
APC-3.5
(f) to
(f) TO N
(f)(2
APC-3.5
(f)(2
required) HP1250-1474 X
(f) HP1250-1749 X
required) HP 1250-1745
HP1250-0778 X
HP1250-0781 X
HP1250-1250 X
a
X
X
X
X
BOARD
EXTENDERS
Extender *
12
required)
Extender *
13
required)
Extender *
PC Board: 36 contacts;
2 rows of 18
PC Board: 30 contacts;
2 rows of 15
PC Board: 20 contacts;
2 rows of 10
Extender * PC Board: 12 contacts;
12
required) 2 rows of 6
PC Board
PC Board extracting tool
Extractor
* Part of Service Accessories
HP 08505-60042
HP 08505-60041
HP 85680-60028
HP08505-60109
HP 03950-4001
X
X
X
X
,X
General Information
l-7
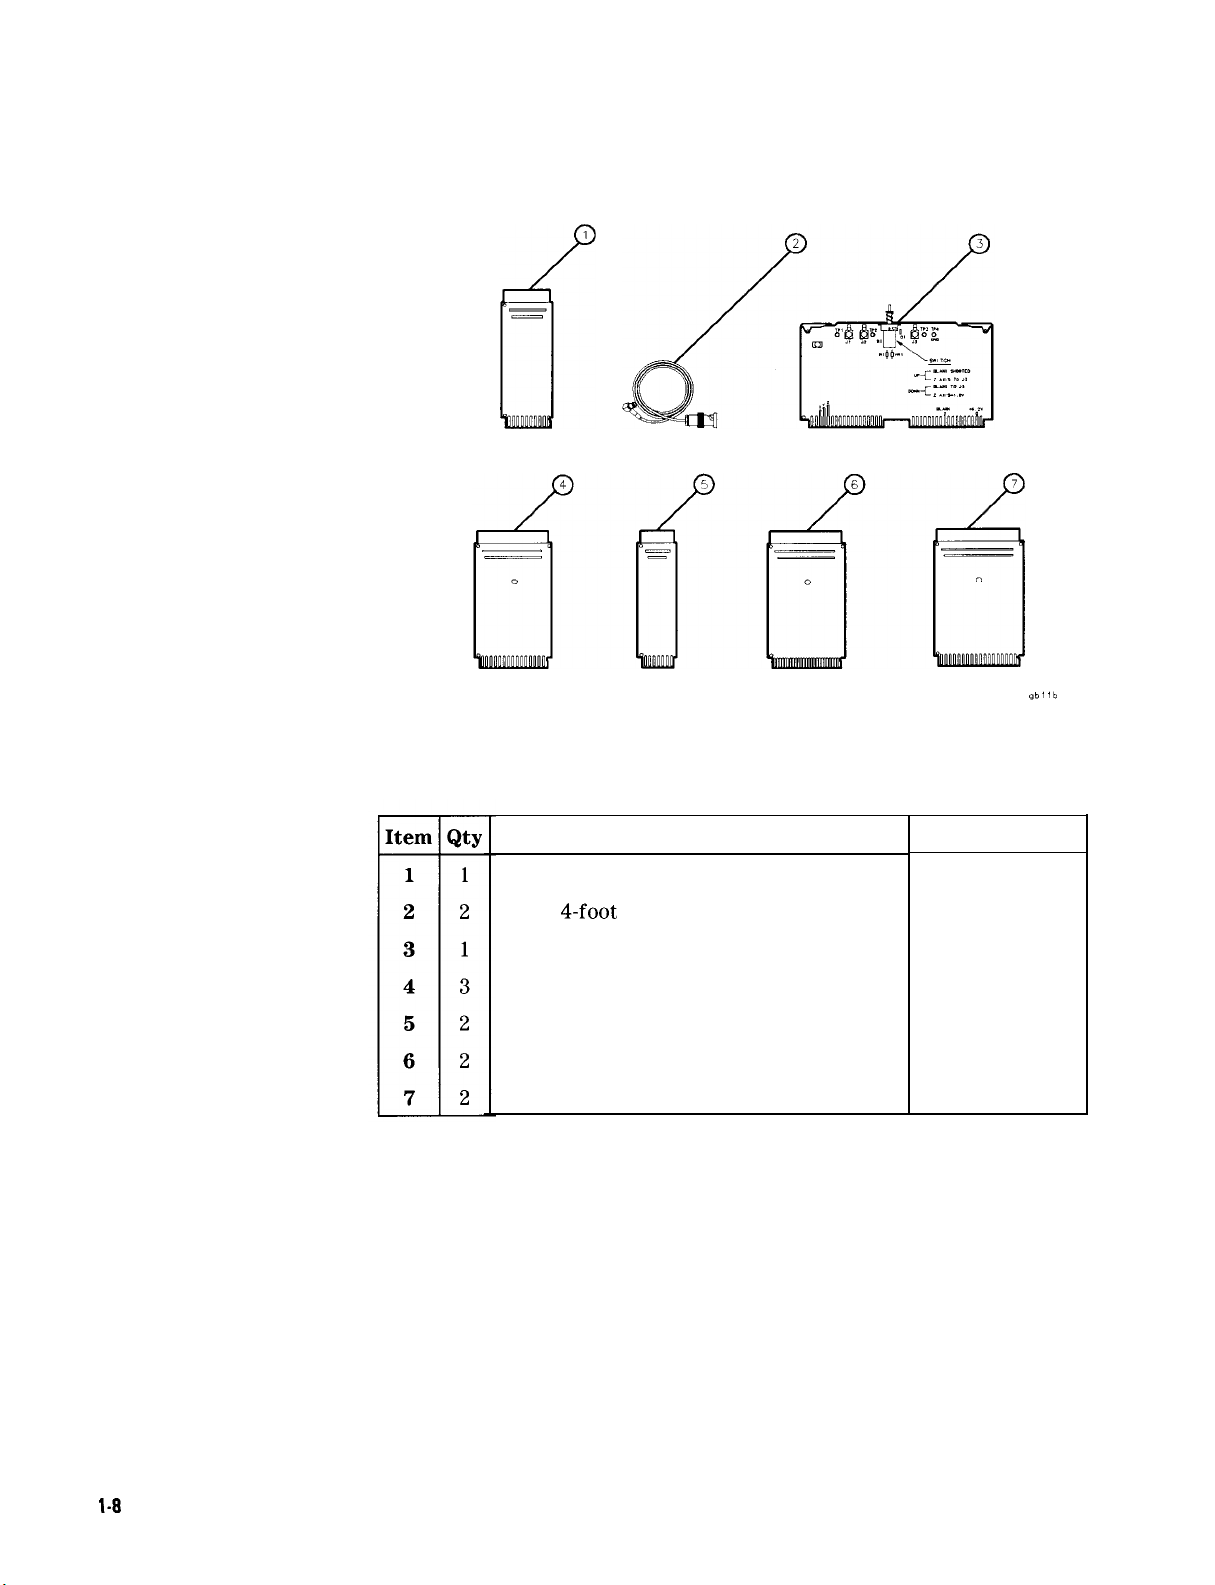
Description
HP Part Number
ExtenderBoard:20contacts;2rowsof
Cable: 4-foot long; BNC to SMB snap-on
PC Board: Display Adjustment Test
ExtenderBoard:
30
contacts;2rowsof
ExtenderBoard:12contacts;2rowsof
ExtenderBoard:50contacts;2rowsof
ExtenderBoard:36contacts;2rowsof
10
15
6
25
18
85680-60028
85680-60093
85662-60088
08505-60041
08505-60109
85680-60034
08505-60042
Figure l-l. Service Accessories, HP Part Number 08568-60001
l-8
General Information

Performance Tksts
2
Introduction
Verification of
Specifications
The procedures in this section test the instrument’s electrical
performance using the Specifications in the Installation and
Verification Manual as the performance standards. None of the
tests require access to the interior of the instrument. The manual
Performance Tests
if semi-automatic test equipment (for Operation Verification) is not
available or the Performance Test is not in the Operation Verification
Program. (Refer to the Installation and Verification Manual for
information on Operation Verification.)
When a complete verification of specifications is required, proceed as
follows:
1. Run the Operation Verification Program.
2. The Operation Verification Program verifies compliance with
specifications of all tests it performs. The tests not performed by
the Operation Verification Program must be done manually and are
as follows:
n Center Frequency Readout Accuracy
n Spurious Responses
H
Fast Sweep Time Accuracy
n
1st
LO Output Amplitude Responses
provided
in this section should be performed only
Calibration Cycle
n Frequency Reference Error
If the results of a performance test are marginally within
specification, go to the Adjustments section of this manual and
perform the related adjustment procedures. When an adjustment is
directly related to a performance test, the adjustment procedure is
referenced under RELATED ADJUSTMENT in the performance test.
This instrument requires periodic verification of performance. The
instrument should have a complete verification of specifications at
least every six months.
Performance Tests
2-l

Equipment Required
Equipment required for the manual performance tests and
adjustments is listed in
at the beginning of this manual. Any equipment that satisfies the
critical specifications given in the list may be substituted for the
recommended model.
‘Ihble
2-1, Recommended Test Equipment,
Test Record
Note
Function or Characteristic Tested Test Performance Test
Center Frequency Readout
Frequency Spans
Sweep Time Accuracy
3-dB
Bandwidths
Bandwidth Shape
Bandwidth Amplitudes
The Operation Verification Program provides a detailed test record
when a printer is used with the controller. If manual performance
tests are done, results of the performance tests may be tabulated in
the HP
HP
and the acceptable ranges for the measurement values obtained
during the tests.
Allow
Performance Tests.
able
(220
8568B
Performance Test Record at the end of this section. The
8568B
Performance Test Record lists all of the tested specifications
l/2-hour
2-1. Performance Test Cross-Reference
ms)
warm-up time for the HP
No.
1
Center Frequency Readout Accuracy Test
2
Frequency Span Accuracy Test
3
Sweep Time Accuracy Test
4
Resolution Bandwidth Accuracy Test
5
Resolution Bandwidth Selectivity Test
6
Resolution Bandwidth Switching Uncertainty Test
8568B
before beginning the
Input Attenuator
Frequency Response
RF Gains
IF Gains
Log Scales Accuracy
Log and Linear Amplifier Fidelity 12 Amplitude Fidelity Test
Noise Floor
Residual Responses
Spurious Responses
Residual FM
Line-Related Sidebands
CAL OUTPUT Level
Fast Sweep Times
1ST
LO OUTPUT Amplitude
Frequency Reference
Accuracay
7
Input Attenuator Switching Uncertainty
8 Frequency Response Test
9
RF Gain Uncertainty Test
10
IF Gain Uncertainty Test
11
Log Scale Switching Uncertainty Test
13
Average Noise Level Test
14 Residual Responses Test
15 Spurious Responses Test
16 Residual FM Test
17 Line-Related Sidebands Test
18
Calibrator Amplitude Accuracy Test
19
Fast Sweep Time Accuracy Test
20
1ST
LO OUTPUT Amplitude Test
21
Frequency Reference Error Test
2-2 Performance Tests

1. Center
Frequency Readout
Accuracy ‘I&t
1. Center Frequency Readout Accuracy
Test
Related Adjustments
Specification
Description
Frequency Control Adjustments
Time Base Adjustment
Step Gain and 18.4 MHz Local Oscillator Adjustments
50 MHz Voltage-Tuned Oscillator Adjustments
(uncorrected)
f2%
of frequency span + frequency reference error x tune frequency
+30% of resolution bandwidth setting + 10 Hz) in AUTO resolution
bandwidth after adjusting FREQ ZERO at stabilized temperature.
A synthesized signal source that is phase-locked to a known frequency
standard is used to input a signal to the analyzer. The frequency
readout of the analyzer is compared to the actual input frequency
for several different frequency settings over the analyzer’s range.
The signal source is phase-locked to a standard known to be as
accurate as the analyzer’s internal frequency reference to minimize
the “frequency reference error x center frequency” term of the
specification.
SPECTRUH
FAEQUENCY
ANALYZER
SIONAL
INPUT
2
ADAPTER
STANDARD
CABLE ASSENBLY
Figure 2-1. Center Frequency Accuracy
SYNTHESIZED
Test
Setup
SHEEPER
Performance Tests
2-3

1. Center Frequency Readout Accuracy Test
Equipment
Procedure 1.
Synthesized Sweeper . . . . . . . . . HP
Frequency Standard . 10 MHz standard,
e.g. HP
5061A
accy
within + 1 part in
8340A
Adapter, Type N (m) to SMA (f) . . . HP1250-1250
61 cm (24 in.) Cable Assembly, SMA Male Connectors HP 5061-1086
Connect CAL OUTPUT to SIGNAL INPUT 2.
2.
3.
4.
5.
6.
7.
Press
[INSTR
PRESET),
@
on the analyzer.
Adjust FREQ ZERO for a maximum amplitude trace.
Press
(1tds-r~
PRESET).
Set the synthesized sweeper for a 100.000 MHz signal at a level of
approximately 0
Connect equipment as shown in Figure
Set analyzer
dBm.
~CENTER
2-l.
FREQUENCY) and [FREQUENCY SPAN) and
synthesized sweeper frequency according to Table 2-2. At each
setting, press
CREFERENCE
[PEAK
SEARCH).~~)
LEVEL) as necessary to place signal peak at a convenient
to center the signal. Adjust
level.
8.
Record the CENTER readout frequency in the table for each
setting. The limits for this frequency are given in the table. See
Figure 2-2.
lOlo,
2-4 Performance Tests
Figure 2-2. Center Frequency Readout Error Measurement

1. Center Frequency Readout Accuracy
Test
Note
Spectrum analyzer center frequency readout can fall outside of
specified limits if 10 MHz frequency reference has not been calibrated
within the past year. To eliminate “frequency reference error x
tune frequency” term, substitute spectrum analyzer 10 MHz FREQ
REFERENCE rear panel output for frequency standard and repeat
test.
‘Ihble
2-2. Center Frequency Readout Error
[FREQUENCYSPAN)I(CENTER FREQumcy~
100 MHz
100 MHz
100 MHz
10 MHz
10 MHz
10 MHz
10 MHz
1 MHz
100
kHz
10
kHz
I
Spectrum Analyzer
(MHz)
\
I
100
500
1000
100
500
1000
1500
1000
1000
1000
Test
Center Readout
(MHZ)
\
Min Measured
98
498
998
99.8
499.8
999.8
1499.8
999.98
999.998
999.9998
Record
I
Max
102
502
1002
100.2
500.2
1000.2
1500.2
1000.02
1000.002
1000.0002
Performance Tests 2-5
2. Frequency Span
Accuracy
lkst
Related Adjustments
Specification
Description
Frequency Control Adjustments
50 MHz Voltage-Tuned Oscillator Adjustments
Span
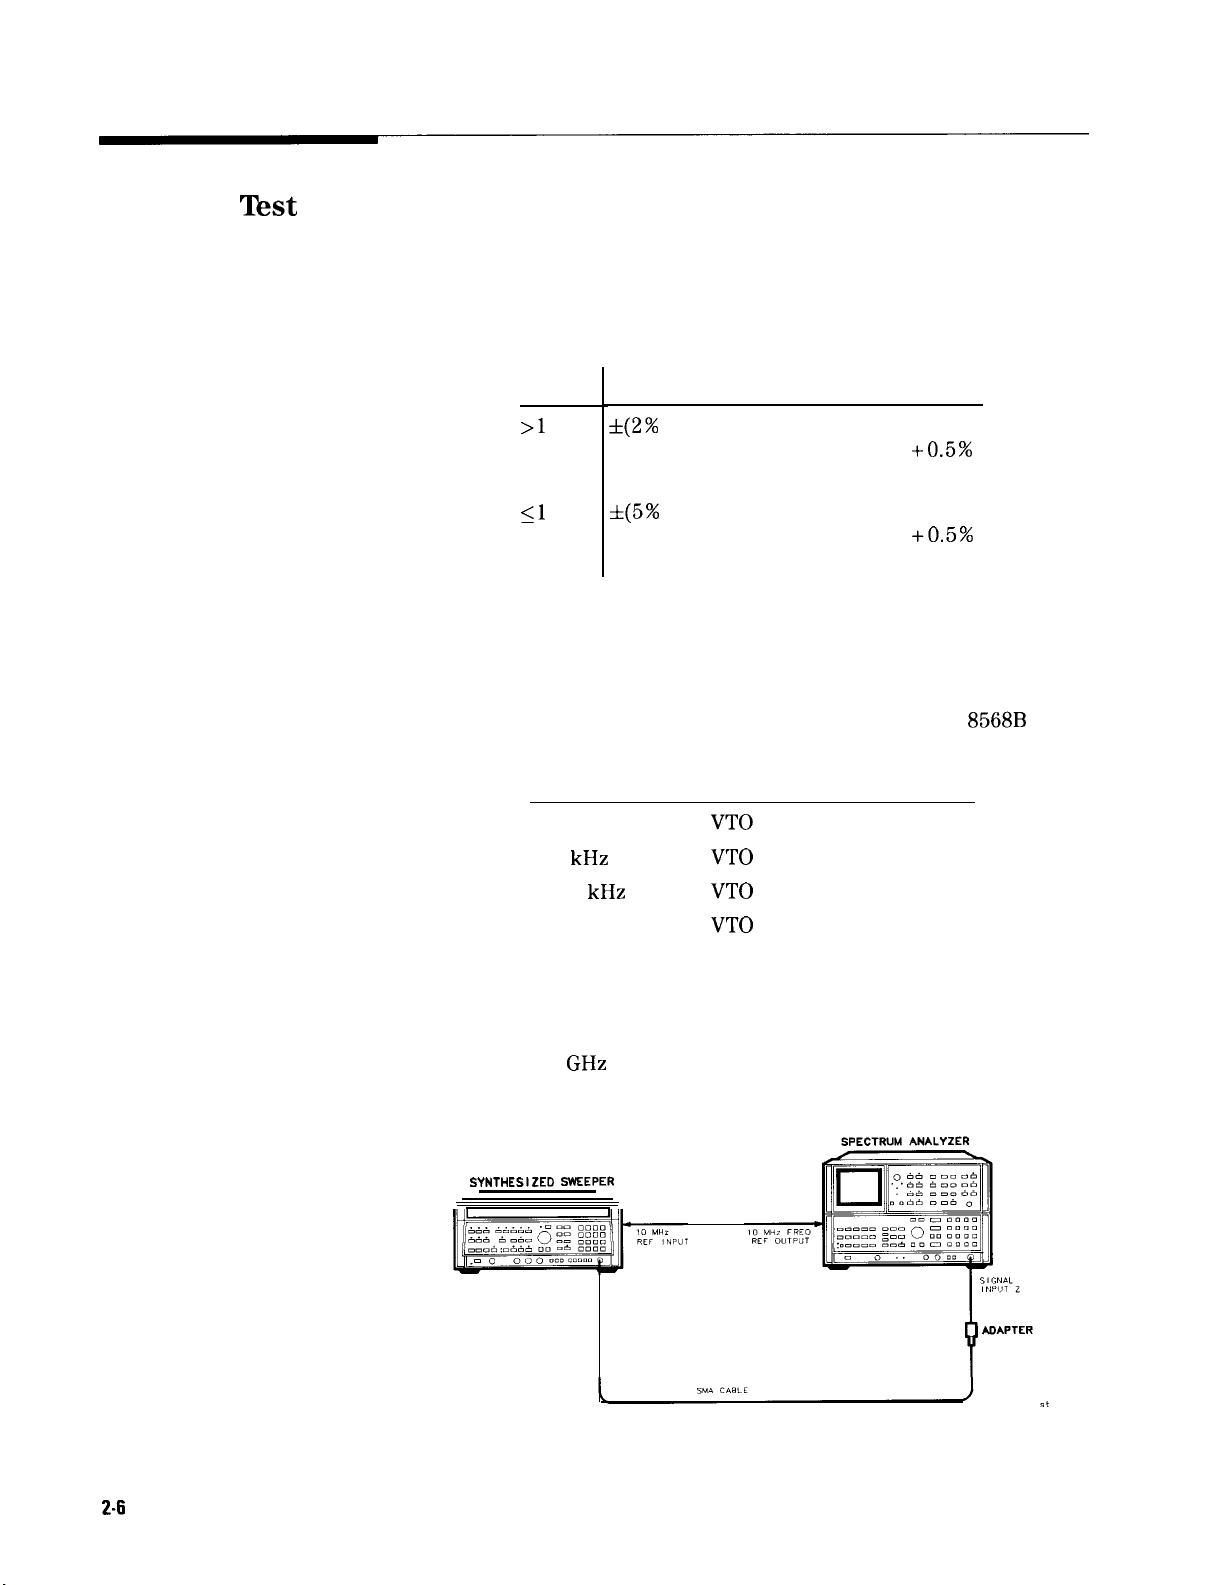
>l
MHz
51 MHz
Frequency Span accuracy is determined by measuring a frequency at
5% of sweep and then at 95% of sweep. These frequencies correspond
to half a division from
The spans chosen are based on the architecture of the HP
hardware:
200 Hz
100
100.1 kHz
1 MHz
1.01 MHz
20 MHz
20.1 MHz
1.5
f(2%
of the actual frequency
separation between two points +0.5%
of span setting)
445%
of the actual frequency
separation between two points +0.5%
of span setting)
each edge of the CRT.
Span
kHz
GHz
Uncertainty
Assembly Being Swept
VT0 Oscillator (low divide)
VT0 Oscillator (low divide)
VT0 Oscillator (high divide)
VT0 Oscillator (high divide)
FM Coil of Yig Oscillator
FM Coil of Yig Oscillator
Main Coil of Yig Oscillator
Main Coil of Yig Oscillator
8568B
RF
2-6
Performance Tests
SYNTHESIZED WEEPER
Figure 2-3. Frequency Span Accuracy Test Setup

2. Frequency Span Accuracy Test
Equipment
Procedure
Synthesized Sweeper.....................................................................
83640A
AdapterTypeN(m) to SMA(f).................................................1250-1250
Cable;SMAconnectors....................................................................
Cable; BNC122cm(48in)............................................................HP
.5061-5458
10503A
1. Connect equipment as shown in Figure 2-3.
2. Press
3. Press [CENTER FREQUENCY] 100 MHz, [FREQUENCY
QNsTR
PRESET]
on analyzer.
SPAN_) 200
Hz.
4. Connect synthesized sweeper tot spectrum analyzer RF input 2.
5. On synthesized sweeper, select external REFERENCE and key in
(jj’
6. Press
0 dBm.
Icw]
and key in 99.999 910 MHz.
7. Press MARKER [PEAK SEARCH) on spectrum analyzer and record
marker reading under FREQ C of
Table
2-3.
8. Set synthesized sweeper frequency to 100.000 090 MHz.
9. Press MARKER
[PEAK SEARCH] and record marker reading under
FREQ D of Table 2-3.
10. Repeat the span measurement procedure of steps 6 through 9 for
each frequency span listed in
Table
2-3.
Spectrun
Frequent y
&an
200Hz
IOOkHz
100.1
kHz
1MHz
1.01 MHz
20MHz
20.1 MHz
1.5
GHz
Analyzer
Center
Frequent y
100
MHz
100MHz
100
MHz
100
MHz
100
MHz
100
MHz
100
MHz
900
MHz
11. Determine the frequency difference between the two measured
points. Enter this value under the A DUT column in
‘fable
2-3.
12. The frequency span error is the difference between A DUT and A
SYNTH. (See table 2-3 for values). Calculate the span error and
record it in
13. Compare the table 2-4
Table
2-4.
spec
to the span error value calculated in
step 12.
lhble
2-3. Wide Span Error
Synthesized
Freq. A
Cf-.45
99.999 910 MHz
99.955 000 MHz
99.954955 MHz
99.550 000 MHz
99.550550MHz
91.000 000 MHz
90.955 000 MHz
225 MHz
span
c
100.000090 MHz
100.045 000 MHz
100.045 045 MHz
100.450000 MHz
100.450500 MHz
109.000000 MHz
109.045.000 MHz
Freq. B
cf +
SweeDer
.45 span
1575 MHz
A Synth
(B-4
180 Hz
90.000 Hz
90.090kHz
900.000kHz
909.000kHz
18.000 MHz
18.090 MHz
1350 MHz
1
I
I
I
I
I I
I
I
I
I
I
I
Performance Tests 2-7

2. Frequency Span Accuracy
Test
Freq Span
r-
1
1.5
GHz
-I-
SDan
ADUT-ASyn
from
‘Ihble
Error
‘Ihble
2-4. Span Error
Min
2-3
-5000
-5,005
-50,000
-23,230
-460,000
-462,300
-34,500.OOO
Spec.
-10
Hz
Hz
Hz
Hz
Hz
Hz
Hz
Hz ]
34,500O.OOO
Max
10
5000
5,005
50,000
23,230
460,000
462,300
-I
Hz
Hz
Hz
Hz
Hz
Hz
Hz
Hz
Note
The specification in Table 2-4 was derived using the following formula:
For spans
For spans 2 1 MHz, the
> 1 MHz, the
spec
is: >*[(.02)(A synth freq) + (.005)(span)]
spec
is:
>&[(.05)(A
synth freq) + (.005)(span)]
2-8 Performance Tests

3. Sweep Time
Accuracy Test
(220
ms)
3. Sweep Time Accuracy Test (220 ms)
Related Adjustment
Specification
Description
Frequency Control Adjustments
*lo%
for sweep times
&20%
for sweep times
Preferred Procedure
This test is for sweep times
Fast Sweep Time Accuracy Test (Test 19).
A universal counter is connected to the PENLIFT RECORDER
OUTPUT (on the rear panel) of the spectrum analyzer. The counter is
used in time interval mode to determine the “pen down” (sweep time)
interval of the PENLIFT RECORDER OUTPUT. The
voltage level corresponds directly to the sweeping of the analyzer
(pen down = OV) and not-sweeping of the analyzer (pen up =
DVM is used to set the appropriate trigger level for the counter.
Alternate Procedure
Perform this procedure if the equipment for the preferred procedure
is unavailable.
Sweep time accuracy for sweep times
using the HP
measurement.
8568B’s
5100
seconds
>lOO
seconds
220
ms. For faster sweep times, refer to
penlift
220
ms can also be measured
internal frequency counter for a time interval
output
15V).
A
SPECTRUM ANALYZER
DIGITAL
Figure 2-4. Sweep Time Accuracy Test Setup
VOLTMETER
UNIVERSAL
COUNTER
\
Performance Tests 2-9

3. Sweep Time Accuracy
Test
(220 ms)
Equipment
Procedure
Sweep Times 220 ms
Universal Counter ..........................................
Digital Voltmeter
...........................................
1. Connect equipment as shown in Figure 2-4.
2. Press [INSTR PRESET) on the spectrum analyzer.
3. Key in the following settings:
(CENTER FREQUENCY)
[FREQUENCY SPAN]
.....................................
...........................................
4. Set up the universal counter as follows:
a. Set all front panel keys in “out” position.
b. Set POWER switch to ON.
c. Set GATE TIME vernier control to 9 o’clock.
d. Set SEPXOM A switch to COM A position.
e. Depress T.I. A + B switch (making sure the blue shift key is
out).
f. Set Channel A trigger level to trigger on negative slope.
HP
HP
500
5316A
3456A
MHZ
0 kHz
g. Set Channel B trigger level to trigger on positive slope.
h. Set both Channel A and Channel B
ac/dc
switches to
de.
i. Connect the digital voltmeter to Channel A TRIGGER LEVEL
OUT. (Be sure to ground the DVM properly.)
j. Adjust Channel A trigger level to set a DVM voltage reading of
0.3 v.
k. Repeat steps i and j for Channel B.
5. Set analyzer @WEEP TIME) to 20 ms. Allow the universal counter
enough time to settle at this sweep time.
2-10
Performance Tests

3. Sweep Time Accuracy Test (220 ms)
+15v
-r-l
ov- ---
START+TI”E
MEASUREMENT
Figure 2-5.
NOTE:PULSE
JI
INTERVAL
WIDTH APPROXIMATE
t-SWEEP RETRACE
t-ACTIVE SNEEP +
MEASUREMENT
Penlift
Output Signal
rl
1 L
STOPhE
INTERVAL
---
6. Note the measured sweep time on the universal counter and
record this value in
Table
2-5. The measured sweep time should
be a value between the minimum and maximum values given in
Table
2-5.
7. Repeat steps 5 and 6 for each sweep time setting in
‘Ihble
2-5.
Sweep Time Accuracy, Sweep Times
220
Table
ms
2-5.
[SWEEP
20
50
100 ms
500
8. Press MARKER
TIME)
ms
ms
ms
1s
450
900
(NORMAL].
Min
18
45
90
Marker A Time
Measured
ms
ms
ms
ms
ms
9. Use @J to place the marker at the second vertical graticule.
10. Press
@FiHIFT),[Xi!FF~.
11. Set analyzer [SWEEP TIME) to 20 s. Allow the universal counter
enough time to settle at this sweep time.
12. Note the measured sweep time on the universal counter and
record this value in Table 2-6. The measured sweep time should
be a value between the minimum and maximum values given in
Table
2-6.
13. Repeat steps 11 and 12 for 200 s sweep time.
Performance Tests
2-11

3. Sweep Time Accuracy Test (220 ms)
‘Ihble
2-6.
Sweep Time Accuracy, Sweep Times
220
s
Sweep Times 220 ms
(Alternate Procedure)
Start-Up Time
Measurement
[SWEEP TIME)
Marker A Time
Min Measured Max
4.4 s
14. Sweep times
20 s 3.6 s
200 s
220
ms are tested without external test equipment
32 s 48 s
by the following procedure.
15. Press
16. Set @WEEP TIME] according to
~NSTR PRESET).
Table
2-7. Press MARKER
Rotate the DATA knob to place the marker on the left edge of the
CRT display. Key in
17. Press
[SHIFT) [REsy
CSHIFT) [my.
three times. The Active Function Block
reads SWEEP GEN followed by a measured sweep time. This is
the start-up time. Record it in
‘Ihble
2-7. The start-up time must
be subtracted from the SWEEP GEN time measured in step 19.
(Adding the start-up time to the
[SWEEP TIME] setting effectively
subtracts it from the SWEEP GEN time.)
18. Press MARKER (OFF).
(j-1.
Sweep Time
Measurement
19. Press
@?i] (REST
three times and note the SWEEP GEN
reading. The limits for the SWEEP GEN reading are listed in
Table
2-7. (For example, assume the start-up time measured in
step 17 was 700
,US
for a [SWEEP TIME) of 20 ms. The limits for the
SWEEP GEN readings would be 19.3 to 22.7 ms.)
20. Repeat steps 16 to 19 for each sweep time shown in Table 2-7.
lhble
2-7.
Sweep Time Accuracy, Sweep Times
220
ms
(Alternate Procedure)
SWEEP
20 ms
50 ms
100 ms
500 ms
1s
10 s
50 s
100 s
150 s
-rIME_)
Min Measured
18.0 ms 22.0 ms
45.0 ms 55.0 ms
90.0 ms
450ms
900
ms
45.0
90.0 ms 10.0 ms
20.0 s 80.0 ms
Sweep Gen Readout
Max
110
ms
550
ms
1.10 ms
9.00 ms 11.0 ms
ms 55.0 ms
2-12 Performance Tests

4. Resolution Bandwidth Accuracy
Test
4. Resolution Bandwidth Accuracy Test
Related Adjustment
Specification
Description
Equipment
Procedure
(For instruments with Option 462, refer to Chapter 4.)
3-dB
Bandwidth Adjustments
&20%,
3 MHz
+lO%, 3 kHz to 1 MHz
&20%
10 Hz to 1 kHz
30 kHz and 100 kHz bandwidth accuracy figures apply only with
190% Relative Humidity, <
40°C.
The 3 dB bandwidth for each resolution bandwidth setting is
measured with the MARKER function to determine bandwidth
accuracy. The CAL OUTPUT is used for a stable signal source.
None Required
1.
Press [INSTR PRESET).
2.
Connect CAL OUTPUT to SIGNAL INPUT 2.
3.
Key in spectrum analyzer setting as follows:
(CENTER FREQUENCY)
FREQUENCY SPAN)
[m)
[REFERENCE LEVEL)
4.
Press SCALE LIN pushbutton. Press
.....................................................
........................................
...........................................
........................................
csHIFT],[my
(resolution
-10 dBm
bandwidth).
5.
Adjust [REFERENCE LEVEL] to position peak of signal trace at
reference level (top) graticule line. Press SWEEP
6.
Press MARKER
[ml
and place marker at peak of signal trace
[SINGLE).
with DATA knob. Press MARKER In] and position movable marker
3 dB down from the stationary marker on the positive-going edge
of the signal trace (the MARKER A amplitude readout should be
-3.00 dB
ho.05 dB).
It may be necessary to press SWEEP
ICONT)
and adjust [CENTER FREQUENCY) to center trace on screen.
7.
Press MARKER
(ZJ
and position movable marker 3 dB down
from the signal peak on the negative going edge of the trace (the
MARKER A amplitude readout should be .OO dB
dB
bandwidth is given by the MARKER A frequency readout (see
Figure 2-6). Record this value in
Table
2-8.
f0.05 dB).
20
MHZ
.5
MHz
3 MHz
The 3
Performance Tests
2-13

4. Resolution Bandwidth Accuracy Test
Figure 2-6. Resolution Bandwidth Measurement
8. Vary spectrum analyzer settings according to
the 3 dB bandwidth for each resolution bandwidth setting by the
procedure of steps 6 and 7 and record the value in
measured bandwidth should fall between the limits shown in the
table.
‘Ihble
2-8. Bandwidth Accuracy
[REW)
3
1 MHz
300
100 kHz
30
10
3
1
300
100 Hz
30
10 Hz
‘FREQUENCY SPAN] MARKER A Readout of 3
1
MHz
kHz
kHz
kHz
kHz
kHz
Hz
Hz
T
5
2
500
200
50
20
5
2
500
200
100 Hz
100 Hz
MHz
MHz
kHz
kHz
kHz
kHz
kHz
kHz
Hz
Hz
Min
2.400
270.0
27.00
2.700
MHz
900 kHz
kHz
90.0 kHz
kHz
9.00 kHz
kHz
800
240
80
24
8
Hz
Hz
Hz
Hz
Hz
‘fable
Measured
2-8. Measure
‘Ihble
3
dl
2-8. The
Bandwidth
Max
3.600
1.100 MHz
330.0
33.00
3.300
MHz
kHz
110.0 kHz
kHz
11.00 kHz
kHz
1.200 kHz
360
Hz
120 Hz
36
Hz
12 Hz
2-14 Performance Tests


5. Resolution Bandwidth Selectivity Test
6. Read the 60 dB bandwidth for the 3 MHz resolution bandwidth
setting from the MARKER A frequency readout (see Figure 2-7)
and record the value in
7. Vary spectrum analyzer settings according to Table 2-9. Measure
the 60 dB bandwidth for each resolution bandwidth setting by the
procedure of steps 4 through 6 and record the value in
Table
2-9.
‘fable
2-9.
8. Record the 3 dB bandwidths from
Table
2-8 in
Table
2-9.
9. Calculate the bandwidth selectivity for each setting by dividing
the 60 dB bandwidth by the 3 dB bandwidth. The bandwidth
ratios should be less than the maximum values shown in
‘fable
2-9.
10. The 60 dB bandwidth for the 10 Hz resolution bandwidth setting
should be less than 100 Hz.
2-16 Performance Tests
Figure 2-7. 60 dB Bandwidth Measurement

5. Resolution Bandwidth Selectivity Test
‘lhble
2-9. Resolution Bandwidth Selectivity
Spectrum Analyzer
RES]
(FREQUENCY SPAN)
@iiFSE]
3 MHz 20 MHz 100 Hz
1 MHz
300
kHz
100
kHz
30 kHz500 kHz
10
3 kHz 50 kHz
1
300 Hz 5 kHz
100 Hz
30 Hz 500 Hz
10 Hz 100 HZ
15 MHz
5 MHz
2 MHz
kHz200 kHz
kHz 10 kHz
2 kHz
300 Hz
AUTO
AUTO
AUTO
AUTO
AUTO
AUTO
AUTO
AUTO
AUTO
AUTO
Measured Measured
3
6OdB
dB
Bandwidth
Selectivity Selectivity Ratio
Bandwidth Bandwidth (60 dB BW
3dBBW)
60 dB points separated by
+
cl00
Maximum
15:l
15:l
15:l
15:l
13:l
13:l
13:l
11:l
11:l
11:l
11:l
Hz
Performance Tests 2-17
6. Resolution Bandwidth Switching Uncertainty Test
(For instruments with Option 462, refer to Chapter 4.)
Related Adjustments
Specification
Description
Equipment
Procedure
3 MHz Bandwidth Filter Adjustments
21.4 MHz Bandwidth Filter Adjustments Down/Up Converter
Adjustments
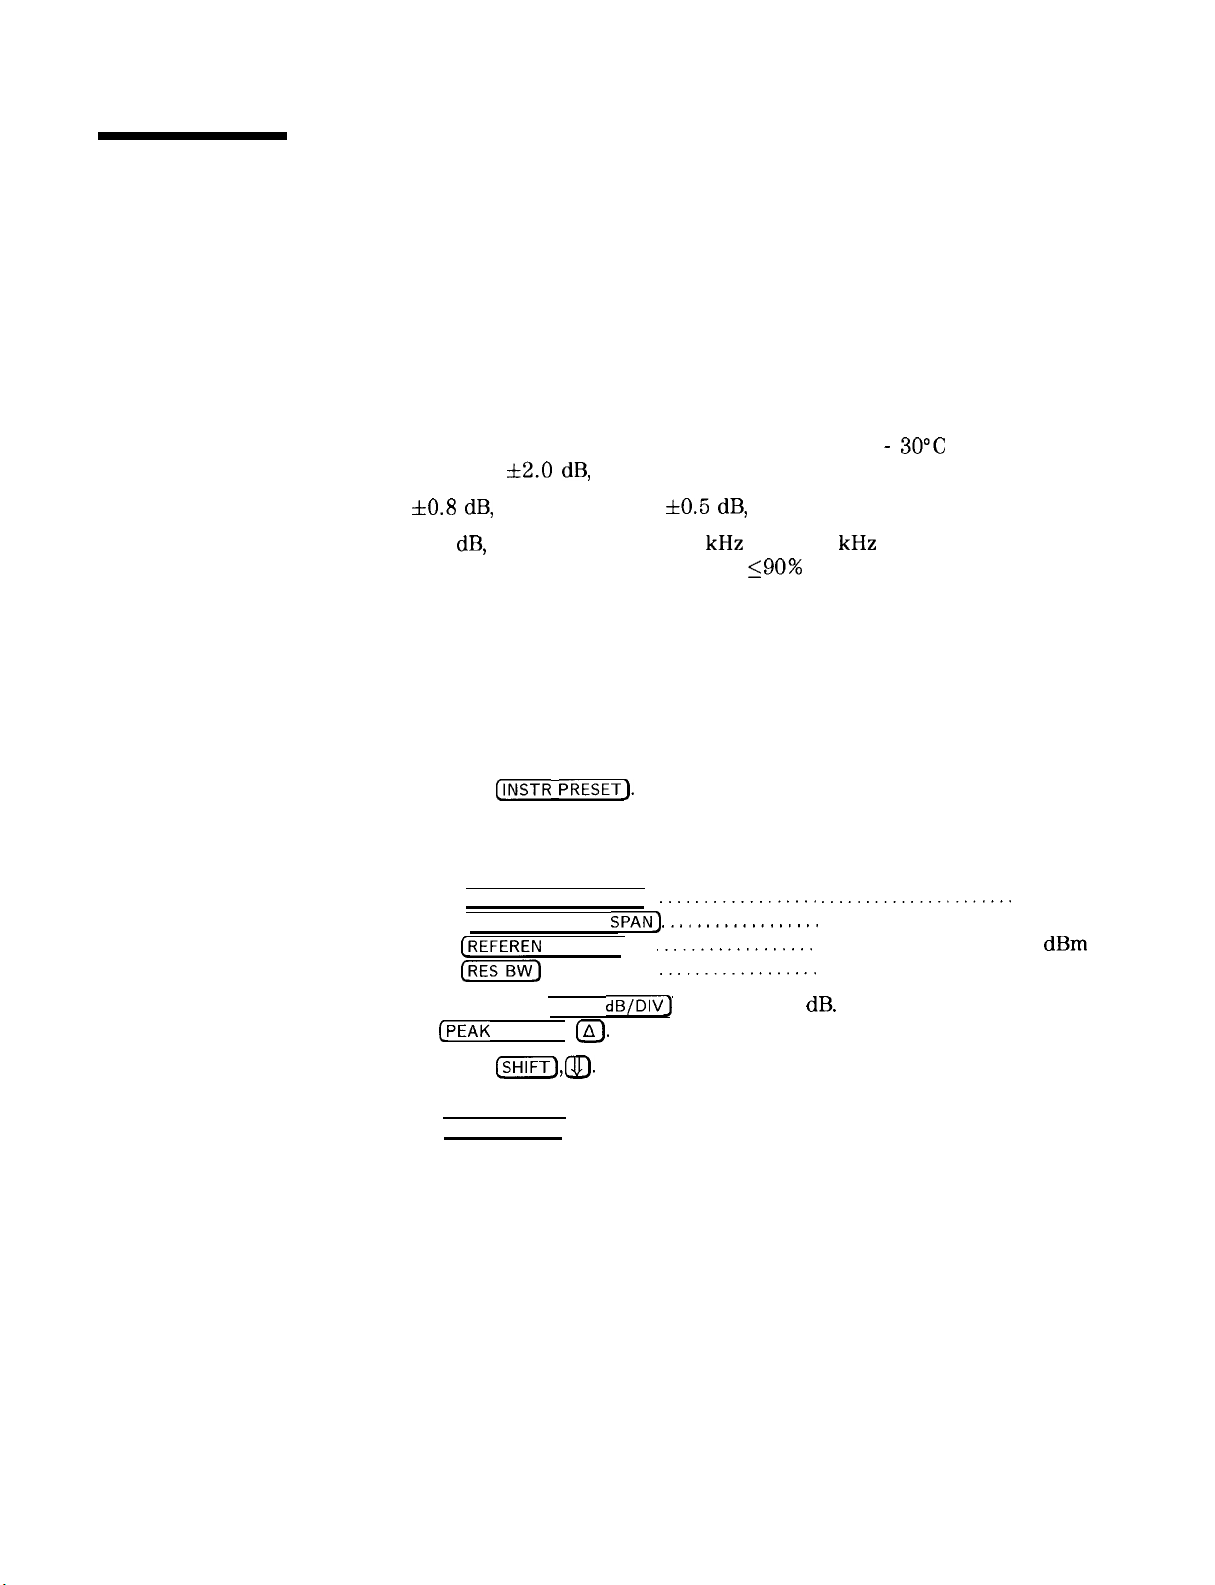
(uncorrected; referenced to 1 MHz bandwidth; 20 warm-up)
f0.8 dB,
fl.O
k2.0 dB,
30 Hz bandwidth
dB,
3 MHz bandwidth 30 kHz and 100 kHz bandwidth switching
10 Hz bandwidth
*0.5 dB,
100 Hz to 1 MHz bandwidth
30°C
after 1 hour
uncertainty figures only applicable 190% Relative Humidity
The CAL OUTPUT signal is applied to the input of the spectrum
analyzer. The deviation in peak amplitude of the signal trace is then
measured as each resolution bandwidth filter is switched in.
None Required
1.
Press (INSTR PRESET).
Connect CAL OUTPUT to SIGNAL INPUT 2.
2.
Key in the following control settings:
3.
(CENTER FREQUENCY)
[FREQUENCY SPAN]
REFERENCE LEVEL]
&sTE,
..................
..................
..................
..................
......................
.......................
......................
.......................
20
5
-8
1
MHz
MHz
dBm
MHz
2-18 Performance Tests
Press LOG (ENTER
4.
[PEAK SEARCH)
Press
5.
6.
m,@J
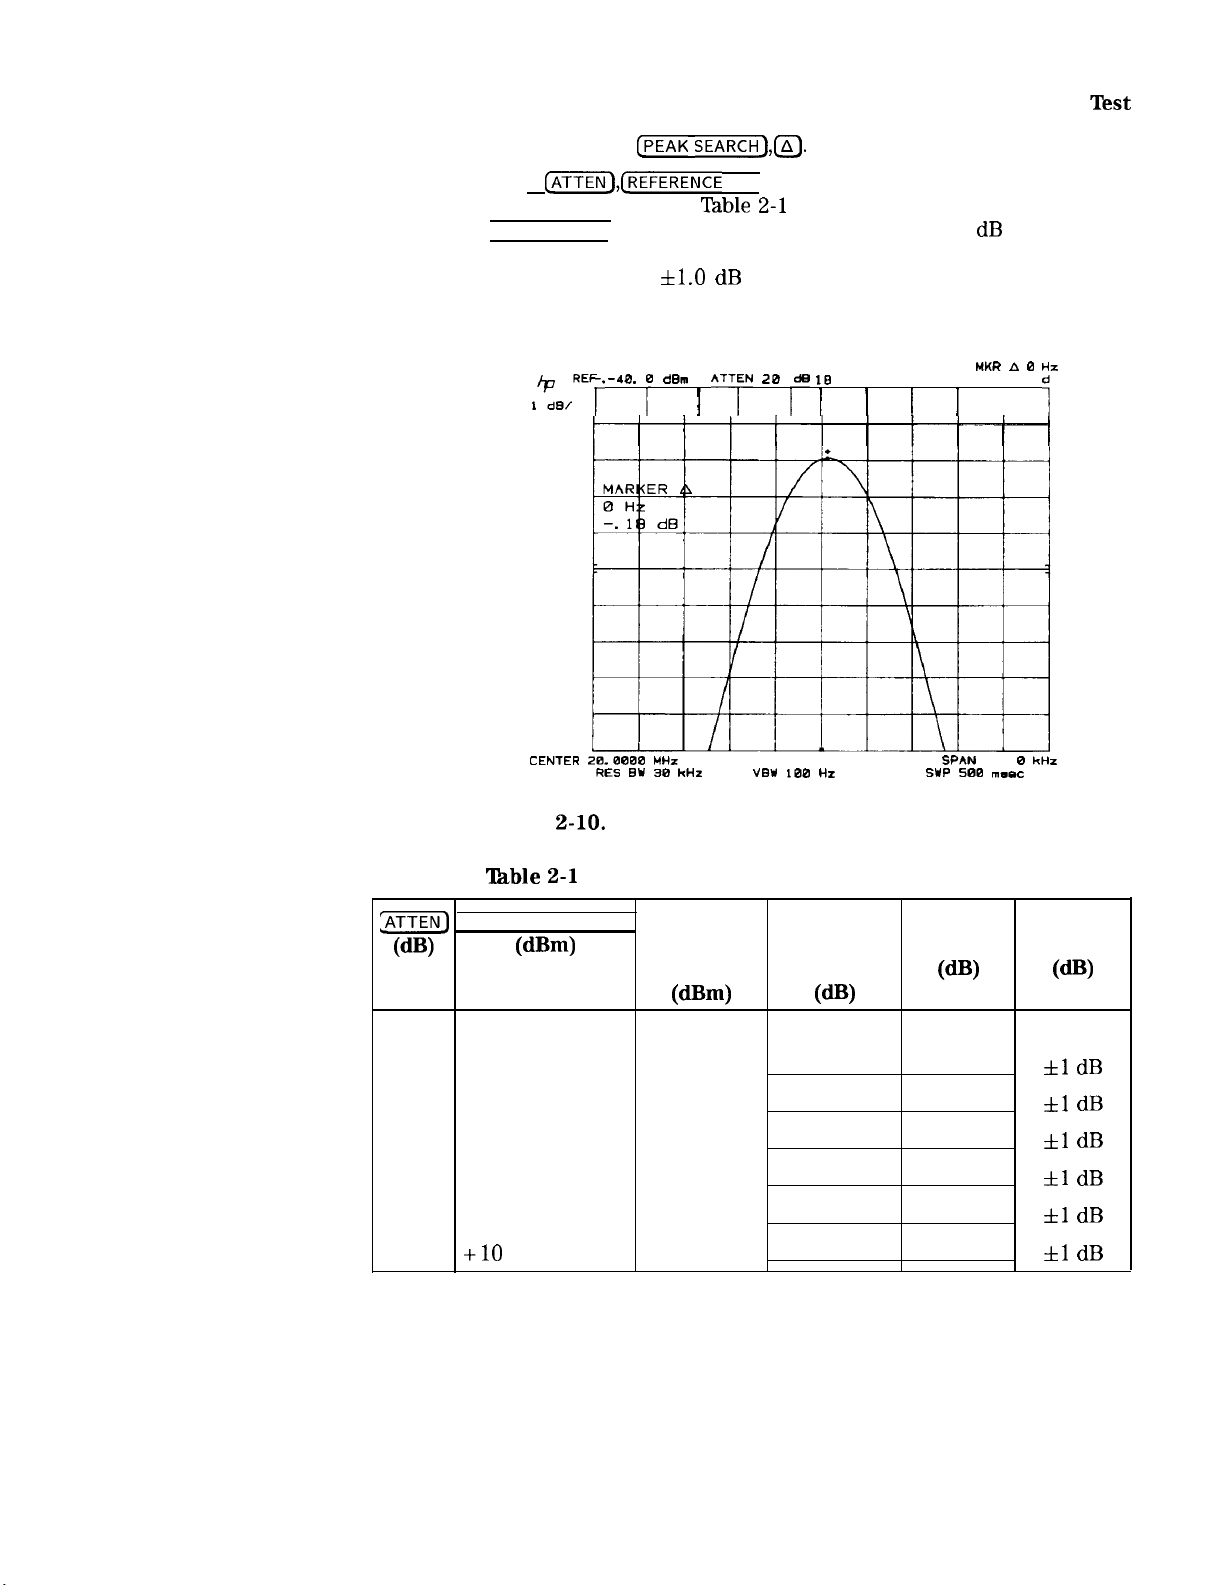
Key in settings according to Table 2-10. Press MARKER
[PEAK SEARCH] at each setting, then read the amplitude deviation
a.
dB/bIvj
and key in 1
dB.
Press MARKER
from the MARKER A readout at the upper right of the display (see
Figure 2-8). The allowable deviation for each resolution bandwidth
setting is shown in the table.

6. Resolution Bandwidth Switching Uncertainty Test
Figure 2-8. Bandwidth Switching Uncertainty Measurement
‘Ihble
2-10. Bandwidth Switching Uncertainty
1 MHz
5 MHz
3 MHz 5 MHz
300 kHz
100
kHz 500 kHz
5 MHz
30 kHz 500 kHz
10 kHz 50 kHz
3 kHz 50
1
kHz 10
300 Hz 1
100 Hz
1
30 Hz 200 Hz
10 Hz 100 Hz
kHz
kHz
kHz
kHz
Deviation
(MKR A
Readout,
0 (ref)
dB)
Allowable
Deviation
(dB)
0 (ref)
IlIl.00
Zto.50
Ito.
Ito.
f0.50
f0.50
Ito.
dZo.50
Ito.
f0.80
f2.00
Performance Tests
2-l
9

7. Input Attenuator Switching Uncertainty
Test
6. Press MARKER
7. Set
[~~J’JREFERENCE
amplitude according to
(PEAK SEARCH) and record the deviation from the 10
CPEAK SEARCH),(KJ
LEVEL], and frequency synthesizer
Table 2-l
1. At each setting, press MARKER
dB
setting from
the MARKER A amplitude readout (see Figure 2-10). The deviation
should not exceed
~Sl”‘i
r’
*l.O dB
-40. i
dBm l
IB
at any setting.
ATTi” 20 ,dB ,
, , ,
HKR A
0
Hz
i
Figure
‘Ihble 2-l
Lz)
10
20
30
40
50
[REFERENCE LEVEL) Frequency
-50
-40
-30 -32
-20
-10 -12
60 0
70
+lO
CENTER
Wm)
28.0000
2-10.
RES
MHz
BY30
kHz
VBW
100 Hz SVP 500
SPAN
Attenuator Switching Uncertainty Measure]
1. Input Attenuator Switching Uncertainty
Deviation Corrected Allowable
Synthesizer (MARKER A Deviation Deviation
Amplitude Amplitude
Wm)
-52
0
(W
(ref)
WV
0
(ref)
-42
-22
-2
8
100.
n3mP.z
0
ktiz
nent
(9
fl
dB
fl
dB
fl
dB
fl
dB
fl
dB
fl
dB
Performance Tests 2-21

8. Frequency
Response Test
Related Adjustment
Specification
Description
SYNTHESIZED SWEEPER
Slope Compensation Adjustment
SIGNAL INPUT 1
~tl.5 dB,
*I dB,
100 Hz to 1.5
GHz
100 Hz to 500 MHz
SIGNAL INPUT 2
fl dB,
100 kHz to 1.5
GHz
Frequency response at both analyzer inputs is tested by slowly
sweeping a flat signal source over the frequency range and observing
the peak-to-peak variation in trace amplitude. The test is divided into
three parts. First, the response is tested from 20 MHz to 1.5
GHz
with a power-meter-leveled synthesized sweeper. Next, a frequency
synthesizer is used to check the response from 100 kHz to 20 MHz.
Finally, SIGNAL INPUT 1 is tested from 100 Hz to 100 kHz with a
function generator.
SPECTRUM ANALYZER
POWER METER
I
OPTION 001. ADD 50
Figure 2-11. Frequency Response Test Setup (20 MHz to 1.5
I
OHMS/75
RECORDER
OUTPUT
I I
OHM PAD AND ADAPTER
POWER SENSOR
GHz)
.\
I
ADA,PT,ERS
\I
I
GNAL
NPUT
gb12b
2-22 Performance Tests
8. Frequency Response Test
Note
Equipment
Procedure
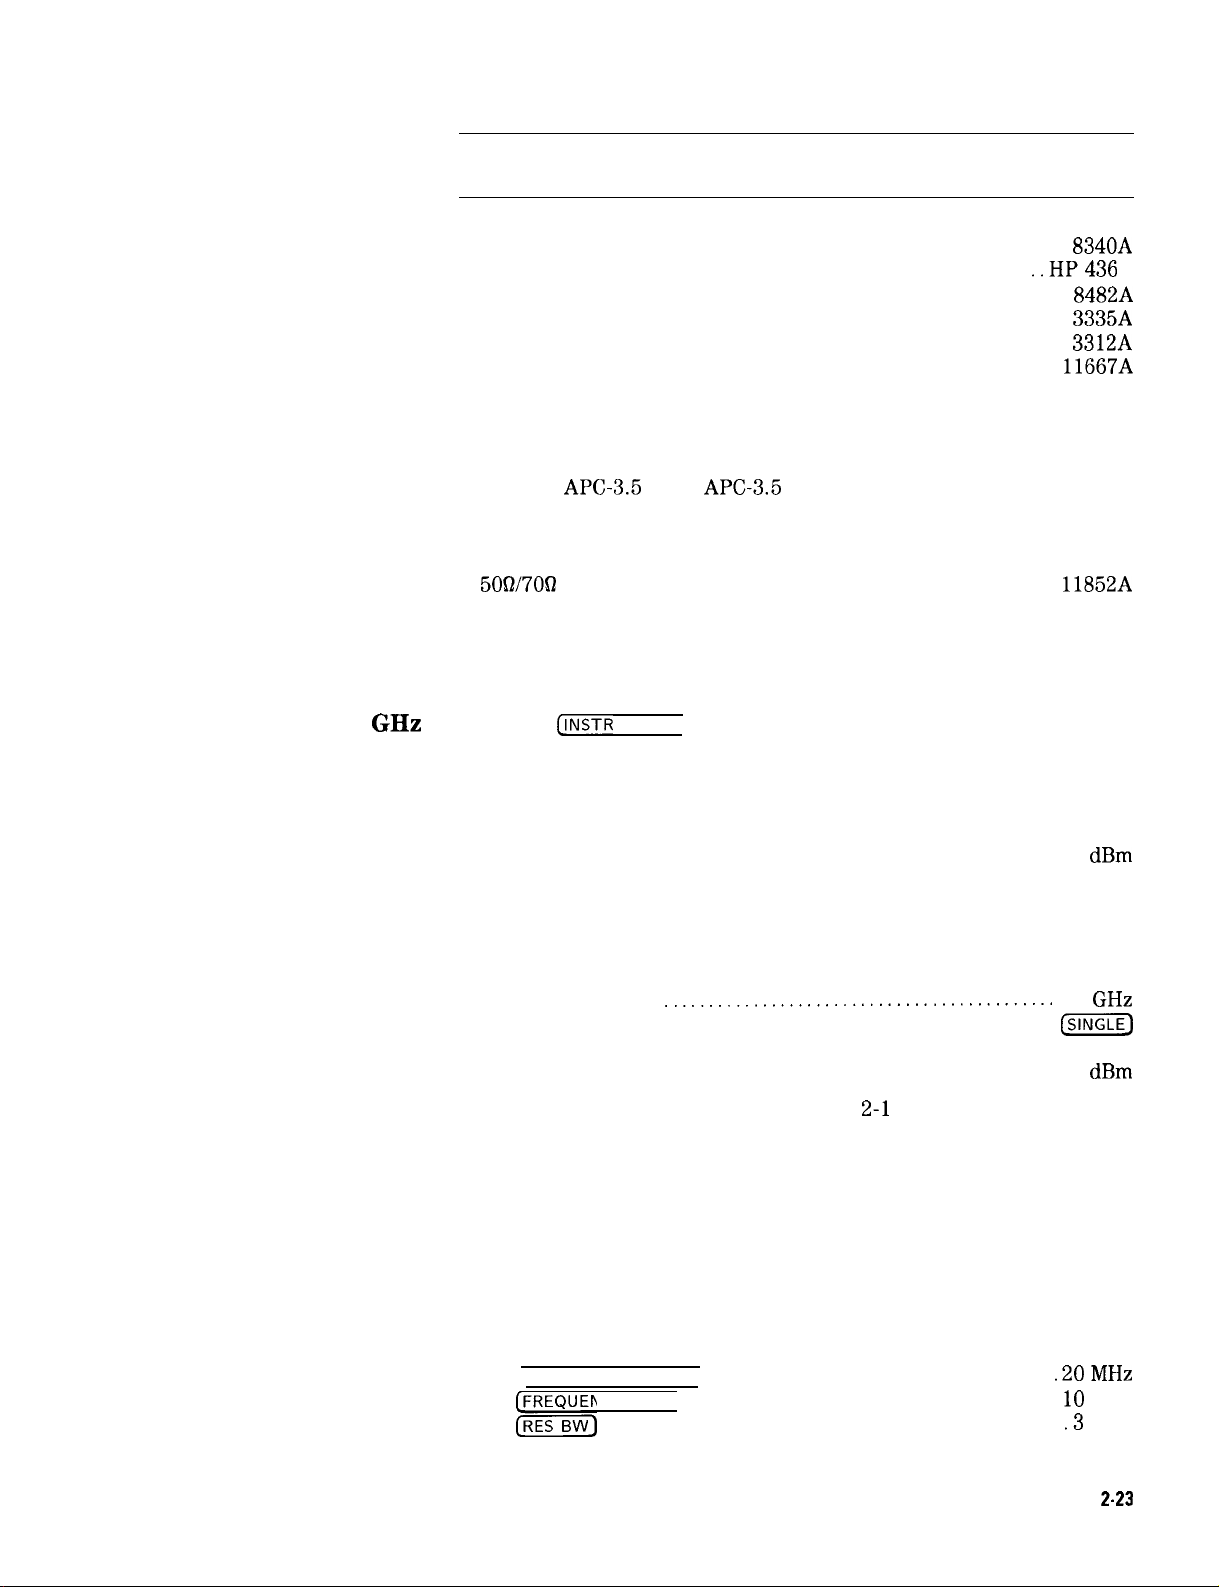
20 MHz to 1.5
GHz
Equipment listed is for three test setups, Figure 2-11, Figure 2-13, and
Figure 2-15.
Synthesized Sweeper .......................................
Power Meter
Power Sensor
...............................................
...............................................
Frequency Synthesizer .....................................
Function Generator ........................................
Power Splitter
.............................................
Adapter, Type N (m) to BNC (f) ........................
Adapter, Type N (m) to BNC (m) .......................
Adapter, Type N (m) to Type N (m)
Adapter, Type N (m) to SMA (f)
Adapter, APC-3.5 (f) to APC-3.5 (f)
....................
........................
....................
Cable, SMA Connectors ................................
HP
8340A
..HP436
HP
8482A
HP
3335A
HP
3312A
HP
11667A
HP 1250-0780
HP 1250-0082
HP 1250-0778
HP 1250-1250
HP 1250-1749
HP 5061-5458
Additional Equipment for Option 001:
5OfY700
Adapter, Type N (f) to BNC (m) (7561)
1.
Minimum Loss Pad ...............................
..................
HP
HP 1250-1534
Press ~NSTR PRESET) on spectrum analyzer and synthesized
11852A
sweeper.
A
2.
Set controls as follows:
Power Meter
MODE
RANGE HOLD
CAL FACTOR %
. . . . . dBm
. . . OFF
. . . 100
Synthesized Sweeper
START FREQ
STOP FREQ
SWEEP
SWEEP TIME
POWER LEVEL
3.
Connect equipment as shown in Figure
...........................................
............................................
.................................................
.............................................
......................................
2-l
1. The RECORDER
0.00 dBm
OUTPUT on rear panel of power meter is connected to LEVELING
EXT INPUT of the synthesized sweeper. One output arm of the
power splitter is connected directly to SIGNAL INPUT 2 of the
spectrum analyzer via the N-to-N adapter. The power sensor
connects directly to the other splitter output.
4.
Depress RANGE HOLD button on power meter.
5.
Select METER leveling on synthesized sweeper.
6.
Key in the following spectrum analyzer settings:
20 MHz
1.5
GHz
[-)
120 s
[CENTER FREQUENCY)
FREQUENCY SPAN]
km)
............................................................................................
......................................
Performance Tests
.20
10
.3
MHZ
MHz
MHz
2.23
8. Frequency Response Test
Adjust POWER LEVEL on synthesized sweeper (using data knob)
7.
to place peak of 20 MHz signal near reference level (top) graticule
line.
Press
[ENTER
8.
dB/mv],
1
dB
on spectrum analyzer. Adjust POWER
LEVEL on synthesized sweeper to position peak of signal 2
divisions below the reference level line.
Key in the following spectrum analyzer settings:
9.
START FREQ)
km)
Press TRACE A
10.
Press SWEEP SINGLE on the synthesized sweeper.
11.
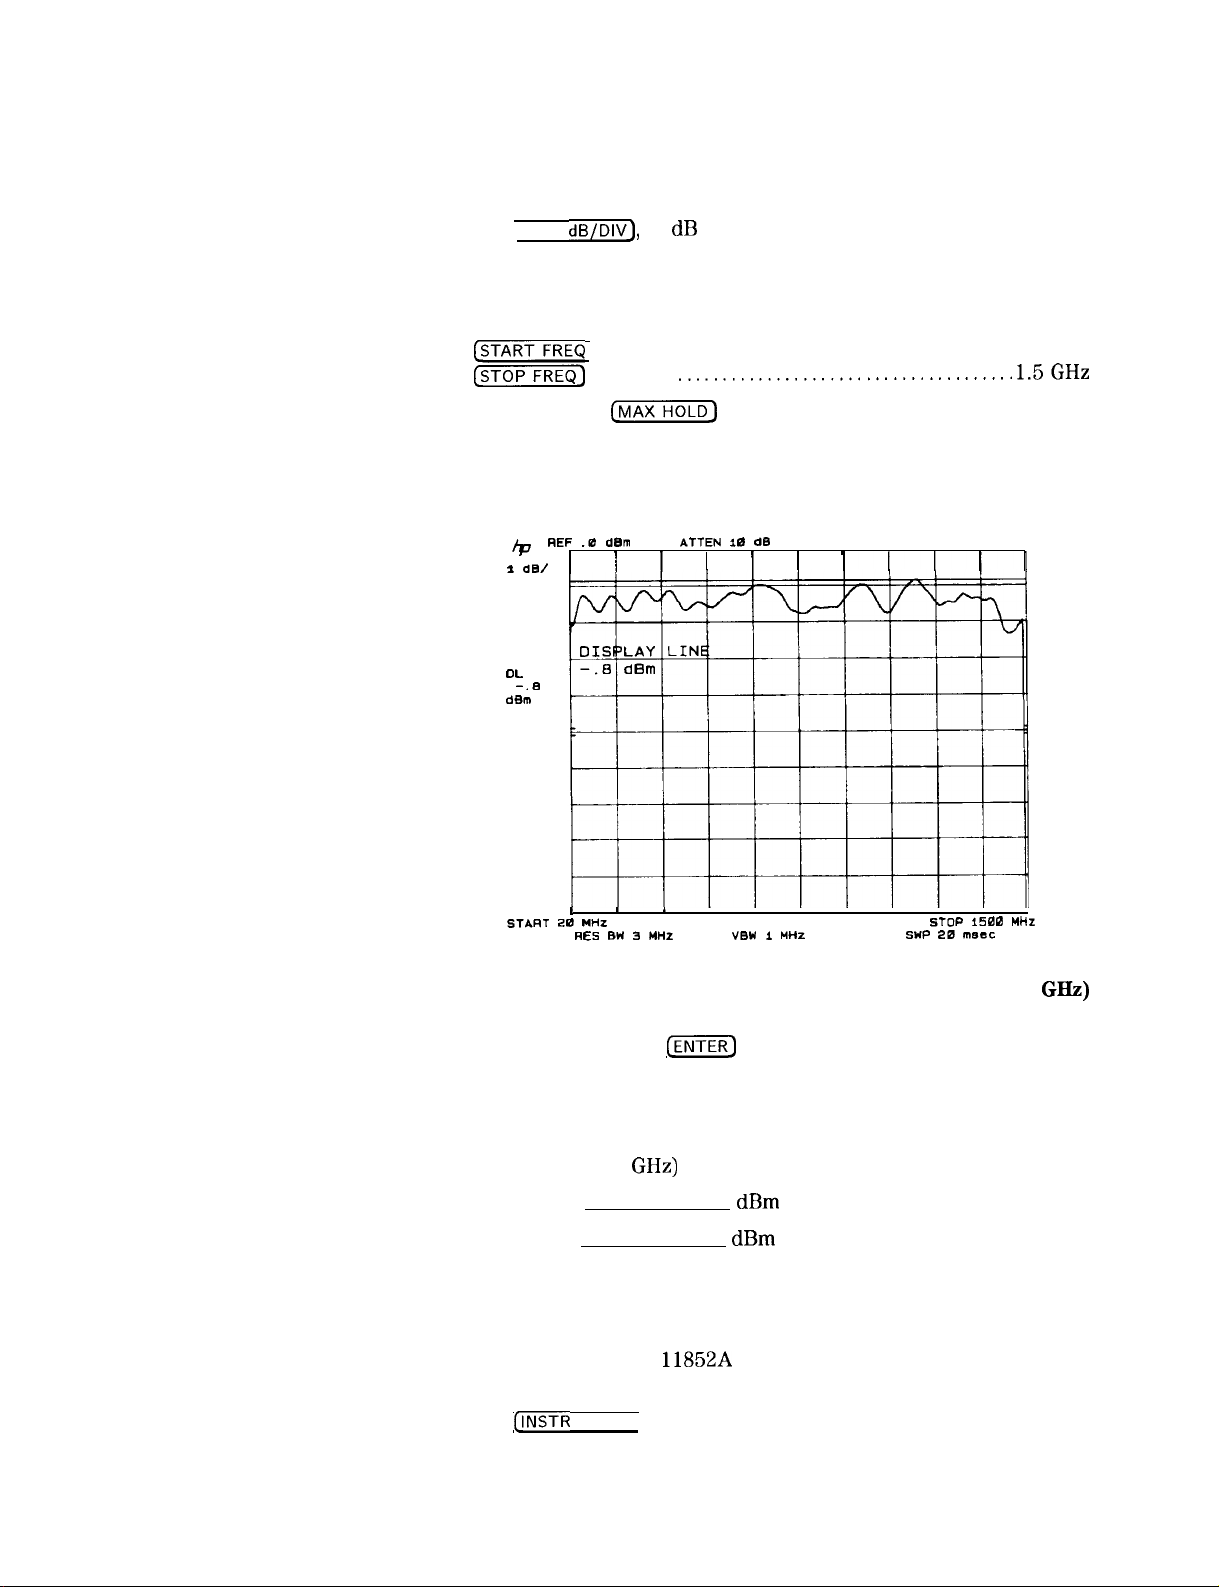
rp
I dB/
DL
-.B
dBm
START 20 nnz
. . . . . . . . . . . . . . . . . . . . . . . . . . . . . . . . . . . . . . . . . . . . . .
. . . . . . . . .
REF .0
darn
,
RES BW
[MAX)
I
..__..................................
on the analyzer.
ATTEN
10
dB
I
3
Mnt
VBW 1 MHZ
I
STOP 1500 MHZ
SWP 20
mssc
20.MHz
1.5GHz
2-24 Performance Tests
Figure 2-12. Frequency Response Measurement (20 MHz to 1.5
12. Press DISPLAY LINE
[ENTER)
on the spectrum analyzer. Use the
GHz)
Display Line to measure the maximum and minimum points on the
trace. Record measurements below.
SIGNAL INPUT 2
(20 MHz to 1.5
Maximum
Minimum
GHz)
dBm
dBm
13. To check SIGNAL INPUT 1, use the type N male to BNC male
adapter to connect the power splitter directly to SIGNAL INPUT
1.
Option 001: Use HP
11852A
Minimum Loss Pad and adapters
between splitter and spectrum analyzer input.
14. Press
[INSTR PRESET) on spectrum analyzer, then activate SIGNAL
INPUT 1 with the pushbutton.

8. Frequency Response Test
Option 001: Set [REFERENCE LEVEL] TO -6.0 dBm.
100
kHz
to 20 MHz
15. Repeat steps 6 through 11. Press DISPLAY LINE
[ENTER)
spectrum analyzer. Use the Display Line to measure the maximum
and minimum points on the trace. Record measurements below.
SIGNAL INPUT 1
(20 MHz to 1.5
Maximum
Minimum
16. Press MARKER
MHz. Press DISPLAY LINE
(-1
GHz)
dBm
dBm
on spectrum analyzer. Set marker to 500
(ENTER]
on the spectrum analyzer. Use
the Display Line to measure the maximum and minimum points
between 20 MHz and 500 MHz. Record measurements below.
SIGNAL INPUT 1
(20 MHz to 500
Maximum
Minimum
GHz)
dBm
dBm
17. Set the frequency synthesizer controls as follows:
FREQUENCY
SWEEP WIDTH
AMPLITUDE
.............................................
.........................................
.............................................
(Option 001: + 4 dBm)
on the
20 MHz
19.9 MHz
-2 dBm
OPTIOW 001: MO
Figure 2-13. Frequency Response Test Setup (100
18. Connect equipment as shown in Figure 2-13. The output of the
frequency synthesizer should be connected to SIGNAL INPUT 1.
Option
SPECTRUM ANALYZER
8IHIAL
INPUT
i
I
l-f
80 oHMa/ 78 ON88 PM AW AIDAPTUII
19. Press ~NSTR PRESET) on the spectrum analyzer. Activate SIGNAL
INPUT 1 with the pushbutton.
001:
Use HP 11852 Minimum Loss Pad and adapters.
FREQUENCY SYNTHESIZER
#IONAL
IaPuT P
I
ADAPTER
kHz
to 20 MHz)
20. Key in the following spectrum analyzer settings:
Performance Tests 2-25


8. Frequency Response
Test
25. After completion of sweep, press DISPLAY LINE
(j?KiK]
on the
spectrum analyzer. Use the Display Line to measure the maximum
and minimum points on the trace. Record the measurements
below.
SIGNAL INPUT 1
(100 kHz to 20 MHz)
Maximum dBm
Minimum dBm
26. Measure and record signal level at start of trace (100
kHz).
SIGNAL INPUT 1
(100
kHz)
dBm
27. Connect output of frequency synthesizer to SIGNAL INPUT 2.
Activate this input with the pushbutton.
Option 001. Do not use HP
11852A
Minimum Loss Pad. Set
frequency synthesizer output amplitude to -2 dBm.
28. Press TRACE A
CCLEAR-WRITE)
and DISPLAY LINE
(OFF)
on
spectrum analyzer.
29. Set frequency synthesizer FREQUENCY to 20 MHz. Set spectrum
analyzer (CENTER FREQUENCY_) to 20 MHz, and (FREQUENCY SPAN) to
1 MHz.
30. Repeat steps 22 through 24.
31. After completion of sweep, press DISPLAY LINE
[ENTER]
spectrum analyzer. Use the Display Line to measure the maximum
and minimum points on the trace. Record the measurements
below.
SIGNAL INPUT 2
(100 kHz to 20 MHz)
Maximum
Minimum
dBm
dBm
Figure 2-15.
Frequency Response
Test
Setup (100 Hz to 100
on the
k=)
Performance Tests
2-27

8. Frequency Response Test
100Hzto
100
kHz
Press (INSTR PRESET) on the spectrum analyzer. Activate SIGNAL
32.
INPUT 1.
Key in the following spectrum analyzer settings:
33.
START FREQ) . . . .
;&TEq
Connect equipment as shown in Figure 2-15 with function
34.
.._..............................
. . . . . . . . . . . . . . . . . . . . . . . . . . . . . . . . . . . . . . . .
...........
.........
generator to SIGNAL INPUT 1.
Set the function generator controls as follows:
35.
LINE . . . . . . . . . . . . . . . . . . .. . . . . . .. . . . . . . . . . . . . . . . . . . . ON
RANGE Hz . . . . . . . . . . . . . . . . . . . . . . . . . . . . . . . . . . . . . . . . . . 10 K
FUNCTION . . . . . . . . . . . . . . . . . . . . . . . . . . . . . . . . . . . . . . . . . . . . .
OFFSET . . . . . . . . . . . . . . . . . . . . . . . . . . . . . . . . . . . . . CAL (button in)
AMPLITUDE . . . . . . . . . . . . . . . . . . . . . . . . . . . . . . . . . . . . . . . . . . . 1 V
AMPLITUDE VERNIER . . . . . . . . . . . . . . . . . . . . . . . . . . . . . . midrange
SYM . . . . . . . . . . . . . . . . . . . . . . . . . . . . . . . . . . . . . . . . . . . . . . . . . CAL
TRIGGER PHASE . . . . . . . . . . . . . . . . . . . . . . . . . . . . . . . . FREE RUN
MODULATION
. . . . . . . . . . . . . . . . . . . . . . . . . . . . . . . . . . . . . . . all out
MODULATION RANGE Hz . . . . . . . . . . . . . . . . . . . . . . . . . . . . . . . . I
MODULATION RANGE Hz VERNIER .......fully CCW
MODULATION SYM
Percent Modulation
Adjust function generator FREQUENCY to place signal between
36.
. . . . . . . . . . . . . . . . . . . . . . . . . . . . . . . . . . . . CAL
. . . . . . . . . . . . . . . . . . . . . . . . . . . . . . . . . . .
the last two graticule lines (right side) on the signal analyzer
display.
100
.. . . fully
1
kHz
kHz
CW
-
Adjust AMPLITUDE VERNIER on the function generator until
37.
the peak of the signal is at the reference graticule line on the
spectrum analyzer display.
Press LOG
38.
DISPLAY LINE
CENTER
[ENTER]
dB/DIv_) 1
dB
on the spectrum analyzer. Press
and set the Display Line to the level
recorded for 100 kHz in step 25.
Adjust function generator AMPLITUDE VERNIER to place peak of
39.
signal at the Display Line.
Adjust FREQUENCY on the function generator to position the
40.
signal trace at the right edge of the spectrum analyzer display
(last graticule line).
Press MODULATION SWP on the function generator and allow the
41.
function generator to make at least two complete sweeps. Press
TRACE A [MAX HOLD). Allow the function generator to make one
complete sweep. After completion of the sweep, press TRACE A
m).
2.28
Performance Tests

8. Frequency Response
Test
42. Press DISPLAY LINE
[ENTER]
on the spectrum analyzer. Use the
Display Line to measure the maximum and minimum points on
the trace. (Disregard LO Feedthrough at 1
kHz.) Record the
measurements below.
SIGNAL INPUT 1
(1
kHz to 100 kHz)
Maximum dBm
Minimum dBm
43. Set Display Line to peak of trace at 1 kHz.
44. Key in the following spectrum analyzer settings:
TRACE A
(CLEAR-WRITE)
. . . . . . . . . . . . . . . . . . . .
45. Set function generator controls as follows:
RANGE Hz . . . . . . . . . . . . . . . . . . . . . . . . . . . . . . . . . . . . . 100 (button)
FREQUENCY . . . . . . . . . . . . . . . . . . . . . . . . . . . . . . . . . . . . . . . . . . . 10
MODULATION. . . . . . . . . . . . . . . . . . . . . . . . . . . . . . . . . . . . . . . . . . . ..all out
46. Adjust function generator FREQUENCY as necessary to place
signal near center graticule line and adjust AMPLITUDE VERNIER
to place peak of signal at Display Line.
.l
1
iO0
kHz
kHz
Hz
47. Key in the following spectrum analyzer settings:
FREQUENCY SPAN) . . . . . . . . . . . . . . . . . . . . . . . . . . . . . . . . . . . . . 100 Hz
48.
&TT!,
Set (CF
(CENTER
. . . . . . . . . . . . . . . . . . . . . . . . . . . . . . . . . . . . . . . . . . . . . . 30 Hz
STEP SIZE] to 100 Hz. Step spectrum analyzer
IEQUENCY]
FF
from 1 kHz to 100 Hz with
a,
function generator FREQUENCY to match spectrum analyzer
center frequency at each step. Record level-at each setting.
SIGNAL
1000 Hz
INPUT
1
dBm
900 Hz dBm
800 Hz dBm
700 Hz dBm
600 Hz dBm
500 Hz dBm
400 Hz dBm
300 Hz dBm
200 Hz dBm
100 Hz
dBm
while setting
Performance Tests 2-29

8. Frequency Response Test
49. For each input, subtract the lowest minimum level (greatest
negative) from the highest maximum (least negative)
measurement recorded in steps indicated. The result should not
exceed 2
dB.
SIGNAL INPUT 1
100 Hz to 500 MHz (from steps 16, 25, 42, or 48)
Spec: ~2
dB
Overall Maximum dBm
-Overall Minimum dBm
Overall Deviation dBm
SIGNAL INPUT 2
100 kHz to 1.5
Spec: ~2
Overall Maximum
dB
GHz
(from steps 12 or 31)
dBm
-Overall Minimum dBm
Overall Deviation
dBm
50. Subtract the lowest minimum level (greatest negative) from the
highest maximum (least negative) measurement recorded in steps
indicated. The result should not exceed 3
dB.
SIGNAL INPUT 1
100 Hz to 1.5
GHz
(from steps 15, 16, 25, 42, or 48)
2.30
Performance Tests
Spec: ~3
dB
Overall Maximum
-Overall Minimum
Overall Deviation
dBm
dBm
dBm


9. RF Gain Uncertainty Test
h
/I
Figure 2-16. RF Gain Uncertainty Measurement
1 I
I\ I
-
2-32 Performance Tests

10. IF Gain
Uncertainty Test
10. IF Gain Uncertainty
Test
Related Adjustments
Specification
0 dBm to -55.9 dBm Res BW
-56.0 dBm to -129.9 dBm
Description
Step Gain and 18.4 MHz Local Oscillator Adjustments
21.4 MHz Bandwidth Filter Adjustments
Assuming the internal calibration signal is used to calibrate the
reference level at -10 dBm and the input attenuator is fixed at 10
dB,
any changes in reference level from the -10 dB setting will contribute
to IF gain uncertainty as shown:
Range
Uncertainty (uncorrected; 20 -
Res BW
230
230
Hz,
Hz,
f0.6 dB;
f1.0 dB;
Res BW = 10 Hz,
Res BW = 10 Hz,
30°C)
h1.6 dB
f2.0 dB
The IF gain steps are tested over the entire range from 0 dBm to
-129.9 dBm using an RF substitution method. The 10
dB,
2
dB,
and
0.1 dB steps are compared against a calibrated signal source provided
by an HP
SIGNAL GENERATOR
3335A
Frequency Synthesizer.
SPECTRUM ANALYZER
RF OUTPUT
ADAPTER
STEP ATTENUATOR
HP
355CbHE9
--
STEP ATTENUATOR
HP
355C-HZ5
Figure 2-17. IF Gain Uncertainty
Test
SIGNAL INPU
ADAPTER
--
Setup
Performance Tests 2-33

10. IF Gain Uncertainty Test
Equipment
Procedure 1.
10 dB Gain Steps
Frequency Synthesizer
Adapter, Type N (m) to BNC (f)
Press (
2.
Connect CAL OUTPUT to SIGNAL INPUT.
3.
Press
-10.00 dBm
4.
Press
Set the frequency synthesizer for an output frequency of 20.0010
5.
INSTR pfwm-).
Cm]
8. Adjust AMPTD CAL for a MARKER amplitude of
50.02 dB.
(1~~733
PRESET).
.....................................HP
........................
HP 1250-0780
MHz and an output power level of -2.0 dBm. Set the amplitude
increment for 10 dB steps.
6.
Connect the equipment as shown in Figure 2-17.
7.
Key in analyzer settings as follows:
CCENTER
CFREQUENCY
8
Press MARKER
(CENTER FREQUENCY) to center signal trace on display.
9
Set analyzer as follows:
FREQUENCY) . . . . . . . . . . . . . . . . . . . . . . . . . . . . . . . 20.001 MHZ
SPAN) . . . . . . . . . . . . . . . . . . . . . . . . . . . . . . . . . . . . 2 kHz
(PEAK
SEARCH).~~)
or adjust
3335A
Note
[V’DEO(j-1
LOG
10.
Press MARKER [PEAK SEARCH),
11.
Press
(SHIFT),(m]I
Set the analyzer (REFERENCE
12.
synthesizer amplitude according to
. . . . . . . . . . . . . . . . . . . . . . . . . . . . . . . . . . . . . . . 100 Hz
. . . . . . . . . . . . . . . . . . . . . . . . . . . . . . . . . . . . . . . . . . . . 1 kHz
CENTER
dB/DIv]
. . . . . . . . . . . . . . . . . . . . . . . . . . 1
dB
to permit extended reference level settings.
LEVEL],(VIDEO],
Table
and frequency
2-12 settings. (Use the
frequency synthesizer @J for 10 dB steps.) At each setting, note
the MKR A amplitude displayed in the upper right corner of the
analyzer display (deviation from
the 0
dB
reference setting) and
record it in the table. See Figure 2-18.
After measurement at the (REFERENCE LEVEL) = -70 dBm setting, press
[SHIFT),(ENTER dB/DIvP
as indicated in
‘lhble
2-12.
2-34 Performance Tests

10. IF Gain Uncertainty Test
‘Ihble
2-12. IF Gain Uncertainty, 10 dB Steps
[REFERENCE LEVEL)
Pm)
0
-10
-20
-30
-40
-50
-60
-70
-80 -32
-90
-100
-110
Frequency
Synthesizer
Amplitude
Pm)
-2
-12
-22
-32
-42
-52
-62
-72
-42
-52
-62
v
100
100
100
100
100
100
10
10
100
100
10
10
Deviation
(Marker
Amplitude
0 (ref.)
A
WV
-120
Figure 2-18. IF Gain Uncertainty Measurement
-72
10
Performance Tests 2-35

10. IF Gain Uncertainty Test
2 dB Gain Steps
13. Press
QNSTR
pREsETj,(jRECALL) 7.
14. Set [REFERENCE LEVEL] to -1.9 dBm.
15. Press MARKER (OFF). Set
CVlDEo]
to 100 Hz.
16. Set the frequency synthesizer for an output power level of -3.9
dBm. Set the amplitude increment for 2 dB steps.
17. Press MARKER [PEAK
18. Set the analyzer
amplitude according to
SEARCH),@
CREFERENCE
‘Iable
LEVEL) and the frequency synthesizer
2-13. At each setting, note the MKR
A amplitude and record it in the table.
‘lhble
2-13. IF Gain Uncertainty, 2 dB Steps
LREFERENCE
CdBm)
-1.9
-3.9
-5.9
-7.9
LEVEL) Frequency
Synthesizer (MARKER A
Amplitude
Wm)
-3.9
-5.9
-7.9
-9.9
Deviation
‘Amplitude
W-9
0
(ref)
-9.9
rp
REF -1.0
1 m/
CENTER
22.001
RES 81 1
dBm
03
Nbb
hbix
Figure 2-19. IF Gain Uncertainty Measurement (2
-11.9
AtfEN10
VBU
dB
100
Hz
YKRAE Hz
0.02 dB
SPAM
2.00
SUP SW “.O
kl4z
dB)
2-36 Performance Tests

10. IF Gain Uncertainty
Test
0.1 dB Gain Steps
19. Set [REFERENCE LEVEL) to 0
dB.
20. Set the frequency synthesizer for an output power level of -2.00
dBm. Set the amplitude increment for 0.1 dB steps.
21. Press MARKER [PEAK
SEARCH),@.
22. Set the analyzer and the frequency synthesizer amplitude
according to
lkble
2-14. At each setting, note the MKR A
amplitude and record it in the table.
23. Find the largest positive deviation and the largest negative
deviation for reference level settings from 0 dBm to -70 dBm in
Table
2-12. Also, find the largest positive and negative deviations
for the last five settings in the table.
A
Reference Level Range: 0 to -70 dBm
Largest Positive Deviation:
Largest Negative Deviation:
-80 to -120 dBm
dB
dB
24. Find the largest positive and negative deviations in
Yhble
2-14:
C
‘Ihble 2-13
‘lkble
‘able
B
2-13 and
D
2-14
dB
dB
Largest Positive Deviation:
Largest Negative Deviation:
dB
dB
dB
dB
Performance Tests 2-37
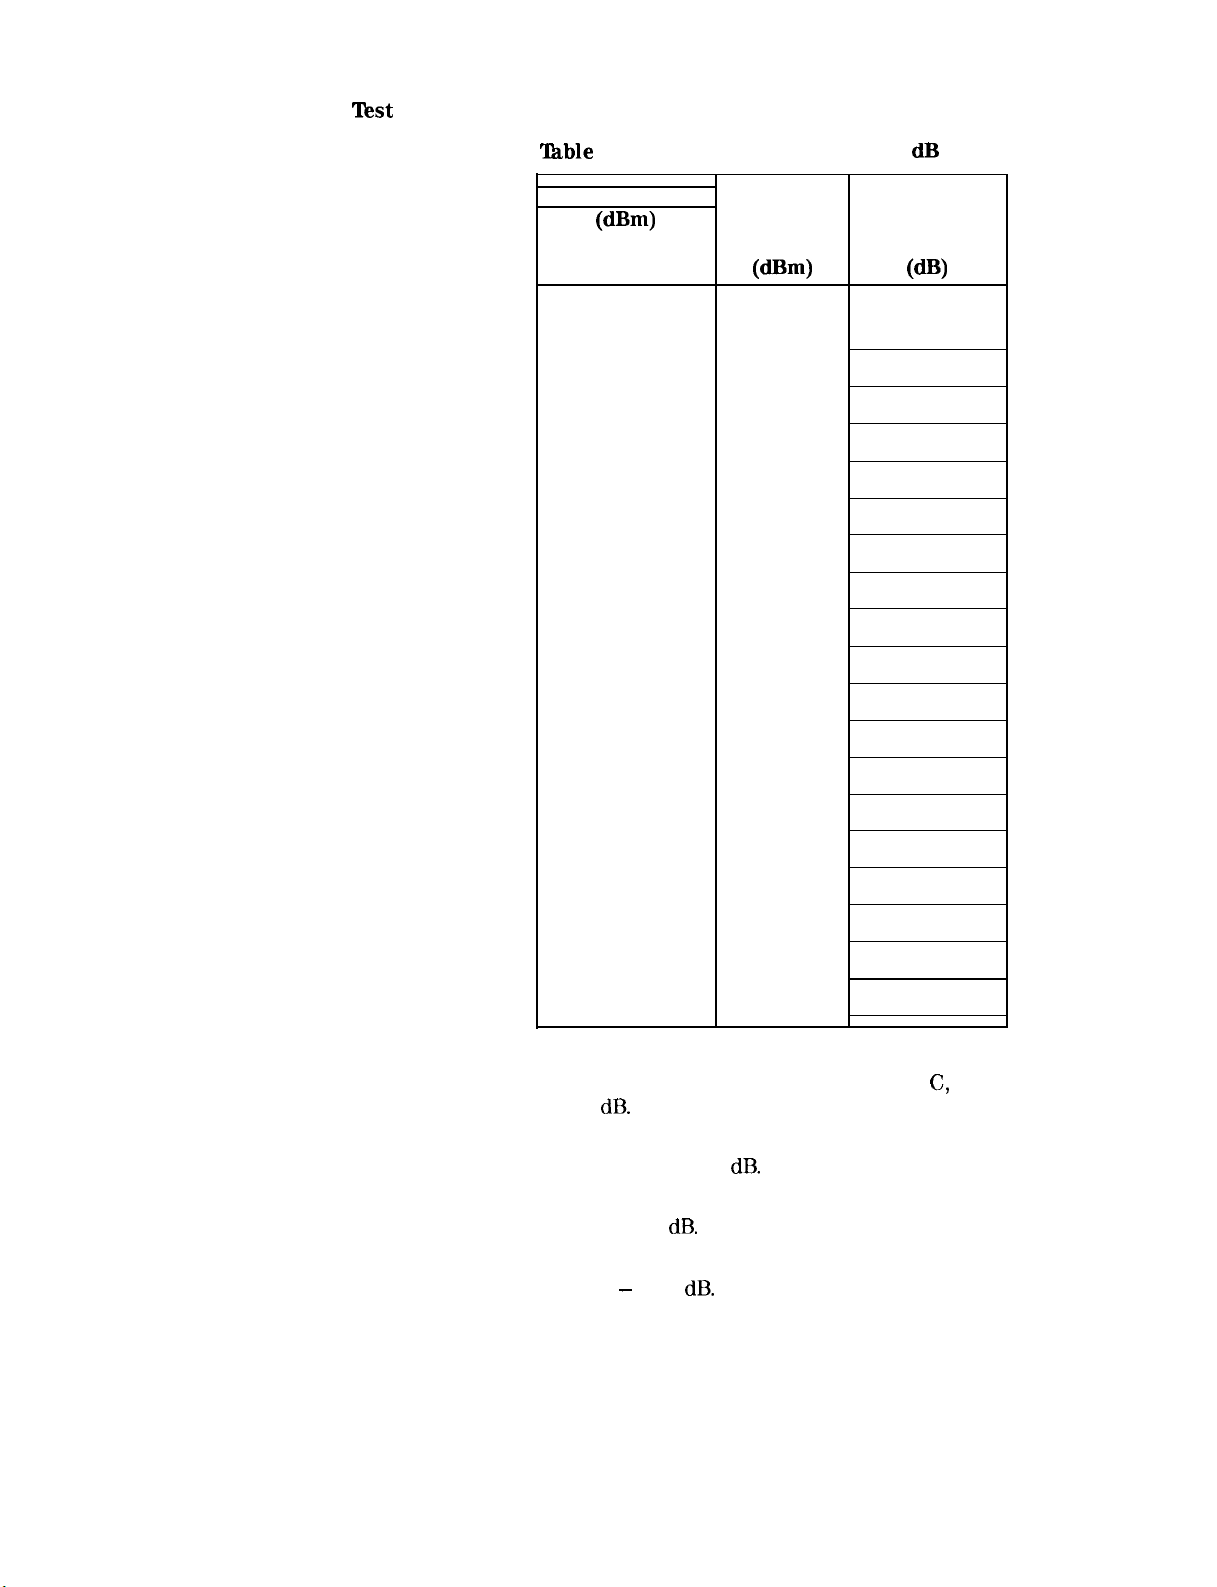
10. IF Gain Uncertainty
Test
‘Ihble
2-14. IF Gain Uncertainty, 0.1 dB Steps
[REFERENCE LEVEL) Frequency
Pm)
Synthesizer
Amplitude
(am)
0.0
-0.1
-0.2
-0.3
-0.4
-0.5
-0.6
-0.7
-0.8
-0.9
-1.0
-1.1
-1.2
-2.00 0(ref)
-2.10
-2.20
-2.30
-2.40
-2.50
-2.60
-2.70
-2.80
-2.90
-3.00
-3.10
-3.20
Deviation
(MKR A
Amplitude
PI
-1.3
-1.4
-1.5
-1.6
-1.7
-1.8
-1.9
25. The sum of the positive deviations recorded in A,
not exceed 0.6
dB.
-3.30
-3.40
-3.50
-3.60
-3.70
-3.80
-3.90
C,
and D should
26. The sum of the negative deviations recorded in A, C, and D
should not be less than -0.6
dB.
27. The sum of the positive deviations recorded in A, B, C, and D
should not exceed 1.0
dB.
28. The sum of the negative deviations recorded in A, B, C, and D
should not exceed
-
1 .O
dB.
2.38 Performance Tests


11. Log Scale Switching Uncertainty Test
REP -9.8 dml
REP -9.8 dml
bb
2 dB/2
dB/
//
CENTER 100.000 MHZ
CENTER 100.000 MHZ
RES BW 30 kliz
RES BW 30 kHz
ATTEN 10 de
ATTEN 10
VBW
VBW
dB
100
100
II
kHz
kHz
HKA 100.001 B MHZHKA 100.001 B MHZ
-a.a2 *em
-a.a2 *em
\\
SPAN
100
kHZSPAN
100
20.0 nl*ec
20.0 nl*ec
kHZ
SWP
SWP
Figure 2-20. Log Scale Switching Uncertainty MeasurementFigure 2-20. Log Scale Switching Uncertainty Measurement
able
2-15. Log Scale Switching Uncertainty
SCALE
(dB/DIV)
Allowable
Deviation
WV
1
0 (ref)
10
2
5
f0.5
f0.5
f0.5
2-40
Performance Tests

12. Amplitude Fidelity
Test
12. Amplitude
Fidelity Test
Related Adjustment
Specification
Description
(For instruments with Option 857, refer to Chapter 5.)
Log Amplifier Adjustments
Log:
Incremental
ho.1
dB/dB over 0 to 80 dB display
Cumulative
3 MHz to 30 Hz Resolution Bandwidth
<kl.O dB
5%
1.5 dB max over 0 to 90 dB display
max over 0 to 80 dB display (20 -
30°C).
Linear:
f3%
of Reference Level for top
9-l/2
divisions of display
Amplitude fidelity in log and linear modes is tested by decreasing the
signal level to the spectrum analyzer in 10 dB steps with a calibrated
signal source and measuring the displayed amplitude change with the
analyzer’s MARKER A function.
SIGNAL
ANALYZER
SYNTHESIZER LEVEL
f
GENERA OR
ADAPTER
?
Figure 2-21. Amplitude Fidelity Test Setup
Performance Tests
2-41

12. Amplitude Fidelity Test
Equipment
Procedure
Log Fidelity
Frequency Synthesizer . . . . . . . . . . . . . . . . . . . . . . . . . . . . . . . . . . HP
3335A
Adapter, Type N (m) to BNC (f) . . . . . . . . . . . . . . . . . . . . . HP 1250-0780
1. Set the frequency synthesizer for an output frequency of 20.000
MHz and an output power level of + 10
dBm. Set the amplitude
increment for 10 dB steps.
2. Connect equipment as shown in Figure 2-21.
3. Press ~NSTR PRESET) on the analyzer. Key in analyzer settings as
follows:
[CENTER FREQUENCY)......................................
FREQUENCY
CREFERENCE
4. Press MARKER
SPAN]
LEVEL)
.........................................
.......................................
SPEAK SEARCHJ@~K~GTJ~MKR
+ REF
center the signal on the display.
5. Key in the following analyzer settings:
FREQUENCY SPAN) . . . . . . . . . . . . . . . . . . . . . . . . . . . . . . . . . . . . . . . . O Hz
[&Xi,
. . . . . . . . . . . . . . . . . . . . . . . . . . . . . . . . . . . . . . . . . . . . 1 Hz
6. Press MARKER A. Step the frequency synthesizer output
amplitude from + 10
dBm to -80 dBm in 10 dB steps, noting
the MARKER A amplitude (a negative value) at each step and
recording it in column 2 of
‘fable
2-16. Allow several sweeps after
each step for the video filtered trace to reach its final amplitude
(see Figure 2-22).
LVL)
.20
.50
+ 10
to
MHZ
kHz
dBm
7. Subtract the value in column 1 from the value in column 2 for
each setting to find the fidelity error.
‘Ihble
2-16. Log Amplitude Fidelity
Frequency
1
2
Fidelity Error
Cumulative
Synthesizer Calibrated MARKER A Amplitude (Column 2 - Column 1)
Amplitude Amplitude
(mm)
+lO
0
-10
Step
0 (ref) 0 (ref)
-10
-20
(dB)
WV
0 (ref)
0 to 80
-20 -30
-30 -40
-40
-50
-50 -60
-60 -70
-70
-80
-80
-90
<*l.O dB
Cumulative
Error
dB
0 to 90
(9
~f1.5 dB
Error
dB
(dW
2-42 Performance Tests

12. Amplitude Fidelity
Test
8. The fidelity error for amplitude steps from -10 dB to -80
should be <& 1.0
9. The fidelity error at the -90 dB setting should be
4J
10
d0/
CENTER
REF
9.7
L
20.000
RES BW I kHZ
dB.
d&n ATTEN 20 dB
1
iB0
MHz
I I
VBW
s&l.5 dB.
YKR A
1
I I I
1
HT.
SWP
SPAN 0
300 n..c
I 1
dB
nz
Linear Fidelity
Figure 2-22. Amplitude Fidelity Measurement
10. Key in analyzer settings as follows:
(jEGi--
FREQUENCY SPAN)
[M,
.................................................
....................................................
..........................................
300
.I
MHz
1 MHz
11. Set the frequency synthesizer for an output power level of + 10
dBm.
12. Press SCALE LIN pushbutton. Press MARKER
CPEAK SEARCHJ[MKR)
13. Set (FREQUENCY SPAN) to 0 Hz and
@‘iYiF),[XF6-~
(resolution bandwidth), MARKER
to center the signal on the display.
[VlDEo]
to 1 Hz. Press
a.
14. Decrease frequency synthesizer output amplitude by 10 dB steps,
noting the MARKER A amplitude and recording it in column 2 of
‘Ikble
2-17.
Hz
Performance Tests 2-43

12. Amplitude Fidelity Test
‘Ihble
2-17. Linear Amplitude Fidelity
Frequency MARKER A
Synthesizer Amplitude
Amplitude
1
I
MW
(dB)
I
I
1
(f3
I
I
0
-10
Allowable Range
% of Reference Level)
(W
Min
I
Max
-10.87 -9.21
-23.10
-17.72
I
2-44 Performance Tests
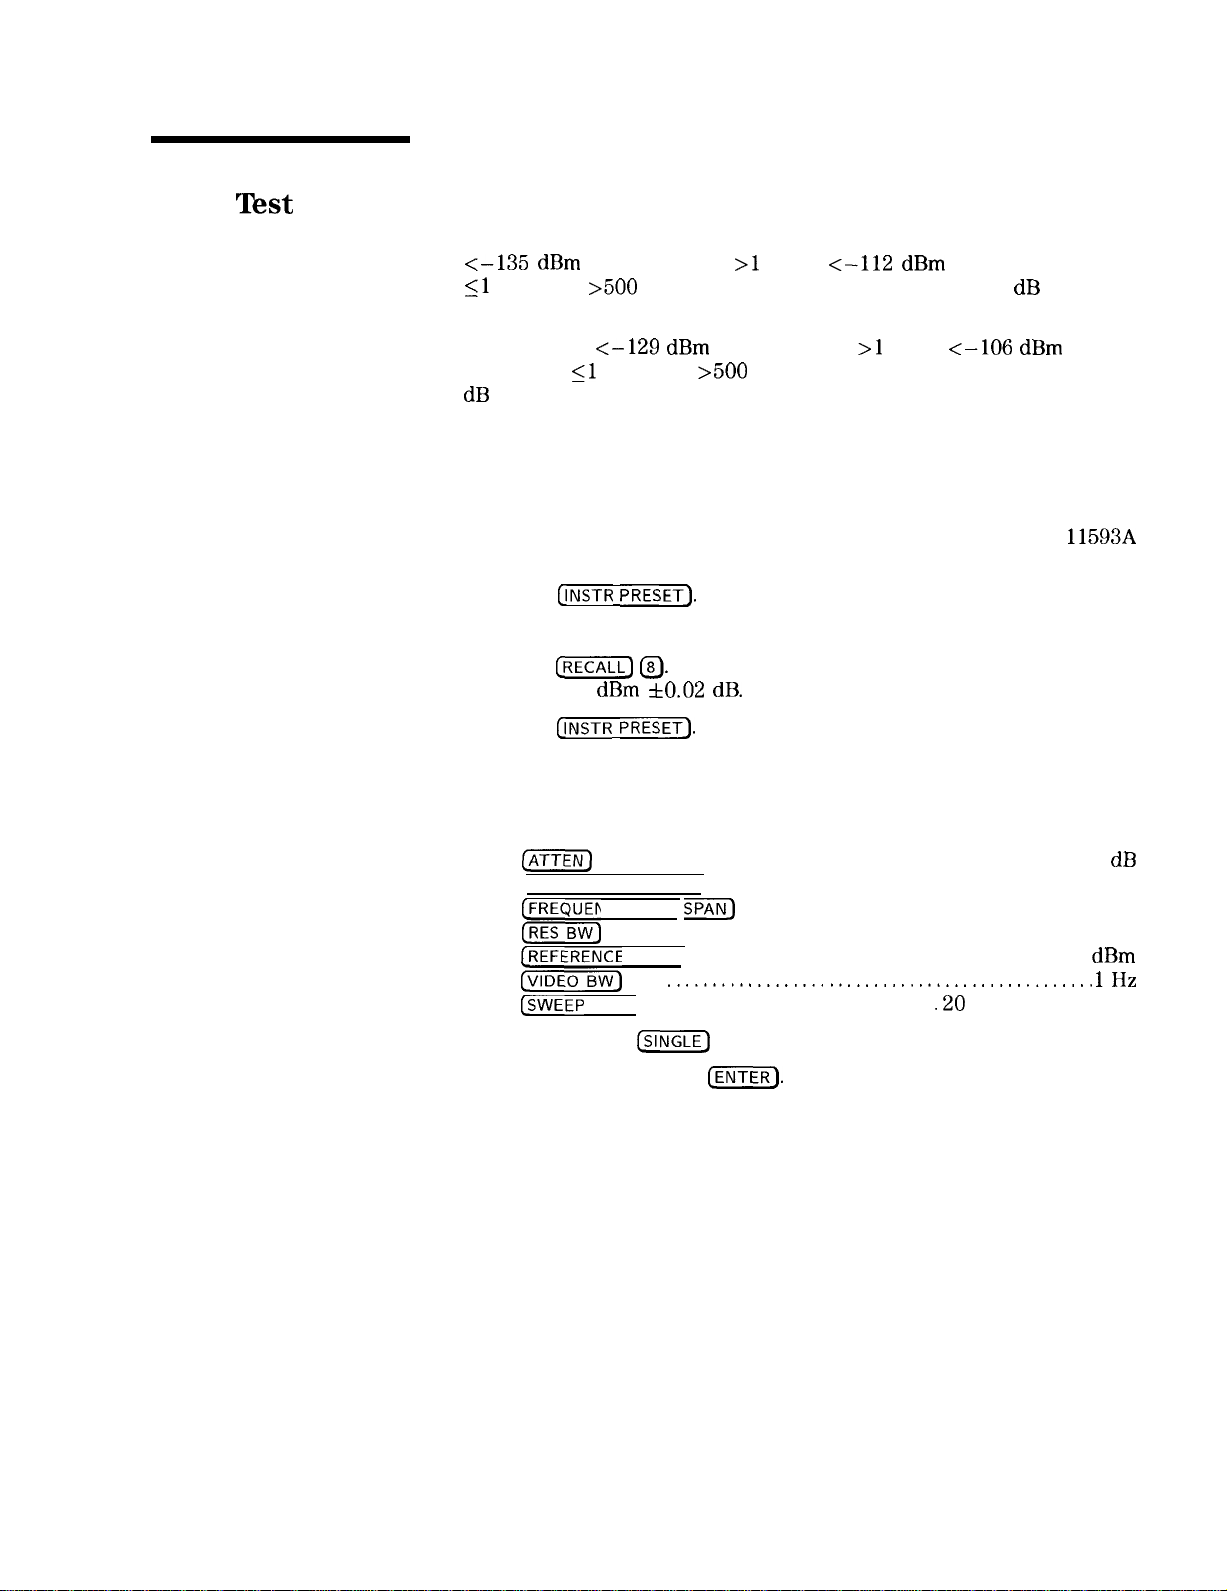
13. Average Noise
Level
Tkst
13. Average Noise Level Test
Specification
Description
Equipment
Procedure
c-135
<l
dBm for frequencies >I MHz,
c-112
dBm for frequencies
MHz but >500 Hz with 10 Hz resolution bandwidth, 0 dB input
attenuation, 1 Hz video filter.
Option 001:
c-129
dBm for frequencies >l MHz,
c-106
dBm for
frequencies 51 MHz but >500 Hz with 10 Hz resolution bandwidth, 0
dB
input attenuation, 1 Hz video filter (SIGNAL INPUT 1 only).
The average noise level is checked by observing the displayed noise
level at several frequencies with no input signal applied.
50 Ohm Termination. . . . . . . . . . . . . . . . . . . . . . . . . . . . . . . . .HP
1.
Press
(~NsTR
PRESET].
2.
Connect CAL OUTPUT to SIGNAL INPUT 2.
3.
4.
5.
m
Press
of -10.00 dBm
@. Adjust AMPTD CAL for a MARKER amplitude
50.02 dB.
Press ~NSTR PRESET].
Disconnect CAL OUTPUT from analyzer. Terminate SIGNAL
11593A
INPUT 2 with a 509 coaxial termination.
6.
Key in spectrum analyzer settings as follows:
CATTEN)
(CENTER FREQUENCY] . . . . . . . . . . . . . . . . . . . . . . . . . . . . . . . . . . 501 HZ
FREQUENCY SPAN) . . . . . . . . . . . . . . . . . . . . . . . . . . . . . . . . . .O Hz
;W,
REFERENCE LEVEL) . . . . . . . . . . . . . . . . . . . . . . . . . . . . . . . . . -80 dBm
i-1
@WEEP TIME] . . . . . . . . . . . . . . . . . . . . . . . . . . . . . . . . . . . . .
7.
Press SWEEP
8.
Press DISPLAY LINE
. . . . . . . . . . . . . . . . . . . . . . . . . . . . . . . . . . . . . . . . . . . . . . 0
. . . . . . . . . . . . . . . . . . . . . . . . . . . . . . . . . . . . . . . . . . . . 10 Hz
. . . .
..__............__.............................. 1Hz
.20
seconds
(SINGLE]
and wait for completion of the sweep.
[ENTER).
Using DATA knob, place display
line at the apparent average amplitude of the noise trace (see
Figure 2-23).
dB
Performance Tests 2-45

13. Average Noise Level
Test
Figure 2-23. Average Noise Level Measurement
9. Read the average noise level from the DISPLAY LINE readout.
The value should be
c-112
dBm.
dBm
10. Change [CENTER FREQUENCY) to 1.001 MHz. Follow the procedure
to steps 7 through 9 to determine the average noise level. The
value should be
c-135
dBm.
dBm
11. Change
(-CENTER
FREQUENCY) to 1501 Mhz. Follow the procedure of
steps 7 through 9 to determine the average noise level. The value
should be <- 135 dBm.
dBm
2-46 Performance Tests

14. Residual
Responses Test
14. Residual Responses
Test
Specification
Description
Equipment
Procedure
c-105
dBm for frequencies >500 Hz with 0 dB input attenuation (no
signal present at input) Option 100:
c-99
dBm for frequencies >500 Hz with 0 dB input attenuation
(SIGNAL INPUT 1 only).
Option 400:
c-95
dBm for frequencies >500 Hz with 0 dB input attenuation.
c-105
The spectrum analyzer is checked for residual responses across its
frequency range with
attenuation.
dBm for frequencies
no signal applied to the input and 0
50 Ohm Termination
1.
Press (INSTR PRESET].
2.
Connect CAL OUTPUT to SIGNAL INPUT 2.
3.
4.
5.
IRECALL) @J
Press
of -10.00 dbm
Press
QNSTR
Adjust AMPTD CAL for a MARKER amplitude
f0.02 dB.
PRESET).
Disconnect CAL OUTPUT from analyzer. Terminate SIGNAL
>2.5
kHz with 0 dB input attenuation.
. . . . . . . . . . . . . . . . . . . . . . . . . . . . . . . . HP
INPUT 2 with a 50 ohm coaxial termination.
dB
input
11593A
Note
6.
Key in control settings as follows:
(FREQUENCY). . . . . . . . . . . . . . . . . . . . . . . . . . . . . . . . . . . . . . ...50 MHz
CREFERENCE
(CENTER FREQUENCY) .
CF STEP SIZE) . . . . . . . . . . . . . . . . . . . . . . . . . . . . . . . . . .
km,
(@EGG-)
(ATTEN)
7.
Press DISPLAY LINE
8.
Reduce
LEVEL] . . . . . . . . . . . . . . . . . . . . . . . . . . . . . . . . . . . -60 dBm
.25
.45
MHz
. . . . . . . . . . . . . . . . . . . . . . . . . . . . . . . . . . . . . . . . . . 1 kHz
. . . . . . . . . . . . . . . . . . . . . . . . . . . . . . . . . . . . . .3 kHz
. . . . . . . . . . . . . . . . . . . . . . . . . . . . . . . . . . . . . . . . . . . . . 0
[RESBW)
CENTER_)
or
[VlDEOBW),
and key in -105 dBm.
if necessary, for a margin of at
least 4 dB between the noise trace and the display line (refer to
Figure 2-24). Do not reduce either bandwidth to less than 300 Hz.
This test will require approximately 30 minutes to complete using
the settings given in step 6. If the resolution bandwidth or video
bandwidth are further reduced, a full band check of residual
responses will take up to 15 hours to complete
MHz
dB
Performance Tests 2-47

14. Residual Responses Test
Figure 2-24. Residual Responses Measurement
9.
Press SWEEP
[SINGLE_)
and wait for completion of sweep. Look for
any residual responses at or above the display line. If a residual
is suspected, press SWEEP
CRINGLE)
again and see if the response
persists. A residual will persist on repeated sweeps, but a noise
peak will not. Any residual responses must be
c-105 dBm.
Option 400:
Any residual 500 Hz to 2.5 kHz must be
>2.5
kHz must be
If a response appears marginal, do the following to determine
10.
c-105
dBm
c-95 dBm;
any residuals
whether or not it exceeds the specification.
a. Press
b. Press MARKER
ISAVE_) 0.
[NORMAL)
and place the marker on the peak of
the response in question.
c. Press MARKER
Ijj),
then activate SWEEP
m.
d. Reduce [FREQUENCY SPAN] to 1 MHz or less. The amplitude of
the response should be
c-105
dBm (below the display line).
e. Press (RECALL] (iJ to resume the search for residuals.
Step [CENTER FREQUENCY) to 1510 MHz with @) checking for
11.
residual responses at each step by the procedure of steps 9 and
10. There should be no residual responses at or above the display
line below 1500 MHz.
2-46 Performance Tests
Maximum Residual Response
dBm
MHz

15. Spurious
Responses Test
15. Spurious Responses Test
Related Adjustment
Specification
Second Converter Adjustments
For total signal power of
analyzer, all image and out-of-band mixing responses, harmonic and
intermodulation distortion products are >75 dB below the total signal
power for input signals 10 Mhz to 1500 MHz;
signal power for input signals 100 Hz to 10 MHz.
Second Harmonic Distortion
For a signal -30 dBm at the mixer and
distortion is
Third Order Intermodulation Distortion
For two signals each -30 dB at the mixer, third-order intermodulation
products are:
>70 dB
c-40
dBm at the input mixer of the
>70 dB
210
MHz, second harmonic
down; 60 dB down for signals
below the total
~10
MHz.
Description
Harmonic distortion (second and third) is tested using a signal source
and a low-pass filter. The LPF insures that the harmonics measured
are generated by the spectrum analyzer and not by the signal source.
Spurious responses due to image frequencies, out-of-band mixing, and
intermodulation distortion are measured by applying signals from two
separate sources to the spectrum analyzer input.
Performance Tests
2-49
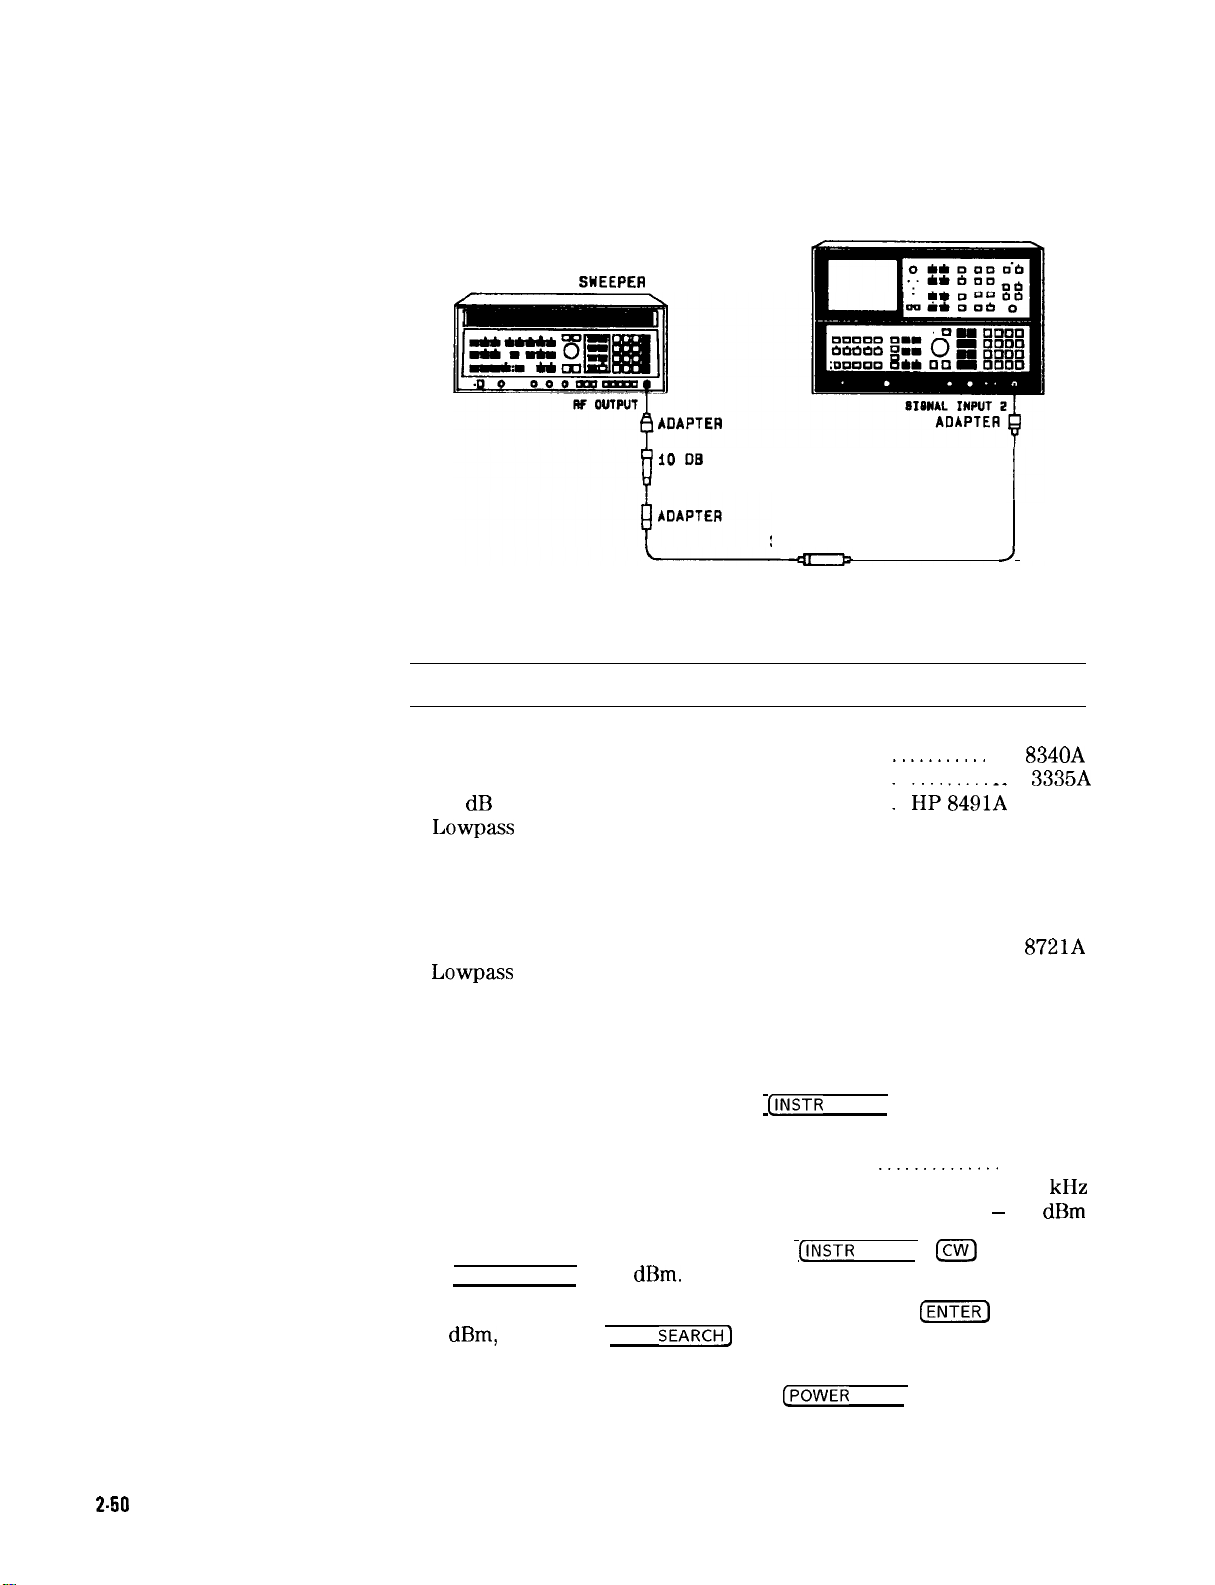
15. Spurious Responses Test
SPECTRUM ANALYZER
Note
Equipment
SYNTHESIZED
SMEEPEA
10 DB
ATTENUATOR
300 MHZ
LPF
J
Figure 2-25. Harmonic Distortion Test Setup
Equipment listed is for two test setups, Figure 2-25 and Figure 2-26.
Synthesized Sweeper ........................
Frequency Synthesizer ...................... HP
10 dB Attenuator (2 required) ..............
Lowpass Filter (300 MHz) ...................
Adapter, Type N (m) to BNC (f) (2 required)
Adapter, Type N (m) to SMA (f) .............
Adapter, Type N (f) to BNC (m) .............
Adapter, Type N (f) to BNC (f) ..............
Directional Bridge ........................... ........... HP
Lowpass Filter (50 MHz) (2 required) .......
...........
HP
8340A
3335A
:
:
ii< 84&A
.......
........
Opt 010
HP 0955-0455
HP 1250-0780
....... HP 1250-1250
.......
HP 1250-0077
....... HP 1250-1474
8721A
.......
HP 0955-0306
2-50
Performance Tests
Procedure
Harmonic Distortion
1. Connect equipment as shown in Figure 2-25.
2. On the spectrum analyzer, press [INSTR PRESET). Set the controls of
the spectrum analyzer as follows:
CENTER FREQUENCY
FREQUENCY SPAN
REFERENCE LEVEL-...................
.................
....................
..............
................
.............
3. On the synthesized sweeper, key in ~NSTR PRESET],
(POWER LEVEL) -10 dBm.
4. On the spectrum analyzer, key in DISPLAY LINE
Icw)
CENTER]
280 MHz
10
20 dBm
280 MHz,
-90
dBm, MARKER [PEAK SEARCH] to position a marker on the peak of
the displayed 280 MHz signal.
5. On the synthesized sweeper, press
~POWER
LEVEL] and use the
ENTRY knob to adjust the amplitude of the displayed 280 MHz
kHz

15. Spurious Responses Test
signal for a marker indication of -20.00 dBm (-30.0 dBm at the
input mixer with 10 dBm of input attenuation).
On the spectrum analyzer, key in MARKER
6
CCENTER
FREQUENCY) 560 MHz, MARKER
@,
CPEAK
SEARCH) to position
a second marker on the peak of the second harmonic distortion
product of the 280 MHz input signal. The response should be
below the display line
Second Harmonic
7. On the synthesized sweeper, key in
the amplitude of the 280 MHz signal by 10
8. On the spectrum analyzer, key in MARKER
CCENTER
FREQUENCY) 280 MHz, [REFERENCE LEVEL) -30 dBm,
DISPLAY LINE [ENTER] -105 dBm, MARKER
(>70 dB
below the input signal level).
dBm
~POWER
LEVEL)
ato
decrease
dB.
loFF),
CPEAK
SEARCH) to
position a marker on the peak of the displayed 280 MHz signal.
9. On the synthesized sweeper, press [POWER LEVEL] and use the
ENTRY knob to adjust the amplitude of the displayed 280 MHz
signal for a marker indication of -30.00 dBm (-40.0 dBm at the
input mixer with 10 dBm of input attenuation).
10. On the spectrum analyzer, key in MARKER
[CENTER FREQUENCY) 840 MHz, MARKER [PEAK SEARCH) to position
a],
a second marker on the peak of the third harmonic distortion
product of the 280 MHz input signal. The response should be
below the display line (>75 dB below the input signal level).
Third Harmonic
dBm
Performance Tests 2-51

15. Spurious Responses Test
Intermodulation
Distortion
SPECTRUM ANALYZER
ATTENUATOR
DIRECTIONAL
50 MHz LON
PASS
FILTER
Figure 2-26. Intermodulation Distortion
Test
ATTENUATOR
Setup
11. Connect equipment as shown in Figure 2-26.
12. Set the controls of the spectrum analyzer as follows:
CENTER FREQUENCY . . . . . . . . . . . . . . . . . . . . . . . . . . . 29.5 MHz
FREQUENCY SPAN . . . . . . . . . . . . . . . . . . . . . . . . . . . . . . . . 5 MHz
REFERENCE LEVEL . . . . . . . . . . . . . . . . . . . . . . . . . . . . . . . -20
DISPLAY LINE . . . . . . . . . . . . . . . . . . . . . . . . . . . . . . . . . . . . . . . . OFF
13. On the synthesized sweeper, key in
[cw
30 MHz, [POWER LEVEL],
-4 dBm and use the ENTRY knob to position the peak of the
displayed 30 MHz signal at the top CRT graticule line.
14. On the frequency synthesizer, key in
(AMPLITUDE)
-4
dBm.
Readjust the signal amplitude as necessary
[FREQUENCY) 29 MHz,
to position the peak of the displayed 29 MHz signal at the top CRT
graticule line.
dBm
2-52 Performance Tests
15.
Set the controls of the spectrum analyzer as follows:
CENTER FREQUENCY . . . . . . . . . . . . . . . . . . . . . . . . . . . . . . 29 MHz
FREQUENCY SPAN . . . . . . . . . . . . . . . . . . . . . . . . . . . . . . . . . 500 Hz
16.
On the spectrum analyzer, key in DISPLAY LINE (ENTER) -100
dBm, MARKER [PEAK SEARCH) to position a marker on the peak of
the displayed 29 MHz signal.
On the frequency synthesizer, adjust the signal amplitude for a
17.
marker indication of -20.00
On the spectrum analyzer, key in [CENTER FREQUENCY) 30 MHz,
18.
MARKER
[PEAK SEARCH) to position a marker on the peak of the
dBm.
displayed 30 MHz signal.
On the synthesized sweeper, adjust the signal power level for a
19.
marker indication of -20.00
dBm.

15. Spurious Responses Test
Note
-0
-10
-20
z
E
i.i
-30
If unable to locate intermodulation distortion products, temporarily
increase output power level of frequency synthesizer and synthesized
sweeper by + 10
signal sources to the previous settings before making distortion
measurements.
20. On the spectrum analyzer, key in MARKER
[CENTER FREQUENCY) 31 MHz, MARKER [PEAK SEARCH) to position
a marker at the peak of the 31 MHz third-order intermodulation
product. The response should be below the display line
below the input signals).
TO1
Distortion (1 MHz separation @ 30 MHz)
21. On the spectrum analyzer, key in [CENTER FREQUENCY) 28 MHz,
MARKER [PEAK SEARCH] to position a marker at the peak of the 28
MHz third-order intermodulation product. The response should be
below the display line
TO1
Distortion (1 MHz separation @ 30 MHz)
fl
dB.
Return the output power level of both
[n),
dBm
(>80 dB
dBm
below the input signals).
fz
SECOND
HARMONICS
FROM SIGNAL
(GO dB
z
3 -40
Q
2
-50
-60
-70
f2 - fl
SECOND
ORDER
GENERAToRS
-
L
THIRD
ORDER
Figure 2-27. Intermodulation Distortion Products
22. On the frequency synthesizer, key in [FREQUENCY) 29.99 MHz.
23. On the spectrum analyzer, key in MARKER
CCENTER
MARKER (PEAK SEARCH).
FREQUENCY) 29.99 MHz, DISPLAY LINE
\
IOFF),
211
SECOND
ORDER
[ENTER]
-90
2f2
dBm,
Performance Tests 2-53
15. Spurious Responses Test
24. On the frequency synthesizer, readjust the signal amplitude as
necessary to position the peak of the displayed 29.99 MHz signal
at the top CRT graticule line.
25. On the spectrum analyzer, key in MARKER
(CENTER FREQUENCY) 30.01 MHz, MARKER (PEAK SEARCH) to
@,
position a second marker at the peak of the 30.01 MHz third-order
intermodulation product. The response should be below the
display line
TO1
(>70 dB
below the input signals).
Distortion (10 kHz separation @ 30 MHz)
dBm
26. On the spectrum analyzer, key in [CENTER FREQUENCY) 29.98 MHz,
MARKER
[PEAK SEARCH) to position a second marker at the peak
of the 29.98 MHz third-order intermodulation product. The
response should be below
the display line
(>70 dB
below the
input signals).
TO1
Distortion (10 kHz separation @ 30 MHz)
dBm
27. On the synthesized sweeper, press (POWER LEVEL] and decrease
the amplitude of the 30 MHz signal by 13.0 dB from the current
setting.
28. On the frequency synthesizer, key in
(AMPLITUDE] and then decrease the amplitude of the 29 MHz signal
by 13.0
dB
from the current setting.
[FREQUENCY] 29 MHz,
29. Set the controls of the spectrum analyzer as follows:
CENTER FREQUENCY . . . . . . . . . . . . . . . . . . . . . . . . . . . . . 29 MHz
FREQUENCY SPAN . . . . . . . . . . . . . . . . . . . . . . . . .
,500
Hz
REFERENCE LEVEL . . . . . . . . . . . . . . . . . . . . . . . . . . . . . . -33 dBm
MARKER . . . . . . . . . . . . . . . . . . . . . . . . . . . . . . . . . . . . . . . . . . . OFF
30. On the spectrum analyzer, key in DISPLAY LINE
dBm, MARKER
CPEAK
SEARCH) to position a marker on the peak of
[ml
-105
the displayed 29 MHz signal.
31. On the frequency synthesizer, adjust the signal amplitude for a
marker indication of -33.0
32. On the spectrum analyzer, key in
dBm.
CCENTER
FREQUENCY) 30 MHz,
MARKER [PEAK SEARCH) to position a marker on the peak of the
displayed 30 MHz signal.
33. On the synthesized sweeper, adjust the signal power level for a
marker indication of -33.0
dBm (total signal power of -40 dBm
at the input mixer with 10 dB of input attenuation).
34. On the spectrum analyzer, key in MARKER
[CENTER FREQUENCY) 1 MHZ, MARKER [PEAK SEARCH] to position
a,
a second marker at the peak of the 1 MHz second-order
intermodulation distortion product. The response should be below
the display line
SO1
Distortion (1 MHz separation @ 30 MHz)
(>75 dB
below the total input power).
dBm
2-54 Performance Tests

15. Spurious Responses Test
35. On the spectrum analyzer, key in [CENTER FREQUENCY] 59 MHz,
MARKER [PEAK SEARCH) to position a second marker at the peak
of the 59 MHz second-order intermodulation distortion product.
The response should be below the display line (>75 dB below the
total input power).
SO1
Distortion (1 MHz separation @ 30 MHz)
dBm
Performance Tests 2-55

16. Residual FM
Test
Specification
<3
Hz peak-to-peak in
bandwidth
530
Hz, video bandwidth
110
s; frequency span ~100 kHz, resolution
530
Hz.
Description
Equipment
Procedure
The spectrum analyzer CAL OUTPUT is used to supply a stable 20
MHz signal to the analyzer. The analyzer is tuned in zero span to a
point on the 30 Hz bandwidth response for which the slope of the
response is known from direct measurement. The residual FM is then
slope detected over a 10 second interval, yielding a trace whose
peak-to-peak excursion is proportional to the residual FM.
None Required
1. Press
(~N~TR
PRESET).
2. Connect CAL OUTPUT to SIGNAL INPUT 2.
3. Press (RECALL) 8 and adjust AMPTD CAL for a MARKER amplitude
of -10.00 dBm
4. Press
CRECALL)
ho.02 dB.
9 and adjust FREQ ZERO for a maximum amplitude
trace.
5. Set
PREFERENCE
LEVEL) to -10 dBm. Adjust FREQ ZERO
counterclockwise until trace is at the center graticule line.
6. Set
~FREQUENCY
SPAN) to 100 Hz. Press SWEEP
CSINGLE)
and wait
for completion of the sweep.
7. Press MARKER
Cm),
and place marker 1 division above the
center graticule line on the negative-going side of the trace. Press
MARKER In] and set the movable marker 1 division below the
center graticule line. See Figure 2-28.
2-56 Performance Tests

16. Residual FM Test
RF -I... L
hr
1u
Figure 2-28. Bandwidth Filter Slope Measurement
8. Compute the detection slope of the 30 Hz filter between the
markers by dividing the MARKER A amplitude by the MARKER A
frequency:
filter slope = MARKER A amplitude/MARKER Afrequency =
dB/Hz
9. Press SWEEP
10. Change
necessary, to position the trace at the center graticule line. The
amplitude variations of the trace (see Figure 2-29) represent the
analyzer residual FM.
[CONT),(mj
FREQUENCY
IOFF).
SPAN] to 0 Hz. Readjust FREQ ZERO, if
Performance Tests
2-57

16. Residual FM Test
Figure 2-29. Slope Detected Residual FM
11. Press SWEEP
CRINGLE)
and wait for completion of the sweep.
12. Press MARKER [PEAK SEARCH_). Press DISPLAY LINE
position the display line at the lowest point on the trace.
(m’
and
2-58 Performance Tests
Figure 2-30. Peak-to-Peak Amplitude Measurement

16. Residual FM Test
13. Press MARKER
Ia]
and position movable marker at the lowest
point on the trace (see Figure 2-30). Read the MARKER A
amplitude from the display and record its absolute value.
MARKER A amplitude = p-p amplitude =
dB
14. Divide the peak-to-peak amplitude by the slope computed in step
8 to obtain the residual FM:
p-p amplitude/filter slope = residual FM
dB/
=
Hz
dB/Hz
= residual FM
The residual FM should be less than 3 Hz.
15. Press ~NSTR PRESET].
16. Press
Cm]
9 and adjust FREQ ZERO for a maximum amplitude
trace.
Performance Tests 2-59

17. Line-Related
Sidebands Tests
Specification
Description
Equipment
Procedure
95 dB
below the peak of a CW signal. Option
$00: >75 dB
below
the peak of a CW signal.
The spectrally pure calibrator signal of the spectrum analyzer is
applied to the analyzer input and the line related sidebands near the
signal are measured.
None required
1.
Press ~NSTR PRESET) on the analyzer. Connect CAL OUTPUT to
SIGNAL INPUT 2.
2.
Press
C-j
of -10.00 dBm
3.
Press
(~NSTR
4.
Key in the following analyzer settings:
[CENTER FREQUENCY)
[REFERENCE LEVEL] . . . . . . . . . . . . . . . . . . . . . . . . . . . . . . . . . . . . . -10 dBm
CFREQUENCY
5.
Wait for completion of sweep, then press MARKER
[PEAK
SEARCH),(jj).
8 and adjust AMPTD CAL for a MARKER amplitude
f0.02 dB.
PRESET).
.20
MHZ
SPAN]
....................
600 Hz
6.
Press (SHIFT)
(-1
G,
SWEEP
@‘i7ZZ],
10
(j-/Iv
to initiate
video averaging of 10 sweeps. Wait for completion of sweeps.
7.
Press MARKER
(PEAK
SEARCH],(~)
and position movable marker at
the peak of each line related sideband (120 Hz, 180 Hz, and 240 Hz
for 60 Hz line frequency; 100 Hz, 150 Hz, and 200 Hz for 50 Hz
line frequency, etc.). The MARKER A amplitude for each sideband
should be
120 Hz (100 Hz)
180 Hz (150 Hz)
240
c-85 dB
Hz (200 Hz)
(see Figure 2-31).
dB
dB
dB
2-60
Performance Tests

17. Line-Related Sidebands
Tests
Option 400
Figure 2-31. Line Related Sidebands
Press ~NSTR PRESET]. Connect CAL OUTPUT
1.
2.
Press
(ml
of -10. 00 dBm l
3.
Press
ONSTR
4.
Key in the following analyzer settings:
[CENTER FREQUENCY]
PREFERENCE
(FREQUENCY SPAN]
5.
Wait for completion of the sweep, then press MARKER
[PEAK
SEARCH],(-).
6.
Press (SHIFT)
8 and adjust AMPTD CAL for a MARKER amplitude
tO.02 dB.
PRESET).
.....................................
LEVEL]
[VlDEo]
.......................................
.......................................
G,
SWEEP
(-1,
Measurement
to SIGNAL INPUT 2.
10
cm/Iv
to initiate
video averaging of 10 sweeps. Wait for completion of sweeps.
7.
Press MARKER
SPEAK SEARCH],@
and position movable marker at
the peak of each line related sideband (400 Hz, 800 Hz, and 1200
Hz). The MARKER A amplitude for each sideband should be
dB.
400 Hz
800 Hz
dB
dB
20 MHz
-10 dBm
3 kHz
c-75
1200 Hz
dB
Performance Tests 2-61

18. Calibrator
Amplitude
Accuracy
Test
Related Adjustment
Specification
Description
20 MHz Reference Adjustments
-10 dBm
The output level of the calibrator signal is measured with a power
meter.
f0.3 dB
SPECTRUW ANILYZER
Equipment
Procedure
2-62 Performance Tests
Figure 2-32. Calibrator Amplitude Accuracy
Power Meter
Power Sensor
Adapter, Type N (f) to BNC (m)
1. Connect equipment as shown in Figure 2-32.
2. Measure output level of the CAL OUTPUT signal. The value should
be -10.0 dBm
.................................................
...............................................
........................
ho.3 dB.
dBm
Test
Setup
HP
HP 1250-0077
HP 436A
8482A

19. Fast Sweep
Time Accuracy
Test
(430
ms)
19. Fast Sweep Time Accuracy Test
(~20
ms)
Related Adjustment
Specification
Description
None
&lo% for sweep times
5100
seconds
The triangular wave output of a function generator is used to
modulate a 500 MHz signal which is applied to the spectrum analyzer
SIGNAL INPUT. The signal is demodulated in the zero span mode to
display the triangular waveform. Sweep time accuracy for sweep
times
~20
ms is tested by checking the spacing of the signal peaks on
the displayed waveform.
SPECTRUM ANALYZER
SYNTHESIZED SWEEPER
Equipment
Procedure
Figure 2-33.
Function Generator
Universal Counter
Signal Generator
Fast
Sweep Time Accuracy
(~20
ms
........................................HP
..........................................HP
...........................................
Test
Setup)
3312A
5316A
HP
8340A
1. Connect equipment as shown in Figure 2-33.
2. Press
PRESET)
on spectrum analyzer.
QNSTR
3. Key in analyzer settings as follows:
~CENTER
(FREQUENCY SPAN)
FREQUENCY)
.....................................
........................................100
500
kHz
4. Set synthesized sweeper for an output frequency of 500 MHz and
an output power level of -10
dBm.
Performance Tests 2-63
MHZ

19. Fast Sweep Time Accuracy Test
(~20
ms)
5. Press MARKER (PEAK
6. Set [FREQUENCY SPAN) to 0 Hz,
MHz, and press TRIGGER
SEARCHJ@~EFZF),~.
(j-1
to 3 MHz,
Cm].
[VlDEoBW)
to 3
7. Set synthesized sweeper for an amplitude-modulated output.
8. Set function generator controls as follows:
.
FUNCTION .
AMPLITUDE . . . . . . . . . . . . . .
OFFSET
SYM . . . .
TRIGGER PHASE
MODULATION
. . . . . . . . . . . . . . . . . . . . . . . . . . . . triangular wave
. .
approximately 1 Vp-p
...... CAL position (in)
.
. .CAL position (in)
.
.
.
. .
. all out
FREE RUN
9. Key in (SWEEP TIME] 5 ms and set function generator for a counter
reading of 2.00
f0.02
kHz.
10. Adjust spectrum analyzer TRIGGER LEVEL to place a peak of
the triangular waveform on the first graticule from the left edge
of the CRT display as a reference. (Adjust function generator
amplitude, if necessary, to provide a signal large enough to
produce a stable display). The fifth peak from the reference
should be within
~l~0.5
division of the sixth graticule from the left
edge of the display (see Figure 2-34).
11. Using sweep times and function generator frequencies in
Table
2-18, check sweep time accuracy for sweep times
~20
ms by
procedure of step 10.
2-64 Performance Tests
Figure 2-34. Fast Sweep Time Measurement
(~20
ms)

19. Fast Sweep Time Accuracy Test (~20 ms)
‘able
2-18. Fast Sweep Time Accuracy (~20 ms)
[SWEEP TIME] Function Generator Frequency Sweep Time Error
ww
(divisions)
5 ms 2.00
2 ms 5.00
f0.02
f0.05
1 ms 10.0 fO.1
200
100
ps
,Ls
50.0
100
Iko.5
fl
Performance Tests 2-65

20.
1st
LO Output
Amplitude Test
Specification
>+4
dBm from 2.0
GHz
to 3.7
GHz
Description
The power level at the
first L.O. is swept over its 2.0
SPECTRUM ANALYZER
Figure 2-35.
1ST
LO OUTPUT connected is measured as the
1st
LO Output Amplitude Test Setup
GHz
to 3.1
GHz
range.
POWER METER
Equipment
Procedure
2-66 Performance Tests
Power Meter
Power Sensor
1. Press (INSTR PRESET].
2. Set [SWEEP TIME) to 100 seconds.
3. Calibrate power meter and sensor. Connect equipment as
Figure 2-35.
4. Observe the meter indication as the analyzer makes a complete
sweep. The indication should be > + 4 dBm across the full sweep
range.
5. Replace 50 ohm terminator on
.................................................
...............................................HP
dBm
1ST
LO OUTPUT.
HP
shown in
436A
8482A
21. Frequency Reference Error Test
21. Frequency Reference Error
Test
Related Adjustment
Specification
Description
Note
Time Base Adjustment
Aging Rate
<l
x 10eg/day and
from cold start at
Temperature Stability
<7
x
lo-’
0” to
frequency within 30 minutes.
The frequency of the spectrum analyzer time base oscillator is
measured directly using a frequency counter locked to a frequency
reference which has an aging rate less than one-tenth that of the
time base specification. After a 30 day warmup period, a frequency
measurement is made. The analyzer is left undisturbed for a
period and a second reading is taken. The frequency change over this
24-hour
This test requires that the spectrum analyzer be turned on (not in
STANDBY) for a period of 30 days to ensure that the frequency
reference attains its aging rate. However, after aging rate is attained,
the frequency reference typically attains aging rate again in 72 hours
of operation after being off for a period not exceeding 24 hours.
period must be less than one part in
~2.5
x
10m7
year; attained after 30 days warmup
25°C.
5E9’C.
Frequency is within 1 x
10’.
lo-”
of final stabilized
24-hour
Care must be taken not to disturb the spectrum analyzer during the
24-hour
shock and vibration. The frequency reference should remain within
its attained aging rate if the instrument is left on, the instrument
orientation with respect to the earth’s magnetic field is maintained,
and the instrument does not sustain any mechanical shock. Frequency
changes due to orientation with respect to the earth’s magnetic field
and altitude changes will usually be nullified when the instrument
is returned to its original position. Frequency changes due to
mechanical shock will usually appear as a fixed frequency error.
The frequency reference is also sensitive to temperature changes;
for this reason the ambient temperature near the instrument at the
first measurement time and the ambient temperature at the second
measurement time should not differ by more than
Placing the spectrum analyzer in STANDBY mode turns the
instrument off while continuing to provide power for the frequency
reference oven, helping to minimize warmup time. However, the
frequency reference must be on to attain its aging rate.
test interval, since the frequency reference is sensitive to
1°C.
Performance Tests 2-67


‘lhble
Performance
2-19.
Tkst
Record
Hewlett-Packard Company
Model HP
8568B
Tested by
Report No.
Serial No.
IF-Display Section
RF Section
Date
Performance Tests 2-69

Tkst
1. Center
Frequency Readout
Accuracy Test
Step 8. Center Frequency Readout Error Test Record
Comb
Generator
Comb
Frequency
WW
100 MC
EXT TRIG
(1, 2, 5, or 10 MHz)
trigger signal
Spectrum Analyzer
[FREQUENCY SPAN) [CENTER FREQUENCY)
ww
100 MHz
100 MHz 500
100 MHz 1000
10 MHz
10 MHz 500
10 MHz 1000
10 MHz 1500
1 MHz 1000
100
kHz
10 kHz
1
100
100
1000
1000
T
98
498
998
99.8
499.8
999.8
1499.8
999.98
999.998
999.9998
Min
Center Readout
W-W
Measured
Max
102
502
1002
100.2
500.2
1000.2
1500.2
1000.02
1000.002
1000.0002
2-70
Performance Tests

‘I&t 2. Frequency
Span Accuracy Test
Test 2. Frequency Span Accuracy Test
Steps 7, 9, and 11. Wide Span Error
r
Spectrum
F
kequency
Span
200
100kHz
100.1
IMHz
1.01 MHz
20
20.1
1.5
n,
Hz
kHz
MHz
MHz
GHz
Analyzer
Center
1
Frequency
100
MHz
100
MHz
100
MHz
100
MHz
100
MHz
100
MHz
100
MHz
900
MHz
Synthesized Sweeper
Freq. A
Cf-.45
span
99.999 910 MHz
99.955 000 MHz
99.954955 MHz 100.045045
99.550
OOOMHz
99.550 550 MHz
91.000000 MHz
90.955 000 MHz
225
MHz
1
Freq Span Span Error
Freq. B
cf +
.45
span
100.000 090
100.045 000
100.450 000
100.450 500
109.000000
109.045.000
1575
ADUT- ASyn
from
200
Hz
100
kHz
100.1 kHz
1 MHz
1.01 MHz
20
MHz
20.1 MHz
1.5
GHz
A Synth
P-4
MHz
MHz
MHz
MHz
MHz
MHz
MHz
MHz
180 Hz
90.000 Hz
90.090kHz
900.000kHz
909.000kHz
18.000 MHz
18.090MHz
1350MHz
Step 12. Span Error
‘able
2-3
-34,500.OOO
DUT Measured
Freq. C
Min
-10
-5000
-5,005
-50,000
-23,230
-460,000
-462,300
Hz
Freq. D
A DUT
(D-C)
Spec.
Max
Hz 10 Hz
Hz
Hz
Hz
Hz
Hz
Hz
34,500O.OOO
5000
Hz
5,005
Hz
50,000
23,230
460,000
462,300
Hz
Hz
Hz
Hz
Hz
Note
The specification in Table 2-4 was derived using the following formula:
For spans > 1 MHz, the
For spans 5 1 MHz, the
spec
spec
is:
>&[(.02)(A
is:
>&[(.05)(A
synth freq) + (.005)(span)]
synth freq) + (.005)(span)]
Performance Tests 2-71

Test 3. Sweep Time Accuracy
Step 6. Sweep Time Accuracy, Sweep Times
220
ms
[SWEEP TIME)
20 ms
50 ms
100 ms
500 ms
1s
Min
18
45
90
450
900
Marker A Time
Measured
Max
ms 22 ms
ms 55 ms
ms 110 ms
ms 550 ms
ms 1.10
Step 12. Sweep Time Accuracy, Sweep Times
21
Step 19. Sweep Time Accuracy, Sweep Times
ms (Alternate Procedure)
[SWEEP TIME)
20 ms
50 ms
100 ms
500 ms
1s
10
s
50
s
100
s
150
s
Min
18.0 ms
45.0 ms
90.0 ms
450 ms
900 ms
9.00 s
45.0 s
90.0
20.0
Sweet
s
s
Gen Readout
1
Measured
s
220
220
s
2-72 Performance Tests

‘I&t 4. Resolution
Bandwidth
Accuracy
Test 4. Resolution Bandwidth Accuracy
Step 8. Bandwidth Accuracy
[REW-
/
3MHz
1MHz
300kHz
100kHz
30kHz
10kHz
300Hz
100Hz
3kHz
1kHz
30Hz
10Hz
[FREQUENCY SPAN)
5MHz
2 MHz
500kHz
200kHz
50kHz
20kHz
5kHz
2 kHz
500 Hz
200Hz
100Hz
100Hz
MARKER A Readout of 3
Min
2.400 MHz
900kHz
270.0 kHz
90.0 kHz
27.00 kHz
9.00 kHz
2.700 kHz
800Hz
240Hz
80Hz
24Hz
8Hz
Measured
(
3
Bandwidth
d
3.600 MHz
1.100 MHz
330.0 kHz
110.0 kHz
33.00 kHz
11.00 kHz
3.300 kHz
1.200 kHz
Max
360Hz
120Hz
36 Hz
12 Hz
Performance Tests 2-73

Test 5. Resolution
Bandwidth
Selectivity
Steps 7, 8 and 9. Resolution Bandwidth Selectivity
Spectrum
RES]
(
3 MHz
300
:
100
30 kHz
10
300 Hz
100 Hz
[FREQUHKYWANJ
20 MHz
1MHz 15MHz
kHz
kHz
500
kHz
200
3 kHz 50 kHz
1 kHz
30 Hz 500 Hz
10 Hz 100 Hz
10
5 MHz
2 MHz
kHz
kHz
kHz
5 kHz
2 kHz
Analyl
er
(VIDEOBW]
100 Hz
300 Hz
AUTO
AUTO
AUTO
AUTO
AUTO
AUTO
AUTO
AUTO
AUTO
AUTO
Bandwidth
Measured
60
dB
Measured Bandwidth Maximum
3
dB
Bandwidth (60 dB BW
60 dB points separated by
Selectivity Selectivity Ratio
t
3 dB BW)
I
I
I
I
I
I
cl00
15:l
15:l
15: 1
15:l
13: 1
13:l
13:l
11:l
11:l
Hz
2-74 Performance Tests

lkst
6. Resolution
Bandwidth
Switching
Uncertainty Test
Test 6. Resolution Bandwidth Switching Uncertainty Test
Step 6. Bandwidth Switching Uncertainty
1 MHz
3
300
100
30
10 kHz
3
1
300
100 Hz
30
10 Hz
‘FREQUENCY SPAN]
MHz
kHz
kHz
kHz
kHz
kHz
Hz
Hz
5
5
5
500
500
50
50
10 kHz
1
1
200
100 Hz
MHz
MHz
MHz
kHz
kHz
kHz
kHz
kHz
kHz
Hz
Deviation
(MKR
Readout,
0 (ref)
A
dB)
Allowable
Deviation
PI
0
(ref)
AZ1.00
Iko.50
zto.50
Ito.
dzo.50
kO.50
f0.50
f0.50
f0.50
1tO.80
f2.00
Performance Tests 2-75

Test 7. Input Attenuator Switching Uncertainty Test
Step 7. Input Attenuator Switching Uncertainty
10
20
30
40
50
60
70
(REFERENCE LEVEL]
ww
-50
-40
-30
-20
-10
0
+lO
Frequency
Synthesizer
Amplitude
Wm)
-52
-42
-32
-22
-12
-2
8
Deviation
(MARKER A
Amplitude
WV
0 (ref)
Corrected Allowable
Deviation Deviation
ow
0 (ref)
0-W
ztl dB
*l dB
ztl dB
kl dB
fl dB
kl dB
2-76 Performance Tests

Test
8. Frequency
Respons
g&
kep
12
SIGNAL INPUT 2
(20 MHz to 1.5
SIGNAL INPUT 1
15
(20 MHz to 1.5
SIGNAL INPUT 1
16
(20 MHz to 500 MHz)
SIGNAL INPUT 1
25
(100 kHz to 20 MHz)
SIGNAL INPUT 1
26
(100
SIGNAL INPUT 2
31
(100 kHz to 20 MHz)
kHz)
Signal Input
GHz)
GHz)
Test 8. Frequency Response Test
Min Measured
Max
42
SIGNAL INPUT 1
(1 kHz to 100
SIGNAL INPUT 1
48
1000 Hz
900 Hz
800 Hz
700 Hz
600 Hz
500 Hz
400 Hz
300 Hz
200 Hz
100 Hz
SIGNAL INPUT 1 (deviation in
49
100 Hz to 500 MHz (steps 16, 25, 42, or 48)
(overall max - overall min)
SIGNAL INPUT 2 (deviation in
100 kHz to 1.5
(overall max - overall min)
kHz)
GHz
dB)
dB)
(steps 12 or 31)
<2
<2
dB
dB
SIGNAL INPUT 1 (deviation in
50
100 Hz to 1.5
(overall max - overall min)
GHz
dB)
(steps 15, 16, 25, 42, or
48)
<3 dB
Performance Tests 2-77

Test 9. RF Gain Uncertainty Test
Step 6. 2nd LO Shift
Min
-1.0
Measured
dB
Max
+ 1.0
dB
2-78 Performance Tests
 Loading...