

Page 1

T.O. 33K3-4-2827-l
TECHNICAL MANUAL
CALIBRATION PROCEDURE
FOR
SPECTRUM ANALYZER
8563A (
(HEWLETT-PACKARD)
Distribution Statement
official use or for administrative or operational purposes only, 15 August 1991. Other requests for this
document shall be referred to AFMETCAL Detachment
Heath, OH 43056-6116.
Destruction Notice
disclosure of the contents or reconstruction of the document.
Distribution authorized to U. S. Government agencies and their contractors for
813 Irving-Wick Dr W, Suite 4M,
For unclassified, limited documents, destroy by any method that will prevent
Published under Authority of the Secretary of the Air Force
CHANGE 4
28 FEBRUARY 2003
Page 2

T.O. 33K3-4-2827-1
Date of issue for original and changed pages are:
Original..
Change..
Change
Change..
Change..
Page
No.
Title..
.....................................
A
2..
3
......................................
4
6
7..
8
......................................
9
......................................
10
16
18 -
20.............................
23.............................
21
24
....................................
25 -
29.............................
30
....................................
31
....................................
32
33..
34 . .
..................................
35 ....................................
36 ....................................
37..
..................................
38
....................................
39
....................................
40
41
42
....................................
43
....................................
44
46
47
....................................
48
....................................
49
....................................
50
....................................
51
....................................
52
....................................
53
....................................
54
60..
61
....................................
62
Blank..
...............O....................
................1............................
.................
...............
...............
...............................
...............................
.................................
...............................
15..
...........................
17..
...........................
...........................
.............................
.............................
...........................
........................
30 November 2000
......................28February 2002
.............................
......................
Change
No.
4
4
0
1
0
2
0
3
0
2
0
1
2
0
3
2
0
4
0
3
0
1
0
0
1
4
2
3
2
0
2
0
0
28
February 2003
Page
No.
A-l ..................................
A-2 Blank..
......................
Change
No.
0
0
Page
No.
* Change
No.
A Change 4
indicates an original page
Page 3

1 CALIBRATION DESCRIPTION:
T.O.
SPECTRUM ANALYZER
(HEWLETT-PACKARD)
Table 1.
Test Instrument (TI) Performance
Characteristics
Frequency Reference
Calibrator Amplitude
Frequency Readout
and Marker Count
Display Average
Noise Level
Range: 10 MHz
Accuracy:
Aging/year:
Settability:
Temperature:
Range: -10
Accuracy:
Range: Opt HO1 and S/N
9
9
Accuracy:
Frequency Readout:
<*(frequency readout X
frequency reference error + 5%
Marker Count:
reference error + 50 Hz X N ** + 1 LSD)
Range:
9
and S/N <3 124);
9
Opt 026 and S/N 23 124)
Specifications
to 22
Opt 026 and S/N 23 124,
to 26.5
frequency X frequency
to 22
to 26.5
X
X
X
(-10 to 55 “C) *
at 300 MHz
dB
(Opt HO1
(H51,
Test
Method
Compared to Frequency
Standard
Measured with a
Power Meter
Compared to a known
frequency from a
Synthesized Sweeper
With no input to the TI,
the Average Noise Level
is measured on the TI
CRT
Accuracy:
10
100
1 MHz to 2.9
2.9 to 6.46
6.46 to 13.0
13.0 to 19.7
19.7 to 22.0
(Opt HO1 and S/N ~3 124);
19.7 to 26.5
21
(H5 1, Opt 026 and S/N 23 124)
See footnotes at end of Table.
c-l 10
c-1 10
c-1 10
offset from carrier)
1
Page 4

T.O. 33133-4-2827-l
Table 1. (Cont.)
Test Instrument (TI)
Characteristics
Noise Sidebands
Resolution Bandwidth
Switching
Resolution Bandwidth
Accuracy and Selectivity
Performance
Specifications
Range:
and
Accuracy: Offset:
<(-86
20 Log N
<(-100
20 Log N **)
<(-110
20 Log N
Range:
Accuracy:
300
10 Hz to 1 MHz and 2 MHz
(referenced to
RES BW setting)
Range: 10 Hz to 2 MHz
Accuracy:
10 Hz to 300
1 MHz,
2 MHz,
for Opt H51);
Selectivity (RES BW
to 3
BW
+
+
+
Hz),
offsets
Test
Method
Signal is applied to TI
and the Noise Sidebands
are measured
With an external signal
applied to the TI, the
amplitude reference is set
with RES BW set to
300
The remaining
RES BW settings are
compared to 300
amplitude
Compared to a known
signal level
Input Attenuator
IF Gain
Scale Fidelity
See footnote at end of Table.
2
Range: ( referenced to 10
setting) 20 to 70
9
2.9
Accuracy:
fl.8
maximum
Range: (10
Attenuator setting)
0 to -80
Accuracy:
Range: 0 to 90
.O dB
with RES BW
2300 Hz setting; 0 to 100
RES BW setting 1100 Hz
Accuracy:
LOG,
f1.5
(0 to -100
LINEAR:
to a maximum of
over the 0 to -90
with RES BW
of Reference Level
to
step,
with
range
100 Hz);
Page 5

Table 1. (Cont.)
T.O.
Test Instrument (TI)
Characteristics
Frequency Response
Performance
Specifications
Range: Opt HO1 and S/N
9
to 22
9
to 26.5
H51, Opt 026 and S/N 13124;
9
to 19.7
Accuracy: (Relative,
setting)
9
to 2.9
2.9 to 6.46
6.46 to 13.0
13.0 to 19.7
19.7 to 22.0
and S/N <3 124);
19.7 to 26.5
Opt 026 and S/N 13124)
Accuracy: (Absolute, referenced to
CAL OUT
9
to 2.9
9
to 6.46
9
to 13.0
9
to 19.7
9
to 22
and S/N
9
Opt 026 and S/N 23124)
124);
to 26.5
Opt
10
10
attenuator setting)
attenuator
(Opt HO1
(H51,
(Opt HO1
(H51,
Test
Method
Compared to a
leveled signal
Frequency Span
Sweep Time
Range: 0 Hz, 100 X N ** to
19.25
Accuracy:
Range: 50
50 ms to 60
Accuracy:
Opt
Opt
(23.75
Opt
026
1); 130 ms,
ms:
and
for
and S/N23124)
to 60
(Zero Span);
(Span 1100 Hz X N **)
ms,
250 ms,
Compared to a signal
of known frequency
A modulated signal is
applied to the TI and the
sweep time is determined
for
Change 1 3
Page 6

T.O.
Table 1. (Cont.)
Test Instrument (TI)
Characteristics
Residual
Responses
Residual FM
Second
Harmonic
Performance
Range: (0
200
for Opt H5 1)
Accuracy: 200
18
Range: (Zero Span)
Opt HO1 and S/N
9
9
Opt
Accuracy:
in 20 ms);
20 ms for Opt H5 1
Range: 10 MHz to
2.9
10 MHz to 1.45
1.45 to 11
of attenuation)
to 6.46
to 6.46
degradation to
for Opt H5 1
to 22
to 26.5
1, Opt 026 and S/N 13 124
Hz X N ** p-p
Hz X N ** p-p in
and
(18
Test
Method
With no input to TI
the residual response
are measured
up to
Signal is applied to TI
and Residual FM is
measured
Reference
is established and
amplitude of harmonic
is measured
Third Order
Intermodulation
Distortion
Accuracy: 10 MHz to 2.9
for -40
mixer;
for -10
<-60
<-72
Range: 10 MHz to
9
Accuracy: (two -30
signals at input mixer and
separation)
<-70
<-75
9
to 2.9
at input mixer;
10 MHz to 1.45
1.45 to 11
Opt
to 10 MHz,
10 MHz to 2.9
to 10 MHz, <-70
at input
2.9
1 and Opt 026,
10 MHz to
Opt H51 and Opt 026,
c-100
2.9
10 MHz
<-75
With two separate signals
applied at the same time,
a reference is established
and distortion is measured
4
Page 7

* Typical or Operational Specifications. Not calibrated.
** N = LO Harmonic (See below):
T.O.
Frequency Band
9
to 2.9
2.75 to 6.46
5.86 to 13.0
12.4 to 19.7
19.1 to 22.0
19.1 to 26.5
(Opt
(Opt
and S/N 23124)
2 EOUIPMENT REOUIREMENTS:
Minimum Use Calibration
Noun
2.1
FREQUENCY Range:
Specifications
STANDARD
Accuracy: 12.5 X
2.2 ELECTRONIC
Range: 0.1666 Hz to Hewlett-Packard
COUNTER 200
and S/N
HO1
Opt 026
MHz
at 10 MHz
Band
0
1
2 2
3
4 4
4
Equipment
Austron
2100F
LO Harmonic
1
1
3
4
Item
2.3 SYNTHESIZED
SWEEPER (26.5
2.4 POWER METER
2.5 POWER SENSOR
Accuracy:
count of LSD
at 10 MHz
to
Range:
10 MHz
22
for Opt 026 and 8340B
S/N 23
124A)
to -35
Accuracy:
Frequency:
SSB Phase Noise:
at 50
Range: -30 to
offset
Accuracy:
Range: 300 MHz at
-20
Accuracy:
TAR 2.23: 1
Hewlett-Packard
Hewlett-Packard
436A
Hewlett-Packard
8481A
5
Page 8

T.O.
Minimum Use
Noun
2.6 POWER SENSOR
Specifications
Range: 50 MHz to 22
(26.5
for
OPT 026 and
23
Accuracy:
2.7 SPECTRUM
Range: 4.8
to 2.8
ANALYZER
Accuracy:
2.8 POWER SPLITTER Range: 10 MHz to 26.5
Accuracy: Tracking
9
2.9 SIGNAL
to 18
18 to 26.5
Range: 2.5
10.25
50.40
GENERATOR
Accuracy:
SSB Phase Noise at 10
offset
118 dBc/I-Iz
Calibration
Hewlett-Packard
8485A
Hewlett-Packard
Hewlett-Packard
Hewlett-Packard
8663A
2.10 FUNCTION
GENERATOR
2.11 SYNTHESIZED
LEVEL
GENERATOR
2.12 STEP
ATTENUATOR
I
2.13 STEP
I
ATTENUATOR
2.14 TERMINATION
Range: 0.1 Hz to 500
Accuracy:
Range: 0 to -80
Accuracy:
Range: 9
at 50 MHz
to 50 MHz
(Flatness)
Accuracy: f0.375
Range: 0 to 20
in 10 dB steps
Accuracy:
Range: 0 to 10
in 1 dB steps
Accuracy:
Range: 50
Accuracy:
Hewlett-Packard
3325B
Hewlett-Packard
3335A
Hewlett-Packard
8496B
Hewlett-Packard
8494B
Hewlett-Packard
908A
6 Change 2
Page 9

T.O.
Noun
2.15 SYNTHESIZED
SIGNAL
GENERATOR
2.16 DC BLOCKING
CAPACITOR
2.17 POWER
DIVIDER
2.18 LOW PASS
FILTER
2.19 LOW PASS
FILTERS
Minimum Use Calibration
Specifications
Range: 2.7 to 5.1
to -35
Accuracy:
SSB Phase Noise
at 50
Range: N/A
Accuracy
Range: 2.7 to 5.1
Accuracy: N/A
Range: 50 MHz, rejection
Accuracy: Verify before use
Range: 4.1
Accuracy: Verify before use
at 80 MHz
at 5.9
offset
rejection
Equipment
Hewlett-Packard
8673D H15
Hewlett-Packard
08553-60169
Weinschel
1506
Hewlett-Packard
0955-0306
Hewlett-Packard
360D
SubItem
RCL Electronics
2.20 ATTENUATOR
2.21 PULSE
GENERATOR
2.22 ATTENUATOR
3 PRELIMINARY OPERATIONS:
3.1
Review and become familiar with entire procedure before beginning Calibration Process.
Unless otherwise designated, and prior to beginning the Calibration Process,
ensure that all test equipment voltage and/or current outputs are set to zero (0)
or turned off, where applicable. Ensure that all equipment switches are set to
the proper position before making connections or applying power.
3.2 Connect TI and test equipment to appropriate power source and set all POWER switches to ON. Allow a
2 hour warm-up time for the TI and allow test equipment to warm-up as required by manufacturer of test
equipment.
Range: 10
Accuracy: N/A
Range: 0.1 Hz to 200
Accuracy:
Range: 20
Hewlett-Packard
8493C OPT-01 0
Hewlett-Packard
8116A
Hewlett-Packard
8491B OPT 020
I
3.3 After the TI has warmed up as specified, perform the Trace Alignment Procedure and Reference Level
Calibration as outlined in Chapter 2 of the Spectrum Analyzer User’s Guide.
Change 2 7
Page 10

T.O.
3.4 Become familiar with the TI controls settings before proceeding with the calibration. The procedure will
identify the Hardkeys as upper case and Bold and the Softkeys (Menu keys) as upper case only. Values shall be
entered in by use of the DATA key pad. For example: Press TI AMPLITUDE, REF LVL and set to -10
The AMPLITUDE key is a
DATA key pad, and then push the
3.5 The TI options and configurations are listed as follows:
the REF LVL is a
key which is also a part of the DATA keys.
(Menu key), the 1 and 0 are entries using the
a) Std TI with S/N
range to 26.5
b) Opt EOl-configuration that includes external mixers. Frequency range is 22
c)
d)
e) OPT
OPT
g) OPT
extend the frequency range to 50
mixers do not require calibration.
Make copies of Table 6 and Table 8 for use as Calibration Worksheets.
3.7 Perform only that portion of the procedure that pertains to the TI being calibrated.
4 CALIBRATION PROCESS:
4.1 FREOUENCY REFERENCE CALIBRATION:
configuration and frequency range of
OPT
1- Frequency range is 26.5
1- Includes OPT
consists of a special configuration Spectrum Analyzer 8563A OPT H36 and two mixers which
Unless otherwise specified, verify the results of each test and take corrective
action whenever the test requirement is not met, before proceeding.
have a frequency range of 22
All models and serial numbers extend frequency range to 26.5
1 and two external mixers.
The OPT H36 TI has the same specs as the standard TI, and the
NOTE
Std TI with S/N 23124 have extended frequency
NOTE
Adjustment of the Time Base Oscillator is normal due to the Aging Rate of the
crystal, This is common to all Quartz Oscillators. However, in order to ensure
the reliability of the TI, the following action will be taken: If TI passes the
following applicable steps, NO ADJUSTMENT ACTION should be entered
into the Maintenance Data Collection System. If the TI failed, perform the
applicable steps listed in applicable Maintenance Technical Order or
Commercial Data and enter appropriate ADJUSTMENT ACTION into the
Maintenance Data Collection System.
4.1
Connect Frequency Standard 10 MHz REF OUT to the Electronic Counter EXT FREQ STD INPUT
(l-10 MHz). Set Electronic Counter INT
4.1.2 Connect TI 10 MHz REF OUTPUT to the Electronic Counter CH A Input. Set Electronic Counter
switch to
The values in the following steps are derived from and multiplication of the
Aging Rate to determine the offset at twelve months
specification. Use these calculated twelve month values (including Settability)
regardless of length of the calibration interval for this TI in T.O.
STD switch to EXT STD.
NOTE
and
adding the Settability
Page 11

T.O. 33K3-4-2827-1
4.1.3 Adjust Electronic Counter controls for a stable indication and push RESET. Verify the Electronic Counter
indication is 9 999 998.8 to 10 000 001.2 Hz.
4.1.4 Set Electronic Counter INT STD/EXT STD switch to INT STD and disconnect test setup.
4.2 CALIBRATOR AMPLITUDE CALIBRATION:
4.2.1 Standardize the Power Meter and Power Sensor (2.5) for a 300 MHz measurement.
4.2.2 Connect the Power Sensor (2.5) to the
CAL OUTPUT.
4.2.3 The Power Meter must indicate between -9.7 to -10.3 dBm.
4.2.4 Disconnect the test setup.
4.3 FREQUENCY READOUT AND MARKER COUNT CALIBRATION:
4.3.1 Connect equipment as shown in Figure 1.
10 MHz REF
SYNTHESIZED SWEEPER
FREQUNECY
RFOUTPUT
STANDARD
0
INPUT 50
0
IN/OUT
Figure
4.3.2 Press the Synthesized Sweeper INSTR PRESET and set the controls as follows:
cw
POWER LEVEL
1.5
-10
Frequency Standard switch (rear panel) EXT
4.3.3 Press the TI PRESET key. Set controls as follows:
FREQUENCY
CENTERFREQ
SPAN
4.3.4 Press the TI RECALL, MORE 1 OF 2, FACTORY PRSEL PK, PEAK SEARCH.
4.3.5 Verify the
MKR frequency indication is between the corresponding values listed in the Limits column of
1.5
Table 2.
4.3.6 Set the Synthesized Sweeper to the remaining Applied values listed in Table 2. Set TI controls to the
remaining corresponding values in Table 2 and repeat steps 4.3.4 and 4.3.5.
Change3 9
Page 12

T.O. 33K3-4-2827-1
Table 2.
Applied
1.5
1.5
1.5
1.5
1.5
1.5
4.0
4.0
4.0
4.0
4.0
TI
SPAN (MHz)
1
10
20
50
100
1000
1
10
20
50
100
1.5
1.5
1.5
1.5
1.5
1.5
4.0
4.0
4.0
4.0
4.0
Limits
1.499948 to 1.500052
1.49948 to 1.50052
1.49895 to 1.50105
1.49745 to 1.50255
1.4948 to 1.50520
1.4500 to 1.5500
3.999948 to 4.000052
3.99948 to 4.00052
3.99895 to 4.00105
3.99745 to 4.00255
3.9948 to 4.0052
4.0
9.0
9.0
9.0
9.0
9.0
9.0
16.0
16.0
16.0
16.0
16.0
16.0
1000
1
10
20
50
100
1000
1
10
20
50
100
1000
4.0
9.0
9.0
9.0
9.0 8.99745 to 9.00255
9.0
9.0
16.0
16.0
16.0
16.0
16.0
16.0
3.9500 to 4.0500
8.999948 to 9.000052
8.99948 to 9.00052
8.99895 to 9.00105
8.99480 to 9.00520
8.950 to 9.050
15.999948 to 16.000052
15.99948 to 16.00052
15.99895 to 16.00105
15.99745 to 16.00255
15.9948 to 16.0052
15.950 to 16.050
10
Page 13

T.O.
Applied
21.0
21.0
21.0
21.0 50 21.0
21.0 100 21.0
21.0
4.3.7 Set controls as follows:
SPAN
FREQ COUNT
COUNTER RES
Table 2.
TI
SPAN (MHz) FREQ
1
10
20 21.0 20.99895 to 21.00105
1000
(Cont.)
TI CENTER
21.0
21.0
21.0
Limits
20.999948
20.99948 to 21.00052
20.99745 to 21.00255
20.9948 to 21.0052
20.950
1 MHz
1 Hz
to 21 BOO052
to 2
1.050
4.3.8 Press the TI PEAK SEARCH.
4.3.9 Verify the TI CNTR frequency indicates within
4.3.10 Set the Synthesized Sweeper to the remaining applied values listed in the Applied column of Table 3, set
the TI controls to the remaining corresponding values in Table 3 and repeat steps 4.3.8 and 4.3.9.
TI
4.3.11
Applied
1.5
4.0
9.0
16.0
21.0
Set the Synthesized Sweeper for minimum output and disconnect the test setup.
SPAN (MHz)
1
1
1
1
1
values listed in the Limits column of Table 3.
Table 3.
TI CENTER
FREQ
1.5
4.0
9.0 8.99999989 to 9.00000011
16.0 15.99999984 to 16.00000016
21.0 20.99999979
Limits
1.49999994 to 1.50000006
3.99999994 to 4.00000006
to 21 .oooooo21
11
Page 14

T.O.
4.4 DISPLAYED AVERAGE NOISE LEVEL CALIBRATION:
4.4.1 Connect the TI CAL OUTPUT to the TI INPUT 50
controls as follows:
FREQUENCY
CENTER FREQ 300 MHz
SPAN
AMPLITUDE
REF LVL -10
LOG
BW
RES BW 10 Hz
VIDEO BW 1 Hz
4.4.2 Press the TI PEAK SEARCH, CAL, and REF LVL ADJUST keys.
4.4.3 Use the TI knob to adjust the REF LVL CAL number until the TI MKR indicates -10.00
TI STORE REF LVL.
connector. Press the TI PRESET and set the TI
100 Hz
1
Press
4.4.4 Disconnect the TI CAL OUTPUT from the TI INPUT connector. Connect the Termination to the TI
INPUT 50
4.4.5 Set the TI controls as follows:
4.4.6 Press the TI BW and VID AVG ON keys. Set to 10 Hz.
4.4.7 Press the TI TRACE and CLEAR WRITE A keys. Wait until VAVG 10 is displayed on the TI CRT.
4.4.8 Press the
10.7
connector.
FREQUENCY
CENTER FREQ 10
SPAN
AMPLITUDE
LOG
REF LVL -50
MARKERS
MARKERS OFF
TRIG
SGL SWP, MKR, and MKRNOISE ON keys. The TI MKR amplitude must indicate
1170 Hz
10
12
Page 15

7.7
is added to the TI marker amplitude indications to account for the TI
normalization to a 1 Hz bandwidth and corrections for the log amplifiers and
envelope detector.
4.4.9 Set the TI controls as follows:
CENTER FREQ 99
T.O.
NOTE
MARKERS
OFF
TRIG
4.4.10 Repeat steps 4.4.7 and 4.4.8. The TI MKR amplitude must indicate c-l 17.7
4.4.11 Set the TI controls as follows:
FREQUENCY
CENTER
START FREQ
1
STOP FREQ 2.9
MARKERS
OFF
BW
BW
1
VIDEO BW 10
4.4.12 Press the TI SGL
VID AVG
key and wait for sweep to complete.
OFF
MHz
MHz
4.4.13 Press the TI MKR, MKRNOISE ON, and PEAK SEARCH keys.
4.4.14 Press the TI MKR
and MARKER
SPAN
BW
CF keys. Set the TI controls as follows:
RESBW
VIDEO BW 1 Hz
VID AVG ON
TRIG
4.4.15 Repeat steps 4.4.7 and 4.4.8. The TI MKR amplitude must indicate e-137.7
1170 Hz
10
Hz
CON-r
13
Page 16

T.O.
4.4.16 Set the TI controls as follows:
FREQUENCY
CENTERFREQ
START FREQ
STOP
MARKERS
BW
BW
VIDEO BW
2.9
6.46 GHz
OFF
1
MHz
10
VID AVG OFF
4.4.17 Repeat steps 4.4.12 through 4.4.15. The TI MKR amplitude must indicate c-138.7
4.4.18 Set the TI controls as follows:
FREQUENCY
START FREQ
STOP
MARKERS
6.46 GHz
13.0
BW
1
RES BW
VIDEO BW
VID AVG
MHz
10
OFF
4.4.19 Repeat steps 4.4.12 through 4.4.15. The TI MKR amplitude must indicate c-127.7
4.4.20 Set the TI controls as follows:
FREQUENCY
START
STOP
MARKERS
13.0
19.7
OFF
14
Page 17

BW
T.O.
RES BW
1 MHz
VIDEO BW 10
VID AVG OFF
4.4.21 Repeat steps 4.4.12 through 4.4.15. The TI MKR amplitude must indicate c-122.7
4.4.22 Set the TI controls as follows:
FREQUENCY
START
STOP
19.7
22.0
(Opt HO1 and S/N
26.5
(Opt H51, Opt 026 and S/N 23124)
MARKERS
OFF
BW
RES BW 1 MHz
VIDEO BW 10
VID AVG OFF
4.4.23 Repeat steps 4.4.12 through 4.4.15. The TI MKR amplitude must indicate
4.4.24 Disconnect the Termination from the TI INPUT 50
connector.
4.5 NOISE SIDEBAND CALIBRATION:
4.5.1 Connect the Signal Generator
OUTPUT connector to the TI INPUT 50
4.5.2 Set the Signal Generator controls as follows:
FREQUENCY 2500 MHz
AMPLITUDE -15
4.5.3 Press the TI PRESET key. Set controls as follows:
FREQUENCY
CENTER FREQ
2.5
CF STEP
SPAN
17.7
connector.
1 MHz
15
Page 18

T.O.
AMPLITUDE
REF LVL
PEAK SEARCH
MKR
-10
SIG TRK ON
SPAN
4.5.4
Wait for completion of two sweeps and then press TI controls as follows:
MKR
10
SIG TRK OFF
BW
RES BW
SPAN
1
ZERO SPAN
BW
1
VIDEO BW
Hz
4.5.5 Set the Signal Generator output level to place the peak of the signal on the TI CRT Reference Level.
4.5.6 Press the TI SGL SWP and SGL SWP. Wait for the sweep to complete and set TI controls as follows:
MKR
MKR NOISE ON
MARKER DELTA
NOTE
In the following steps, the TI A MKR will indicate in
4.5.7 Press TI FREQUENCY, CENTER FREQ,
and SGL SWP. Wait for sweep to complete and verify the
or
instead of
TI A MKR amplitude indication is c-86
4.5.8 Press TI FREQUENCY, CENTER FREQ, and SGL SWP. Wait for sweep to complete and verify the
TI A MKR amplitude indication is c-86
4.5.9 Press TI FREQUENCY, CENTER FREQ,
and CF STEP 30
16 Change 2
Page 19

T.O.
45.10 Press the TI SGL SWP and SGL
Wait for the sweep to complete and set TI controls as follows:
MKR
MKR NOISE ON
MARKER DELTA
45.11 Press TI FREQUENCY CENTER FREQ,
TI A MKR amplitude indication is
100
and SGL SWP. Wait for sweep to complete and verify the
45.12 Press TI FREQUENCY, CENTER FREQ, and SGL SWP. Wait for sweep to complete and verify the
TI A MKR amplitude indication is
45.13 Press TI FREQUENCY, CENTER FREQ,
100
and CF STEP 100
4.5.14 Press the TI SGL SWP and SGL SWP. Wait for the sweep to complete and set TI controls as follows:
MKR
MKR NOISE ON
MARKER DELTA
4.5.15 Press
TI A MKR amplitude indication is
FREQUENCY, CENTER FREQ,
110
and SGL SWP. Wait for sweep to complete and verify the
I
4.5.16 Press TI FREQUENCY, CENTER FREQ, and SGL SWP. Wait for sweep to complete and verify the
TI A MKR amplitude indication is
10
4.5.17 Set Signal Generator output to minimum and disconnect test setup.
4.6 RESOLUTION BANDWIDTH SWITCHING CALIBRATION:
4.6.1 Connect equipment as shown in Figure 2.
10 MHz
1 SYNTHESIZED LEVEL
IN/OUT
INPUT 50
Figure 2.
4.6.2 Set the Synthesized Level Generator controls for a 50 MHz at -5.00
OUTPUT 50
Change 2 17
Page 20

T.O.
4.6.3 Press the TI PRESET, CAL, and FULL IF ADJ keys. Wait for the IF ADJUST STATUS message to
disappear, then set the TI controls as follows:
FREQUENCY
CENTER FREQ 50 MHz
AMPLITUDE
LOG
SPAN
BW
RES BW
4.6.4 Press the TI CAL, IF ADJ OFF, PEAK SEARCH, MKR
4.6.5 Press the TI PEAK SEARCH and MARKER DELTA keys.
4.6.6 Press the TI SPAN and set to the next value listed in the Span column of Table 4.
4.6.7 Press the TI BW,
Press the TI
4.6.8 Press the TI CAL and ADJ CURR IF STATE keys. Wait for the IF ADJUST STATUS message to
disappear.
4.6.9 Press the TI PEAK SEARCH key.
4.6.10 The TI A MKR amplitude must indicate between the corresponding values listed in the Limits column of
Table 4.
4.6.11 Repeat steps 4.6.6 through 4.6.10 for the remaining values listed in Table 4.
BW and set to the corresponding value listed in the RES BW column of Table 4.
RATIO and set to 0.100.
Table 4.
MKR REF LEVEL.
1
1 MHz
300
18
TI SPAN TI RES BW Limits
1 MHz
10 MHz
5 MHz
500
100
50 kHz
5lcHz
300 kHz
2
MHz
MHz
100
30
10
300
Hz
Reference
-0.5
to
-0.5
to
-0.5
to
-0.5
to
-0.5
to
-0.5
to
-0.5
to
-0.5
to
Page 21

Table 4. (Cont.)
TI SPAN TI RES BW Limits
-0.5
-0.5
-0.5
to
to
to
500 Hz
30
Hz
4.6.12 Set the Synthesized Level Generator output to minimum and leave equipment connected.
4.7 RESOLUTION BANDWIDTH ACCURACY AND SELECTIVITY CALIBRATION:
4.7.1 Set the Synthesized Level Generator controls as follows:
T.O.
1
FREQUENCY
AMPLITUDE -5
AMPTD INCR
4.7.2 Press the TI PRESET, CAL and FULL IF ADJ. Wait for the IF ADJUST STATUS message to disappear.
Press IF ADJ OFF. Set the TI controls as follows:
FREQUENCY
CENTER FREQ 40 MHz
SPAN
AMPLITUDE
LOG
BW
RES BW 2 MHz
VIDEO BW
4.7.3 Adjust the Synthesized Level Generator AMPLITUDE controls to place peak of the signal 2 to 3 divisions
below the reference level on the TI CRT.
40
MHz
1 dB
5 MHz
1
300 Hz
4.7.4 Set the Synthesized Level Generator AMPTD INCR to 3
4.7.5 Press the TI CAL and ADJ CURR IF STATE. Wait for the IF ADJUST STATUS message to disappear
before continuing. Press TI SAVE, SAVE STATE, then STATE 0.
4.7.6 Set the Synthesized Level Generator frequency to
setting.
4.7.7 Press TI PEAK SEARCH, then MARKER DELTA.
as indicated in Table 5 for the TI current RES BW
19
Page 22

T.O.
4.7.8
Set the Synthesized Level Generator frequency
5 MHz 38.0 42.0
to F2 as indicated in Table
Table 5.
sized Level Ge
for the TI current RES BW
2 MHz 39.2
500
200
50
20
2kHz 39.999 2 40.000 8
500 Hz 39.999 8 40.000 2
200 Hz 39.999 92
4.7.9 Press
the Actual column in Table 6 for the current RES BW.
PEAK SEARCH.
Record the A MKR frequency indication as
40.8
39.8 40.2
39.92 40.08
39.98
39.992 40.008
39.998 40.002
39.999 96 40.000 04
the actual SPAN measurement in
40.02
40.000 08
4.7.10 Set the Synthesized Level Generator frequency to 40 MHz.
4.7.11 Perform steps 4.7.12 through 4.7.14 for TI Resolution
proceed to step 4.7.15.
4.7.12 Press Synthesized Level Generator AMPLITUDE
4.7.13 Press TI PEAK SEARCH, then MARKER DELTA.
4.7.14 Press Synthesized Level Generator AMPLITUDE
4.7.15 Press
4.7.16 For TI Resolution Bandwidths 2300 Hz, perform step 4.7.16.1 and proceed to step 4.7.17. For TI
Resolution Bandwidths 1100 Hz, perform step 4.7.16.2 and proceed to step 4.7.17.
20
SGL SWP and wait for the completion of a new sweep.
Bandwidths
from2MHz to 300 Hz only.
Otherwise,
Page 23

T.O.
4.7.16.1 Press TI MKR. Rotate the TI Control Knob CCW until the A MKR amplitude indicates 0
The marker should be on the left-hand skirt of the signal. If the marker cannot be set exactly to 0
the marker is just above or just below the actual -3 dB point.
4.7.16.2 Press TI PEAK SEARCH, MARKER DELTA. Rotate the TI Control Knob CCW until the A MKR
amplitude indicates -3
Press TI MARKER DELTA. Rotate the TI Control Knob CW until the TI A MKR amplitude indicates
0
The active marker should be on the right-hand skirt of the signal. If the marker was just above
-3
in the previous step, set the marker just below the -3
previous step, set the marker just above the -3 dB point.
4.7.18 Record the TI A MKR frequency indication as the measured -3
Measurement Measured column of Table 6.
4.7.19 Using the values recorded in Table 6, calculate the corrected -3
the result in the -3
4.7.20 Calculate the 3
values listed in the Limits column of Table 6.
The marker should be on the left-hand skirt of the signal.
point. If the marker was just below -3
bandwidth in the -3
bandwidth as shown below and record
BW Measurement Corrected column in Table 6 for the current RES BW setting.
BW error as shown below. The calculated error must be within the corresponding
M.17
note whether
in the
BW
I
3dBBWerror
Span Measurement
2 MHz 4 MHz ___ MHz
1 MHz
300
100
30 kHz 40 kHz
10
3kHz 4
1.6 MHz MHz
400 kHz
160
16kHz
Actual
(Corrected
Table 6.
3
BW)
RES BW setting
RES BW setting
-3
BW
Measurement
Measured Corrected Limits
TI Opt H51)
for
Change 1 21
Page 24

T.O.
RES BW
Setting
Span Measurement
Ideal Actual
1.6
Table 6. (Cont.)
-3
BW
Measurement
Measured Corrected
3dBBW
Error
Limits
300 Hz
30 Hz 80 Hz
10 Hz
4.7.21 Press
4.7.22 Set the TI Span and Resolution Bandwidth to the next values listed in Table 5 and repeat steps
through 4.7.21.
4.7.23 Repeat step 4.7.22 for the remaining values listed in Table 5 and Table 6 for each TI Resolution
Bandwidth.
4.7.24 Set the TI controls as follows:
MKR, MARKERS OFF, TRIG, SWP CONT.
Hz
160 Hz
80 Hz
SPAN
AMPLITUDE
LOG
BW
__
__
50 MHz
10
RES BW 2 MHz
VIDEO BW
4.7.25 Set the Synthesized Level Generator controls as follows:
AMPLITUDE
AMPTD INCR
4.7.26 Press the TI CAL and ADJ CURR IF STATE. Wait for the IF ADJUST STATUS message to disappear.
Press TI PEAK SEARCH, SAVE, SAVE STATE, STATE 0.
4.7.27 Adjust the Synthesized Level Generator AMPLITUDE controls until the TI MKR amplitude indicates
0
kO.17
4.7.28 Set the Synthesized Level Generator AMPTD INCR to 60
22 Change I
300 Hz
-3
Page 25

T.O.
4.7.29 Set the Synthesized Level Generator frequency to Fl as indicated in Table 7 for the TI current RES BW
setting.
4.7.30 Press TI PEAK SEARCH, MARKER DELTA.
4.7.3 1
Set the Synthesized Level Generator frequency to F2 as indicated in Table 7 for the TI current RES BW
setting.
Table 7.
Synthesized Level Generator
RES BW
SPAN
(MHz) F2 (MHz)
2 MHz 50 MHz
1 MHz
300 kHz
100 kI-Iz
30
3kHz
300
Hz
4.7.32 Press TI PEAK SEARCH. Record the A MKR frequency indication as the actual Span measurement in
20
MHz
5 MHz
2 MHz
500
200
50 kHz
20
24.0 56.0
32.0 48.0
38.0 42.0
39.2 40.8
39.8 40.2
39.92 40.08
39.98
39.992 40.008
39.998 40.002
40.02
the Actual column in Table 8 for the RES BW setting to be measured.
Table 8.
-60
BW
RES BW
Setting
Span Measurement Measurement
Ideal
Actual Measured
Corrected
Limits
(ratio)
I
2MHz
1 MHz
300 kHz
100
30
10
32
MHz
16 MHz
4 MHz
1.6 MHz
400 kHz
160 kI-Iz
MHz
MHz
MHz
MHz
Change 1 23
Page 26

T.O.
BW Span Measurement
Setting
Ideal Actual
Table 8. (Cont.)
-60
BW
Measurement
Measured Corrected
Limits
(ratio)
3kHz
300
Hz
4.7.33 Set the Synthesized Level Generator frequency to 40 MHz.
4.7.34 Press Synthesized Level Generator AMPLITUDE
4.7.35 Press
4.7.36 Press Synthesized Level Generator AMPLITUDE
4.7.37 Press TI SGL
4.7.38 Press TI MKR. Rotate the TI Control Knob CCW until the A
The marker should be on the left-hand skirt of the signal. If the marker cannot be set exactly to 0
the marker is just above or just below the actual -60
4.7.39 Press TI MARKER DELTA. Rotate the TI RPG knob CW until the A
The active marker should be on the right-hand skirt of the signal. If the marker was just above -60
in the previous step, set the marker just below the -60
previous step, set the marker just above the -60 dB point.
40 kHz
16
4kHz
RECALL, RECALL STATE, STATE 0, then press TI PEAK SEARCH, MARKER DELTA.
and wait for the completion of a new sweep.
point.
point. If the marker was just below -60
amplitude indicates 0
amplitude indicates 0
M.17
note whether
in the
4.7.40 Record the A MKR frequency as the measured -60
Measured column in Table 8 for the current RES BW setting.
4.7.41 Calculate the corrected -60
Measurement Corrected column in Table 8.
Record the corrected -60
4.7.43 Calculate the TI Selectivity by dividing the appropriate -60
in Table 8 by the -3
within the corresponding values listed in the Limits column of Table 8.
4.7.44 Press TI MKR, MARKERS OFF, TRIG, SWEEP CONT.
4.7.45 Repeat steps 4.7.24 through 4.7.44 for the remaining RES BW and
4.7.46 Set the Synthesized Level Generator for minimum output and disconnect test setup.
24 Change 2
BW Measurement Corrected value recorded in Table 6. The calculated ratio must be
bandwidth as shown below and record the result in the -60
bandwidth in the Corrected column in Table 8 for the current RES BW setting.
bandwidth in the -60
BW Measurement Corrected value recorded
settings in Table 7 and Table 8.
BW Measurement
BW
Page 27

4.8 INPUT ATTENUATOR CALIBRATION:
4.8.1 Connect equipment as shown in Figure 3.
T.O.
SYNTHESIZED LEVEL
GENERATOR
OUTPUT 50 !A
0
STEP
ATTENUATORS
Figure 3.
4.8.2 Set the Step Attenuators to 0
4.8.3 Set the Synthesized Level Generator controls as follows:
FREQUENCY 50 MHz
AMPLITUDE -50
AMPTD INCR
10 MHz
IN/OUT
INPUT 50 R
4.8.4 Press the TI PRESET, CAL, and REALIGN LO
controls as follows:
FREQUENCY
CENTERFREQ
SPAN
AMPLITUDE
REF LVL -70
LOG
BW
RES BW
VIDEO BW
4.8.5 Adjust the Step Attenuators to place the peak of the signal two to three divisions below the TI CRT
Reference Level.
IF keys. Wait for TI adjustment to finish. Set the TI
50 MHz
1
3
1 Hz
25
Page 28
T.O.
4.8.6 Press the TI SGL SWP key and press SGL SWP key again. Wait for the sweep to complete.
4.8.7 Press the TI MKR and MARKER DELTA keys.
4.8.8 Press the Synthesized Level Generator
4.8.9 Press TI AMPLITUDE and REF LVL keys. Enter the corresponding value listed in the TI REF LVL
column in Table 9. Press TI
Table 9.
4.8.10 Press the TI SGL
4.8.11 Verify the TI A MKR amplitude indication is within 9.4 to 10.6
indication.
4.8.12 Repeat steps 4.8.8 through 4.8.11 for the remaining corresponding values listed in Table 9.
Applied TI REF LVL
-50
-40 -60 20 9.4 to 10.6
-30 -50 30 18.8 to 21.2
-20 -40 40 28.2 to 31.8
key and enter the corresponding value listed in the TI
and wait for the sweep to complete.
-70
to the next value listed in the Applied column of Table 9.
column in
Record the TI A MKR amplitude
Table 9.
TI
Limits
10 Reference
-10 -30
0 -20 60 48.2 to 51.8
-10 70 58.2 to 61.8
4.8.13 Determine the Incremental Error for the TI
current TI A MKR amplitude indication from the previous TI A MKR amplitude indication. Also subtract 10
Verify the results are within -0.6 to 0.6
Example:
Incremental Error = current TI MKR amplitude indication
Incremental Error for 30 dB = TI A MKR indication for 30 dB
Incremental
Increment Error for 30 dB = 0.01 dB
4.8.14 Set all outputs to minimum and leave equipment connected.
4.9 IF GAIN CALIBRATION:
4.9.1 Set the Synthesized Level Generator controls for 50 MHz at
attenuation.
30
= 20.3
For example:
-10.2
settings of
previous TI MKR amplitude indication
TI A MKR indication for 40 dB
Set the Step Attenuators for 10
38.2 to 41.8
by subtracting the
10 dB
IO dB
of
26
Page 29
T.O.
4.9.2 Press the TI PRESET, CAL, and REALIGN LO
4.9.3 Set the TI controls as follows:
FREQUENCY
CENTER FREQ 50 MHz
SPAN
AMPLITUDE
LOG
BW
RES BW 1
VIDEO BW
4.9.4 Adjust the Step Attenuators to place the peak of the signal 2 or 3
4.9.5
4.9.6 Set the Synthesized Level Generator to the next value listed in the Applied column of Table 10.
4.9.7 Press the TI AMPLITUDE, REF LVL, and set to the corresponding value listed in the REF LVL column of
Table
the TI SGL SWP, SGL SWP, MKR, and MARKER DELTA keys.
Press the TI SGL SWP key.
IF keys. Wait for the adjustments to finish.
1
1 Hz
below the TI CRT Reference Level.
4.9.8 The TI A MKR amplitude must indicate between the corresponding values listed in the Limits column of
Table 10.
4.9.9 Repeat steps 4.9.6 through 4.9.8 for the remaining values listed in Table 10.
Table IO.
Range
0 to -80
Applied
0 -10
-10
-20 -30
-30 -40
-40 -50 -49.0 to -5
-50 -60
-60 -70
REF LVL
0
-20 -19.0
Limits
Reference
-9.0
-29.0 to -31.0
-39.0 to -41.0
-59.0 to -61.0
-69.0 to -71.0
to -11 .o
to
-21.0
1 .o
-70 -80
-79.0 to -81.0
27
Page 30

T.O.
4.9.10 Set
4.9.11 Set the Synthesized Level Generator controls for a
4.9.12 Adjust the Step Attenuators to place the peak of the signal 2 to 3
4.9.13 Press the TI SGL SWP, SGL SWP, MKR, and MARKER DELTA keys.
4.9.14 Set
4.9.15 Press the TI AMPLITUDE, REF LVL, and set to the corresponding value listed in the REF LVL column
of Table 11. Press the TI SGL SWP key.
4.9.16 The TI A MKR amplitude must indicate between the corresponding values listed in the Limits column of
Table 11.
TI controls as follows:
MARKER NORMAL
AMPLITUDE
REF LVL
LOG
TRIG
MHz at
Synthesized Level Generator to the next value listed in the Applied column of Table 11.
0
below the TI CRT Reference Level.
4.9.17 Repeat steps 4.9.14 through 4.9.16 for the remaining values listed in Table 11.
Table II.
Range
oto-12
Applied
REF LVL
0
-1
-2
-3
-4
-5
-6
-7
-8
Limits
Reference
0.0
to
-2.0
-1.0 to -3.0
-2.0
to
-4.0
-3.0
to
-5.0
-4.0 to -6.0
-5.0
to
-7.0
-6.0 to -8.0
-7.0
to
-9.0
28
-9
0
-10
-8.0 to -10.0
-9.0 to -11.0
Page 31
4.9.18 Set the TI controls as follows:
T.O. 33K3-4-2827-1
Table 11. (Cont.)
MARKER
AMPLITUDE
REF LVL 0
AMPLITUDE SCALE LINEAR
NORMAL
UNITS
TRIG
CONT
4.9.19 Set the Synthesized Level Generator controls for a 50 MHz at +lO dBm.
4.9.20 Adjust the Step Attenuators to place the peak of the signal 2 to 3 dB below the TI CRT Reference Level
4.9.21 Press the TI SGL SWP, SGL SWP,
4.9.22 Set the Synthesized
4.9.23 Press
the TI
of Table 12. Press the TI
Level
Generator to the next value listed in the Applied column of Table 12.
AMPLITUDE,
SGL SWP
REF LVL, and set to the corresponding value listed in the REF LVL column
key.
and
MARKER DELTA keys.
4.9.24 The TI A MKR amplitude must indicate between the corresponding values listed in the Limits column of
Table 12.
4.9.25 Repeat steps 4.9.22 through 4.9.24 for the remaining values listed in Table 12.
Table 12.
0 to -80
0 -10
-10 -20
-20 -30 -29.0
-30 -40
-40 -50
-9.0 to -11.0
-19.0 to -21.0
-39.0 to -41.0
-49.0 to -51.0
to -31.0
29
Page 32

T.O.
Table
Applied
0to-80 -50 -60
-60 -70
-70 -80
4.9.26 Set all outputs to minimum and leave equipment connected.
4.10 SCALE FIDELITY CALIBRATION:
Set the Synthesized Level Generator for a 50 MHz at
20
of attenuation.
Press the
4.10.3 Set the TI controls as follows:
PRESET, CAL, and REALIGN LO and IF keys. Wait for adjustments to finish.
FREQUENCY
CENTER FREQ
SPAN
(Cont.)
REF LVL
Limits
-59.0to-61.0
-69.0
to -71 .O
-79.0to-81.0
output. Set the Step Attenuators for
50 MHz
0 Hz
AMPLITUDE
REF LVL
A-I-TEN
BW
RES BW 300 Hz
VIDEO BW 30 Hz
4.10.4
amplitude indicates between -10 and -11
4.10.5 Adjust the Synthesized Level Generator output level for a TI MKR amplitude indication of -10.00
17
4.10.6 Press the TI SGL SWP, SGL SWP, MKR, and MARKER DELTA keys
4.10.7 Decrease the Synthesized Level Generator output level by 4
4.10.8 Press the SGL SWP key. Wait for completion of new sweep. Press the TI PEAK SEARCH.
the TI MKR and MARKER NORMAL keys. Adjust the Step Attenuators until the TI MKR
Set the AMPTD INCR to 4
except decrease by for the last step.
NOTE
The TI VBW may be lowered, if necessary, when failure occurs at lower power
levels.
-10
4.10.9 The TI A MKR amplitude must indicate between the corresponding values listed in the Limits column of
Table 13. Record the TI A MKR indication.
30 Change 3
Page 33

T.O.
4.10.10 Determine the Increment Error for each 4
Incremental Error must be
Increment Error = current
For the last step:
Increment Error = current
4.10.11 Repeat steps 4.10.7 through 4.10.10 for the remaining values, up to and including the -80
the
from REF LVL column of Table 13. For -84 to -90
Table 13, perform 4.10.12.
4.10.12
for VAVG 10 to be displayed above the top graticule. Repeat steps 4.10.7 through 4.10.10 for the remaining
values listed in Table 13 except omit pressing
graticule before pressing PEAK SEARCH.
from REF LVL only) Press the TI TRIG, CONT, BW, VID AVG ON and enter 10 Hz. Wait
from Applied
REF LVL (nominal) (nominal)
0
-4
A MKR
A MKR
SGL SWP
step in Table 13 using the following formula. The
on last step)
previous
previous
A MKR
A MKR
settings in the
key and wait for VAVG 10 to be displayed above the top
Table 13.
4
2
from REF LVL column of
Limits
Reference
-3.6 to -4.4
setting in
-8
-12 -2
-16 -6
-20 -10
-24 -14 -22.5 to -25.5
-28 -18 -26.5 to -29.5
-32 -22 -30.5 to -33.5
-36 -26 -34.5 to -37.5
-40 -30 -38.5 to -41.5
-44
-48 -38 -46.5 to -49.5
-52 -42 -50.5 to -53.5
-56
-34
-46 -54.5 to -57.5
-7.2 to -8.8
-10.8 to -13.2
-14.5 to -17.5
-18.5 to -21.5
-42.5 to -45.5
-60 -50 -58.5 to -61.5
-64 -54 -62.5 to -65.5
Change 2 31
Page 34

T.O.
Table 13. (Cont.)
from
REF LVL (nominal)
-68 -58
-72 -62 -70.5 to -73.5
-76 -66 -74.5 to -77.5
-80 -70
-84 -74
-88 -78
-90 -80
4.10.13 Set the Synthesized Level Generator controls as follows:
AMPLITUDE
AMPL INCR
4.10.14 Set the TI controls as follows:
Applied
(nominal)
Limits
-66.5 to -69.5
-78.5 to -81.5
-82.5 to -85.5
-86.5 to -89.5
-88.5 to -91.5
0.01
TRIG
AMPLITUDE
BW
RES BW
VIDEO AVG ON OFF
4.10.15 Press the TI MKR and MARKER NORMAL key.
4.10.16 Adjust the Synthesized Level Generator output level for a TI
f0.17
4.10.17 Press the TI SGL SWP, SGL SWP, MKR, and MARKER DELTA.
4.10.18 Decrease the Synthesized Level Generator output level by 4
4.10.19 Press the TI SGL
in the Limits column of Table 14. Record the TI A MKR indication.
Set the Synthesized Level Generator AMPTD INCR to 4
The TI A MKR amplitude must indicate between the corresponding values listed
amplitude indication of -10.00
except by 2
2dB
1
OFF
for the last step.
32
Page 35

REF LVL (nominal)
Table 14.
Applied
(nominal)
T.O. 33K3-4-2827-1
Limits (dB)
0
-4
-8
-12
-16
4.10.20 Determine the Increment Error for each 4 dB step in Table 14 using the following formula. The
Increment Error must be
Increment Error = current TI A MKR
For the last step:
Increment Error = current TI A MKR
4.10.21 Repeat steps 4.10.18 through 4.10.20 for the remaining values listed in Table 14.
4.10.22 Set the Synthesized Level Generator controls as follows:
dB.
-2
-6
previous TI A MKR + 4 dB
previous TI A MKR + 2 dB
Reference
-10.8 to -13.2
-14.5 to -17.5
AMPLITUDE
AMPTD INCR
4.10.23 Set the TI controls as follows:
TRIG
AMPLITUDE
LINEAR/LOG
UNITS
4.10.24 Press the TI
4.10.25
4.10.26
4.10.27 Decrease the Synthesized Level Generator output level by 2 dB.
4.10.28 Press the TI
Limits column of Table 15.
Adjust the Synthesized Level Generator output level for a TI
17 dB. Set the Synthesized Level Generator AMPTD INCR to 2 dB.
Press the
MKR
and MARKER NORMAL key.
TI
SGL SWP, SGL SWP, MKR
SGL SWP
key. The TI A
and
MARKER DELTA.
must indicate between the corresponding values listed in the
0.01
LINEAR
amplitude indication of -10.00
33
Page 36

T.O. 33K3-4-2827-1
l
Table 15.
Applied
0
-2
-4
-6
-8
Reference
-1.68 to -2.33
-3.60 to -4.42
-5.50 to -6.54
-7.37 to -8.68
-10 -9.21 to -10.87
-12
-11.02 to -13.10
-14 -12.78 to -15.42
-16 -14.49 to -17.82
-18 -16.14 to -20.36
4.10.29 Repeat steps 4.10.27 and 4.10.28 for the remaining values in Table 15.
4.10.30 Set all outputs to minimum and disconnect test setup.
4.11 FREOUENCY RESPONSE CALIBRATION:
4.11.1 Connect equipment as shown in Figure 4.
4.11.2 Press the Synthesized Sweeper INSTR PRESET. Set the Synthesized Sweeper controls for 300 MHz CW at
-4 dBm.
NOTE
4.11.3
Press
the TI
The TI Preselect Peak does not function at
PRESET.
Set the TI controls as follows:
c2.9 GHz.
FREQUENCY
CENTERFREQ 300 MHz
CF STEP 100
MHz
AMPLITUDE
REF LVL
-5
BW
RES BW
300
SPAN
34 Change 4
Page 37

4.11.4 Press the TI CAL, IF ADJ OFF, and MKR keys.
POWER
METER SYNTHESIZER SWEEPER
Figure 4.
T.O.
4.11.5 Set the Power Meter MODE to
4.11.6 Adjust the Synthesized Sweeper Power Level for a
at a convenient reference line on the TI CRT.
4.11.7 Set the Power Meter RANGE HOLD to ON.
4.11.8 Press the Synthesized Sweeper METER LEVELING key (The signal may disappear off the TI CRT
display).
4.11.9 Adjust the Synthesized Sweeper knob to place the peak of the signal at the same reference established in
step4.11.6.
4.11
4.11.11 Press the TI TRACE, MAX HOLD A keys. Press the Synthesized Sweeper SINGLE SWEEP key and
Press the TI FREQUENCY key. Set the Synthesized Sweeper and TI START FREQ to
STOP FREQ to 2.9
wait for completion of sweep.
4.11.12 The TI CRT signal must be within fl.5
the minimum and maximum peaks must be
maximum peak indications.
4.11.13 Press the TI TRACE, CLEAR WRITE A keys. Press the TI FREQUENCY, CENTER FREQ keys and
set the Synthesized Sweeper frequency and TI to the first value listed in the CW column of Table 16.
Set the Synthesized Sweeper SWEEP TIME to 200 s.
and RANGE HOLD to OFF.
MKR amplitude indication of -10
of the reference used in step
Record the signal level at 50 MHz, the minimum, and
or
MHz and
The difference between
4.11.14 Press the TI AMPLITUDE, MORE 1 of 3, MORE 2 of 3, and PRESEL AUTO PEAK keys. Wait for the
PEAKING! message to disappear.
Press the TI FREQUENCY key. Set the Synthesized Sweeper and TI START FREQ and STOP FREQ to
the corresponding values listed in the START and STOP columns of Table 16.
4.11.16 Press the TI TRACE, MAX HOLD A keys. Press the Synthesized Sweeper SINGLE SWEEP key and
wait for completion of sweep.
35
Page 38

T.O.
4.11.17 The TI CRT signal indication must be within the corresponding value listed in the Ref Limits column of
Table 16 of the reference used in step 4.11.6. The difference between the minimum and maximum peaks must be
less than or equal to the corresponding value listed in the Band Limits column of Table 16.
NOTE
The frequency response in the upper bands of the TI (2.75 to 22.0
(26.5
condition in the current TI state. If any part of the span is not within
specifications, tune the Synthesized Sweeper frequency to the respective area
and press the TI PRESEL AUTO PK at that frequency. Recheck the frequency
response of the TI in the area that was not within specifications. It may be
necessary to tune the Synthesized Sweeper across the area in small increments,
peaking the signal, and measuring response at each point to verify response
flatness.
for Opt
Opt 026 and S/N 23 124)) assumes a Preselector Peak
Table 16.
START
Range
9
to 22
(26.5
H51, Opt 026 and
S/N
(OPT HO1 and
S/N
S/N 23 124)
4.11.18 Repeat steps 4.11.13 through 4.11.17 for the remaining values listed in Table 16.
4.11.19 Set all outputs to minimum and disconnect the test setup.
4.11.20 Connect the Synthesized Level Generator OUTPUT 50
TRACE, CLEAR WRITE A.
I
4.11.21 Press the TI FREQUENCY, CENTER FREQ and set the Synthesized Level Generator Frequency and TI
to 50 MHz.
4.11.22 Adjust the Synthesized Level Generator output level for the signal peak indication recorded in
step 4.11.12.
for Opt
124)
and 23.1
4.6 2.9 6.46
9.7 6.46 13.0 f3.0
16.3
20.8
13.0
19.7
19.7
STOP
19.7
22.0
26.5
to the
Limits
Ref Band
INPUT 50
connector. Press TI
4.11.23 Set the TI START FREQ to 9
4.11.24 Slowly sweep the Synthesized Level Generator Frequency from 9
recorded in step 4.11.12, verify the 9
Verify that the difference between the minimum and maximum peaks is
36 Change 1
and STOP FREQ to 50 MHz. Press TI TRACE, MAX HOLD A.
to 2.9
response is
to 50 MHz. Using the values
of the reference used in step 4.11.6.
Page 39

NOTE
T.O. 33K3-4-2827-1
If TI SPAN is too wide to verify the Frequency Response across the 9
50 MHz range, the range may be broken down into three or four smaller
increments, i.e., 9 to 200 kHz, 200
to 1 MHz, 1 to 10 MHz, and 10 to
50 MHz. The Frequency Response can be checked across these smaller ranges
and the Frequency Response across the 9 kHz to 2.9
determined. The TI RES BW may be reduced to eliminate LO mixing at Iower
frequencies.
4.11.25 Set all outputs to minimum and disconnect test setup.
4.12 FREQUENCY SPAN CALIBRATION:
4.12.1 Press the TI PRESET key.
4.12.2 Connect equipment as shown in Figure 1
4.12.3 Set the Synthesized Sweeper controls as follows:
POWER LEVEL
Frequency Standard switch (rear panel)
4.12.4 Set the TI controls as follows:
to
range can be
500 MHz
-15
EXT
FREQUENCY
CENTER FREQ
SPAN
AMPLITUDE
REV
500 MHz
100
Hz
-10
TI CRT (the left most graticule is the first graticule line on the display). Record the Synthesized Sweeper
Frequency indication.
4.12.6 Adjust the Synthesized Sweeper frequency to place the peak of the signal at the tenth graticule line of the
between the corresponding values listed in the Limits column of Table 17.
Table 17.
Ran e Limits (Hz
100Hzto 2
500
M
100
76.0
to 84.0
500
500
M
M
200 152.0
500
380.0
to
168.0
to 420.0
Change 3 37
Page 40

T.O. 33233-4-2827-l
Table 17. (Cont.)
Range Applied (Hz)
100 Hz
to 2
500
500
500
500
500
500
500
500
500
500
500
500
M
M
M
M
M
M
M
M
M
M
M
M
TI SPAN (Hz)
lk
2k
5k
20k
50k
200 k
500 k
2M
5M
Limits (Hz)
760.0 to 840.0
1.52 to 1.68 k
3.8 to 4.2 k
7.6 to 8.4 k
15.2 to 16.8 k
38.0 to 42.0 k
76.0 to 84.0 k
152.0 to 168.0 k
380.0 to 420.0 k
760.0 to 840.0 k
1.52 to 1.68 M
3.8 to 4.2 M
500
M
500
M
500
M
500
M
500M
1.1 G 2G 1.52 to 1.68 G
4.12.7 Repeat steps 4.12.2 through 4.12.6, setting the Synthesized Sweeper Frequency,
SPAN to the remaining corresponding values listed in Table 17.
4.12.8 Set all outputs to minimum and disconnect the test setup.
4.13 SWEEP TIME CALIBRATION:
4.13.1 Connect equipment as shown in Figure 5.
20 M
50 M
100 M
200 M
500 M
7.6 to 8.4 M
15.2 to 16.8 M
38.0 to 42.0 M
76.0 to 84.0 M
152.0 to 168.0 M
380.0 to 420.0 M
760.0 to 840.0 M
CENTER
and
Page 41

INPUT
32
0
ELECTRONIC COUNTER
PULSE GENERATOR
TRIG
OUTPUT
CHANNEL A
OUTPUT
0
TEE
Figure 5.
4.13.2 Press the TI PRESET key and then set the controls as follows:
FREQUENCY
CENTERFREQ 300 MHz
AM INPUT
0
T.O.
RF OUTPUT
Q
SPAN OHZ
BW
RES BW 2 MHz
SWEEP TIME
SCALE
Set Synthesized Sweeper Frequency to 300 MHz, Modulation to AM, and Power Level to -5
4.13.3
4.13.4 Set the Pulse Generator Frequency to 200
Duty to
Amplitude to 500
LINEAR
Offset to 0 V and
Function to Triangle.
4.13.5 Set the Electronic Counter for a frequency measurement.
4.13.6 Set the Pulse Generator Frequency controls to the first value listed in the Applied column of Table 18.
4.13.7 Set the TI SWEEP TIME to the corresponding value listed in the Sweep Time column of Table 18. If
necessary press the TI
4.13.8 Adjust the Pulse Generator Frequency for
key and EXTERNAL keys.
cycles evenly spaced relative to the vertical graticule lines of
the TI CRT. For example, if the peak of the first cycle is 0.2 divisions to the right of the first graticule line, the
peak of the tenth cycle should be set 0.2 divisions to the right of the tenth graticule line.
Change 1 39
Page 42

T.O.
4.13.9 Adjust the Electronic Counter controls for a reliable and repeatable frequency indication. Determine the
measured sweep time using the following equation:
4.13.10 The Measured Sweep Time must be between the corresponding values listed in the Limits column of
Table 18.
4.13.11 Set the TI SWEEP TIME and Pulse Generator Frequency to each of the remaining values listed in
Table 18 and repeat steps 4.13.7 through4.13.10.
TI Sweep
Applied (Hz)
200.0 k
100.0 k
50.0 k 200
20.0 k 500
10.0 k
Times (s)
=
Table 18.
Limits (s)
42.5 to 57.5
85.0 to 115.0
170.0 to 230.0
425.0 to 575.0
0.850 to 1.15 m 0.9 to 1.1 m
Limits
Opt
45 to 55
90to
450 to 550
and Opt
(Opt
10
5.0 k 2m 1.70 to 2.30 m 1.8 to 2.2 m
2.0 k
500.0 20 m 17.0 to 23.0 m
4.13.12 Disconnect the Electronic Counter from the Pulse Generator. Connect the Electronic Counter CHANNEL
A to the TI BLANKING OUTPUT.
4.13.13 Press the TI TRIG, FREE RUN, and SWEEP TIME.
4.13.14 Set the TI SWEEP TIME to the first value listed in the Sweep Time column of Table 19.
4.13.15 Set the Electronic Counter controls for a repeatable and reliable Time Interval A to B indication with
CHANNEL A SLOPE set to
4.13.16 The Electronic Counter must indicate between the corresponding values listed in the Limits column of
Table 19.
and CHANNEL B SLOPE set to +.
4.25 to 5.75 m
8.5 to 11.5 m 9.0 to 11 m
4.5 to 5.5 m
40
Page 43

Table 19.
T.O.
Swee Times (s
Limits (s) (Opt
P
30 m 29.7 to 30.3 m
100 m
200 m
500 m 495.0 to 505.0 m
1
2
5
10 9.9 to 10.1
20
50 49.5 to 50.5
60
Limits (s
27 to 33 m
49.5 to 50.5 m 49.5 to 50.5 m
99.0 to 101 .O m
198.0 to 202.0 m 198.0 to 202.0 m
0.99 to 1.01 0.99 to 1.01
1.98 to 2.02 1.98 to 2.02
4.95 to 5.05 4.95 to 5.05
19.8 to 20.2 19.8 to 20.2
59.4 to 60.6 59.4 to 60.6
99.0 to 101.0 m
495.0 to 505.0 m
9.9 to 10.1
49.5 to 50.5
Repeat
4.13.17
4.13.18 Set all outputs to minimum and disconnect test setup.
4.14 RESIDUAL RESPONSE CALIBRATION:
4.14.1 Press the TI PRESET and set controls as follows:
4.14.2 Connect the TI CAL OUTPUT to the TI INPUT 50
steps 4.13.14
through
FREQUENCY
CENTER FREQ 300 MHz
SPAN
AMPLITUDE
REF LVL -10
BW
RES
BW
4.13.16 for
the remaining values
connector.
listed in
Table 19.
10
300 Hz
41
Page 44
T.O.
4.14.3 Press the TI PEAK SEARCH, CAL, and REF LEVEL ADJ. Using the TI knob, set the TI MKR amplitude
for a -10.00
f0.17
indication. Press TI STORE REF LVL.
4.14.4 Disconnect the TI CAL OUTPUT from the TI INPUT 50
TI INPUT 50
connector.
4.14.5 Set the TI controls as follows:
FREQUENCY
CENTER
SPAN
CF STEP
AMPLITUDE
REF LVL
BW
RES BW
TRIG
DISPLAY LINE
connector. Connect the Termination to the
15.2 MHz
30 MHz
28.5 MHz
-50
10
SINGLE
-90
4.14.6 Press TI SGL SWP and wait for completion of new sweep. Observe any residual response and verify the
residual responses are
NOTE
If a Residual Response is suspected, press TI
residual response. A residual response will persist on successive sweeps,
SGL SWP
again and observe the
but
a
noise peak will not.
4.14.7 Press the TI FREQUENCY, CENTER FREQ and
and repeat step 4.14.6 for
frequencies up to
2.8652
4.14.8 Press the TI FREQUENCY, CENTER FREQ and set to 2.885
4.14.9 Press TI SGL SWP and wait for completion of new sweep. Observe any residual response and verify the
residual responses are
4.14.10 Press the TI FREQUENCY, CENTER FREQ and
and repeat step 4.14.9 for TI frequencies up to
6.419
4.14.11 Press the TI FREQUENCY, CENTER FREQ and set to 6.445
4.14.12 For TI without Opt
proceed to step 4.14.15. For TI with Opt
Repeat step 4.14.9.
proceed to step 4.14.13 and
perform steps 4.14.13 through 4.14.15.
42 Change 1
Page 45

T.O.
4.14.13 Press the
FREQUENCY, CENTER FREQ and set to 18
4.14.14 Press TI SGL SWP and wait for completion of new sweep. Observe any residual response and verify the
residual responses are
4.14.15 Disconnect test setup.
4.15 RESIDUAL FM CALIBRATION:
Connect equipment as shown in Figure 6.
4.15.2 Press the Synthesized Sweeper INSTR PRESET and set controls as follows:
cw 2.8
POWER LEVEL -5
SPECTRUM ANALYZER SYNTHESIZED SWEEPER
DC BLOCKING
CAPACITOR
INPUT
Figure 6.
4.15.3 Press the TI PRESET and set controls as follows:
FREQUENCY
CENTER FREQ
SPAN
4.15.4 Press the TI PEAK SEARCH and MARKER
CF keys. Wait for sweep to complete. Press the
2.8
5
and set to 100 Hz. Press the TI SGL SWP key and wait for sweep to complete.
4.15.5 Press the Spectrum Analyzer INSTR PRESET and set the controls as follows:
CENTER FREQUENCY
FREQUENCY SPAN
SPAN
Page 46

T.O.
4.15.6 Press the Spectrum Analyzer PEAK SEARCH, MARKER NORMAL and MARKER SIGNAL TRACK
(On) keys. Press the Spectrum Analyzer FREQUENCY SPAN and set to 100 Hz. Wait for the signal to be
centered in the 100 Hz span setting.
Press the Spectrum Analyzer PEAK SEARCH,
completion of new sweep. Press Spectrum Analyzer SCALE ENTER
Spectrum Analyzer MARKER SIGNAL TRACK (Off), PEAK SEARCH,
CF and MKR
and set to 1
REF LVL keys. Wait for
Press the
CF and MKR
REF LVL
keys.
4.15.8 Decrease the Spectrum Analyzer reference level by 5
Press the Spectrum Analyzer SWEEP SINGLE
key and wait for completion of new sweep. Press the Spectrum Analyzer MARKER NORMAL key. Using the
Spectrum Analyzer control knob, rotate until the Marker is four divisions below the reference level on the left side
of the signal.
4.15.9 Press the Spectrum Analyzer MARKER A key and rotate the control knob CCW until the Spectrum
Analyzer MARKER A amplitude indicates about -2
4.15.10 Record the Spectrum Analyzer MARKER A frequency and amplitude indications.
Calculate the slope of the 10 Hz resolution bandwidth by dividing the Spectrum Analyzer MARKER A
frequency by the Spectrum Analyzer MARKER A amplitude indication. Record the calculated value.
Slope =
MARKER A reading in Hz
MARKER A reading in dB
Slope =
1.08
3.92
Slope = 275.5 Hz
4.15.12 Set the Spectrum Analyzer controls as follows:
CENTER FREQUENCY
FREQUENCY SPAN
REF LEVEL
SCALE ENTER
SWEEP CONT
MARKER NORMAL
PEAK SEARCH
MARKER SIGNAL TRACK
FREQUENCY SPAN
4.15.13 Wait for the signal to be centered in the 100 Hz span setting.
Press the Spectrum Analyzer PEAK SEARCH, MKR
completion of new sweep.
and MKR
4.8
5kHz
10 +dBm
REF LVL and wait for
44 Change 1
Page 47

T.O.
Press Spectrum Analyzer SCALE ENTER
MARKER SIGNAL TRACK (Off). Press the Spectrum Analyzer PEAK SEARCH, MKR
MKR
4.15.16 Decrease the Spectrum Analyzer reference level by 5
4.15.17 Press the Spectrum Analyzer MARKER NORMAL key. Using the Spectrum Analyzer control knob,
rotate until the Marker is five divisions below the reference level on the left side of the signal.
4.15.18 Press the Spectrum Analyzer MKR
4.15.19 Press the Spectrum Analyzer FREQUENCY SPAN and set to 0 Hz.
4.15.20 Set the Spectrum Analyzer sweep time to 20 ms. Press the Spectrum Analyzer SWEEP SINGLE key and
wait for completion of new sweep.
4.15.21 Press the Spectrum Analyzer PEAK SEARCH and MARKER A key. Using the Spectrum Analyzer
control knob, place the active Marker at the minimum point of the displayed signal.
REF LVL.
CF and wait for completion of new sweep.
The signal displayed on the Spectrum Analyzer should be about five division
below the reference level, if it is not, press the Spectrum Analyzer
CENTER FREQUENCY and rotate the knob until the displayed signal is five
division below the reference level.
and set to 1
NOTE
Press the Spectrum Analyzer
CF and
and wait for completion of new sweep.
4.15.22 Record the Spectrum Analyzer MARKER A amplitude indication.
Calculate the Residual FM by multiplying the value recorded in
step 4.15.22.
4.15.24 Verify the calculated value in step 4.15.24 is
4.15.25 Set all outputs to minimum and disconnect test setup.
4.16 SECOND HARMONIC CALIBRATION:
4.16.1 Connect equipment as shown in Figure 7.
FREQUENCY
SYNTHESIZED
Hz
Hz for Opt H51).
10 MHz REF
IN/OUT
SWEEPER
RF OUTPUT INPUT 50
0
LOW PASS
FILTER (2.18)
by the value recorded in
0
Figure 7.
4.16.2 Press the Synthesized Sweeper INSTR PRESET and set controls for 40 MHz at -30
Change 1 45
Page 48
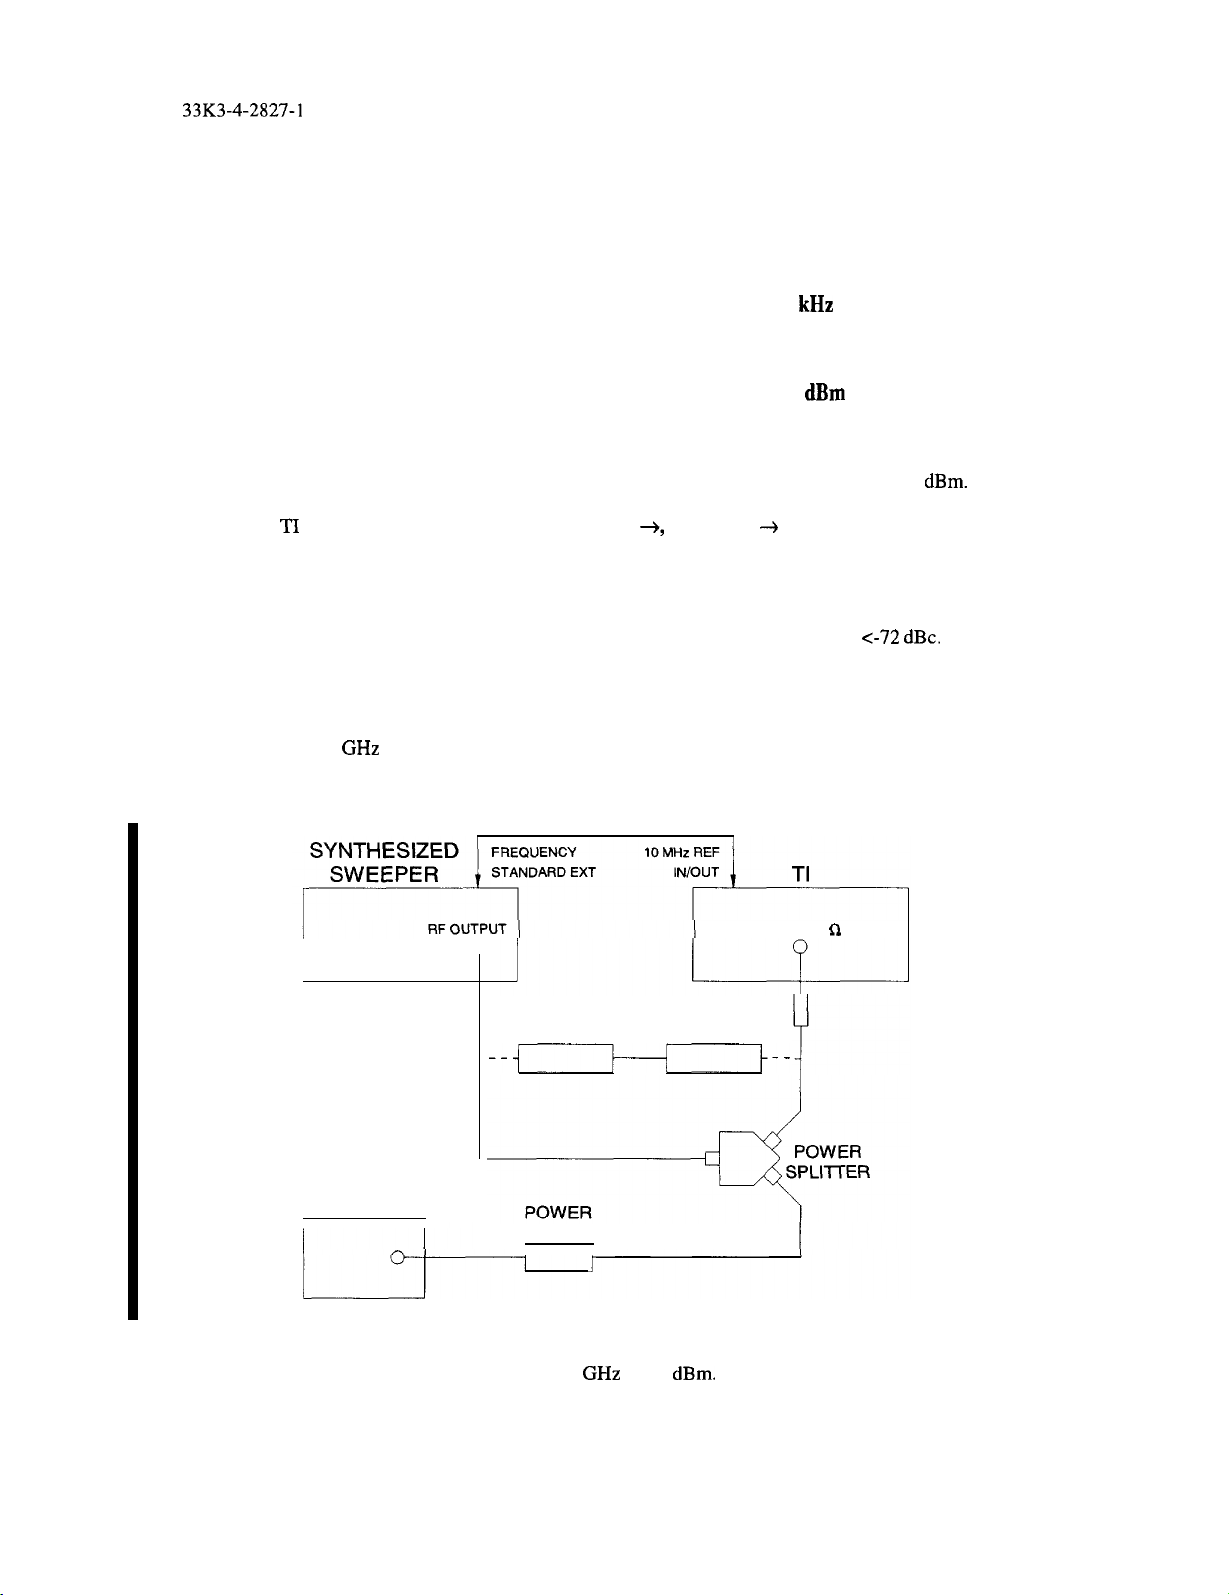
T.O.
4.16.3 Press the TI PRESET key set controls as follows:
FREQUENCY
CENTER FREQ
SPAN
40 MHz
10
AMPLITUDE
REF LVL
-30
PEAK SEARCH
4.16.4 Adjust the Synthesized Sweep Power Level until the TI MKR amplitude indicates about -30
4.16.5 Press the
SGL SWP, PEAK SEARCH, MARKER
MARKER
CF STEP, MKR, MARKER
DELTA, FREQUENCY, ft.
4.16.6 Press the TI SGL SWP key and wait for sweep to complete.
4.16.7 Press the TI PEAK SEARCH key and verify the TI A MKR amplitude indication is
4.16.8 Set the Synthesized Sweeper output to minimum and disconnect test setup.
4.16.9 Standardize the Power Meter and Power Sensor (2.6). Set the Power Meter % CAL FACTOR switch for
the Power Sensor (2.6) 3
calibration factor.
4.16.10 Connect equipment as shown in Figure 8 without the Low Pass Filters connected.
POWER METER
I
I
SENSOR (2.6)
I I
Figure 8.
4.16.11 Set the Synthesized Sweeper controls for 2.95
46 Change 1
INPUT 50
LOW PASS
FILTER (2.19)
at -10
Page 49

4.16.12 Set the TI controls as follows:
FREQUENCY
CENTER FREQ 2.95
CF STEP 2.95
AMPLITUDE
T.O. 33K3-4-2827-1
LVL
4.16.13 Press the TI TRIG, CONT, MKR, MARKERS OFF, and PEAK SEARCH keys.
4.16.14 Press the TI BW, RES BW, 300, Hz, AMPLITUDE, MORE 1 OF 3, then MORE 2 OF 3 and PRESEL
AUTO PK keys. Wait for the PEAKING! message to disappear. Press TI BW, then set to AUTO.
4.16.15 Adjust the Synthesized Sweeper Power Level for a TI MKR amplitude indication of about -5 dBm.
4.16.16 Press the Power Meter dB [REL] key. Set the Power Meter % CAL FACTOR switch for the Power Sensor
(2.6) 6 GHz calibration factor.
4.16.17 Set the Synthesized Sweeper controls for 5.9 GHz.
4.16.18 Press the TI FREQUENCY,
4.16.19 Press the TI BW, RES BW, 300, Hz, AMPLITUDE, MORE 1 OF 3, then MORE 2 OF 3 and PRESEL
AUTO PK keys. Wait for the PEAKING! message to disappear. Press TI BW, then set to AUTO.
4.16.20 Adjust the Synthesized Sweeper Power Level for a TI MKR amplitude indication of about -5 dBm.
4.16.21 Record the Power Meter indication.
4.16.22 Connect equipment as shown in Figure 8 with the Low Pass Filters connected.
4.16.23 Set the Synthesized Sweeper controls for 2.95 GHz at -5 dBm.
PEAK SEARCH.
0
4.16.24 Press the TI MKR, MARKERS OFF, FREQUENCY,
4.16.25 Press the TI BW, RES BW, 300, Hz, AMPLITUDE, MORE 1 OF 3, then MORE 2 OF 3 and PRESEL
AUTO PK. Wait for the PEAKING! message to disappear. Press TI BW, then set to AUTO.
4.16.26 Set the Synthesized Sweeper Power Level for a TI
4.16.27 Press the TI SGL SWP, SGL SWP, PEAK SEARCH, MARKER DELTA, FREQUENCY, and
4.16.28 Press the TI AMPLITUDE, REF LVL and enter -30
sweep to complete.
4.16.29 Press the
OF 3 and PRESEL AUTO PK. Wait for the PEAKING! message to disappear. Press TI BW, then set to AUTO.
4.16.30 Press the TI PEAK SEARCH. Record the TI MKR A amplitude indication.
4.16.31 Algebraically add the value recorded in step 4.16.21 to the value recorded in step 4.16.30. Verify the
results are c-100 dBc.
4.16.32 Set all outputs to minimum and disconnect test setup.
BW,
BW, 300, Hz, PEAK SEARCH, AMPLITUDE, MORE 1 OF 3, then MORE 2
PEAK SEARCH.
amplitude indication of about 0 dBm.
keys.
Press the TI SGL SWP and wait for new
I
Change 4 47
Page 50

T.O. 33K3-4-2827-1
4.17 THIRD ORDER INTERMODLJLATION CALIBRATION:
4.17.1 Connect equipment as shown in Figure 9.
NOTE
The TI provides the 10 MHz reference for the Synthesized Signal Generator
and the Synthesized Sweeper.
SYNTHESIZED
SYNTHESIZED
IN (FEAR
POWER METER
POWER
SENSOR (2.6)
Figure 9.
4.17.2 Standardize the Power Meter and Power Sensor (2.6). Set the Power Meter
CAL FACTOR
the Power Sensor (2.6) 3 GHz calibration factor.
4.17.3 Press Synthesized Sweeper INSTR PRESET and set controls as follows:
cw
I
POWER
2.700 GHz
0 dBm
RF OFF
4.17.4 Set the Synthesized Signal Generator controls as follows:
FREQUENCY
RF LEVEL and RANGE
2.70005 GHz
0
OFF
switch
for
4.17.5 Press the TI PRESET and set TI controls as follows:
FREQUENCY
CENTERFREQ
CF STEP
SPAN
48 Change 2
2.700025
50 kHz
200
Page 51

BW
BW
VIDEO BW 30 Hz
AMPLITUDE
T.O.
1
REF LVL
4.17.6 Set the Synthesized Sweeper RF to ON and adjust the Power Level for a Power Meter indication of
-20
4.17.7 Disconnect Power Meter and Power Sensor (2.6) from the Power Divider and connect Power Divider
directly to the TI INPUT 50
4.17.8 Press the TI PEAK SEARCH, MARKER
new sweep.
4.17.9 Set the Synthesized Sweeper RF to OFF.
4.17.10 Set the Synthesized Signal Generator RF OUTPUT ON/OFF to ON. Press TI PEAK SEARCH and
adjust the Synthesized Signal Generator output level for a TI A MKR amplitude indication of 0.00
Set the Synthesized Sweeper RF to OFF.
Set the Synthesized Sweeper RF to ON.
and MARKER
the TI MKR, MARKER DELTA.
NOTE
While performing the Third Order Intermodulation Calibration, if the products
are not discernible, the signal levels of the Synthesized Sweeper and Synthesized
Signal Generator may be increased by increments of
intermodulation products may then be located as instructed, and the signal levels
of the Synthesized Sweeper and Synthesized Signal Generator outputs need to be
decremented back to the original signal level before taking the measurement. If
the power levels of the Synthesized Sweeper and Synthesized Signal Generator
are already at their highest level, then the signal levels of the Synthesized
Sweeper and Synthesized Signal Generator may be manually adjusted to locate
the intermodulation products; however, it is critical the signal levels be decreased
back to their original power levels before the measurement is taken.
REF
-20
keys. Wait for completion of
The
17
4.17.11 Set the Synthesized Sweeper RF to ON
4.17.12 Using the
4.17.13 Record the
4.17.14 Using the
Record the TI A MKR amplitude indication
4.17.16 Determine the most positive value recorded in either step 4.17.13 or step
is
4.17.17 Set the Synthesized Sweeper RF to OFF and the Synthesized Signal Generator RF OUTPUT ON/OFF to
OFF.
4.17.18 Disconnect the Power Divider from the TI INPUT 50
(3.6) directly to the Power Divider. Standardize the Power Meter and Power Sensor (3.6). Set the Power Meter
CAL FACTOR switch for the Power Sensor (3.6) 5
control knob, set the
The TI RBW may be decreased to any setting 2300 Hz, if necessary.
A MKR amplitude indication
control knob, set the TI A marker for a AMKR frequency indication of -50
A marker for a AMKR frequency indication of 100
NOTE
Verify theresult
and connect the Power Meter and Power Sensor
calibration factor.
Change 3 49
Page 52

T.O. 33K3-4-2827-1
4.17.19 Press Synthesized Sweeper INSTR PRESET and set controls as follows:
cw
POWER LEVEL
4.17.20 Set the Synthesized Signal Generator controls as follows:
FREQUENCY
RF LEVEL and RANGE
4.17.21 Press the
TI PRESET
FREQUENCY
and set TI controls as follows:
CENTERFREQ
CF STEP
SPAN
BW
RES BW
5.000
0
5.00005
0
5.000025
50
200
VIDEO BW 30 Hz
AMPLITUDE
REF LVL -20
4.17.22 Set the Synthesized Sweeper RF to ON and adjust the Power Level for a Power Meter indication of
-20
dB. Set the Synthesized Sweeper RF to OFF.
4.17.23 Disconnect Power Meter and Power Sensor (2.6) from the Power Divider and connect Power Divider
directly to the TI INPUT 50
4.17.24 Press the
PEAK SEARCH, MARKER
new sweep. Press the TI
Set the Synthesized Sweeper RF to ON.
MARKER DELTA.
and MARKER
REF LVL keys. Wait for completion of
Set the Synthesized Sweeper RF to OFF.
Set the Synthesized Signal Generator RF OUTPUT ON/OFF to ON. Press TI PEAK SEARCH and
adjust the Synthesized Signal Generator output level for a TI A
4.17.29 Record the TI A
amplitude indication.
amplitude indication of 0.00 dB
17 dB.
4.17.30 Using the TI control knob, set the TI A marker for a
4.17.3 1
50 Change 2
Record the Tl A MKR amplitude indication.
frequency indication of -50 kHz.
Page 53

T.O.
4.17.32 Determine the most positive value recorded in either step 4.17.29 or step 4.17.31. Verify the result
is
4.17.33 Set the Synthesized Sweeper RF to OFF and the Synthesized Signal Generator RF OUTPUT ON/OFF to
OFF.
4.17.34 Set all POWER switches to OFF or STANDBY, disconnect and secure all equipment.
CALIBRATION PERFORMANCE TABLE
4.1 FREQUENCY REFERENCE CALIBRATION:
Applied (MHz)
10
4.2 CALIBRATOR AMPLITUDE CALIBRATION:
Applied
-10
4.3 FREQUENCY READOUT AND MARKER COUNT CALIBRATION:
FREQUENCY READOUT:
Applied
1.5
1.5 10
1.5
1.5
1.5
1.5
at 300 MHz
TI
SPAN (MHz)
1
20
50
100
TI CENTER
1.5
1.5
1.5
1.5
1.5
1.5
Limits (Hz)
9 999 998.8 to 10 000 001.2
Limits
-9.7 to -10.3
Limits
1.499948 to 1.500052
1.49948 to 1.50052
1.49895 to 1.50105
1.49745 to 1.50255
1.4948 to 1.50520
1.4500 to 1.5500
4.0
4.0
4.0 20
4.0 50
4.0 100
4.0 1000
9.0
9.0
9.0 20
1
1
10
4.0
4.0
4.0
4.0
4.0
4.0
9.0
9.0
9.0
3.999948 to 4.000052
3.99948 to 4.00052
3.99895 to 4.00105
3.99745 to 4.00255
3.9948 to 4.0052
3.9500 to 4.0500
8.999948 to 9.000052
8.99948 to 9.00052
8.99895 to 9.00105
Change 1 51
Page 54

T.O.
CALIBRATION PERFORMANCE TABLE (Cont.)
4.3 FREQUENCY READOUT AND MARKER COUNT CALIBRATION: (Cont.)
FREQUENCY READOUT:
Applied
9.0
9.0
9.0
16.0
16.0
16.0
16.0
16.0
16.0
21 .o
21.0
21.0
21.0
TI
SPAN (MHz) FREQ
50 9.0
100 9.0
1000 9.0
1
10
20 16.0
50 16.0
100 16.0
1000 16.0
1
10
20
50 21.0
TI CENTER
16.0
16.0
21.0
21.0
21.0
Limits (GHz)
8.99745 to 9.00255
8.99480 to 9.00520
8.950 to 9.050
15.999948 to 16.000052
15.99948 to 16.00052
15.99895 to 16.00105
15.99745 to 16.00255
15.9948 to 16.0052
15.950 to 16.050
20.999948 to 21.000052
20.99948 to 21.00052
20.99895 to 21.00105
20.99745 to 21.00255
21.0
21.0
MARKER COUNT:
Applied (GHz)
1.5
4.0
9.0
16.0
21.0
52
100
1000 21.0
TI
SPAN (MHz)
1
1
1
21.0
1.5
4.0
9.0
16.0
21.0
CENTER
20.9948 to 21.0052
20.950 to 21.050
Limits (GHz)
1.49999994 to 1.50000006
3.99999994 to 4.00000006
8.99999989 to 9.00000011
15.99999984 to 16.00000016
20.99999979 to 21
Page 55

CALIBRATION PERFORMANCE TABLE (Cont.)
4.4 DISPLAYED AVERAGE NOISE CALIBRATION:
T.O.
Applied
10
loo
MHz to 2.9
2.9 to 6.46
6.46 to 13.0
13.0 to 19.7
19.7 to 22.0
19.7 to 26.5
S/N 23 124)
4.5 NOISE SIDEBAND CALIBRATION:
Applied Offset
MHz
2500 MHz -10
(Opt HO1 and S/N
(Opt
Opt 026 and
124)
Limits
c-103
c-130
c-131
<-120
c-115
c-110
carrier)
Limits
<-86
c-86
from
2500 MHz
2500 MHz -30
MHz
2500 MHz -100
4.6 RESOLUTION BANDWIDTH SWITCHING CALIBRATION:
TI SPAN
1 MHz
10 MHz 2 MHz
5 MHz
500
50
TIRESBW
300
1 MHz
30
3kHz
<-100
c-100
<-110
c-110
Limits
Reference
-0.5 to
-0.5 to
-0.5 to
-0.5 to
-0.5 to
-0.5 to
Change 2 53
Page 56

T.O.
CALIBRATION PERFORMANCE TABLE (Cont.)
4.6 RESOLUTION BANDWIDTH SWITCHING CALIBRATION: (Cont.)
SPAN
500 Hz 100 Hz -0.5
4.7 RESOLUTION BANDWIDTH ACCURACY AND SELECTIVITY CALIBRATION:
TI
RES BW
2 MHz to 10 Hz 2 MHz
1 MHz +25 <15:1
100 kHz +10
30 kHz +10
TIRESBW
Limits
3
BW
for Opt H5
Limits (dB)
-0.5 to +0.5
-0.5
to
to
to
Limits
Selectivity
3kHz
300 Hz
30 Hz +10
4.8 INPUT ATTENUATOR CALIBRATION:
Applied TI REF LVL
-50 -70
-40 -60
-30 -50
54
TI
10
20
30
Limits (dBj
Reference
9.4 to 10.6
18.8 to 21.2
Page 57

CALIBRATION PERFORMANCE TABLE (Cont.)
4.8 INPUT ATTENUATOR CALIBRATION: (Cont.)
T.O.
Applied
-20
-10 -30
0
4.9 IF GAIN CALIBRATION:
10
Steps:
0 to -80
TI REF LVL
-40
-20
-10
Applied
0 -10 -9.0 to -11.0
-10 -20 -19.0 to -21.0
-20 -30
-30 -40 -39.0 to -41.0
TI
40
50
60
70
REF LVL
0
Limits
28.2to31.8
38.2to41.8
48.2to51.8
58.2to61.8
Limits
Reference
-29.0 to -3 1 .O
1 dB Steps:
Range
0 to -12
-40 -50
-50 -60
-60
-70 -80
Applied
-70 -69.0 to -71.0
REF LVL
0
-1
-2
-3
-4 -3.0 to -5.0
-5 -4.0 to -6.0
-6 -5.0 to -7.0
-49.0 to -51.0
-59.0 to -61 .O
-79.0 to -8
Limits
Reference
0.0 to -2.0
-1.0 to -3.0
-2.0 to -4.0
.O
55
Page 58

T.O.
CALIBRATION PERFORMANCE TABLE (Cont.)
4.9 IF GAIN CALIBRATION: (Cont.)
1
Steps: (Cont.)
Range (dBm) Applied (dBm)
0 to -12 +3
0
-1
-2
Linear:
Range (dBm)
0 to -80
Applied (dBm)
0
-10
-20
REF LVL (dBm>
-7
-8
-9
-10 -9.0 to -11 .o
-11
-12 -11.0 to -13.0
REF LVL (dBm) Limits (dB)
0 Reference
-10 -9.0 to -11 .o
-20 -19.0 to -21.0
-30 -29.0 to -3
Limits (dB)
-6.0 to -8.0
-7.0 to -9.0
-8.0 to -10.0
-10.0 to -12.0
.O
-30
-60
-70
4.10 SCALE FIDELITY CALIBRATION:
LOG:
from
REF LVL (nominal)
0
-8
-12
-40 -39.0 to -41 .o
-50 -49.0 to -51.0
-60
-70 -69.0 to -71.0
-80 -79.0 to -8 1
Applied (dBm)
{nominal)
-2
-59.0 to -61 .O
Limits (dB>
Reference
-3.6 to -4.4
-7.2 to -8.8
-10.8 to -13.2
56
Page 59

CALIBRATION PERFORMANCE TABLE (Cont.)
4.10 SCALE FIDELITY CALIBRATION: (Cont.)
LOG: (Cant.
T.O.
from
REF LVL (nominal)
-16
-20
-24
-28
-32
-36
-40
-44
-48
-52
-56
-60
Applied
(nominal)
-6
-10
-14
-18
-22
-26
-30
-34
-38
-42
-46
-50
Limits
-14.5to-17.5
-18.5to-21.5
-22.5to-25.5
-26.5to-29.5
-30.5to-33.5
-34.5to-37.5
-38.5to-41.5
-42.5to-45.5
-46.5to-49.5
-50.5to-53.5
-54.5to-57.5
-58.5to-61.5
-64
-68
-72
-76
-80
-84
-88
-90
-54
-58
-62
-66
-70
-74
-78
-80
-62.5 to -65.5
-66.5to-69.5
-70.5to-73.5
-74.5to-77.5
-78.5
to -8 1.5
-82.5to-85.5
-86.5to-89.5
-88.5to-91.5
57
Page 60

T.O.
CALIBRATION PERFORMANCE TABLE (Cont.)
4.10 SCALE FIDELITY CALIBRATION: (Cont.)
LOG 2
LINEAR:
from
REF LVL (nominal)
0
-4
-8
-12
-16
-18
Applied
0
-2
-4
-6
Applied
(nominal)
-2
-6
-8
Limits
Reference
-3.6 to -4.4
-7.2 to -8.8
-10.8 to -13.2
-14.5 to -17.5
-16.5 to -19.5
Limits
Reference
-1.68 to -2.33
-3.60 to -4.42
-5.50 to -6.54
-8
-10
-12
-14
-16
-18
4.11 FREQUENCY RESPONSE CALIBRATION:
ABSOLUTE:
Applied
9
to 2.9
2.9 to 6.46
6.46 to 13.0
58
-7.37 to -8.68
-9.21 to -10.87
-11.02 to -13.10
-12.78 to -15.42
-14.49 to -17.82
-16.14 to -20.36
Limits
Page 61

CALIBRATION PERFORMANCE TABLE (Cont.)
4.11 FREQUENCY RESPONSE CALIBRATION:
ABSOLUTE: (Cont.)
T.O.
Applied
13.0 to 19.7
19.7 to 22.0
19.7 to 26.5
S/N 23 124)
RELATIVE:
Applied
9
to 2.9
2.9 to 6.46
6.46 to 13.0
13.0 to
19.7
19.7 to 22.0
19.7 to
26.5
S/N 23
124)
4.12 FREQUENCY SPAN CALIBRATION:
(Opt HO1 and S/N
(Opt
(Opt HO1 and S/N
(Opt
Opt 026 and
Opt
026
Limits
.O dB
Limits
and
Range
Applied
500M
500 M 200 152.0 to 168.0
500 M 500 380.0 to 420.0
500 M
500 M 2k
500 M
500 M
500M 20 k 15.2 to 16.8 k
500 M
500M
500 M 200k
TI SPAN
100
10 k 7.6 to 8.4 k
50k 38.0 to 42.0 k
Limits
76.0 to 84.0
760.0 to 840.0
1.52 to 1.68 k
3.8 to 4.2 k
76.0 to 84.0 k
152.0 to 168.0 k
59
Page 62

T.O.
CALIBRATION PERFORMANCE TABLE (Cont.
4.12 FREQUENCY SPAN CALIBRATION: (Cont.)
Range Applied (Hz1
100 Hz
to 2
4.13 SWEEP TIME CALIBRATION:
500 M
500M
500M
500M
500M
500M
500M
1.1 G
TI SPAN
500k
2M
20M
50M
200 M
500 M
2G
Limits
380.0 to 420.0 k
760.0 to 840.0 k
1.52 to 1.68 M
3.8 to 4.2 M
7.6 to 8.4 M
15.2 to 16.8 M
38.0 to 42.0 M
76.0 to 84.0 M
152.0 to 168.0 M
380.0 to 420.0 M
760.0 to 840.0 M
1.52 to 1.68 G
Applied
Times
200.0 k 50
100.0 k
50.0 k
20.0 k 500
10.0 k lm
5.0 k 2m
2.0 k
500.0 20 m
Sweep Times
30m
50
m
Limits
42.5 to 57.5
85.0 to 115.0
170.0 to 230.0
425.0 to 575.0
0.850 to 1.15 m
1.70 to 2.30 m
4.25 to 5.75 m
8.5 to
17.0 to 23.0 m
Limits
29.7 to 30.3 m
49.5 to 50.5 m
Limits (s)
(Opt H51,
45 to 55
90to
450 to 550
0.9 to 1.1 m
1.8 to 2.2 m
4.5 to 5.5 m
9.0 to 11 m
18
Limits (s)
27 to 33 m
49.5 to 50.5 m
and
60
Page 63

CALIBRATION PERFORMANCE TABLE (Cont.)
4.13 SWEEP TIME CALIBRATION: (Cont.)
T.O.
Sweep Times
200m
500 m
2
10
20
50
60
4.14 RESIDUAL RESPONSE CALIBRATION:
Applied
200
to 6.46
99.0 to 101 .O m
198.0 to 202.0 m
495.0 to 505.0 m
0.99 to 1.01
1.98 to 2.02
4.95 to 5.05
9.9 to 10.1
19.8 to 20.2
49.5 to 50.5
59.4 to 60.6
Limits
c-90
Limits (s)
99.0 to 101 .O m
198.0 to 202.0 m
495.0 to 505.0 m
0.99 to 1.01
1.98 to 2.02
4.95 to 5.05
9.9 to 10.1
19.8 to 20.2
49.5 to 50.5
59.4 to 60.6
18
(Opt
4.15 RESIDUAL FM CALIBRATION:
Applied
2.8
4.16 SECOND HARMONIC DISTORTION CALIBRATION:
Applied
30 MHz
2.95
4.17 THIRD ORDER INTERMODULATION CALIBRATION:
Applied
2.7
5.0
1)
Applied
2.70005
5.00005
Limits
Hz
Limits
<-72
Hz for Opt H51)
Limits
Change 1
Blank)
Page 64

T.O.
APPENDIX A
A.1 TIME BASE ADJUSTMENT: [Room Temperature Crystal Oscillator (RTXO)]
A. 1.1
Connect Frequency Standard 10 MHz REF OUT to the Electronic Counter EXT FREQ STD INPUT
(I-10 MHz). Set Electronic Counter INT
STD switch to EXT STD.
A.1.2 Connect TI 10 MHz Reference Output to the Electronic Counter CH A input. Set Electronic Counter
50
switch to 50
A.1.3 Adjust the TI Reference Oscillator Adjustment for an Electronic Counter indication of 10 MHz
count of
LSD.
A. 1.4 Allow TI 10 MHz Reference Oscillator a minimum of one (1) hour to stabilize. Repeat step A. 1.3 as
required.
A. 1.5 Disconnect the test setup and continue
A.2 TIME BASE ADJUSTMENT: [Temperature Compensated Crystal Oscillator (TCXO)]
with
A.2.1 Connect Frequency Standard 10 MHz REF OUT to the Electronic Counter EXT FREQ STD INPUT
(l-10 MHz). Set Electronic Counter INT
STD switch to EXT STD.
A.2.2 Connect TI 10 MHz Reference Output to the Electronic Counter CH A input. Set Electronic Counter
50
A.2.3 Adjust the TI Reference Oscillator Adjustment for an Electronic Counter indication of 10 MHz
labeled on the cover of the TCXO. For example: If the Offset is labeled
switch to 50
and GATE TIME to 1 sec.
the Offset
Hz, the TCXO should be adjusted for
a frequency indication of 10.000 003.5 MHz on Electronic Counter.
A.2.4 Allow TI 10 MHz Reference Oscillator a minimum of one (1) hour to stabilize. Repeat step A.2.3 as
required.
A.2.5 Disconnect the test setup and continue with
A.3 TIME BASE ADJUSTMENT: [Oven Controlled Crystal Oscillator (OCXO)]
4.1.
A.3.1 Connect Frequency Standard 10 MHz FREQ OUT to Frequency Difference Meter (FDM) REF INPUT.
Connect TI rear panel 10 MHz Reference Output to the FDM SIG INPUT connector.
A.3.2 Standardize the FDM as required. Set FDM METER RANGE switch as required for an on scale indication
on the FDM.
A.3.3 Adjust TI Reference Oscillator Adjustment, as required for lowest possible null on the FDM meter.
A.3.4 Allow TI 10 MHz Reference Oscillator a minimum of one (1) hour to stabilize and repeat step A.3.3 as
required.
A.3.5 Disconnect equipment from TI and continue with
4.1.
A-l/(A-2 Blank)
 Loading...