

Page 1

Notice
Hewlett-Packard to Agilent Technologies Transition
This documentation supports a product that previously shipped under the HewlettPackard company brand name. The brand name has now been changed to Agilent
Technologies. The two products are functionally identical, only our name has changed. The
document still includes references to Hewlett-Packard products, some of which have been
transitioned to Agilent Technologies.
Printed in USA March 2000
Page 2

Calibration Guide
HP 8590D Spectrum Analyzer
HEWLETT
Pia
HP
Part No. 08590-90199
Printed in USA June 1992
PACKARD
Page 3

@Copyright Hewlett-Packard Company 1992
All
Rights
Reserved. Reproduction, adaptation, or translation without prior written permission
is prohibited, except as allowed under the copyright laws.
1212 Valley House Drive, Rohnert Park, CA 94928-4999, USA
Page 4

Notice
The information contained in this document is subject to change without notice.
Hewlett-Packard makes no warranty of any kind with regard to this material, including
but not limited to, the implied warranties of merchantability and fitness for a particular
purpose. Hewlett-Packard shall not be liable for errors contained herein or for incidental or
consequential damages in connection with the furnishing, performance, or use of this material.
. . .
III
Page 5

Certification
Hewlett-Packard Company certifies that this product met its published specifications at the
time of shipment from the factory. Hewlett-Packard further certifies that its calibration
measurements are traceable to the United States National Institute of Standards and
Technology, to the extent allowed by the Institute’s calibration facility, and to the calibration
facilities of other International Standards Organization members.
Regulatory Information
The specifications and characteristics chapter contains regulatory information.
Warranty
This Hewlett-Packard instrument product is warranted against defects in material and
workmanship for a period of one year from date of shipment. During the warranty period,
Hewlett-Packard Company will, at its option, either repair or replace products which prove to
be defective.
For warranty service or repair, this product must be returned to a service facility designated by
Hewlett-Packard. Buyer shall prepay shipping charges to Hewlett-Packard and Hewlett-Packard
shall pay shipping charges to return the product to Buyer. However, Buyer shall pay all
shipping charges, duties, and taxes for products returned to Hewlett-Packard from another
country.
Hewlett-Packard warrants that its software and firmware designated by Hewlett-Packard for
use with an instrument will execute its programming instructions when properly installed on
that instrument. Hewlett-Packard does not warrant that the operation of the instrument, or
software, or firmware will be uninterrupted or error-free.
LIMITATION OF WARRANTY
The foregoing warranty shall not apply to defects resulting from improper or inadequate
maintenance by Buyer, Buyer-supplied software or interfacing, unauthorized modification or
misuse, operation outside of the environmental specifications for the product, or improper
site preparation or maintenance.
NO OTHER WARRANTY IS EXPRESSED OR IMPLIED. HEWLETT-PACKARD SPECIFICALLY
DISCLAIMS THE IMPLIED WARRANTIES OF MERCHANTABILITY AND FITNESS FOR A
PARTICULAR PURPOSE.
EXCLUSIVE REMEDIES
THE REMEDIES PROVIDED HEREIN ARE BUYER’S SOLE AND EXCLUSIVE REMEDIES.
HEWLETT-PACKARD SHALL NOT BE LIABLE FOR ANY DIRECT, INDIRECT, SPECIAL,
INCIDENTAL, OR CONSEQUENTIAL DAMAGES, WHETHER BASED ON CONTRACT, TORT,
OR ANY OTHER LEGAL THEORY.
Assistance
Product rnaintename agreements and other customer assistance agreements are available for
Hewlett-Rxkard
Fbr
any assistance, contact your nearest
iv
products.
Hewlett-FWkard
Sales and
Seruice Ome.
Page 6

Safety Symbols
The following safety symbols are used throughout this manual. Familiarize yourself with each
of the symbols and its meaning before operating this instrument.
Caution
The caution sign denotes a hazard. It calls attention to a procedure which, if
not correctly performed or adhered to, could result in damage to or destruction
of the instrument. Do not proceed beyond
conditions are fully understood and met.
Warning
The warning sign denotes a hazard. It calls attention to a procedure
which, if not correctly performed or adhered to, could result in injury
or loss of life. Do not proceed beyond a warning sign until the indicated
conditions are fully understood and met.
General Safety Considerations
Before this
Warning
Warning
grounded through the protective conductor of the ac power cable to a
socket outlet provided with protective earth contact.
Any interruption of the protective (grounding) conductor, inside or
outside the instrument, or disconnection of the protective earth terminal
can result in personal injury.
There are many points in the instrument which can, if contacted, cause
personal injury. Be extremely careful.
instrument
is switched on, make sure it has been properly
acaution
sign until the indicated
Caution
Any adjustments or service procedures that require operation of the
instrument with protective covers removed should be performed only by
trained service personnel.
Before this
instrument
is switched on, make sure its primary power circuitry
has been adapted to the voltage of the ac power source.
Failure to set the ac power input to the correct voltage could cause damage to
the instrument when the ac power cable is plugged in.
V
Page 7

HP 8590 Series Spectrum Analyzer Documentation Description
The following guides are shipped with your spectrum analyzer:
HP 8590 Series Spectrum Analyzer User’s
w
Tells you how to make measurements with your spectrum analyzer.
w
Describes the spectrum analyzer features.
w
Tells you what to do in case of a failure.
HP 8590 Series Spectrum Analyzer Quick Reference Guide
n
Describes how to make a simple measurement with your spectrum analyzer.
n
Briefly describes the spectrum analyzer functions.
w
Lists all the programming commands.
hide
The Calibration Guide for your spectrum analyzer
n Tells you how to test your spectrum analyzer to determine if the spectrum analyzer meets
its specifications.
w
Lists specifications and characteristics for the spectrum analyzer.
Documentation Options
Option 910:
HP 8590 Series Spectrum
HP 8590 Series Spectrum Analyzer Quick Reference
Calibration Guide (Model Specific)
Provides an additional copy of the HP 8590 Series User’s, Programmer’s, and Quick
Reference Guides, and the Calibration Guide.
Analyzer
User’s Guide
Guide
Option 915:
Service Guide (Model Specific)
HP 8590 Series Spectrum Analyzer Component-Level Information
The service guide describes assembly-level repair of the spectrum analyzer. Component-level
information provides information for component-level repair of the spectrum analyzer.
Option 021 and Option 023:
HP 8590 Series Spectrum
Analyzer
Programmer’s Guide
The programmer’s guide describes spectrum analyzer operation via a remote controller
(computer) for spectrum analyzers equipped with Options 021 or 023. This guide is provided
when ordering spectrum analyzers equipped with either Option 021 or Option 023.
How to Order Guides
Each of the guides listed above can be ordered individually. To order, contact your local
HP Sales and Service Office.
vi
Page 8
How to Use This Guide
Where to Start
If you have just received your spectrum analyzer and want to get ready for use for the first
time, do the following:
n
Read Chapters 1 and 2 of the
n
Perform the initial self-calibration routines described in Chapter 2 of the
Spectrum Analyzer
User’s Guide
equipment).
n If you need to verify the unit is operating within its specifications, perform the performance
verification tests in Chapter 1 of this guide.
HP 8590 Series Spectrum
Analyzer
User’s Guide.
HP 8590 Series
(these are automatic self-checks and require no test
After completing the performance verification, use the
User’s Guide to learn how to use the spectrum analyzer and to find more detailed information
HP 8590 Series Spectrum
Analyzer
about the spectrum analyzer, its applications, and key descriptions.
This guide uses the following conventions:
r)
(Front-Panel Ke
Sof
tkey A boxed word written in this typeface indicates a “softkey,” a key whose label
Screen
Text
Caution
A boxed, uppercase name in this typeface represents a key physically located
on the instrument.
is determined by the instrument’s firmware.
Text printed in this typeface indicates text displayed on the spectrum analyzer
screen.
The CAUTION symbol denotes a hazard. It calls attention to a procedure
which, if not correctly performed or adhered to, could result in damage to or
destruction of the instrument. Do not proceed beyond a CAUTION symbol until
the indicated conditions are fully understood and met.
vii
Page 9

Contents
1. Calibrating
Calibration
Operation Verification
Safety
Before You Start
Performance Verification Test Record
....................................
Test equipment you will need
Recording the test results
If the spectrum analyzer doesn’t meet specifications
Periodically verifying operation
1. Frequency Readout Accuracy
2. Frequency Readout and Marker Count Accuracy for Option 013
3. Noise Sidebands
4. System Related Sidebands
5. Frequency Span Readout Accuracy
6. Sweep Time Accuracy
7. Scale Fidelity
8. Reference Level Accuracy
9. Absolute Amplitude Calibration and Resolution Bandwidth Switching
Uncertainties
10. Calibrator Amplitude and Frequency Accuracy
11. Frequency Response
12. Other Input Related Spurious Responses
13. Spurious Response
14. Gain Compression
15. Displayed Average Noise Level
16. Residual Responses
17. Absolute Amplitude, Vernier, and Power Sweep Accuracy
18. Tracking Generator Level Flatness
19. Harmonic Spurious Outputs
20. Non-Harmonic Spurious Outputs
21. Tracking Generator Feedthrough
22. 10 MHz Reference Output Accuracy
.................................
............................
...............................
........................
.........................
.............
.......................
.....................
.....
...........................
.......................
...................
.........................
.............................
.......................
.............................
............
.........................
................
..........................
..........................
....................
.........................
.......
..................
......................
...................
...................
..................
.....................
l-l
l-l
l-3
l-3
l-3
l-3
l-3
l-4
l-9
l-11
1-14
1-17
1-19
l-22
l-24
l-30
l-34
l-37
l-42
l-50
l-54
l-60
l-63
l-69
l-72
l-75
l-79
1-82
l-87
1-91
l-93
2. Specifications and Characteristics
General Specifications
Frequency Specifications
Amplitude Specifications
Option Specifications
Frequency Characteristics
Amplitude Characteristics
Option Characteristics
Physical Characteristics
Regulatory Information
Declaration of Conformity
............................
...........................
...........................
.............................
..........................
..........................
............................
...........................
...........................
.........................
Notice for Germany: Noise Declaration
HP 959OD Spectrum Analyzer
...................
2-2
2-3
2-5
2-8
2-10
2-11
2-13
2-14
2-18
2-19
2-20
Contents-l
Page 10

3.
If You Have a Problem
Calling HP Sales and Service Offices
Before calling Hewlett-Packard
Check the basics
..............................
......................
....................... 3-l
Returning the Spectrum Analyzer for Service .................
Package the spectrum analyzer for shipment ................
3-l
3-2
3-4
3-4
Contents-2
HP 85900 Spectrum Analyzer
Page 11

Figures
l-l. Frequency Readout Accuracy Test Setup
l-2. Frequency Readout Accuracy Test Setup for Option 013
l-3. Noise Sidebands Test Setup
.........................
l-4. System Related Sidebands Test Setup
1-5. Frequency Span Accuracy Test Setup
l-6. Sweep Time Accuracy Test Setup
l-7. Scale Fidelity Test Setup
..........................
......................
l-8. Reference Level Accuracy Test Setup
l-9. Uncertainty Test Setup
l-
10. LPF Characterization
...........................
............................
l-11. Calibrator Amplitude Accuracy Test Setup
1-12. Calibrator Frequency Accuracy Test Setup
1-13. System Characterization Test Setup
1-14. Frequency Response Test Setup,
1-15. Frequency Response Test Setup,
1-16. Frequency Response Test Setup
(Option 001)
250
MHz
250
MHz, for Option 001
(~50 MHz)
1-17. Other Input Related Spurious Test Setup
1-18. Second Harmonic Distortion Test Setup, 30 MHz
1-19. Third Order Intermodulation Distortion Test Setup
l-20. Gain Compression Test Setup
........................
1-21. Displayed Average Noise Level Test Setup
l-22. Residual Response Test Setup
........................
..................
...........
....................
....................
....................
..................
..................
...............
..................
..........
.................
..................
...............
..............
..................
l-23. Absolute Amplitude, Vernier, and Power Sweep Accuracy Test Setup
l-24. Tracking Generator Level Flatness Test Setup
l-25. Harmonic Spurious Outputs Test Setup
l-26. Non-Harmonic Spurious Outputs Test Setup
l-27. Tracking Generator Feedthrough Test Setup
l-28. 10 MHz Reference Test Setup
........................
3-l. Spectrum Analyzer Packaging Materials
................
...................
.................
.................
...................
.....
l-9
l-11
1-14
1-17
1-19
l-22
l-24
l-30
l-34
l-38
l-40
1-41
l-43
l-44
l-44
l-46
1-51
l-55
l-57
1-61
l-63
l-69
l-72
l-75
l-79
l-83
l-87
1-91
3-5
HP 9590D Spectrum Analyzer
Contents9
Page 12

Ylhbles
l-l. Performance Verification Tests
l-2. Recommended Test Equipment
l-3. Recommended Accessories
l-4. Recommended Cables
l-5. Frequency Readout Accuracy
l-6. Frequency Readout Accuracy
l-7. Frequency Span Readout Accuracy
1-8. Sweep Time Accuracy
l-9. Cumulative and Incremental Error, Log Mode
l-10. Scale Fidelity, Linear Mode
l-11. Reference Level Accuracy, Log Mode
1-12. Reference Level Accuracy, Linear Mode
1-13. Resolution Bandwidth Switching Uncertainty
1-14. Frequency Response Errors Worksheet
1-15. Frequency Response (~50 MHz) Worksheet
1-16. Image Responses Worksheet
1-17. Displayed Average Noise Level,
1-18. Residual Responses Above
1-19. Vernier Accuracy Worksheet
l-20 Level Flatness Relative to 300 MHz Worksheet
1-21. Harmonic Spurious Responses Worksheet
l-22. Fundamental Response Amplitudes Worksheet
l-23. Non-Harmonic Responses Worksheet
l-24. TG Feedthrough Worksheet
l-25. Performance Verification Test Record
3-l. Hewlett-Packard Sales and Service Offices
...........................
...........................
.......................
.......................
.........................
........................
........................
.....................
.........................
....................
...................
...................
........................
.......................
DispIay
Line
........................
.........................
...................
..................
....................
....................
..................
................
................
.................
................
................
l-2
l-4
l-6
l-8
l-10
1-12
1-21
l-23
l-26
l-27
l-32
l-33
l-36
l-48
l-49
l-53
l-68
1-71
l-74
l-78
l-81
l-85
l-86
l-90
l-93
3-3
Contents-4
HP 8590D Spectrum Analyzer
Page 13

1
Calibrating
This chapter contains performance test procedures which test the electrical performance of the
spectrum analyzer.
Allow the spectrum analyzer to warm up in accordance with the Temperature Stability
specification in Chapter 2 before performing the tests in this chapter.
None of the test procedures involve removing the cover of the spectrum analyzer.
Calibration
Calibration verifies that the spectrum analyzer performance is within all specifications listed in
Chapter 2. It is time consuming and requires extensive test equipment. Calibration consists of
all
the performance tests. See
‘Ihble
l-l for a complete listing of the performance tests.
Operation Verification
Operation verification consists of a subset of the performance tests. See Table l-l. Operation
verification tests only the most critical specifications of the spectrum analyzer. These tests are
recommended for incoming inspection, troubleshooting, or after repair. Operation verification
requires less time and equipment than the calibration.
HP
859013
Spectrum Analyzer
Calibrating l-l
Page 14
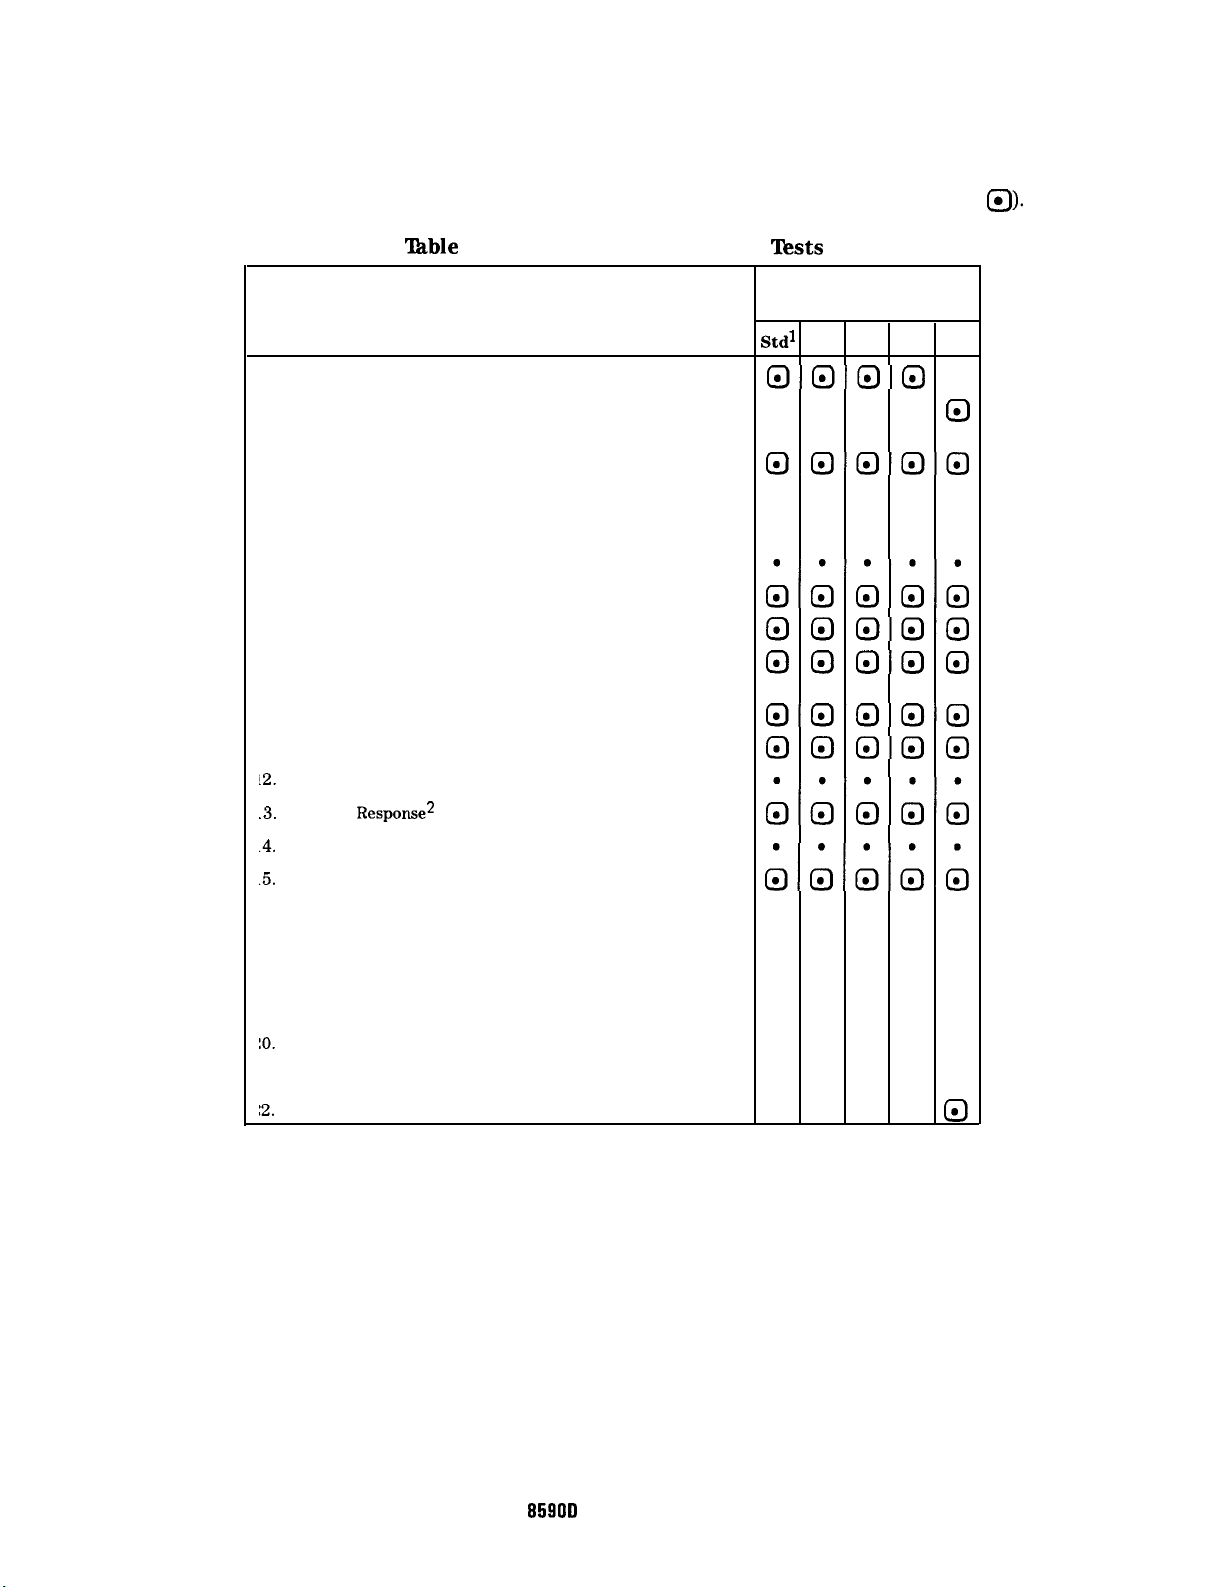
The following table lists the performance tests included in this chapter. Select the spectrum
analyzer option being calibrated and perform the tests marked in the option column. Note that
some of the tests are used for both calibration and operation verification (marked with
‘Ihble
l-l. Performance Verification Tests
Calibration for
Performance Test Name Instrument Option:
Stdl 001 010 011 013
0).
1. Frequency Readout Accuracy
2. Frequency Readout and Marker Count Accuracy
for Option 013
3. Noise Sidebands
4. System Related Sidebands
5. Frequency Span Readout Accuracy
6. Sweep Time Accuracy
7. Scale Fidelity
8. Reference Level Accuracy
9. Absolute Amplitude Calibration and Resolution Bandwidth
Switching Uncertainties
10. Calibrator Amplitude and Frequency Accuracy
Il. Frequency Response
~2.
Other Input Related Spurious Responses
.3.
Spurious
.4.
Gain Compression
.5.
Displayed Average Noise Level
6. Residual Responses
7. Absolute Amplitude, Vernier, and Power Sweep Accuracy
8. Tracking Generator Level Flatness
9. Harmonic Spurious Outputs
10.
Non-Harmonic Spurious Outputs
Il. Tracking Generator Feedthrough
:2.
10 MHz Reference Output Accuracy
Response2
000n
000nEl
.
;;;;;
00000
000n0
00n00
00000
b&i;
;A;;;
. . . . .
. . .
. .
. .
.
. .
. .
0
.
.
0
1 Use this column for all other options not listed in this table.
2 “Part 2: Third Order Intermodulation Distortion, 50 MHz” is not required for operation
verification.
1-2 Calibrating
859lJD Spectrum Analyzer
HP
Page 15

Safety
Familiarize yourself with the safety symbols marked on the pulse generator, and read the
general safety instructions and the symbol definitions given in the front of this manual before
you begin verifying performance of the pulse generator.
Before You Start
There are four things you should do before starting a performance verification test:
n Switch the spectrum analyzer on and let it warm up in accordance with the Temperature
Stability specification in Chapter 2.
n
Read “Making a Measurement” in Chapter 2 of the
Guide.
n After the spectrum analyzer has warmed up as specified, perform the Self-Calibration
Procedure documented in “Improving Accuracy With Self-Calibration Routines” in
Chapter
2
of the
HP 8590 Series Spectrum
spectrum analyzer is only specified after the spectrum analyzer calibration routines have
been run and if the spectrum analyzer is autocoupled.
n Read the rest of this section before you start any of the tests, and make a copy of the
Performance Test Record described in “Recording the Test Results.”
HP 8590 Series Spectrum
Anulyzer
User’s Guide. The performance of the
Analyzer
User’s
Test
equipment you will need
Tables l-2 through l-4 lists the recommended test equipment for the performance tests. The
tables also lists recommended equipment for the spectrum analyzer adjustment procedures
which are located in the
HP 85900 Spectrum Anulyzer Service Guide. Any equipment that
meets the critical specifications given in the table can be substituted for the recommended
model.
Recording the test results
A performance test record is provided at the end of this chapter.
Each test result is identified as a
TR Entry in the performance tests and on the performance
test record. We recommend that you make a copy of the performance test record, record the
test results on the copy, and keep the copy for your calibration test record. This record could
prove valuable in tracking gradual changes in test results over long periods of time.
If the spectrum analyzer doesn’t meet specifications
If the spectrum analyzer fails a test, rerun the frequency calibration and amplitude calibration
routines by pressing CAL
If the spectrum analyzer still fails one or more specifications, complete any remaining tests and
record all test results on a copy of the test record. Then refer to Chapter 3, “If You Have a
Problem,” for instructions on how to solve the problem.
FREQ B
AMPTD . Press CAL STORE , then repeat the verification test.
HP 8590D Spectrum Analyzer
Calibrating 1-3
Page 16
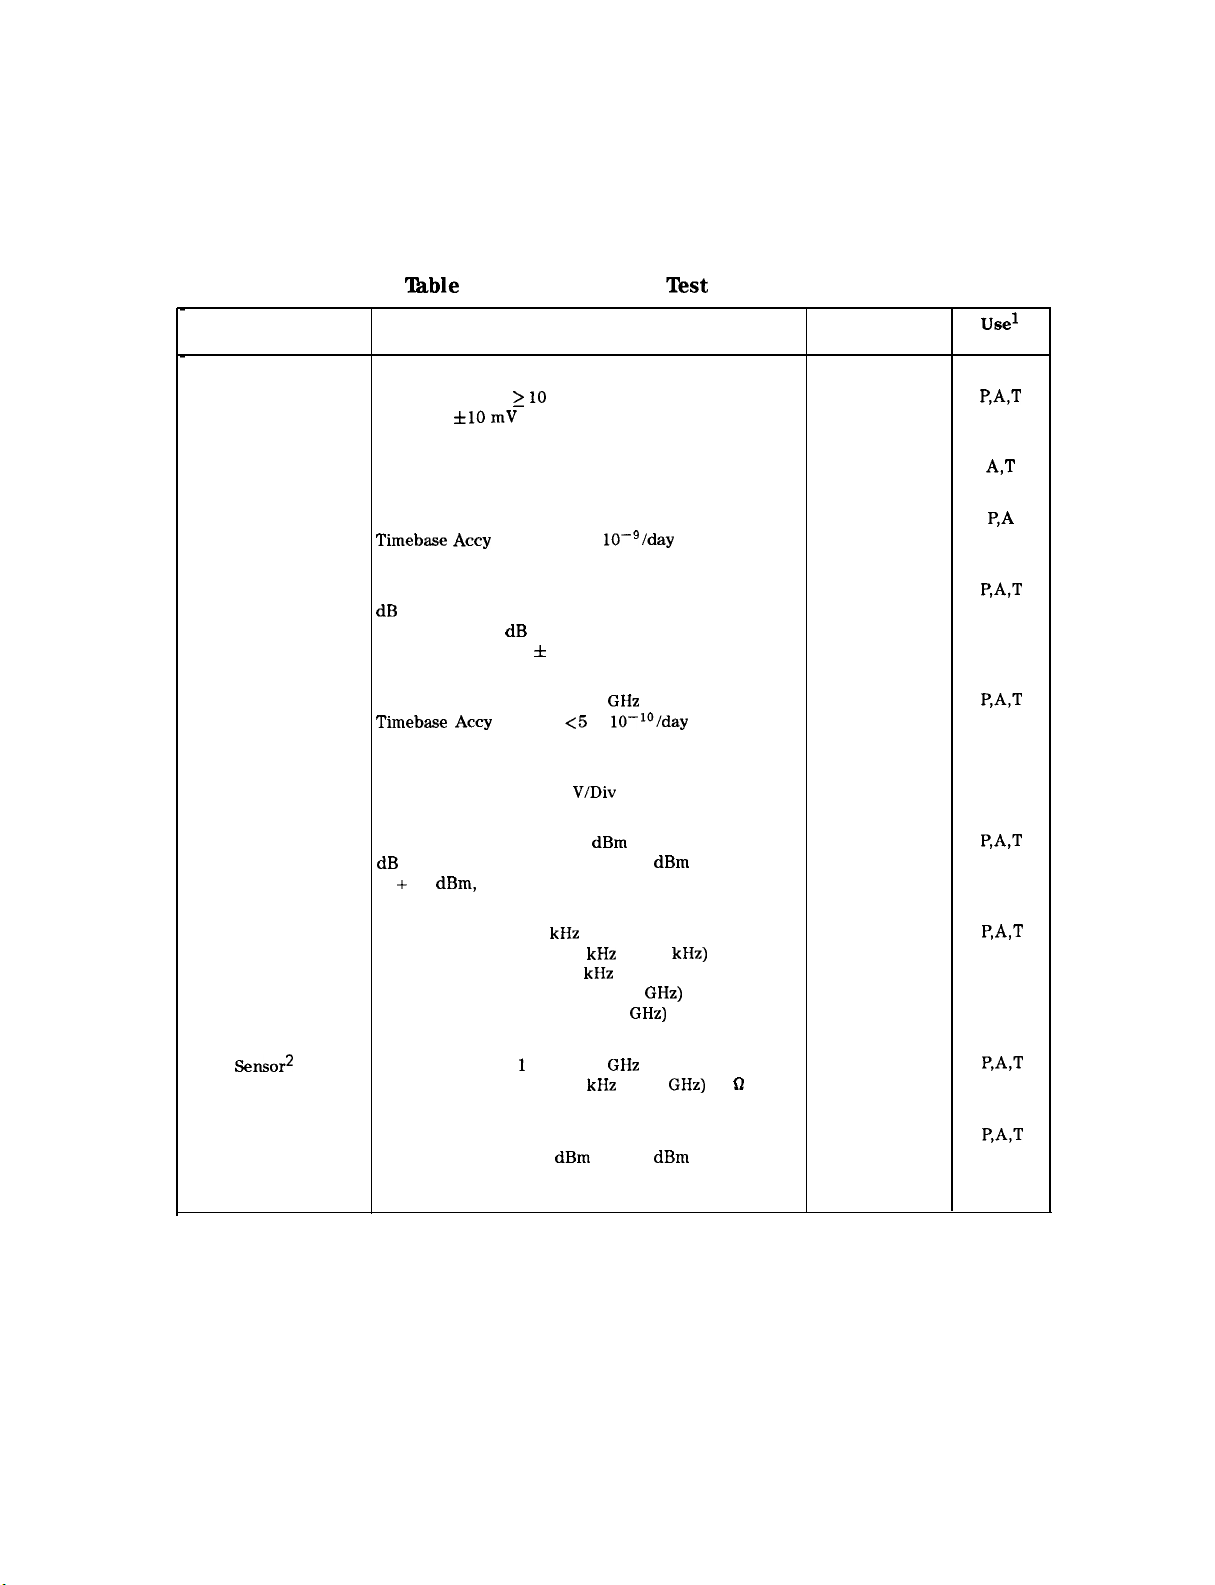
Periodically verifying operation
The spectrum analyzer requires periodic verification of operation. Under most conditions
of use, you should test the spectrum analyzer at least once a year with either operation
verification or the complete set of performance verification tests.
‘able
1-2. Recommended Test Equipment
Equipment
Digital Voltmeter
DVM Test Leads
Frequency Standard
Measuring Receiver
Microwave Frequency
Counter
Oscilloscope
Power Meter
Critical Specifications for
Equipment Substitution
Input Resistance: 2 10 megohms
Accuracy:
For use with HP 3456A
Frequency: 10 MHz
Timebase
Compatible with Power Sensors
dB
Resolution: 0.01 dB
Reference Accuracy: f 1.2 %
Frequency Range: 9 MHz to 7
Timebase
Bandwidth: dc to 100 MHz
Vertical Scale Factor of 5 V/Div
Power Range: Calibrated in
dB
to + 44
f10 mV
Accy
Relative Mode
Accy
relative to reference power -70
dBm,
on 100 V range
(Aging): < 1 x
(Aging): <5 x
dBm
sensor dependent
l0-g/day
GHz
lo-lo/day
and
dBm
Recommended
Model
HP 3456A
HP 34118
HP 5061B
HP 8902A
HP 5343A
HP 54501A
HP 436A
Use1
PAT
A,T
P,A
R&T
PAT
T
EAT
Power Sensor
Power
Sensor2
Power Sensor,
Low-Power
1 P = Performance Test, A = Adjustment, T = Troubleshooting
2 Option 001 and Option 011 Only
Frequency Range: 100
Maximum SWR:
Frequency Range:
Maximum SWR:
Frequency Range: 300 MHz
Amplitude Range: -20
Maximum SWR: 1.1 (300 MHz)
1-4 Calibrating
kHz
to 1800 MHz
1.60 (100
1.20 (300
1.1 (1 MHz to 2.0
1.30 (2.0 to 2.9
1
MHz to 2
1.18 (600
dBm
kHz
kHz
kHz
to -70
HP 8590D Spectrum Analyzer
to 300
to 1 MHz)
GHz)
GHz)
GHz
to 2.0
dBm
kHz)
GHz)
75 9
HP 8482A
HP 8483A
HP 8484A
PAT
PAT
PAT
Page 17
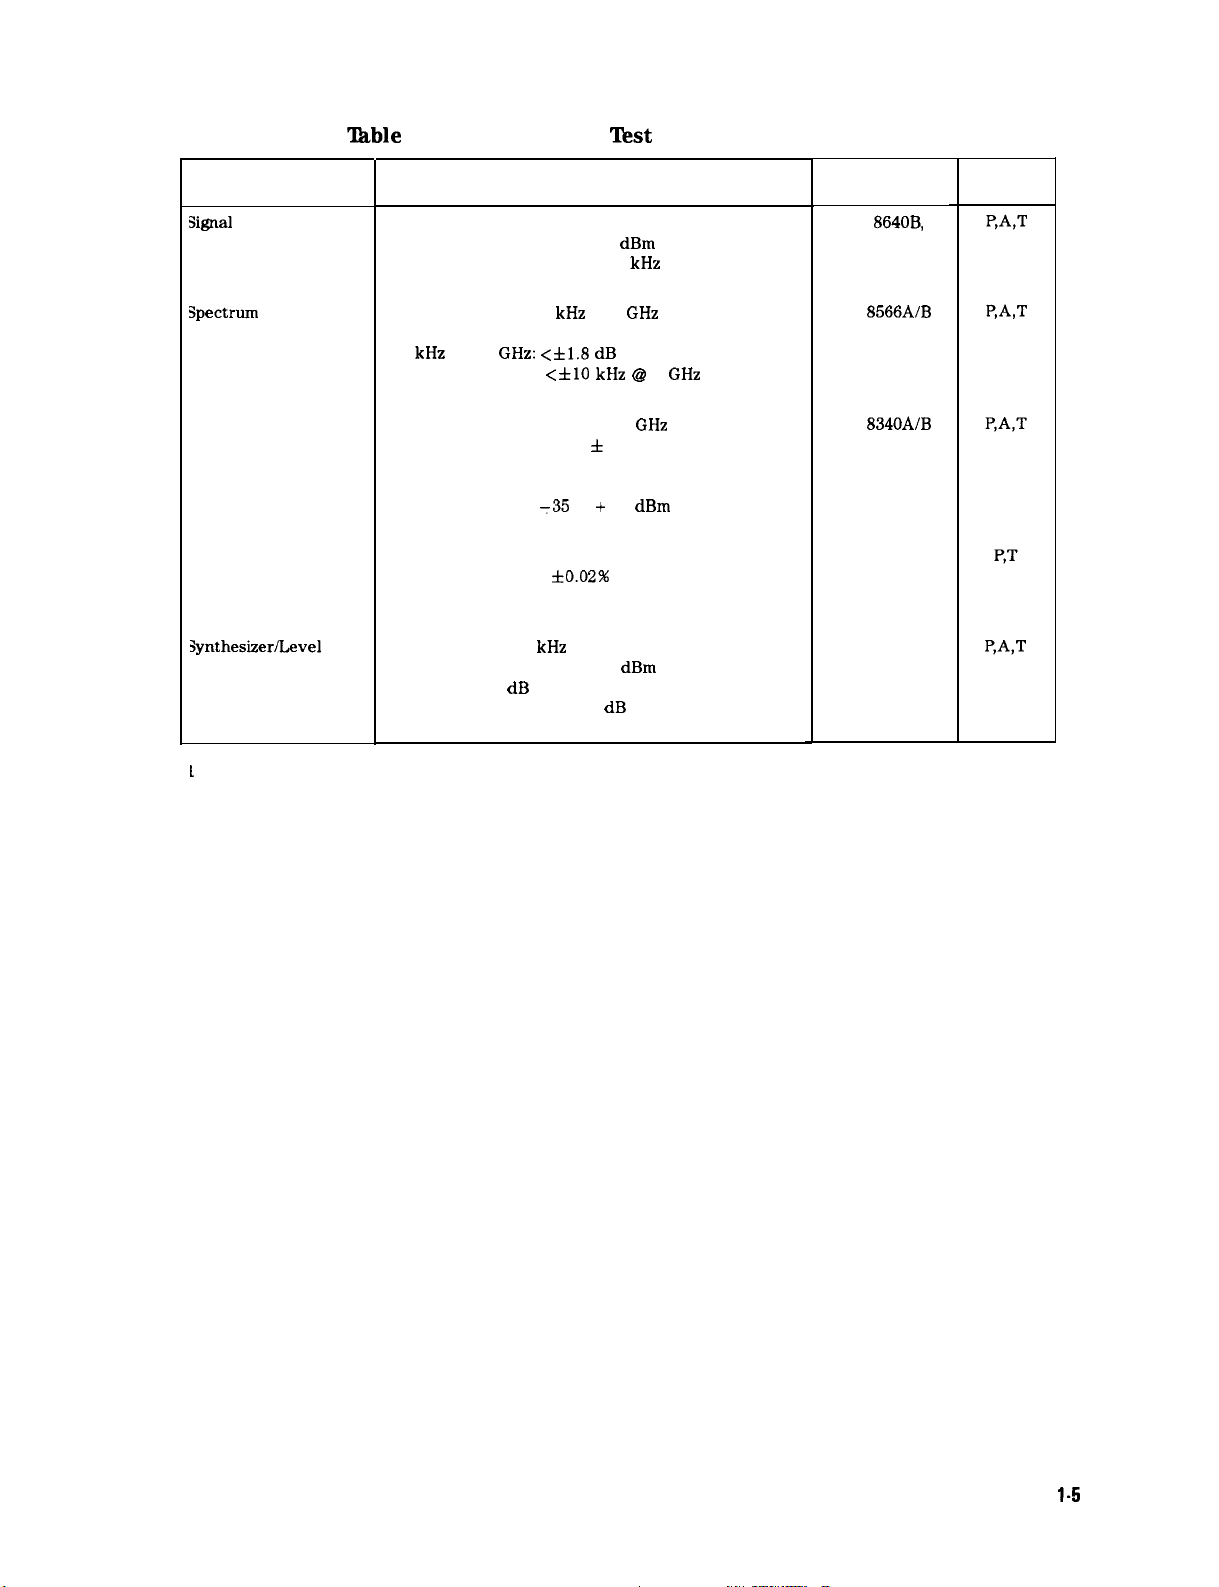
‘able
l-2. Recommended Test Equipment (continued)
Equipment
Signal
Generator
3pectrum
Microwave
Synthesized Sweeper
Synthesizer/Function
Generator
$nthesizer/Level
Generator
Analyzer,
Critical Specifications for
Equipment Substitution
Frequency Range: 1 MHz to 1000 MHz
Amplitude Range: -35 to + 16
SSB Noise: <-120 dBc/Hz at 20
Frequency Range: 100
Relative Amplitude Accuracy:
100
kHz
to 1.8
Frequency Accuracy:
Frequency Range: 10 MHz to 1.8
Frequency Accuracy (CW): f 0.02%
Leveling Modes: Internal and External
Modulation Modes: AM
Power Level Range:
Frequency Range:
Frequency Accuracy:
Waveform: Triangle
Frequency Range: 1
Amplitude Range: + 12 to -85
Flatness: f0.15 dB
Attenuator Accuracy: f0.09 dB
kHz
GHz: <f1.8 dB
<flO kHz @
-35
0.1 Hz to 500 Hz
f0.02%
kHz
dBm
kHz
to 7
GHz
to + 16
to 80 MHz
dBm
offset
7
GHz
dBm
GHz
Recommended
Model
HP
8640B,
Option 002
HP 8566AfB
HP
8340AIB
HP 3325B
HP 3335A
Use’
1
P = Performance Test, A = Adjustment, T = Troubleshooting
HP 859OD Spectrum Analyzer
Calibrating
l-5
Page 18
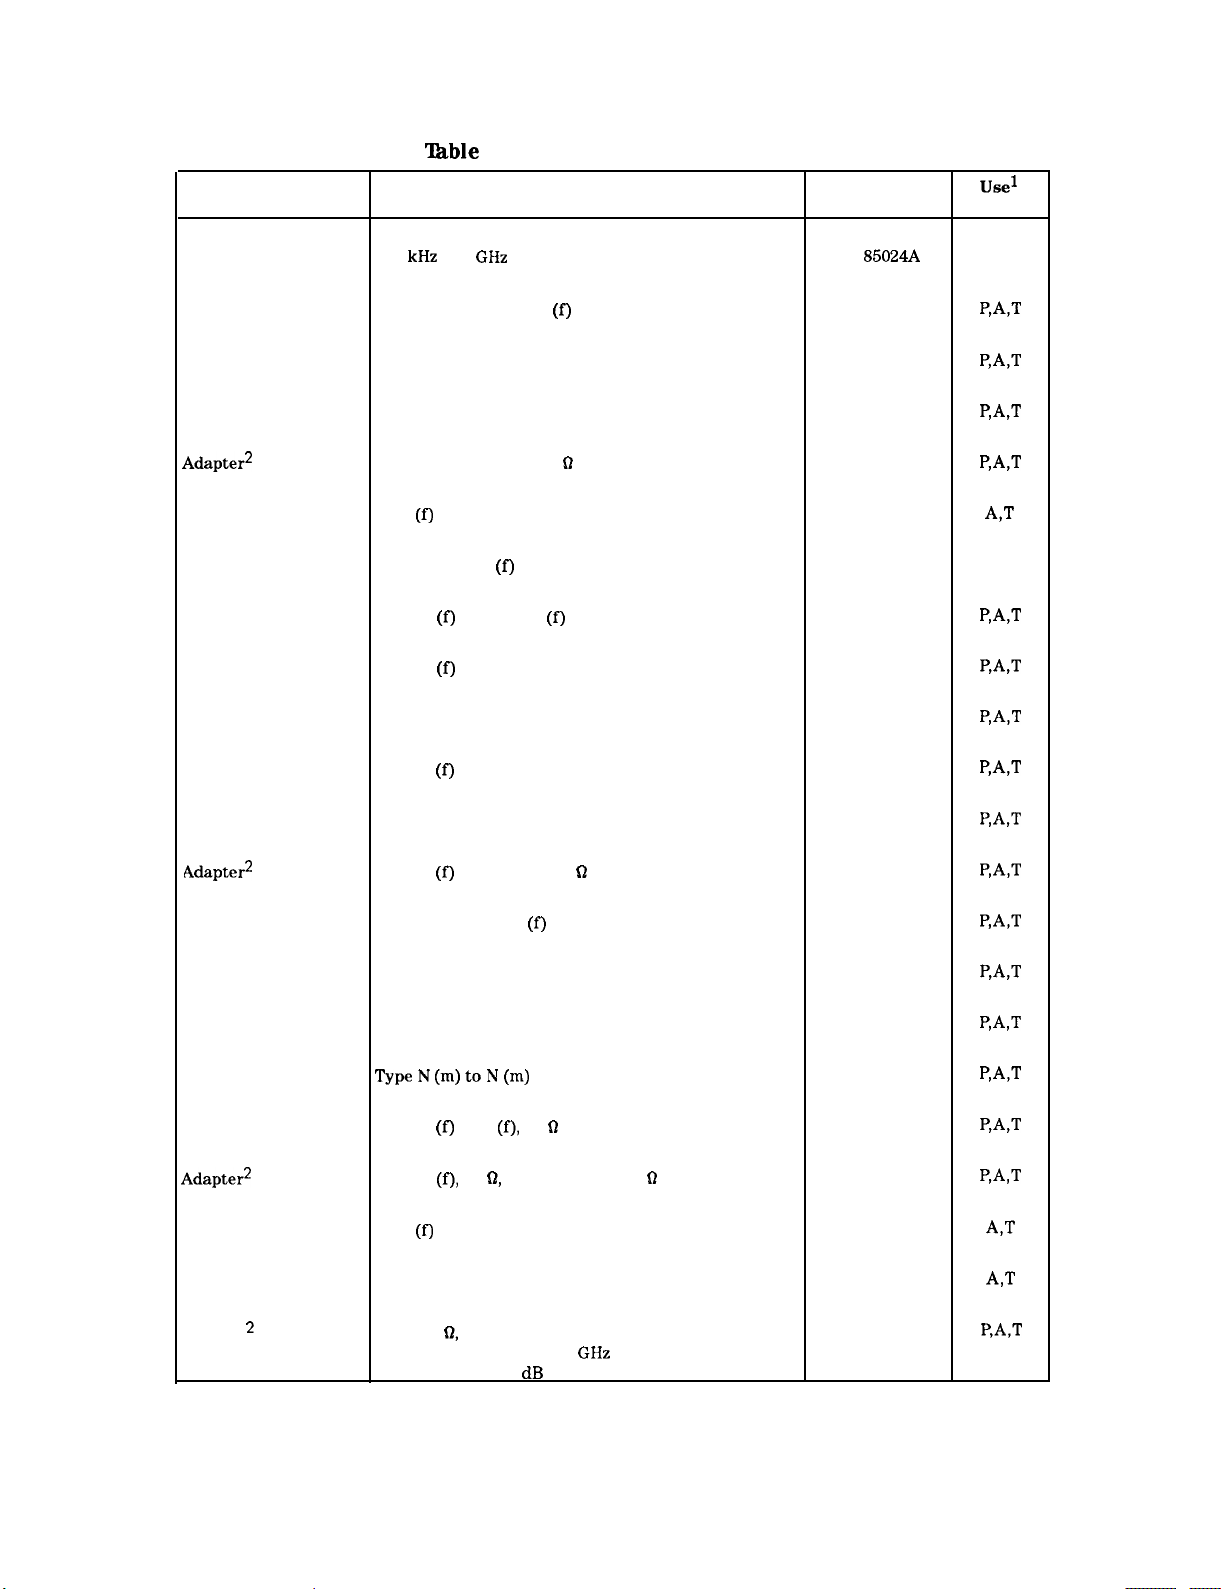
Equipment
Active Probe
‘Etble
1-3. Recommended Accessories
5 Hz to 500 MHz
300
kHz
to 3
GHz
Critical Specifications for
Accessory Substitution
Recommended
Model
HP 41800A
HP 85024A
Use1
T
Adapter
Adapter
Adapter
Adapter2
Adapter
Adapter
Adapter
Adapter
Adapter
Adapter
Adapter
Adapter*
APC 3.5 (f) to APC 3.5 (f)
BNC (f) to dual banana plug
BNC (m) to BNC (m)
BNC (m) to BNC (m), 75
BNC
(f)
to SMB (m)
BNC tee (m) (f) (f)
Type N (f) to APC 3.5 (f)
Type N (f) to APC 3.5 (m)
Type N (m) to APC 3.5 (m)
Type N (f) to BNC (f)
Type N (f) to BNC (m)
Type N (f) to BNC (m), 75
G
5061-5311
1251-1277
1250-0216
1250-1288
1250-1237
1250-0781
1250-1745
1250-1750
1250-1743
1250-1474
1250-1477
Q
1250-1534
PAT
P,A,T
P,A,T
P,-%T
A,T
T
PAT
RAT
PAT
P,A,T
PAT
PAT
Adapter
Adapter
Adapter
Adapter
Adapter
Adapter2
Adapter
Adapter
Adapter,
1
2
2
Minimum Loss
P = Performance Test, A = Adjustment, T = Troubleshooting
Option 001 and Option 011 Only
Type N (m) to BNC
Type N (m) to BNC (m) (2 required)
Type N (f) to N (f)
Type N 04 to N (m)
Type N (f) to N (f), 75
Type N (f), 75 Q, to Type N (m), 50 9
SMB
(f)
to SMB (f)
SMB (m) to SMB (m)
50 to 75 Q, matching
Frequency Range: dc to 2
Insertion Loss: 5.7
(f>
(4 required)
Q
dB
GHz
1250-1476
1250-1473
1250-1472
1250-1475
1250-1529
1250-0597
1250-0692
1250-0813
HP 11852B
P,A,T
RAT
P,A,T
PAT
EAT
C&T
AT
A,T
P,A,T
1-6 Calibrating
HP 8590D Spectrum Analyzer
Page 19
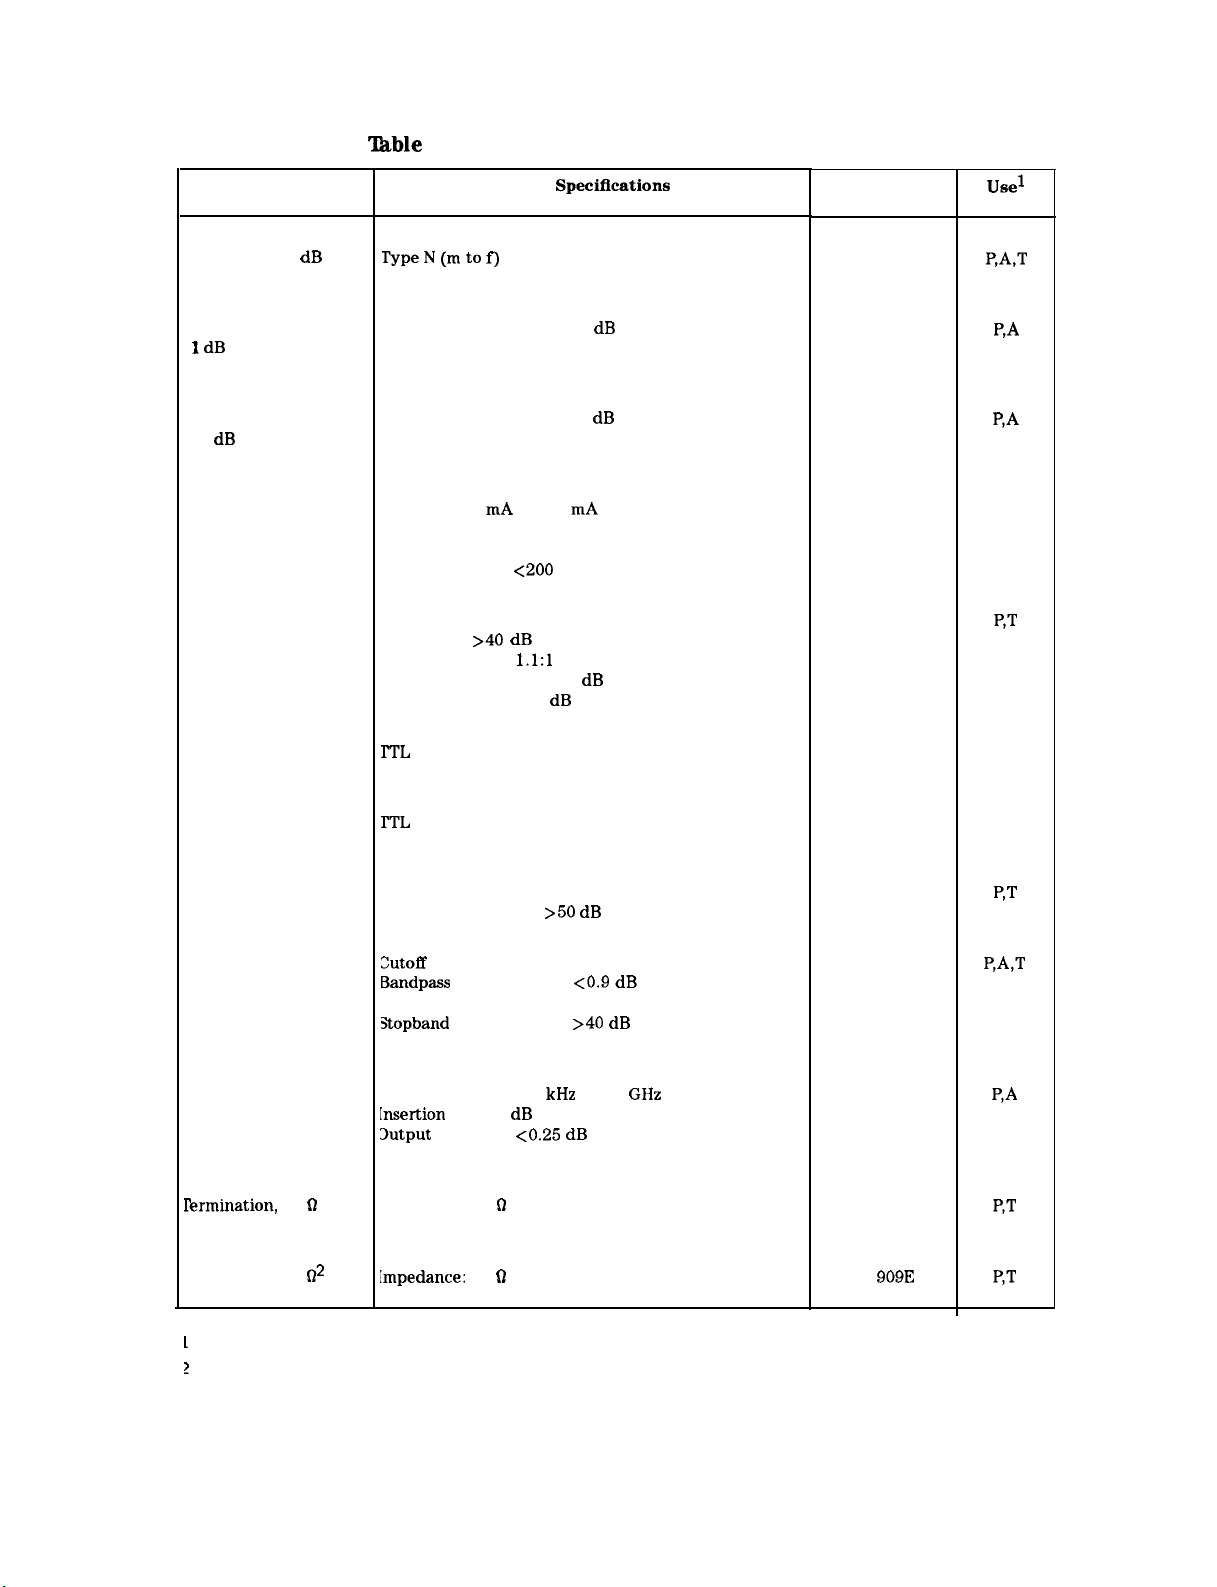
‘Ihble
1-3. Recommended Accessories (continued)
Equipment
Attenuator, 10 dB
Attenuator,
1 dB
Step
Attenuator,
10 dB Step
Digital Current
Tracer
Directional Bridge
Logic Pulser
Critical
We N Cm to
Frequency: 300 MHz
Attenuation Range: 0 to 12 dB
Frequency Range: 50 MHz
Connectors: BNC female
Attenuation Range: 0 to 30
Frequency Range: 50 MHz
Connectors: BNC female
Sensitivity: 1 mA to 500 mA
Frequency Response: Pulse trains to 10 MHz
Minimum Pulse Width: 50 ns
Pulse Rise Time:
Frequency Range: 0.1 to 110 MHz
Directivity:
Maximum VSWR:
Transmission Arm Loss: 6 dB (nominal)
Coupling Arm Loss: 6 dB (nominal)
TTL
voltage and current drive levels
f)
>40
Specifications
Accessory Substitution
dB
<200
ns
dB
l.l:l
for
Recommended
Model
HP 8491A
Option 010
HP 355C
HP 355D
HP 547A
HP 8721A
HP 546A
Use1
P,A,T
P,A
P,A
T
P,T
T
Logic Clip
Low Pass Filter,
50 MHz
Low Pass Filter,
300 MHz
Power Splitter
fermination, 50
Q
TTL
voltage and current drive levels
Cutoff Frequency: 50 MHz
Rejection at 80 MHz:
Cutoff
Frequency: 300 MHz
Bandpass
at 300 MHz
jtopband Insertion Loss:
at 435 MHz
Frequency Range: 50
[nsertion
3utput Tracking:
Equivalent Output SWR: < 1.22: 1
Impedance: 50 G (nominal)
Insertion Loss:
Loss: 6 dB (nominal)
>50 dB
kHz
co.25 dB
<0.9
dB
>40 dB
to 1.8
GHz
(2 required for Option 010)
fermination. 75
Q2
rmpedance:
75 0 (nominal)
(2 required for option 011)
1
P = Performance Test, A = Adjustment, T = Troubleshooting
1
Option 001 and Option 011 Only
HP 548A
0955-0306
0955-0455
HP 11667A
HP 908A
HP
909E
Option 201
T
P,T
P,A,T
P,A
P,T
P,T
HP 8590D Spectrum Analyzer
Calibrating 1-7
Page 20
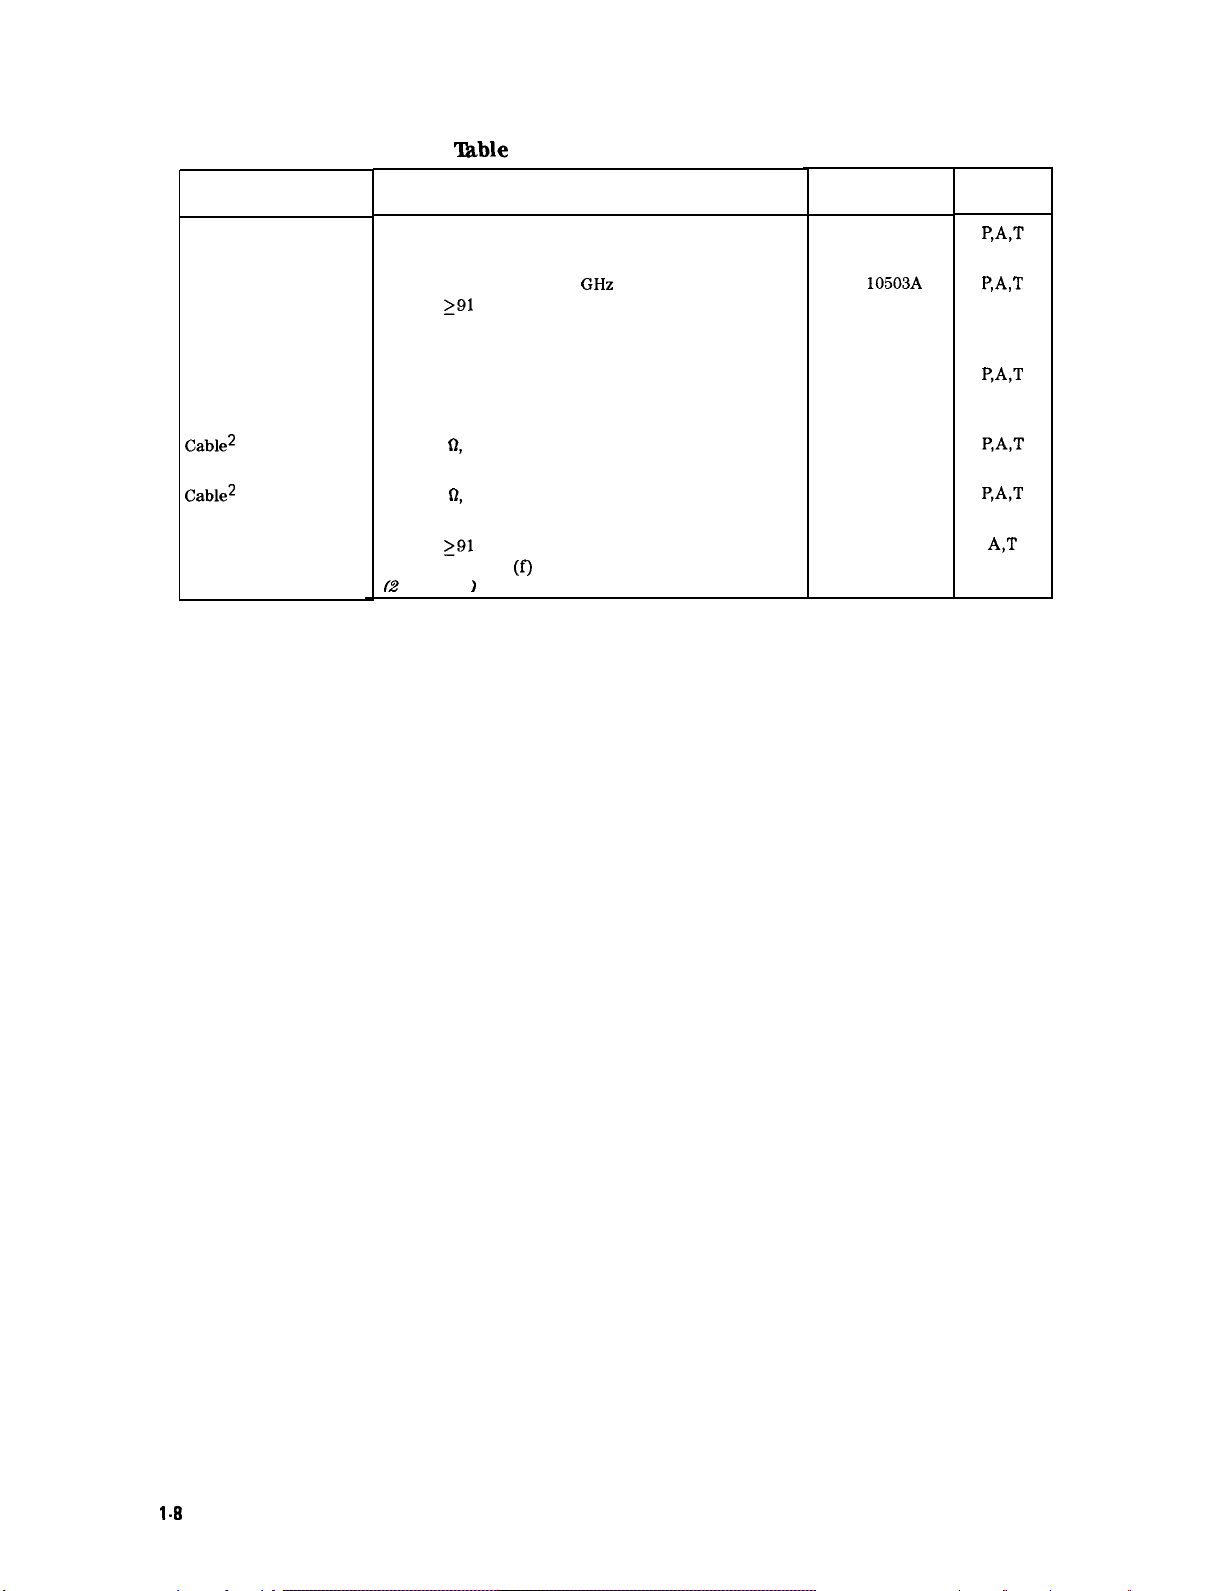
Cable
Cable
Cable
Cable2
Equipment
Table
l-4. Recommended Cables
Critical Specifications for
Cable Substitution
Type N, 183 cm (72 in)
Frequency Range: dc to 1
Length:
Connectors: BNC (m) both ends
(4 required)
Frequency Range: dc to 310 MHz
Length: 20 cm (9 in)
Connectors: BNC (m) both ends
BNC, 75 R, 30 cm (12 in)
291
cm (36 in)
GHz
Recommended
Model
HP 11500A
HP
10503A
HP 10502A
5062-6452
Use’
PAT
P,A,T
Cable2
Cable, Test
1 P = Performance Test, A = Adjustment, T = Troubleshooting
2 Option 001 and Option 011 Only
BNC, 75 Q, 120 cm (48 in)
Length:
Connectors: SMB
(2
291
reauired
cm (36 in)
(f)
to BNC (m)
1
15525-80010
85680-60093
P,A,T
A,T
l-8
Calibrating
HP 8590D Spectrum Analyzer
Page 21
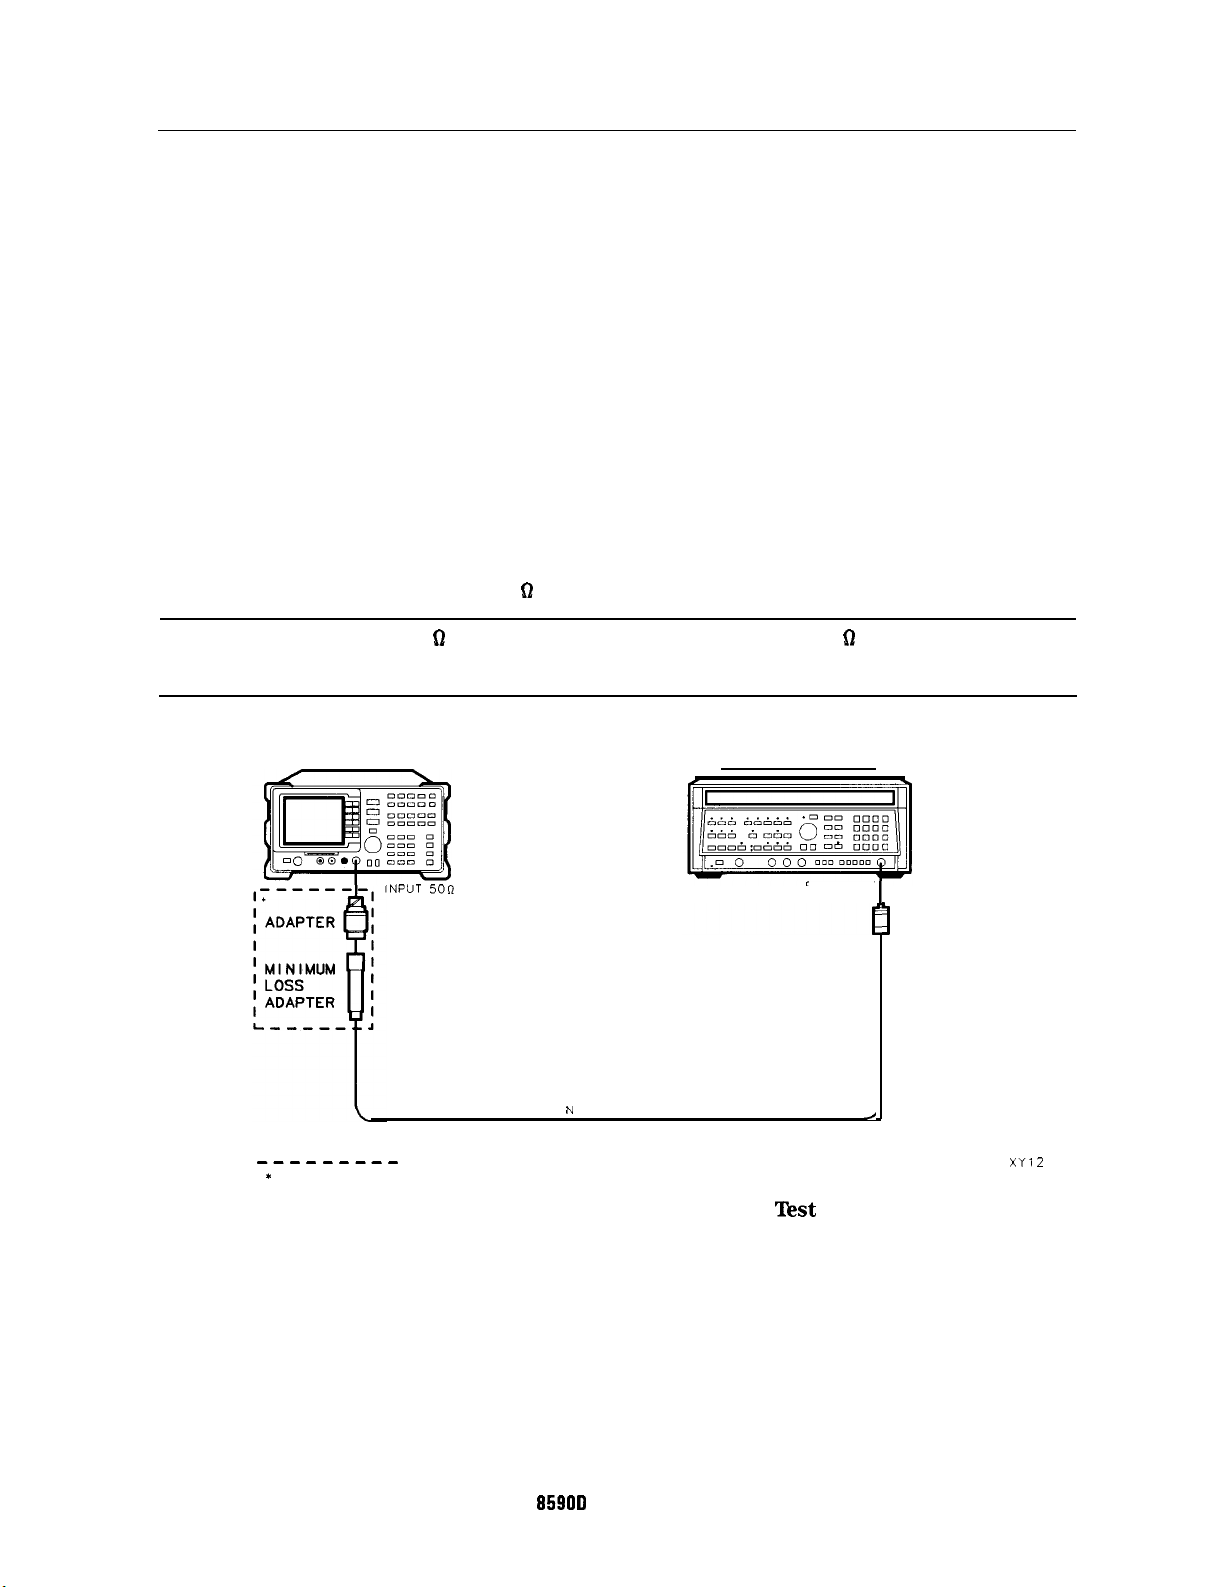
1. Frequency Readout Accuracy
1. Frequency Readout Accuracy
The frequency readout accuracy of the spectrum analyzer is tested with an input signal of
known frequency.
,
There are no related adjustment procedures for this performance test.
If the spectrum analyzer is equipped with Option 013, Counterlock, perform the performance
test “Frequency Readout and Marker Count Accuracy for Option 013” instead.
Equipment Required
Synthesized sweeper
Adapter, Type N (f) to APC 3.5 (f)
Cable, Type N, 183 cm (72 in)
Additional Equipment for Option 001
Adapter, minimum loss
Adapter, Type N (f) to BNC (m), 75
D
Caution
SPECTRUM ANALYZER
---------
I I OPTION 001 ONLY’
---------I
Use only 75 0 cables, connectors, or adapters on the 75 D input of an Option
001 or damage to the input connector will occur.
SYNTHESIZED SWEEPER
NPUT 50R
TYPE N CABLE ASSEMBLY
Figure l-l. Frequency Readout Accuracy Test Setup
RF OUTPUT
/
ADAPTER
1
XY12
HP
95900
Spectrum Analyzer
Calibrating l-9
Page 22
1. Frequency Readout Accuracy
Procedure
1. Connect the equipment as shown in Figure l-l.
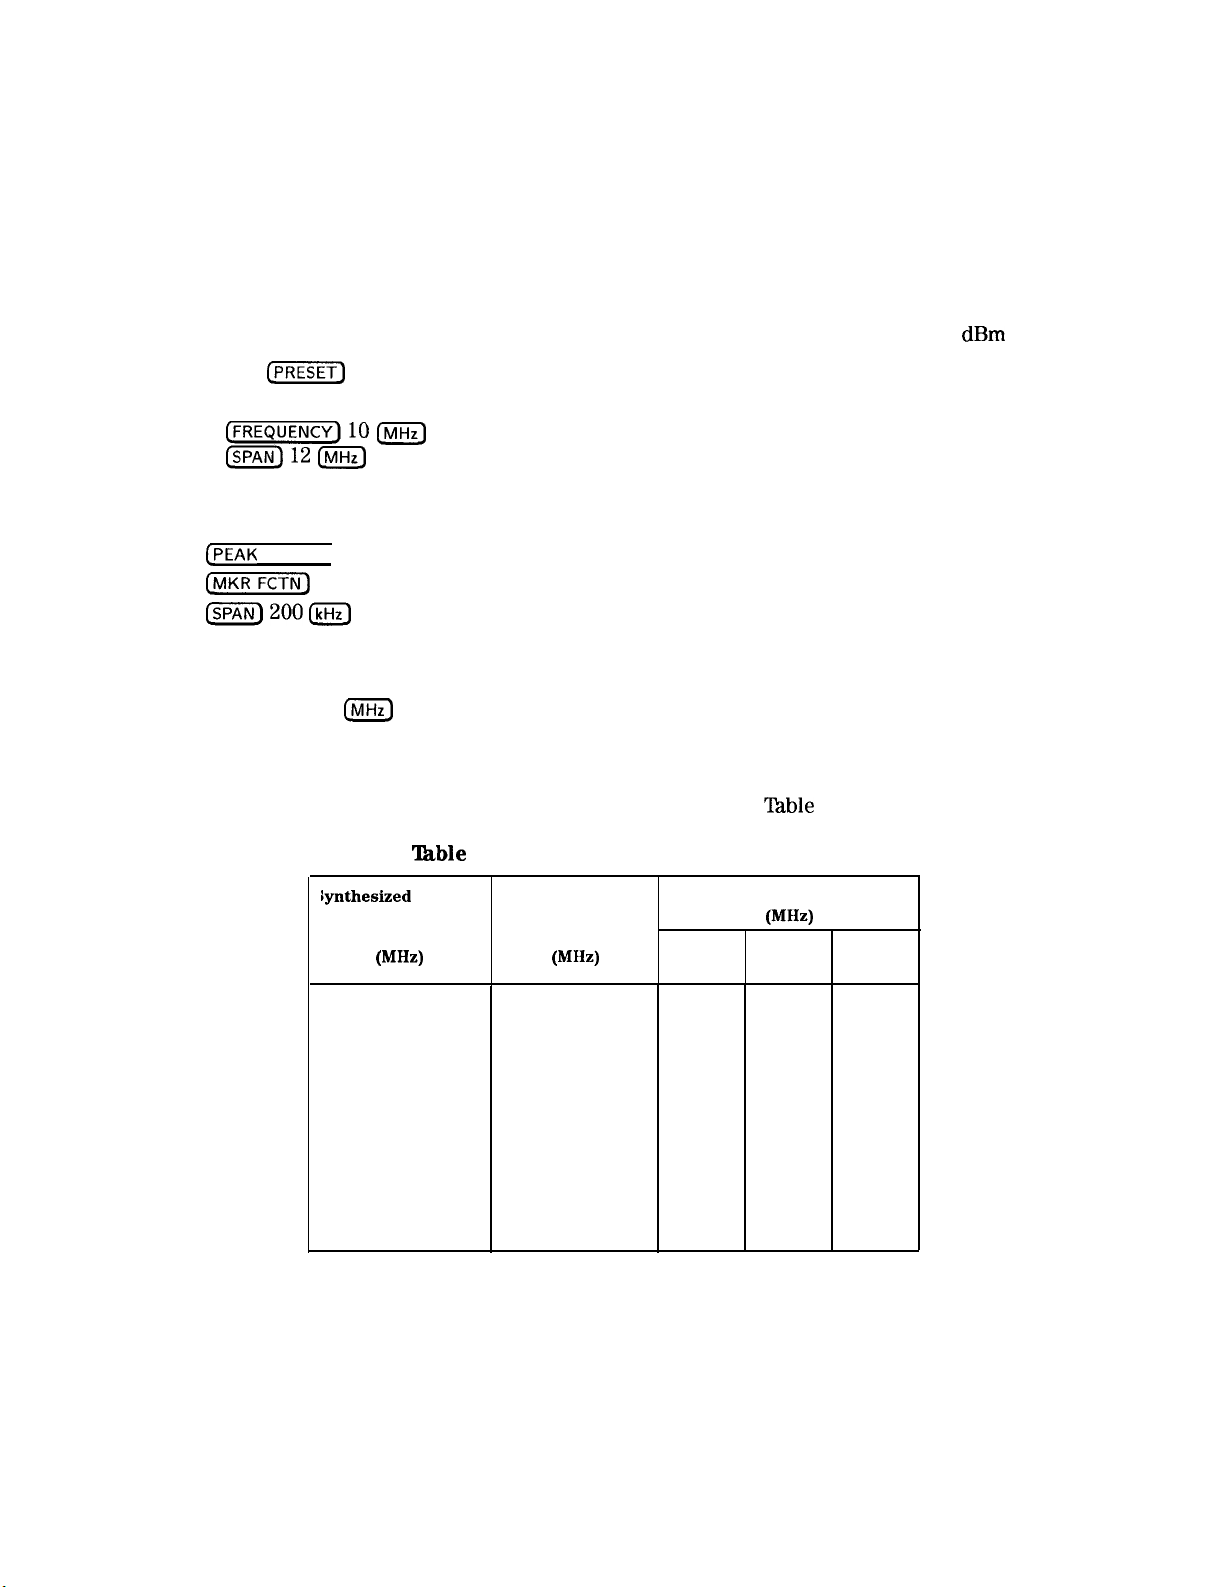
2. Perform the following steps to set up the equipment:
n
Press INSTRUMENT PRESET on the synthesized sweeper, then set the controls as follows:
CW . . . . . . . . . . . . . . . . . . . . . . . . . . . . . . . . . . . . . . . . . . . . . . . . . . . . . . . . . . . . . . . . . 10 MHz
POWER LEVEL
. . . . . . . . . . . . . . . . . . . . . . . . . . . . . . . . . . . . . . . . . . . . . . . . . . . -10
dBm
n Press
(j-1
on the spectrum analyzer, then wait for the preset routine to finish. Set the
spectrum analyzer by pressing the following keys:
FREQUENCY] 10
m
h12m
3. Set the spectrum analyzer to measure the frequency readout accuracy by pressing the
following spectrum analyzer keys:
[PEAK
SEARCH)
(MKR’
MK TRACK ON OFF (ON)
IsPAN)
4. Record the MKR frequency reading in the performance test record. The reading should be
within the limits shown in Table 1-5.
5. Press (SPAN) 12
IrVIHz)
on the spectrum analyzer.
6. Change to the next synthesized sweeper CW and spectrum analyzer center frequencies listed
in Table 1-5.
7. Repeat steps 4 through 6 for each frequency setting listed in
‘able
1-5. Frequency Readout Accuracy
iynthesized
Sweeper Spectrum Analyzer
cw
Frequency
(MHz) (MHz)
Frequency
Center
Min
‘lhble
1-5.
MKR Reading
(MHz)
TR Entry
(Actual)
Max
10
50
100
500
1000
1800
l-l 0 Calibrating
10
50
100
500
1000
1800
HP 8580D Spectrum Analyzer
4.9980
44.9980
94.9980
494.9980
994.9980
1794.9980
l-l 15.0020
l-2
l-3 105.0020
l-4
l-5 1005.0020
1-6
55.0020
505.0020
1805.0020
Page 23
2. Frequency Readout and Marker Count Accuracy for Option 013
2. Frequency Readout and Marker Count Accuracy for
Option 013
This procedure is only for spectrum analyzers equipped with Option 013.
The frequency readout accuracy of the spectrum analyzer is tested with an input signal of
known frequency. By using the same frequency standard for the spectrum analyzer and the
synthesized sweeper, the frequency reference error is eliminated.
The related adjustment for this performance test is the “Sampler Match Adjustment.”
If the spectrum analyzer is
not
equipped with Option 013, Counterlock, perform the
performance test “Frequency Readout Accuracy” instead.
Equipment Required
Synthesized sweeper
Adapter, Type N (f) to APC 3.5 (m)
Adapter, APC 3.5 (f) to APC 3.5 (f)
Cable, Type N, 183 cm (72 in)
Cable, BNC, 122 cm (48 in)
Additional Equipment for Option 001
Adapter, minimum loss
Adapter, Type N (f) to BNC (m), 75
Caution
Use only 75 D cables, connectors, or adapters on the 75 62 input of an Option
001 or damage to the input connector will occur.
fl
O”TP”l
L----
--------I* OPTION
---------I
001
ONLY
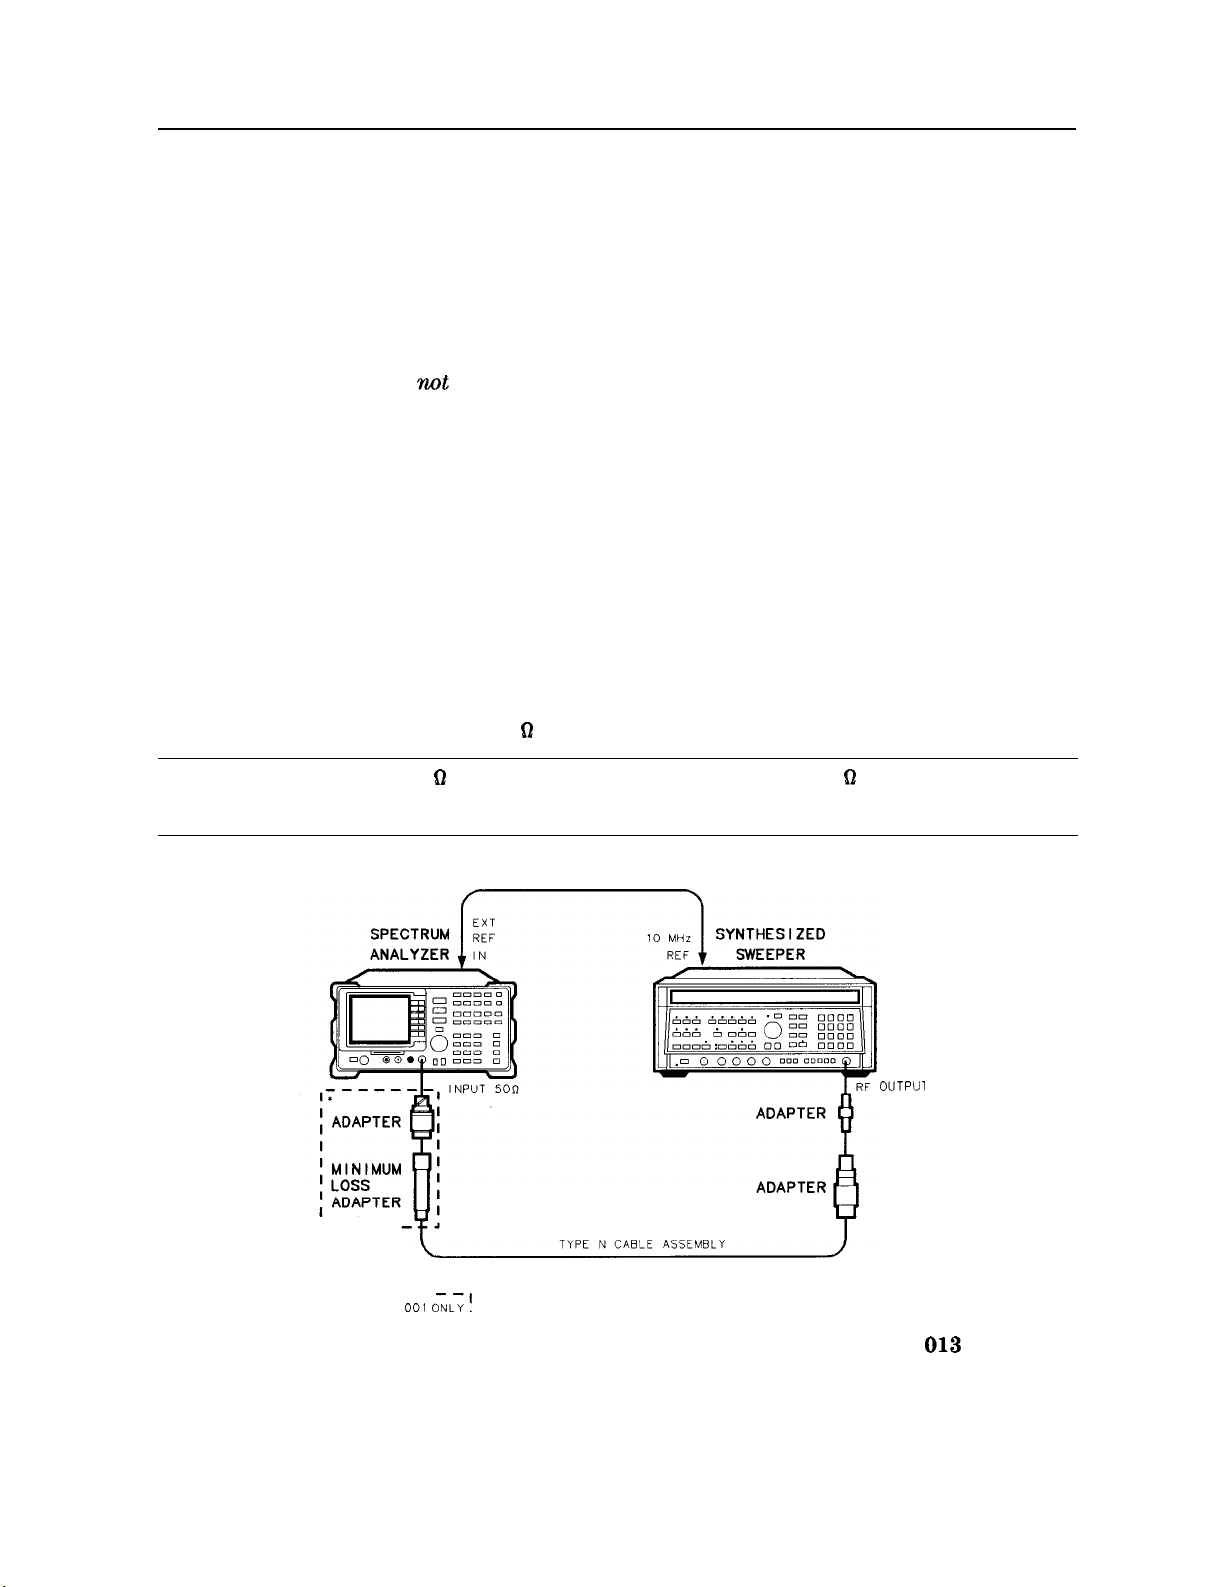
Figure 1-2. Frequency Readout Accuracy Test Setup for Option 013
HP 8580D Spectrum Analyzer
Calibrating l-l 1
XC62
Page 24
2. Frequency Readout and Marker Count Accuracy for Option 013
Procedure
This performance test consists of two parts:
Part 1: Frequency Readout Accuracy
Part 2: Marker Count Accuracy
Perform “Part 1: Frequency Readout Accuracy” before “Part 2: Marker Count Accuracy.”
Part 1: Frequency Readout Accuracy
1. Connect the equipment as shown in Figure l-2. Remember to connect the 10 MHz REF OUT
of the synthesized sweeper to the EXT REF IN of the spectrum analyzer.
2. Perform the following steps to set up the equipment:
n
Press INSTRUMENT PRESET on the synthesized sweeper, then set the controls as follows:
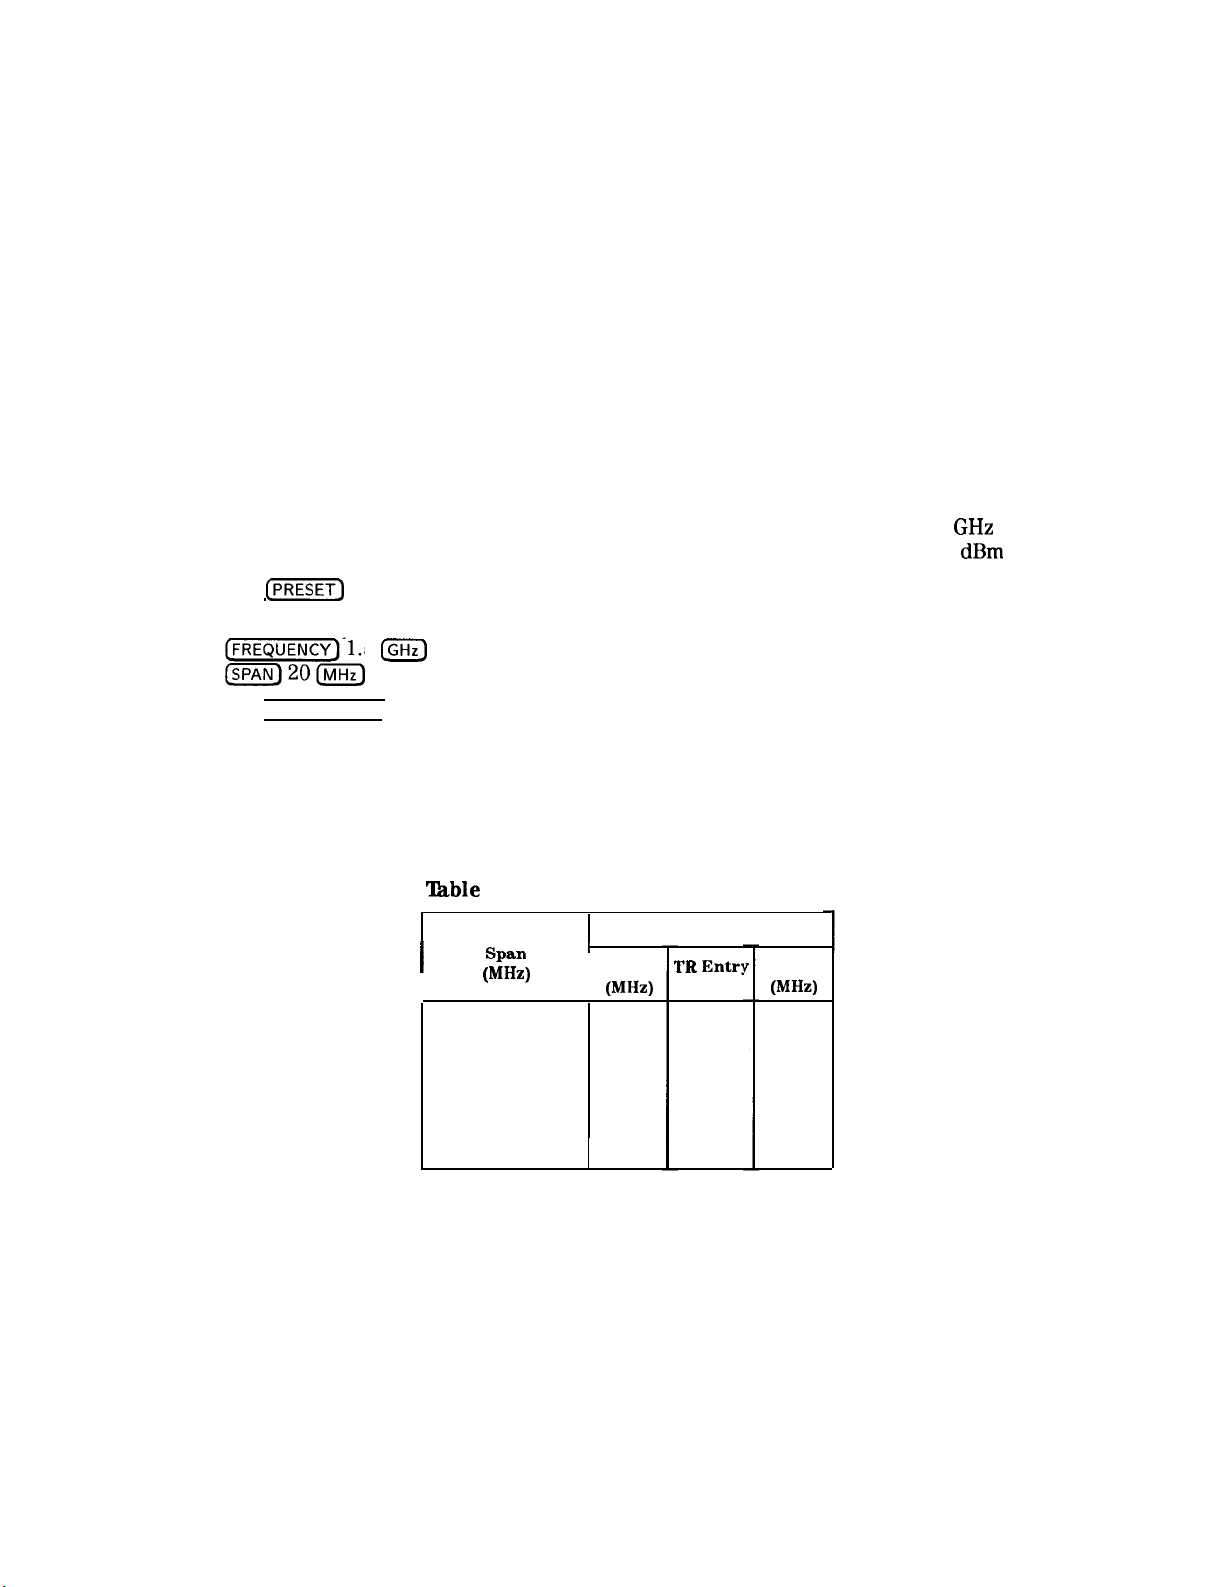
1.5
CW . . . . . . . . . . . . . . . . . . . . . . . . . . . . . . . . . . . . . . . . . . . . . . . . . . . . . . . . . . . . . . . .
POWER LEVEL
. . . . . . . . . . . . . . . . . . . . . . . . . . . . . . . . . . . . . . . . . . . . . . . . . . . -10
GHz
dBm
n Press
c-1
on the spectrum analyzer, then wait for the preset routine to finish. Set the
spectrum analyzer by pressing the following keys:
FREQUENCY_) 1..5
h2om
n Press (PEAK SEARCH) on the spectrum analyzer to measure the frequency readout accuracy.
n Record the MKR frequency reading in the performance test record. The reading should be
IGHz)
.
within the limits shown in Table l-6.
n Change to the next spectrum analyzer span setting listed in Table l-5.
n Repeat steps 3 through 5 for each spectrum analyzer span setting listed in Table l-5.
‘Ihble
l-6. Frequency Readout Accuracy
Min.
(MHz)
1.49958
MKR Reading
k’R Entr!
(Actual)
2-l
2-2
2-3
Max.
(MHz)
1.50082
1.50042
1.500032
Spectrum Analyzer
cz...-.-
I
I
“p&X,
(MHz)
20 1.49918
10
1
I
I
1.499968
l-l2 Calibrating
HP 859OD Spectrum Analyzer
Page 25
2. Frequency Readout and Marker Count Accuracy for Option 013
Part 2: Marker Count Accuracy
Perform “Part 1: Frequency Readout Accuracy” before performing this procedure.
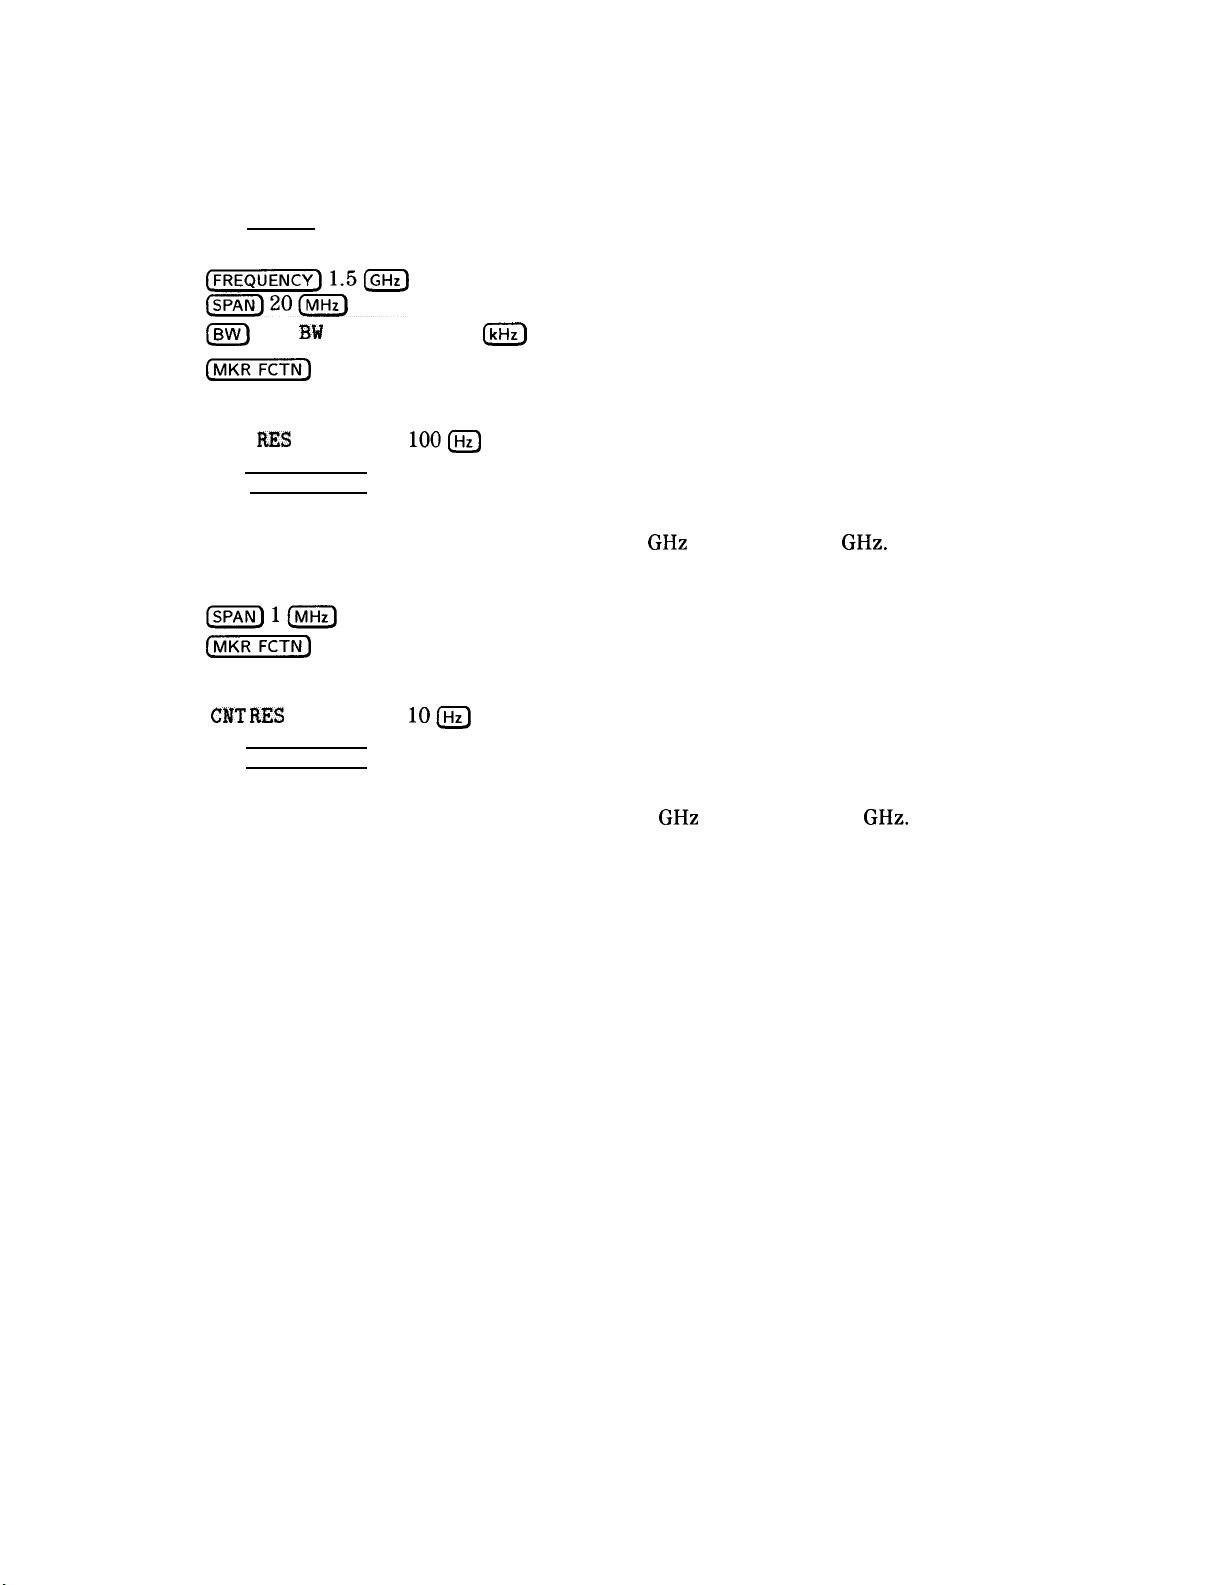
1. Press (PRESET) on the spectrum analyzer, then wait for the preset routine to finish. Set the
spectrum analyzer to measure the marker count accuracy by pressing the following keys:
~pzT-)&~
SPAN
(EiJ
MHz
RES 3W AUTO MAN 300
m
(jNlKRj
More 1 of 2
CNT
MK COUNT ON OFF (ON)
RES
AUTO MAN
lOO@
2. Press [PEAK SEARCH), then wait for a count be taken (it may take several seconds).
3. Record the CNTR frequency reading as TR Entry 2-5 of the performance test record. The
reading should be within the limits of 1.4999989
GHz
and 1.5000011
GHz.
4. Change the spectrum analyzer settings by pressing the following keys:
Wl(MHz)
(jMKRFCTN_)
MK COUNT ON OFF (ON)
More 1 of 2
CPJT RES
AUTO MAN
1OIHz)
5. Press (PEAK SEARCH), then wait for a count be taken (it may take several seconds).
6. Record the CNTR frequency reading as TR Entry 2-6 of the performance test record. The
reading should be within the limits of 1.49999989
GHz
and 1.50000011
GHz.
HP 8590D Spectrum Analyzer
Calibrating 1-13
Page 26
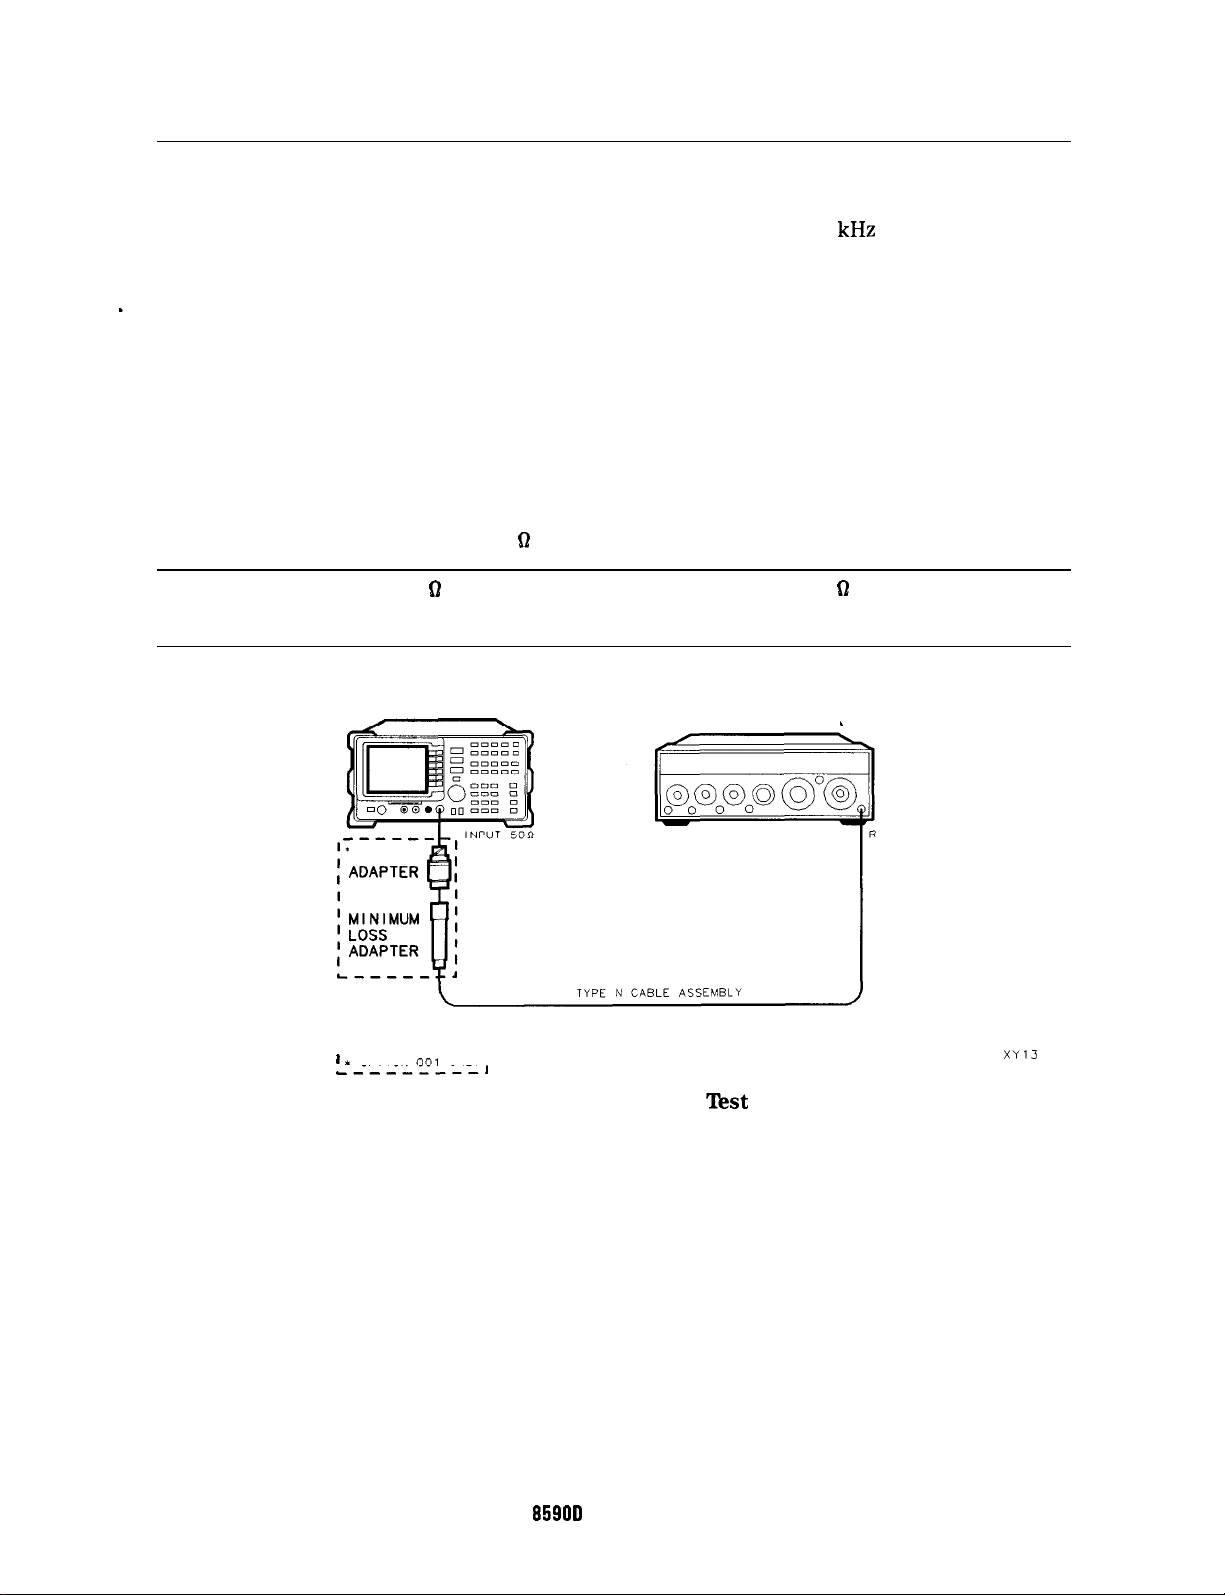
3. Noise Sidebands
A 500 MHz CW signal is applied to the input of the spectrum analyzer. The marker functions
are used to measure the amplitude of the carrier and the noise level 30
the carrier. The difference between these two measurements is compared to specification.
There are no related adjustment procedures for this performance test.
Equipment Required
Signal generator
Cable, Type N, 183 cm (72 in)
Additional Equipment for Option 001
Adapter, minimum loss
Adapter, Type N (f) to BNC (m), 75
D
kHz
above and below
Caution
Use only 75 f? cables, connectors, or adapters on the 75 D input of an Option
001 or damage to the input connector will occur.
SPECTRUM ANALYZER
--m---e--
1 I
OPTION
,--------I
001
ONLY
Figure l-3. Noise Sidebands Test Setup
l
SIGNAL GENERATOR
F OUTPUT
XY13
1-14 Calibrating
HP
8590D
Spectrum Analyzer
Page 27
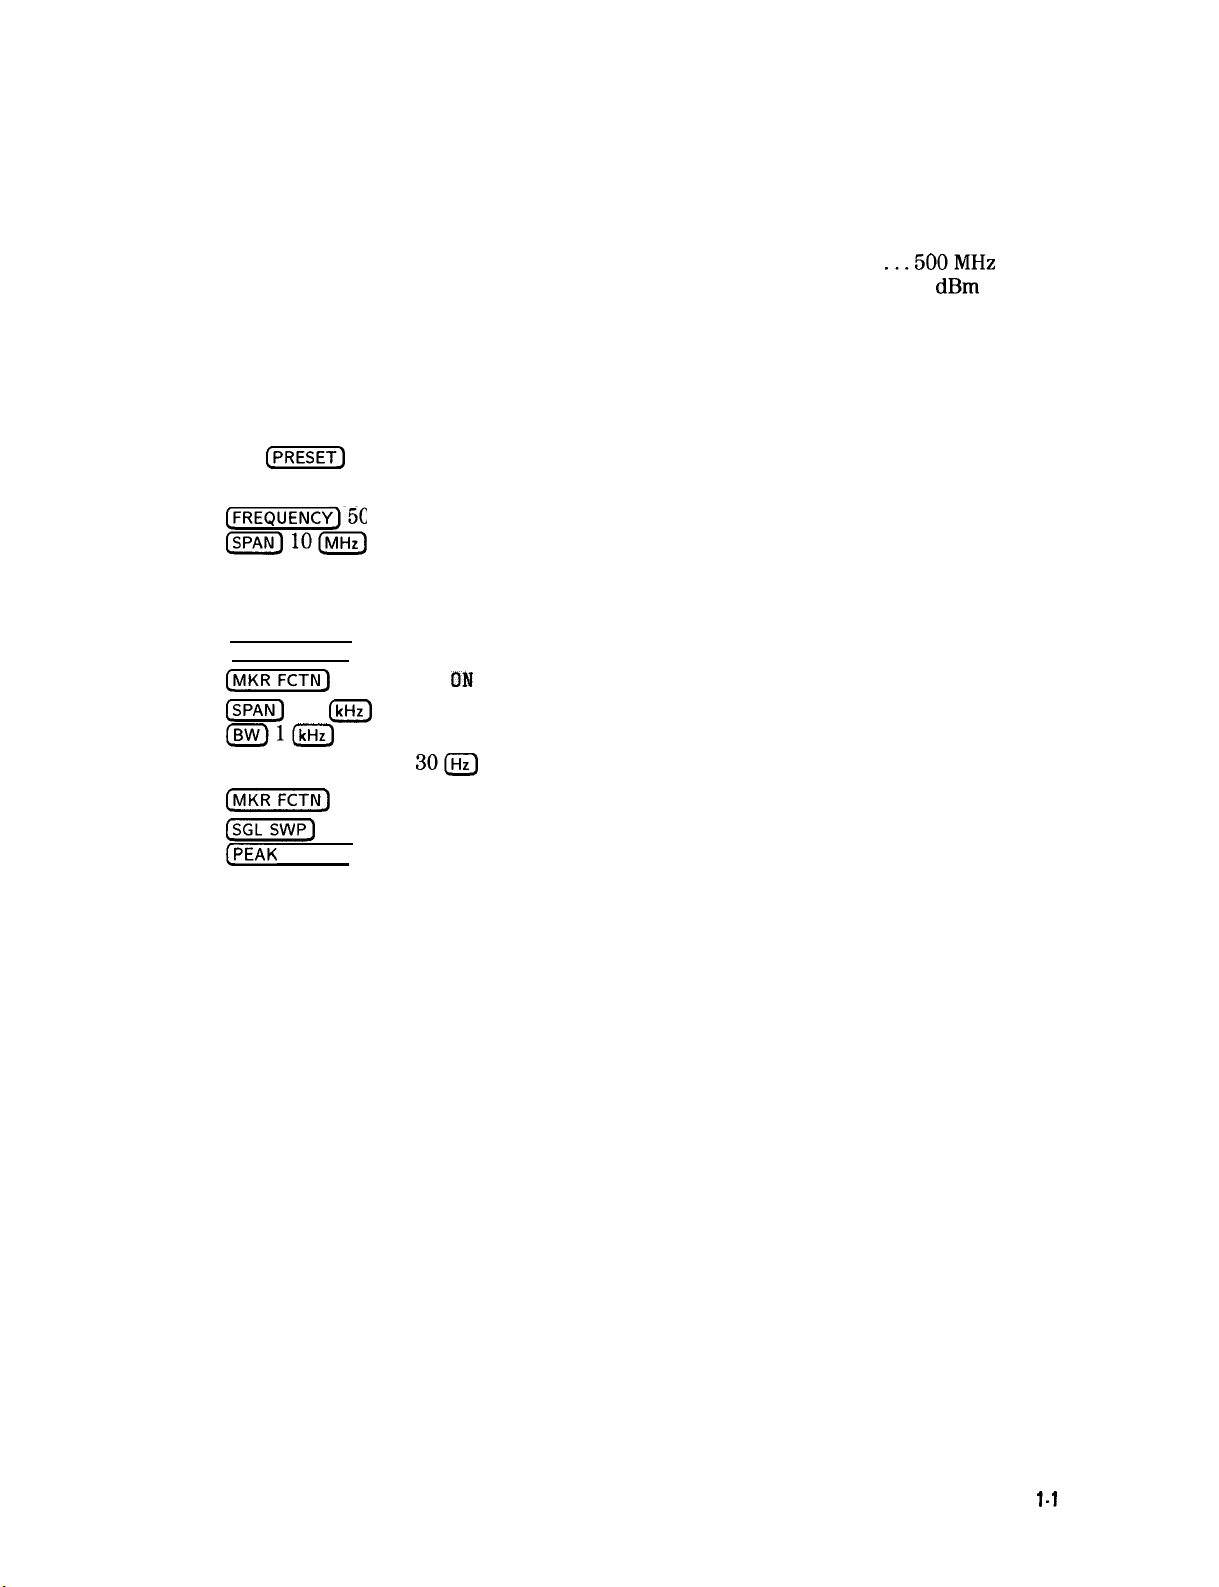
Procedure
1. Perform the following steps to set up the equipment:
n
Set the signal generator controls as follows:
3. Noise Sidebands
FREQUENCY
. . . . . . . . . . . . . . . . . . . . . . . . . . . . . . . . . . . . . . . . . . . . . . . . . . .
..-5OOMHz
OUTPUT LEVEL . . . . . . . . . . . . . . . . . . . . . . . . . . . . . . . . . . . . . . . . . . . . . . . . . . . . . . 0
AM . . . . . . . . . . . . . . . . . . . . . . . . . . . . . . . . . . . . . . . . . . . . . . . . . . . . . . . . . . . . . . . . . . ..OFF
. . . . . . . . . . . . . . . . . . . . . . . . . . . . . . . . . . . . . . . . . . . . . . . . . . . . . . . . . . . . . . . . . . . . OFF
FM
COUNTER
. . . . . . . . . . . . . . . . . . . . . . . . . . . . . . . . . . . . . . . . . . . . . . . . . . . . . . . . . . . . . . . . . . . ..ON
RF
n
Connect the equipment as shown in Figure 1-3.
n Press
(‘j-1
. . . . . . . . . . . . . . . . . . . . . . . . . . . . . . . . . . . . . . . . . . . . . . . . . . . . . . . . . . . . . INT
on the spectrum analyzer, then wait for the preset routine to finish. Set the
spectrum analyzer by pressing the following keys:
FREQUENCY] 500 (MHz)
b10m
2. Calculate the Noise Sideband Suppression by performing the following steps:
n Press the following spectrum analyzer keys:
[PEAK SEARCH)
C-1
m
200
MK
TRACK OM OFF (ON)
IkHz)
Isw)l(kHz)
VID BW AUTO MAN
(MKRFCTN)
(SEEiF)
[PEAK
MK TRACK ON OFF (OFF)
SEARCH]
300
dBm
Record the MKR amplitude reading in the Noise Sideband Worksheet as the Carrier
Amplitude.
HP 8590D Spectrum Analyzer
Calibrating
1-15
Page 28
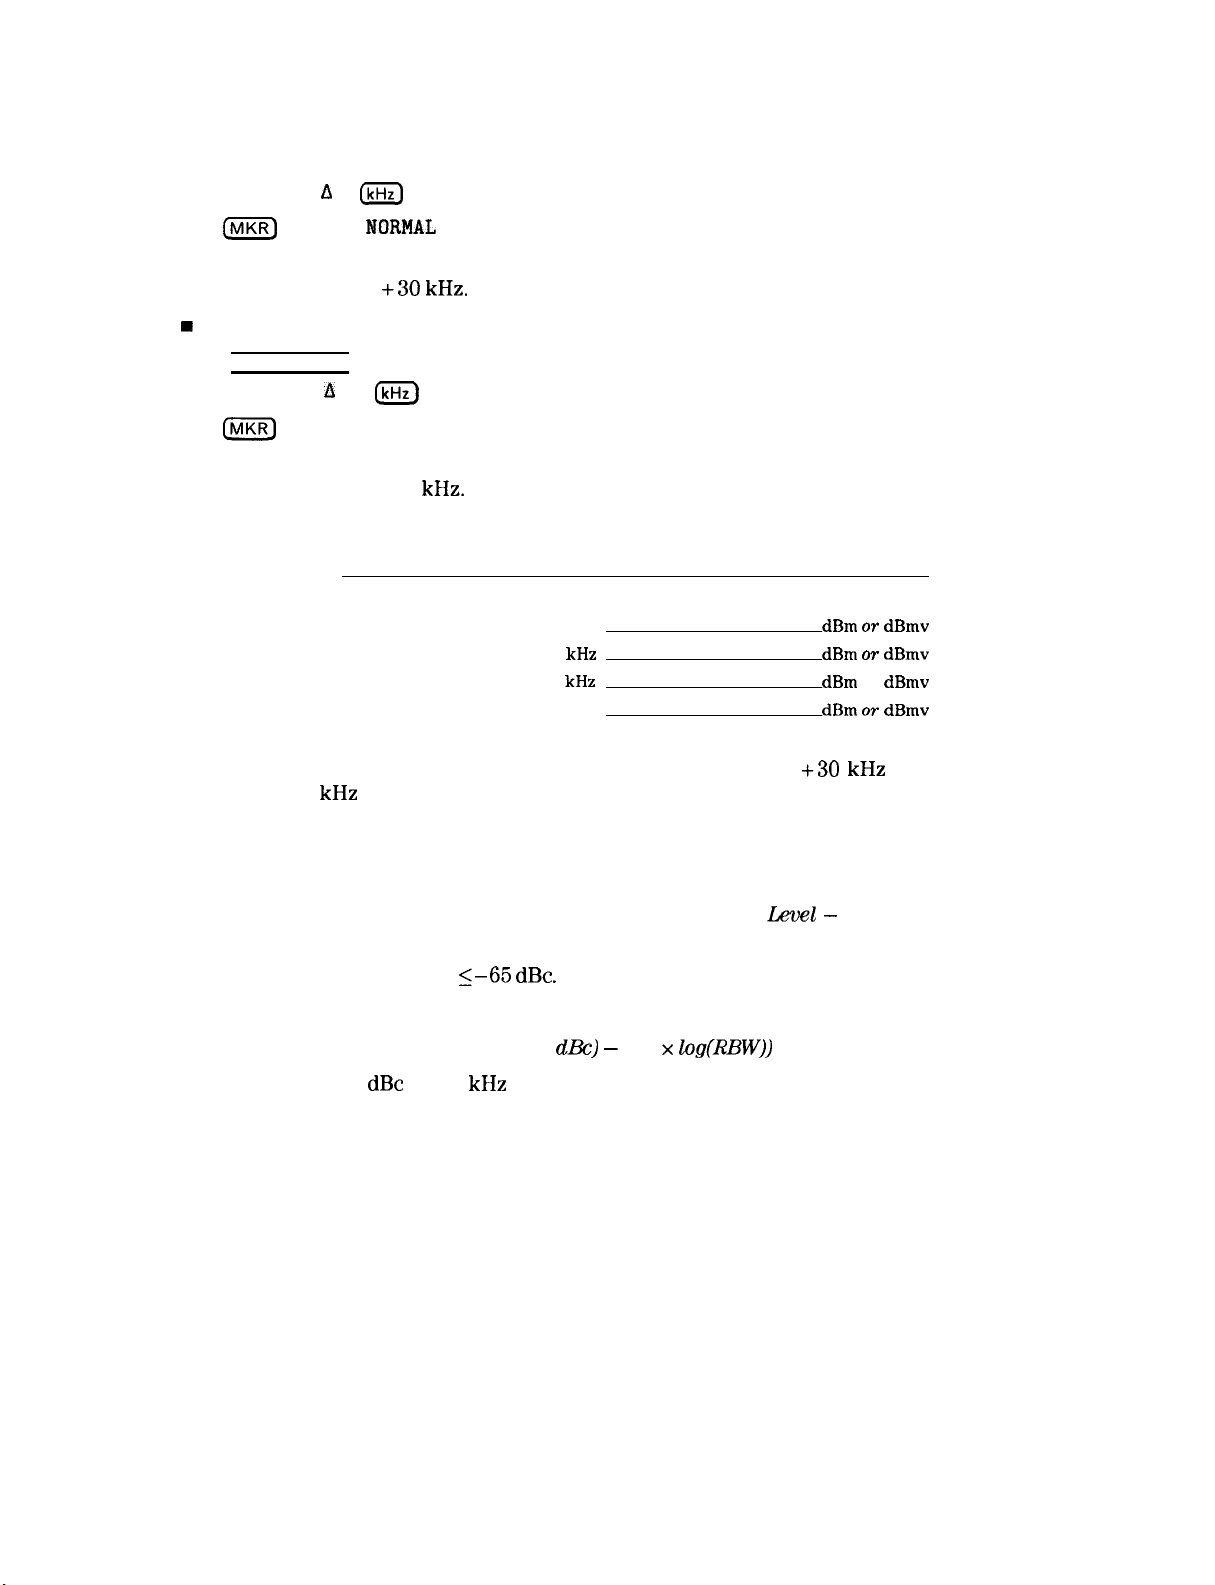
3. Noise Sidebands
n
Press the following spectrum analyzer keys:
MARKER A 30
[MKR)
MARKER
m
NORMAL
Record the MKR amplitude reading in the Noise Sideband Worksheet as the Noise
Sideband Level at
#
Press the following spectrum analyzer keys:
(PEAK SEARCH)
MARKER A -30
+30 kHz.
(kHz)
(MKR) MARKER NORMAL
Record the MKR amplitude reading in the Noise Sideband Worksheet as the Noise
Sideband Level at -30
Carrier Amplitude
Noise Sideband Level at + 30
Noise Sideband Level at -30
Maximum Sideband Level
n
Record the more positive value, either Noise Sideband Level at +30
Level at -30
kHz
from above in the Noise Sideband Worksheet as the Maximum Noise
kHz.
Noise Sideband Worksheet
Description
Measurement
dBm OT
kHz dBm OT
kHz
dBm
or dBmv
dBm OT
kHz
dBmv
dBmv
dBmv
or Noise Sideband
Sideband Level.
n
Subtract the Carrier Amplitude from the Maximum Noise Sideband Level using the
equation below.
Noise Sideband Suppression = Maximum Noise Sideband
n Record the Noise Sideband Suppression in the performance test record as TR Entry 3-l.
The suppression should be
L-65 dBc.
Level -
Carrier Amplitude
The resolution bandwidth is normalized to 1 Hz as follows:
1 Hz noise-power = (noise-power in
For example, -65
dBc
in a 1
kHz
dBc) -
(10 x
log(RBW))
resolution bandwidth is normalized to -95 dBc/Hz.
l-l 6 Calibrating HP 85908 Spectrum Analyzer
Page 29
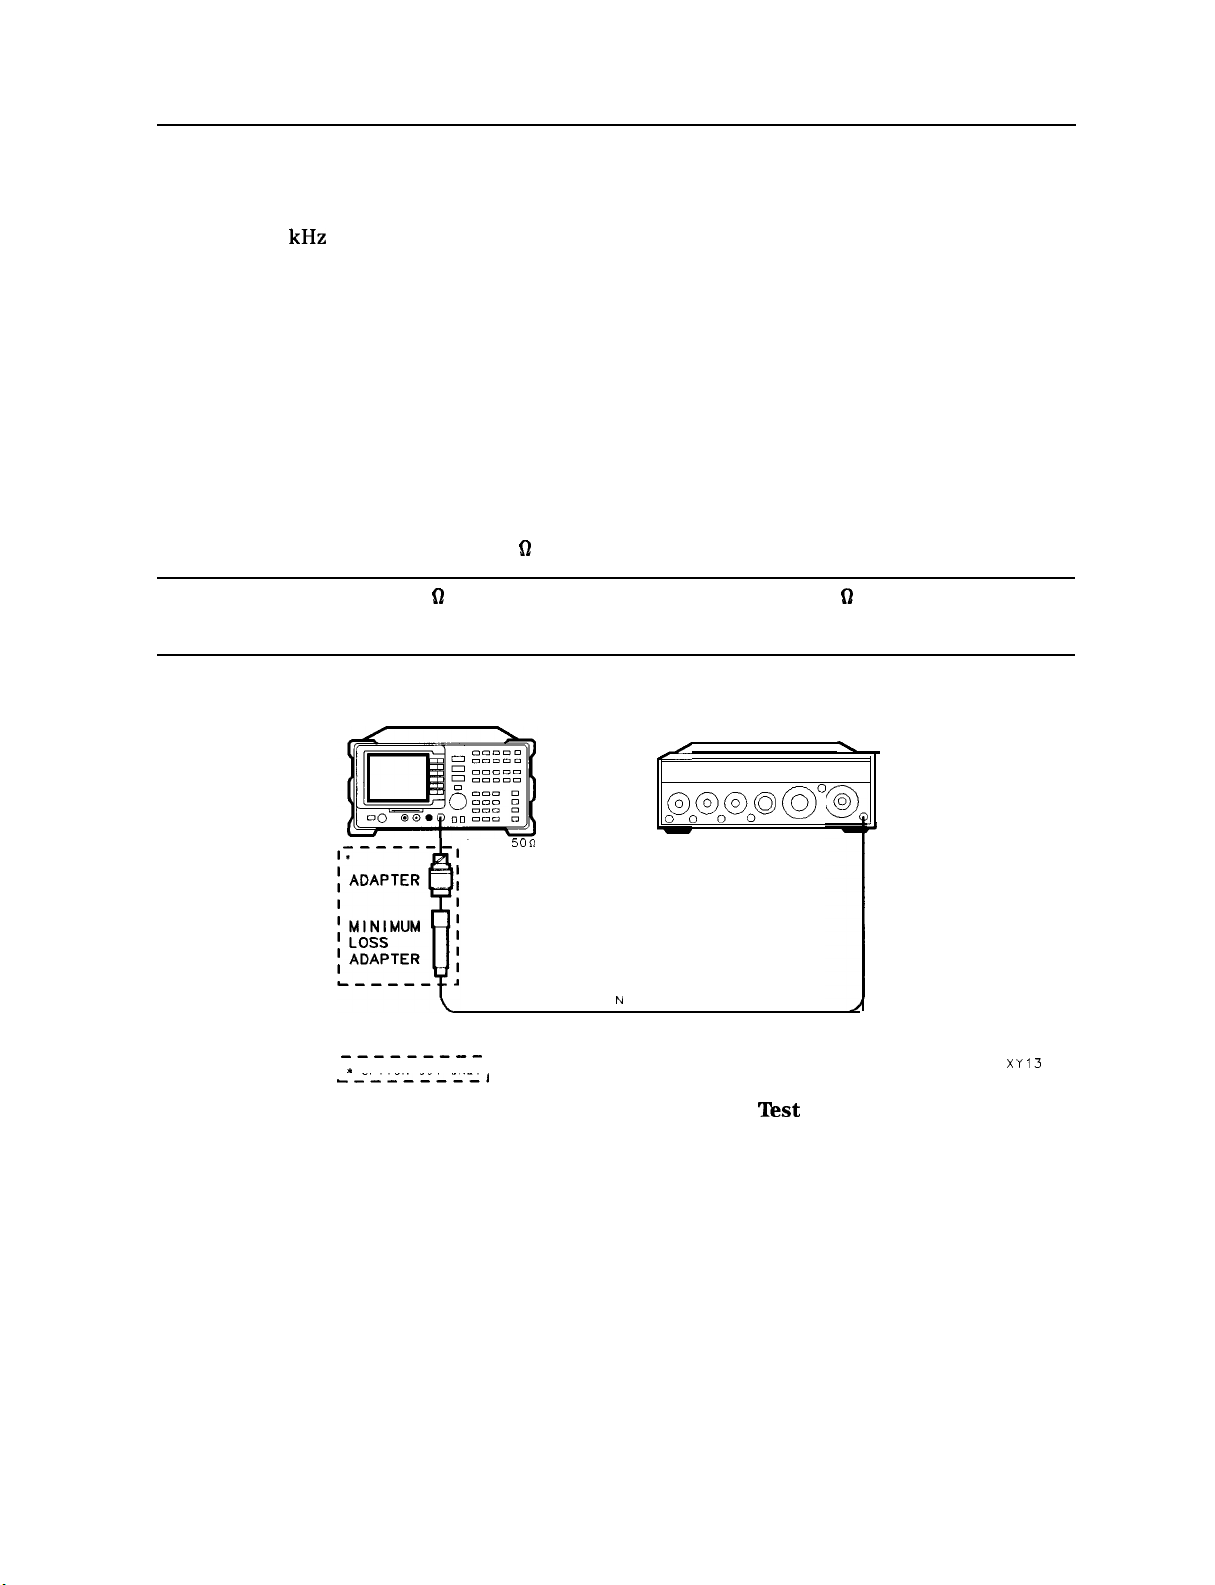
4. System Related Sidebands
4. System Related Sidebands
A 500 MHz CW signal is applied to the input of the spectrum analyzer. The marker functions
are used to measure the amplitude of the carrier and the amplitude of any system related
sidebands 30
generated line related, power supply related or local oscillator related sidebands.
There are no related adjustment procedures for this performance test.
Equipment Required
Signal generator
Cable, Type N, 183 cm (72 in)
Additional Equipment for Option 001
Adapter, minimum loss
Adapter, Type N (f) to BNC (m), 75
kHz
above and below the carrier, System related sidebands are any internally
fI
Caution
Use only 75 D cables, connectors, or adapters on the 75 fI input of an Option
001 or damage to the input connector will occur.
SPECTRUM ANALYZER
INPUT
5on
TYPE N CABLE ASSEMBLY
------e-e
I
*
OPTION 001 ONLY’
,--------I
Figure 1-4. System Related Sidebands Test Setup
SIGNAL GENERATOR
,’
~o@o@oo
-
\
Q0
;I
RF OUTPUT
XY13
HP 8590D Spectrum Analyzer
Calibrating l-17
Page 30
4. System Related Sidebands
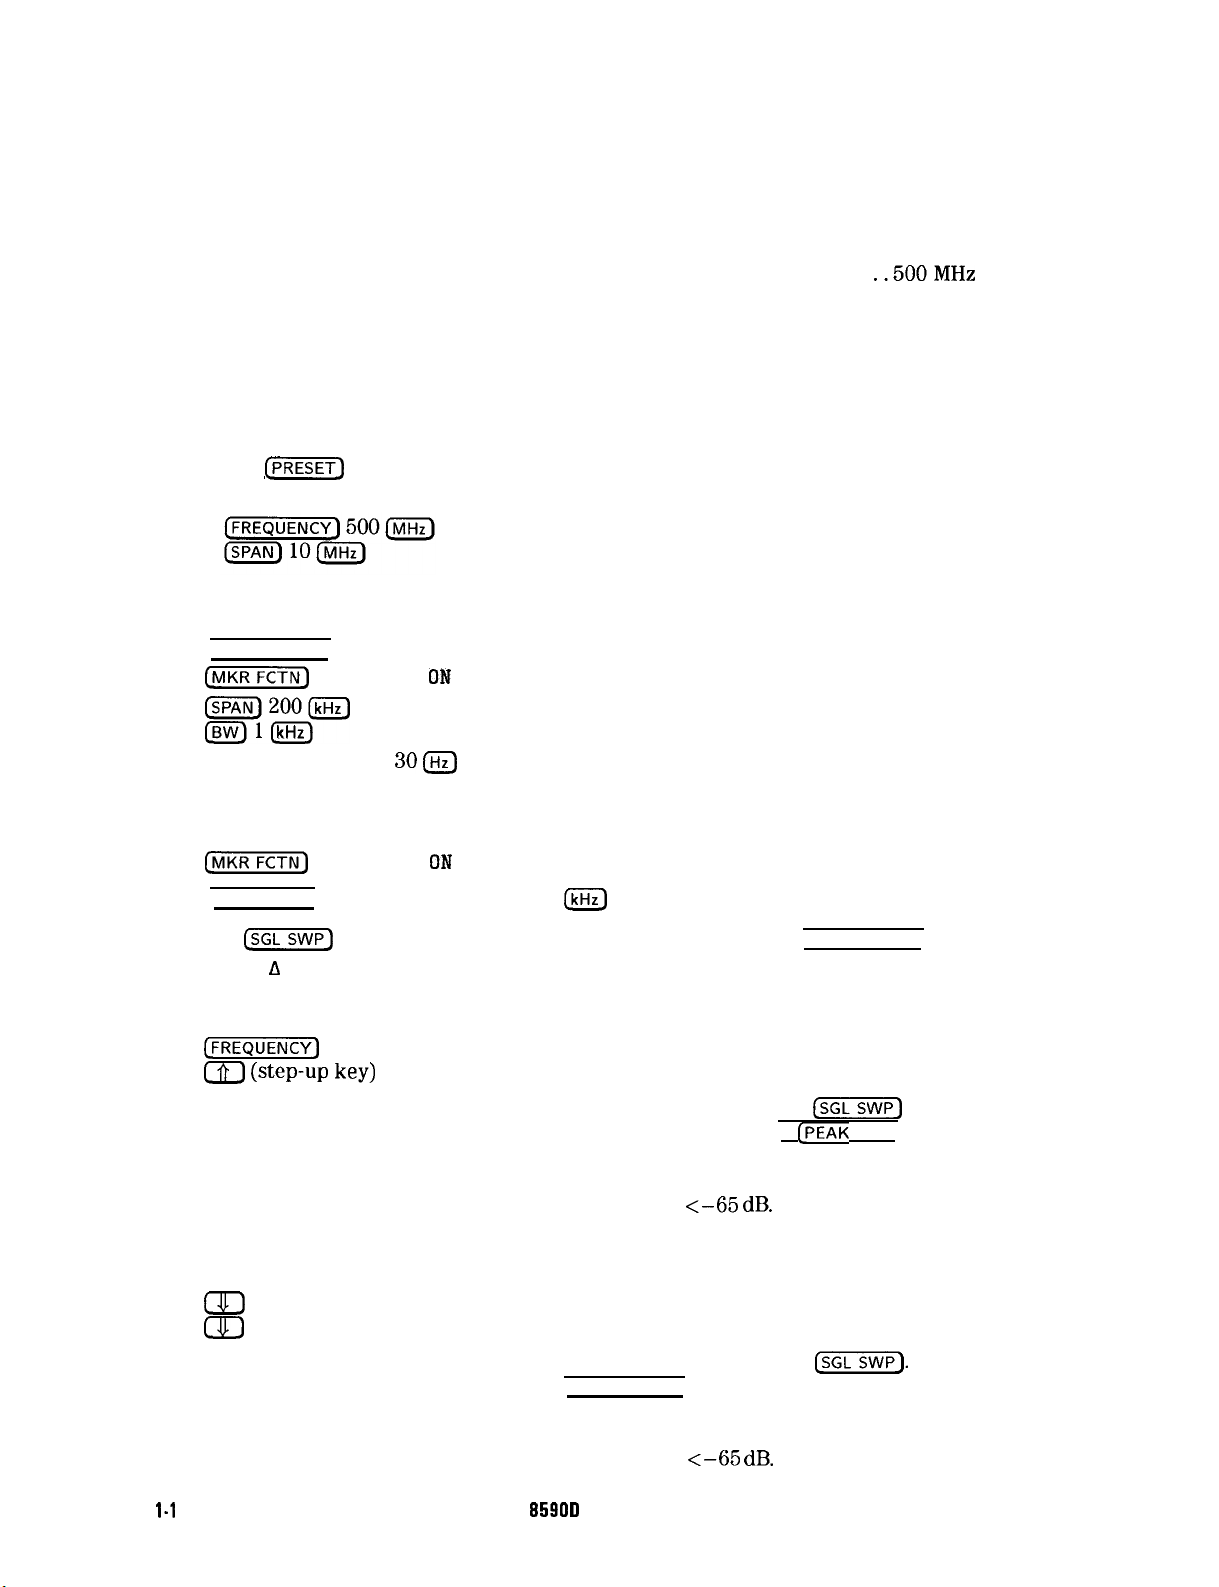
Procedure
1. Perform the following steps to set up the equipment:
n
Set the signal generator controls as follows:
FREQUENCY
. . . . . . . . . . . . . . . . . . . . . . . . . . . . . . . . . . . . . . . . . . . . . . . . . . . .
OUTPUTLEVEL
. . . . . . . . . . . . . . . . . . . . . . . . . . . . . . . . . . . . . . . . . . . . . . . . . . . ..0 dBm
..500MHz
AM . . . . . . . . . . . . . . . . . . . . . . . . . . . . . . . . . . . . . . . . . . . . . . . . . . . . . . . . . . . . . . . . . . ..OFF
. . . . . . . . . . . . . . . . . . . . . . . . . . . . . . . . . . . . . . . . . . . . . . . . . . . . . . . . . . . . . . . . . . ..OFF
FM
COUNTER
. . . . . . . . . . . . . . . . . . . . . . . . . . . . . . . . . . . . . . . . . . . . . . . . . . . . . . . . . . . . . . . . . . . ..ON
RF
n
Connect the equipment as shown in Figure l-4.
n Press
(m)
. . . . . . . . . . . . . . . . . . . . . . . . . . . . . . . . . . . . . . . . . . . . . . . . . . . . . . . . . . . . . INT
on the spectrum analyzer, then wait for the preset routine to finish. Set the
spectrum analyzer by pressing the following keys:
2.
Set the spectrum analyzer to measure the system related sideband above the signal by
performing the following steps:
(PEAK SEARCH)
(MKRFCTN)
MK TRACK OM OFF (ON)
pG-$2oo&m
BW
VID BW AUTO MAN
kHz
300
Allow the spectrum analyzer to stabilize for approximately 1 minute. Then press the
following keys:
CjFCTN)
[FREQUENCY) CF STEP AUTO NAM 130
3.
Press
CsGL)
MK TRACK OM OFF (OFF)
m
and wait for the completion of the sweep. Press (PEAK SEARCH], then
MARKER A .
4.
Press the following spectrum analyzer keys:
CFREQUENCY)
m (step-w key)
5.
Measure the system related sideband above the signal by pressing
(SGL]
on the spectrum
analyzer. Wait for the completion of a new sweep, then press (SPEAK SEARCH].
6.
Record the Marker A Amplitude in TR Entry 3-l of the performance test record.
The Marker A Amplitude above the signal should be
7.
Set the spectrum analyzer to measure the system related sideband below the signal by
c-65 dB.
pressing the following spectrum analyzer keys:
m
(step-down key)
(lJJ
(step-down key)
8.
Measure the system related sideband below the signal by pressing
C-J.
Wait for the
completion of a new sweep, then press [PEAK SEARCH].
Record the Marker A Amplitude in TR Entry 3-2 of the performance test record.
The Marker A Amplitude below the signal should be
859OD Spectrum Analyzer
l-1
8 Calibrating
HP
c-65 dB.
Page 31
5. Frequency Span Readout Accuracy
5. Frequency Span Readout Accuracy
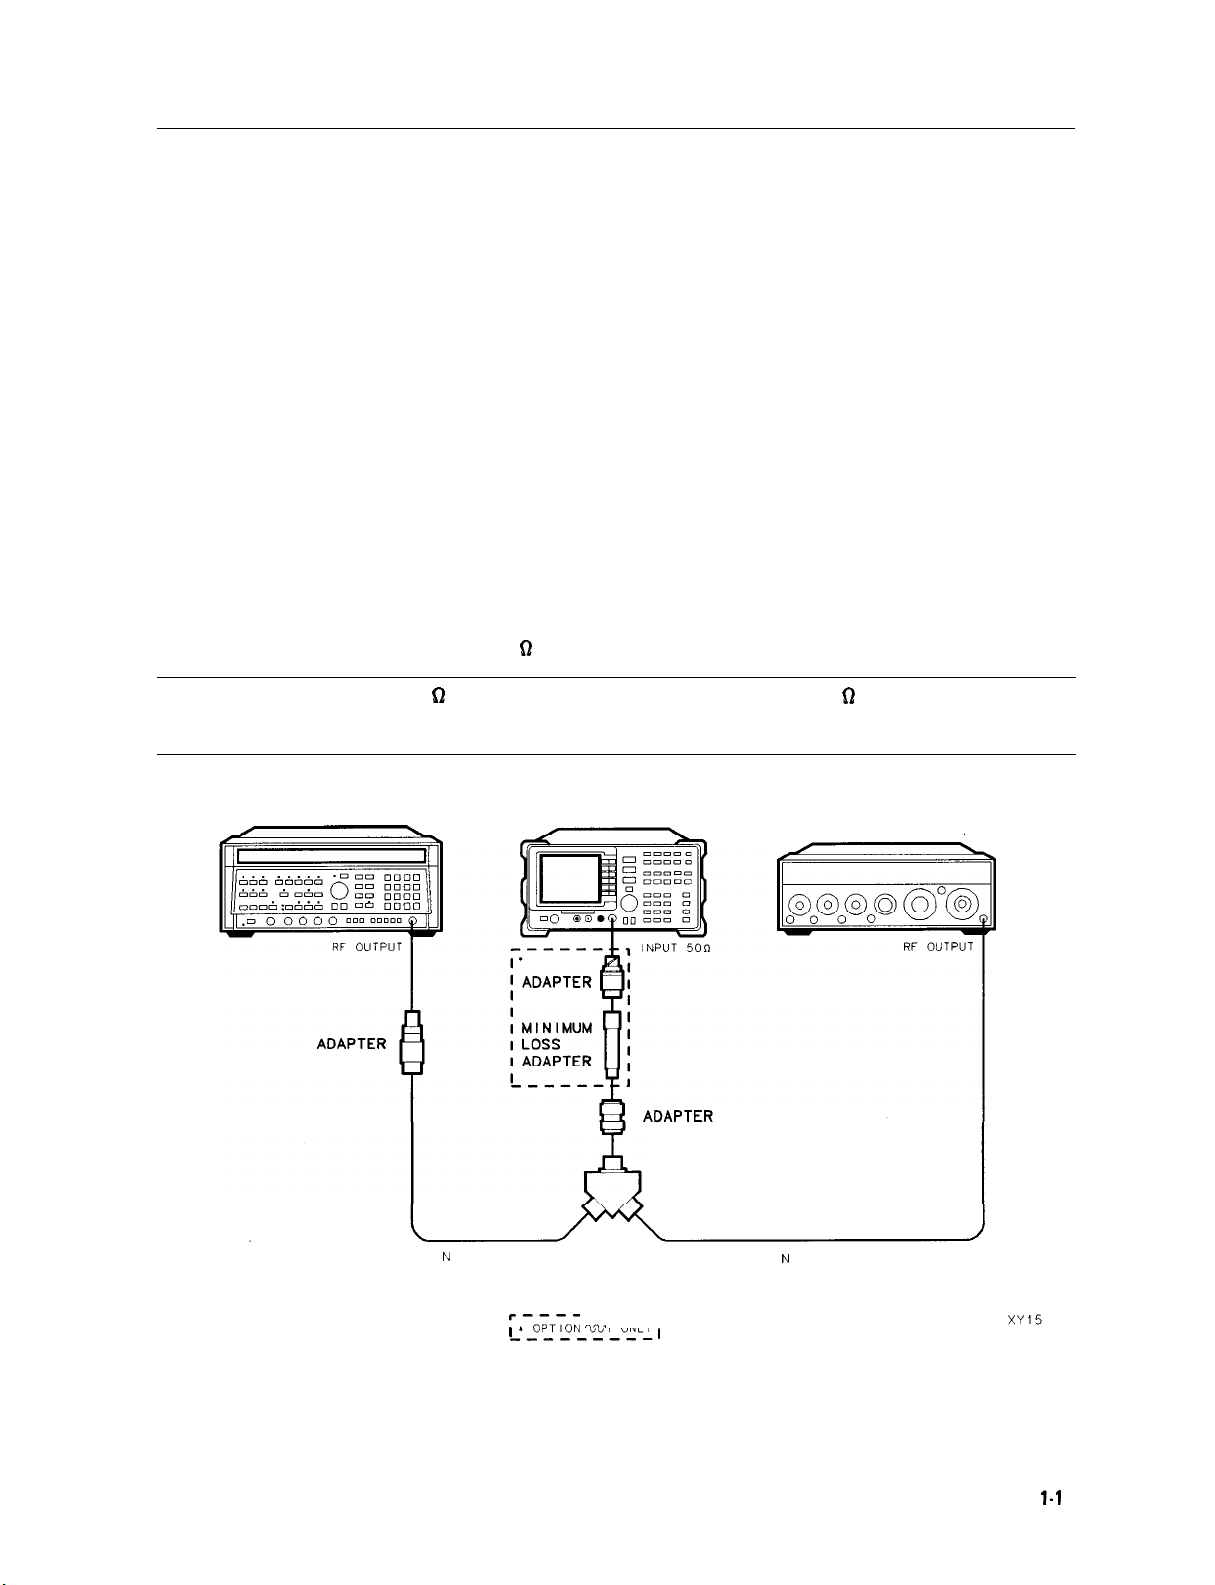
For testing each frequency span, two sources are used to provide two precisely-spaced signals.
The spectrum analyzer marker functions are used to measure this frequency difference and the
marker reading is compared to the specification.
There are no related adjustment procedures for this performance test.
Equipment Required
Synthesized sweeper
Signal generator
Power splitter
Adapter, Type N (m) to Type N (m)
Adapter, Type N (f) to APC 3.5 (m)
Cable, Type N, 183 cm (72 in)
Cable, Type N, 152 cm (60 in)
Additional Equipment for Option 001
Adapter, minimum loss
Adapter, Type N (f) to BNC (m), 75
D
Caution
SYNTHESIZED SWEEPER SPECTRUM ANALYZER
Use only 75 D cables, connectors, or adapters on the 75 Q input of an Option
001 or damage to the input connector will occur.
SIGNAL GENERATOR
POWER SPL I TTER
TYPE N CABLE ASSEMBLY
N
CABLE ASSEMBLY
TYPE
-------1
;.-OPTION 001
-,-------I
ONLY
Figure 1-5. Frequency Span Accuracy Test Setup
HP 8590D Spectrum Analyzer
Calibrating
l-1
9
Page 32
5. Frequency Span Readout Accuracy
Procedure
This performance test consists of two parts:
Part 1: Span 1800 MHz
Part 2: Spans
~500
MHz
Perform “Part 1: Span 1800 MHz” before
“Part#
2: Spans
~500
MHz.”
Part 1: Span 1800 MHz
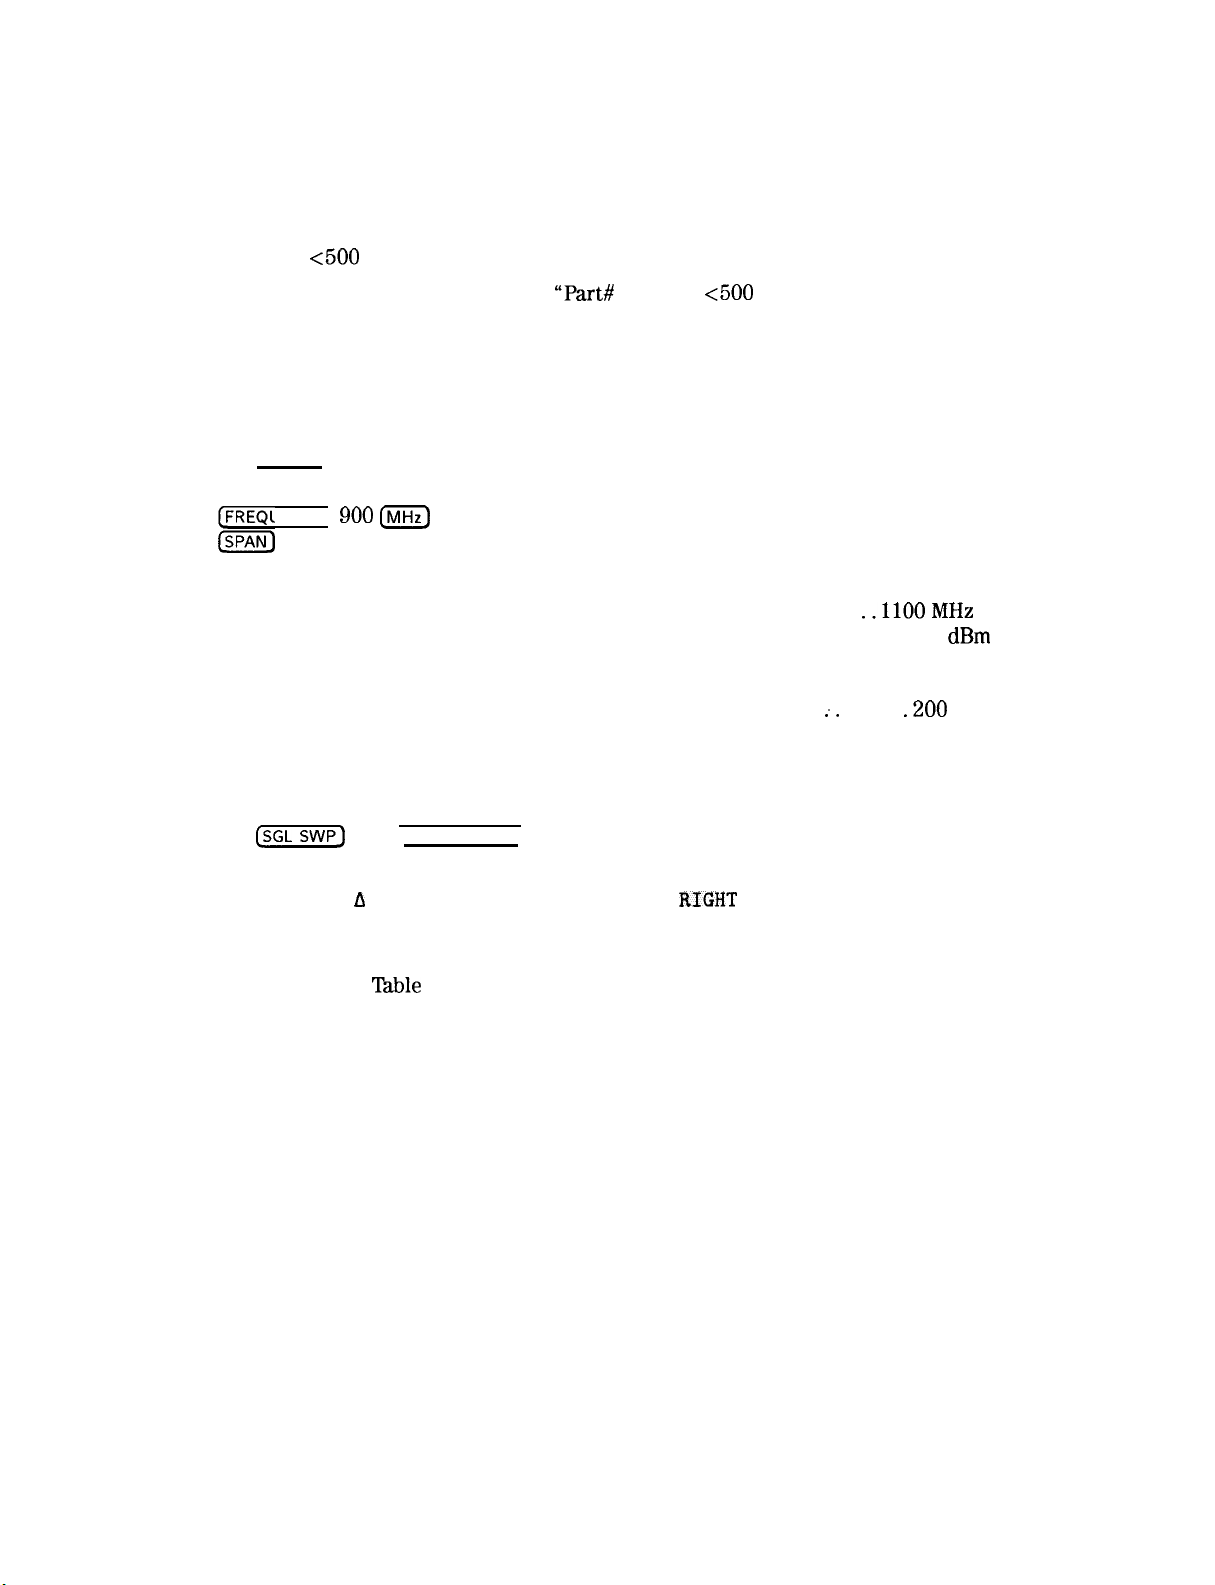
Connect the equipment as shown in Figure l-5. Note that the power splitter is used as a
1.
combiner.
2.
Press [PRESET) on the spectrum analyzer and wait for the preset to finish. Set the spectrum
analyzer by pressing the following keys:
FREQUENCY]
h
1800 (MHz)
Press INSTRUMENT PRESET on the synthesized sweeper and set the controls as follows:
3.
CW
. . . . . . . . . . . . . . . . . . . . . . . . . . . . . . . . . . . . . . . . . . . . . . . . . . . . . . . . . . . . .
POWERLEVEL . . . . . . . . . . . . . . . . . . . . . . . . . . . . . . . . . . . . . . . . . . . . . . . . . . . . . -5 dBm
4.
On the signal generator, set the controls as follows:
FREQUENCY (LOCKED MODE). . . . . . . . . . . . . . . . . . . . . . . . . . . . .
CWOUTPUT . . . . . . . . . . . . . . . . . . . . . . . . . . . . . . . . . . . . . . . . . . . . . . . . . . . . . . . . ..OdBm
Adjust the spectrum analyzer center frequency, if necessary, to place the lower frequency
5.
on the second vertical graticule line (one division from the left-most graticule line).
6.
Press
(sGL]
marker is on the left-most signal This is the “marked” signal.
900 INIHz)
..llOOMHz
;.
. . . . . .
.200
MHz
then [PEAK SEARCH]. If necessary, continue pressing NEXT PEAK until the
7.
Press MARKER A and continue pressing NEXT PK
RIGllT
. The marker delta should be on
the right-most signal.
8.
Record the MKR A frequency reading in the performance test record for the corresponding
TR Entry listed in
l%ble
l-7. The MKR reading should be within the limits shown.
l-20 Calibrating
HP 85900 Spectrum Analyzer
Page 33
Part 2: Spans <500 MHz
5. Frequency Span Readout Accuracy
9. Press
(j-1
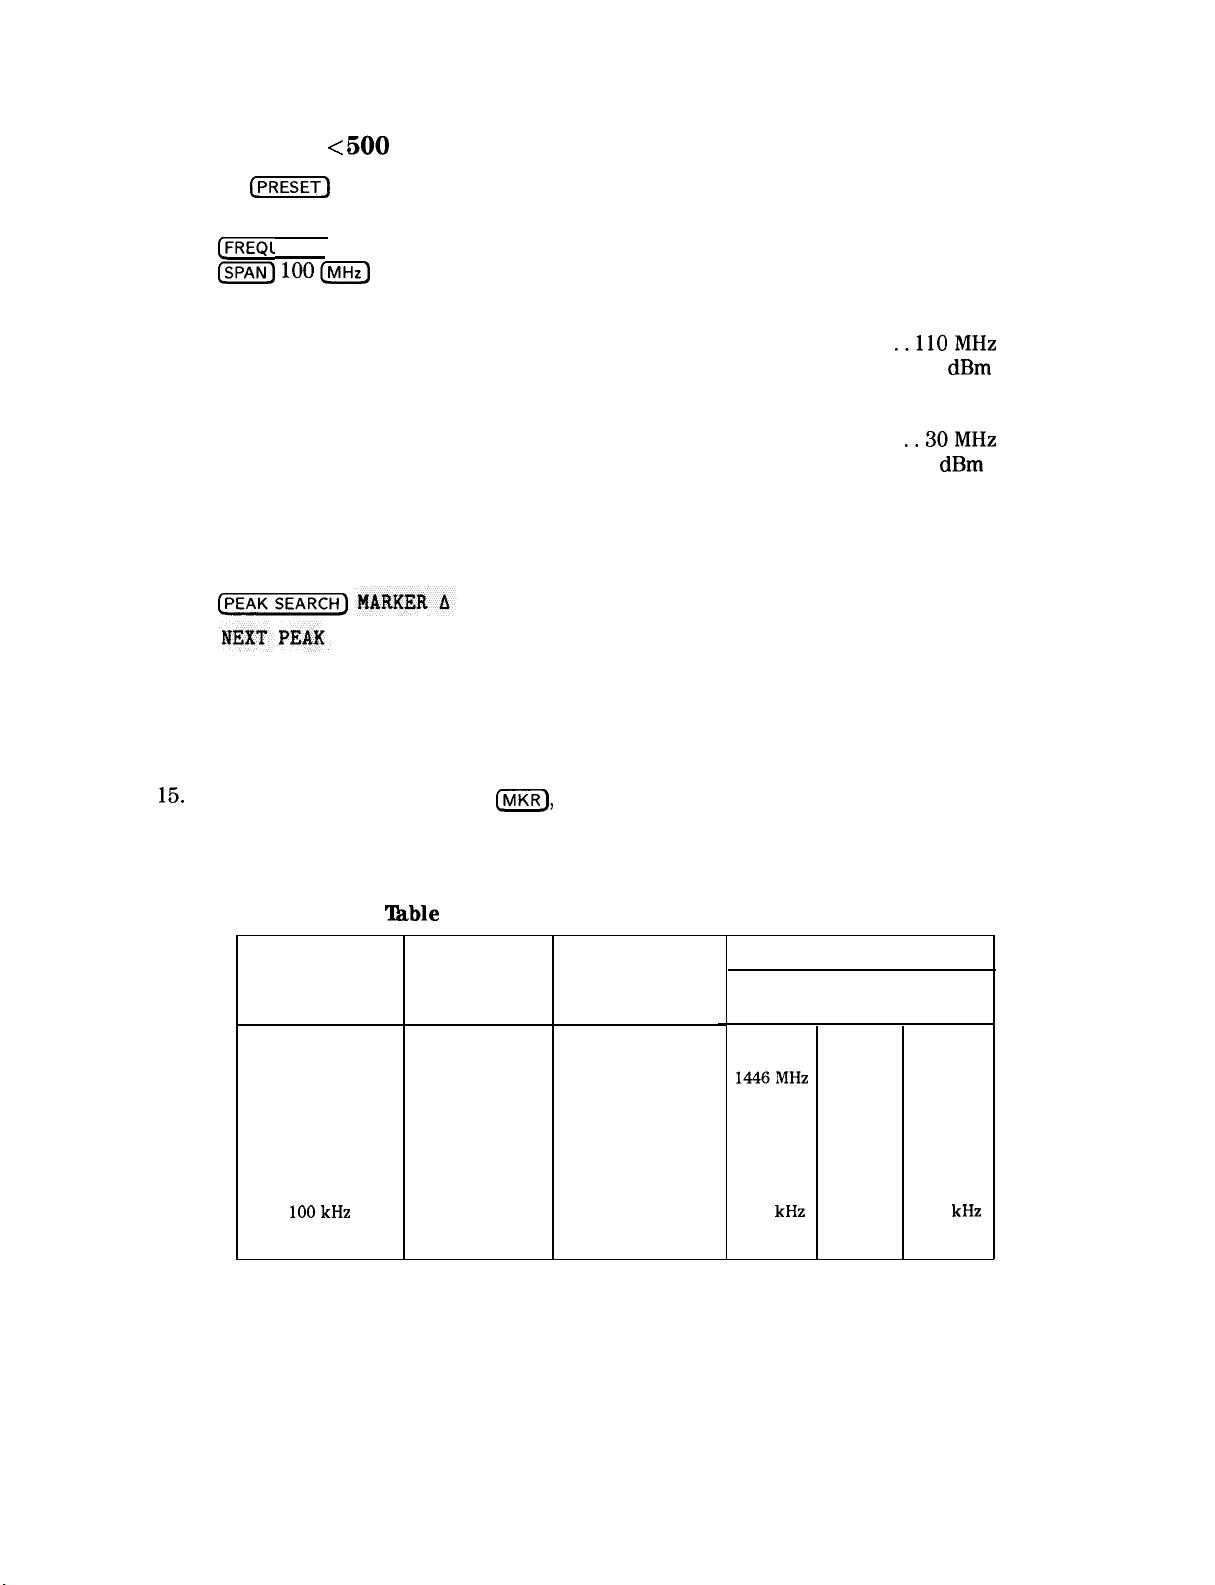
on the spectrum analyzer and wait for the PRESET to finish. Set the
spectrum analyzer by pressing the following keys:
FREQUENCY] 70 (MHz)
h
loom
10. Press INSTRUMENT PRESET on the synthesized sweeper and set the controls as follows:
CW
. . . . . . . . . . . . . . . . . . . . . . . . . . . . . . . . . . . . . . . . . . . . . . . . . . . . . . . . . . . . . .
..llOMHz
POWER LEVEL . . . . . . . . . . . . . . . . . . . . . . . . . . . . . . . . . . . . . . . . . . . . . . . . . . . . . -5 dBm
11. Set the signal generator controls as follows:
FREQUENCY. . . . . . . . . . . . . . . . . . . . . . . . . . . . . . . . . . . . . . . . . . . . . . . . . . . . . .
CW OUTPUT . . . . . . . . . . . . . . . . . . . . . . . . . . . . . . . . . . . . . . . . . . . . . . . . . . . . . . . . . . 0
..30MHz
dBm
12. If necessary, adjust the spectrum analyzer center frequency to center the two signals on
the display.
13. On the spectrum analyzer, press the following keys:
The two markers should be on the signals near the second and tenth vertical graticule lines
(the first graticule line is the left-most).
14. Record the MKR A frequency reading in the performance test record for the corresponding
TR Entry listed in Table l-7. The MKR reading should be within the limits shown.
15.
On the spectrum analyzer, press
Il\nKRl,
More 1 of 2 , then MARKER ALL OFF.
16. Repeat steps 11 through 15 for the remaining span settings listed in Table l-7, setting the
synthesized sweeper CW and signal generator Frequency as shown in the table.
‘Ihble
1-7. Frequency Span Readout Accuracy
Min.
77.0
MKR-A Reading
TR Entry Max.
(Actual)
I I
MHz
MHz
MHz
kHz
5-2 83.0
5-3
5-4 8.30
5-5 83.0
1554 MHz
MHz
16.60
MHz
MHz
kHz
Spectrum Analyze]
Span Setting
1800 MHz
100 MHz
20 MHz
10 MHz
100kHz 69.96 70.04
Signal Generator Sythesized Sweeper
Frequency (MHz) Frequency (MHz)
200
30.0
62.0
66.0
1700
110.0
78.0
74.0 7.70
1446MHz 5-l
77.0
15.40
HP 859OD Spectrum Analyzer
Calibrating 1-21
Page 34
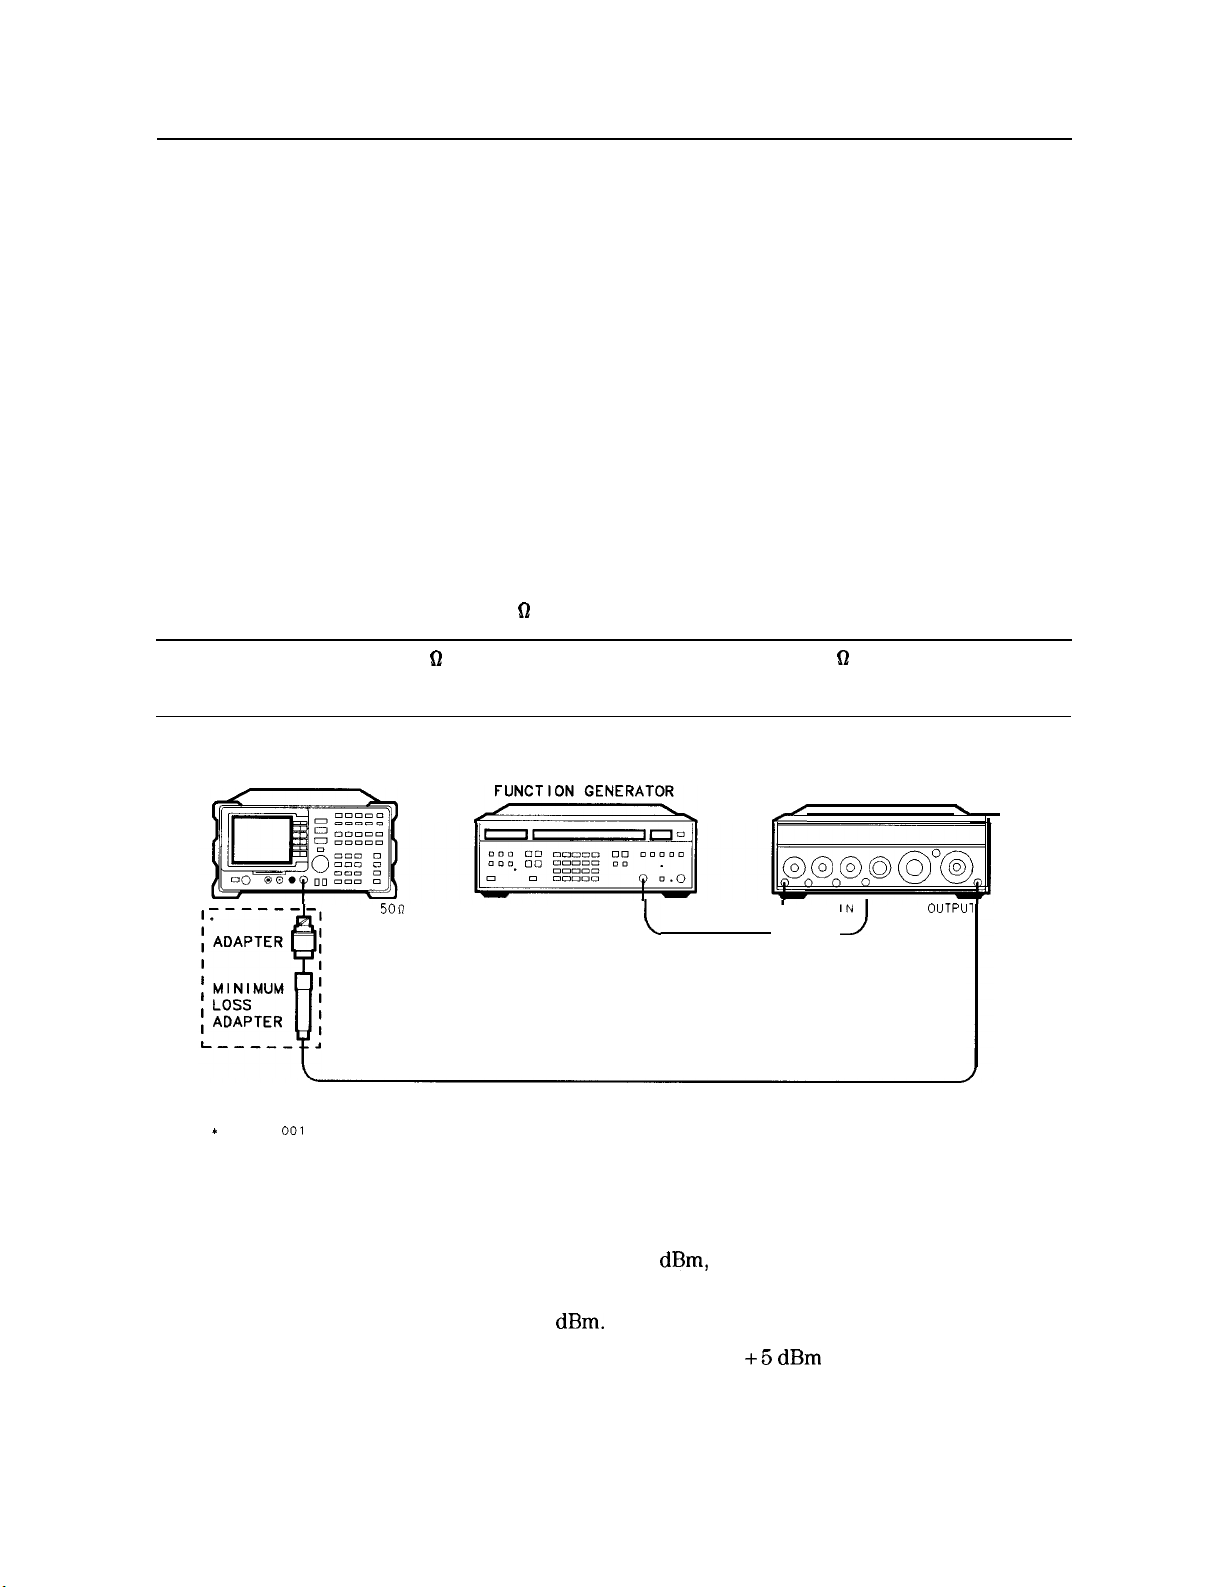
6. Sweep Time Accuracy
This test uses a synthesizer function generator to amplitude modulate a 500 MHz CW signal
from another signal generator. The spectrum analyzer demodulates this signal in zero span to
display the response in the time domain. The marker delta frequency function on the spectrum
analyzer is used to read out the sweep time accuracy.
There are no related adjustment procedures for this performance test.
Equipment Required
Synthesizer/function generator
Signal generator
Cable, Type N, 152 cm (60 in)
Cable, BNC, 120 cm (48 in)
Additional Equipment for Option 001
Adapter, minimum loss
Adapter, Type N (f) to BNC (m), 75
62
Caution
SPECTRUM ANALYZER SYNTHESIZER
---------
I
)i
OPTION
L--------l
001
Procedure
Use only 75 Q cables, connectors, or adapters on the 75 62 input of an Option
001 or damage to the input connector will occur.
INPUT 5017
I
ONLY
Figure 1-6. Sweep Time Accuracy Test Setup
AM
MAIN SIGNAL
TYPE N CABLE ASSEMBLY
(
SIGNAL GENERATOR
,’
‘“I
RF
\
OUTPUl
XY16
1. Set the signal generator to output a 500 MHz, -10
dBm,
CW signal. Set the AM and FM
controls to OFF.
Option 001 only: Set the output to -4
dBm.
2. Set the synthesizer function generator to output a 500 Hz, +5
signal.
3. Connect the equipment as shown in Figure l-6.
1-22 Calibrating HP 95900 Spectrum Analyzer
dBm
triangle waveform
Page 35
6. Sweep Time Accuracy
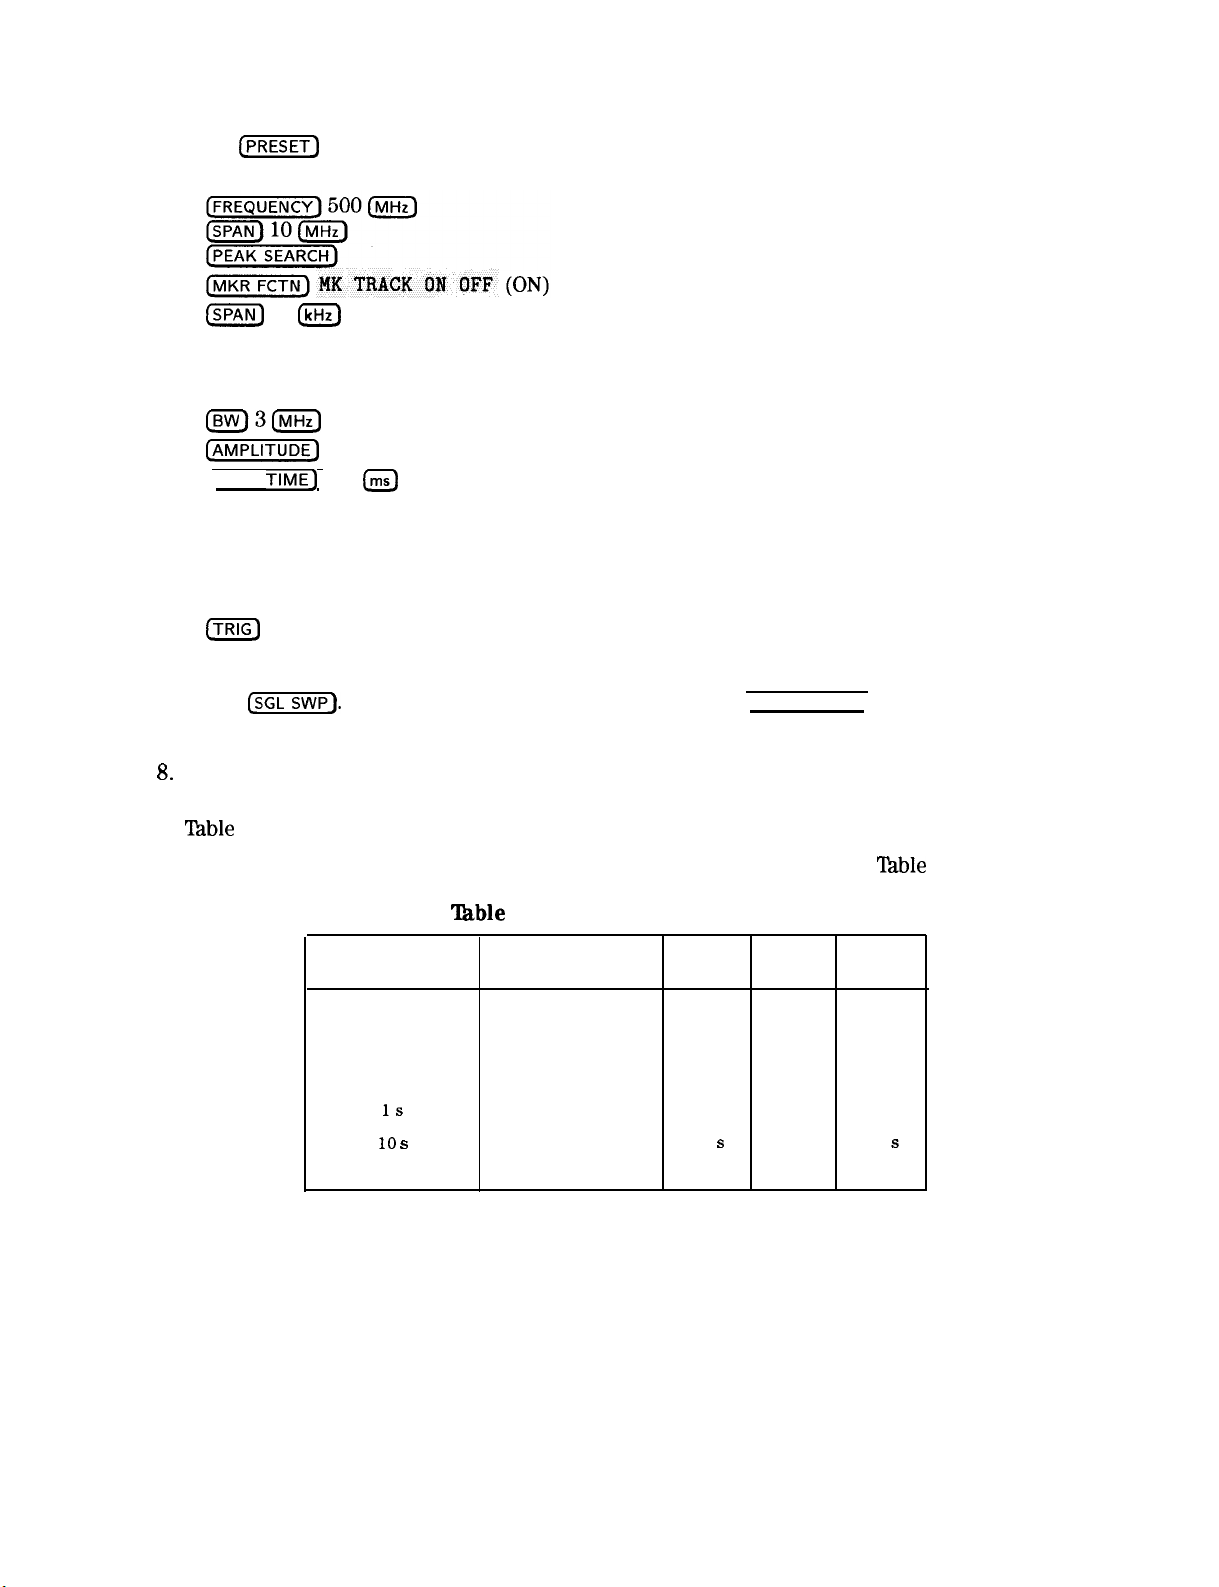
4. Press
@EEY)
on the spectrum analyzer and wait for the preset to finish. Set the controls as
follows:
ISPAN)
50
IkHz)
Wait for the AUTO ZOOM routine
to finish
then press the
following
spectrum
analyzer
(SPAN) ZERO SPAN
iBW)3(MHz)
[AMPLITUDE_)
(SWEEP
SCALE LOG LIN (LIN)
TIMES
20
m
Adjust signal amplitude for a mid-screen display.
5. Set the signal generator AM switch to the AC position.
6. On the spectrum analyzer, press the following keys:
ITRIG)
VIDEO
Adjust the video trigger so that the spectrum analyzer is sweeping.
7. Press
@EFF).
After the completion of the sweep, press (PEAK SEARCH). If necessary, press
NEXT PEAK until the marker is on the left most signal. This is the “marked signal.”
keys:
8-
Press MARKER A, MARKER A , then NEXT PK RIGHT until the marker A is on the eighth
signal peak. Record the marker A reading in the performance test record as indicated in
l%ble
1-8.
9. Repeat steps 6 through 8 for the remaining sweep time settings listed in
‘lhble
1-8. Sweep Time Accuracy
Spectrum Analyzer
Sweep Time Setting Generator Frequency Reading (MKR A) Reading
20 ms
100 ms
1s
10 s
Synthesizer/Level
500 Hz
100 Hz
10 Hz
1 Hz
Minimum TR Entry Maximum
15.4 ms
77.0
770.0
7.7
ms
ms
s
6-l 16.6 ms
6-2 83.0 ms
6-3 830.0 ms
6-4 8.3
‘Ihble
s
l-8.
HP 95900 Spectrum Analyzer
Calibrating 1-23
Page 36
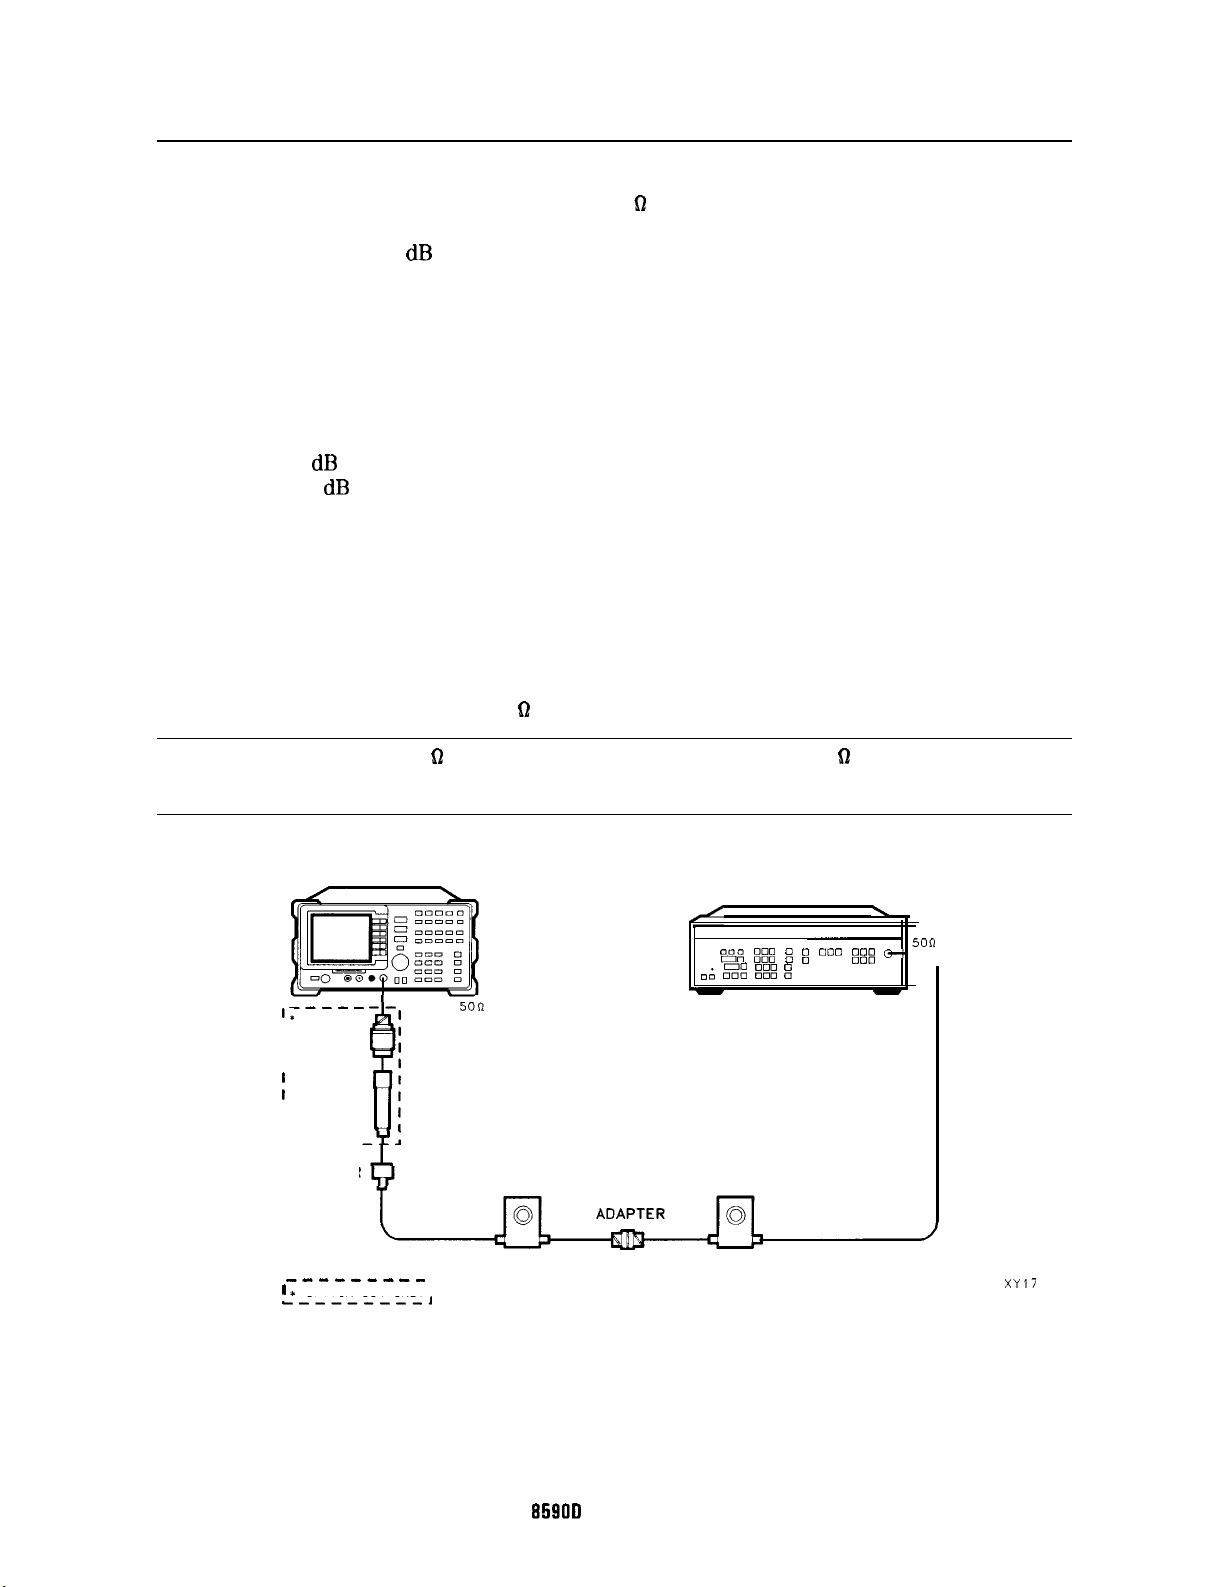
7. Scale Fidelity
A 50 MHz CW signal is applied to the INPUT 50 61 of the analyzer through two step attenuators.
The attenuators increase the effective amplitude range of the source. The amplitude of the
source is decreased in 10
amplitude difference between steps. The source’s internal attenuator is used as the reference
standard. The test is performed in both log and linear amplitude scales.
The related adjustment for this performance test is “Log and Linear Amplitude Adjustment.”
Equipment Required
Synthesizer/level generator
Attenuator, 1 dB step
Attenuator, 10 dB step
Cable, BNC, 122 cm (48 in)
Cable, BNC, 20 cm (9 in)
Adapter, Type N (m) to BNC (f)
Adapter, Type BNC (m) to BNC (m)
Additional Equipment for Option 001
Adapter, minimum loss
Adapter, Type N (f) to BNC (m), 75
dB
steps and the analyzer marker functions are used to measure the
62
Caution
-----
I*
I
, ADAPTER
I
;
MINIMUM
, LOSS
, ADAPTER
I-----
ADAPTER
-^-------
I * OPTION 001 ONLY
,----,---I
Use only 75 62 cables, connectors, or adapters on the 75 61 input of an Option
001 or damage to the input connector will occur.
SPECTRUM ANALYZER
INPUT
I
Figure 1-7. Scale Fidelity Test Setup
5OfI
ATTENUATOR
SYNTHESIZER/LEVEL
GENERATOR
f’
“A;: 888 8 ;
00 E: 888 8
-
ATTENUATOR
-
ODD
0
\
8x& c3-
00
-
5orl
1-24 Calibrating
HP
85901) Spectrum Analyzer
Page 37
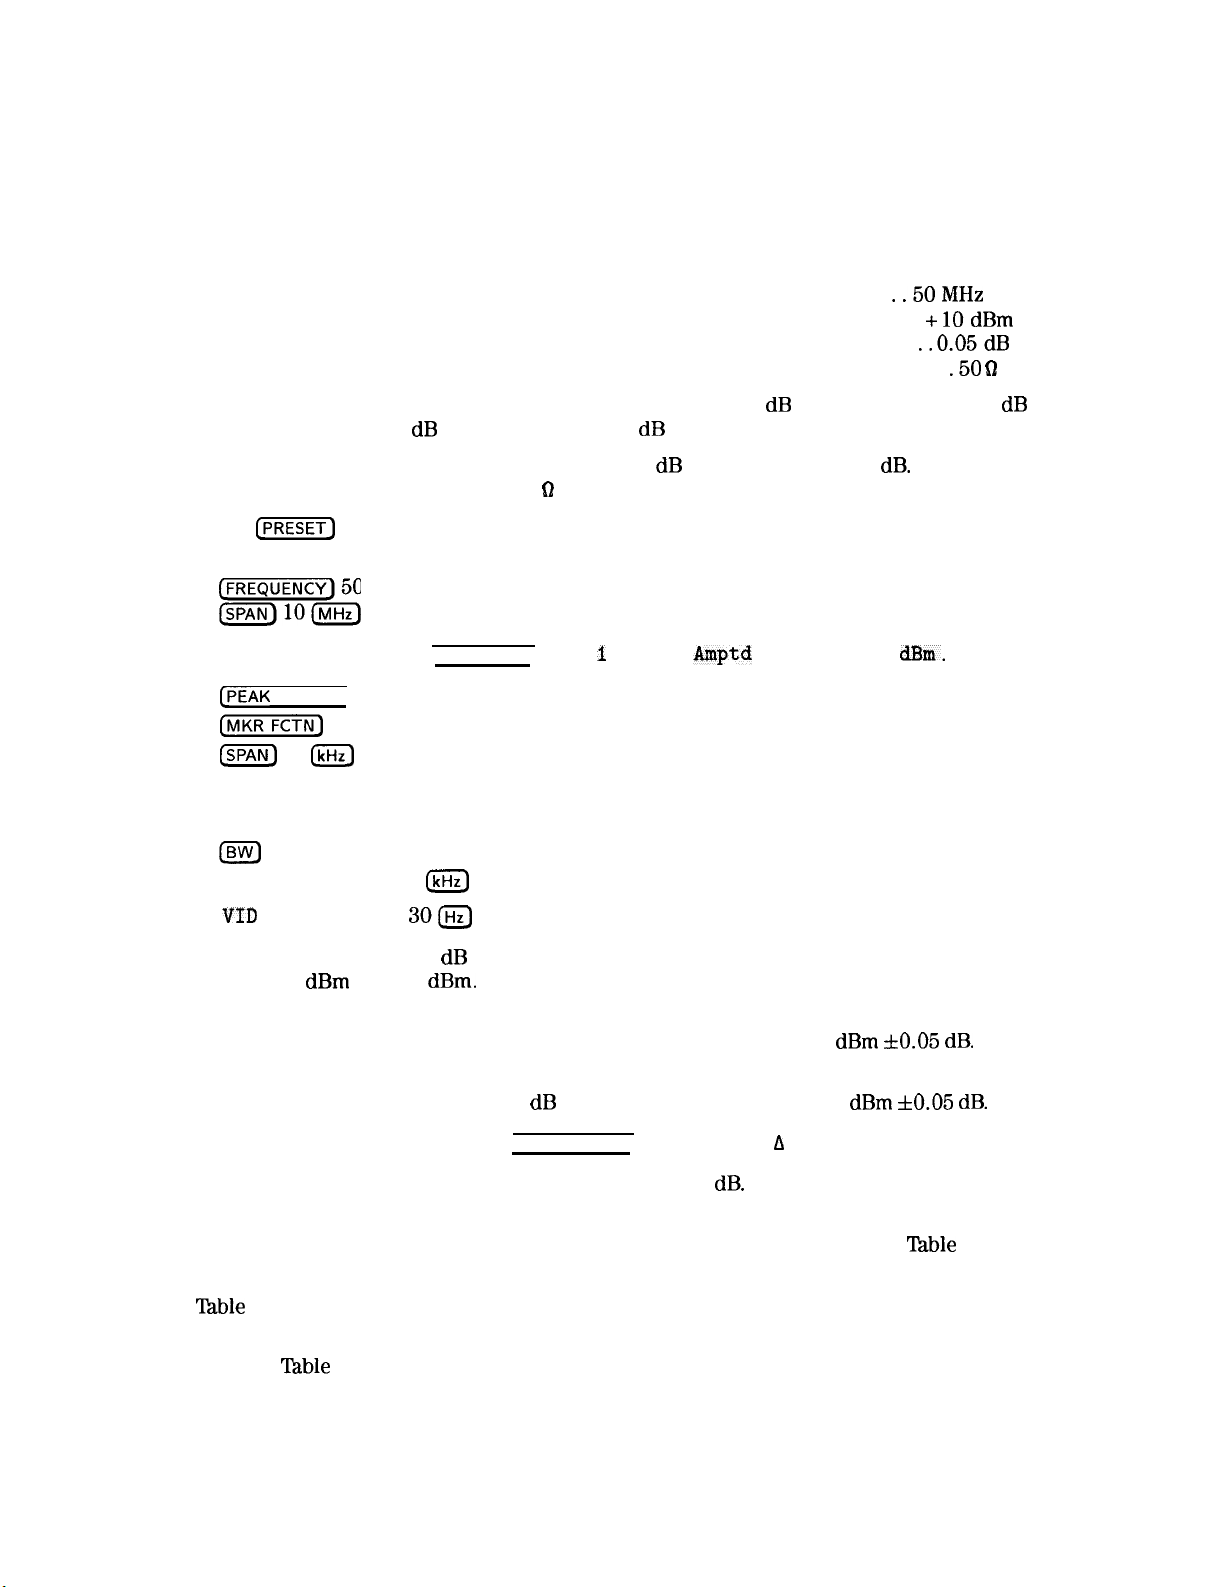
Procedure
Log Scale
1.
Set the synthesizer/level generator controls as follows:
7. Scale Fidelity
FREQUENCY
AMPLITUDE . . . . . . . . . . . . . . . . . . . . . . . . . . . . . . . . . . . . . . . . . . . . . . . . . . . . . . .
AMPTDINCR . . . . . . . . . . . . . . . . . . . . . . . . . . . . . . . . . . . . . . . . . . . . . . . . . . . . . .
OUTPUT
Connect the equipment as shown in Figure l-7. Set the 10 dB step attenuator to 10
2.
. . . . . . . . . . . . . . . . . . . . . . . . . . . . . . . . . . . . . . . . . . . . . . . . . . . . . .
..50MHz
+lOdBm
..O.O5dB
. . . . . . . . . . . . . . . . . . . . . . . . . . . . . . . . . . . . . . . . . . . . . . . . . . . . . . . . . . . . . .
.50 D
attenuation and the 1 dB step attenuator to 0 dB attenuation.
Option 001 only: Set the attenuation of the 10
dB
step attenuator to 0
dB.
Connect the
minimum loss pad to the INPUT 75 9 using adapters.
3.
Press
[PRESET]
on the spectrum analyzer, then wait for the preset routine to finish. Set the
spectrum analyzer by pressing the following keys:
FREQUENCY]
50 (MHz_)
b1om
Option 001 only: Press [AMPLITUDE), Mare
[PEAK
SEARCH)
[-FCTN)
m
MK TRACK ON OFF (ON)
50
m
1
of 2 ,
Amptd
Units , then
dl3m.
Wait for the auto zoom routine to finish, then set the resolution bandwidth and the video
bandwidth by pressing the following keys:
lewJ
RES BW AUTO MAN 3
IkHz)
dB
VID
BW AUTO MAN 30IHz)
4.
If necessary, adjust the 1 dB step attenuator attenuation until the MKR amplitude reads
between 0
On the synthesizer/level generator, press AMPLITUDE and use the increment keys to adjust
5.
the amplitude until the spectrum analyzer MKR amplitude reads 0
dBm
and -1
dBm.
dBm f0.05 dB.
It may be necessary to decrease the resolution of the amplitude increment of the
synthesizer/level generator to 0.01
6.
On the spectrum analyzer, press [PEAK SEARCH] then MARKER A .
Set the synthesizer/level generator AMPTD INCR to 4
7.
On the synthesizer/level generator, press AMPLITUDE, then increment down to step the
8.
synthesizer/level generator to the next lowest nominal amplitude listed in
Record the Actual MKR A amplitude reading in the performance test record as indicated in
9.
‘Ihble
l-9. The MKR amplitude should be within the limits shown.
10.
Repeat steps 8 through 9 for the remaining synthesizer/level generator Nominal Amplitudes
listed in
‘Iable
l-9.
dB
to obtain a MKR reading of 0
dB.
dBm f0.05 dB.
‘Iable
l-9.
HP 9590D Spectrum Analyzer
Calibrating 1-25
Page 38
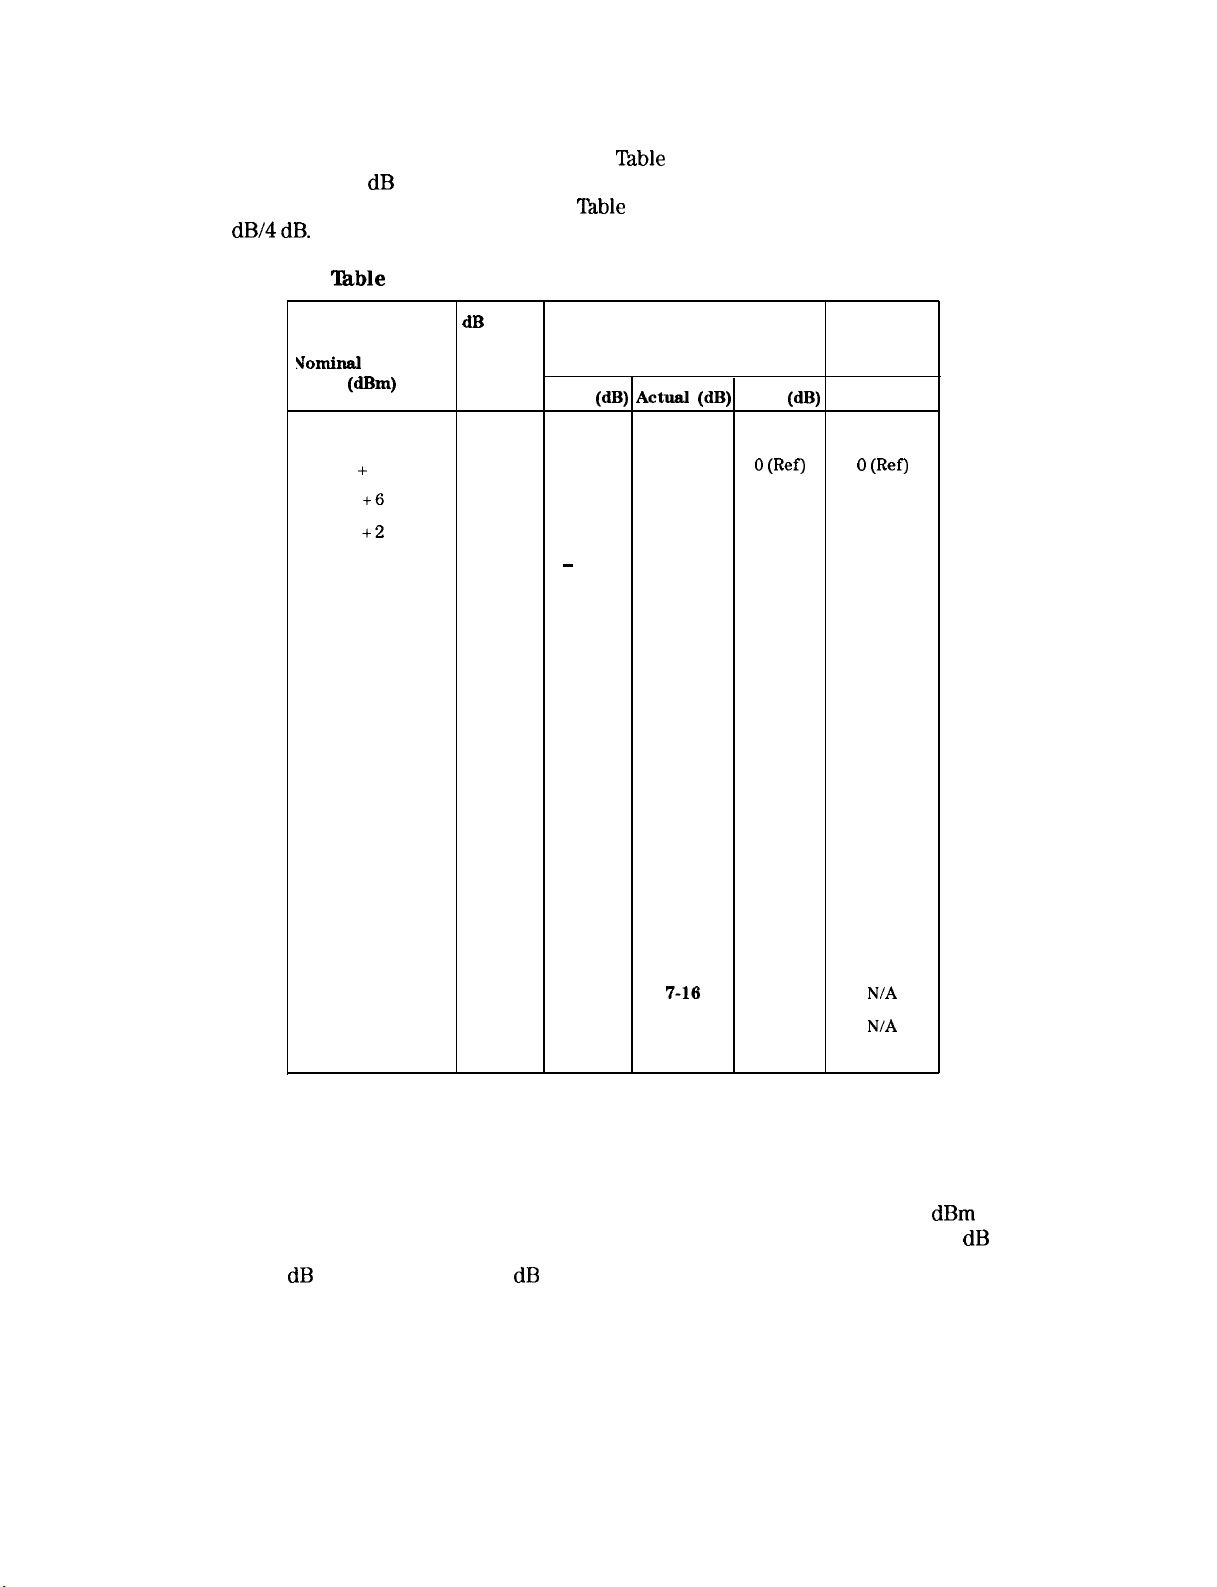
7. Scale Fidelity
11. For each Actual MKR A reading recorded in
Table
1-9, subtract the previous Actual MKR
A reading. Add 4 dB to the number and record the result as the incremental error in the
performance test record as indicated in
0.4
dB/4 dB.
‘Ihble
1-9. Cumulative and Incremental Error, Log Mode
Synthesizer/Level dB from
Generator
Nominal
Amplitude (nominal)
WW
+
10
+6
+2
-2 -12
-6 -16
-10 -20
-14 -24
-18 -28
-22 -32
-26 -36
-30 -40
-34 -44
-38 -48
-42 -52
-46 -56
-50 -60
-54 -64
-68 -68
Ref Level
0
-4
-8
‘lkble
l-9. The incremental error should not exceed
TR Entry TR Entry
Cumulative Error
(MKR A Reading)
Min.
(dB) Actual (dB)
0 (Ref) 0 (Ref)
-4.44 7-l
-8.48 7-2
-
12.52
-16.56 7-4
-20.60 7-5
-24.64 7-6
-28.68 7-7
-32.72 7-8
-36.76 7-9
-40.80 7-10
-44.84
-48.88 7-12
-52.92 7-13
-56.96 7-14
-61 .OO
-65.04
-69.08 7-17
7-3
7-11
7-15
7-16
(Incrementi
Max.
(dB) TR Entry
0 VW
-3.56 7-18
-7.52 7-19
-11.48 7-20
-15.44 7-21
-19.40 7-22
-23.36 7-23
-27.32 7-24
-31.28 7-25
-35.24 7-26
-39.20 7-27
-43.16 7-28
-47.12 7-29
-51.08 7-30
-55.04 7-31
-59.00 7-32
-62.96
-66.92
Error)
0
(Ref)
N/A
N/A
Linear Scale
12. Set the synthesizer/level generator controls as follows:
AMPLITUDE . . . . . . . . . . . . . . . . . . . . . . . . . . . . . . . . . . . . . . . . . . . . . . . . . . . . . . . + 10
AMPTDINCR . . . . . . . . . . . . . . . . . . . . . . . . . . . . . . . . . . . . . . . . . . . . . . . . . . . . . ...0.05
13. Set the 1 dB step attenuator to 0 dB attenuation.
1-26 Calibrating
HP 9590D Spectrum Analyzer
dBm
dB
Page 39
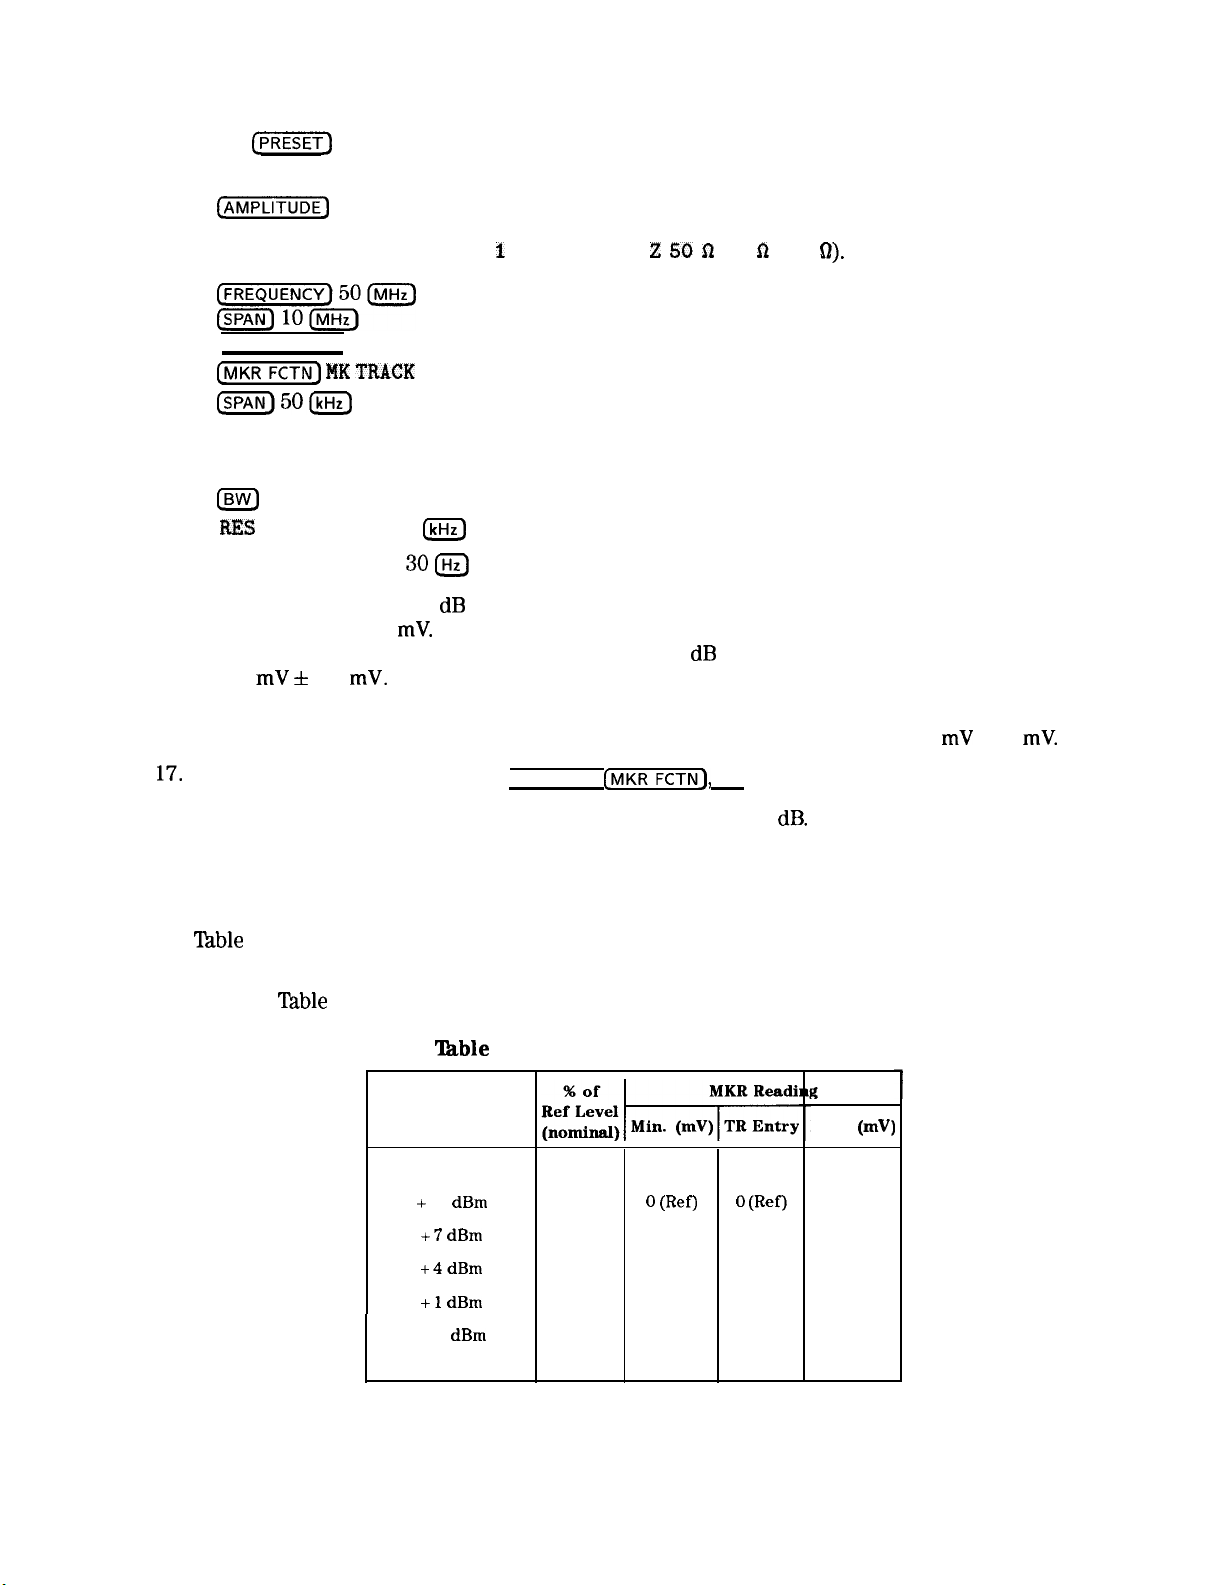
7. Scale Fidelity
14. Press
(j-j
on the spectrum analyzer, then wait for the preset routine to finish. Set the
spectrum analyzer by pressing the following keys:
[m)
Option 001 only: Press Mare
&f&F?-gm&f&F?-gm
SPANSPAN
[
PEAK SEARCH)[PEAK SEARCH)
(jNlKR- MK TRACK
(jNlKR- MK TRACK
(SPAN)50m(SPAN)50m
Wait for the auto zoom routine to finish, then set the resolution bandwidth and the video
Wait for the auto zoom routine to finish, then set the resolution bandwidth and the video
bandwidth by pressing the following keys:
bandwidth by pressing the following keys:
0
0
RES
BW AUTO MAN 3
BW AUTO MAN 3
VID BW AUTO MAN
SCALE LOG LIN (LIN)
I
of 2, INPUT Z 50 R 75 R (50
MHzMHz
ON OFF (ON)
ON OFF (ON)
IkHz)RES
IkHz)
300
0).
15. If necessary, adjust the 1 dB step attenuator attenuation until the MKR reads
approximately 223.6
mV.
It may be necessary to decrease the resolution of the amplitude
increment of the synthesizer/level generator to 0.01 dB to obtain a MKR reading of
223.6
mV f
0.4
mV.
16. On the synthesizer/level generator, press AMPLITUDE, then use the increment keys to
adjust the amplitude until the spectrum analyzer MKR amplitude reads 223.6
mV
+/-0.4
mV.
1’7.
On the spectrum analyzer, press (PEAK SEARCH],
18. Set the synthesizer/level generator amplitude increment to 3
[MKRJ,
then MK TRACK ON OFF (OFF).
dB.
19. On the synthesizer/level generator, press AMPLITUDE, then increment down to step the
synthesizer/level generator to the next lowest Nominal Amplitude listed in Table l-10.
20. Record the MKR amplitude reading in the performance test record as indicated in
‘Ihble
l-10. The MKR amplitude should be within the limits shown.
21. Repeat steps 21 and 22 for the remaining synthesizer/level generator Nominal Amplitudes
listed in
‘Iable
l-10.
Synthesizer/Level
Generator
Nominal Amplitude
+
10
+7 dBm
+4dBm
+l dBm
-2
‘able
l-10. Scale Fidelity, Linear Mode
T
dBm
dBm
100 0
70.7
50 105.36
35.48 72.63
25 49.46
(Ref)
151.59
0 VW
7-33
7-34
7-35
7-36
R
Max.
0 (Ref)
165.01
118.78
86.05
82.88
(mV)
HP 9590D Spectrum Analyzer
Calibrating 1-27
Page 40
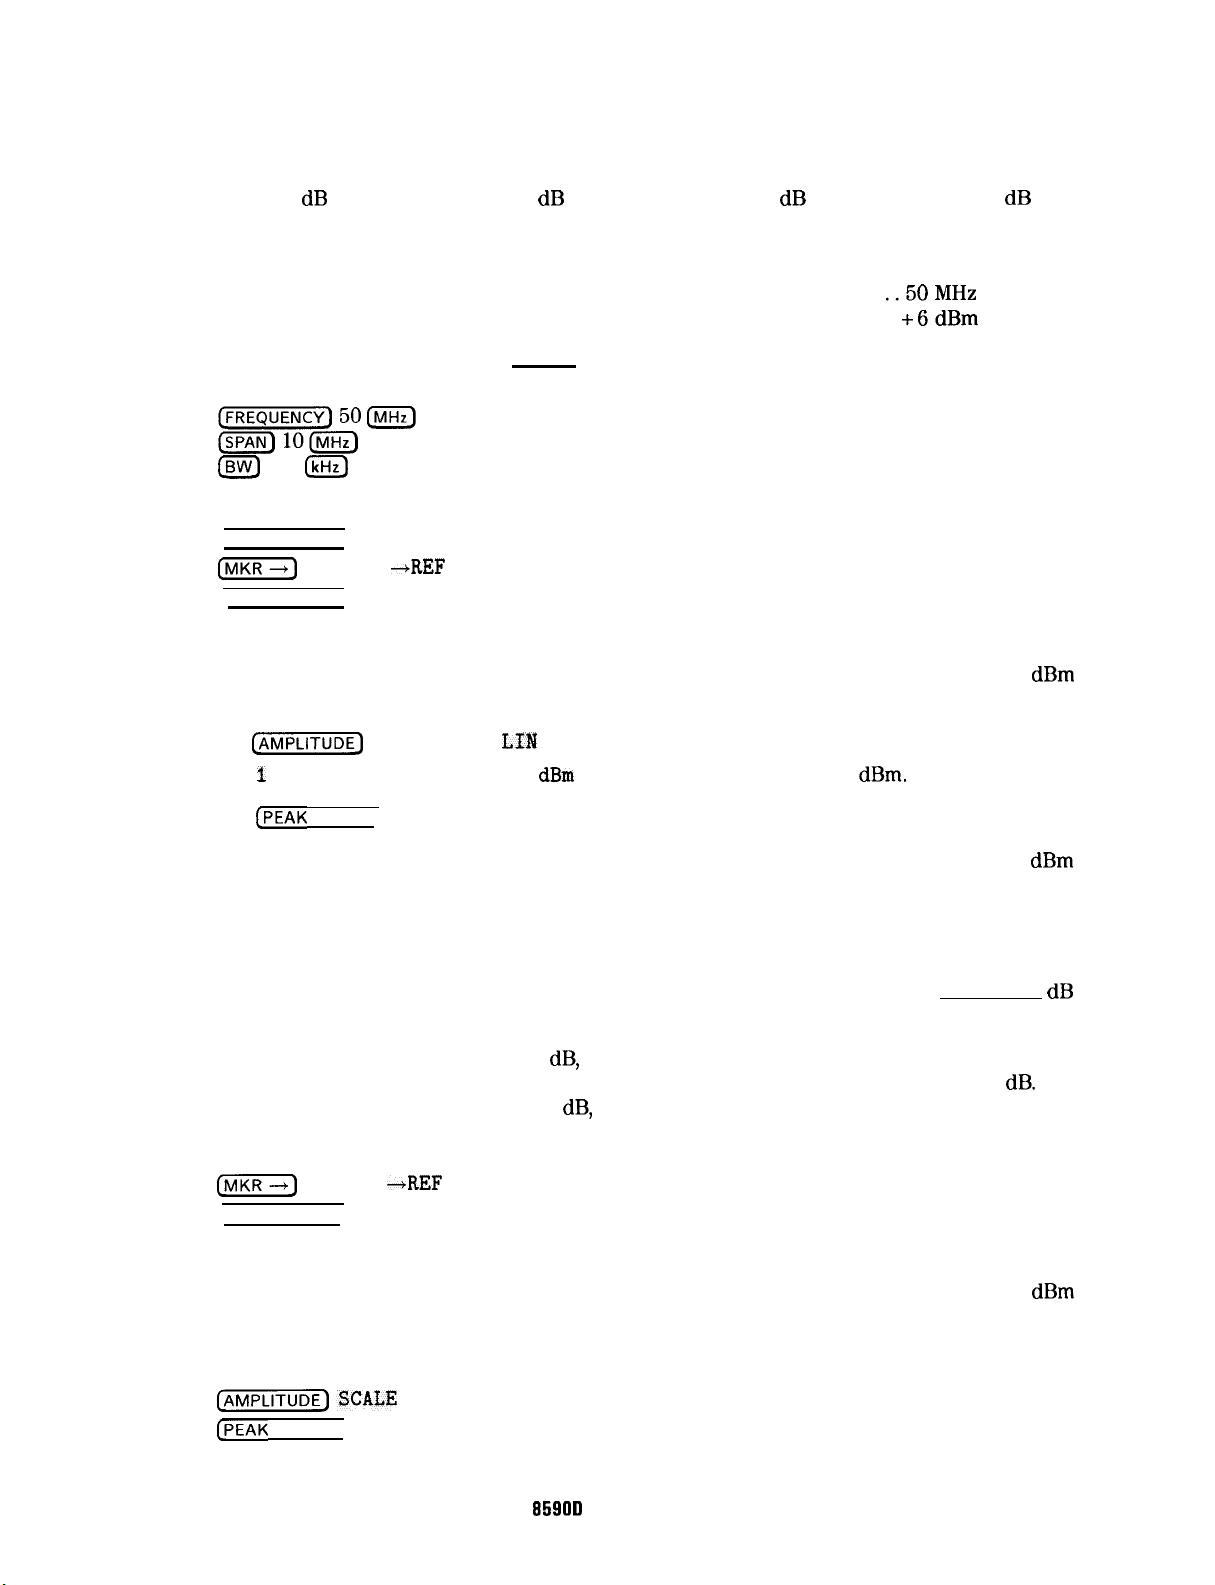
7. Scale Fidelity
Log to Linear Switching
Set the 10 dB step attenuator to 10 dB attenuation and the 1 dB step attenuator to 0
22.
attenuation.
Set the synthesizer controls as follows:
23.
FREQUENCY. . . . . . . . . . . . . . . . . . . . . . . . . . . . . . . . . . . . . . . . . . . . . . . . . . . . . .
AMPLITUDE . . . . . . . . . . . . . . . . . . . . . . . . . . . . . . . . . . . . . . . . . . . . . . . . . . . . . . . .
On the spectrum analyzer, press (PRESET), then wait for the preset routine to finish. Set the
24.
..50MHz
+6dBm
spectrum analyzer by pressing the following keys:
(EJ
300
(kHz)
On the spectrum analyzer, press the following keys:
25.
(PEAK SEARCH)
(MKRJ
(PEAK SEARCH)
Record the peak marker reading in Log mode below.
26.
MARKER +REF LVL
Log Mode Amplitude Reading-
27.
Press
C-1
More 1 of 2, Amptd Units , and
SCALE LOG
LIM
(LIN) to change the scale to linear, then press
dBm
to set the amplitude units to
dBm.
dB
dBm
Press
(PEAK
28.
SEARCH), then record the peak marker amplitude reading in linear mode.
Linear Mode Amplitude Reading-
Subtract the Linear Mode Amplitude Reading from the Log Mode Amplitude Reading, then
29.
record this value ad the Log/Linear Error.
Log/Linear Error
If the Log/Linear Error is less than 0
30.
dB,
record this value as TR Entry 7-37 in the
performance test record. The absolute value of the reading should be less than 0.25
the Log/Linear Error is greater than 0
On the spectrum analyzer, press the following keys:
31.
(--
(PEAK SEARCH]
Record the peak marker amplitude reading in linear mode.
32.
MARKER
+REF
LVL
dB,
continue with the next step.
Linear Mode Amplitude Reading-
On the spectrum analyzer, press the following keys:
33.
dB.
dBm
dB
If
dBm
(AMPLITUDE)SCALE
[PEAK
SEARCH)
1-29 Calibrating
LOG LIN
(LOG)
859OD Spectrum Analyzer
HP
Page 41

34. Record the peak marker reading in Log mode below.
7. Scale Fidelity
Log Mode Amplitude Reading
dBm
35. Subtract the Log Mode Amplitude Reading from the Linear Mode Amplitude Reading, then
record this value ad the Linear/Log Error.
Linear/Log Error
dB
36. Record the Linear/Log Error as TR Entry 7-37 in the performance test record. The absolute
value of the reading should be less than 0.25
dB.
HP 95900 Spectrum Analyzer
Calibrating 1-29
Page 42
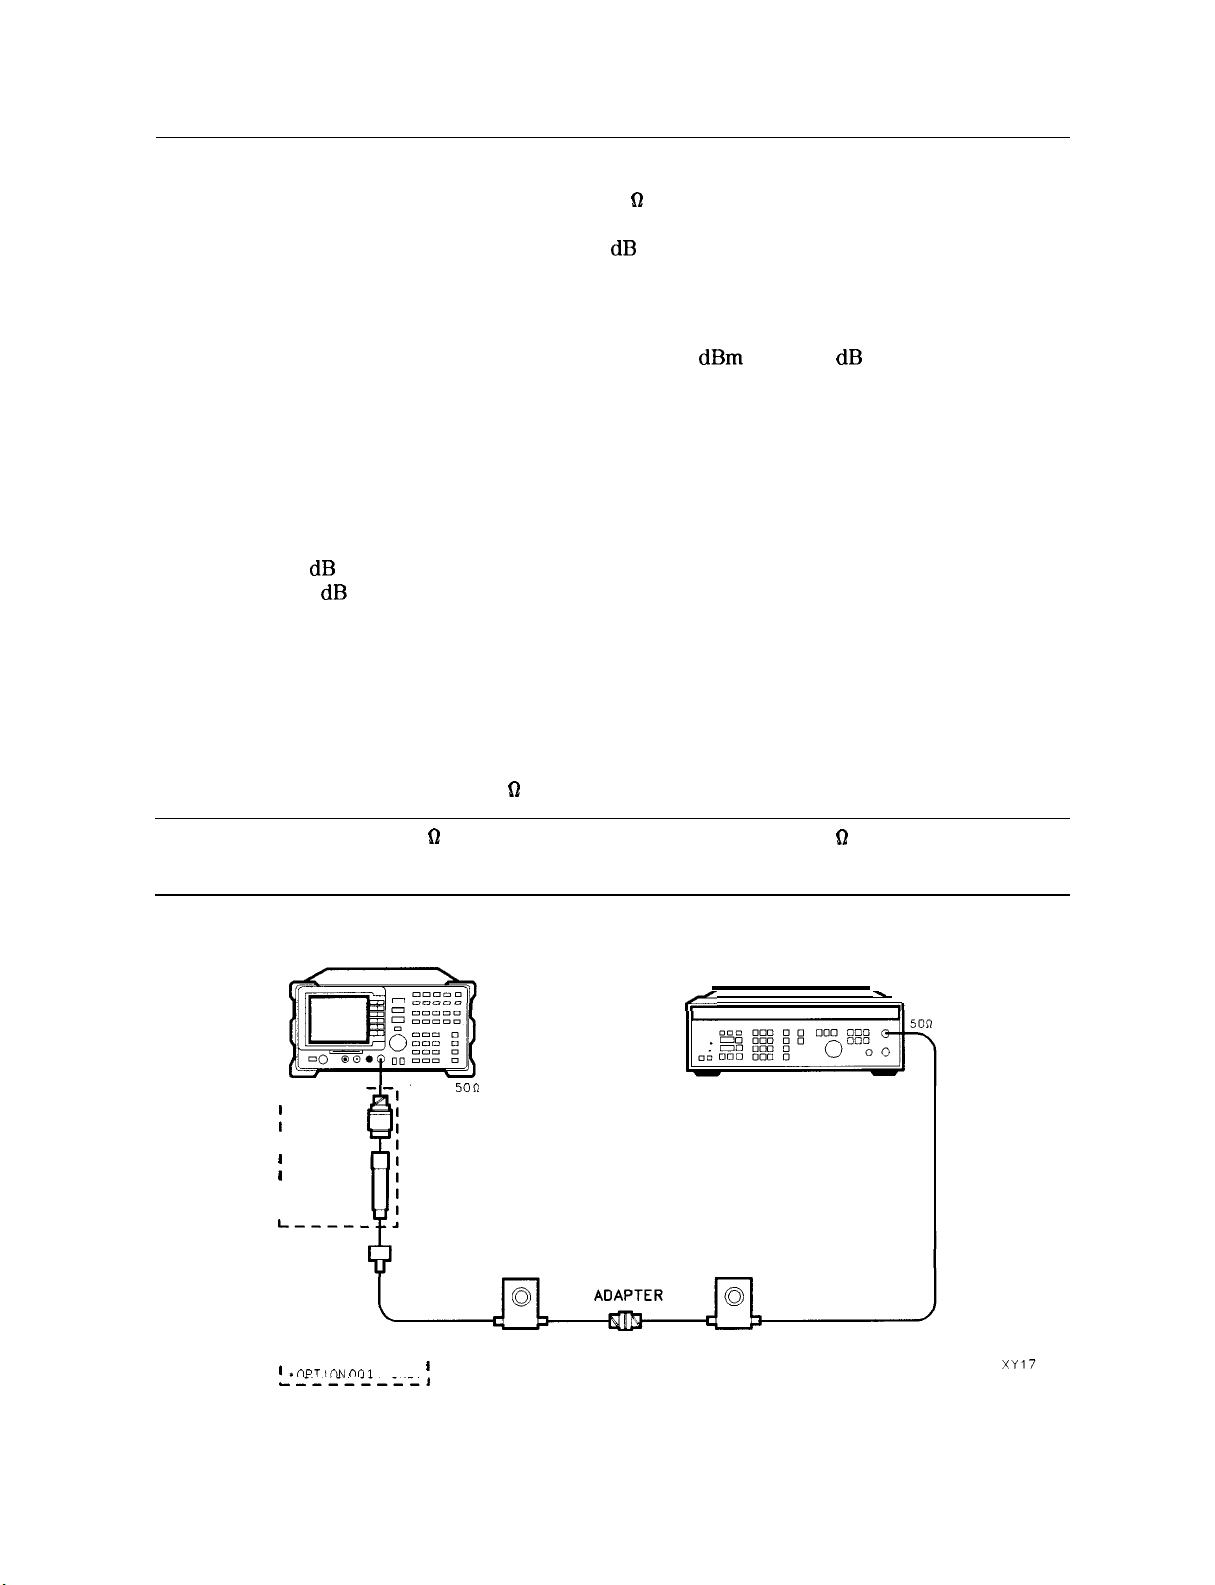
8. Reference Level Accuracy
A 50 MHz CW signal is applied to the INPUT 50 62 of the spectrum analyzer through two
step attenuators. The attenuators increase the effective amplitude range of the source.
The amplitude of the source is decreased in 10
functions are used to measure the amplitude difference between steps. The source’s internal
attenuator is used as the reference standard. The test is performed in both log and linear
amplitude scales.
dB
steps and the spectrum analyzer marker
It is only necessary to test reference levels as low as -90
dBm
(with 10 dB attenuation) since
lower reference levels are a function of the spectrum analyzer microprocessor manipulating the
trace data. There is no error associated with the trace data manipulation.
The related adjustment for this procedure is “A12 Cal Attenuator Error Correction.”
Equipment Required
Synthesizer/level generator
Attenuator, 1 dB steps
Attenuator, 10 dB steps
Cable, BNC 122 cm (48 in) (two
required)
Adapter, Type N (m) to BNC (f)
Adapter, BNC (m) to BNC (m)
Additional Equipment for Option 001
Adapter, minimum loss
Adapter, Type N (f) to BNC (m) 75
Caution
Use only 75 9 cables, connectors, or adapters on the 75 51 input of an Option
001 or damage to the input connector will occur.
61
SPECTRUM ANALYZER
-----
I*
;
ADAPTER
I
;
MINIMUM
, LOSS
, ADAPTER
I-----.
ADAPTER
---------
I* OPTlON cl01
L.--------I
INPUT
ONLY
50*
ATTENUATOR
I
Figure 1-8. Reference Level Accuracy Test Setup
l-30 Calibrating
I(’
ATTENUATOR
HP 9590D Spectrum Analyzer
SYNTHESIZER/LEVEL
GENERATOR
.
,
Page 43
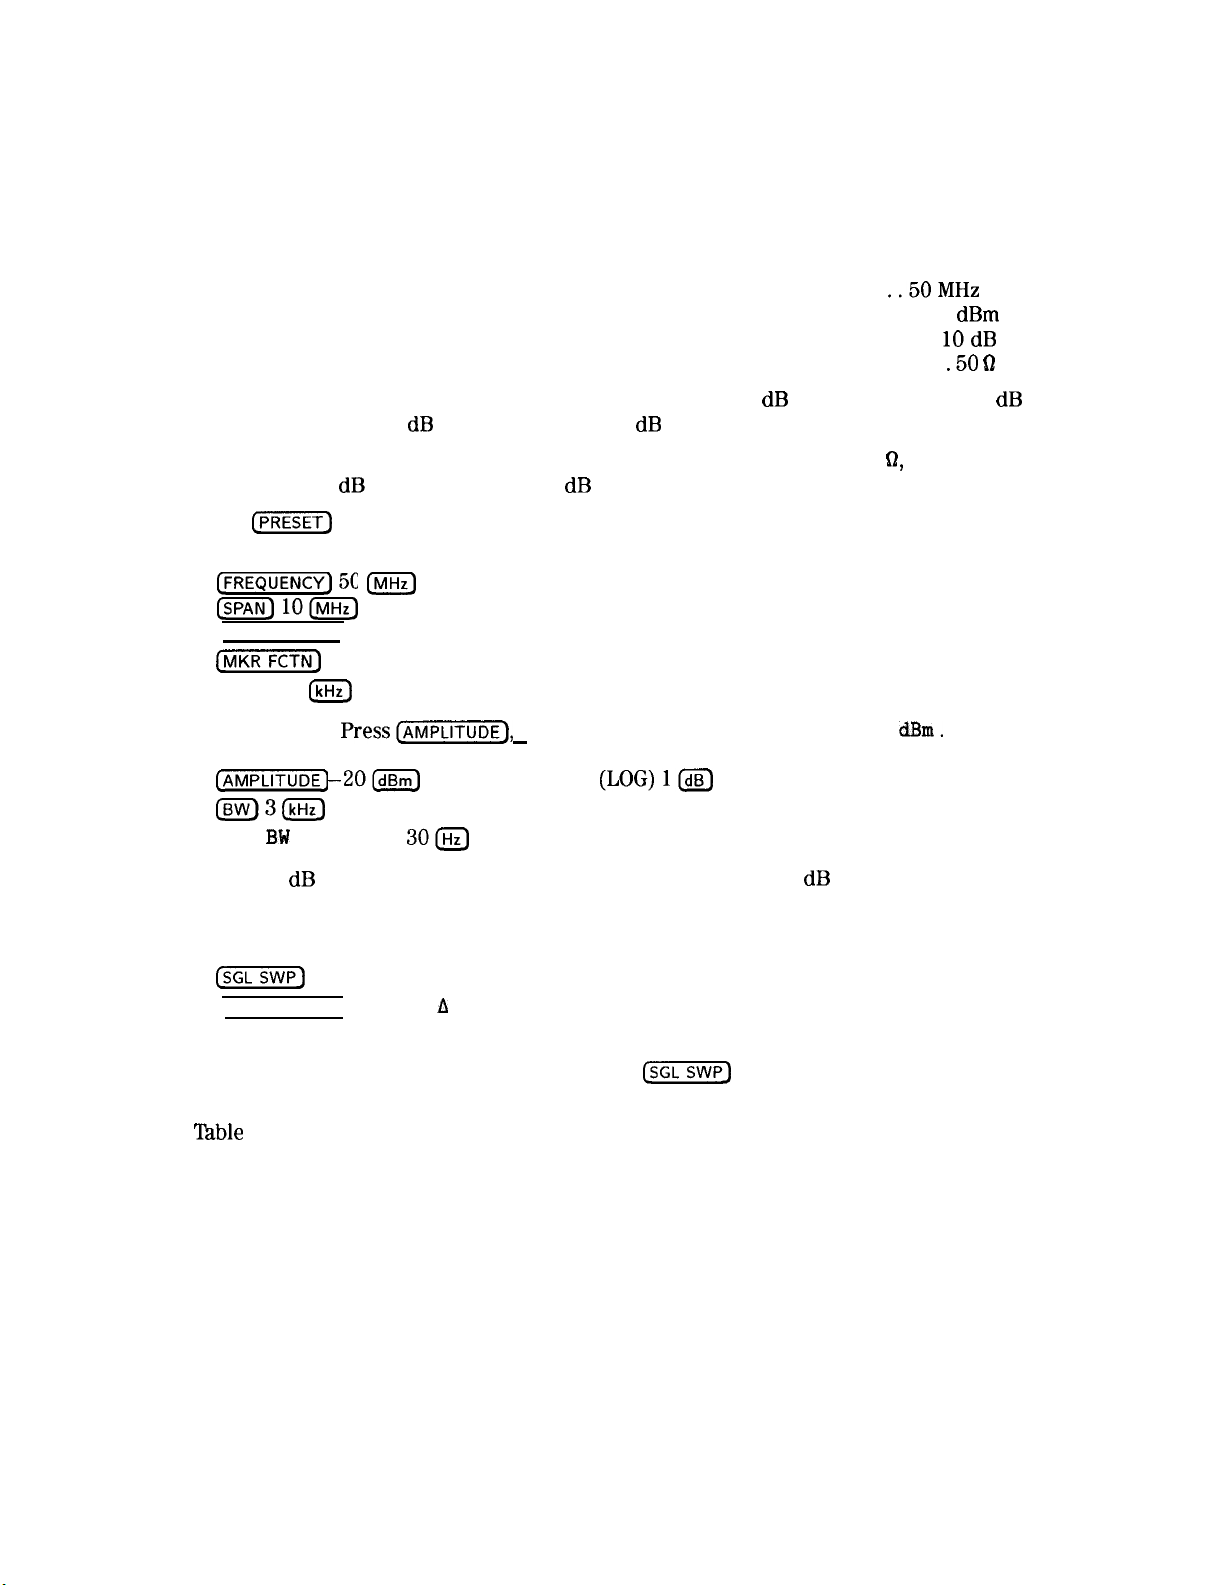
Procedure
Log Scale
Set the synthesizer/level generator controls as follows:
1.
8. Reference Level Accuracy
FREQUENCY
. . . . . . . . . . . . . . . . . . . . . . . . . . . . . . . . . . . . . . . . . . . . . . . . . . . . . .
..50MHz
AMPLITUDE . . . . . . . . . . . . . . . . . . . . . . . . . . . . . . . . . . . . . . . . . . . . . . . . . . . . . . . -10 dBm
AMPTDINCR . . . . . . . . . . . . . . . . . . . . . . . . . . . . . . . . . . . . . . . . . . . . . . . . . . . . . . . . .
10dB
OUTPUT. . . . . . . . . . . . . . . . . . . . . . . . . . . . . . . . . . . . . . . . . . . . . . . . . . . . . . . . . . . . . .
2.
Connect the equipment as shown in Figure 1-8. Set the 10 dB step attenuator to 10
attenuation and the 1 dB step attenuator to 0 dB attenuation.
Option 001 only: Connect the minimum loss adapter to the RF input 75
hl,
using adapters,
and set the 10 dB step attenuator to 0 dB attenuation.
Press
3.
[PRESET]
on the spectrum analyzer, then wait for the preset routine to finish. Set the
spectrum analyzer by pressing the following keys:
FREQUENCY] 50
&lOW
[PEAK SEARCH)
(m-
(SPAN) 50
Option001 only:
CAMPLITUDE)
iBW)3IkHz_)
VID BW AUTO MAN
IhnHz)
MK TRACK ON OFF (ON)
[kHz)
PressCAMPLITUDEj,
-2Om
SCALE LOG LIN
More
300
1 of 2, Amptd Units, then
dBm.
(LOG)l@J
.50 fl
dB
Set the 1 dB step attenuator to place the signal peak one to two dB (one to two divisions)
4.
below the reference level.
On the spectrum analyzer, press the following keys:
5.
(SGL-
[PEAK SEARCH] MARKER
Set the synthesizer/level generator amplitude and spectrum analyzer reference level
6.
according to Table l-11. At each setting, press
Record the MKR A amplitude reading in the performance test record as indicated in
7.
‘Ihble
l-l 1. The MKR A reading should be within the limits shown.
h
(sGLSWPI)
on the spectrum analyzer.
HP 9590D Spectrum Analyzer
Calibrating 1-31
Page 44
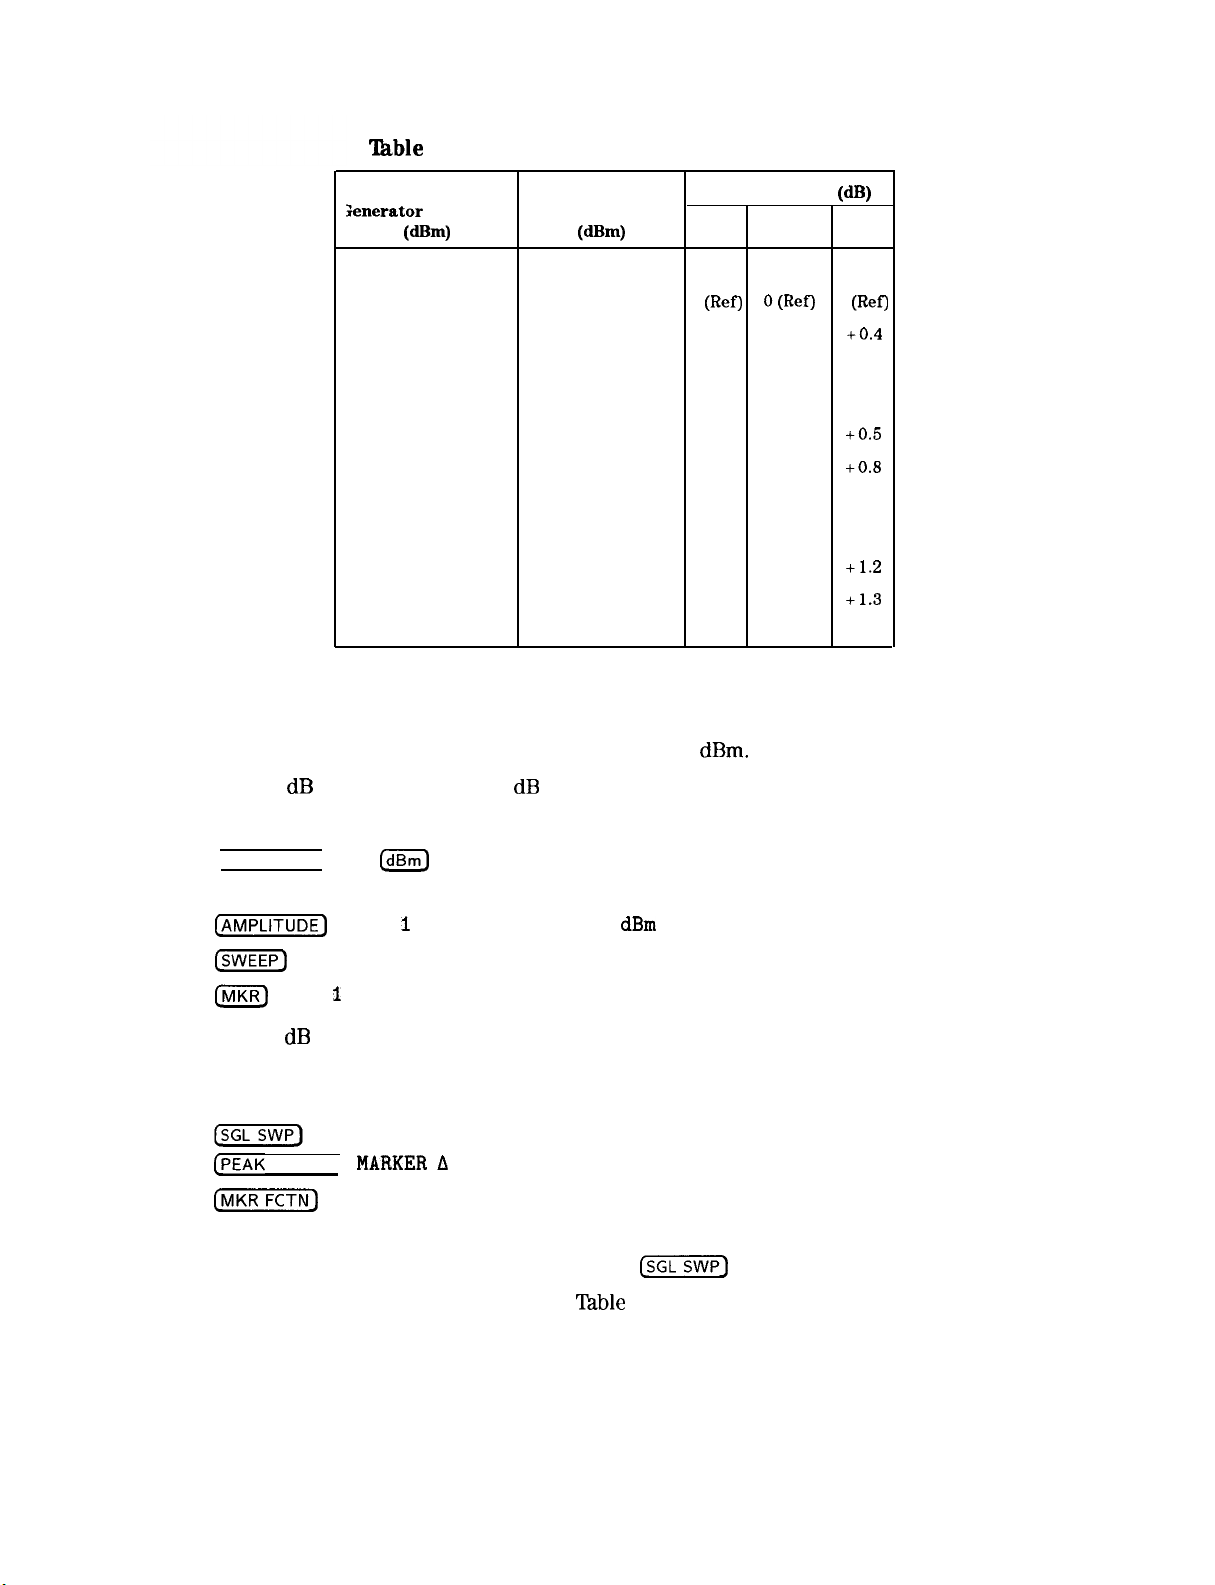
8. Reference Level Accuracy
‘l’hble
l-l 1. Reference Level Accuracy, Log Mode
Synthesizer/Level
knerator
Amplitude Reference Level
Wm)
-10 -20 0
0
+ 10 0
-20 -30 -0.4
-30 -40 -0.5
-40 -50 -0.8
-50 -60 -1.0
-60 -70 -1.1
-70 -80 -1.2
-80 -90 -1.3
Spectrum Analyzer
Pm)
-10 -0.4
Linear Scale
8. Set the synthesizer/level generator amplitude to -10
MKR A Reading (dB)
TR Entry Max.
Min.
(Ref)
-0.5
O(Ref) 0 (Ref)
8-1
8-2
8-3
8-4
8-5
8-6
8-7
8-8
8-9
dBm.
+0.4
+ 0.5
+ 0.4
+0.5
+0.8
+ 1.0
+ 1.1
+1.2
+1.3
9. Set the 1 dB step attenuator to 0 dB attenuation,
10. Set the spectrum analyzer controls as follows:
(AMPLITUDE] -20
m
SCALE LOG LIN (LIN)
CAMPLITUDE)
More
1
of 2 Amptd Units
dBm
@EEF-- SWEEP CONT SGL (CONT)
INIKR) More I
of
2 MARKER
ALL OFF
11. Set the 1 dB step attenuator to place the signal peak one to two divisions below the
reference level.
12. On the spectrum analyzer, press the following keys:
[PEAK
SEARCH]
(mFCTNI)
MARKER n
MK TRACK ON OFF (OFF)
13. Set the synthesizer/level generator amplitude and spectrum analyzer reference level
according to Table 1-12. At each setting, press
14. Record the MKR A amplitude reading in
‘lhble
CsGLSWPI)
on the spectrum analyzer.
1-12. The MKR A reading should be within
the limits shown.
1-32 Calibrating HP 95900 Spectrum Analyzer
Page 45
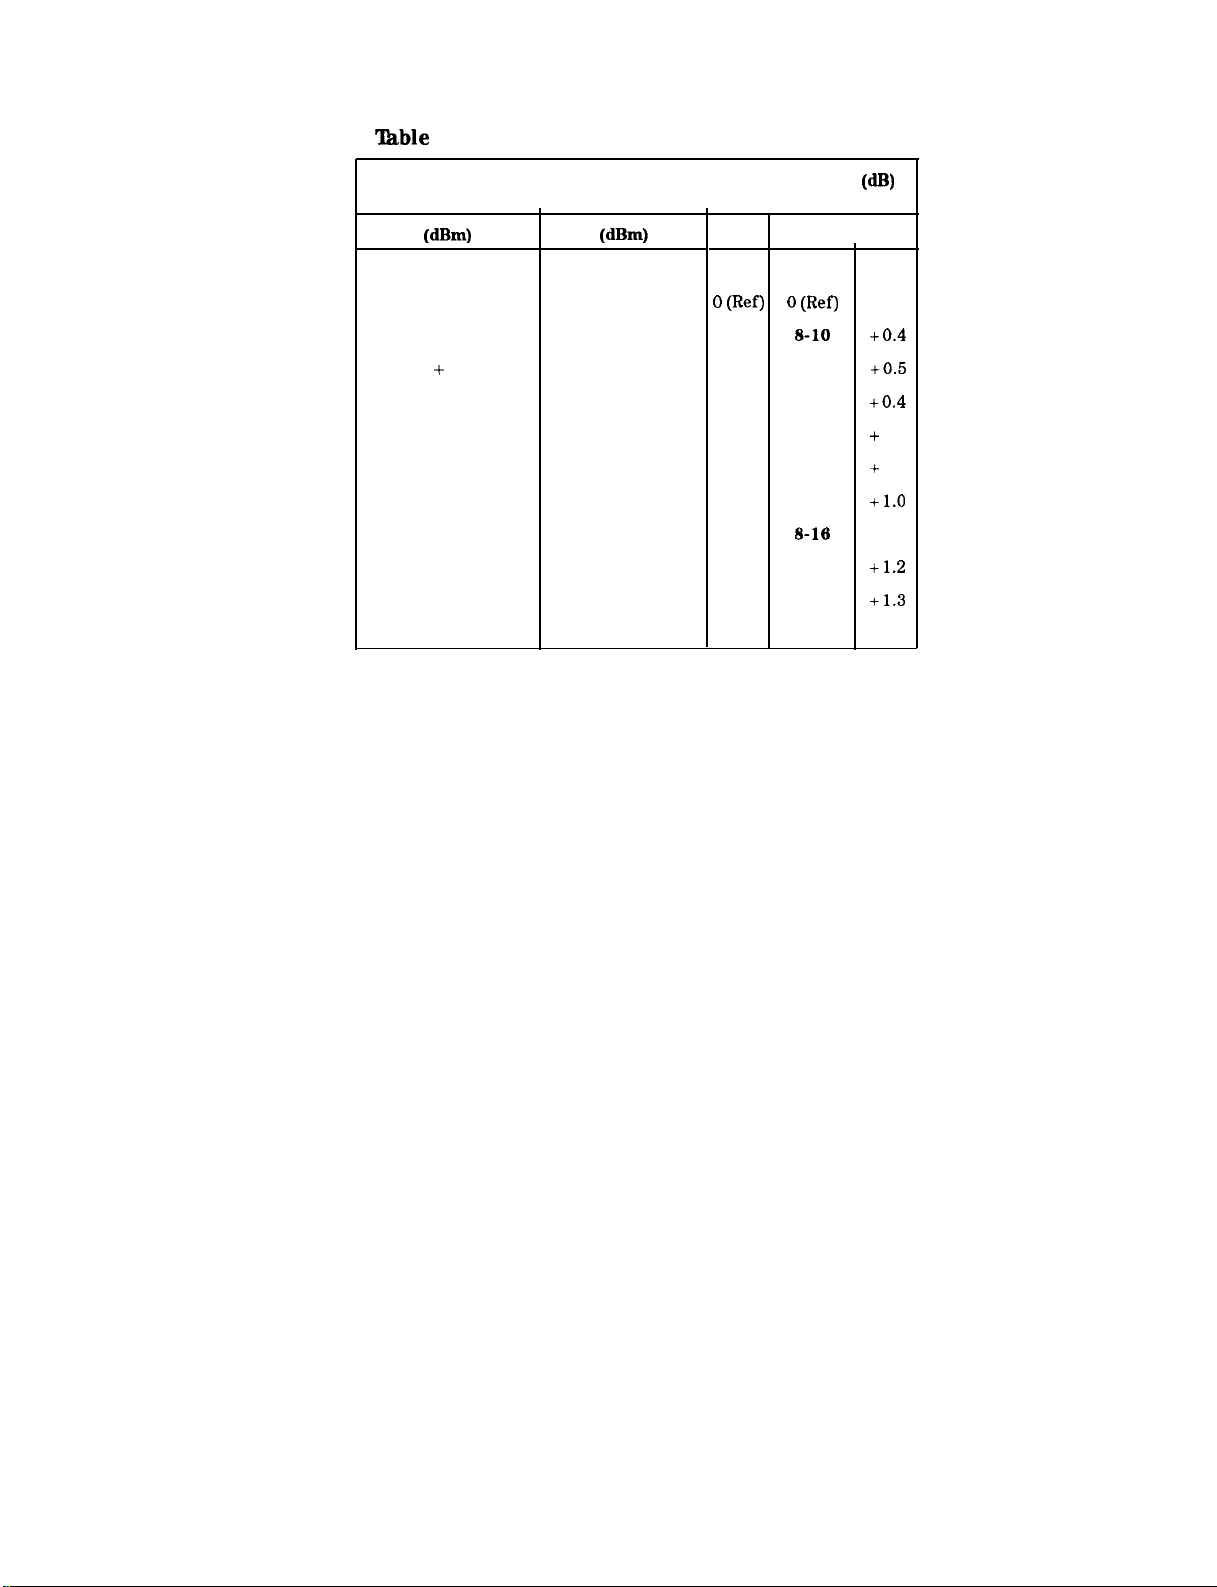
‘able
1-12. Reference Level Accuracy, Linear Mode
8. Reference Level Accuracy
Synthesizer/Level
knerator Amplitude
WW
-10
0
+
10
-20
-30
-40
-50
-60
-70
-80
Spectrum Analyzer
Reference Level
(dBm)
-20
-10
0
-30
-40 -0.5
-50
-60
-70 -1.1
-80
-90
MKR A Reading (dR)
Min.
TR Entry Max.
0 Wfl
-0.4
-0.5
-0.4
-0.8
-1.0
-1.2
-1.3
0 (Ref)
S-10
8-11
8-12
8-13
8-14
8-15
8-16
8-17
8-18
I
0 (Ref)
+0.4
+0.5
+0.4
+
0.5
+
0.8
+l.O
+l.l
+1.2
+1.3
HP 859OD Spectrum Analyzer
Calibrating 1-33
Page 46
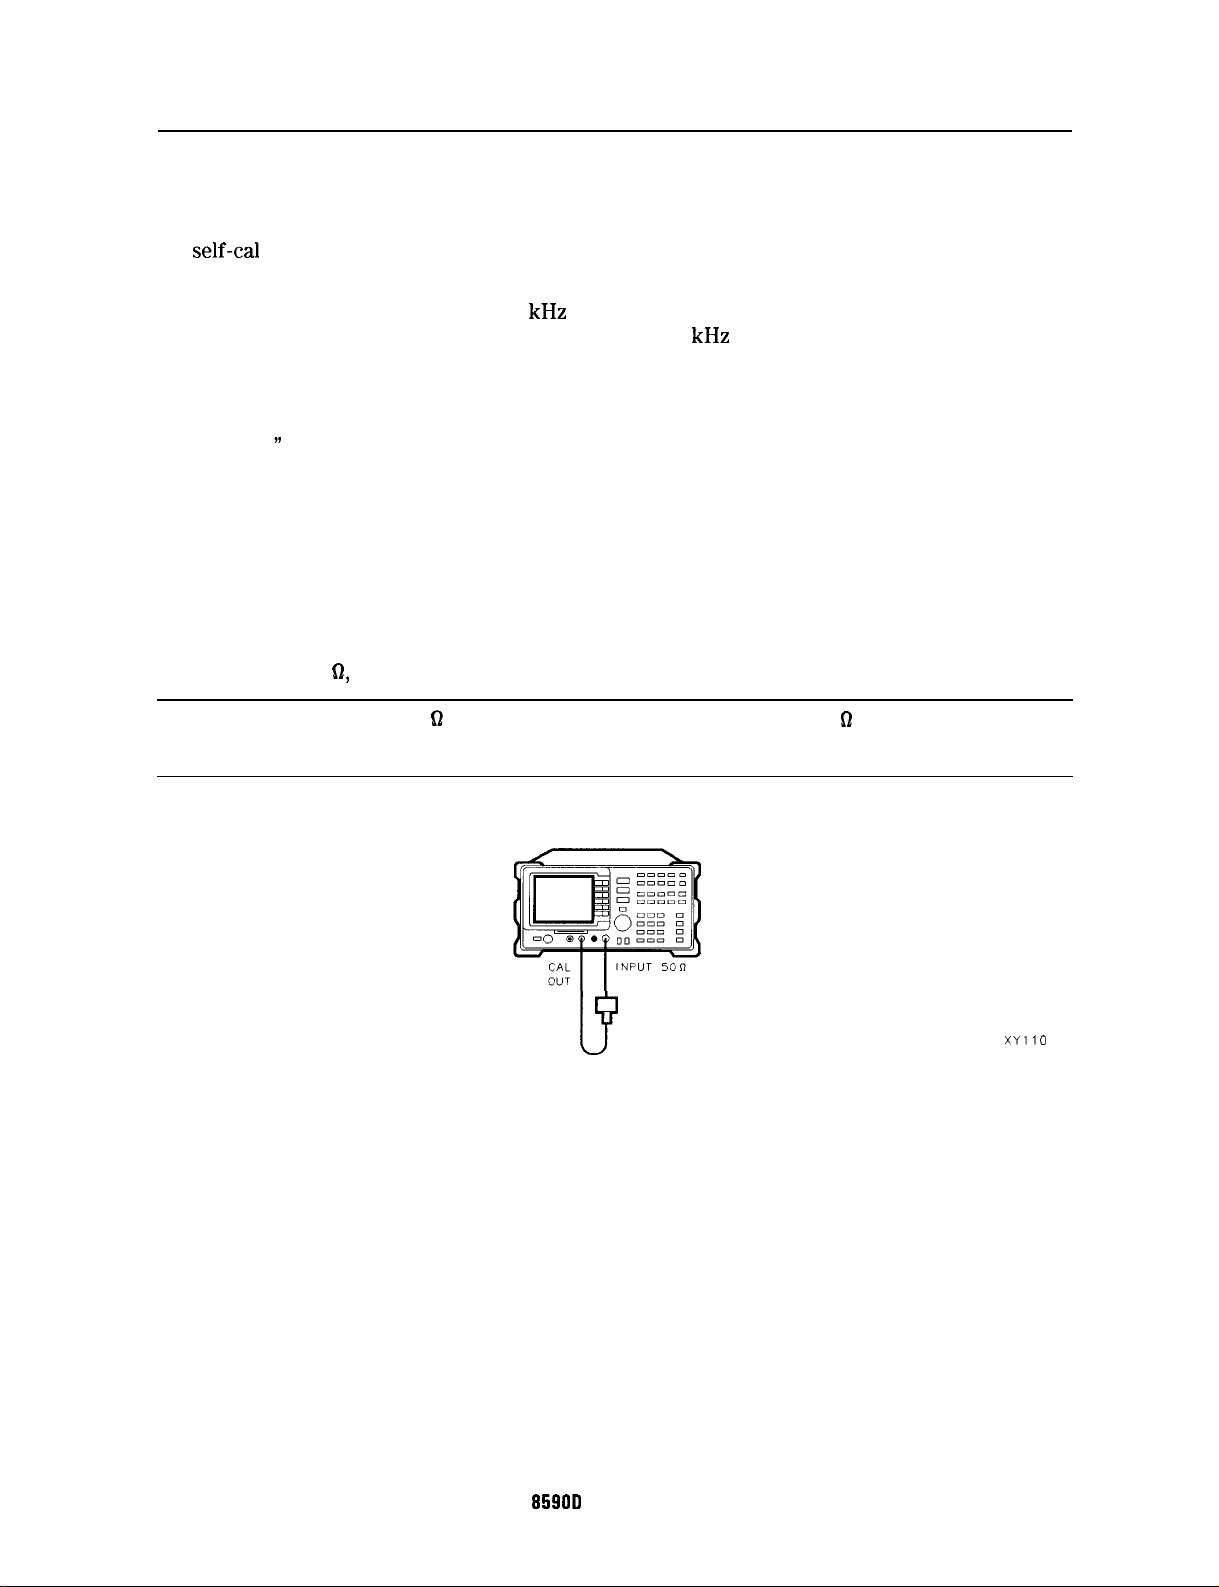
9. Absolute Amplitude Calibration and Resolution Bandwidth Switching Uncertainties
To measure the absolute amplitude calibration uncertainty the input signal is measured after
the
self-Cal
To measure the resolution bandwidth switching uncertainty an amplitude reference is taken
with the resolution bandwidth set to 3
bandwidth is changed to settings between 3 MHz and 1
measured at each setting and compared to the specification. The span is changed as necessary
to maintain approximately the same aspect ratio.
The related adjustment procedure for this performance test is “Crystal and LC Bandwidth
Adjustment.
Equipment Required
Cable, BNC, 23 cm (9 in)
Adapter, Type N (m) to BNC (f)
Additional Equipment for Option 001
Cable, BNC, 75 0, 30 cm (12 in)
routine is finished.
”
kHz
using the marker-delta function. The resolution
kHz
and the amplitude variation is
Caution
Use only 75 61 cables, connectors, or adapters on the 75 Q input of an Option
001 or damage to the input connector will occur.
SPECTRUM ANALYZER
ADAPTER
F
Figure 1-9. Uncertainty Test Setup
XYliO
1-34 Calibrating
HP
8590D
Spectrum Analyzer
Page 47
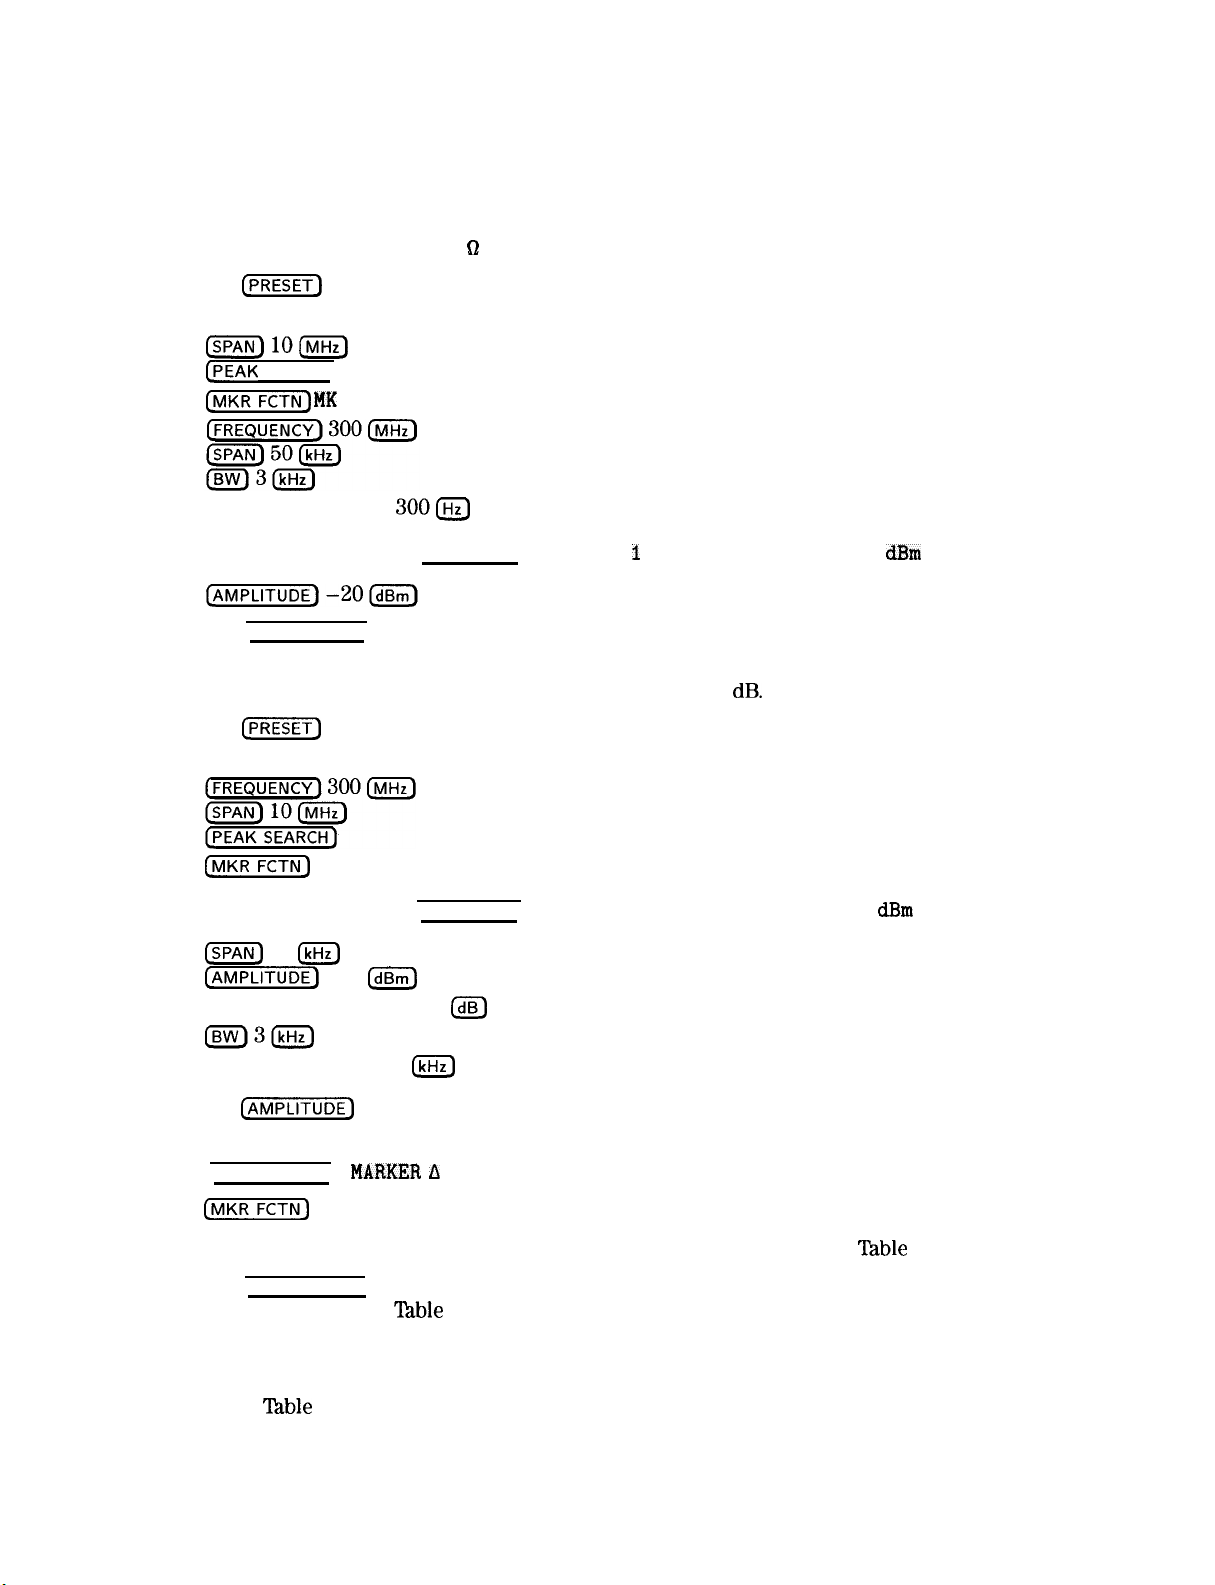
9. Absolute Amplitude Calibration and Resolution Bandwidth Switching Uncertainties
Procedure
1.
Connect the CAL OUT to the spectrum analyzer input using the BNC cable and adapter, as
shown in Figure l-9.
Option 001 only: Use the 75
2.
Press
[PRESET]
on the spectrum analyzer, then wait for the preset routine to finish. Set the
62
cable and omit the adapter.
spectrum analyzer controls by pressing the following keys:
(SPAN)10-
@EAK
SEARCH]
[MKR) MK
VID BW AUTO MAN
Option 001 only: Press [AMPLITUDE], More I of 2 , Amptd Units , then
3.
Press (PEAK SEARCH], then record the marker reading in TR Entry 9-l of the performance test
TRACK ON OFF (ON)
300(%J
clBm
.
record.
The marker reading should be within -20.15 and -19.85
4.
Press
c-1
on the spectrum analyzer, then wait for the preset routine to finish. Set the
dB.
spectrum analyzer controls by pressing the following keys:
(j”I’KRFCTNI)
Option 001 only: Press [AMPLITUDE], More 1 of 2 , Amptd Units , then
m
~AMPLITUDE)
SCALE LOG LIN (LOG) 1
(BW)3(kHz)
VID BW AUTO MAN 1
Press
5.
Cm)
MK TRACK ON OFF (ON)
50
m
-20
m
(dB)
(kHz)
and use the knob to adjust the reference level until the signal appears one
dBm
.
division below the reference level, then press the following keys:
(PEAK SEARCH)
(NlKR]
Set the spectrum analyzer resolution bandwidth and span according to
6.
Press [PEAK SEARCH), then record the MKR A TRK amplitude reading in the performance test
7.
record as indicated in
MARKER
A
MK TRACK ON OFF (OFF)
‘lhble
1-13.
Table
1-13.
The amplitude reading should be within the limits shown.
Repeat steps 6 through 7 for each of the remaining resolution bandwidth and span settings
8.
listed in
Table
1-13.
HP 8590D Spectrum Analyzer
Calibrating 1-35
Page 48
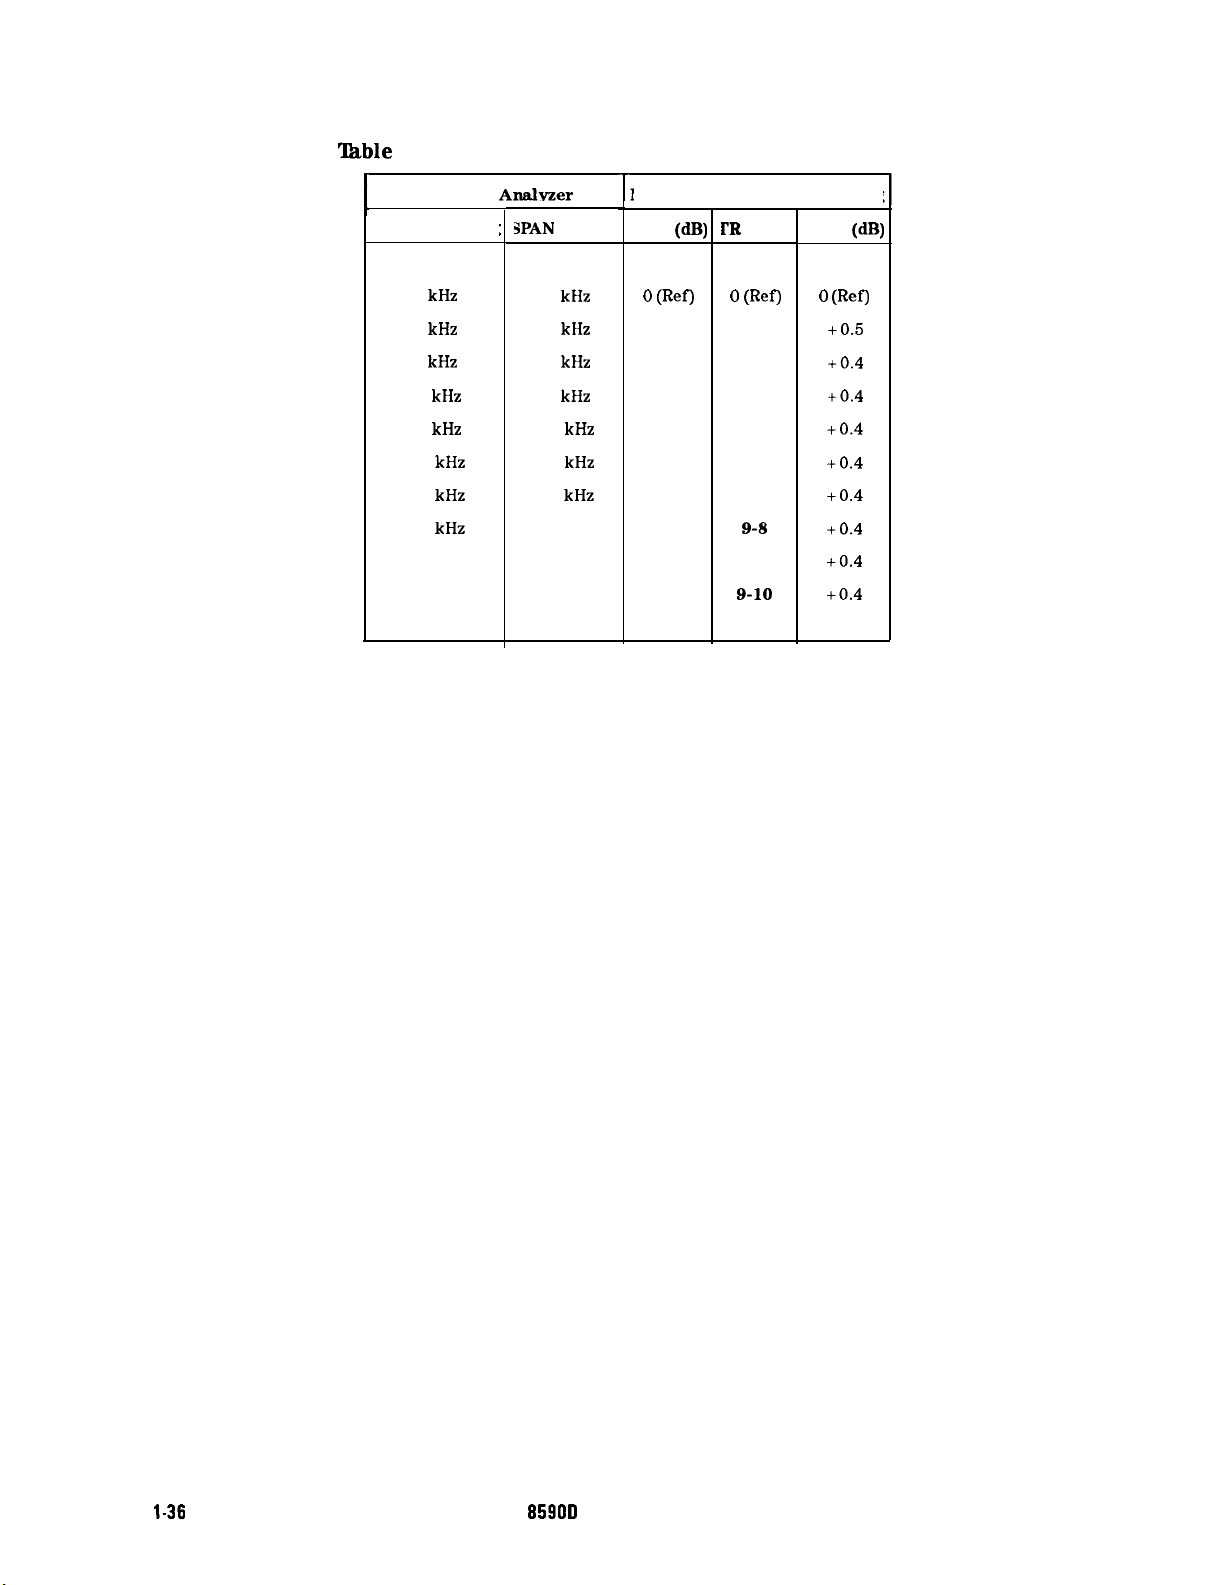
9. Absolute Amplitude Calibration and Resolution Bandwidth Switching Uncertainties
‘Ihble
1-13. Resolution Bandwidth Switching Uncertainty
Spectrum
I
RES BW Setting; !
3
kHz
1 kHz
9
kHz
10
kHz
30
kHz
100 kHz
120 kHz
300
kHz
1 MHz
3 MHz
Analvzer
JPAN
Setting
50
50
50
50
500
500
500
5 MHz
10 MHz
10 MHz
kHz
kHz
kHz
kHz
kHz
kHz
kHz
-L
MKR A TRK Amplitude Reading
Min.
(dB)
l’R
Entry
0 (Ref)
-0.5
-0.4
-0.4
-0.4 9-5
-0.4
-0.4
-0.4
-0.4
-0.4 B-10
0 (Ref)
9-2
9-3
9-4
9-6
9-7
9-8
9-9
Max.
0 (Ref)
+0.5
+0.4
+0.4
+0.4
+0.4
+0.4
+0.4
+0.4
+0.4
(dB)
l-36
Calibrating HP
8590D
Spectrum Analyzer
Page 49

10. Calibrator Amplitude and Frequency Accuracy
10. Calibrator Amplitude and Frequency Accuracy
This test measures the accuracy of the spectrum analyzer CAL OUT signal. The first part of
the test characterizes the insertion loss of a Low Pass Filter (LPF) and 10
harmonics of the CAL OUT signal are suppressed with the LPF before the amplitude accuracy
is measured using a power meter. A frequency counter is used to measure the frequency
accuracy of the CAL OUT signal and the measured frequency is compared to the specification.
The related adjustments for this procedure are:
Calibrator Amplitude Adjustment
Third Converter, 600 MHz Frequency Adjustment
Equipment Required
Microwave frequency counter
Low pass filter, 300 MHz
Synthesized sweeper
Measuring receiver (used as a power meter)
Power meter
Low power sensor with a 50 MHz reference attenuator
Power sensor
Power splitter
10 dB attenuator, Type N (m to f), dc-12.4
Cable, BNC, 121 cm (48 in)
Cable, Type N, 152 cm (60 in)
Adapter, APC 3.5 (f) to Type N (f)
Adapter, Type N (f) to BNC (m) (2 required)
Adapter, Type N (m) to BNC (f)
GHz
Option 010
dB
attenuator. The
Additional Equipment for Option 001
Cable, BNC, 75
Adapter, Type N (f) to Type N (f), 75
Adapter, minimum loss
Adapter, mechanical, 75 Q to 50
Adapter, Type N (f) 75 62 to BNC (m) 75
Q
61
D
t?
HP 859lJD Spectrum Analyzer
Calibrating 1-37
Page 50
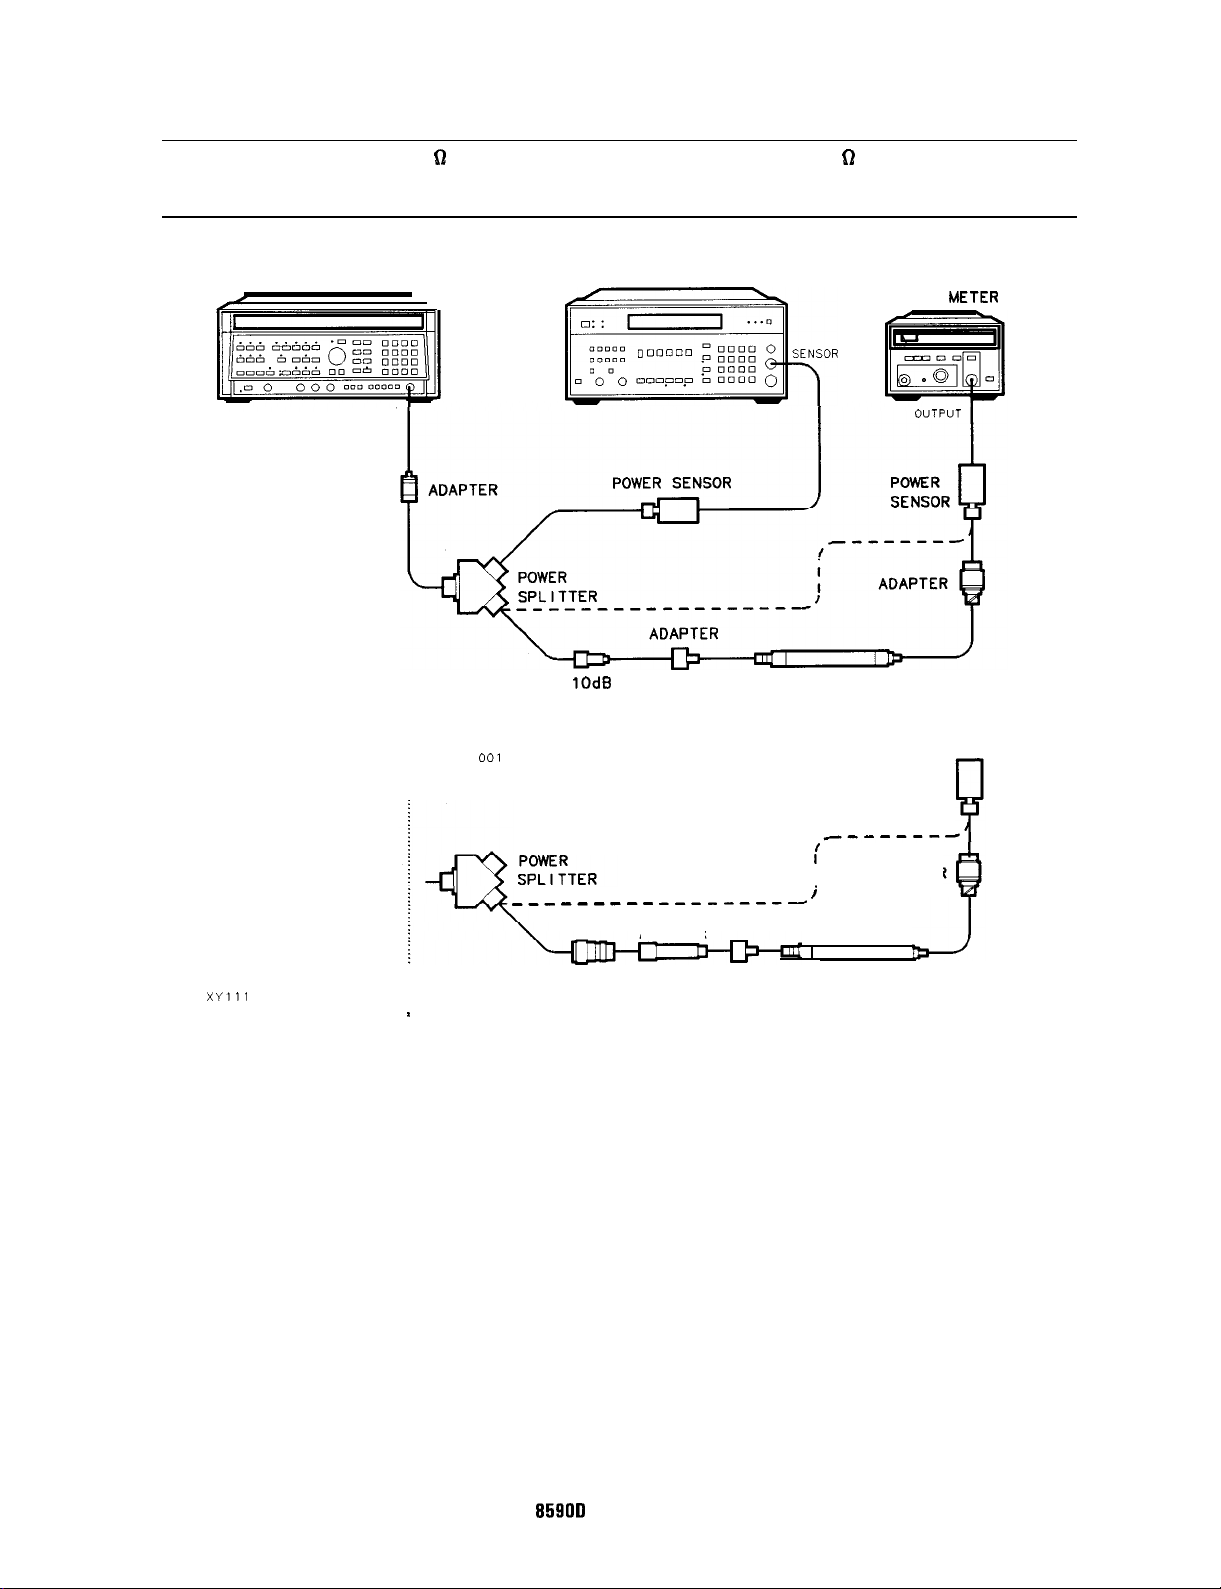
10. Calibrator Amplitude and Frequency Accuracy
Caution
SYNTHESIZED SWEEPER
Use only 75 0 cables, connectors, or adapters on the 75 D input of an Option
001 or damage to the input connector will occur.
MEASURING RECEIVER
POWER METFD
m&OR
RF OUTPUT
TYPE N
CABLE
10dB
ATTENUATOR
LOW PASS
FILTER
XYlll
OPTION
001
ONLY
POWER
SENSOR
:
I
___------
MECHANICAL
/
. . . . . . . . . .
ADAPTER
e------m-
MINIMUM LOSS
ADAPTER
ADAPTER
i
I
ADAPTER
LOW PASS
F I LTER
Figure l-10. LPF Characterization
I
. . . . . . .
1-38 Calibrating
HP
8590D
Spectrum Analyzer
Page 51
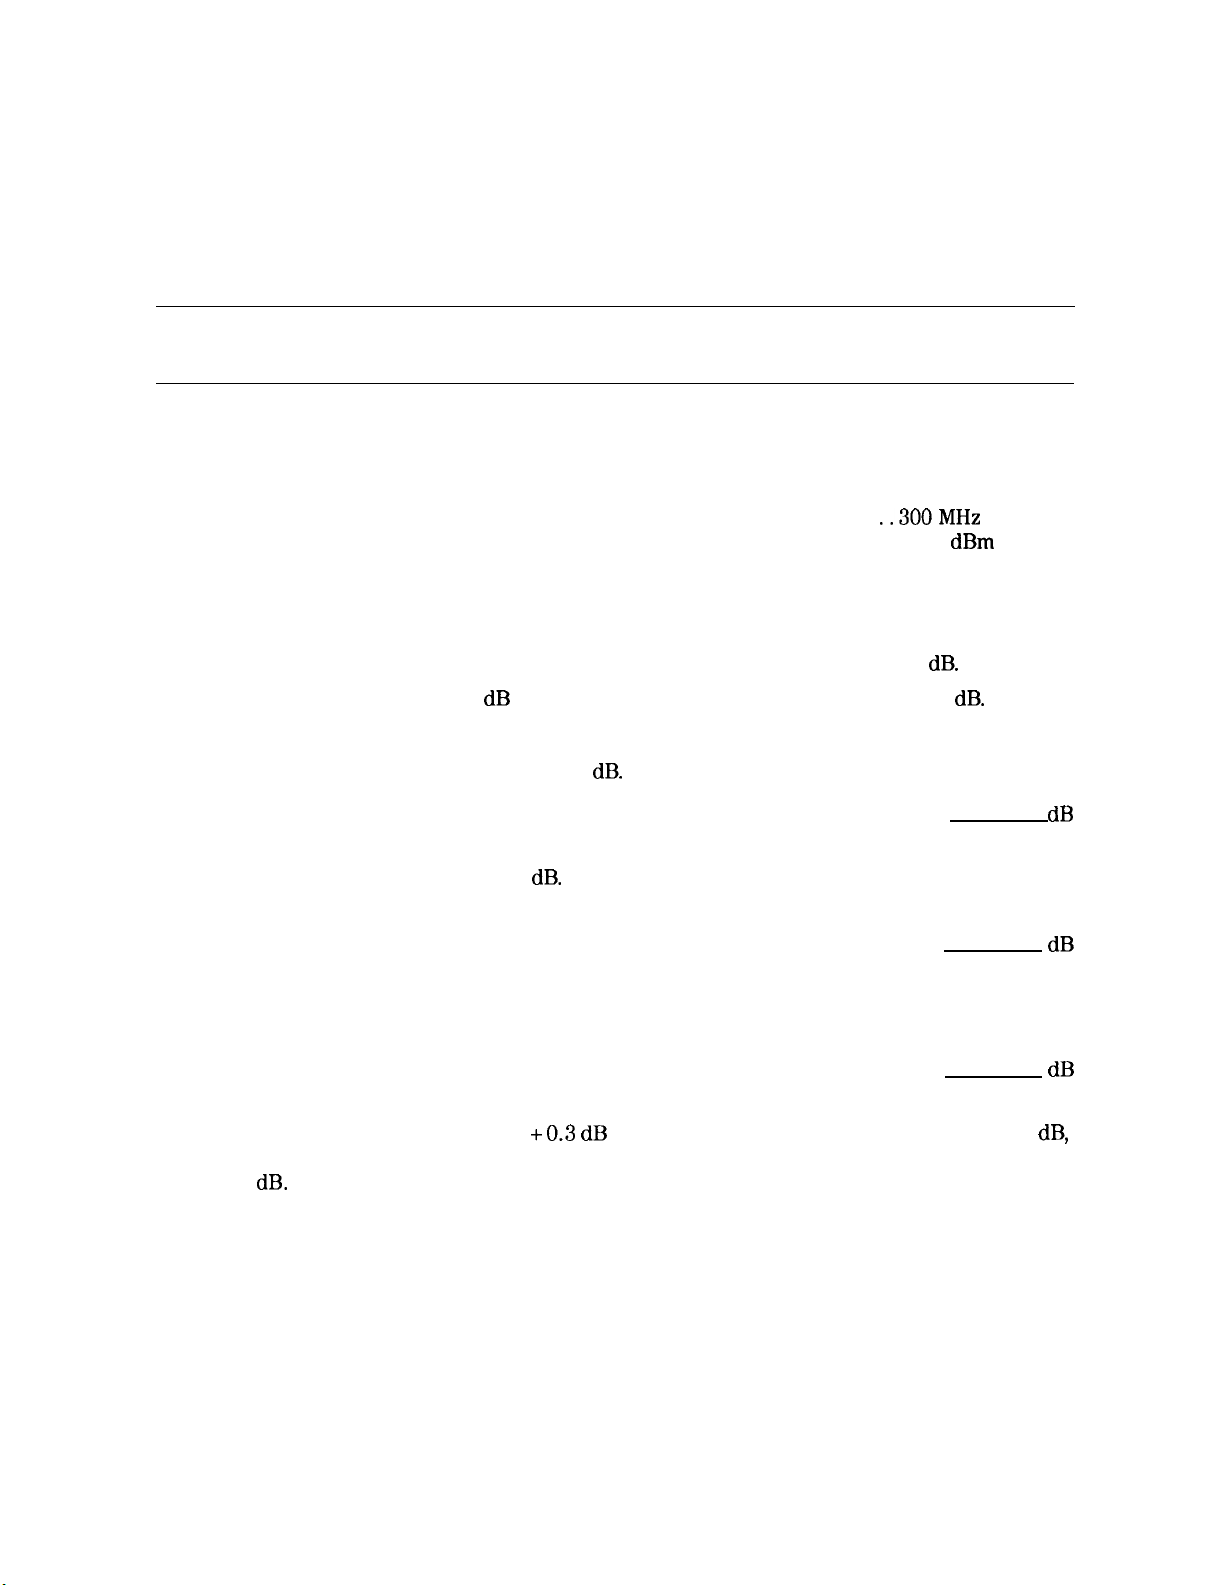
10. Calibrator Amplitude and Frequency Accuracy
Procedure
Part 1: LPF, Attenuator, and Adapter Insertion Loss Characterization
1. Zero and calibrate the measuring receiver and power sensor in LOG mode as described in
the measuring receiver operation manual.
Caution
Do not attempt to calibrate the low power sensor without the reference
attenuator or damage to the low power sensor will occur.
2. Zero and calibrate the power meter and the low power sensor, as described in the power
meter operation manual.
3. Press INSTRUMENT PRESET on the synthesized sweeper. Set the controls as follows:
. . . . . . . . . . . . . . . . . . . . . . . . . . . . . . . . . . . . . . . . . . . . . . . . . . . . . . . . . . . . . .
CW
..300MHz
POWER LEVEL . . . . . . . . . . . . . . . . . . . . . . . . . . . . . . . . . . . . . . . . . . . . . . . . . . . . -15 dBm
4. Connect the equipment as shown in Figure l-10. Connect the low power sensor directly to
the power splitter (bypass the LPF, attenuator, and adapters). Allow the power sensors to
settle before proceeding.
5. On the measuring receiver, press RATIO mode. Power indication should be 0
6. On the power meter, press the dB REF mode key. Power indication should be 0
dB.
dB.
7. Connect the LPF, attenuator and adapters as shown in Figure l-10.
8. Record the measuring receiver reading in
dB.
This is the relative error due to mismatch.
Mismatch Error
9. Record the power meter reading in
dB.
This is the relative uncorrected insertion loss of the
LPF, attenuator, and adapters.
dB
Uncorrected Insertion Loss
10. Subtract the Mismatch Error (step 8) from the Uncorrected Insertion Loss (step 9). This is
the Corrected Insertion Loss.
Corrected Insertion Loss
Example: If the Mismatch Error is
+0.3 dB
and the Uncorrected Insertion Loss is -10.2
subtract the mismatch error from the insertion loss to yield a corrected reading of
-10.5
dB.
HP 85900 Spectrum Analyzer
Calibrating 1-39
dB
dB
dB,
Page 52
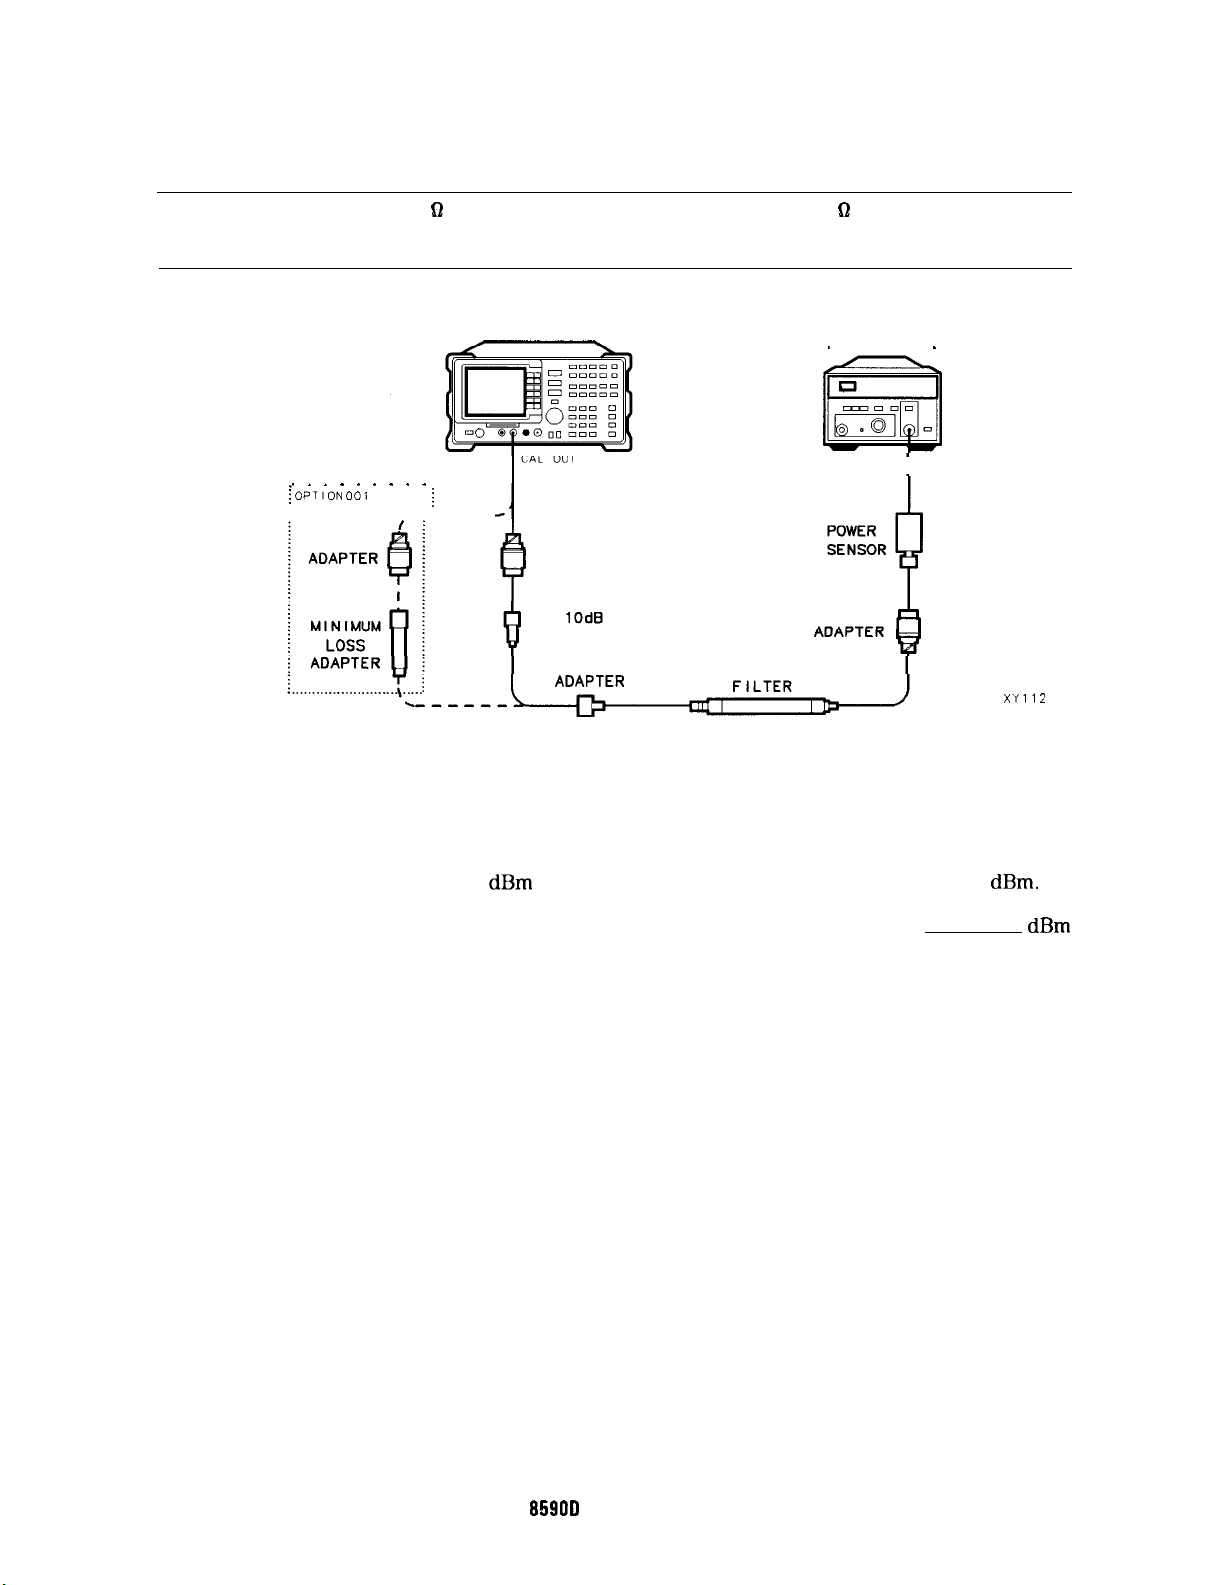
10. Calibrator Amplitude and Frequency Accuracy
Part 2: Calibrator Amplitude Accuracy
Caution
,_ . . . . . . . .
~OPTION 001
Use only 75 62 cables, connectors, or adapters on the 75 62 input of an Option
001 or damage to the input connector will occur.
SPECTRUM ANALYZER
ONLY
;
A----
ADAPTER
ATTENUATOR
LOW PASS
Figure l-11. Calibrator Amplitude Accuracy Test Setup
POWER METER
OUTPUT
I
XYli2
11. Connect the equipment as shown in Figure l-l 1. The spectrum analyzer should be
positioned so that the setup of the adapters, LPF, and attenuator do not bind. It may be
necessary to support the center of gravity of the devices.
12. On the power meter, press the
dBm
mode key. Record the power meter Reading in
Power Meter Reading
dBm.
dBm
l-40 Calibrating
HP 859OD Spectrum Analyzer
Page 53
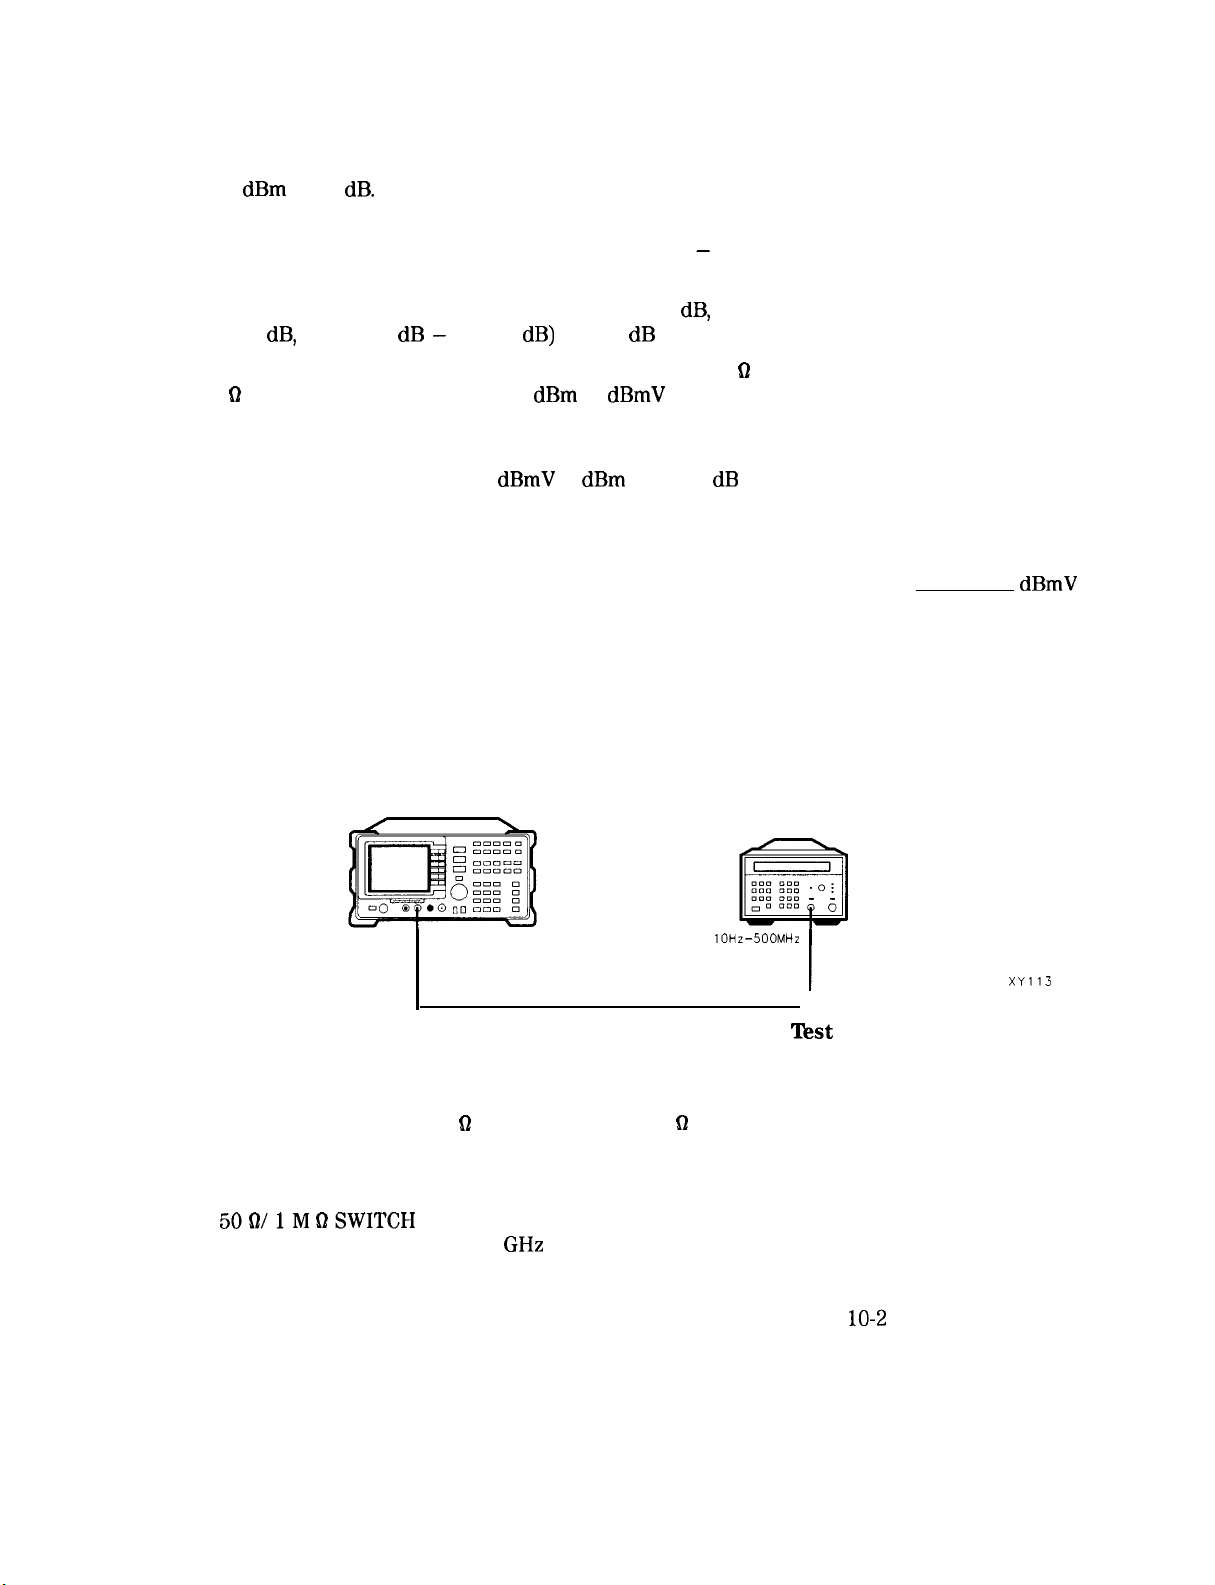
10. Calibrator Amplitude and Frequency Accuracy
13. Subtract the Corrected Insertion Loss (step 10) from the power meter Reading (step 12) and
record this value as TR Entry 10-l in the performance test record. The CAL OUT should be
-20
dBm
f0.4
dB.
CAL OUT Power = Power Meter Reading - Corrected Insertion Loss
Example: If the Corrected Insertion Loss is -10.0
is -30
Option 001 only:
50 D instruments. To convert from
dB,
then -30 dB - (-10.0
The CAL OUT power measured on 75 62 instruments will be the same as
dB)
dBm
= -20
to
dBmV
dB,
and the measuring receiver reading
dB
use the following equation. Record this
value as TR Entry 10-l in the performance test record.
dBmV
=
dBm
+ 48.75
dB
Example: -20 + 48.75 = 28.75.
CAL OUT Power
Skip Part 3 if your spectrum analyzer is equipped with Option 013 and do performance test
number 22 “10 MHz Reference Output Accuracy” instead.
Part 3: Calibrator Frequency Accuracy
SPECTRUM ANALYZER
FREQUENCY COUNTER
dBmV
CAL OUT
Figure 1-12. Calibrator Frequency Accuracy Test Setup
lOti-500MHz
INPUT
1
14. Connect the equipment as shown in Figure 1-12.
Option 001 only: Use a 75
Q
cable instead of a 50 62 cable.
15. Set the frequency counter controls as follows:
SAMPLERATE
50f?/lM DSWITCH
10 Hz-500 MHz/500 MHz-26.5
. . . . . . . . . . . . . . . . . . . . . . . . . . . . . . . . . . . . . . . . . . . . . . . . . . . . Midrange
. . . . . . . . . . . . . . . . . . . . . . . . . . . . . . . . . . . . . . . . . . . . . . . . . ...5061
GHz
SWITCH
. . . . . . . . . . . . . . . . . . . . . 10 Hz-500 MHz
16. Wait for the frequency counter to settle. This may take two or three gate times.
17. Read the frequency counter display. Record this value as TR Entry
10-2
in the performance
test record.
HP 859OD Spectrum Analyzer
Calibrating 1-41
XY113
Page 54

11. Frequency Response
The output of the synthesized sweeper is fed through a power splitter to a power sensor and
the spectrum analyzer. The synthesized sweeper’s power level is adjusted at 300 MHz to place
the displayed signal at the spectrum analyzer center horizontal graticule line. The measuring
receiver, used as a power meter, is placed in RATIO mode. At each new sweeper frequency and
spectrum analyzer center frequency setting, the sweeper’s power level is adjusted to place the
signal at the center horizontal graticule line. The measuring receiver displays the inverse of the
frequency response relative to 300 MHz (CAL OUT frequency).
Testing the flatness of Option 001, INPUT 75
61,
is accomplished by first characterizing the
system flatness.
The related adjustment for this procedure is the “Frequency Response Error Correction.”
Equipment Required
Synthesized sweeper
Measuring receiver (used as a power meter)
Synthesizer/level generator
Power sensor
Power splitter
Adapter, Type N (f) to APC 3.5 (f)
Adapter, Type N (m) to Type N (m)
Cable, BNC, 122 cm (48 in)
Cable, Type N, 183 cm (72 in)
Additional Equipment for Option 001
Power meter
Power sensor
Adapter, Type N (f) 75
Adapter, Type N (m) to BNC (m), 75
Cable, BNC, 120 cm (48 in) 75
0
to Type N (m) 50
D
Q
62
1-42 Calibrating
HP 859OD Spectrum Analyzer
Page 55
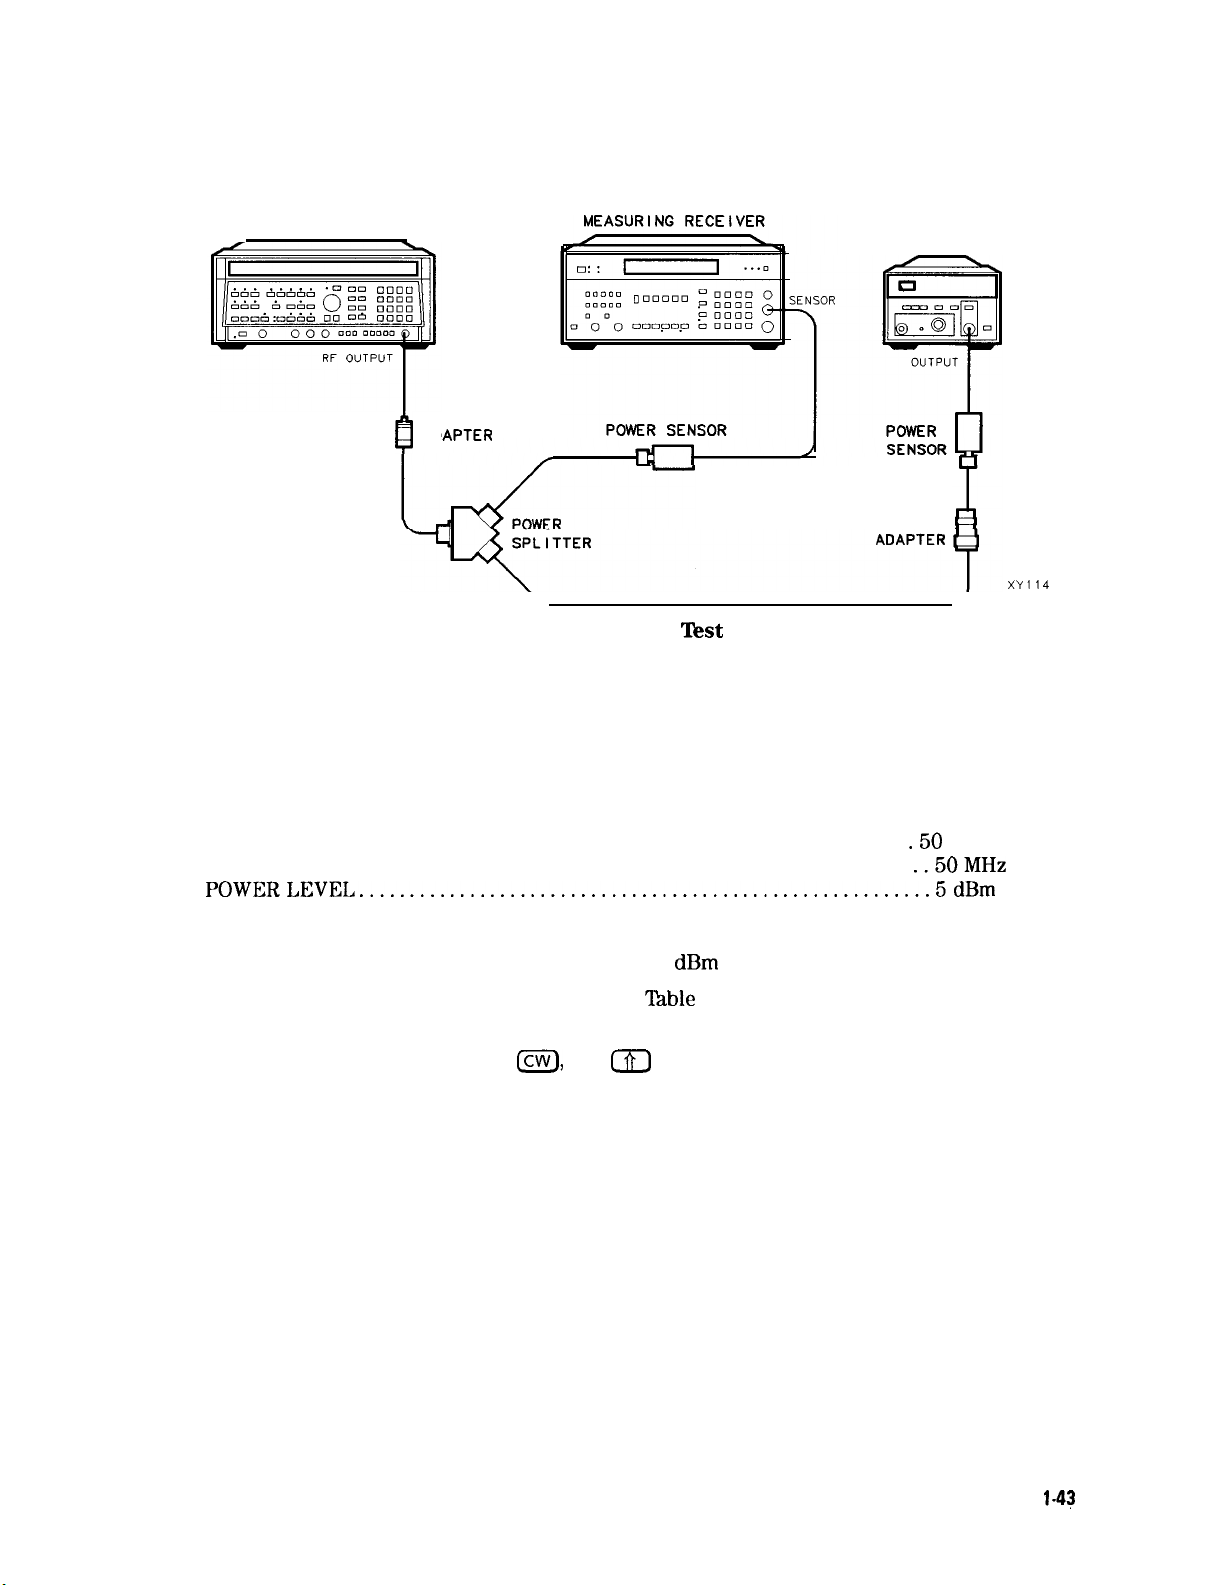
11. Frequency Response
System Characterization Procedure for Option 001
SYNTHESIZED SWEEPER
0
TYPE N
CABLE
ASSY
Figure 1-13. System Characterization Test Setup (Option 001)
AD
‘APTER
POWER METER
MECHANICAL
XY114
1. Zero and calibrate the measuring receiver and the power sensor as described in the
measuring receiver operation manual.
2. Zero and calibrate the power meter and the power sensor as described in the power meter
operation manual.
3. Press INSTRUMENT PRESET on the synthesized sweeper then set the controls as follows:
CW . . . . . . . . . . . . . . . . . . . . . . . . . . . . . . . . . . . . . . . . . . . . . . . . . . . . . . . . . . . . . . . . . .
FREQSTEP . . . . . . . . . . . . . . . . . . . . . . . . . . . . . . . . . . . . . . . . . . . . . . . . . . . . . . . . .
.50
MHz
..50MHz
POWERLEVEL.........................................................5dBm
4. Connect the equipment as shown in Figure 1-13.
5. Adjust the synthesized sweeper power level for a 0
6. Record the power meter reading in Column 4 of
dBm
reading on the measuring receiver.
‘Iable
1-14, taking into account the Cal
Factors of both the power sensors.
7. On the synthesized sweeper, press
Icw),
and
m
(step-up key), to step through the
remaining frequencies listed in Table 1-14. At each new frequency repeat steps 5 and 6,
entering each power sensor’s Cal Factor into the respective power meter.
HP 85900 Spectrum Analyzer
Calibrating
1-43
Page 56
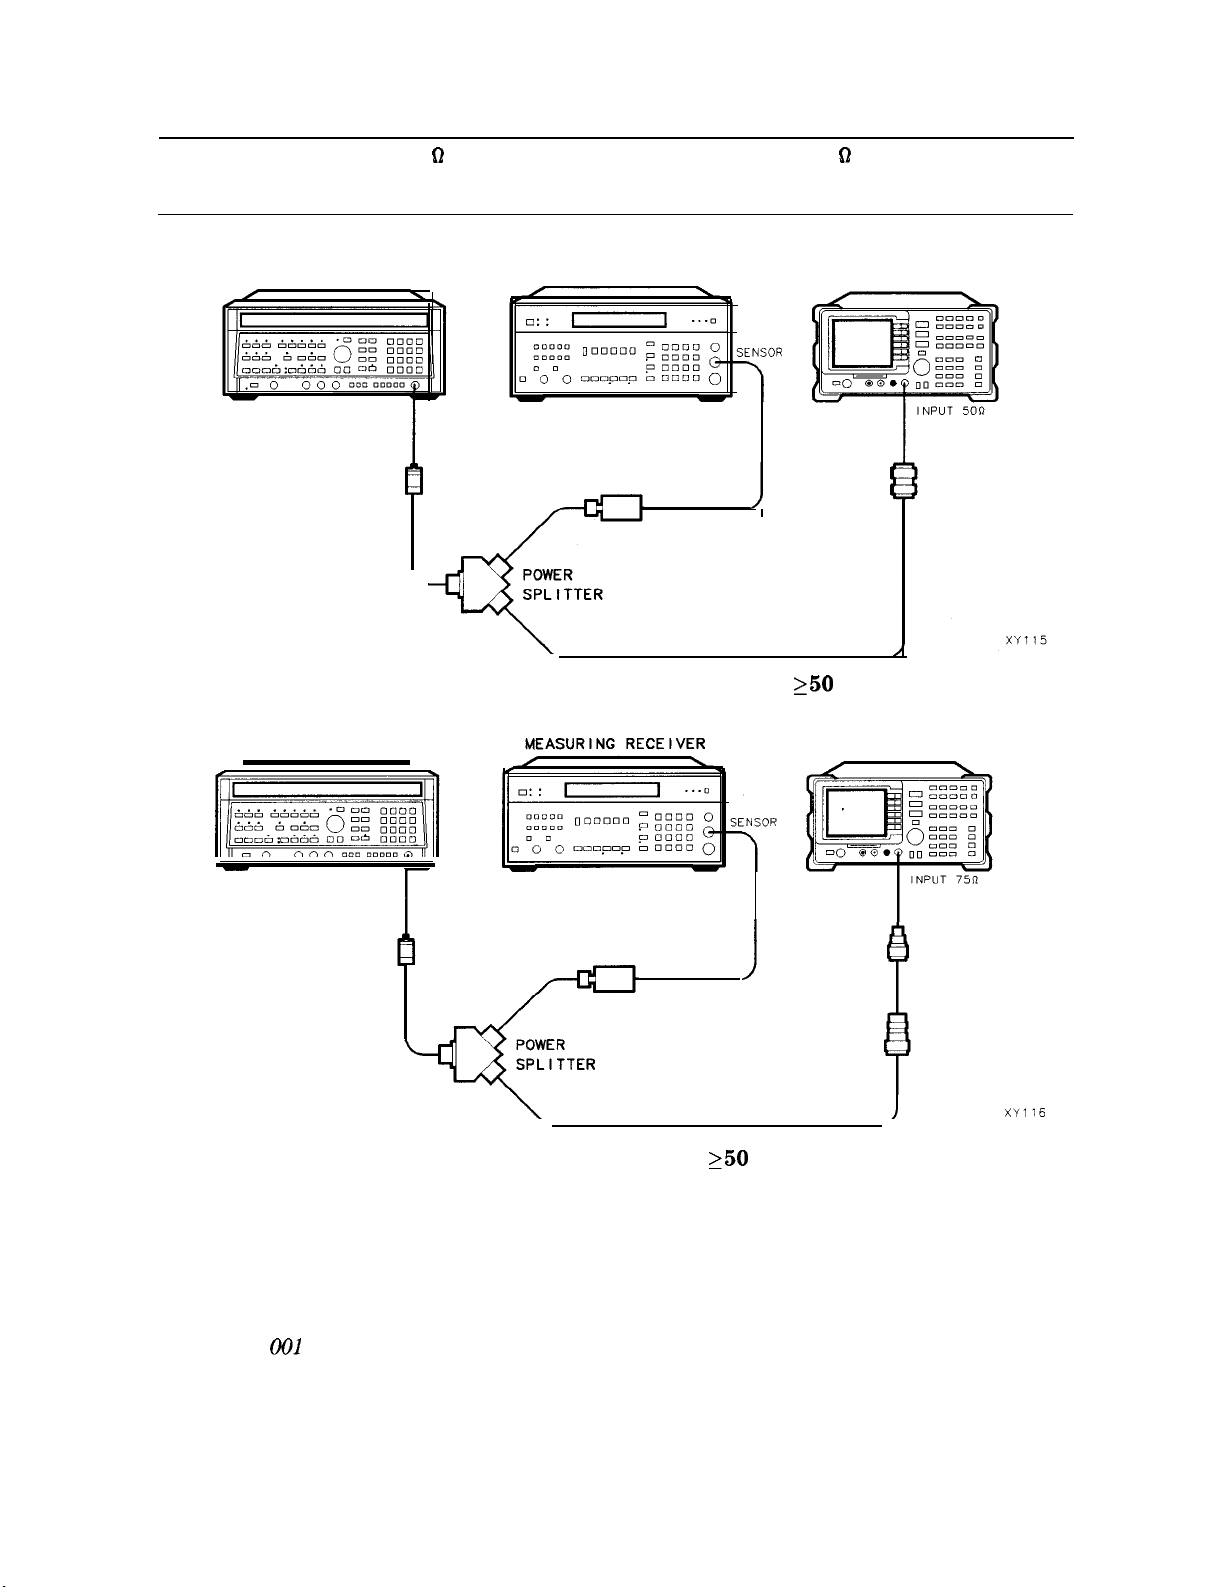
11. Frequency Response
Caution
SYNTHESIZED SWEEPER
Use only 75 61 cables, connectors, or adapters on the 75 61 input of an Option
001 or damage to the input connector will occur.
RF OUTPUT
ADAPTER
MEASURING RECEIVER
POWER SENSOR
SPECTRUM ANALYZER
ADAPTER
1
I
TYPE N
CABLE
ASSY
Figure 1-14. Frequency Response Test Setup,
250
MHz
SYNTHESIZED SWEEPER
-
RF OUTPUT
SPECTRUM ANALYZER
r
ADAPTER
TYPE
N
CABLE
ASSY
Figure 1-15. Frequency Response Test Setup,
POWER SENSOR
MECHANICAL
ADAPTER
250
MHz, for Option 001
Procedure
1. Zero and calibrate the measuring receiver and the power sensor in log mode as described in
the measuring receiver operation manual.
2. Connect the equipment as shown in Figure 1-14.
ADAPTER
Option
1-44 Calibrating HP 8590D Spectrum Analyzer
001
only: Refer to Figure l-15.
Page 57
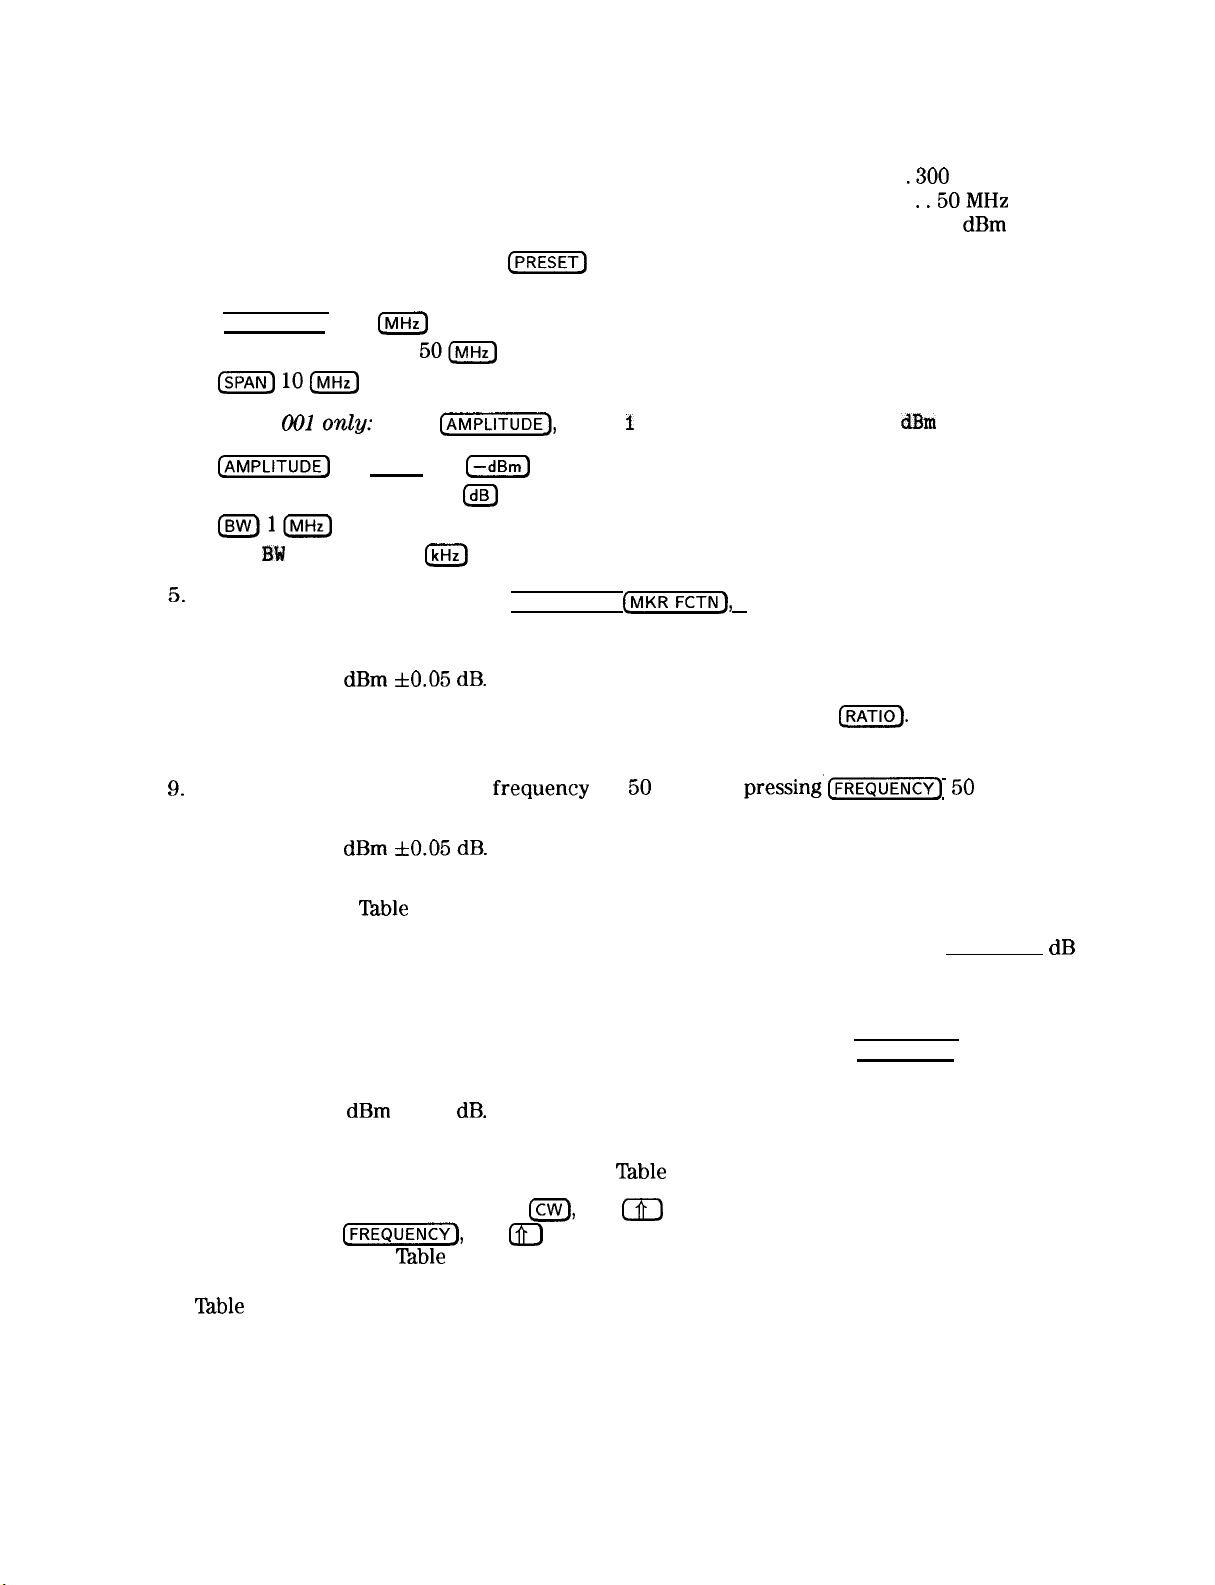
11. Frequency Response
3. Press INSTRUMENT PRESET on the synthesized sweeper and set the controls as follows:
CW
. . . . . . . . . . . . . . . . . . . . . . . . . . . . . . . . . . . . . . . . . . . . . . . . . . . . . . . . . . . . . . .
FREQSTEP . . . . . . . . . . . . . . . . . . . . . . . . . . . . . . . . . . . . . . . . . . . . . . . . . . . . . . . .
.300
MHz
..50MHz
POWERLEVEL. . . . . . . . . . . . . . . . . . . . . . . . . . . . . . . . . . . . . . . . . . . . . . . . . . . . . -8 dBm
4. On the spectrum analyzer, press
[PRESETI)
and wait for the preset to finish. Set the spectrum
analyzer controls as follows:
(FREQUENCY) 300
CF STEP AUTO MAN
LhnHz)
50LNIHz)
ISPAN) 1oIhnHz)
(Option
(.jmmEg
SCALE LOG LIN (LOG) 1
001 on&:
Press
cm’,
10 (-dem)
(XJ
More i of 2, Amptd Units , then
dBm
.
(BW)l[MHz)
VI5 3W AUTO #AN 3
5.
On the spectrum analyzer, press (PEAK SEARCH],
IkHz)
(MKR),
then MK TRACK ON OFF (ON).
6. Adjust the synthesized sweeper power level for a MKR-TRK amplitude
reading of -14
7. Set the sensor Cal Factor on the measuring receiver and then press
dBm f0.05 dB.
m.
8. Set the synthesized sweeper CW to 50 MHz.
9.
Set the spectrum analyzer Center
frequency
to
50
MHz by
pressing’(FREQUENCY) 50
(MHz).
10. Adjust the synthesized sweeper power level for a spectrum analyzer MKR-TRK amplitude
reading of -14
dBm f0.05 dB.
11. Set the sensor Cal Factor on the measuring receiver and record the negative of the power
ratio here and in
‘lhble
1-14.
Negative of Measuring Receiver Reading at 50 MHz
dB
12. Set the synthesized sweeper CW to 100 MHz.
13. Set the spectrum analyzer center frequency to 100 MHz by pressing [FREQUENCY) 100 (MHz).
14. Adjust the synthesized sweeper power level for a spectrum analyzer MKR-TRK amplitude
reading of -14
dBm
f0.05
dB.
15. Set the sensor Cal Factor on the measuring receiver and record the negative of the power
ratio displayed on the measuring receiver in
16. On the synthesized sweeper, press
analyzer, press
frequencies listed in
I-],
Table
and a (step-up key), to step through the remaining
1-14. At each new frequency repeat steps 14 through 16,
Icw),
and
‘lhble
1-14 as the Error Relative to 300 MHz.
m
(step-up key), and on the spectrum
entering the power sensor’s Cal Factor into the measuring receiver as indicated in
Table
1-14.
HP 8590D Spectrum Analyzer
Calibrating 1-45
Page 58
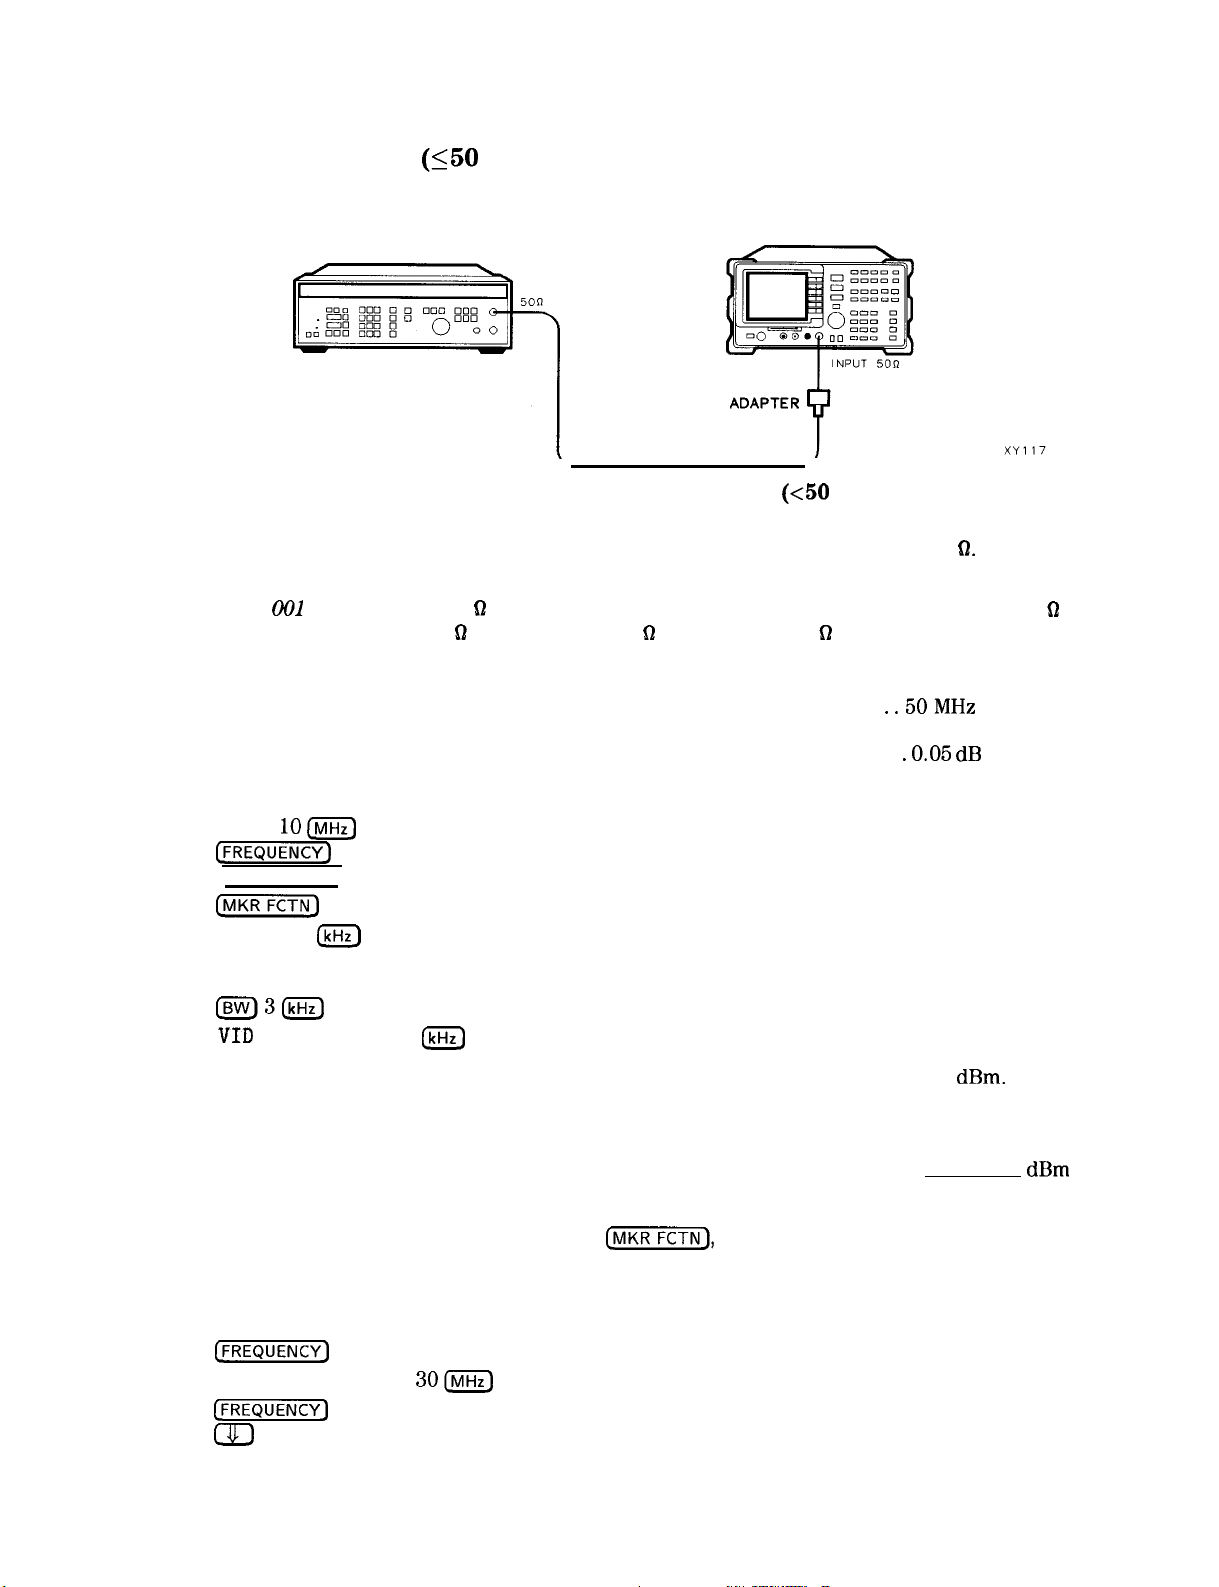
11. Frequency Response
Frequency Response,
SYNTHESIZER/LEVEL
GENERATOR
Figure 1-16. Frequency Response Test Setup (~50 MHz)
17.
Using a cable, connect the synthesizer/level generator directly to the INPUT 50 9. Refer to
(150
MHz)
SPECTRUM ANALYZER
Figure 1-16.
Option
001
only: Using a 75
9
cable, connect the synthesizer/level generator from the 75
OUTPUT to the INPUT 75 Q and set the 50-75 n switch to the 75 61 position.
Set the synthesizer/level generator controls as follows:
FREQUENCY
. . . . . . . . . . . . . . . . . . . . . . . . . . . . . . . . . . . . . . . . . . . . . . . . . . . . . .
..50MHz
AMPLITUDE . . . . . . . . . . . . . . . . . . . . . . . . . . . . . . . . . . . . . . . . . . . . . . . . . . . . . . . -15dBm
AMPTD INCR. . . . . . . . . . . . . . . . . . . . . . . . . . . . . . . . . . . . . . . . . . . . . . . . . . . . . . . .
.0.05
dB
61
18.
On the spectrum analyzer press the following keys:
(SPAN)
(FREQUENCY)
(PEAK SEARCH)
(jjFCTN)
(SPAN) 100
10INIHz)
50 [MHz)
MK TRACK ON OFF (ON)
(kHz)
Wait for AUTO ZOOM to finish, then press the following spectrum analyzer keys:
lsw)3(kHz)
VIII BW AUTO MAN 1
19.
Adjust the synthesizer/level generator Amplitude until the MKR-TRK reads -14
(kHz)
corresponds to the amplitude at 50 MHz recorded in step 11. Record the synthesizer/level
generator amplitude below.
Amplitude Setting (50 MHz)
20.
On the spectrum analyzer, press MARKER A ,
21.
Set the synthesizer/level generator frequency to 20 MHz.
22.
On the spectrum analyzer, press the following keys:
(FREQUENCY)
CF STEP AUTO MAN
(FREQUENCY)
(-J-J
(step-down key)
3OIrvlHz)
t-1,
then MK TRACK ON OFF (ON).
dBm.
This
dBm
l-46 Calibrating HP 9590D Spectrum Analyzer
Page 59

11. Frequency Response
23. Adjust the synthesizer/level generator amplitude for a MKR A-TRK amplitude reading of
0.00 ±0.05
dB.
Record this amplitude setting in
‘Ihble
1-15 in Column 2 at 20 MHz.
24. Repeat steps 21 through 23 for each of the frequencies listed in Table 1-15. Change the
spectrum analyzers’s center frequency step size to the relative frequency change for each
new frequency (for example, use 10 MHz CF STEP size when changing from 20 MHz to
10 MHz).
Option 001 only:
When measuring the 50
Do not test below 1 MHz.
kHz
center-frequency flatness and below, there will be two signals
on screen, the LO feedthrough and the signal from the synthesizer/level generator. Ensure
that the marker is on the signal from the synthesizer/level generator (to the right of the LO
feed through).
25. For each of the frequencies in
‘Ihble
1-15, subtract the synthesizer/level generator
Amplitude Reading (column 2) from the synthesizer/level generator Amplitude setting
(50 MHz) recorded in step 19. Record the result as the Response Relative to 50 MHz
(column 3) in
26. Add to each of the Response Relative to 50 MHz entries in
‘lhble
1-15.
Table
1-15 the measuring
receiver Reading at 50 MHz recorded in step 11. Record the results as the Response
Relative to 300 MHz (column 4) in Table 1-15.
27. Option 001 only: Starting with the error at 50 MHz, subtract Column 4 (System Error) to
Column 2 (Error Relative to 300 MHz) and record the result in Column 5 (Corrected Error
Relative to 300 MHz).
Test
Results
Perform the following steps to verify the frequency response of the spectrum analyzer.
1. Enter the most positive number from
2. Enter the most positive number from
(Option 001 only:
Use column 5.)
‘fable
1-15, column 4:
Table
1-14, column 2:
dB
dB
3. Record the more positive of numbers from steps 1 and 2 in TR Entry 11-l of the
performance test record.
4. Enter the most negative number from Table 1-15, column 4:
5. Enter the most negative number from
(Option
001
only: Use column 5.)
Table
1-14, column 2:
6. Record the more negative of numbers from steps 4 and 5 in TR Entry 1 l-2 of the
performance test record.
7. Subtract the results of step 6 from the results of step 3. Record this value in TR Entry 11-3
of the performance test record.
The result should be less than 2.0
The absolute values in steps 3 and 6 should be less than 1.5
dB.
dB.
HP 8590D Spectrum Analyzer
Calibrating 1-47
dB
dB
Page 60
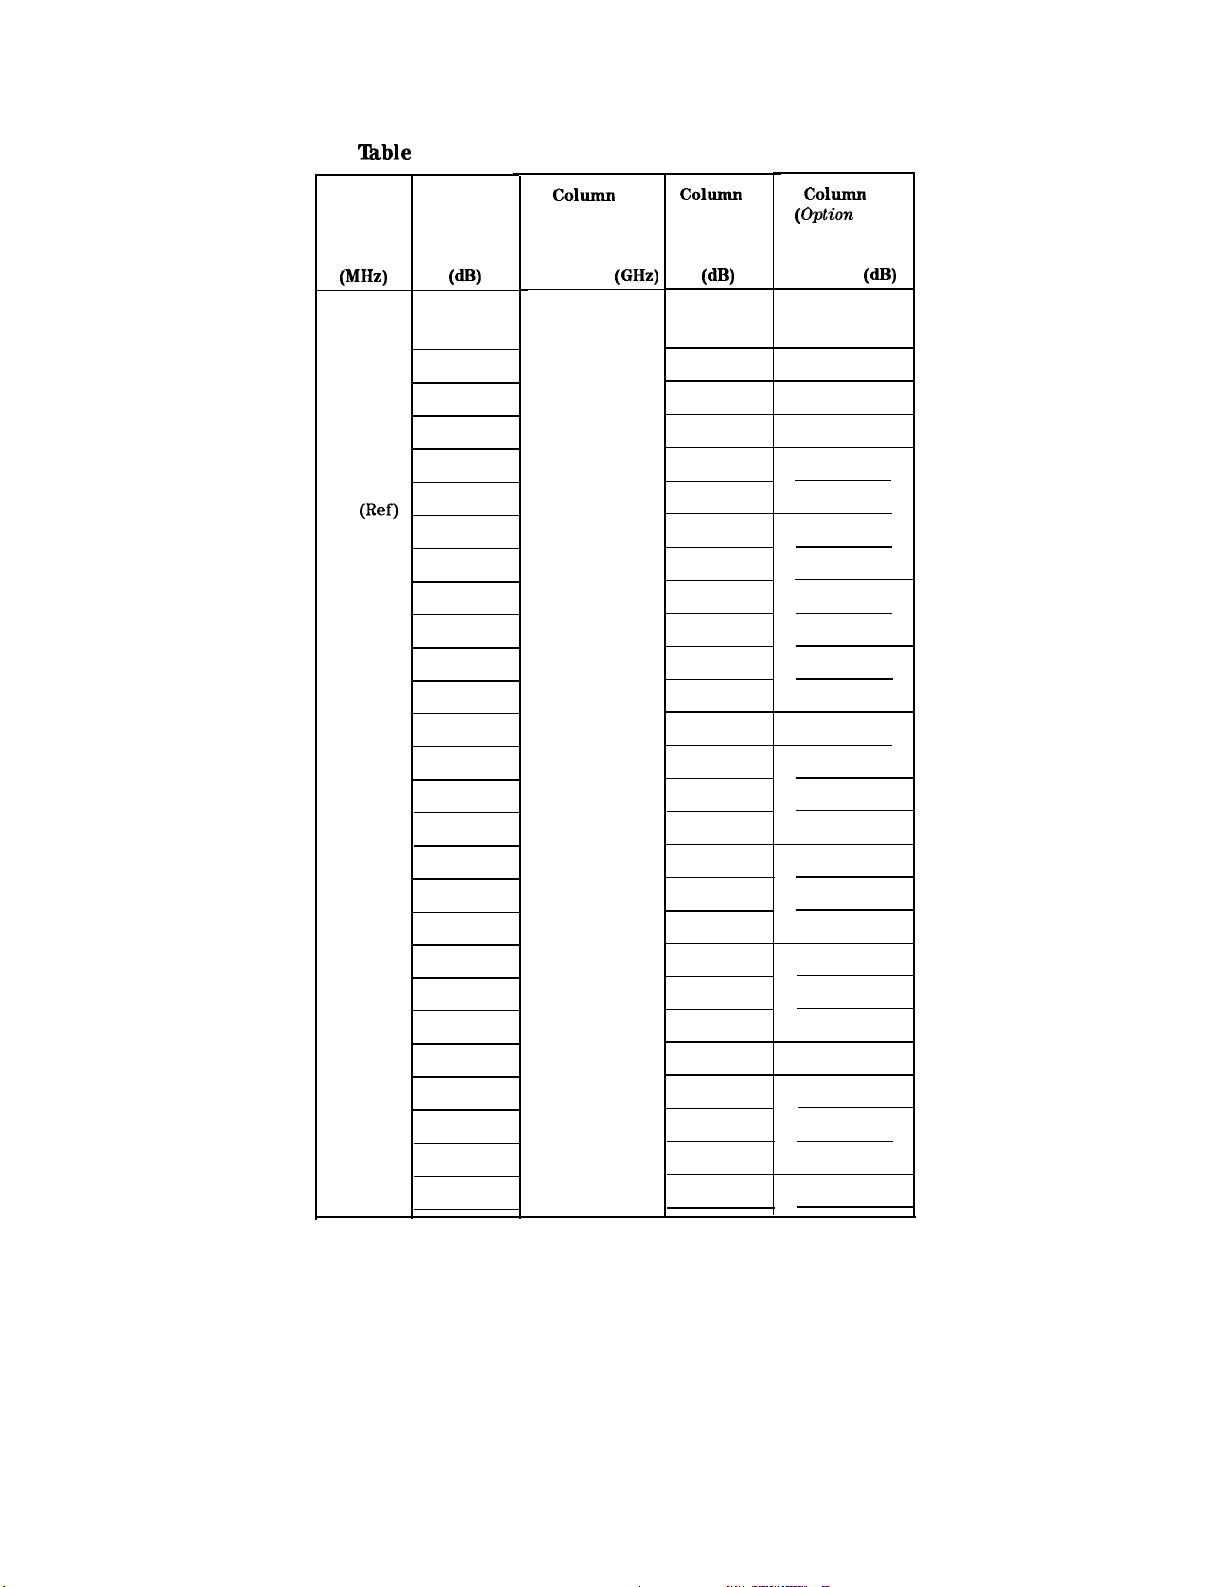
11. Frequency ‘Response
‘Ihble
1-14. Frequency Response Errors Worksheet
Column 1
Frequency
(MHz)
50
100
150
200
250
300
(Ref)
350
400
450
500
550
600
650
700
750
800
850
900
950
1000
1050
1100
1150
1200
1250
1300
1350
Column 2
Error
Relative
to 300 MHz
W)
c01llmn
3
Sensor
CAL FACTOR
Frequency (GHz)
0.03
0.1
0.1
0.3
0.3
0.3
0.3
0.3
0.3
0.3
1.0
1.0
1.0
1.0
1.0
1.0
1.0
1.0
1.0
1.0
1.0
1.0
1.0
1.0
1.0
1.0
1.0
c01unln
System
Error
WI
4
C&mln
(option
Corrected Error
Relative to
300 MHz
5
001)
(dR)
1-48 Calibrating
HP 8590D Spectrum Analyzer
Page 61
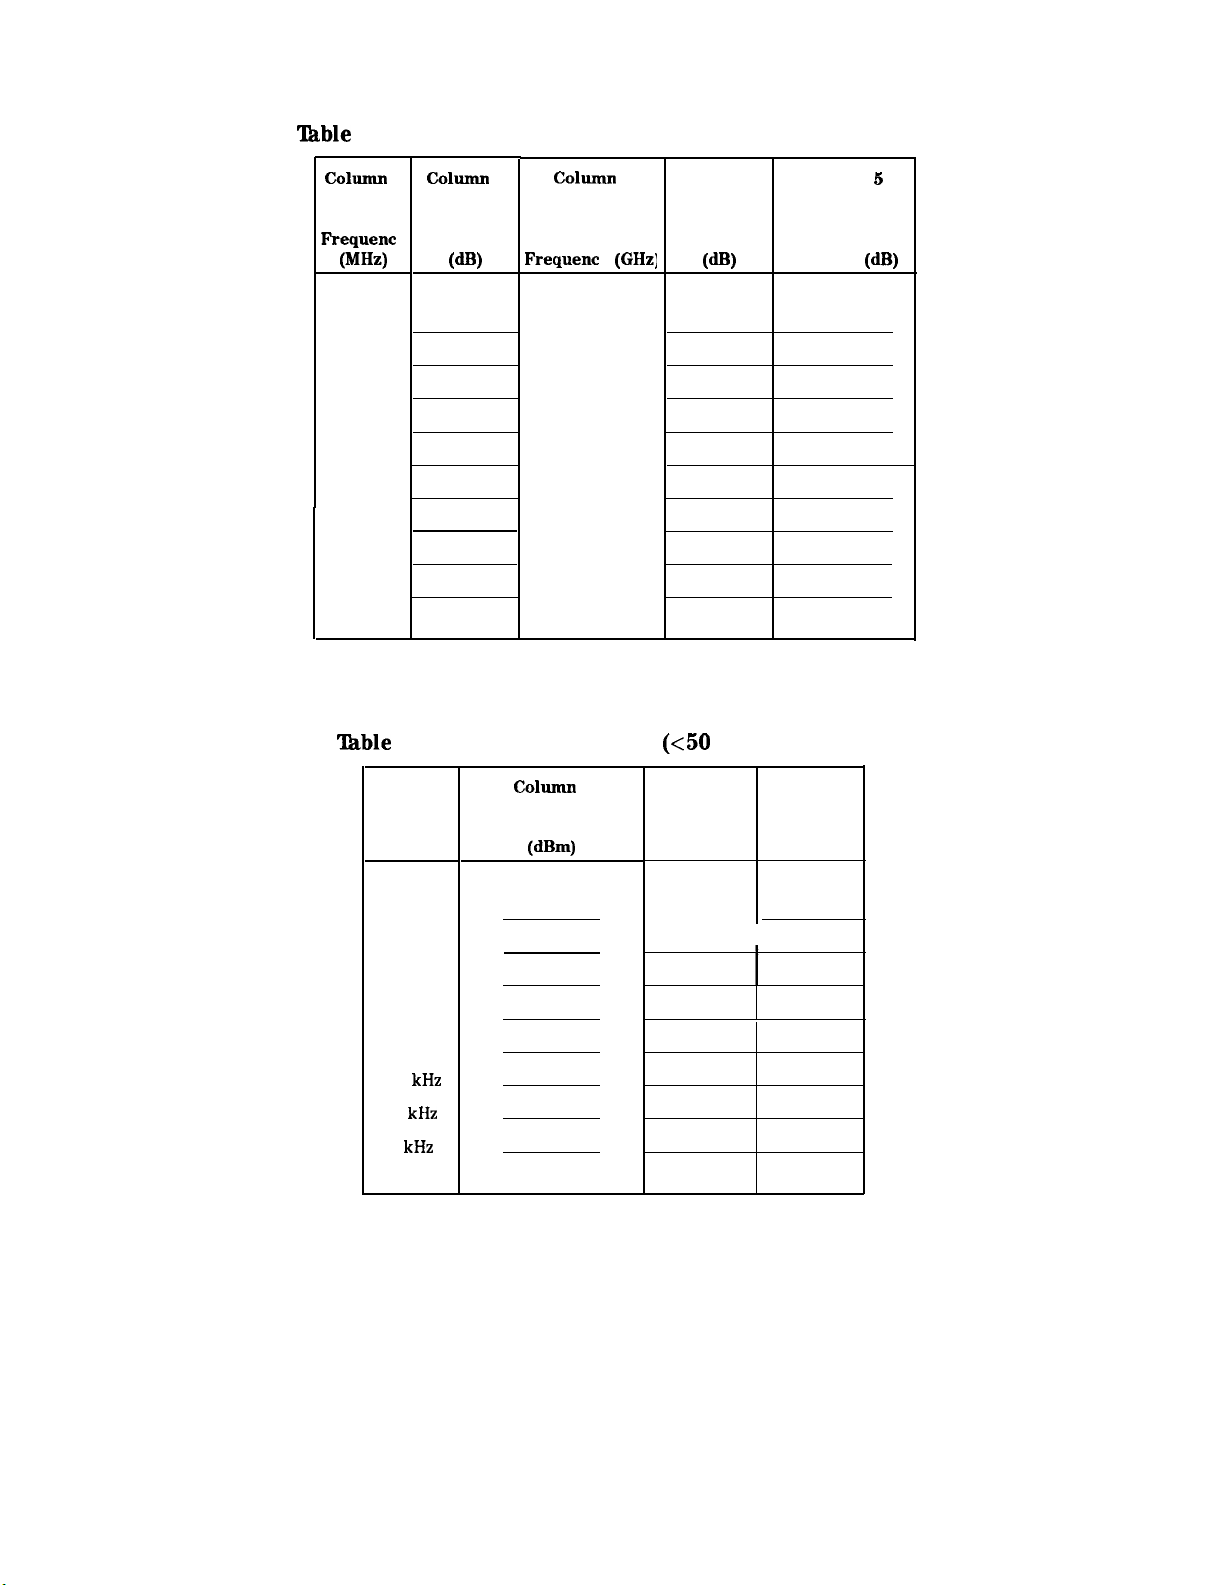
‘I&ble
1-14. Frequency Response Errors Worksheet (continued)
11. Frequency Response
column
Frequent
(MHz)
1400
1450
1500
1550
1600
1650
1700
1750
1800
‘Ihble
1
column
Error
Relative
y
to 300 MHz
WV
2
c01llmn
Sensor
CAL FACTOR
Frequent y
1.0
1.0
1.0
3
(GHz)
Column 4
System
Error
Colllmn
(Option 001)
Corrected Errol
Relative to
300 MHz
(dB)
2.0
2.0
2.0
2.0
2.0
2.0
1-15. Frequency Response (~50 MHz) Worksheet
6
Column 1
Frequency
50 MHz
20 MHz
10 MHz
5 MHz
1 MHz
200
kHz
50
kHz
9
kHz
column
Synthesizer/Level Response Response
Generator Amplitude Relative Relative
2 Column 3 Column 4
@ml
to 50 MHz to 300 MHz
0 (Reference)
I
HP 859OD Spectrum Analyzer
Calibrating 1-49
Page 62

12. Other Input Related Spurious Responses
A synthesized source and the spectrum analyzer are set to the same frequency and the
amplitude of the source is set to -10
analyzer. The source is then tuned to several different frequencies which should generate
image responses. At each source frequency, the source amplitude is set to -10
amplitude of the response, if any, is measured using the spectrum analyzer marker function.
The marker-amplitude difference is then compared to the specification.
There are no related adjustment procedures for this performance test.
Equipment Required
Synthesized sweeper
Measuring receiver (used as a power meter)
Power sensor
Adapter, Type N (f) to APC 3.5 (f)
Adapter, Type N (f) to Type N (f)
Cable, Type N, 183 cm (72 in)
Additional Equipment for Option 001
Power sensor
Adapter, minimum loss
Adapter, Type N (f) to BNC (m), 75
Adapter, Type N (f) to Type N (f)
dBm.
A marker-amplitude reference is set on the
0
dBm
and the
l-50 Calibrating
HP 859OD Spectrum Analyzer
Page 63
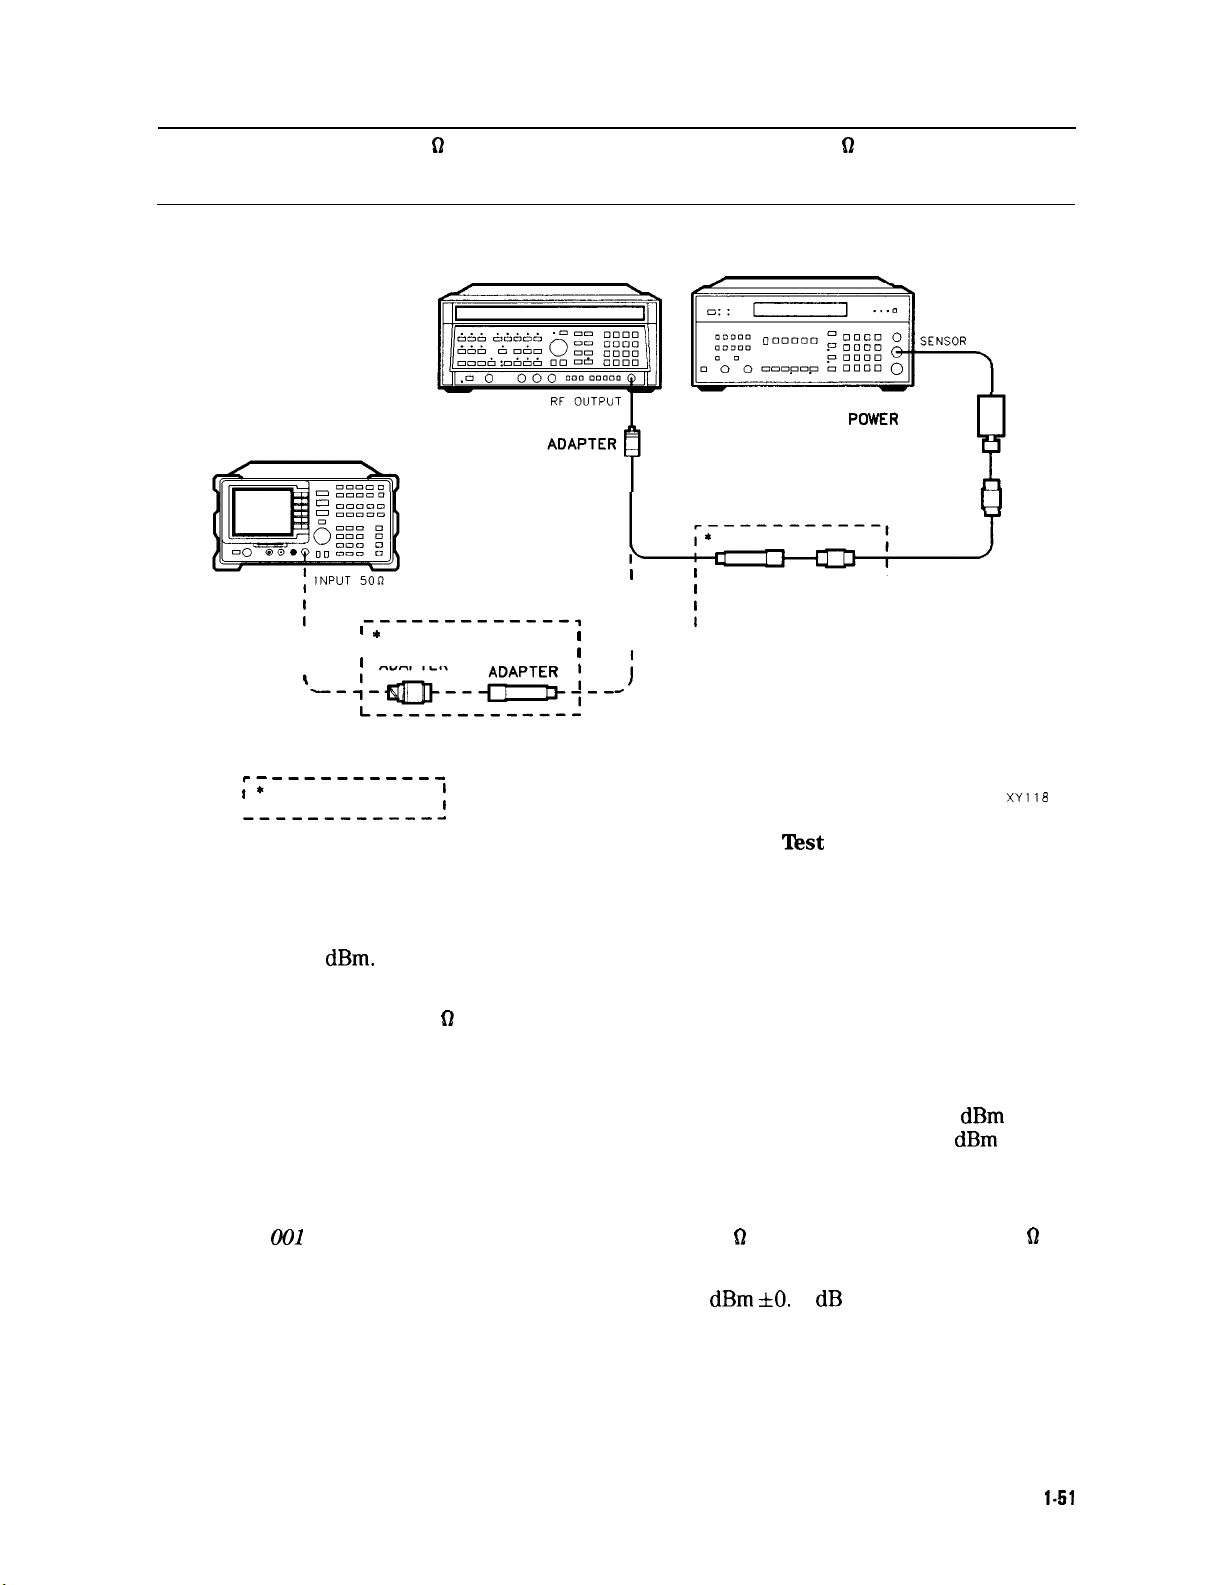
12. Other Input Related Spurious Responses
Caution
SPECTRUM ANALYZER
Use only 75 cables, connectors, or adapters on the 75 62 input of an Option
001 or damage to the input connector will occur.
SYNTHESIZED SWEEPER
TYPE N CABLE
I
I
I
’ *
I
I
I
l
I
\
ADAPTER
MINIMUM
LOSS
I
I
;
MEASURING RECEIVER
POWER SENSOR
’
MINIMUM ADAPTER I
;
ADAPTER
I
LOSS
------------
ADAPTER
I
I
I
-----------
;:
OPT ION 001 ONLY
I
------------d
;
XY118
Figure 1-17. Other Input Related Spurious Test Setup
Procedure
1. Zero and calibrate the measuring receiver and the power sensor in log mode so that power
is read out in
receiver.
Option 001 only:
2. Press INSTRUMENT PRESET on the synthesized sweeper and set the controls as follows:
CW
POWER LEVEL. . . . . . . . . . . . . . . . . . . . . . . . . . . . . . . . . . . . . . . . . . . . . . . . . . . . -10
Option 001 only:
3. Connect the equipment as shown in Figure l-17. Connect the output of the synthesizer to
the power sensor using adapters.
Option
power sensor.
4. Adjust the synthesized sweeper power level for a -10
measuring receiver.
dBm.
Enter the power sensor’s 542.8 MHz Cal Factor into the measuring
Use 75 61 power sensor.
. . . . . . . . . . . . . . . . . . . . . . . . . . . . . . . . . . . . . . . . . . . . . . . . . . . . . . . . . . . . . . 542.8 MHz
dBm
POWER LEVEL . . . . . . . . . . . . . . . . . . . . . . . . . . . . . . . . . -14.3
001
only: Use the minimum loss adapter and 75
D
adapter to connect to the 75
dBm *O.
1 dB reading on the
dBm
Q
5. On the synthesized sweeper, press SAVE 1.
6. Enter the power sensor’s Cal Factor for 1142.8 MHz into the measuring receiver.
7. Set the CW frequency on the synthesized sweeper to 1142.8 MHz.
HP 859OD Spectrum Analyzer
Calibrating
l-51
Page 64
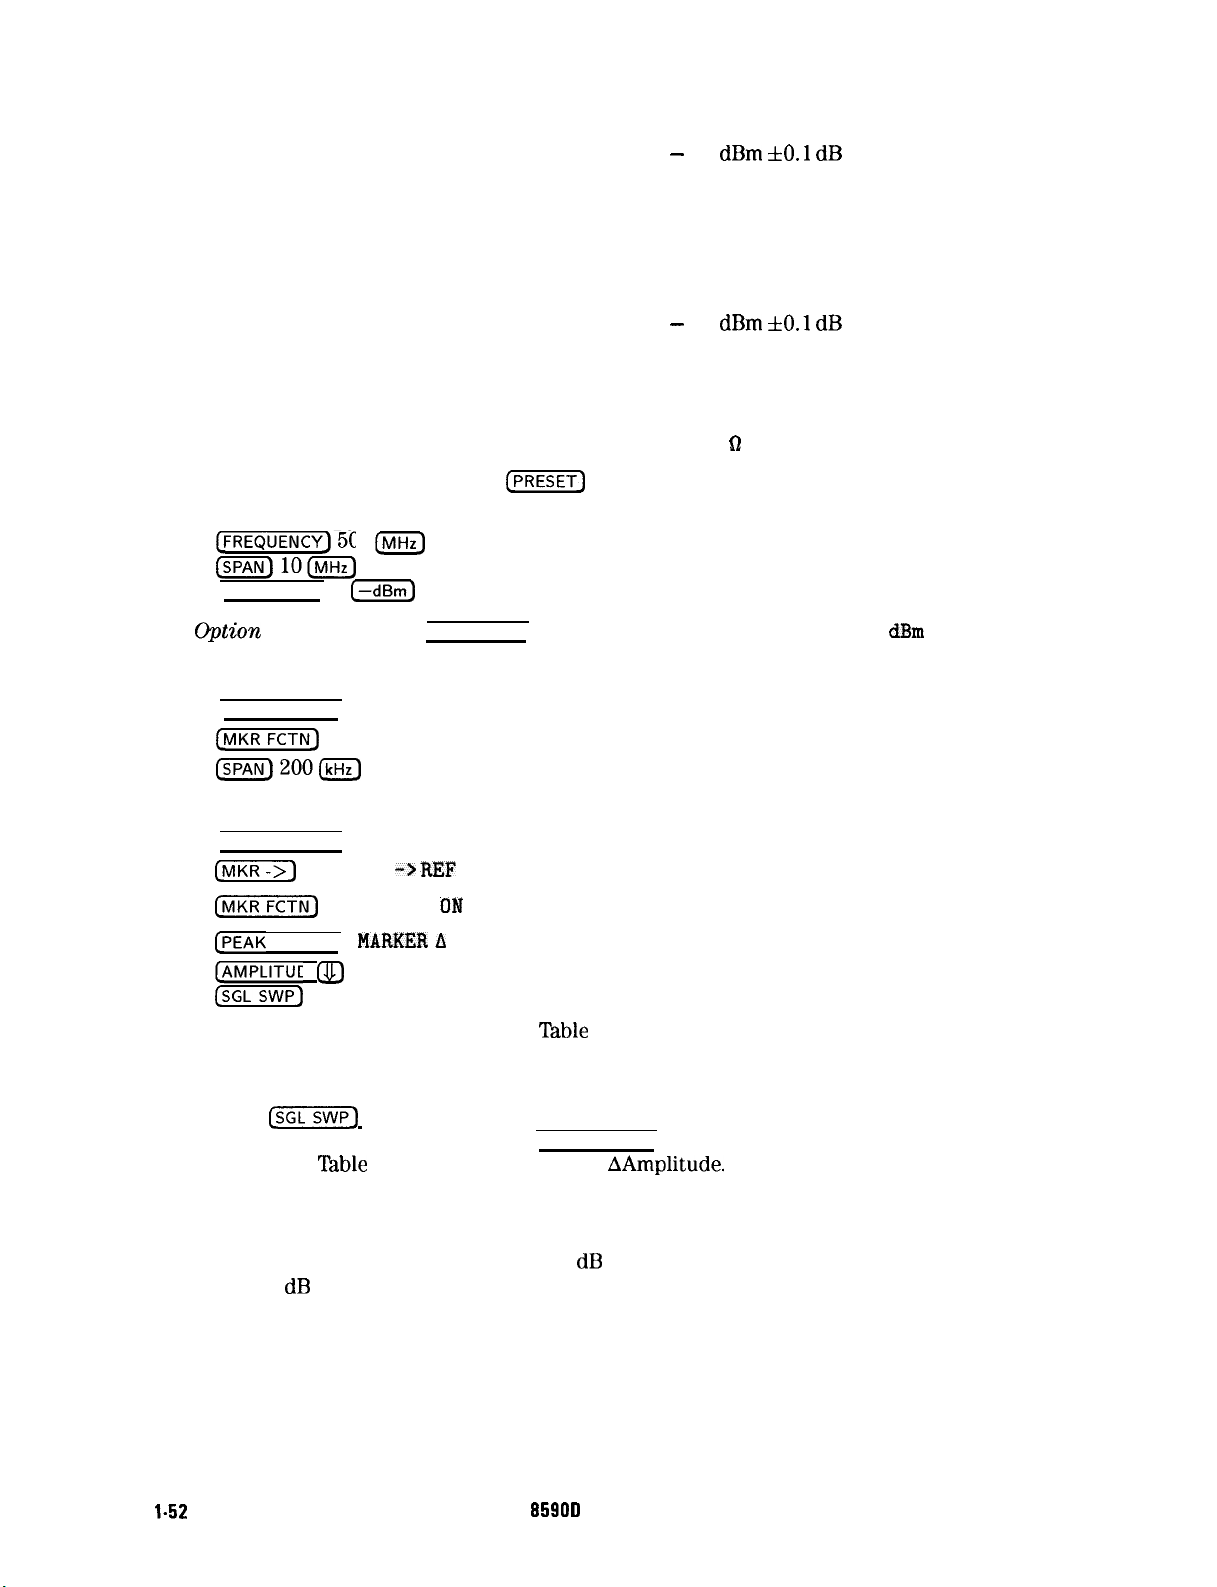
12.
Other Input Related Spurious Responses
8.
Adjust the synthesized sweeper power level for a - 10
dBm fO.1 dB
reading on the
measuring receiver.
9.
On the synthesized sweeper, press SAVE 2.
10.
Enter the power sensor’s Cal Factor for 500 MHz into the measuring receiver.
11.
Set the CW frequency on the synthesized sweeper to 500 MHz.
12.
Adjust the synthesized sweeper power level for a - 10
dBm fO.1 dB
reading on the
measuring receiver.
13.
Connect the synthesized sweeper to the RF INPUT of the spectrum analyzer using the
appropriate cable and adapters.
Option 001 only: Use the minimum loss adapter and 75
14.
On the spectrum analyzer, press
(j-1
and wait for the preset to finish then set the
Q
adapter as shown in Figure 1-17.
controls as follows:
FREQUENCY) 500
@
hlO@
(AMPLITUDE) 0
0ption 001 only: Press (AMPLITUDE], More 1 of 2, Amptd Units, then
15.
On the spectrum analyzer, press the following keys:
(PEAK SEARCH)
(jMKR-
(-dBm)
MK TRACK ON OFF (ON)
dBm
.
=200(kHz)
Wait for the AUTO ZOOM message to disappear. Press the following spectrum analyzer keys:
[PEAK SEARCH)
(jj]
(MKR]
(PEAK
AMPLITUDE]
MARKER ->
REF
LVL
MK TRACK OM OFF (OFF)
SEARCH)
MARKER A
(iJJ
(step-down key).
&Em-)
For each of the frequencies listed in
16.
‘Ruble
1-16, do the following:
a. Set the synthesized sweeper to the listed CW frequency by pressing RECALL 1 for a CW
frequency of 542.8 MHz or RECALL 2 for a CW frequency of 1148.8 MHz.
b. Press
[SGL)
and wait for the completion of a new sweep.
c. On the spectrum analyzer, press (PEAK SEARCH) and record the marker-delta amplitude
reading in
‘Iable
1-16 as the Actual MKR
AAmplitude.
The Actual MKR A Amplitude should be less than the Maximum MKR A Amplitude listed
in the table below.
The Maximum MKR A Amplitude is 10 dB more positive than the specification. This is due
to the 10 dB change in reference level made in step 15.
HP
8590D
l-52
Calibrating
Spectrum Analyzer
Page 65

‘I&ble
1-16. Image Responses Worksheet
,
Synthesized Sweeper
CW Frequency
12. Other Input Related Spurious Responses
Actual MKR A Maximum MKR
Amplitude
(d&z)
Amplitude
(dBc)
A
L
542.8 MHz
1142.8 MHz
17. Record the Maximum MKR A Amplitude from
lhble
performance test record.
-55
-55
1-16 as TR Entry 12-1 in the
HP 859OD Spectrum Analyzer
Calibrating 1-53
Page 66

13. Spurious Response
This test is performed in two parts. The first part measures second-harmonic distortion; the
second part measures third-order intermodulation distortion.
To test second harmonic distortion, a 50 MHz low-pass filter is used to filter the source output,
ensuring that harmonics read by the spectrum analyzer are internally generated and not
coming from the source. To measure the distortion products, the power at the mixer is set 25
dB
higher than specified. New test limits have been developed based on this higher power.
With -45
equivalent Second Order Intercept
dBm
+25 dBm
dBm
at the input mixer and the distortion products suppressed by 70
(SOI)
is
+25 dBm
(-45
dBm
at the mixer, and the distortion products suppressed by 45
(-20
dBm
+ 45
dBc).
dBc,
+ 70
dBc,
dBc).
Therefore, with -20
the equivalent SO1 is also
the
For third order intermodulation distortion, two signals are combined in a directional bridge (for
isolation) and are applied to the spectrum analyzer input. The power level of the two signals is
8
dB
higher than specified, so the distortion products should be suppressed by 16 dB less than
specified. In this manner, the equivalent Third Order Intercept
With two -30
the equivalent TO1 is +5
dBm
signals at the input mixer and the distortion products suppressed by 70
dBm
(-30
dBm
+ 70
dBc/B).
However, if two -22
present at the input mixer and the distortion products are suppressed by 54
TO1 is also +5
dBm
(-22
dBm
+ 54
dBc/Z).
(TOI)
is measured.
dBm
signals are
dBc,
the equivalent
dBc,
Performing the test with a higher power level maintains the measurement integrity while
reducing both test time and the dependency upon the source’s noise sideband performance.
There are no related adjustment procedures for this performance test.
It is only necessary to perform “Part 1: Second Harmonic Distortion, 30 MHz” for operation
verification.
Equipment Required
Synthesizer/level generator
Synthesized sweeper
Measuring receiver (used as a power meter)
Power sensor, 100
Low pass filter, 50 MHz
Directional bridge
Adapter, Type N (f) to APC 3.5 (f)
Adapter, Type N (f) to BNC (m)
Adapter, Type N (m) to BNC (f)
Adapter, Type N (m) to BNC (m)
Cable, BNC, 120 cm (48 in) (2 required)
kHz
to 1800 MHz
Additional Equipment for Option 001
Power sensor
Adapter, mechanical, 75 62 to 50
Adapter, minimum loss
Adapter, Type N (f) to BNC (m), 75
Adapter, BNC (m) to BNC (m)
l-54
Calibrating
61
0
HP 8590D Spectrum Analyzer
Page 67
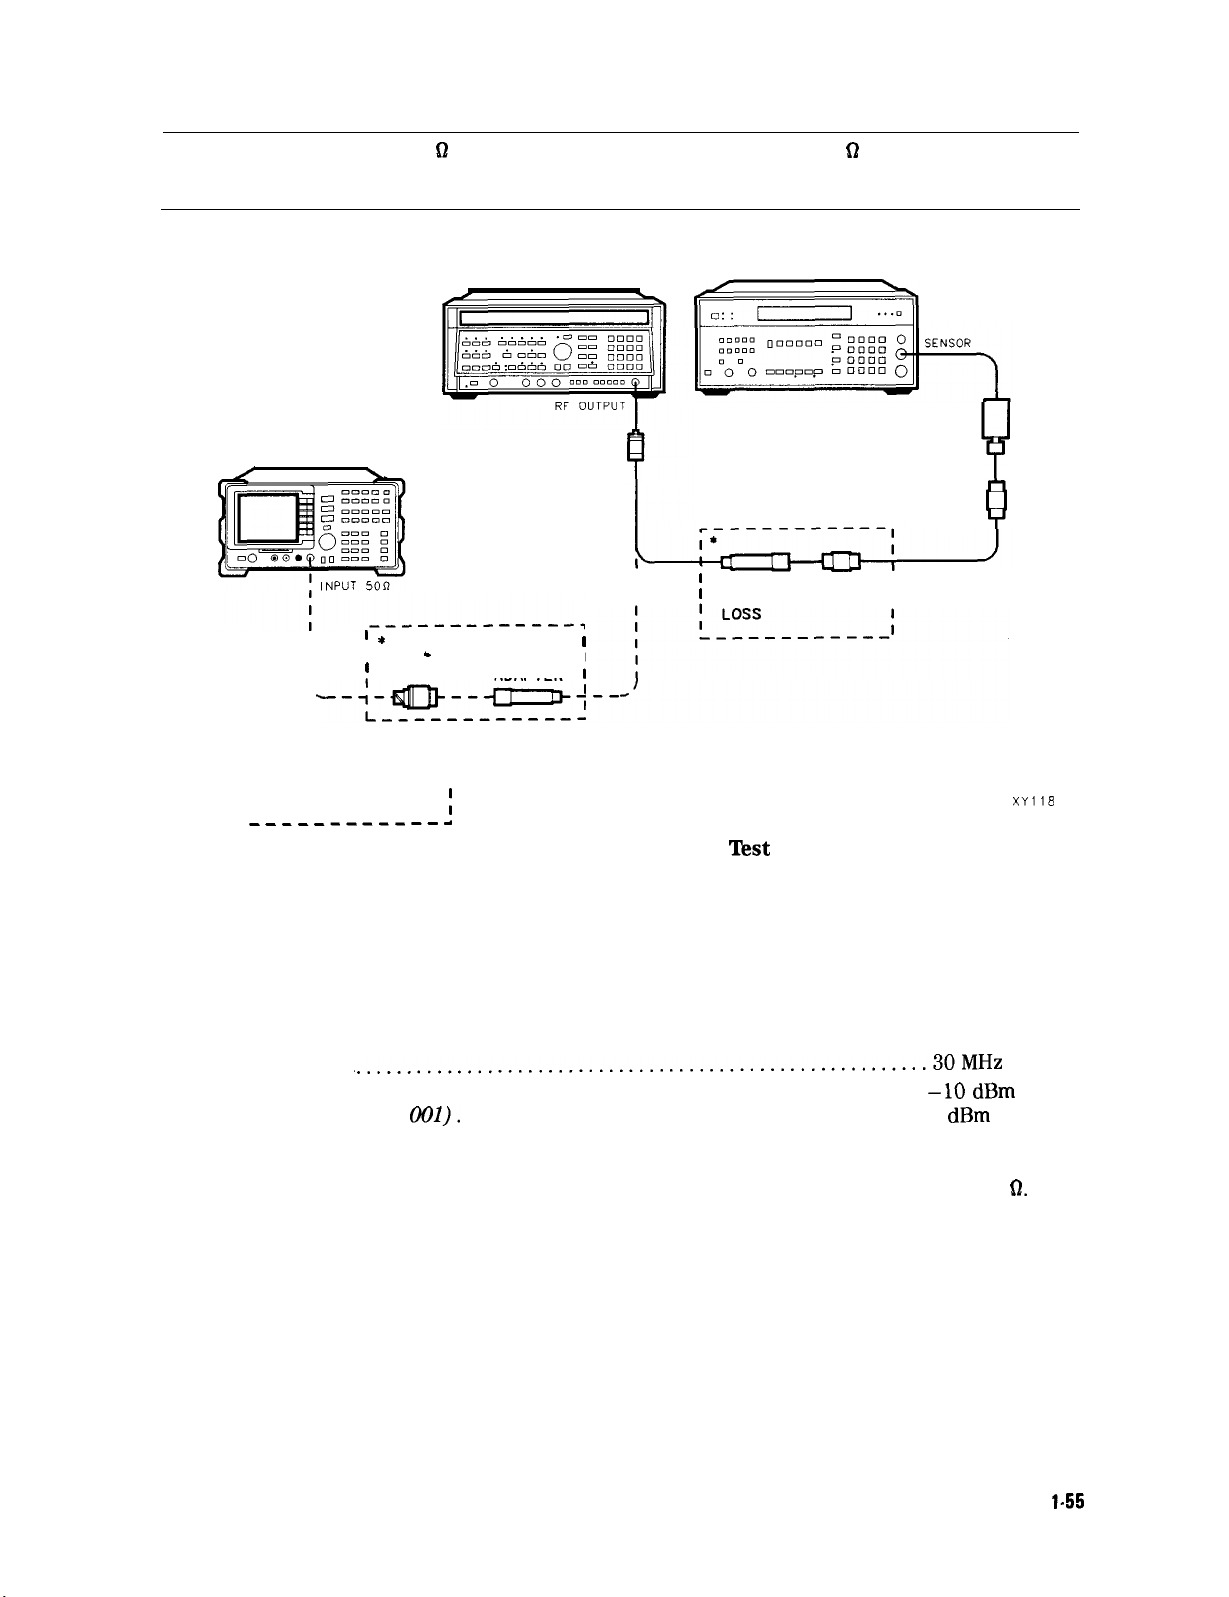
13. Spurious Response
Caution
SPECTRUM ANALYZER
/
Use only 75 62 cables, connectors, or adapters on the 75 fi input of an Option
001 or damage to the input connector will occur.
SYNTHESIZED SWEEPER
ADAPTER
\
TYPE N CABLE
I
I
’ *
I
I
I
I
\
c
1
ADAPTER
MINIMUM
LOSS
ADAPTER
’
I
’
MEASURING RECEIVER
r-3
POWER SENSOR
’
MINIMUM ADAPTER I
’
ADAPTER
ADAPTER
I
---c----w--
;:
, OPT ION 001 ONLY
---_-B-_-_--d
;
Figure 1-18. Second Harmonic Distortion Test Setup, 30 MHz
Procedure
Part 1: Second Harmonic Distortion, 30 MHz
1. Set the synthesizer/level generator controls as follows:
FREQUENCY
AMPLITUDE . . . . . . . . . . . . . . . . . . . . . . . . . . . . . . . . . . . . . . . . . . . . . . . . . . . . . . . .
AMPLITUDE
2. Connect the equipment as shown in Figure l-18.
Option 001 only: Connect the minimum loss adapter between the LPF and INPUT 75
~........................................................30MHz
(Option
001).
. . . . . . . . . . . . . . . . . . . . . . . . . . . . . . . . . . . . . . . . . . -4.3 dBm
-1OdBm
XYli8
0.
HP 85900 Spectrum Analyzer
Calibrating
l-55
Page 68

13. Spurious Response
3. Press
CPRESET)
on the spectrum analyzer and wait for the preset to finish then set the
controls as follows:
FREQUENCY) 30
INIHz)
h10m
Option 001 only: Press
(AMPLITUDE) 10
[PEAK
SEARCH]
(jj)
(-dem]
MK TRACK ON OFF (ON)
(j-1,
Mare I of 2, Amptd Units , then
dBm
.
ISPAN)l(MHz)
(j-j
Isw]
MK TRACK ON OFF (OFF)
300
4. Adjust the synthesizer/level generator Amplitude to place the peak of the signal at the
reference level (-10
dBm).
5. Set the spectrum analyzer controls as follows:
(B\iv) 100
VID BW
AUTO MAN
3001Hz)
6. Wait for two sweeps to finish, then press the spectrum analyzer keys as follows:
(PEAK SEARCH)
(FREQUENCY)
MARKER
h
CF STEP AUTO MAN 30 [MHz)
LFREQUENCY)
7. Press m (step-up key) on the spectrum analyzer to step to the second harmonic at
60 MHz. Press
@EAK
SEARCH). Record the MKR A Amplitude reading as TR Entry 13-l in the
performance test record.
1-56 Calibrating
HP 859OD Spectrum Analyzer
Page 69
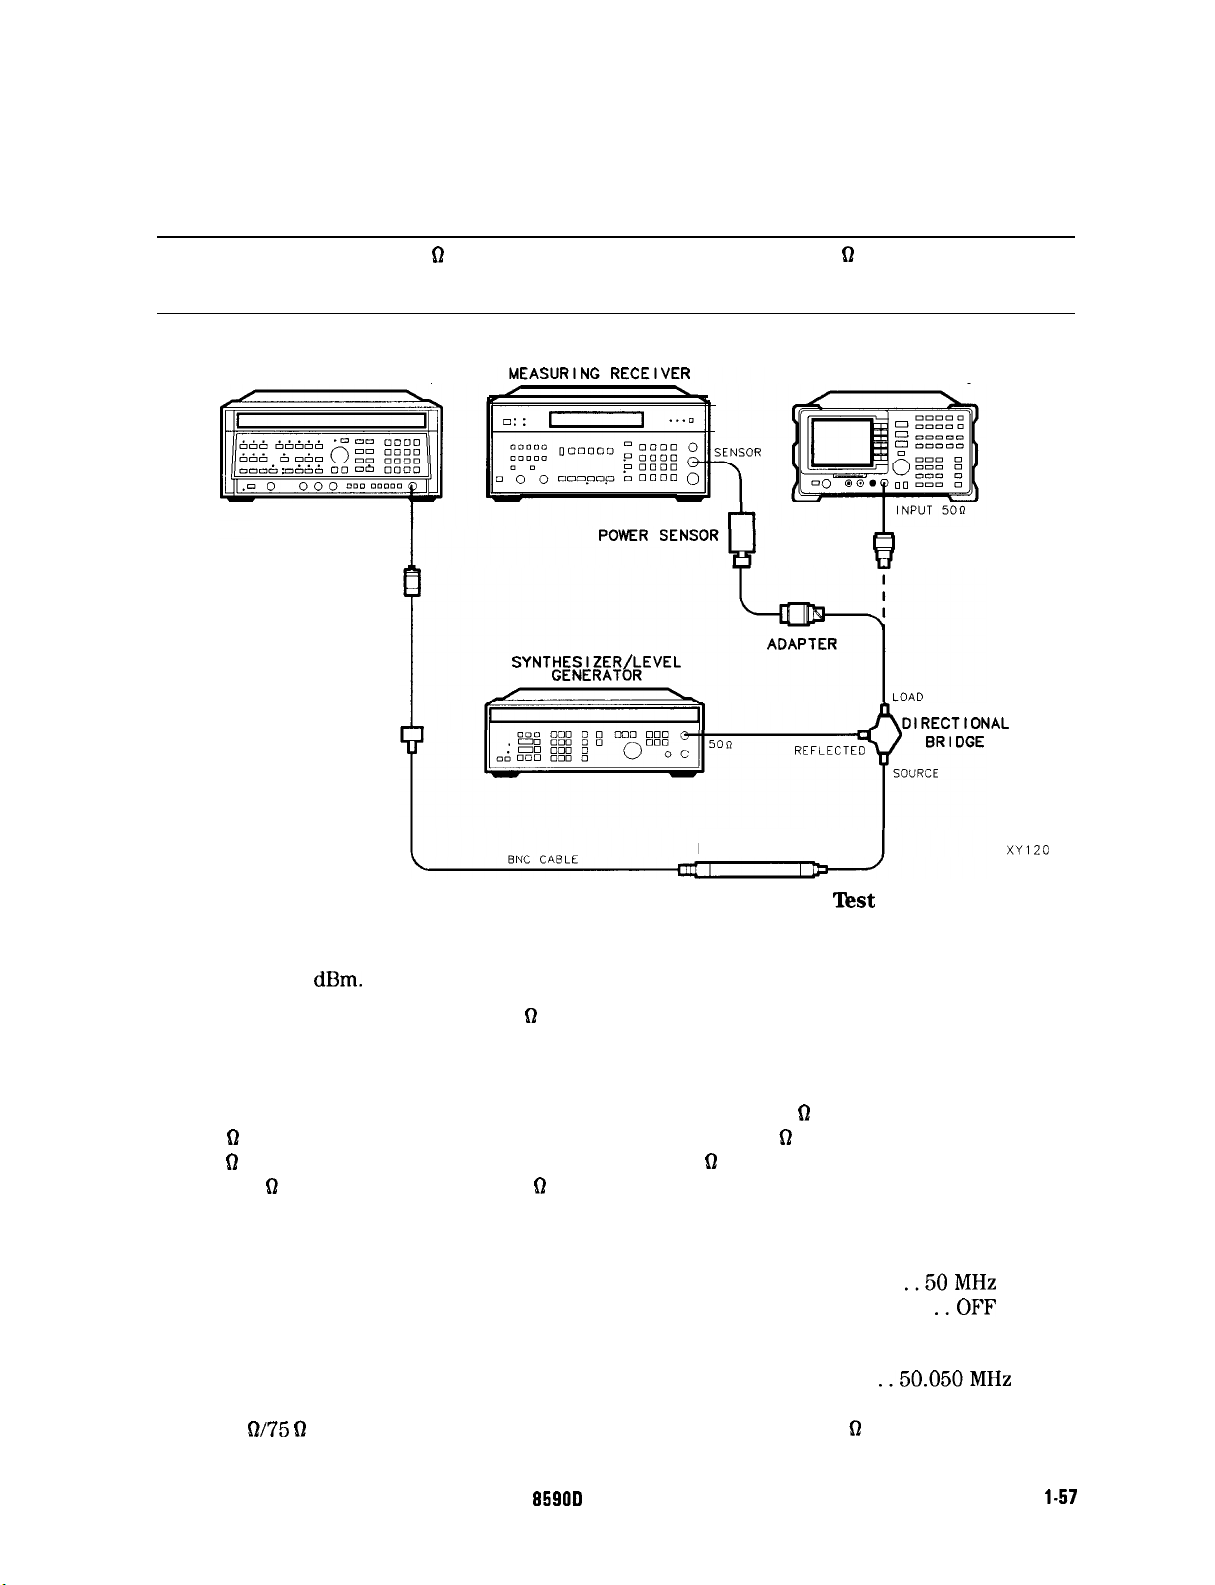
13. Spurious Response
Part 2: Third Order Intermodulation Distortion, 50 MHz
Perform this procedure for calibrating the spectrum analyzer. It is not necessary to perform
this procedure for operation verification.
Caution
SYNTHESIZED SWEEPER
Use only 75 Q cables, connectors, or adapters on the 75 D input of an Option
001 or damage to the input connector will occur.
SPECTRUM ANALYZER
RF OUTPUT
ADAPTER
Q
ADAPTER
ADAPTER
50 MHz LDW
PASS FILTER
IRECTIONAL
XY120
Figure 1-19. Third Order Intermodulation Distortion Test Setup
1. Zero and calibrate the measuring receiver and the power sensor in log mode so the power
reads out in
Option 001 only: Calibrate the 75
dBm.
Enter the power sensor’s 50 MHz Cal Factor into the measuring receiver.
D
power sensor.
2. Connect the equipment as shown in Figure l-19 with the output of the directional bridge
connected to the power sensor.
Option 001 only: The power measured at the output of the 50
a2
directional bridge by the
75 62 power sensor, is the equivalent power “seen” by the 75 0 spectrum analyzer. Use the
75 61 power sensor with the Type N (f) to BNC (m) 75 D adapter and use a BNC (m) to BNC
(m) 75 D adapter in place of the 50 D adapter.
3. Press INSTRUMENT PRESET on the synthesized sweeper then set the controls as follows:
POWERLEVEL. . . . . . . . . . . . . . . . . . . . . . . . . . . . . . . . . . . . . . . . . . . . . . . . . . . . . -6dBm
CW
. . . . . . . . . . . . . . . . . . . . . . . . . . . . . . . . . . . . . . . . . . . . . . . . . . . . . . . . . . . . . . .
RF. . . . . . . . . . . . . . . . . . . . . . . . . . . . . . . . . . . . . . . . . . . . . . . . . . . . . . . . . . . . . . . . . . .
..50MHz
..OFF
4. Set the synthesizer/level generator controls as follows:
FREQUENCY
. . . . . . . . . . . . . . . . . . . . . . . . . . . . . . . . . . . . . . . . . . . . . . . . . .
..50.050MHz
AMPLITUDE . . . . . . . . . . . . . . . . . . . . . . . . . . . . . . . . . . . . . . . . . . . . . . . . . . . . . . . . -6dBm
50
B/75 D
switch
. . . . . . . . . . . . . . . . . . . . . . . . . . . . . . . . . . . . . . . . . 75 0 (no RF output)
HP 959OD Spectrum Analyzer
Calibrating
1-57
Page 70
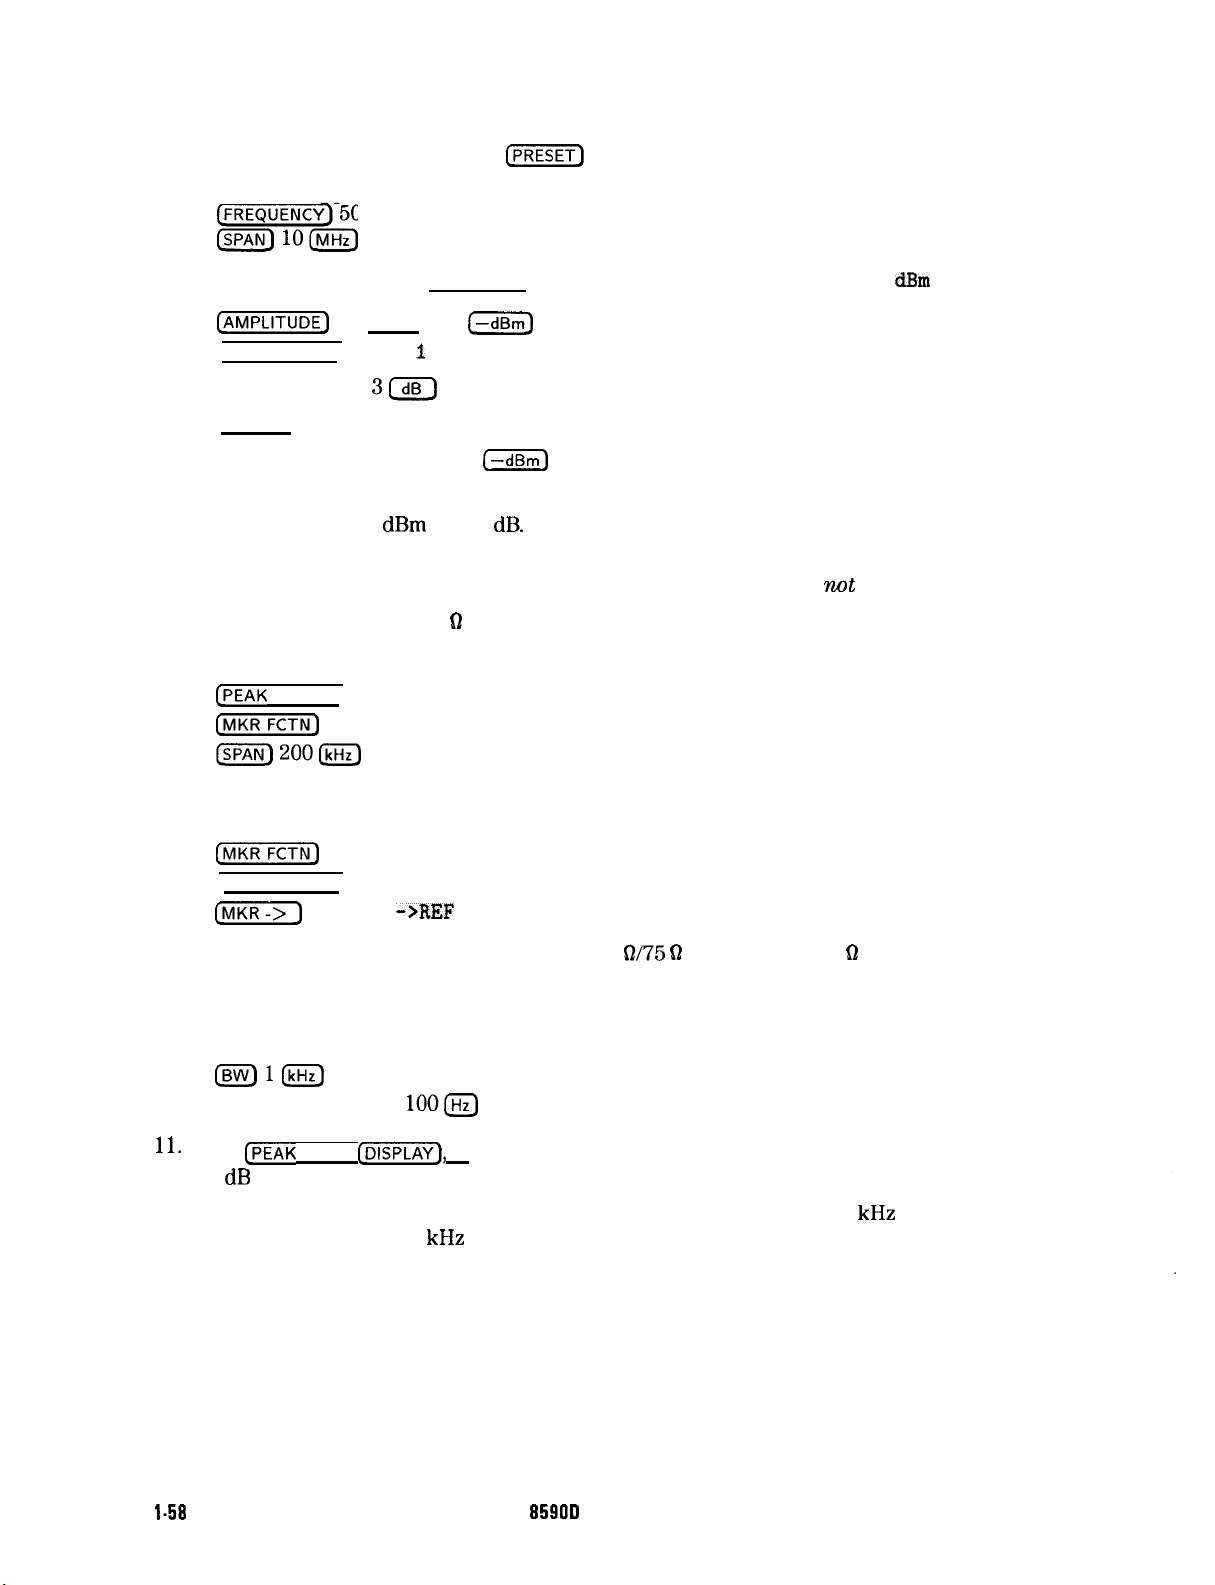
13.5.Spurious Response
On the spectrum analyzer, press
L-1
and wait until the preset is finished then set the
controls as follows:
FREQUENCY] 50 [MHz)
&lOW
Option 001 only: Press (AMPLITUDE), More 1 of 2, Amptd Units, then
(pYFmm-)
10
(PEAK SEARCH] More
PEAK EXCURSN
3m
I
of 2
(ZZ)
dE!m
.
(DISPLAY) More 1 of 2
THRESHLD ON OFF (ON) 90
(-dBm)
6. On the synthesized sweeper, set the RF to ON. Adjust the power level until the measuring
receiver reads -12
dBm
f0.05
dB.
7. Disconnect the power sensor from the directional bridge. Connect the directional bridge
directly to the spectrum analyzer RF INPUT using an adapter and
Option 001 only:
Use a 75 0 adapter, BNC (m) to BNC (m).
not
a cable.
8. On the spectrum analyzer, press the following keys:
[PEAK
SEARCH]
(MKRFCTN)
MK TRACK ON OFF (ON)
(SPAN)2000
Wait for the AUTO
ZOOM
message to disappear, then press the following spectrum analyzer
keys:
(MKRFCTN)
[PEAK SEARCH)
C-1
9. On the synthesizer/level generator, set the 50
MK TRACK ON OFF (OFF)
MARKER
->REF
LVL
O/75 D
switch to the 50 Q position (RF ON).
Adjust the Amplitude until the two signals are displayed at the same amplitude.
10. If necessary, adjust the spectrum analyzer center frequency until the two signals are
centered on the display. Set the controls as follows:
[BW)l(kHz)
11-
VID BW AUTO MAN
Press
CPEAK
SEARCH],
lOO@
[DISPLAY),
then DSP LINE ON OFF (ON). Set the display line to a value
54 dB below the current reference level setting.
12. The third order intermodulation distortion products should appear 50
frequency signal and 50
kHz
above the higher frequency signal. Their amplitude should be
kHz
below the lower
less than the display line.
l-58
Calibrating
HP 859OD Spectrum Analyzer
Page 71

13. If the distortion products can be seen, proceed as follows:
13. Spurious Response
a. On the spectrum analyzer, press
[PEAK SEARCH] and MARKER
b.
Repeatedly press NEXT PEAK until the active marker is on the highest distortion
A.
@CGF),
wait for completion of the sweep, then press
product.
c. Record the MKR A amplitude reading as TR Entry 13-2 in the performance test record.
The MKR A reading should be less than -54
dBc.
14. If the distortion products cannot be seen, proceed as follows:
a. On both the synthesized sweeper and the synthesizer/level generator, increase the
power level by 5
dB.
Distortion products should now be visible at this higher power
level.
b. On the spectrum analyzer, press
c.
Repeatedly press NEXT PEAK until the active marker is on the highest distortion
(sGL),
CPEAK
SEARCH), then
MARKER
A .
products.
d. On both the synthesized sweeper and the synthesizer/level generator, reduce the power
level by 5 dB and wait for the completion of a new sweep.
e. Record the MKR A amplitude reading as TR Entry 13-2 in the performance test record.
The MKR A reading should be less than -54
dBc.
HP
8590D
Spectrum Analyzer
Calibrating l-59
Page 72

14. Gain Compression
Gain Compression is measured by applying two signals, separated by 3 MHz. First, the
test places a -30
reference level is
analyzer, overdriving its input. The decrease in the first signal’s amplitude (gain compression)
caused by the second signal is the measured gain compression.
There are no related adjustment procedures for this performance test.
Equipment Required
Synthesized sweeper
Synthesizer/level generator
Measuring receiver (used as a power meter)
Power sensor
Directional bridge
Adapter, Type N (f) to BNC (m)
Adapter, Type N (m) to BNC (m)
Adapter, Type N (f) to APC 3.5 (f)
Adapter, Type N (m) to BNC (f)
Cable, BNC, 120 cm (48 in) (2 required)
Additional Equipment for Option 001
dBm
signal at the input of the spectrum analyzer (the spectrum analyzer
also
set to -30
dBm).
Then, a 0
dBm
signal is applied to the spectrum
Power sensor, 75
Adapter, Type N (f) to BNC (m), 75
Adapter, BNC (m) to BNC (m), 75
D
62
D
l-60 Calibrating
HP 8590D Spectrum Analyzer
Page 73
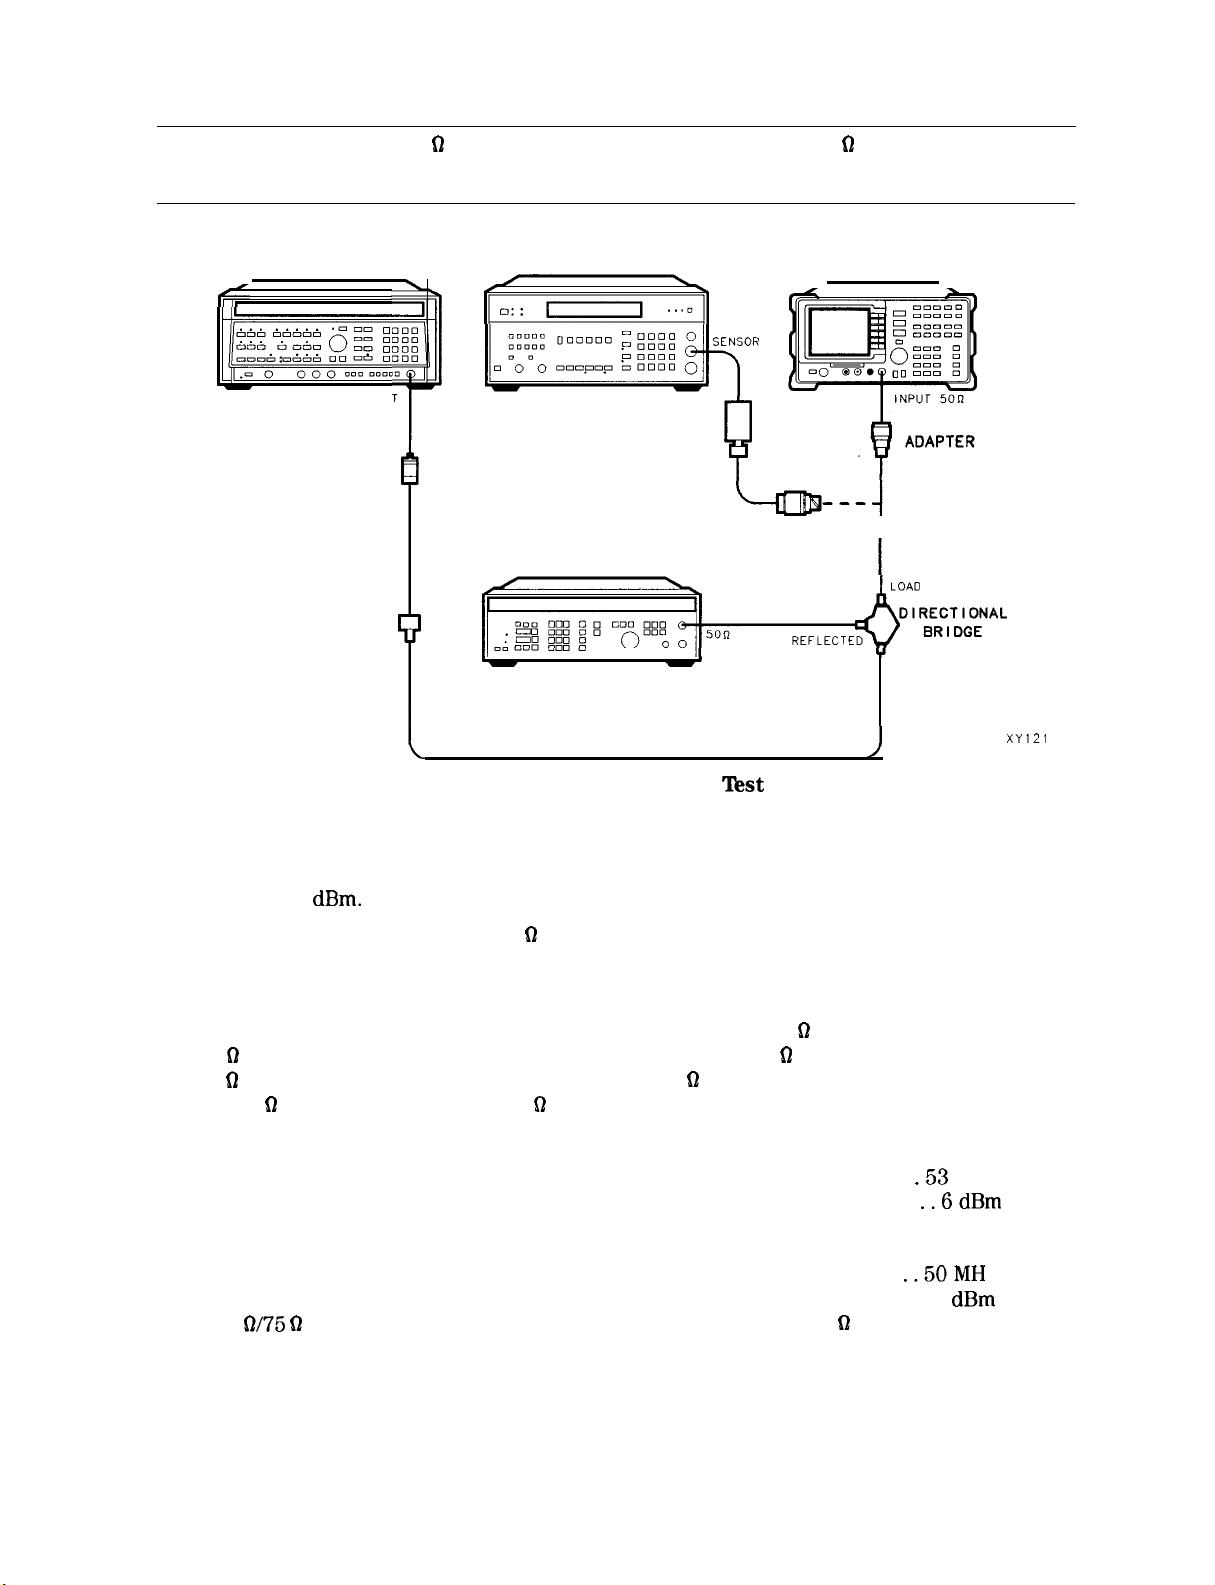
14. Gain Compression
Caution
SYNTHESIZED SWEEPER
LW
Use only 75 Q cables, connectors, or adapters on the 75 61 input of an Option
001 or damage to the input connector will occur.
RF OUTPU
ADAPTER
ADAPTER
MEASURING RECEIVER
r-1
POWER SENSOR
SYNTHESIZER/LEVEL
GENERATOR
B
SPECTRUM ANALYZER
ADAPTER
I
SOURCE
I
Figure l-20. Gain Compression Test Setup
XY121
Procedure
1. Zero and calibrate the measuring receiver and the power sensor in log mode so the power
reads out in
Option 001 only: Calibrate the 75
2. Connect the equipment as shown in Figure l-20, with the load (reflected) of the directional
coupler connected to the power sensor.
Option 001 only: The power measured at the output of the 50
75 6) power sensor, is the equivalent power “seen” by the 75 61 spectrum analyzer. Use the
75 D power sensor with a Type N (f) to BNC (m) 75 62 adapter and use a BNC (m) to BNC
(m) 75 62 adapter in place of the 50 Q adapter.
3. Press INSTRUMENT PRESET on the synthesized sweeper then set the controls as follows:
CW
POWERLEVEL . . . . . . . . . . . . . . . . . . . . . . . . . . . . . . . . . . . . . . . . . . . . . . . . . . . . .
4. Set the synthesizer/level generator controls as follows:
CW..
AMPLITUDE
50
O/75 Q
dBm.
Enter the power sensor’s 50 MHz Cal Factor into the measuring receiver.
62
power sensor.
D
directional bridge by the
. . . . . . . . . . . . . . . . . . . . . . . . . . . . . . . . . . . . . . . . . . . . . . . . . . . . . . . . . . . . . . . .
.53
MHz
..6dBm
..............................................................
.......................................................
SWITCH
.......................................
75 Q (no RF output)
..50MH
-14
z
dBm
HP 859OD Spectrum Analyzer
Calibrating l-61
Page 74
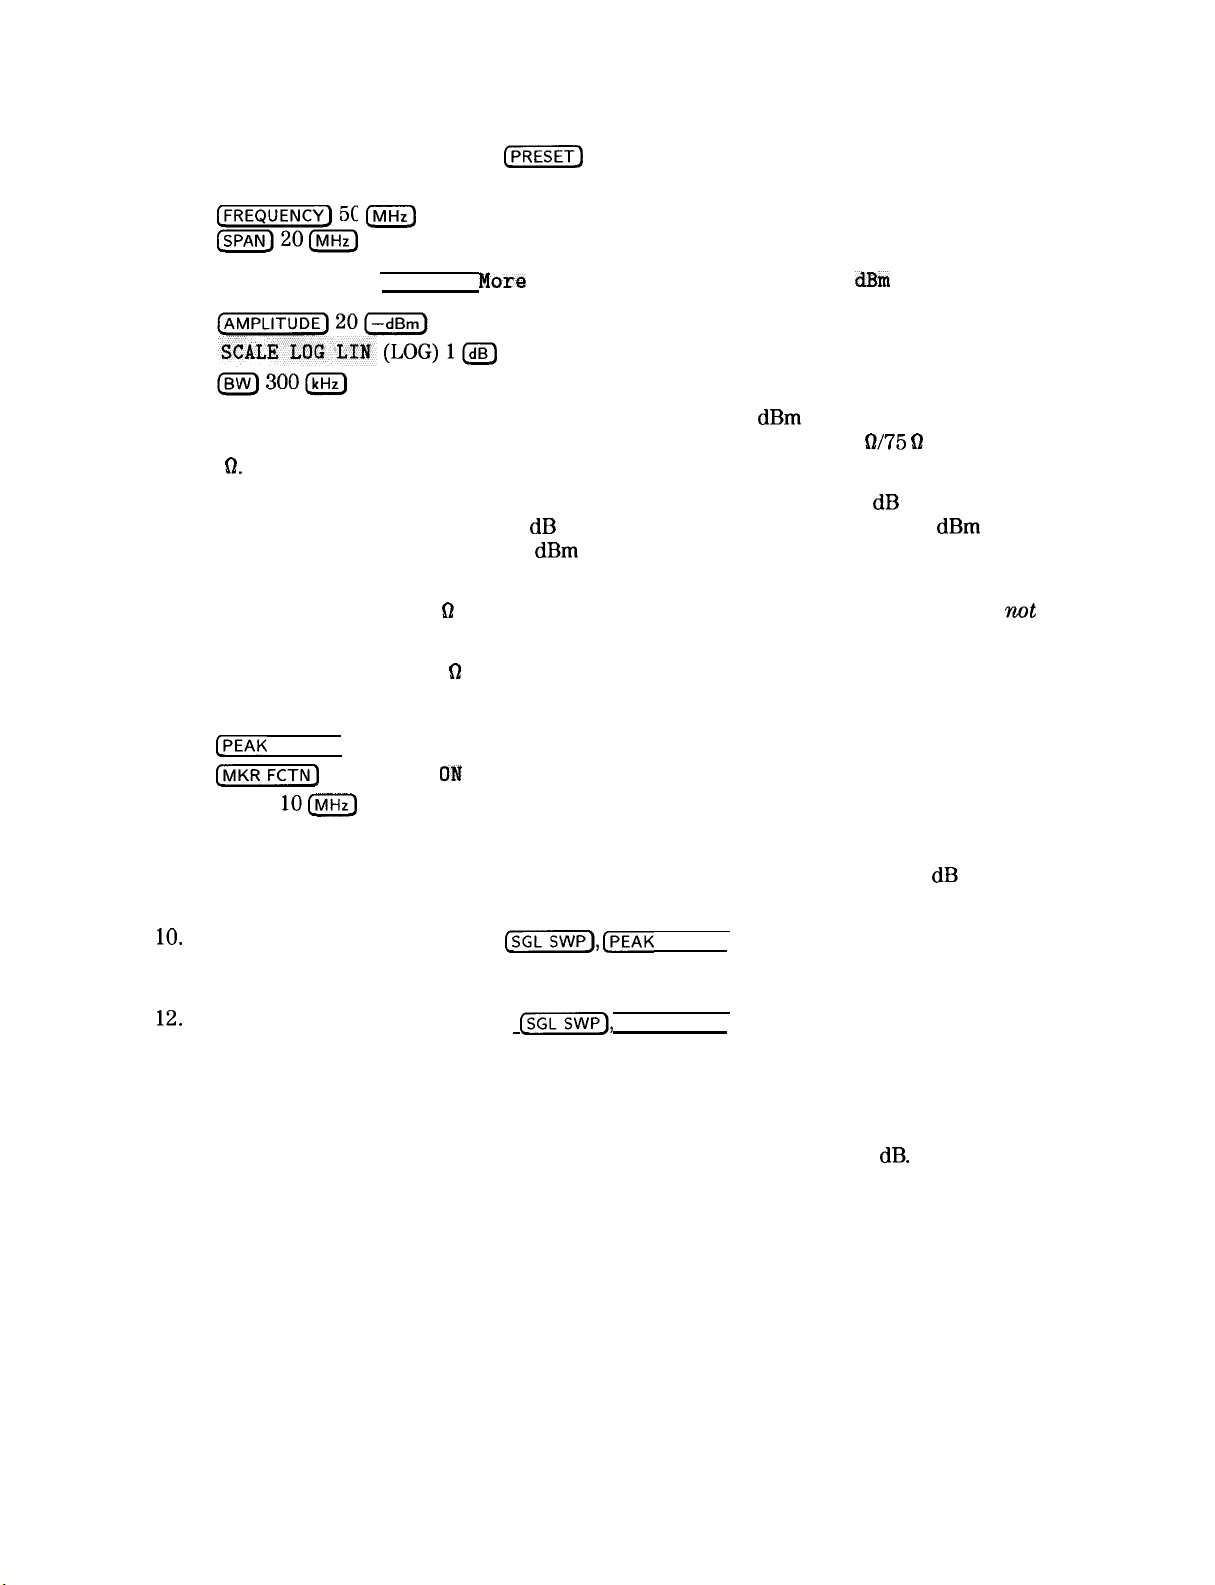
14. Gain Compression
5. On the spectrum analyzer, press
(j-1
and wait for the preset to finish then set the
controls as follows:
FREQUENCY] 50
h2om
Option 001: Press (AMPLITUDE],
IhnHz)
More
1 of 2 , Amptd Units , then
dEm
.
6. On the synthesized sweeper, adjust the power level for a 0
receiver. Set RF to OFF On the synthesizer/level generator, set the 50
50
0.
dBm
reading on the measuring
O/75 62
switch to
Note that the power level applied to the spectrum analyzer input is 10 dB greater than the
specification to account for the 10 dB attenuation setting. A power level of 0
spectrum analyzer input yields -10
dBm
at the input mixer.
dBm
at the
7. Disconnect the power sensor from the directional coupler and connect the directional
coupler to the INPUT 50 Q connector of the spectrum analyzer using an adapter and
cable.
Option 001 only:
Use a 75 D adapter, BNC (m) to BNC (m).
8. On the spectrum analyzer, press the following keys:
not
a
SPEAK
SEARCH)
(MKRFCTN)
[SPAN)
100
MK
TRACK OM OFF (ON)
Wait for the AUTO ZOOM message to disappear.
9. On the synthesizer/level generator, adjust the Amplitude to place the signal 1 dB below the
spectrum analyzer reference level.
19.
On the spectrum analyzer, press
[SGLSWP), [PEAK
SEARCH), then MARKER A .
11. On the synthesized sweeper, set RF to ON.
12.
On the spectrum analyzer, press
f,jsGL],
(PEAK SEARCH), NEXT PEAK. The active marker
should be on the lower amplitude signal and not on the signal that is off the top of the
screen. If it is not on the lower amplitude signal, reposition the marker to this peak using
the spectrum analyzer knob.
13. Read the MKR A amplitude and record as TR Entry 14-1 in the performance test record.
The absolute value of this amplitude should be less than or equal to 0.5
dB.
1-62 Calibrating
HP 859OD Spectrum Analyzer
Page 75
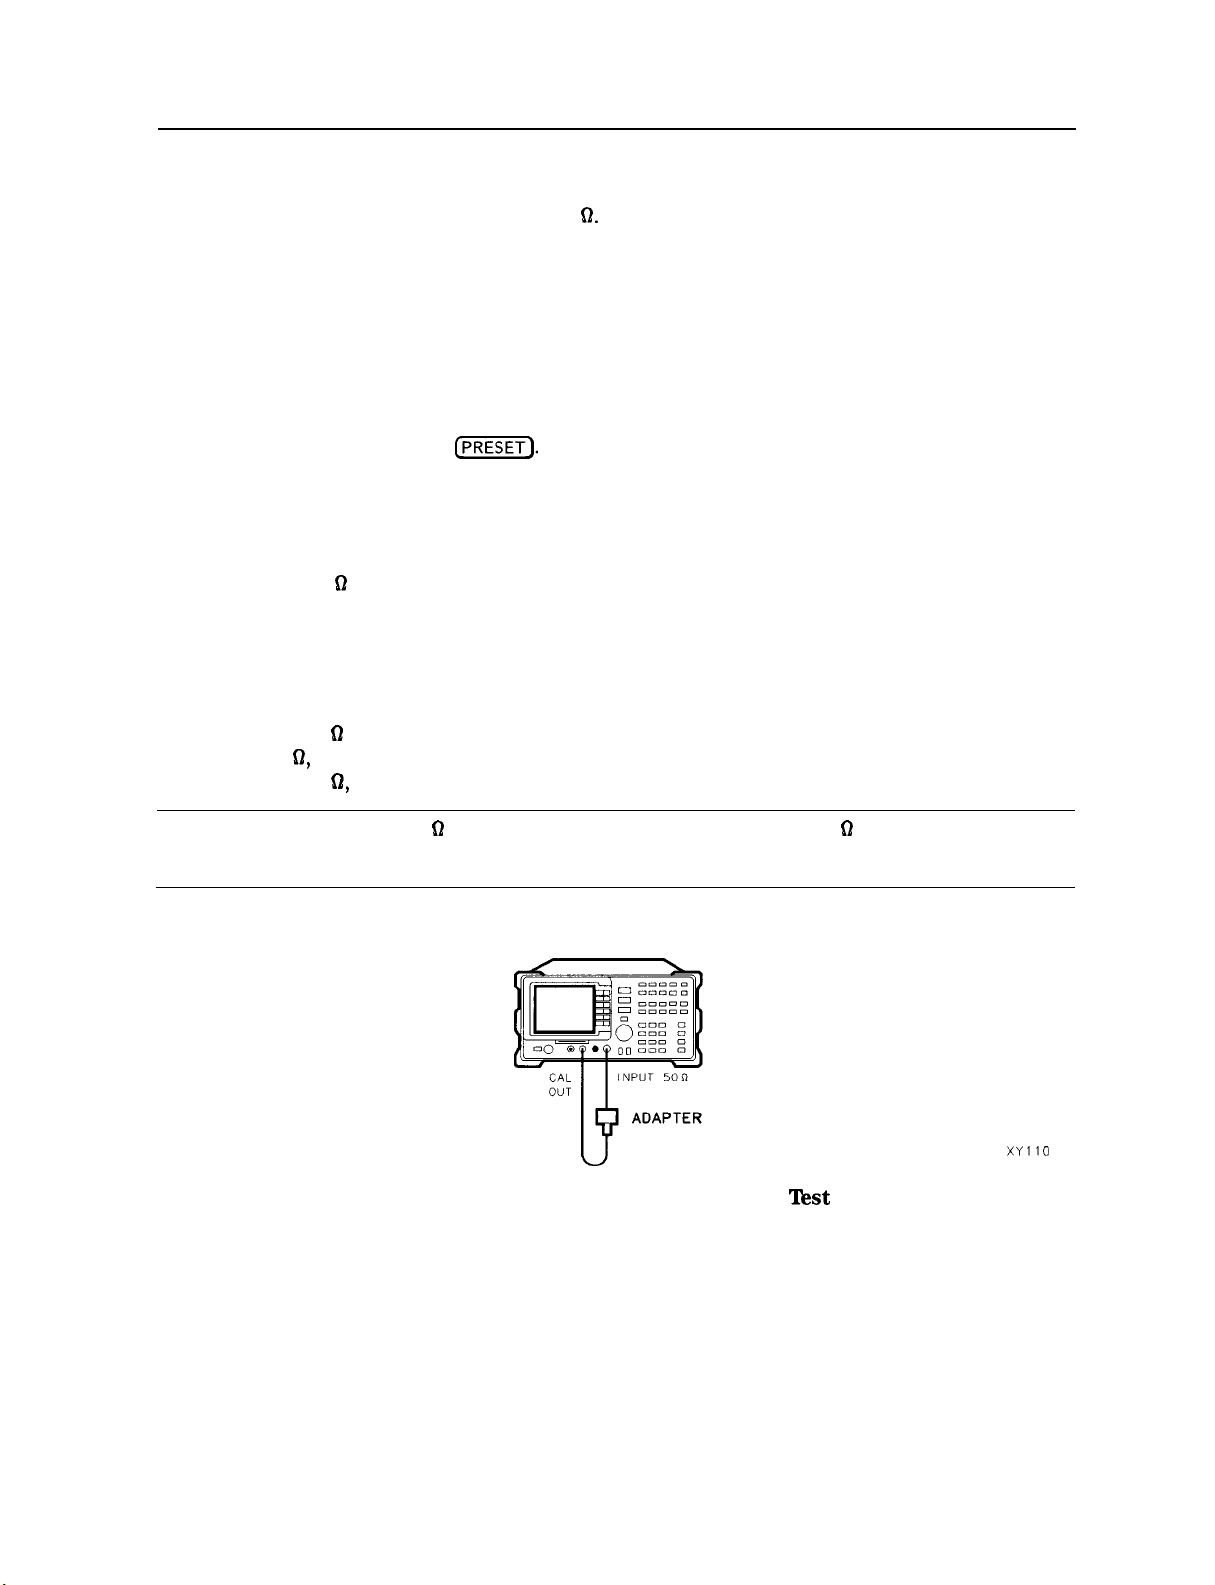
15. Displayed Average Noise Level
15. Displayed Average Noise Level
This test measures the displayed average noise level within the frequency range specified. The
spectrum analyzer input is terminated in 50
The LO feedthrough is used as a frequency reference for these measurements. The test tunes
the spectrum analyzer frequency
across the band, uses the marker to locate the frequency with the highest response, and then
reads the average noise in zero span.
To reduce measurement uncertainty due to input attenuator switching and resolution
bandwidth switching, a reference level offset is added. The CAL OUT signal is used as the
amplitude reference for determining the amount of offset required. The offset is removed at
the end of the test by pressing
[PRESETJ
The related adjustment for this procedure is the “Frequency Response Adjustment.”
Equipment Required
Termination, 50 0
Adapter, Type N (m) to BNC (f)
Cable, BNC, 23 cm (9 in)
0.
Additional Equipment for Option 001
Termination, 75 D Type N (m)
Adapter, 75
Cable, BNC, 75 0, 30 cm (12 in)
Caution
f?,
Type N (f) to BNC (m)
Use only 75 D cables, connectors, or adapters on the 75 61 input of an Option
001 or damage to the input connector will occur.
SPECTRUM ANALYZER
Figure 1-21. Displayed Average Noise Level Test Setup
XYllO
HP 85900 Spectrum Analyzer
Calibrating 1-63
Page 76
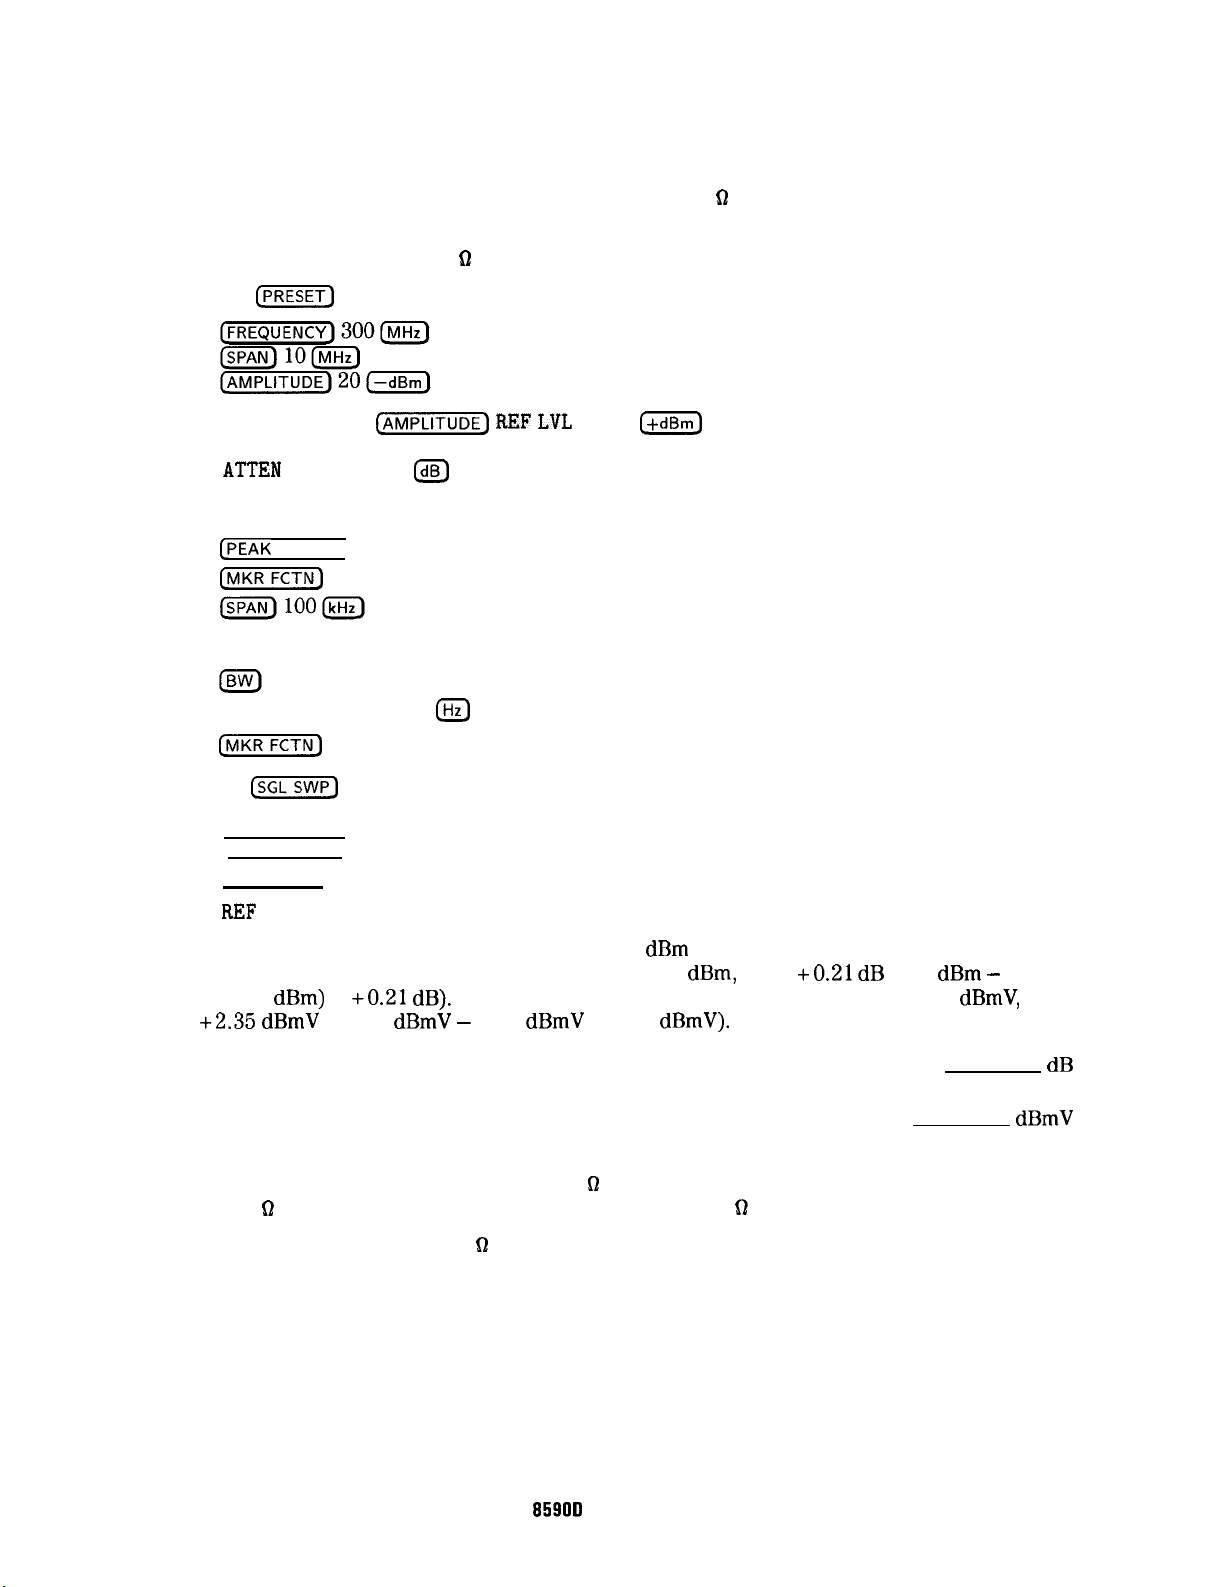
15. Displayed Average Noise Level
Procedure
1. Connect a cable from the CAL OUT to the INPUT 50 D of the spectrum analyzer as shown
in Figure 1-21.
Option 001 only: Use a 75
Press
CM)
Option 001 only:
ATTEN
and wait for the preset to finish. Set the controls as follows:
(j%KKiFj
AUTO MAN 0
61
cable and omit the adapter.
REF LWL
28.75
[dB)
(+dBm)
2. Press the following spectrum analyzer keys:
CPEAK
SEARCH]
[“KRFCTN)
MK TRACK ON OFF (ON)
Wait for the AUTO ZOOM message to disappear. Set the controls as follows:
VID BW AUTO MAN 30
1Hz)
[“KRFCIN) MK TRACK ON OFF (OFF)
3. Press
[SGLSWP_)
and wait for completion of a new sweep, then press the following spectrum
analyzer keys:
[PEAK SEARCH)
(AMPLITUDE) More 1 af 3
REF
LVL OFFSET
Subtract the MKR amplitude reading from -20
OFFSET. For example, if the marker reads -20.21
(-20.21
+2.35 dBmV
dBm)
=
+0.21 dB).
(28.75
Example for Option 001: If the marker reads 26.4
dBmV -
26.4
dBmV
= 2.35
dBm
and enter the result as the REF LVL
dBm,
enter
+0.21 dB
(-20
dBm -
dBmV).
dBmV,
enter
REF LVL OFFSET
Option 001:
REF LVL OFFSET
dBmV
4. Disconnect the cable from the INPUT 50 !l connector of the spectrum analyzer. Connect
the 50 D termination to the spectrum analyzer INPUT 50 D connector.
Option 001 only: Use the 75
62
termination.
dB
1-64 Calibrating
HP
8590D
Spectrum Analyzer
Page 77
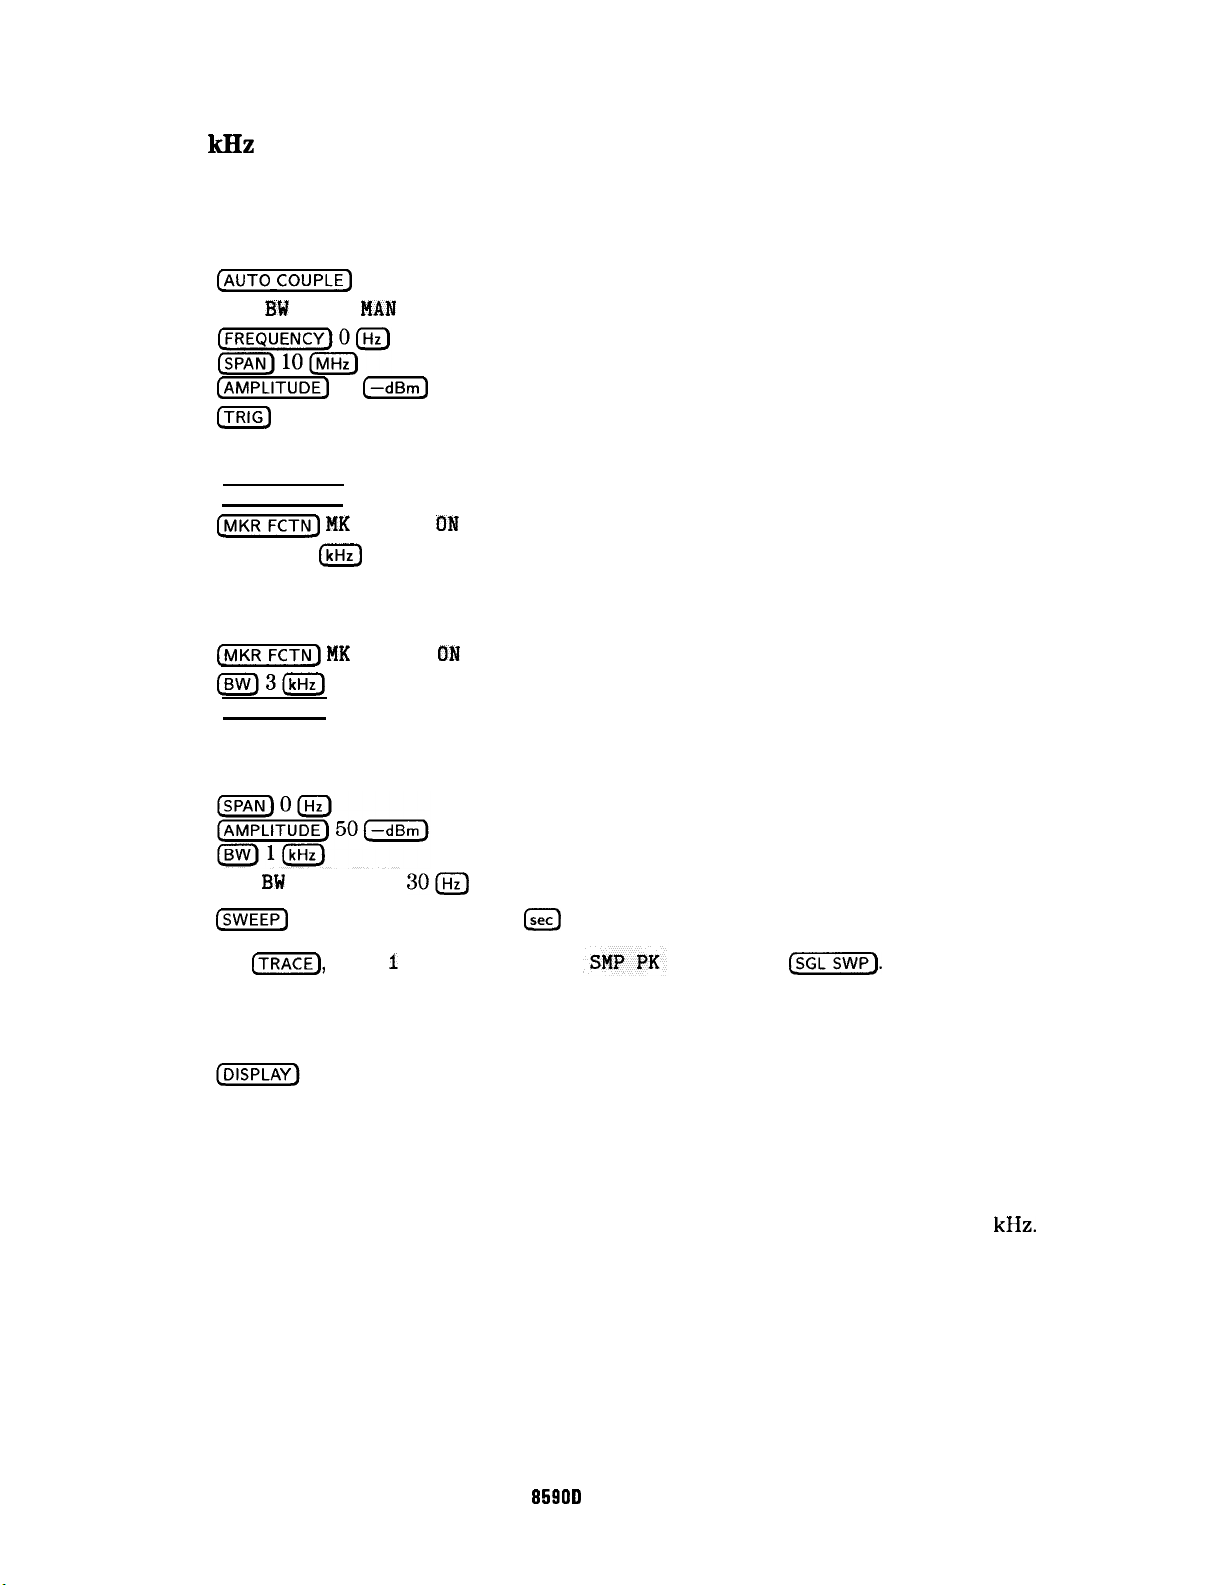
15. Displayed Average Noise Level
400
kHz
If testing a spectrum analyzer equipped with Option 001, omit steps 5 through 9 and proceed to
step 10.
5. Press the following spectrum analyzer keys:
CAUT~ coupLEj
VID 3W AUTO
#AM
(AUTO)
(mj
@@
10
cq-
SWEEP CONT SGL
6. Press the following spectrum analyzer keys:
(PEAK SEARCH)
l’j’j-
(SPAN) 800
MK TRACK ON OFF (ON)
(kHz)
Wait for the AUTO ZOOM message to disappear, then press the following spectrum analyzer
keys:
(MKRFCTN) NK
TRACK ON OFF (OFF)
iBW)3(kHz)
(FREQUENCY)
7. Adjust the center frequency until the LO feedthrough peak is on the left-most graticule
line. Set the controls as follows:
VID BW AUTO MAN
CSWEEP]
Press
SWP TIME AUTO MAN 5
(-1,
More I of 3, DETECTOR
300
[secl
(SMP), then
@ziSiF].
Wait for completion of a new sweep.
8. Press the following spectrum analyzer keys:
DSP LINE ON OFF (ON)
Adjust the display line so that it is centered on the average trace noise, ignoring any
residual responses. Refer to the Residual Responses verification test for any suspect
residuals.
9. Record the display line amplitude setting as TR Entry 15-1 as the noise level at 400
The average noise level should be less than the specified limit.
HP
95900
Spectrum Analyzer
Calibrating l-65
kHz.
Page 78
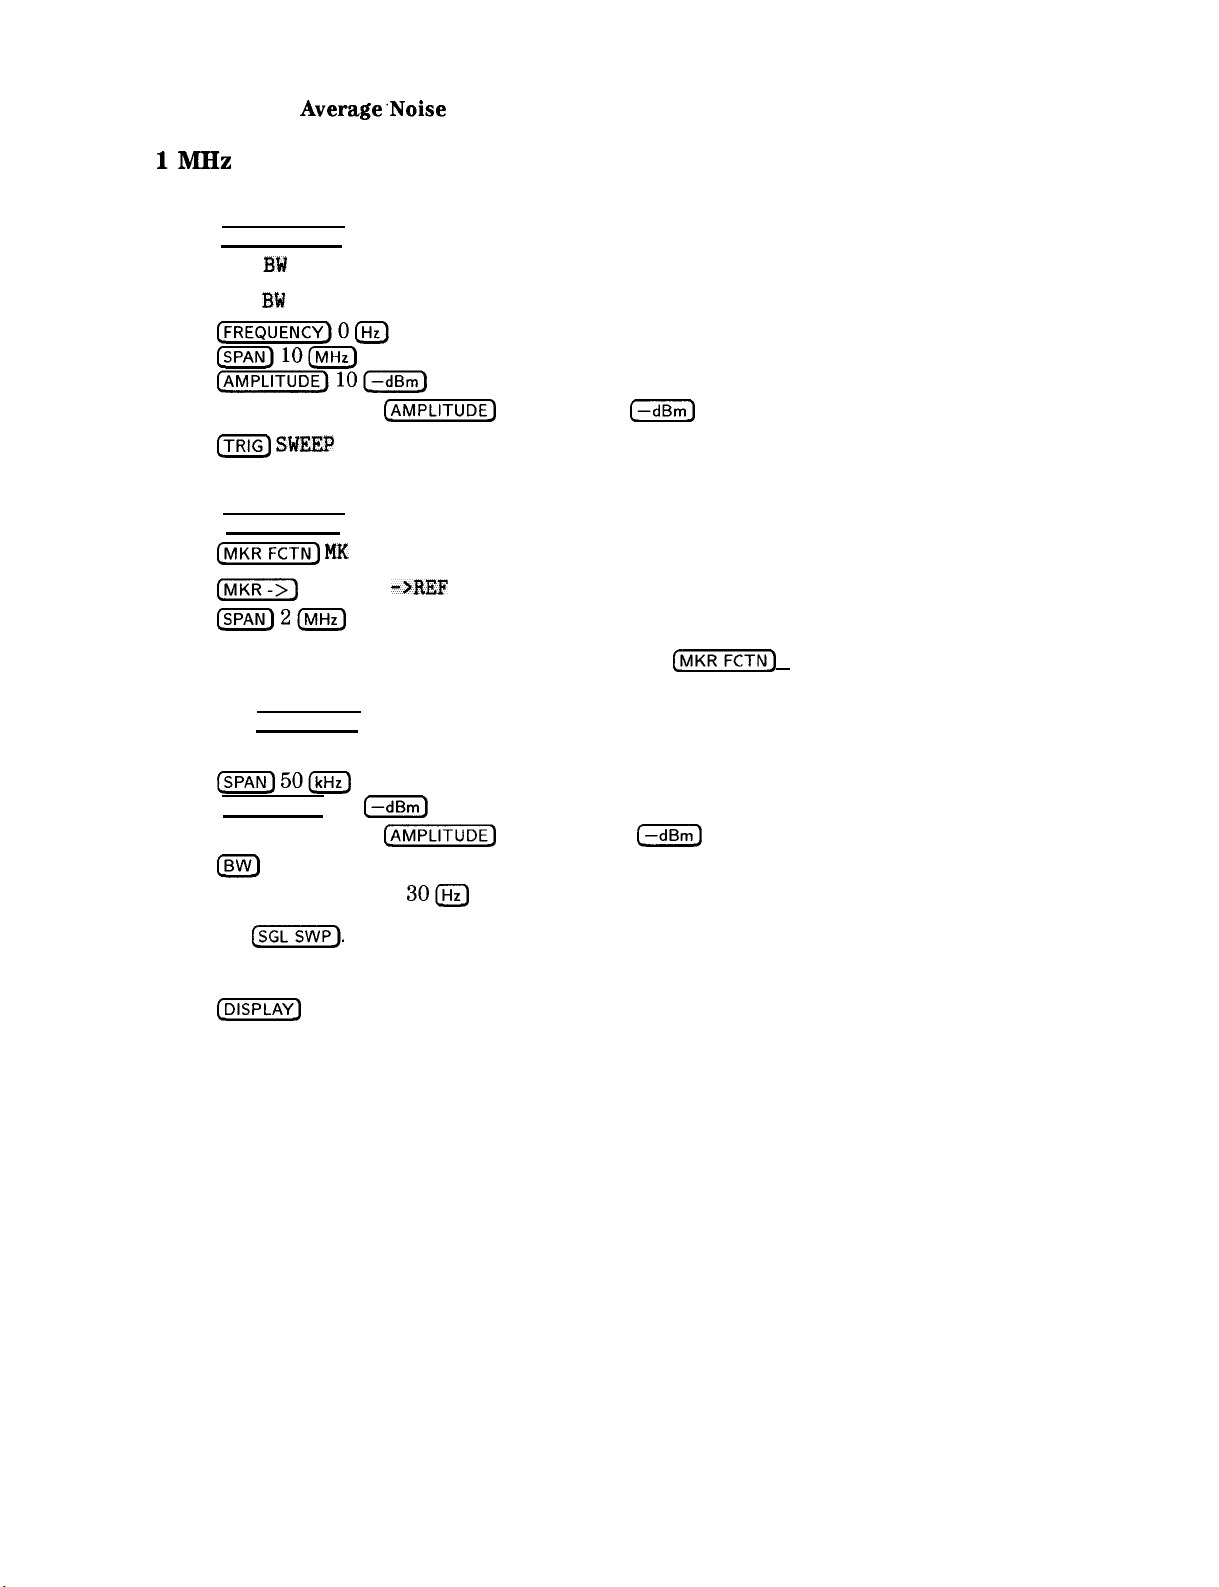
15. Displayed Average’Noise Level
1MHz
10.
Press the following spectrum analyzer keys:
(AUTO COUPLE)
RES BW AUTO MAN (AUTO)
VID BW AUTO RAN (AUTO)
Option 001 only:
LTRIG) SUEEP
11.
Press the following spectrum analyzer keys:
[PEAK SEARCH]
(jXXG-- MK
[FV1KR->)
MARKER
(jA”pL’TuDE]
REF LVL 35
CONT SGL (CONT)
TRACK ON OFF (ON)
->REF
LVL
C-dBm]
=2-
Wait for the AUTO
ZOOM
message to disappear. Press
(MKRFCIN]
then MK TRACK ON OFF
(OFF).
12.
Press (FREQUENCY_) and adjust the center frequency until the LO feedthrough peak is on the
left-most graticule line. Set the controls as follows:
ISPAN) 50m
(AMPLITUDE) 50 (TiiK]
Option 001
only:
cm’
REF LVL 1.2
(--dBm)
0
VID BW AUTO MAN
Press
13.
14.
[sGL].
Press the following spectrum analyzer keys:
Wait for the completion of a new sweep.
3Oa
(FiGiF]
DSP LINE ON OFF (ON)
Adjust the display line so that it is centered on the average trace noise, ignoring any
residual responses. Refer to the Residual Responses verification test for any suspect
residuals.
15.
Record the display line amplitude setting as TR Entry 15-2 in the performance test record
as the noise level at 1 MHz. The average noise level should be less than the specified limit.
l-66 Calibrating
HP 85900 Spectrum Analyzer
Page 79
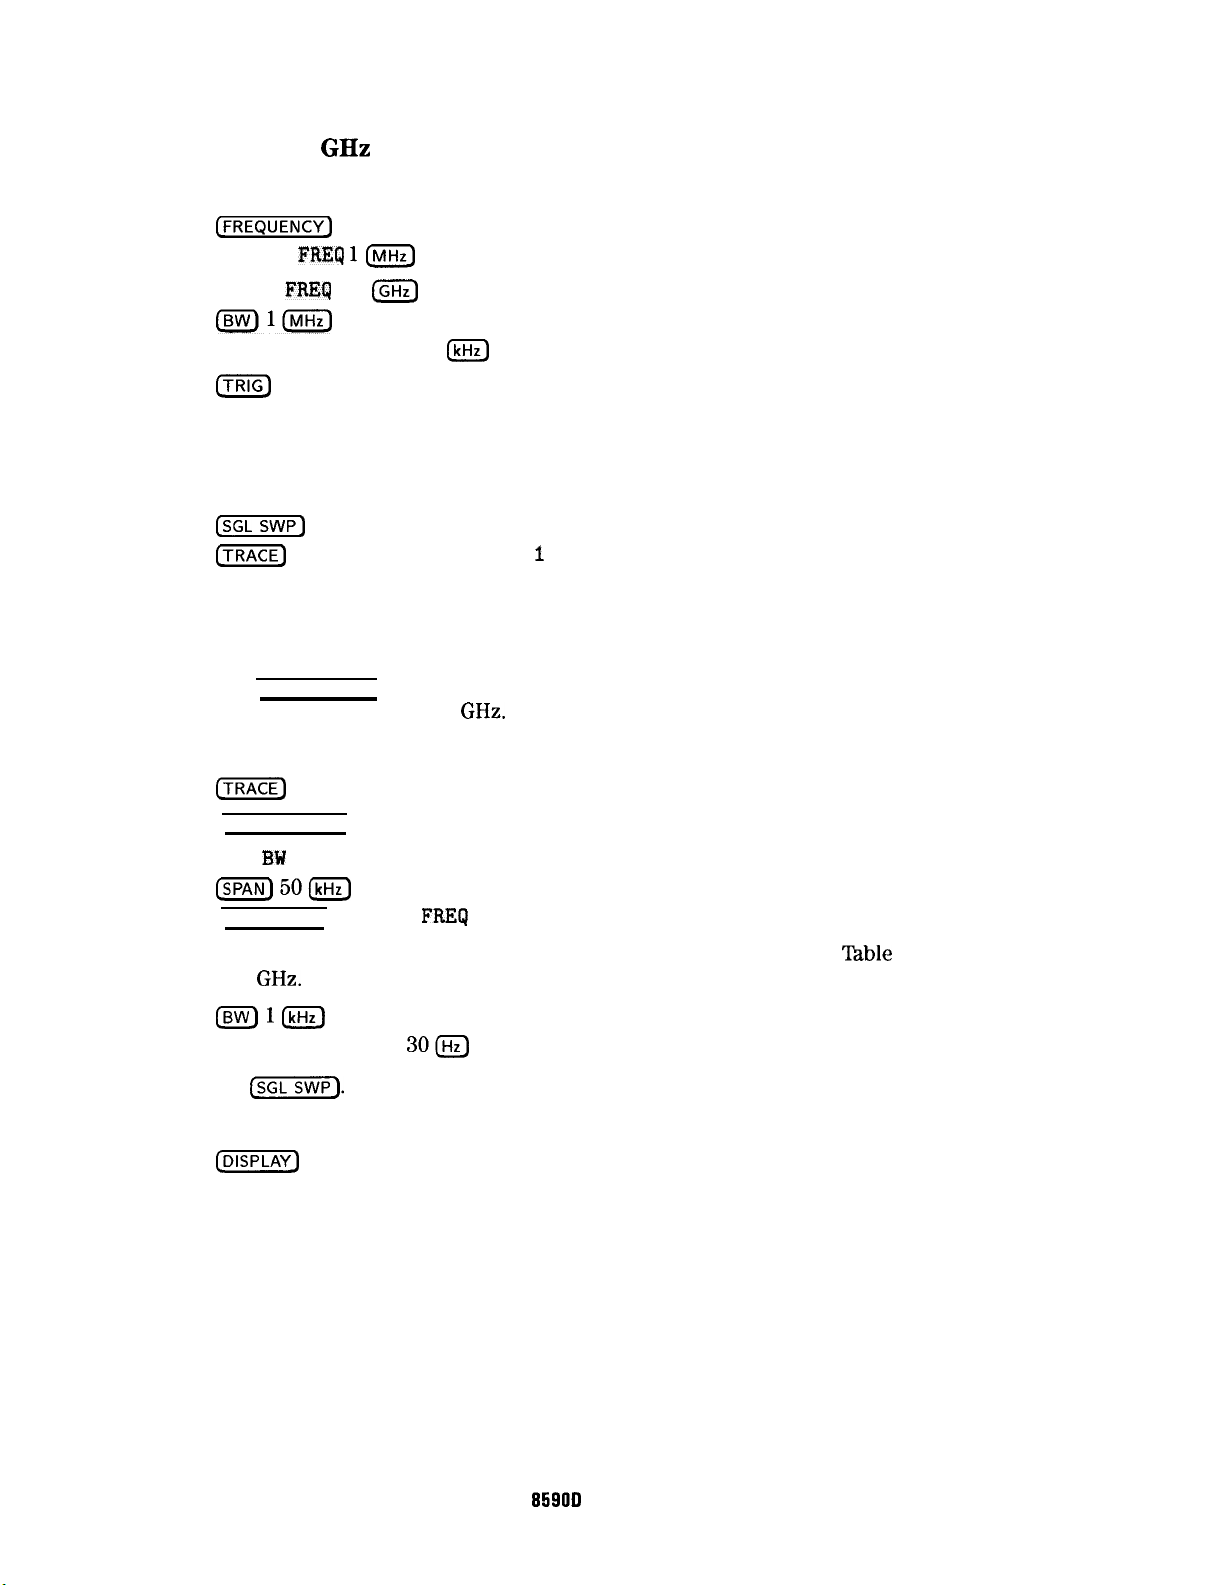
15. Displayed Average Noise Level
1 MHz to 1.5
Press the following spectrum analyzer keys:
16.
CFREQUENCY)
START
STOP
GHz
FREQ l@J
FRECJ
1.5
(GHz)
(BW)l(MHz)
VID BW AUTO MAN 10
m
SWEEP CONT SGL (CONT)
Adjust the spectrum analyzer start frequency setting, if necessary, to place the LO
17.
(kHz)
feedthrough just off-screen to the left.
Press the following spectrum analyzer keys:
18.
(TEEiF-)
C-1
CLEAR WRITE A More 1 of 3
VID AVG ON OFF (ON) 10 (Hz)
Wait until AVG 10 is displayed to the left of the graticule (the spectrum analyzer will take
ten sweeps, then stop).
Press
19.
[PEAK SEARCH) and record the MKR frequency as the Measurement Frequency in
Table 1-17 for 1 MHz to 1.5
GHz.
Press the following spectrum analyzer keys:
20.
~~~
[
More 1 of 3 VID AVG ON OFF (OFF)
AUTO COUPLE
) RES BW AUTO MAN (AUTO)
VID BW AUTO MAN (AUTO)
ISPAN)50m
[FREQUENCY] CENTER
Set the center frequency to the measurement frequency recorded in
to 1.5
GHz.
Set the controls as follows:
FREG
Table
1-17 for 1 MHz
Isw)l(kHz)
21.
VID BW AUTO MAN
Press
CsGLSWP).
300
Wait for the sweep to finish. Press the following spectrum analyzer keys:
(jDIspLAy_)
DSP LINE ON OFF (ON)
Adjust the display line so that it is centered on the average trace noise, ignoring any
residual responses. Refer to the Residual Responses verification test for any suspect
residuals.
22.
Record the display line amplitude setting as TR Entry 15-3 in the performance test record.
The average noise level should be less than the specified limit.
HP
95900
Spectrum Analyzer
Calibrating l-67
Page 80
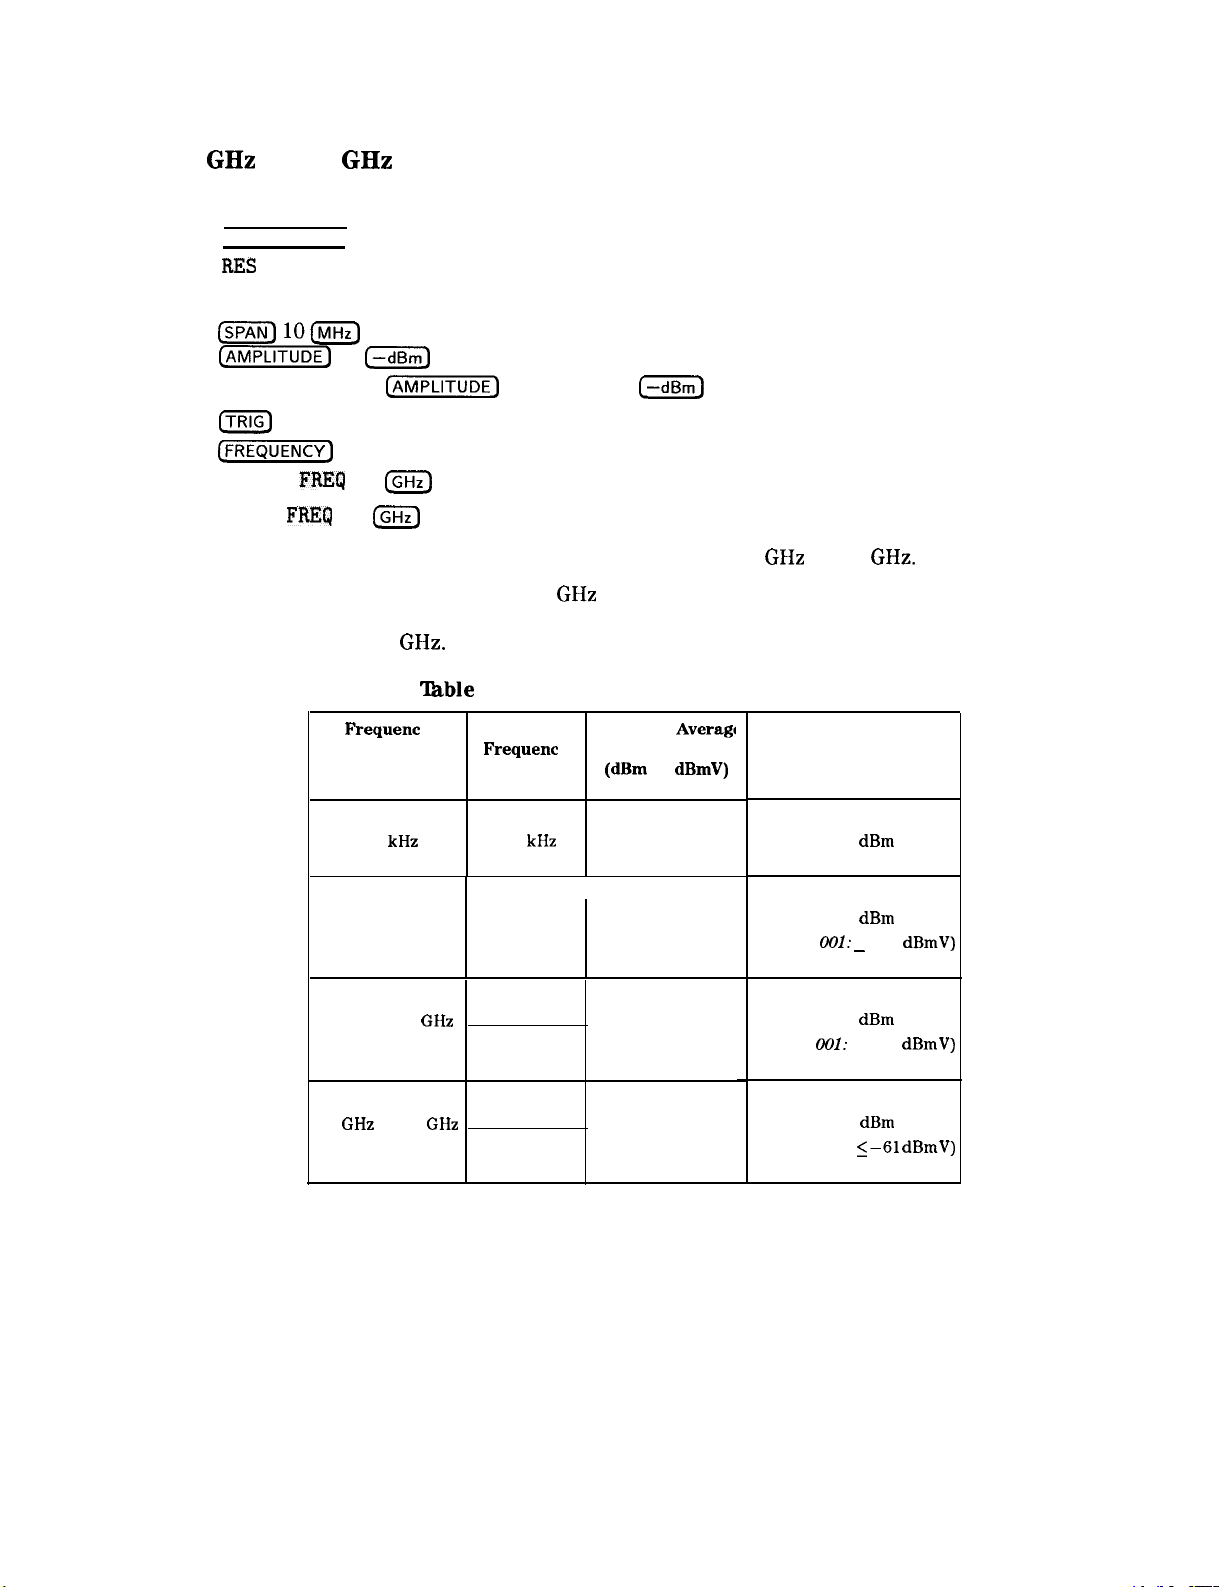
15. Displayed Average Noise Level
1.5
GHz
to 1.8
GHz
23. Press the following spectrum analyzer keys:
(AUTO COUPLE)
RES
BW AUTO MAN (AUTO)
VID BW AUTO MAN (AUTO)
ISPAN_) 100
(jizFmE)
Option 001 only:
ITRIG)
(FREQUENCY)
START
50
[-dE3m_l
(-1
REF LVL 1.2
SWEEP CONT SGL (CONT)
FREQ
1.5
LGHz)
(-dBmj
.
STOP
24. Repeat steps 18 through 21 above for frequencies from 1.5
If the Displayed Average Noise at 1.8
FREQ
1.8
IGHz)
GHz
to 1.8
GHz
is at or out of specification, it is recommended
GHz.
that a known frequency source be used as a frequency marker. This ensures that testing is
done at or below 1.8
1 MHz to 1.5
GHz.
‘able
1-17. Displayed Average Noise Level
Frequent
400
y
Range
kHz
1 MHz 1 MHz
Measurement Displayed
Frequent y
(dBm
400
kHz
GHz
Average
Noise Level
or
dBmV)
TR Entry
15-1
15-2
(Option
15-3
(Option
Specification
-115
dBm
-115
dBm
001:
<-63 dBmV)
-
-115
dBm
001:
<-63 dBmV)
-113
001:
dBm
961 dBmV)
1.5
GHz
to 1.8
GHz
Record the display line amplitude setting as TR Entry 15-4 in the performance test record.
25.
15-4
(Option
The average noise level should be less than the specified limit.
1-69 Calibrating
HP 85900 Spectrum Analyzer
Page 81
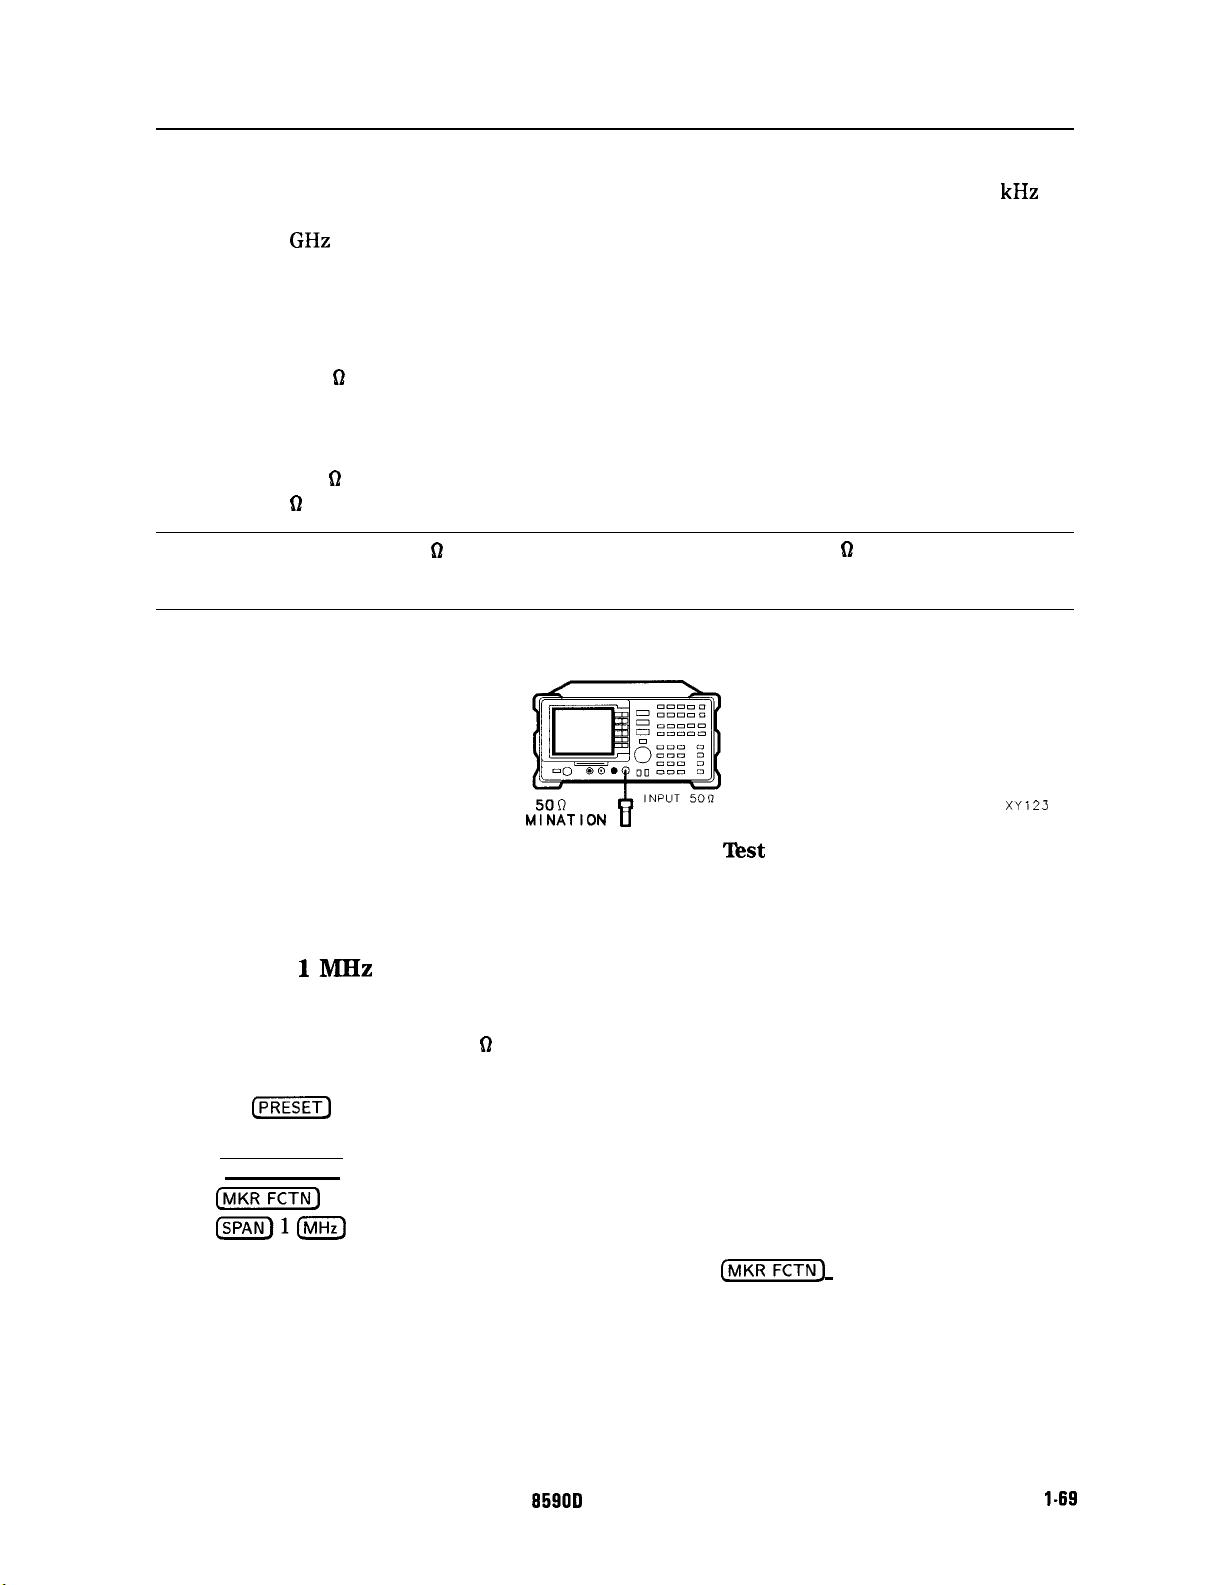
16. Residual Responses
16. Residual Responses
The spectrum analyzer input is terminated and the spectrum analyzer is swept from 150
kHz
above the LO to 1 MHz. Then the spectrum analyzer is swept in 50 MHz spans throughout the
1 MHz to 1.8
GHz
range. Any responses above the specification are noted.
There are no related adjustment procedures for this performance test.
Equipment Required
Termination, 50
Q
Additional Equipment for Option 001
Termination, 75 61 Type N (m)
Adapter, 75 0 Type N (f) to BNC (m)
Caution
Use only 75 n cables, connectors, or adapters on the 75 62 input of an Option
001 or damage to the input connector will occur.
SPECTRUM ANALYZER
TER
Figure l-22. Residual Response Test Setup
Procedure
150kHzto
1. Connect the termination to the spectrum analyzer input as shown in Figure l-22.
Option 001 only: Use the 75
proceed with step 5.
Press
2
following spectrum analyzer keys:
[PEAK SEARCH)
(jj)
ISPAN)l(MHzl
Wait for the
(OFF).
1MHz
fjj]
MK TRACK ON OFF (ON)
AUTO ZOOM
61
termination with the adapter, skip steps 2 through 4, and
on the spectrum analyzer and wait for the preset to finish. Press the
message to disappear, then press
(NlKRFCTN)
and MK TRACK ON OFF
XY123
HP
959013
Spectrum Analyzer
Calibrating
1-69
Page 82
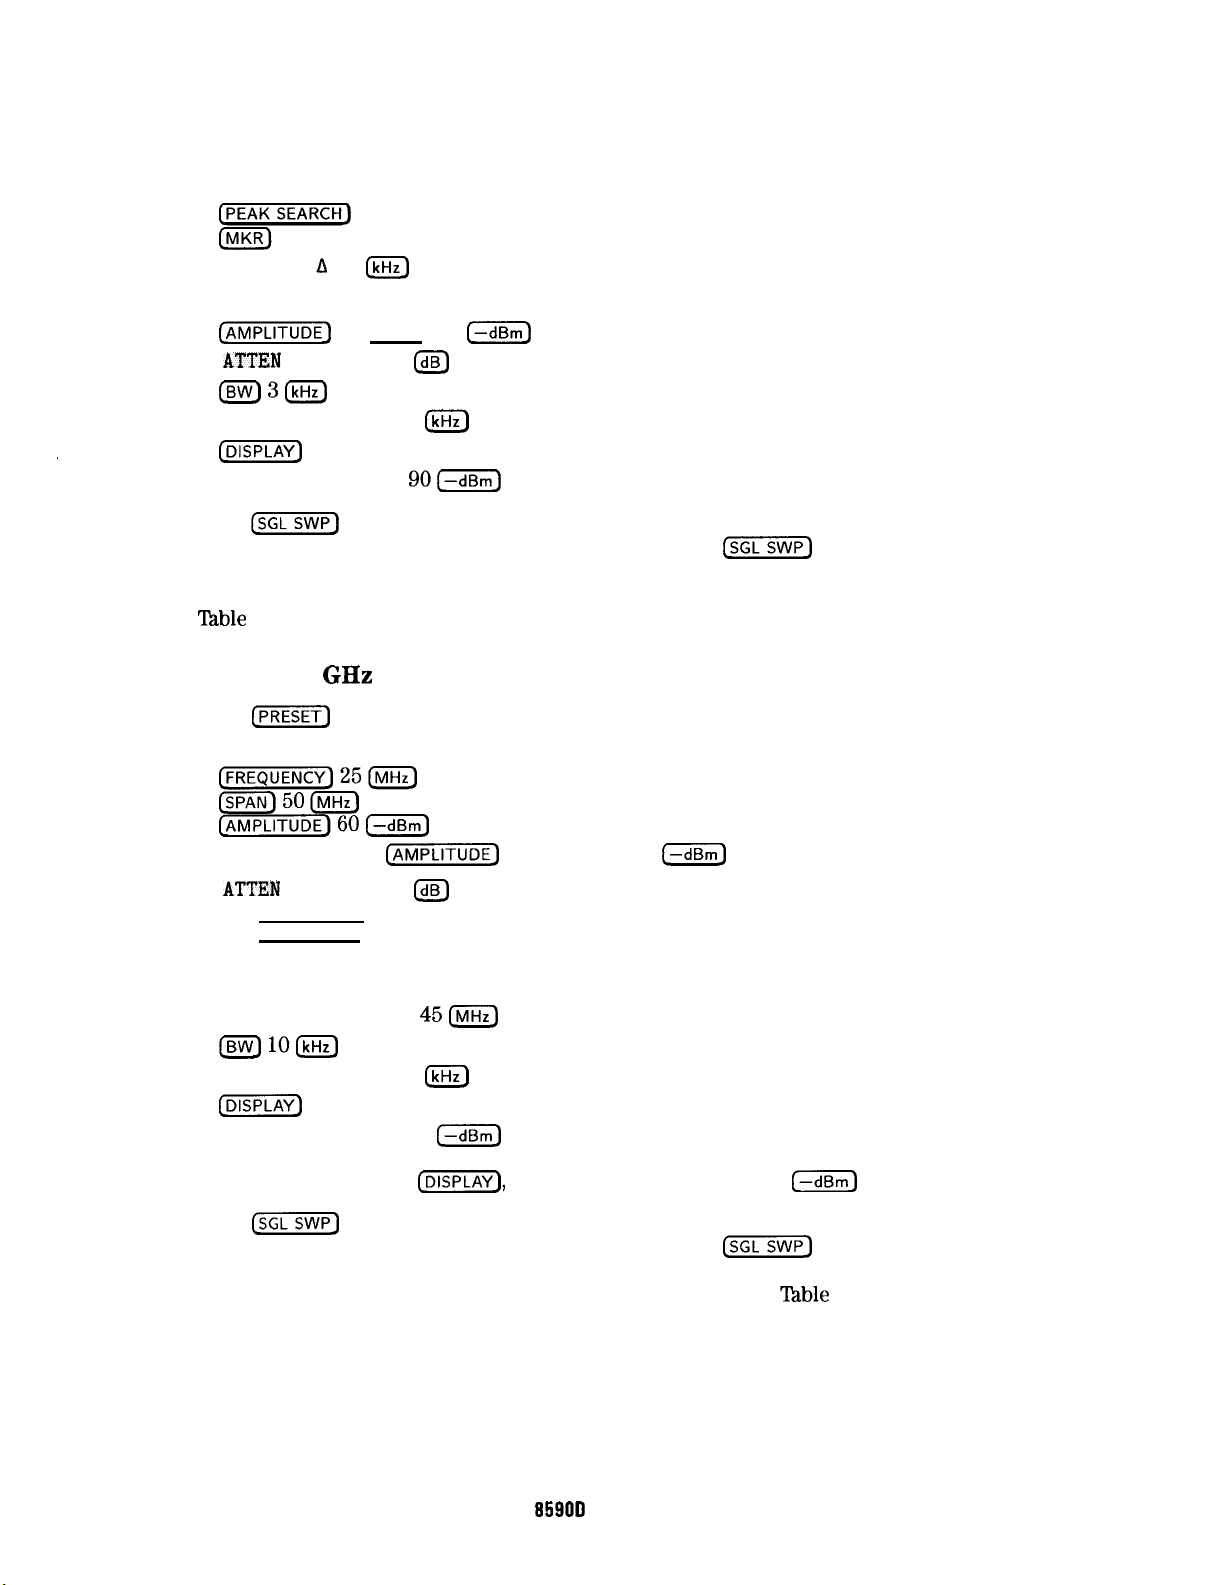
16. Residual Responses
3. Adjust the center frequency until the LO feedthrough peak is on the left-most vertical
graticule line. Press the following spectrum analyzer keys as follows:
MARKER A 150
m
MARKER NORMAL
(‘j-j
60
ATTEN
AUTO MAN 0
(-Xl
@
iBW)3(kHz)
VID BW AUTO MAN 1
m
(EisFiq
DSP LINE ON OFF
4. Press
C-1
and wait for a new sweep to finish. Look for any residual responses at or
above the display line. If a residual is suspected, press
9OcXJ
(SGLSWP)
again. A residual response
will persist on successive sweeps, but a noise peak will not. Note the frequency and
amplitude of any residual responses above the display line and to the right of the marker in
‘lhble
1-18.
1 MHz to 1.8
5. Press
c-1
GHz
on the spectrum analyzer and wait for the preset to finish. Set the controls
as follows:
~p$fiJ-fiJ-~
SPAN
@KKiKE)60(X)
Option 001
MHz
only:
CAMPLITUDE]
REF LVL 11.25
w
ATTEN
AUTO MAN 0
6. Press (FREQUENCY) and adjust the center frequency until the LO feedthrough (the “signal”
Ide_l
near the left of the screen) is just off the left-most vertical graticule line. Set the controls
as follows:
CF STEP AUTO MAN
450
(ZiJ 100
VID BW AUTO MAN 3
m
(DISPLAY)
DSP LINE ON OFF 90
Option 001 only:
7. Press
[sGL)
Press
and wait for a new sweep to finish. Look for any residual responses at or
above the display line. If a residual is suspected, press
m
c-1,
DSP LINE ON OFF , then 38
(--dBm)
(SGL’
again. A residual response
will persist on successive sweeps, but a noise peak will not. Note the frequency and
amplitude of any residual responses above the display line in
‘lhble
1-18.
l-70 Calibrating
HP
95901) Spectrum Analyzer
Page 83
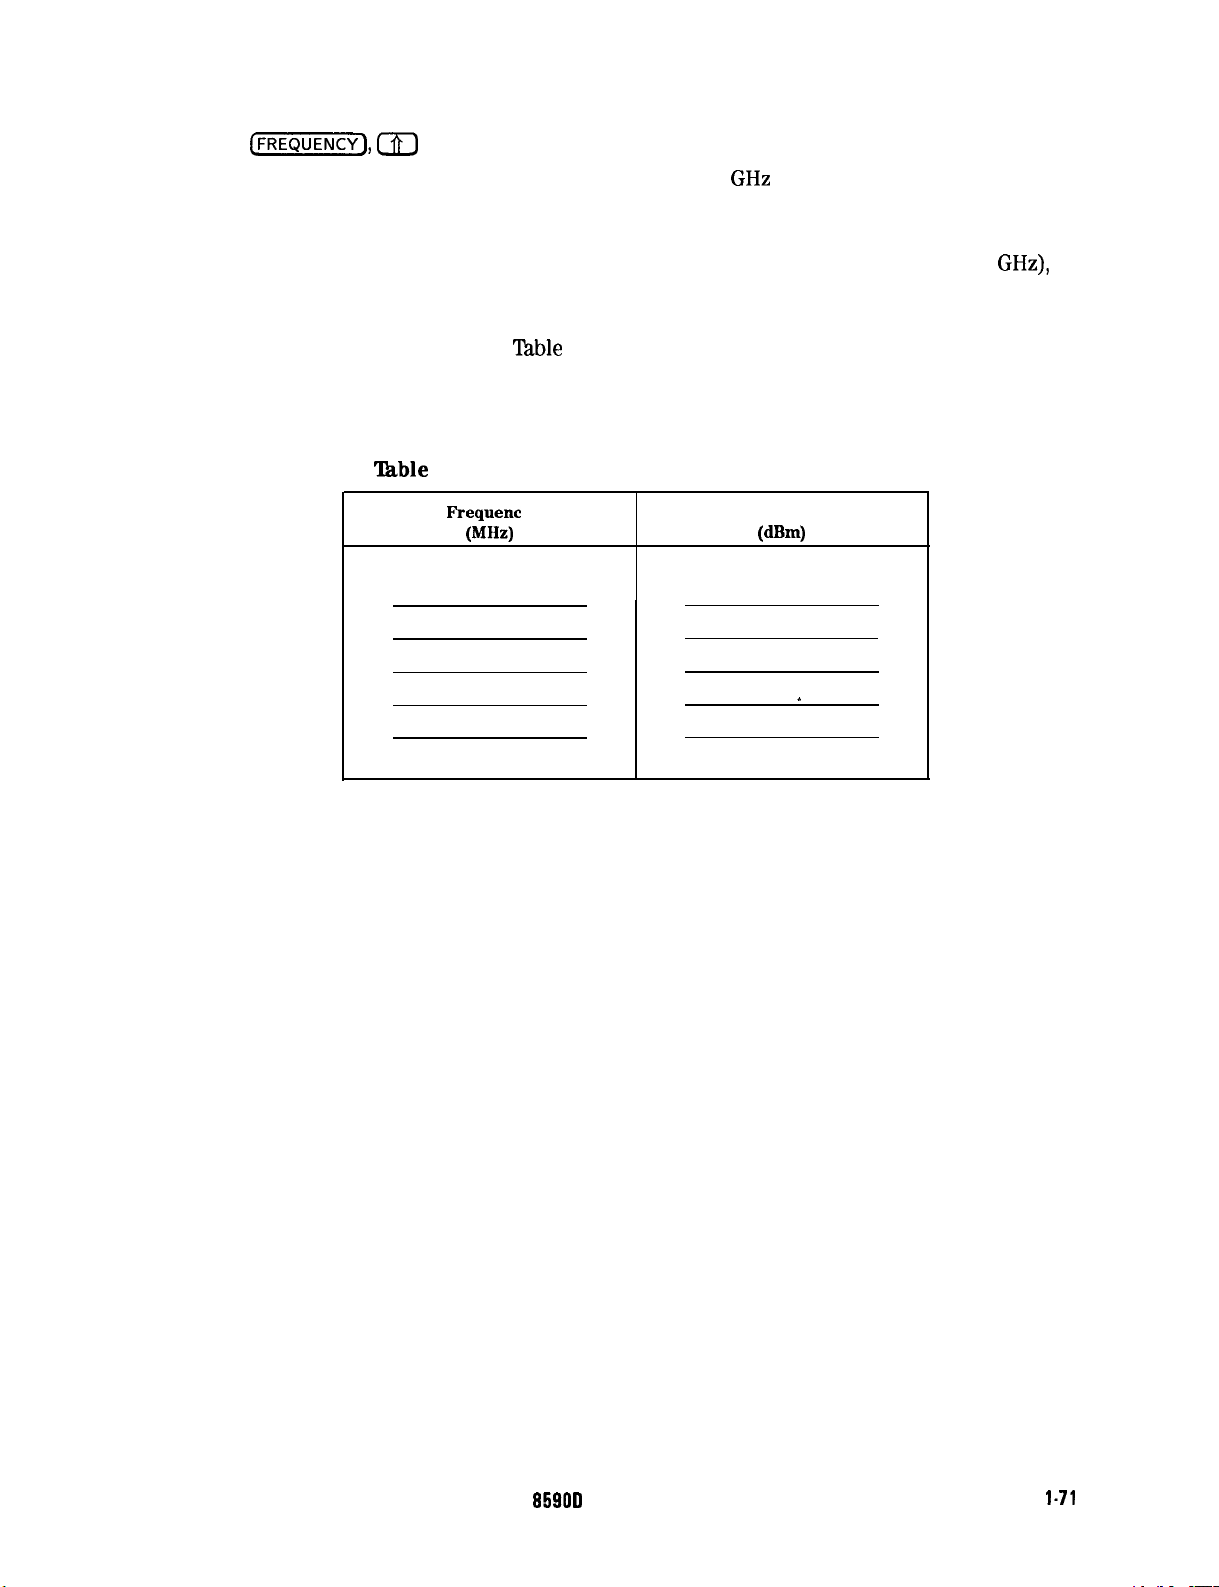
16. Residual Responses
8. Press
9. Repeat steps 7 and 8 until the range from 1 MHz to 1.8
[FREQUENCY_),
m
(step-up key), to step to the next frequency and repeat step 7.
GHz
has been checked. This
requires 40 additional frequency steps. The test for this band requires about 6 minute to
complete if no residuals are found.
If there are any residuals at or near the frequency specification limits (1 MHz or 1.8
it is recommended that a known frequency source be used as a frequency marker. This will
ensure that testing is done within the specification limits.
10. Record the highest residual from
‘Ihble
1-18 as TR Entry 16-1 in the performance test
record. If no residuals are found, then record N/A in the performance test record.
‘Ihble
1-18. Residual Responses Above Display Line
Frequent y
(MHz)
Amplitude
Wm)
GHz),
HP
95900
Spectrum Analyzer
Calibrating
l-71
Page 84
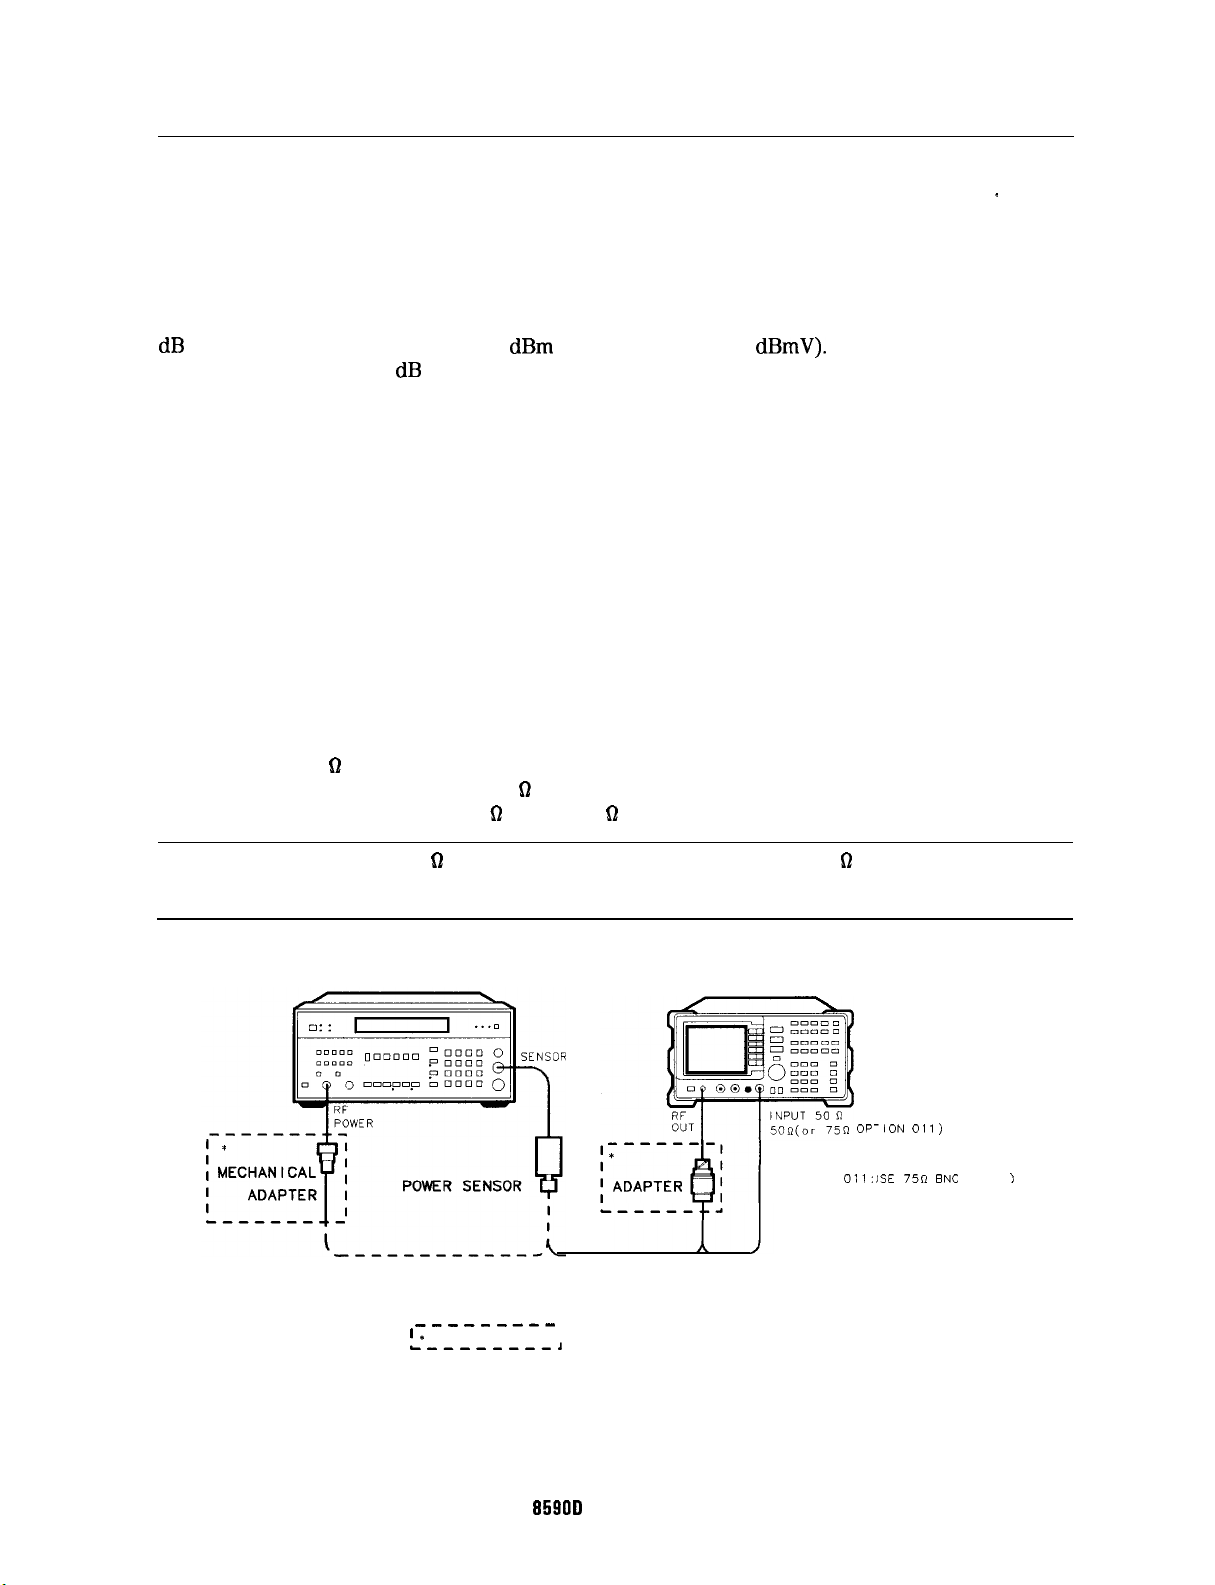
17. Absolute Amplitude, Vernier, and Power Sweep Accuracy
This procedure is only for spectrum analyzers equipped with Option 010 or 011.
’
The tracking generator output is connected to the spectrum analyzer input and the tracking is
adjusted at 300 MHz for a maximum signal level. A calibrated power sensor is then connected
to the tracking generator output to measure the power level at 300 MHz.
The measuring receiver is then set for RATIO mode so that future power level readings are in
dB
relative to the power level at -10
dBm
(Option 011: + 38.8
dBmV).
The output power level
setting is decreased in 1 dB steps and the power level is measured at each step. The difference
between ideal and actual power levels is calculated at each step.
Since a power sweep is accomplished by stepping through the vernier settings, the
peak-to-peak variation of the vernier accuracy is equal to the power sweep accuracy.
The related adjustment for this procedure is the “Modulator Offset and Gain Adjustment.”
Equipment Required
Measuring receiver
Power sensor
Cable, Type N, 62 cm (24 in)
Additional Equipment for Option 011
Power sensor
Cable, BNC, 75
Adapter, Type N (f) to BNC (m), 75 0
Adapter, mechanical, Type N, 50 fl (m) to 75 62 (f)
D
Caution
Use only 75 hl cables, connectors, or adapters on the 75 62 input of an Option
011 or damage to the input connector will occur.
MEASURING RECEIVER
------em-
I*
OPTION 011 ONLY’
h--------J
Figure 1-23. Absolute Amplitude, Vernier, and Power Sweep Accuracy Test Setup
SPECTRUM ANALYZER
TYPE N CABLE
(
OPTION
OPl
011: L
-ION 01
1SE 75R
1)
ENC
CABLE
i
XY124
1-72 Calibrating
HP
959013
Spectrum Analyzer
Page 85
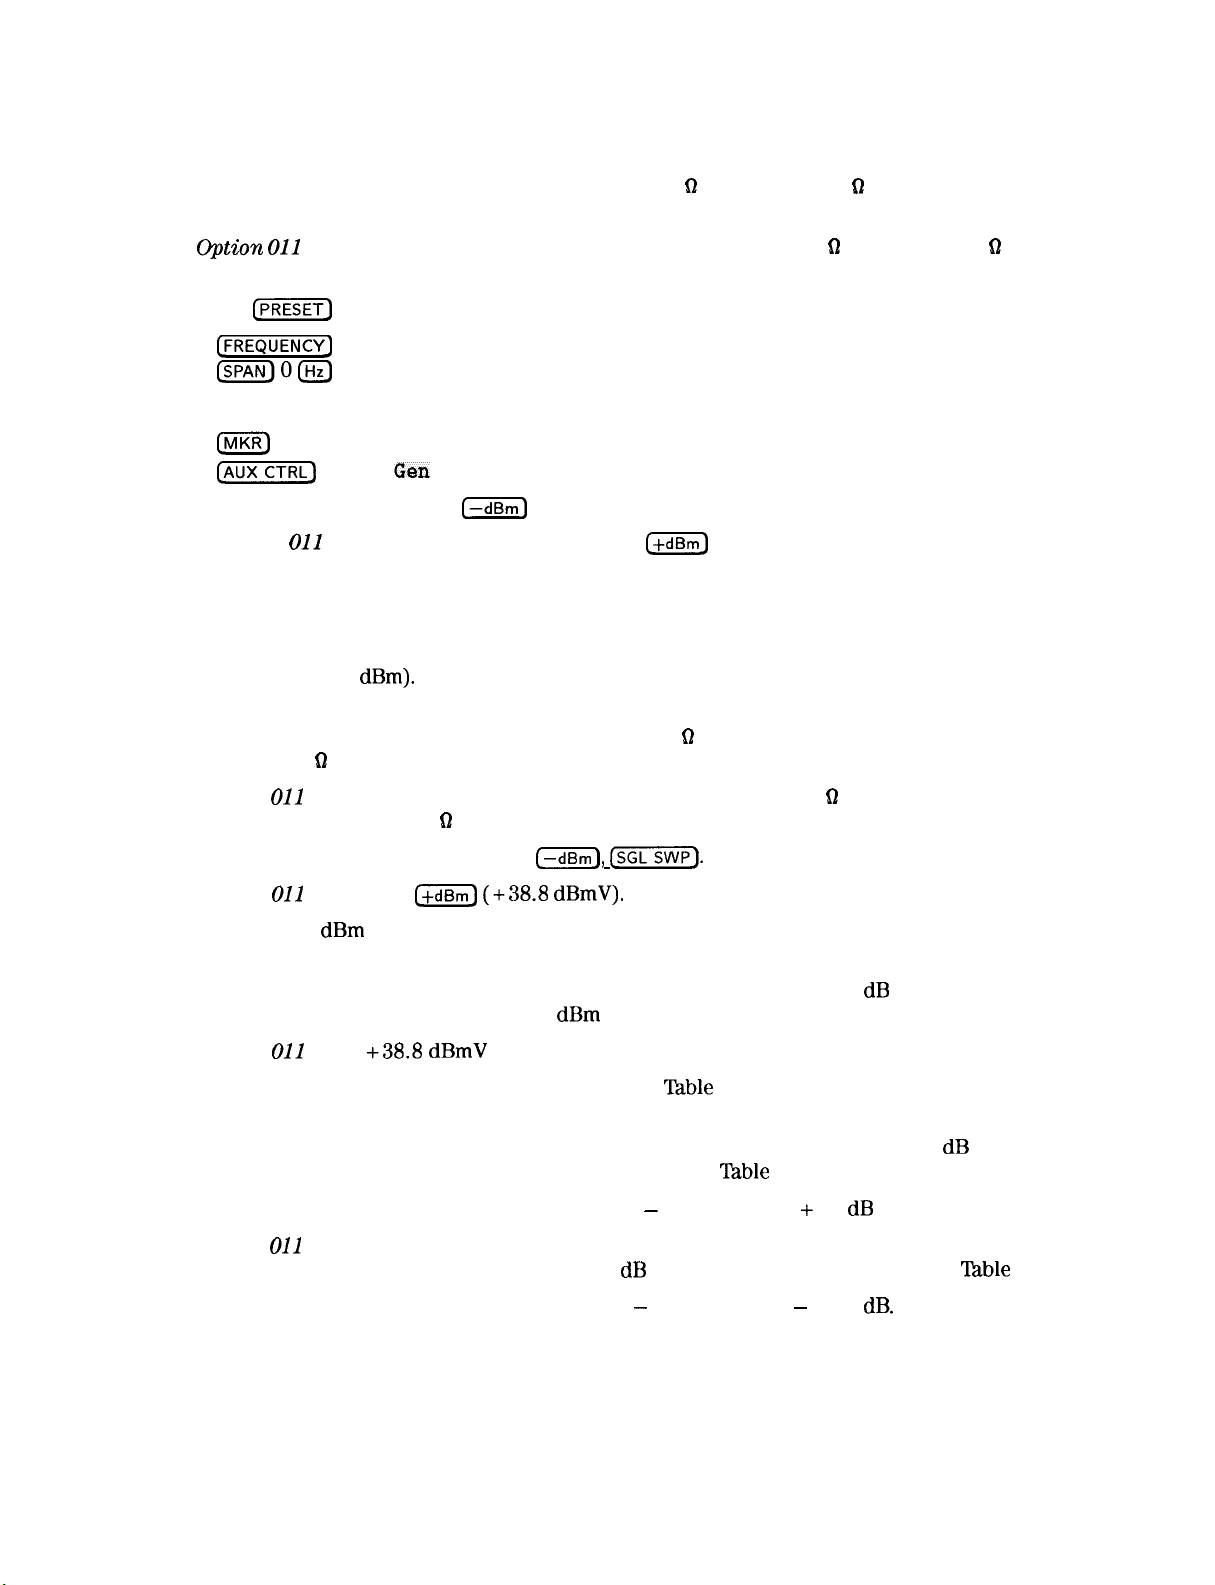
17. Absolute Amplitude, Vernier, and Power Sweep Accuracy
Procedure
Connect the Type N cable between the RF OUT 50 9 and INPUT 50 0 connectors on the
1.
spectrum analyzer. See Figure l-23.
@@ion 011
only: Connect the BNC cable between the RF OUT 75 62 and INPUT 75
62
connectors on the spectrum analyzer.
Press
2.
C-1
FREQUENCYI)
on the spectrum analyzer and set the controls as follows:
300 (MHz)
&OO
3.
On the spectrum analyzer, press the following keys:
IIV1KR)
[AUXCTRL)
Track
Gen
SRC PWR ON OFF (ON) 5 (-dBm]
Option
4.
On the spectrum analyzer, press TRACKING PEAK . Wait for the PEAKING message to
011
only:
SRC PWR ON OFF (ON) 38
I+dBm)
disappear.
5.
Zero and calibrate the measuring receiver/power sensor combination in log mode (power
levels readout in
dBm).
Enter the power sensor’s 300 MHz Cal Factor into the measuring
receiver.
6.
Disconnect the Type N cable from the RF OUT 50 61 and connect the power sensor to the
RF OUT 50 D as shown in Figure l-23.
Option
011
only: Disconnect the BNC cable from the RF OUT 75 Q and connect the power
sensor to the RF OUT 75 0 using an adapter.
On the spectrum analyzer, press 10
7.
Option
Subtract -10
8.
011
only: 38.8
dBm
I+dBm)
from the power level displayed on the measuring receiver and record
(+38.8
C-1, [SWP].
dBmV).
the result in the performance test record as TR Entry 17-1.
Press RATIO on the measuring receiver. Power levels now readout in
9.
power level just measured at the -10
Option
Set the SRC POWER to the settings indicated in
10.
011
only:
+38.8 dBmV
output power level setting.
dBm
output power level setting.
‘Ihble
1-19. At each setting, record the
dB
relative to the
power level displayed on the measuring receiver.
Calculate the Vernier Accuracy by subtracting the SRC POWER setting and 10 dB from the
11.
Measured Power Level for each SRC POWER setting in
Vernier Accuracy = Measured Power Level - SRC POWER + 10
Option
011
only:
Calculate the Vernier Accuracy by subtracting the SRC POWER setting
from the Measured Power Level, adding 38.8 dB to each SRC POWER setting in
Vernier Accuracy = Measured Power Level - SRC POWER - 38.8
12.
Locate the most positive and most negative Absolute Vernier Accuracy values in Table 1-19
‘lhble
1-19.
dB
dB.
Table
l-19.
and record as TR Entries 17-2 and 17-3 in the performance test record.
HP 85900 Spectrum Analyzer
Calibrating 1-73
Page 86
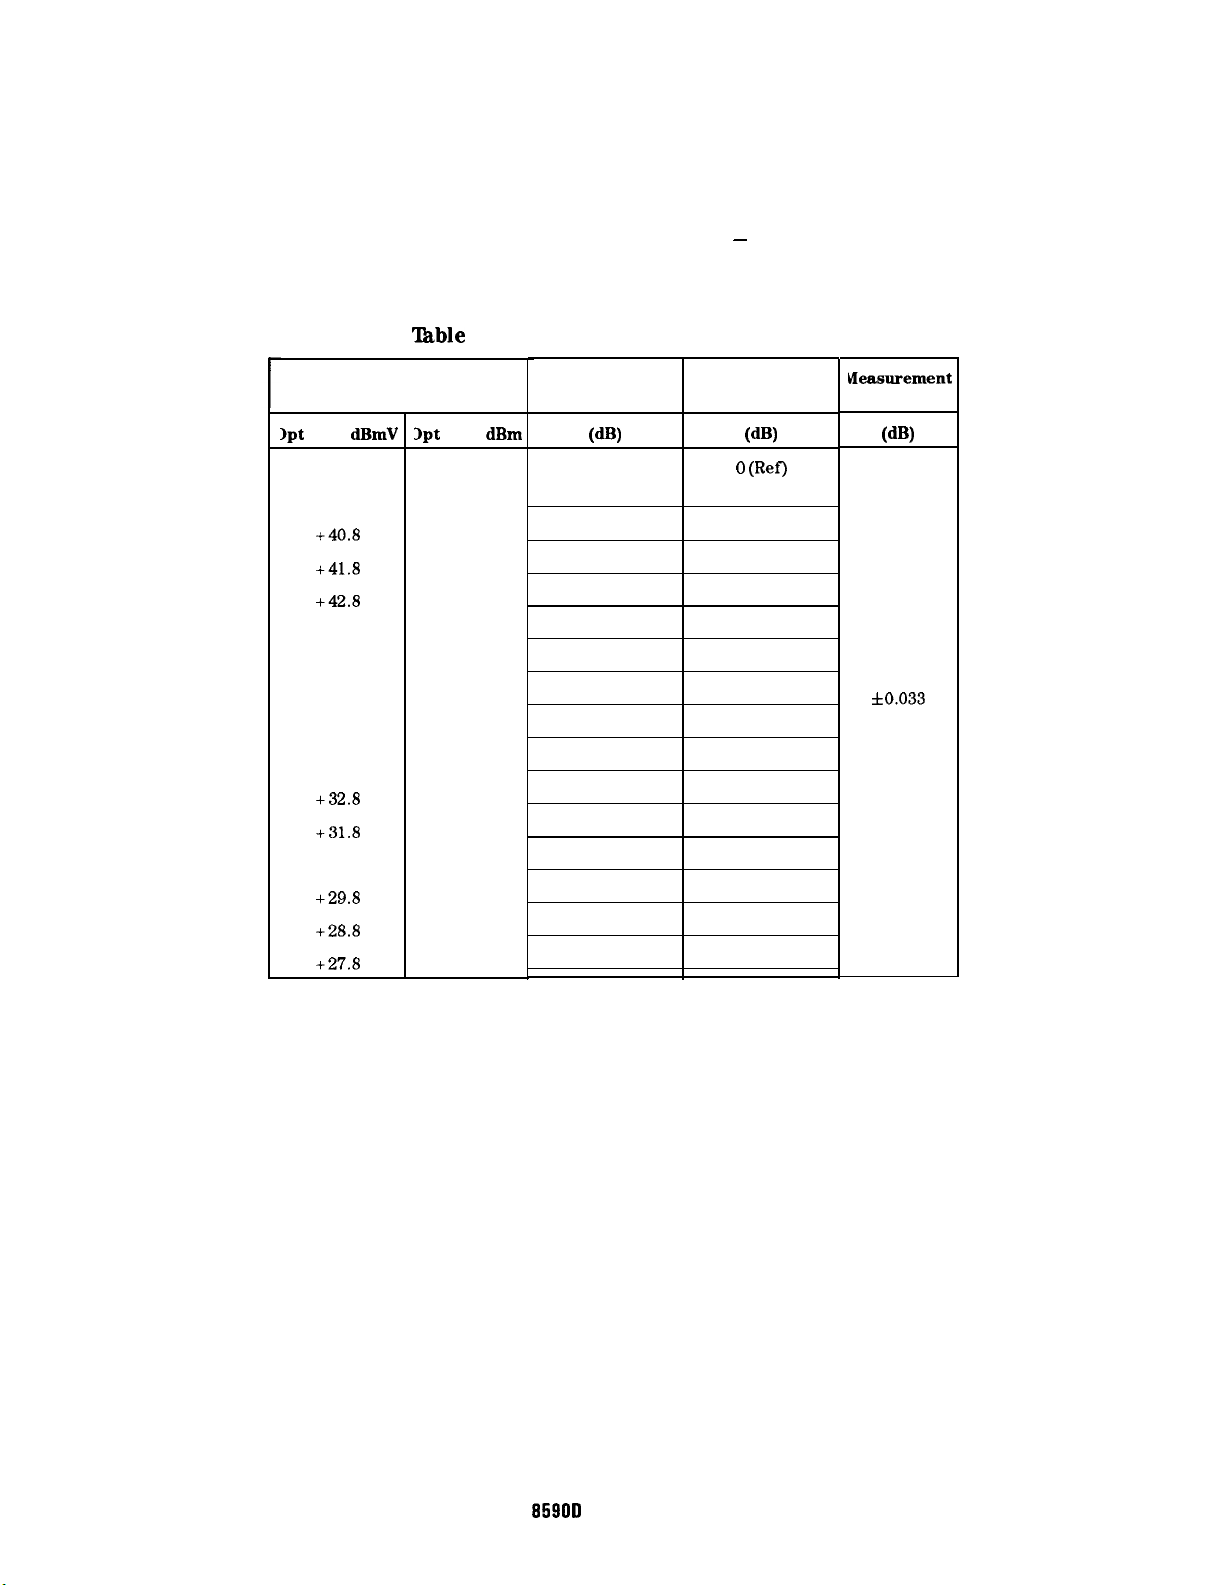
17. Absolute Amplitude, Vernier, and Power Sweep Accuracy
13. Calculate the power sweep accuracy by subtracting the Negative Vernier Accuracy
recorded in step 12 from the Positive Vernier Accuracy recorded in step 12. Record the
result in the performance test record as TR Entry 17-4.
Power Sweep Accuracy = Positive Vernier Accuracy - Negative Vernier Accuracy
‘Ihble
1-19. Vernier Accuracy Worksheet
SRC POWER Setting
Ipt
011, dBmV
+ 38.8
+ 39.8
+40.8
+41.8
+42.8
+ 37.8
+ 36.8
+ 35.8
+ 34.8
+ 33.8
+32.8
+31.8
+ 30.8
+29.8
+28.8
+27.8
Ipt
010, dBm
-10
-9
-8
-7
-6
-5
-4
-3
-2
-1
-1.5
-14
-13
-12
-11
Measured
Power Level Accuracy
T
WV
0 (Ref)
0
Vernier
VW
0 UW
Ueasurement
Uncertainty
WY
0
f0.033
f0.033
f0.033
f0.033
f0.033
f0.033
60.033
f0.033
f0.033
f0.033
f0.033
f0.033
f0.033
f0.033
f0.033
1-74 Calibrating
HP
95900
Spectrum Analyzer
Page 87
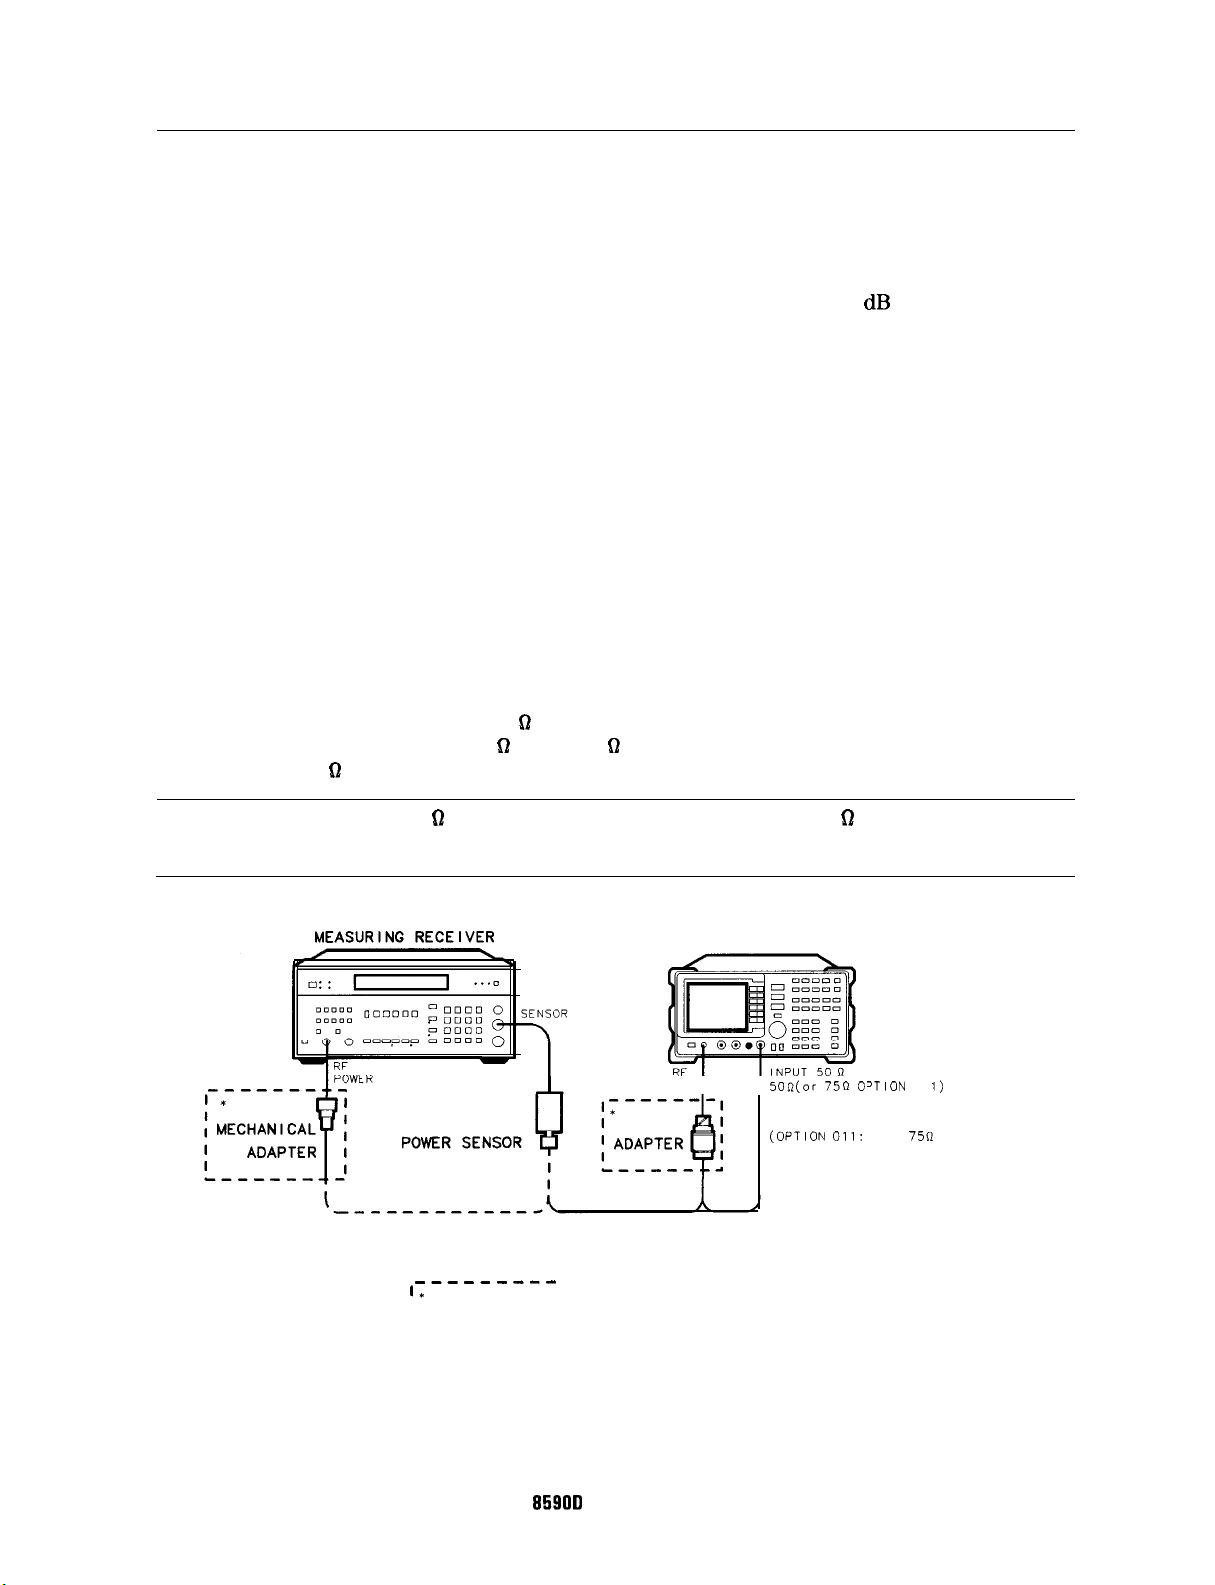
18. Tracking Generator Level Flatness
18. Tracking Generator Level Flatness
This procedure is only for spectrum analyzers equipped with Option 010 or 011.
The tracking generator output is connected to the spectrum analyzer input and the tracking is
adjusted at 300 MHz for a maximum signal level. A calibrated power sensor is then connected
to the tracking generator output to measure the power level at 300 MHz. The measuring
receiver is set for RATIO mode so that future power level readings are in
power level at 300 MHz.
The tracking generator is stepped to several frequencies throughout its range. The output
power difference relative to the power level at 300 MHz is measured at each frequency and
recorded.
The related adjustment for this procedure is the “Modulator Offset and Gain Adjustment.”
Equipment Required
Measuring receiver
Power sensor
Cable, Type N, 62 cm (24 in)
Additional Equipment for Option 011
dB
relative to the
Power sensor
Adapter, Type N (f) to BNC (m), 75
61
Adapter, mechanical, Type N, 50 61 (m) to 75 D (f)
Cable, BNC, 75
Caution
D
Use only 75 0 cables, connectors, or adapters on the 75 0 input of an Option
011 or damage to the input connector will occur.
------e-e
I*
OPTION 011 ONLY
L--------l
Figure l-24. Tracking Generator Level Flatness Test Setup
I
SPECTRUM ANALYZER
OUT
I I
50I2(or 75n 01
TYPE N CABLE
(OPTION 011:
‘TION
USE
01
75R
1)
BNC C
ABLE)
XY124
HP
95900
Spectrum Analyzer
Calibrating l-75
Page 88
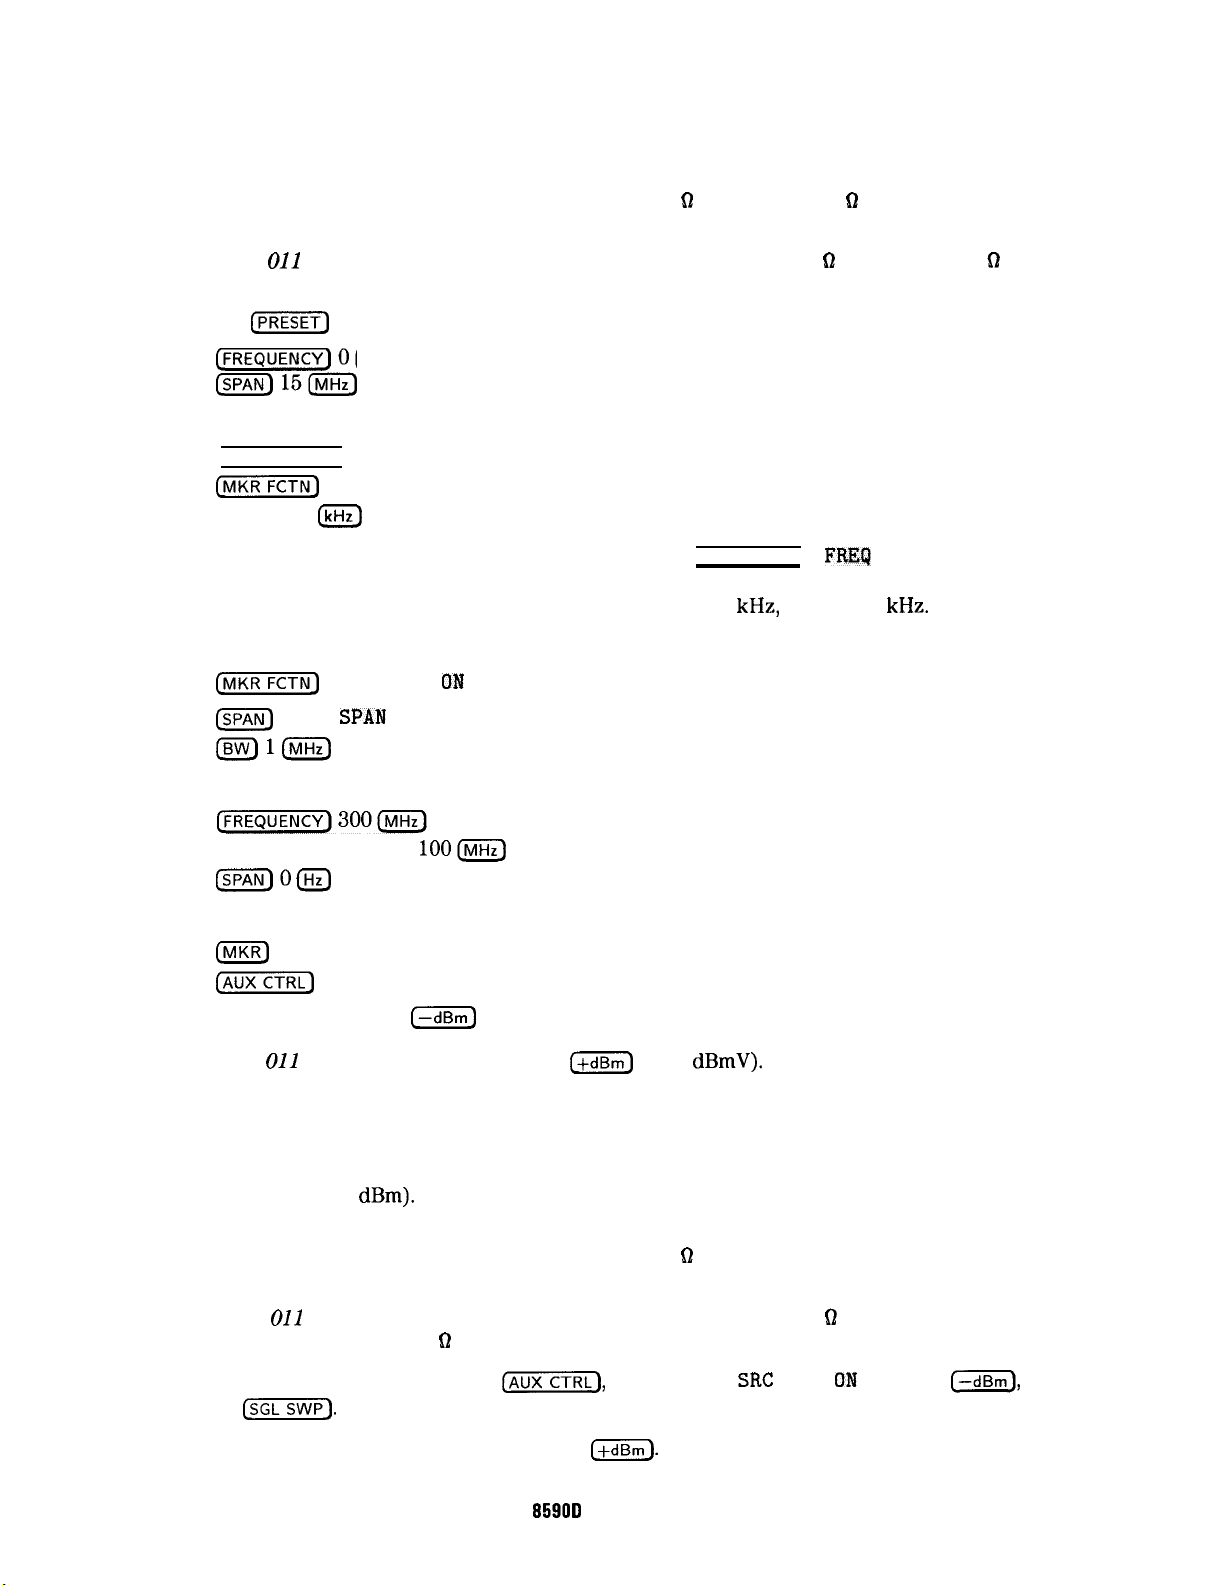
18. Tracking Generator Level Flatness
Procedure
Connect the Type N cable between the RF OUT 50 61 and INPUT 50 D connectors on the
1.
spectrum analyzer. See Figure l-24.
Option
011
only:
Connect the BNC cable between the RF OUT 75 Q and INPUT 75
connectors on the spectrum analyzer.
2.
Press
(jj)
FREQUENCY) 0 (Hz)
on the spectrum analyzer. Set the controls as follows:
&15@KJ
3.
Press the following spectrum analyzer keys:
(PEAK SEARCH)
(MKRFCTN)
(SPAN) 100
Wait for the
MK TRACK ON OFF (ON)
m
AUTO ZOOM
message to disappear. Press [
FREQUENCY
),
FREQ
OFFSET. Enter
the negative of the MKR-TRK frequency displayed in the upper right-hand corner of the
display. For example, if the MKR-TRK frequency is 132
kHz,
enter -132
kHz.
Set the spectrum analyzer controls as follows:
[MKRFCTN)
m
MK TRACK OK OFF (OFF)
ZERO
SPA??
Wl(MHz)
4.
Set the spectrum analyzer controls as follows:
61
CF STEP AUTO MAN
(SPAN)OIHz)
5.
On the spectrum analyzer, press the following keys:
lOO=
INIKR)
[CTRL)
SRC PWR ON OFF 5
Option
6.
On the spectrum analyzer, press TRACKIWG PEAK . Wait for the
Track Gen
011
only:
(--dBm]
SRC PWR ON OFF 38
(+dBm)
(+ 38
dBmV).
PEAKING
message to
disappear.
7.
Zero and calibrate the measuring-receiver/power-sensor combination in log mode (power
levels readout in
dBm).
Enter the power sensor’s 300 MHz Cal Factor into the measuring
receiver.
8.
Disconnect the Type N cable from the RF OUT 50 D and connect the power sensor to the
RF OUT 50 0.
Option
011
only: Disconnect the BNC cable from the RF OUT 75 D and connect the power
sensor to the RF OUT 75 D using an adapter.
9.
On the spectrum analyzer, press
then
CsGL).
(AUXCTRL),
Track Gen ,
SIX
PWR OK OFF , 10
[-dBm),
Option
1-76 Calibrating
011
only:
SRC PWR ON OFF 38.8
HP
C+dBm).
8580D
Spectrum Analyzer
Page 89
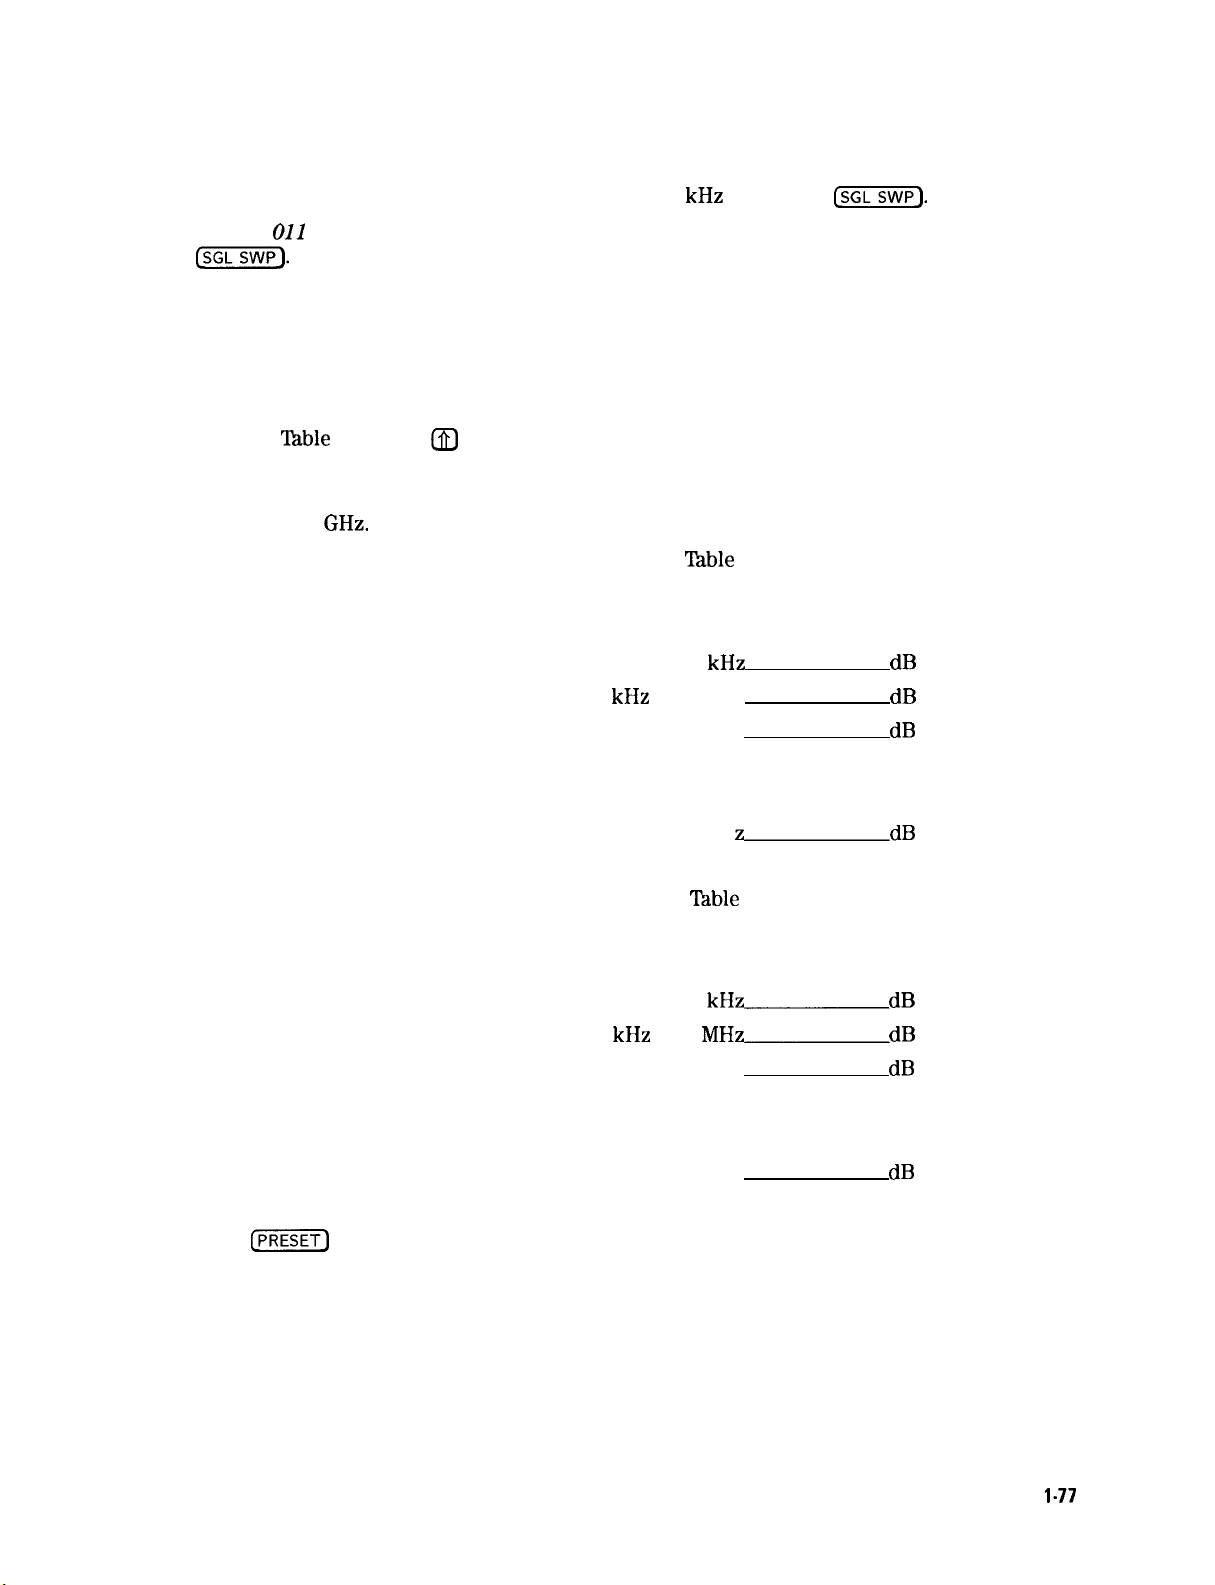
18. Tracking Generator Level Flatness
10. Press RATIO on the measuring receiver. The measuring receiver readout is now for power
levels relative to the power level at 300 MHz.
11. Set the spectrum analyzer center frequency to 100
Option
011
only: Set the spectrum analyzer center frequency to 1 MHz then press
kHz
then press
CsGL].
@EmiF-).
12. Enter the appropriate power sensor Cal Factor into the measuring receiver as indicated in
Table l-20.
13. Record the power level displayed on the measuring receiver as the Level Flatness in
Table l-20.
14. Repeat steps 11 through 13 above to measure the flatness at each center frequency setting
listed in
‘Ihble
l-20. The
(h)
(step-up) key may be used to tune to center frequencies above
100 MHz.
Spectrum analyzers equipped with Option 011 should be tested only at frequencies of
1 MHz to 1.8
GHz.
15. Locate the most positive Level Flatness reading in Iable l-20 for the indicated frequency
ranges and record as the Maximum Flatness.
Option 010:
Maximum Flatness, 100
Maximum Flatness, 300
kHz
to 5 MHz
Maximum Flatness, 10 MHz to 1800 MHz
kHz
dB
(TR Entry 18-l)
dB
(TR Entry 18-2)
dB
(TR Entry 18-3)
Maximum Flatness, 1 MHz to 1800 MH
16. Locate the most negative Level Flatness reading in
ranges as the Minimum Flatness.
Minimum Flatness, 100
Minimum Flatness, 300
kHz
to 5
Minimum Flatness, 10 MHz to 1800 MHz
Minimum Flatness, 1 MHz to 1800 MHz
17. Press
(jj)
on the spectrum analyzer.
Option 011:
AdB
‘Ihble
l-20 for the indicated frequency
(TR Entry 18-1)
Option 010:
dB
kHd
MH-
(TR Entry 18-4)
dB
(TR Entry 18-5)
dB
(TR Entry 18-6)
Option 011:
dB
(TR Entry 18-2)
HP 8580D Spectrum Analyzer
Calibrating
l-77
Page 90
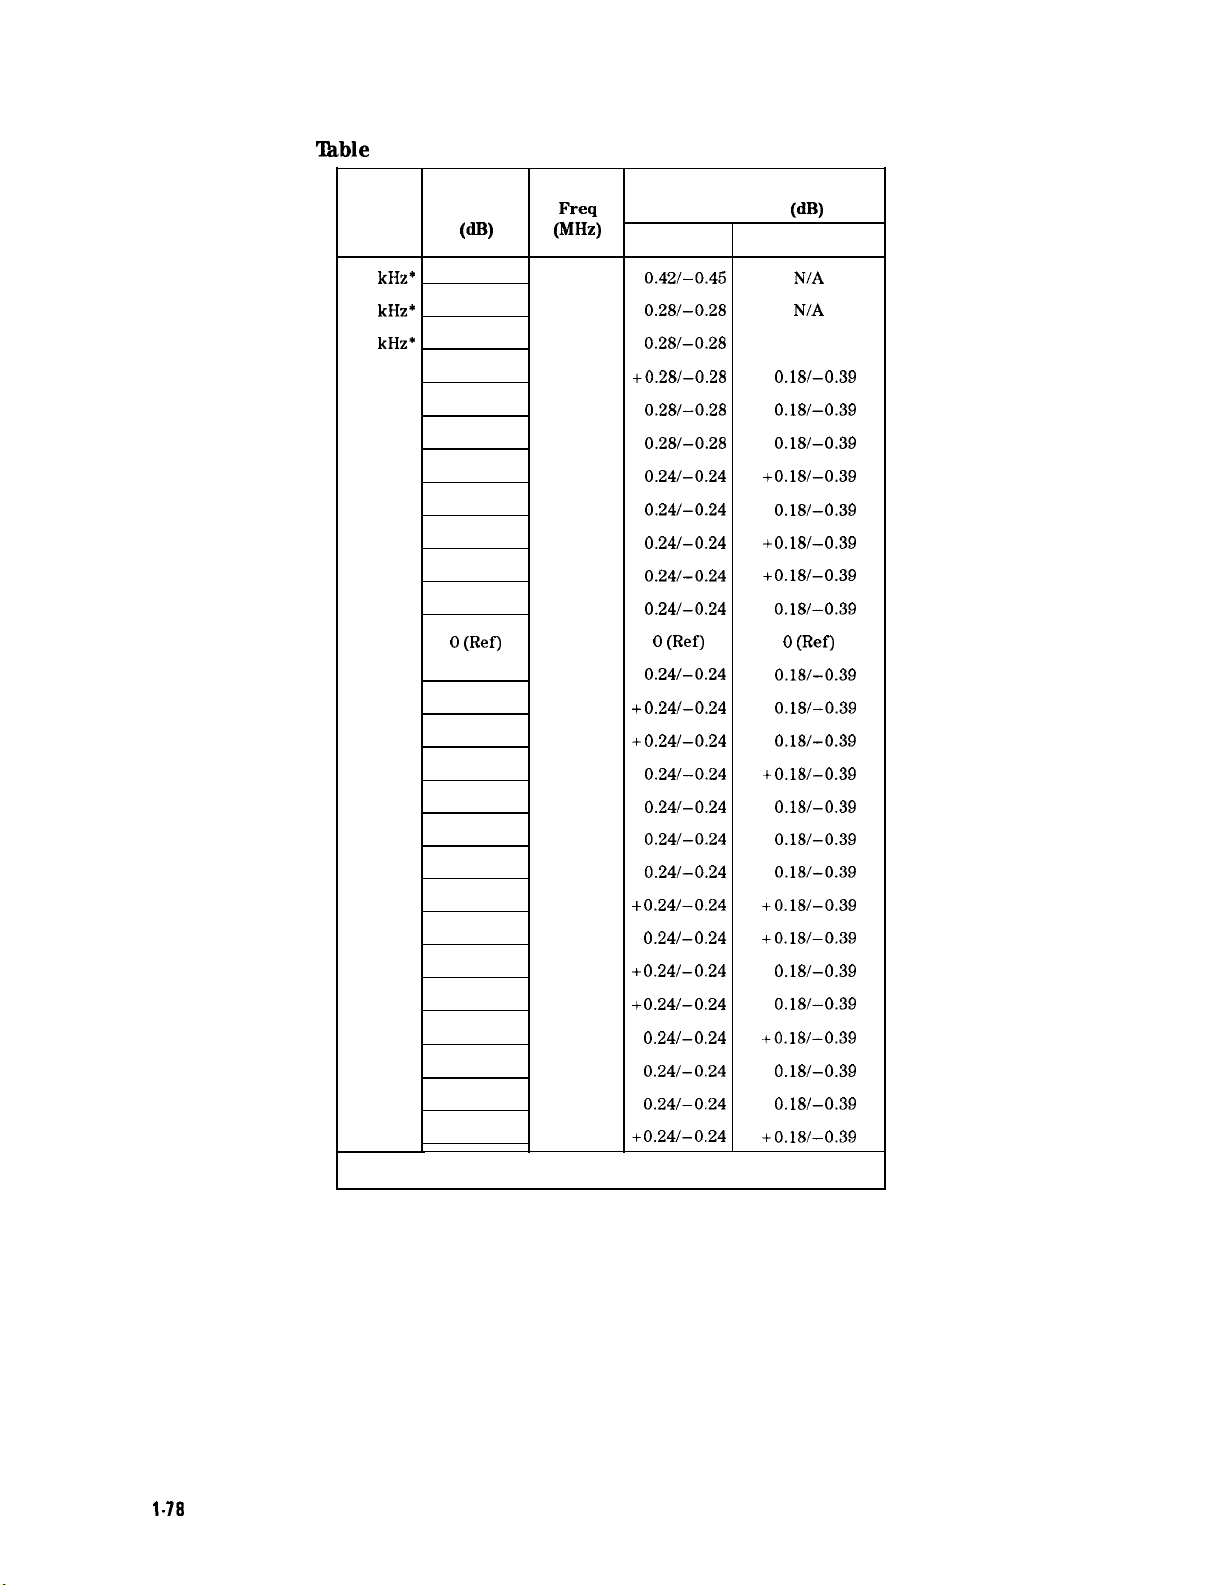
18. Tracking Generator Level Flatness
lhble
l-20. Level Flatness Relative to 300 MHz Worksheet
Center
Freq
100
kHz*
300
kHz*
500
kHz’
1 MHz
2 MHz
5 MHz
10 MHz
20 MHz
50 MHz
100 MHz
200 MHz
300 MHz
400 MHz
500 MHz
600 MHz
700 MHz
800 MHz
900 MHz
000 MHz
100 MHz
200 MHz
300 MHz
400 MHz
500 MHz
600 MHz
700 MHz
800 MHz
Level Cal Factor
Flatness
WI
0 (Ref)
fieq
(MHz)
0.1
0.3
0.3
1
3
3
10
30
50
100
300
300
300
300
300
1000
1000
1000
1000
1000
1000
1000
1000
2000
2000
2000
2000
Measurement
Uncertainty
Option 010 Option 011
+
0.421-0.45
+
0.28/-0.28
+
0.281-0.28
+0.28/-0.28
+
0.28/-0.28
+
0.28/-0.28
+
0.241-0.24
+
0.24/-0.24
+
0.241-0.24
+
0.241-0.24
+
0.241-0.24
0
(Ref)
+
0.241-0.24
+ 0.241-0.24
+ 0.241-0.24
+
0.241-0.24
+
0.24/-0.24
+
0.24/-0.24
+
0.24/-0.24
+ 0.24/-0.24 +0.18/-0.39
+
0.24/-0.24 +0.18/-0.39
+ 0.241-0.24
+ 0.241-0.24
+
0.241-0.24
+
0.241-0.24
+
0.24/-0.24
+ 0.24/-0.24
(dB)
N/A
N/A
N/A
+
0.18/-0.39
+
0.18/-0.39
+
O.lS/-0.39
+ 0.18/-0.39
+
0.18/-0.39
+ 0.18/-0.39
+ O.lS/-0.39
+
O.lS/-0.39
0
(Ref)
+
0.18/-0.39
+
O.lS/-0.39
+
O.lS/-0.39
+ O.lS/-0.39
+
0.18/-0.39
+
0.18/-0.39
+
0.18/-0.39
+
0.18/-0.39
+
O.lS/-0.39
+0.18/-0.39
+
O.lS/-0.39
+
O.lS/-0.39
+ 0.18/-0.39
l-78
Calibrating
These frequencies are tested on Option 010 spectrum analyzers only.
HP 8590D Spectrum Analyzer
Page 91
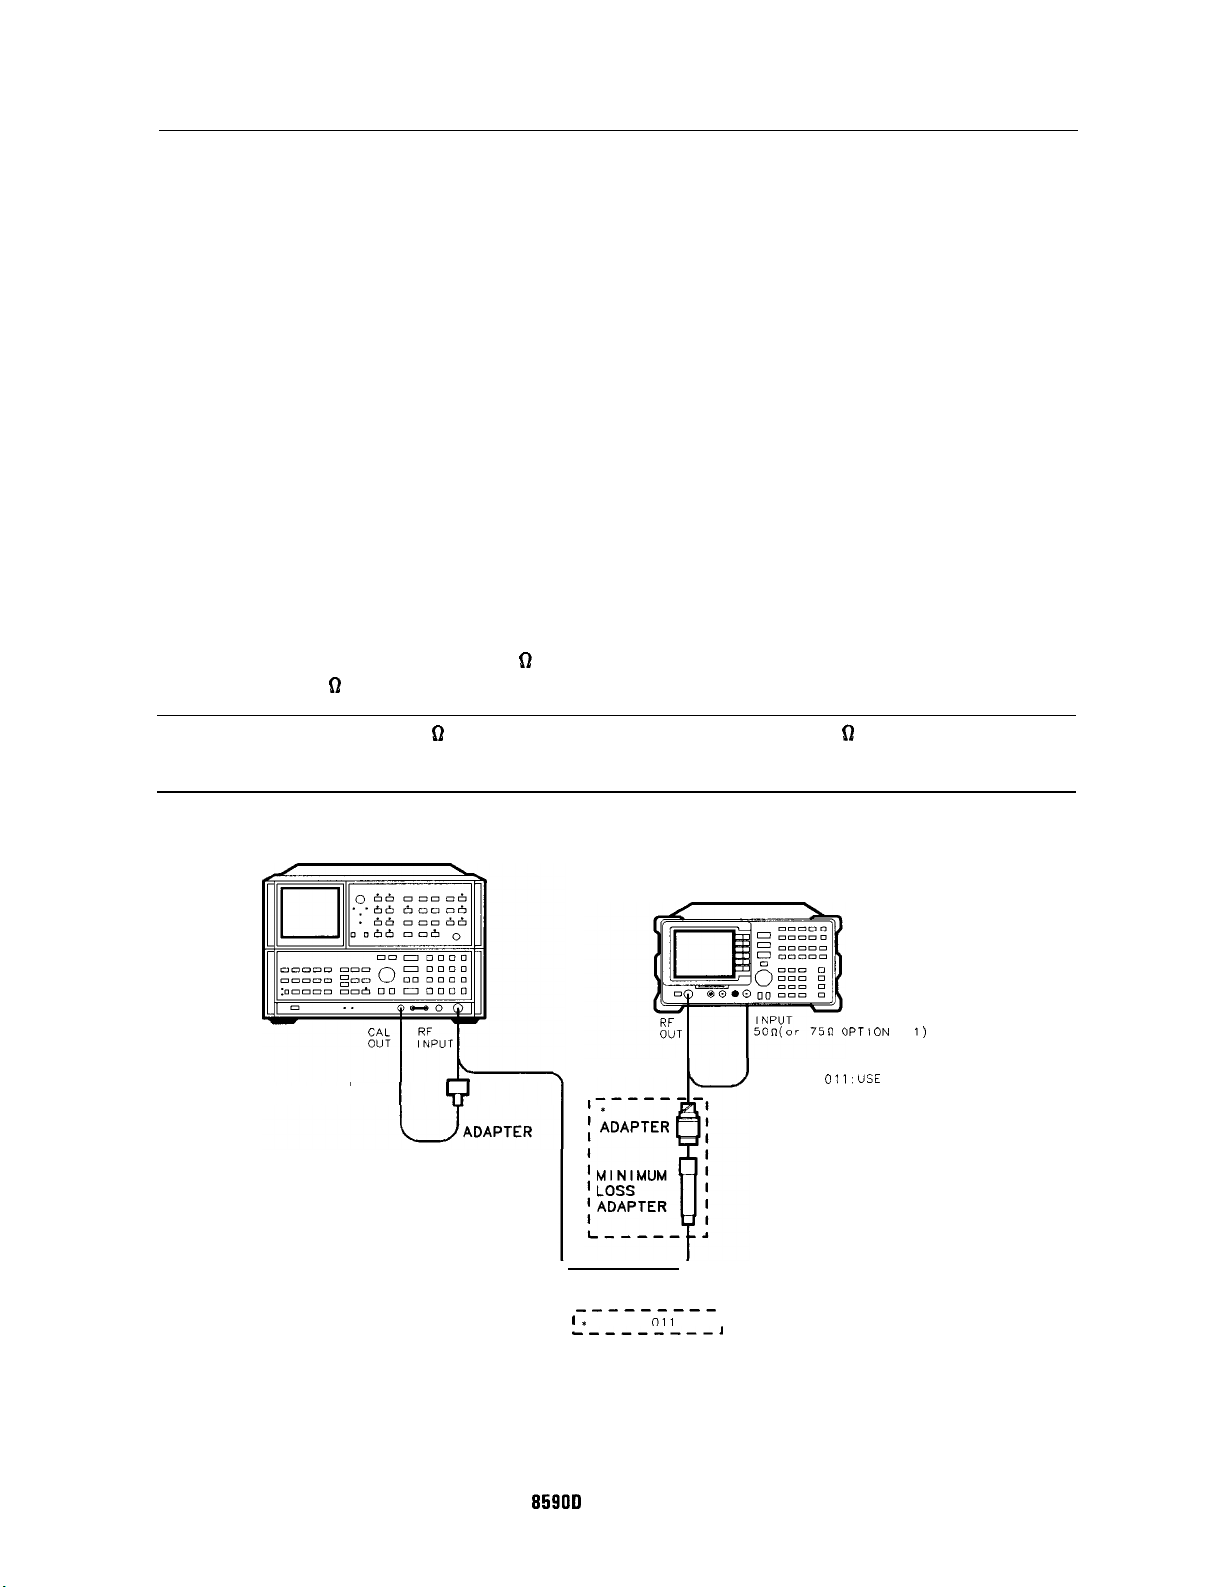
19. Harmonic Spurious Outputs
19. Harmonic Spurious Outputs
This procedure is only for spectrum analyzers equipped with Option 010 or 011.
The tracking generator output is connected to the spectrum analyzer input and the tracking
is adjusted at 300 MHz for a maximum signal level. The tracking generator output is then
connected to the input of an microwave spectrum analyzer. The tracking generator is tuned
to several frequencies and the amplitude of the second and third harmonics relative to the
fundamental are measured at each frequency.
There are no related adjustment procedures for this performance test.
Equipment Required
Microwave spectrum analyzer
Adapter, Type N (m) to BNC (f)
Cable, Type N, 62 cm (24 in)
Cable, BNC, 23 cm (9 in)
Additional Equipment for Option 011
Adapter, minimum loss
Adapter, Type N (f) to BNC (m), 75
Cable, BNC, 75
61
61
Caution
SPECTRUM ANALYZER
Use only 75 D cables, connectors, or adapters on the 75 D input of an Option
011 or damage to the input connector will occur.
SPECTRUM ANALYZER
IPTION
01
1)
TYPE N CABLE
OPTION
BNC
CABLE
TYPE N CABLE
-----
_--------
I*
OPTION
,--------I
011
ONLY
(
I
Figure l-25. Harmonic Spurious Outputs Test Setup
011: USE
75n
BNCCABLE)
XY126
HP
8590D
Spectrum Analyzer
Calibrating 1-79
Page 92
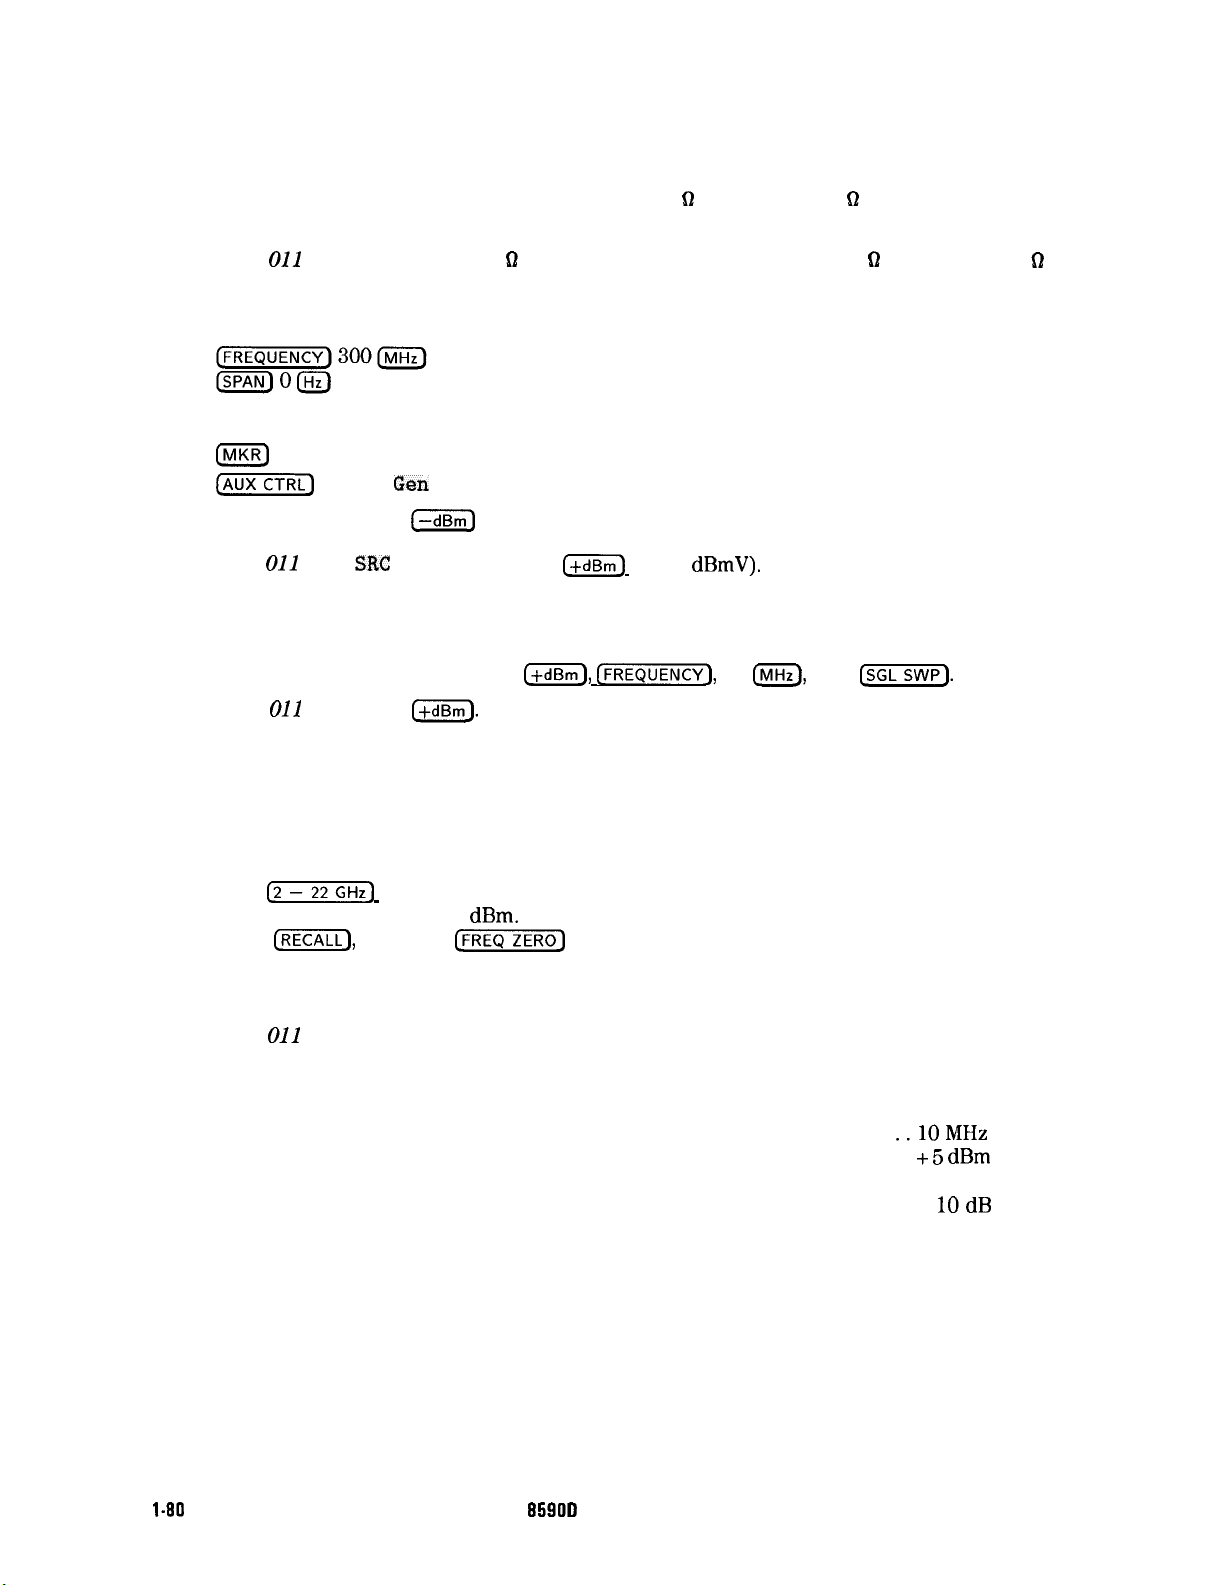
19. Harmonic Spurious Outputs
Procedure
1.
Connect the Type N cable between the RF OUT 50 a2 and INPUT 50 D connectors on the
spectrum analyzer. See Figure l-25.
Option
011
only: Connect the 75 61 BNC cable between the RF OUT 75 D and INPUT 75
connectors on the spectrum analyzer.
2.Press PRESET on the spectrum analyzer and set the controls as follows:
3.
On the spectrum analyzer, press the following keys:
m
(AUXj
SRC PWR ON OFF 5
Option
4.
On the spectrum analyzer, press TRACKING PEAK . Wait for the PEAKING message to
011
Track
only:
Gen
[-dBm)
SRG
PWR ON OFF 42
(+dBm)
( + 42
dBmV).
disappear.
5.
On the spectrum analyzer, press 0
Option
011
only: 42.8
(+dBm).
(+dBm), (FREQUENCY],
10
IhnHz),
then
I-).
It is only necessary to perform step 6 if more than 2 hours have elapsed since a front-panel
calibration of the microwave spectrum analyzer has been performed. The microwave
spectrum analyzer should be allowed to warm up for at least 30 minutes before proceeding.
6.Perform a front-panel calibration of the microwave spectrum analyzer as follows:
62
a. Connect a BNC cable between CAL OUTPUT and RF INPUT.
b. Press
c. Press
7.
Connect the Type N cable from the tracking generator output to the microwave spectrum
lj-1
(INSTR PRESET), (RECALL), 8. Adjust AMPTD CAL for a marker
amplitude reading of -10
(jj),
9. Adjust
C-1
dBm.
for a maximum amplitude response.
analyzer RF INPUT. See Figure l-25.
Option
8.
Set the microwave spectrum analyzer controls as follows:
011
only: Use the minimum loss adapter and Type N (f) to BNC (m) adapter.
CENTER FREQUENCY
SPAN . . . . . . . . . . . . . . . . . . . . . . . . . . . . . . . . . . . . . . . . . . . . . . . . . . . . . . . . . . . . . .
REFERENCE LEVEL . . . . . . . . . . . . . . . . . . . . . . . . . . . . . . . . . . . . . . . . . . . . . . . .
. . . . . . . . . . . . . . . . . . . . . . . . . . . . . . . . . . . . . . . . . . . . . . . 10 MHz
..lOMHz
+5
dBm
RESBW . . . . . . . . . . . . . . . . . . . . . . . . . . . . . . . . . . . . . . . . . . . . . . . . . . . . . . . . . . . . . 30kHz
LOGdB/DIV
. . . . . . . . . . . . . . . . . . . . . . . . . . . . . . . . . . . . . . . . . . . . . . . . . . . . . . . . . .
10dB
l-90
Calibrating HP 859OD Spectrum Analyzer
Page 93
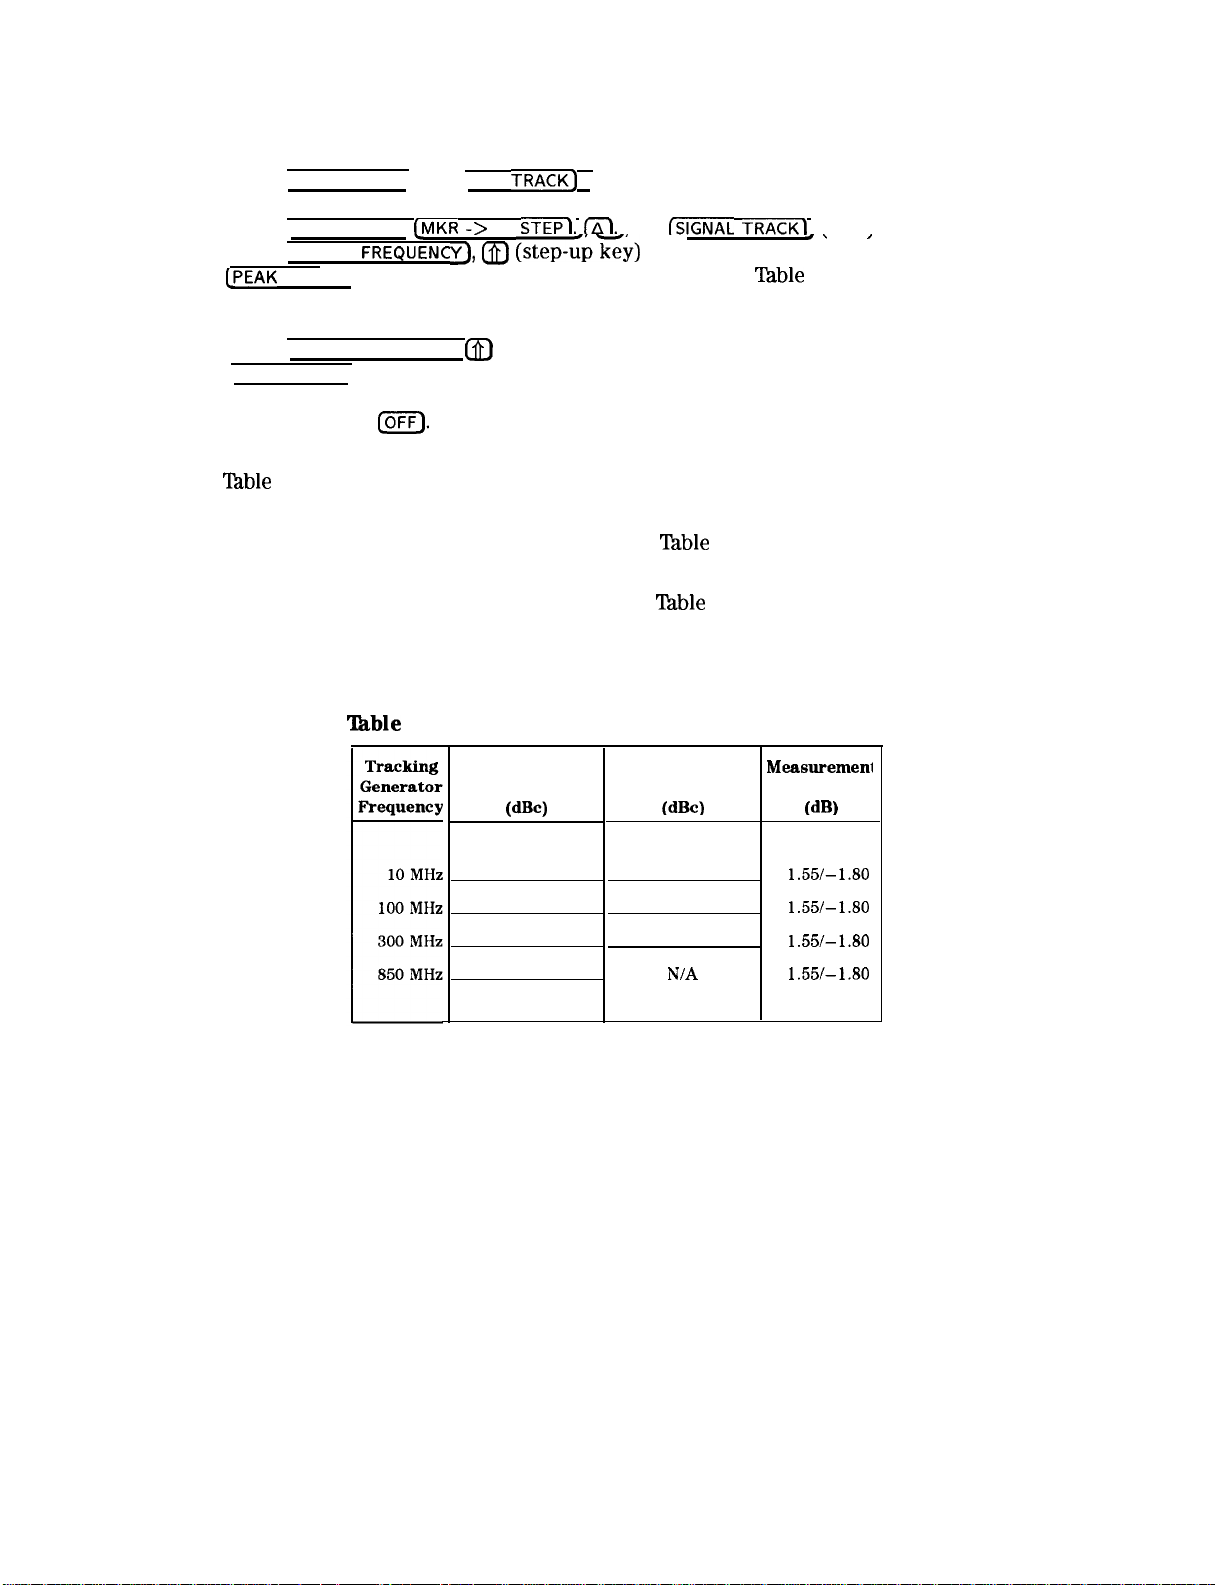
9. On the microwave spectrum analyzer, do the following:
19. Harmonic Spurious Outputs
a. Press (PEAK SEARCH] and (SIGNAL
TRACK_)
(ON). Wait for the signal to be displayed at
center screen.
b. Press [PEAK SEARCH],
c. Press (CENTER
IPEAK
SEARCH). Record the marker amplitude reading in
&KR ->
Ffwwmc
CF STEPI Inl. and
YJ, m
(step-t&key) to tune to the second harmonic. Press
CSIGNAL TRACK)
‘fable
(OFF).
*\
I
1-21 as the 2nd Harmonic
Level for the 10 MHz Tracking Generator Output Frequency.
d. Perform this step only if the tracking generator output frequency is less than 600 MHz.
Press [CENTER FREQUENCY], m (step-up) key to tune to the third harmonic. Press
[PEAK SEARCH) Record the marker amplitude reading in Table 1-21 as the 3rd Harmonic
Level for the 10 MHz Tracking Generator Output Frequency.
e. Press MARKER
IOFF).
10. Repeat steps 8 and 9 above for the remaining Tracking Generator Output Frequencies listed
in
Table
1-21. Note that the spectrum analyzer CENTER FREQ is the same as the Tracking
Generator Output Frequency,
11. Locate the most positive 2nd Harmonic Level in
Table
1-21 and record as TR Entry 19-1 in
the performance test record.
12. Locate the most positive 3rd Harmonic Level in
Table
1-21 and record as TR Entry 19-2 in
the performance test record.
‘Ihble
1-21. Harmonic Spurious Responses Worksheet
2nd Harmonic
Level
WW
3rd Harmonic Measuremenl
Level
(dBc) (dB)
N/A
Uncertainty
+ 1.55/-1.80
+ 1.55/-1.80
+ 1.55/-1.80
+ 1.55/-1.80
HP 8580D Spectrum Analyzer
Calibrating 1-81
Page 94
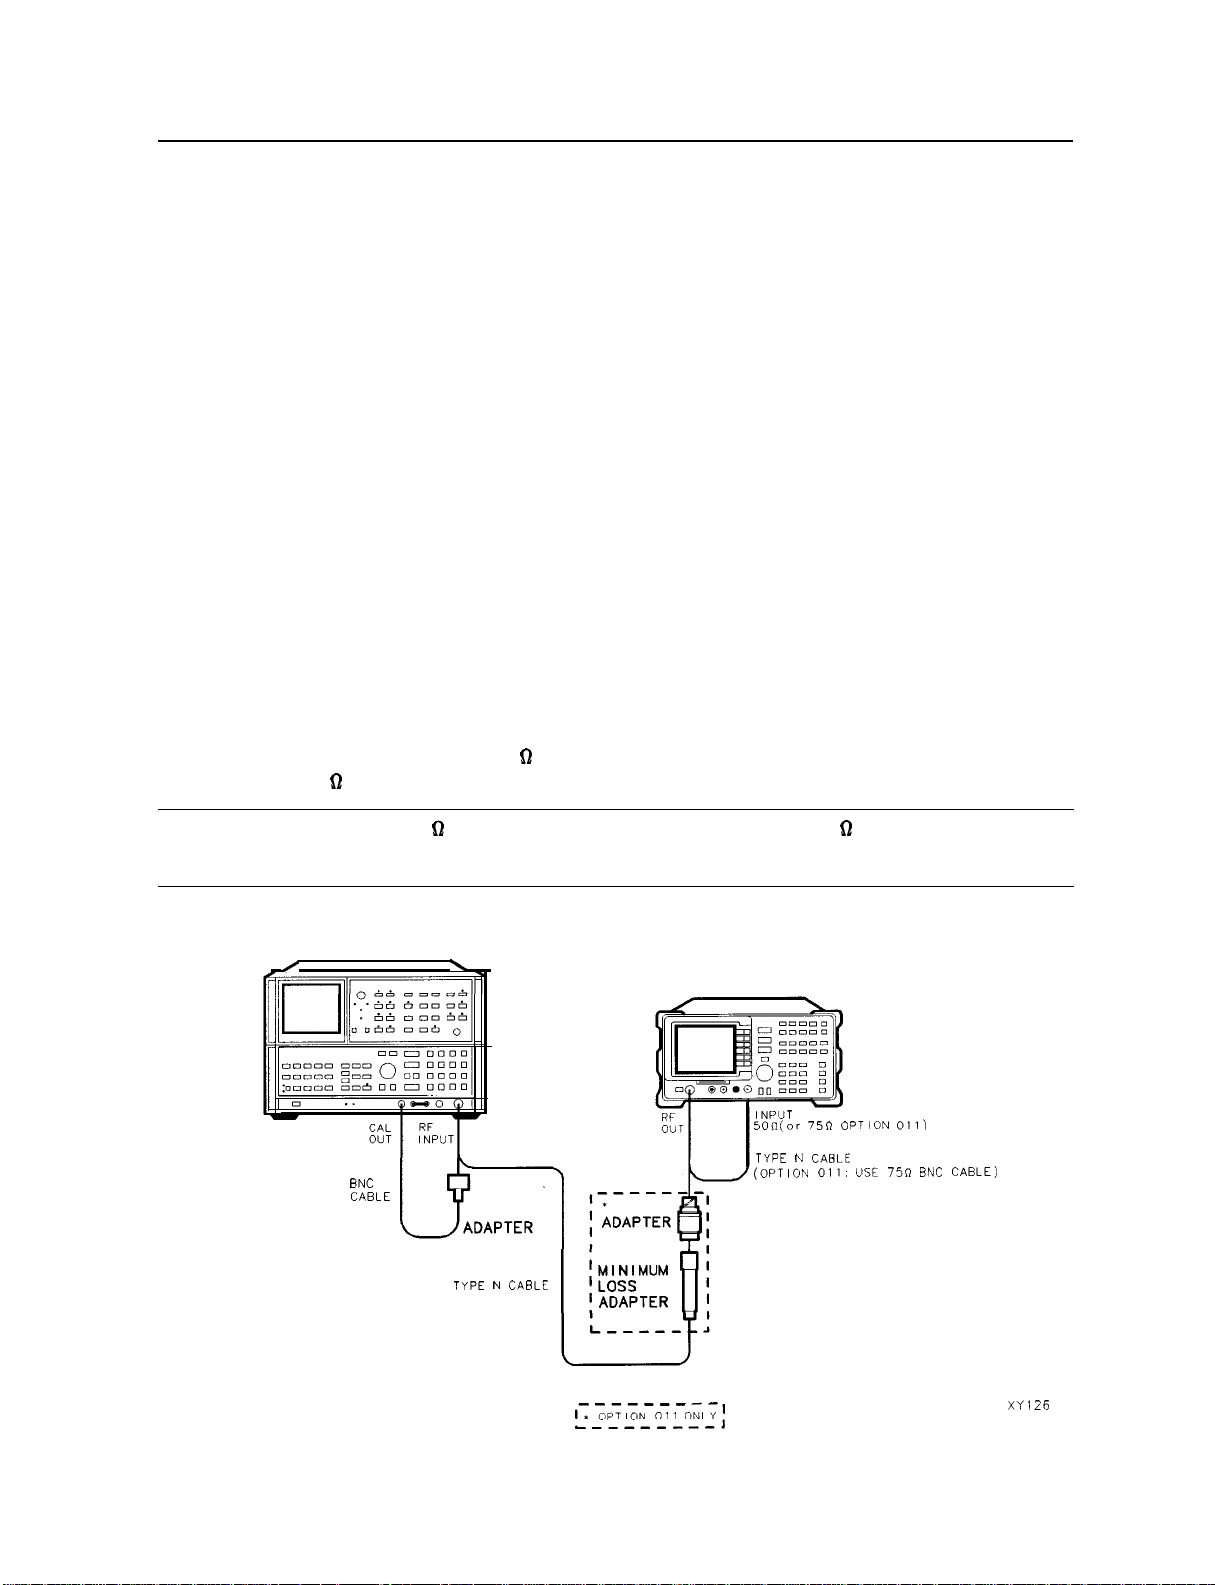
20. Non-Harmonic Spurious Outputs
This procedure is only for spectrum analyzers equipped with Option 010 or 011.
The tracking generator output is connected to the spectrum analyzer input and the tracking
is adjusted at 300 MHz for a maximum signal level. The tracking generator output is then
connected to the input of a microwave spectrum analyzer. The tracking generator is set to
several different output frequencies.
For each output frequency, several sweeps are taken on the microwave spectrum analyzer
over different frequency spans and the highest displayed spurious response is measured in
each span. Responses at the fundamental frequency of the tracking generator output or their
harmonics are ignored. The amplitude of the highest spurious response is recorded.
There are no related adjustment procedures for this performance test.
Equipment Required
Microwave spectrum analyzer
Adapter, Type N (m) to BNC (f)
Cable, Type N, 62 cm (24 in)
Cable, BNC, 23 cm (9 in)
Additional Equipment for Option 011
Adapter, minimum loss
Adapter, Type N (f) to BNC (m), 75
Cable, BNC, 75
62
62
Caution
SPECTRUM ANALYZER
0
Use only 75 D cables, connectors, or adapters on the 75 62 input of an Option
011 or damage to the input connector will occur.
\
SPECTRUM ANALYZER
INPUT
50n(or 750
TYPE
N
BNC
CABLE
TYPE N CABLE
---B--e
l+;PTlON 011 ONLV’
,--------I
(OPTION oil:
Figure l-26. Non-Harmonic Spurious Outputs Test Setup
CABLE
OP
TION 011)
USE
75~
BNC
CABLE)
XY126
1-82 Calibrating
HP 8580D Spectrum Analyzer
Page 95
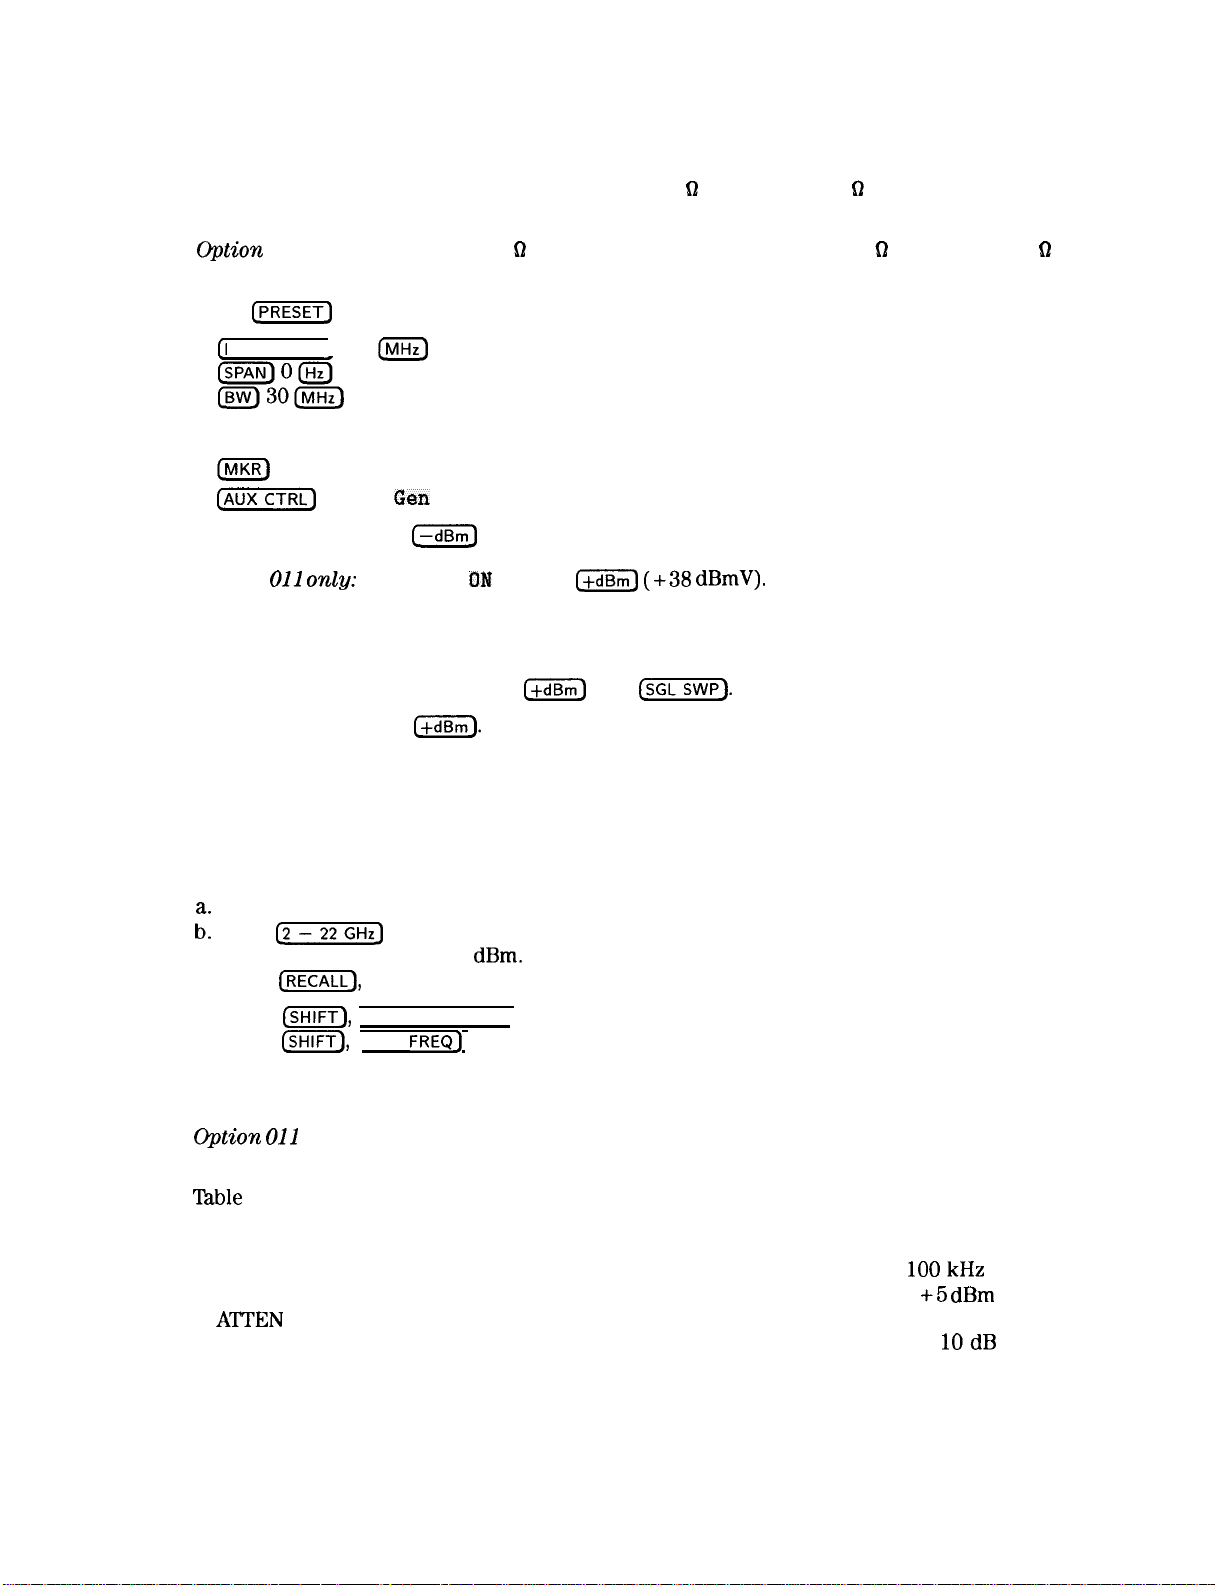
20. Non-Harmonic Spurious Outputs
Procedure
1.
Connect the Type N cable between the RF OUT 50 62 and INPUT 50 D connectors on the
spectrum analyzer. See Figure l-26.
Q&ion 011 only: Connect the 75 D BNC cable between the RF OUT 75 n and INPUT 75
on the spectrum analyzer.
2.
Press
L-1
FREQUENCY) 300
3.
On the spectrum analyzer, press the following keys:
(AUXCTRL)
SRC PWR ON OFF 5
Option
4.
On the spectrum analyzer, press TRACKING PEAK . Wait for the PEAKING message to
011 on@:
on the spectrum analyzer and set the controls as follows:
IhnHz)
Track
Gen
@J
SRC PWR ON OFF 38
I+dBm)
(+38
dBmV).
disappear.
5.
On the spectrum analyzer, press 0
Option 011 only: 42.8
(+dBmj.
(+dBmj’
then
C-1.
It is only necessary to perform step 6 if more than two hours have elapsed since a
front-panel calibration of the microwave spectrum analyzer has been performed. The
microwave spectrum analyzer should be allowed to warm up for at least 30 minutes before
proceeding.
62
Perform a front-panel calibration on the microwave spectrum analyzer as follows:
6.
Connect a BNC cable between CAL OUTPUT and RF INPUT.
ba:
Press
c-1
amplitude reading of -10
C.
Press
t-1,
Press
(SHIFT),
d.
Press
@XTJ
(INSTR PRESET), (RECALL_), 8. Adjust AMPTD CAL for a marker
dBm.
9. Adjust FREQ
[FREQUENCY SPAN] to start the 30 second internal error correction routine.
[START FREQ) to use the error correction factors just calculated.
ZERO
for a maximum amplitude response.
7.8.Connect the Type N cable from the tracking generator output to the microwave spectrum
analyzer RF INPUT as shown in Figure l-26.
O-ption 011
only: Use the minimum loss adapter and Type N (f) to BNC (m) adapter.
Set the spectrum analyzer CENTER FREQ to the Fundamental Frequency listed in
‘lhble
l-22.
9.
Set the microwave spectrum analyzer controls as follows:
SPAN . . . . . . . . . . . . . . . . . . . . . . . . . . . . . . . . . . . . . . . . . . . . . . . . . . . . . . . . . . . . . . .
REFERENCE LEVEL . . . . . . . . . . . . . . . . . . . . . . . . . . . . . . . . . . . . . . . . . . . . . . . .
100kHz
+5
dBm
ATTEN. . . . . . . . . . . . . . . . . . . . . . . . . . . . . . . . . . . . . . . . . . . . . . . . . . . . . . . . . . . . . . . 20dB
LOGdB/DIV
Set the microwave spectrum analyzer CENTER FREQUENCY to the Fundamental
10.
. . . . . . . . . . . . . . . . . . . . . . . . . . . . . . . . . . . . . . . . . . . . . . . . . . . . . . . . . .
10dB
Frequency listed in Table l-22.
HP 959OD Spectrum Analyzer
Calibrating 1-83
Page 96
20. Non-Harmonic Spurious Outputs
11. On the microwave spectrum analyzer, press [PEAK SEARCH). Press
(MKR
->
REF LVL). Wait for another sweep to finish.
12. Record the microwave spectrum analyzer marker-amplitude reading in
cm->,
Table
l-22 as the
Fundamental Amplitude.
13. Set the microwave spectrum analyzer [START FREQ),
in the first row of
14. Press
CPEAK
(SINGLE)
SEARCH).
Table
l-23.
on the microwave spectrum analyzer and wait for the sweep to finish. Press
CsTopFREQI),
and
(j-1
as indicated
15. Verify that the marked signal is not the fundamental or a harmonic of the fundamental as
follows:
a. Divide the marker frequency by the fundamental frequency (the spectrum analyzer
CENTER FREQ setting). For example, if the marker frequency is 30.3 MHz and the
fundamental frequency is 10 MHz, dividing 30.3 MHz by 10 MHz yields 3.03.
b. Round the number calculated in step a the nearest whole number. In the example
above, 3.03 should be rounded to 3.
c. Multiply the fundamental frequency by the number calculated in step b. Following the
example, multiplying 10 MHz by 3 yields 30 MHz.
d. Calculate the difference between the marker frequency and the frequency calculated in
step c above. Continuing the example, the difference would be 300
kHz.
e. Due to span accuracy uncertainties in the microwave spectrum analyzer and center
frequency uncertainties in the spectrum analyzer, the marker frequency might not equal
the actual frequency. Given the marker frequency, check if the difference calculated in
step d is within the appropriate tolerance:
For marker frequencies
For marker frequencies
~55
MHz, tolerance = ±750
>55
MHz, tolerance =
f10
kHz
MHz
f. If the difference in step d is within the indicated tolerance, the signal in question is the
fundamental signal (if the number in step b = 1) or a harmonic of the fundamental (if
the number in step b
>l).
This response should be ignored.
16. Verify that the marked signal is a true response and not a random noise peak by pressing
c-1
to trigger a new sweep and press (PEAK SEARCH]. A true response will remain at the
same frequency and amplitude on successive sweeps but a noise peak will not.
17. If the marked signal is either the fundamental or a harmonic of the fundamental (see
step 15) or a noise peak (see step
pressing
ml,
[PEAK SEARCH). Continue with step 19.
16),
move the marker to the next highest signal by
18. If the marked signal is not the fundamental or a harmonic of the fundamental (see step
15) and is a true response (see step
marked signal and the Fundamental Amplitude as listed in
16),
calculate the difference between the amplitude of
‘Iable
l-22.
For example, if the Fundamental Amplitude for a fundamental frequency of 10 MHz is
+ 1.2
dBm
and the marker amplitude is -40.8
dBm,
the difference is -42
dBc.
Record this difference as the Non-Harmonic Response Amplitude for the appropriate
spectrum analyzer CENTER FREQ and microwave spectrum analyzer START and STOP
FREQ settings in
YIhble
l-23.
Non-Harmonic Amplitude = Marker Amplitude - Fundamental Amplitude
19. If a true non-harmonic spurious response is not found, record “NOISE” as the
Non-Harmonic Response Amplitude in
Table
l-23 for the appropriate spectrum analyzer
CENTER FREQ and microwave spectrum analyzer START and STOP FREQ settings.
1-84 Calibrating HP 959OD Spectrum Analyzer
Page 97
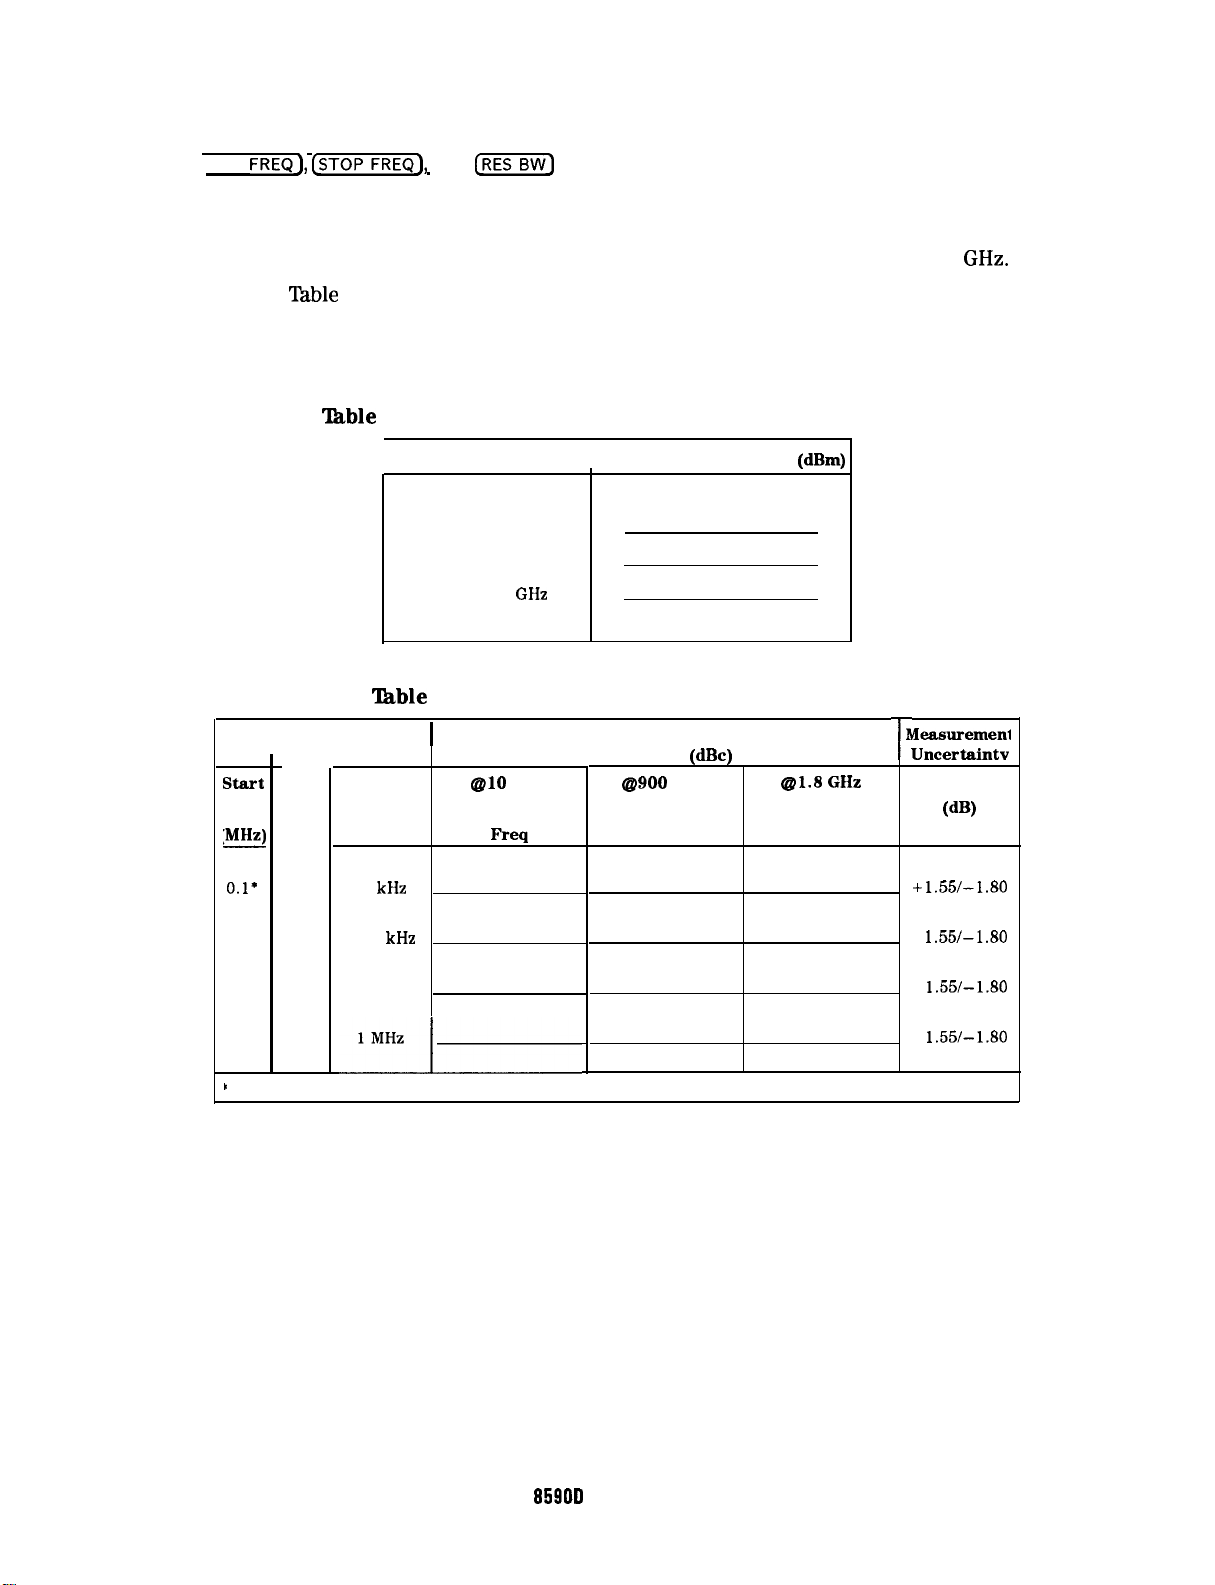
20. Non-Harmonic Spurious Outputs
20. Repeat steps 14 through 19 for the remaining microwave spectrum analyzer settings for
[START FREQ),
@ZKKjJ
and
@ZZK]
for the spectrum analyzer CENTER FREQ setting of
10 MHz.
21. Repeat steps 8 through 20 with the spectrum analyzer CENTER FREQ set to 900 MHz.
22. Repeat steps 8 through 20 with the spectrum analyzer CENTER FREQ set to 1.8
23. Locate in
Table
l-23 the most-positive Non-Harmonic Response Amplitude. Record this
amplitude as TR Entry 20-l in the performance test record.
‘l’hble
l-22. Fundamental Response Amplitudes Worksheet
I
‘Ihble
Microwave Spectrum
Analyzer
n
lyzer
Settings
start
Freq
(MHz)
stop
Freq
(MHz)
Res
BW
Fundamental Frequency Fundamental Amplitude
10 MHz
900 MHz
1.8
GHz
I
l-23. Non-Harmonic Responses Worksheet
1
@lo
MHz
Center
fieq
Non-Harmonic Response
Amplitude
a900
(dBc)
MHz
Center
Frea
(dBm)
al.8 GHz
Center
Frea
n
deasuremenl
T
Uncertaintv
PI
GHz.
0.11
5.0
55
1240
5.0
55
1240
1800
10 kHz
100 kHz
1 MHz
lMHI
’
Option 011: Set START FREQ to 1 MHz.
+ 1.55/-1.80
+ 1.55/-1.80
+ 1.55/-1.80
+ 1.55/-1.80
HP
8590D
Spectrum Analyzer
Calibrating l-85
Page 98
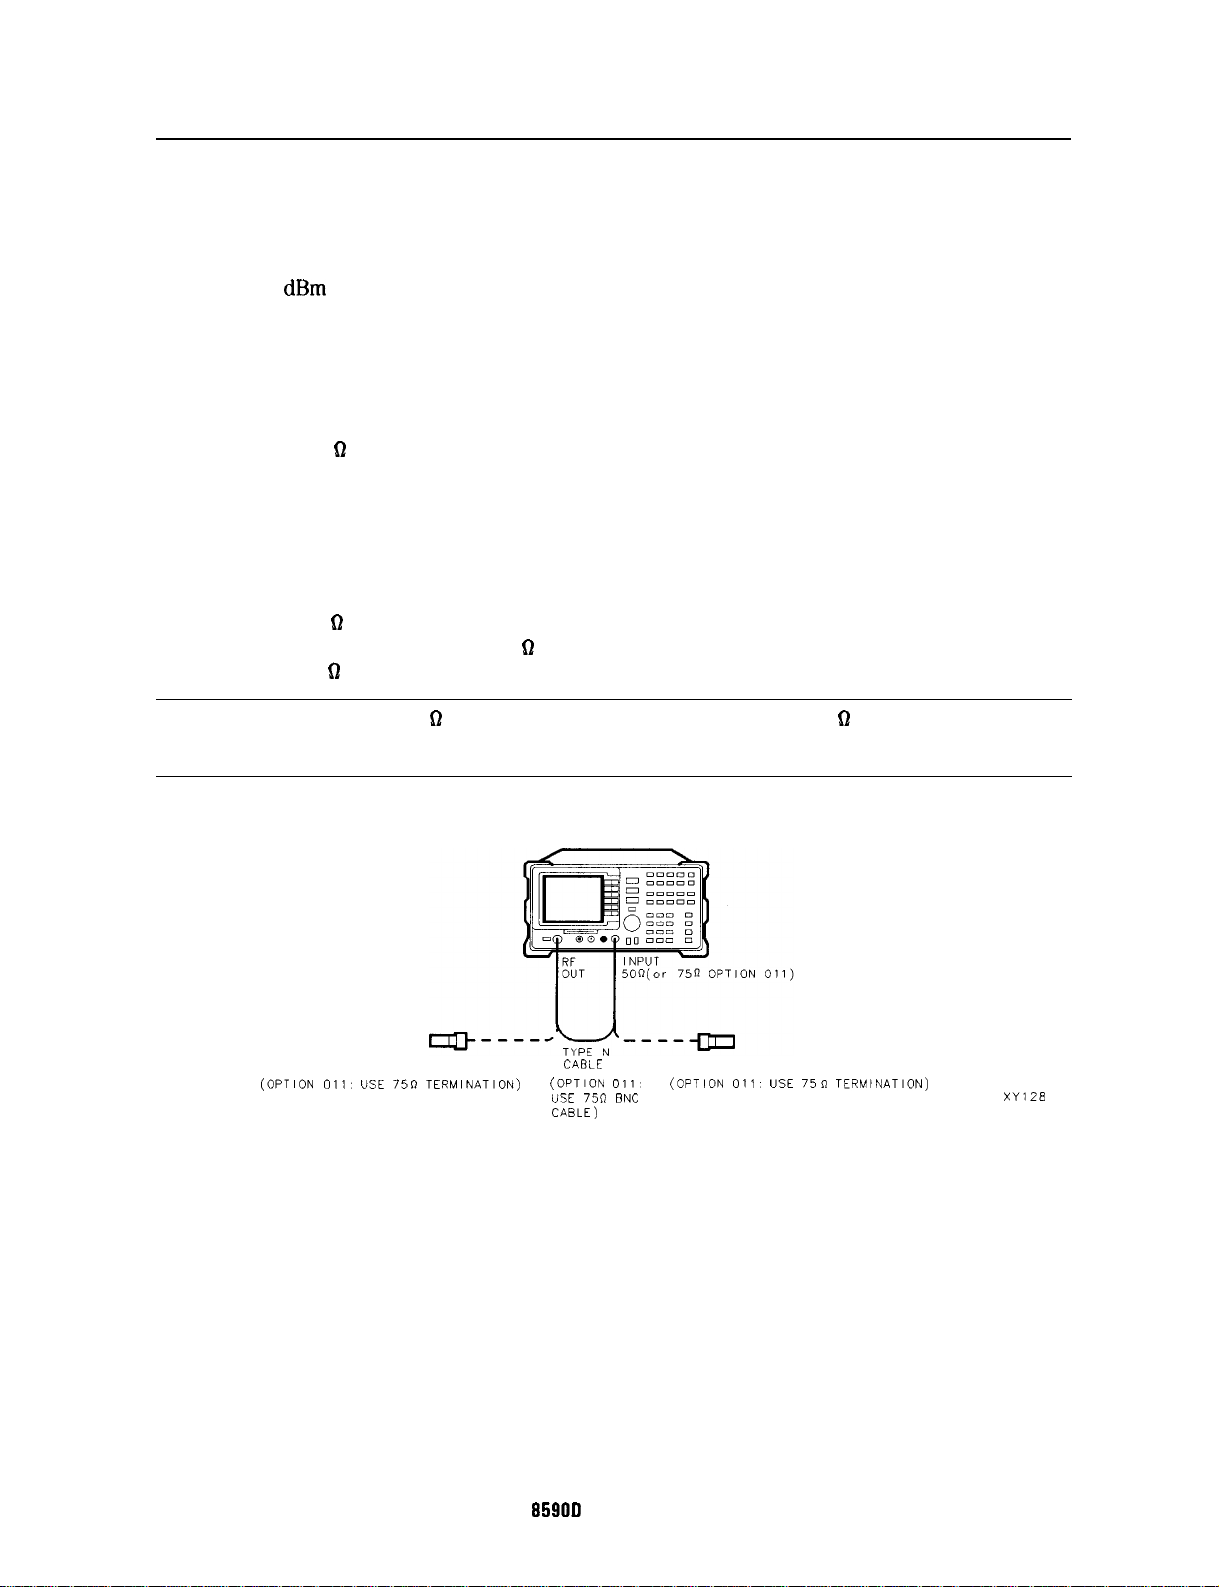
21. Tracking Generator Feedthrough
This procedure is only for spectrum analyzers equipped with Option 010 or 011.
The tracking generator output is connected to the spectrum analyzer input and the tracking is
adjusted at 300 MHz for a maximum signal level. The tracking generator output is terminated
and set for 0
terminated. The noise level of the spectrum analyzer is then measured at several frequencies.
There is no related adjustment procedure for this performance test.
Equipment Required
Termination, 50 62 (2 required)
Adapter, Type N (m) to BNC (f)
Cable, Type N, 62 cm (24 in)
Cable, 23 cm (9 in)
Additional Equipment for Option 011
Termination, 75 61 Type N (m) (2 required)
Adapter, Type N (f) to BNC (m), 75 62 (2 required)
Cable, BNC, 75
dBm
output power (maximum output power). The spectrum analyzer input is also
0
Caution
(OPTION 011:
Use only 75 62 cables, connectors, or adapters on the 75 62 input of an Option
011 or damage to the input connector will occur.
SPECTRUM ANALYZER
50Q TERMINATION
USE
75~ TERMINATION)
CABLE
(OPTION oil-
USE
75fl
BNC
CABLE)
Figure l-27. Tracking Generator Feedthrough Test Setup
50Q TERMINATION
(OPTION 011:
USE
75n TERMINATION)
XYlZt?
1-86 Calibrating
859OD Spectrum Analyzer
HP
Page 99
2 1. Tracking Generator Feedthrough
Procedure
1.
Connect the Type N cable between the RF OUT 50 52 and INPUT 50 62 connectors on the
spectrum analyzer. See Figure l-27.
Option
011
only: Connect the 75 61 BNC cable between the RF OUT 75
0
and INPUT 75
connectors on the spectrum analyzer.
Press
2.
[PRESET]
FREQUENCY) 300
on the spectrum analyzer and set the controls as follows:
m
&l(g
On the spectrum analyzer, press the following keys:
3.
m
(AUX]
Track Gen
SRC PWR ON OFF 5 [-dBm-
Option
4.
On the spectrum analyzer, press TRACKING PEAK . Wait for the PEAKING message to
011
only: 42 +
dBm
(+ 42
dBmV).
disappear.
5.
Connect the CAL OUTPUT to the INPUT 50
Option
011
only: Connect the CAL OUTPUT to the INPUT 75
62.
B.
Set the spectrum analyzer controls as follows:
CAMPLITUDE) 20
0ption 011 only:
(-dBm)
(amplitude] FIEF LWL
28.75
m
B
ATTEN AUTO MAN OIdB)
6.
On the spectrum analyzer, press the following keys:
[PEAK SEARCH)
(MKR-
(SPAN) 100
MK TRACK ON OFF (ON)
m
Wait for the AUTO ZOOM message to disappear then set the controls as follows:
lew)
VID BW AUTO MAN 30
(MKRFCTN)
MK TRACK ON OFF (OFF)
IHz)
HP
959013
Spectrum Analyzer
Calibrating
l-97
Page 100
2 1. Tracking Generator Feedthrough
7. Press
CsGLSWPI)
and wait for completion of a new sweep. Press the following spectrum
analyzer keys:
(PEAK SEARCH_)
@iGiFE)
More 1 of 3
REF LVL OFFSET
Subtract the
m
amplitude reading from -20
dBm
and enter the result as the
REF LVL OFFSET.
For example, if the marker reads -20.21
[-20
dBm -
(-20.21
dBm)
=
+0.21 dB].
Example for Option 011: If the marker reads 26.4
(28.75
dBmV -
26.4
dBmV
= 2.35
dB).
dBm,
enter
dBmV,
+0.21 dB
enter
+2.35 dB
REF LVL OFFSET
8. Connect one 50 0 termination to the spectrum analyzer INPUT 50 D and another to the
tracking
Option
another to the tracking generator’s RF OUT 75
8.
Press
generator’s
011
c-1,
RF OUT 50
only: Connect
0.
one7562
terminationtothe
spectrum analyzer
INPUT7562
61.
Track Gen , then SRC PWR ON OFF (OFF) on the spectrum analyzer.
dB
and
10. Set the spectrum analyzer controls as follows:
(FREQUENCY)Oa
ISPAN) 100
(AMPLITUDE) 10
O-ption
011 only:
m
C-1
REF LVL 38.75
[+dBm)
0
VID BW AUTO MAN (AUTO)
(MKR)
More 1 of 2
MARKER ALL OFF
ITRIG)
SWEEP CONT SGL (CONT)
11. Press the following spectrum analyzer keys:
(PEAK SEARCH)
(jjFCTNI)
[mj
MK TRACK ON OFF (ON)
MARKER
->REF
LVL
LSPAN)2(MHz)
Wait for the AUTO ZOOM message to disappear, then press
(OFF).
(jj),
MK TRACK ON OFF
l-88 Calibrating
HP 859OD Spectrum Analyzer
 Loading...