


HP 8566B Spectrum Analyzer
100 Hz to 22
Technical Data
HEWLETT
PACKARD
Outstanding Precision
and Capability

The HP 8566B Spectrum
Analyzer
Designed for bench and system
use, the HP 8566B offers
superior measurement speed,
microwave frequency accuracy,
and sensitivity. Measure
low-level signals up to 22
with narrow resolution
bandwidths. Synthesizer
stability virtually eliminates
long-term drift and residual FM.
The Spectrum Analyzer
That Keeps Getting Better
Frequency range is 100 Hz to
22
with a dc-coupled input.
Preselected external mixers
extend this coverage from 26.5 to
75
Other external mixers
allow measurement to 325
An internal bus and microcom-
puter control make possible
many powerful operating and
data processing features, as well
as flexibility under computer
control. Sixteen Kbytes of user
RAM are available for storing
trace data, instrument states,
and custom downloadable
programs
All displayed
information can be sent directly
to an HP-IB plotter when
sweeptime is greater than or
equal to 20 ms.
Accurate Measurements
Amplitude measurement range
extends from
to -135
with a 90 calibrated display.
Less than 1 x
frequency reference error and
the spectrum analyzer selectivity
allow high frequency accuracy
even when you are measuring
small signals in the presence of
large ones.
Turbo Speed Option
Already
a world leader in
measurement speed, the
HP 8566B can be made even
faster with Option 002, which
nearly doubles the internal
processing speed of the analyzer.
Some measurements can be
made up to 50% faster, and
overall throughput is typically
improved by 5 to 25%. (Sweep
speed is not affected by
Option
The Turbo option is compatible
with all HP 8566B accessories,
and it can be added to any
HP 8566B without affecting
specifications. (An HP 8566A
must first be upgraded to an
HP 8566B.)
Accessories and Options
By adding measurement
accessories and options, the
HP 8566B spectrum analyzer
fits into many applications,
including electromagnetic
compatibility (EMC) testing,
broadband signal surveillance,
and component
response testing.
Turbo Speed Improvements
measurement accessories
and software create systems for
testing to commercial and military
standards.
Microwave tracking sources add
scalar measurement capability.
Preselected external mixers
simplify millimeter-wave
measurements from 26.5 to
75
. Interactive test generator
soft-front-panel-based drivers
speed software development.
MIL-STD 45662A calibrations
are available.
Custom Programming
You can create complex
measurement routines on an
external controller, store the
programs in user RAM, and
execute them using a single
custom
Simple measurement routines
can be entered from the
intrument front panel, stored in
user RAM, and executed using a
single custom
Operation
Trace Dump
MKR AMPL
Harmonics Test
FFT
Standard
HP 8566B
1083 ms
8.4
ms
1007 ms
473
ms
Turbo
HP 8566B
532
ms
3.7
ms
782
ms
243
ms
Speed
Improvement
51%
56%
22%
49%

The HP 8566B Microwave
Spectrum Analyzer
Smart Enough to Make
Its Own Decisions with
Precision and Speed
Easy-to-read, annotated
display shows instrument
settings and multiple traces
One keystroke sends all CRT
information directly to a plotter*
Coupled functions
SAVE and RECALL
store instrument settings
Instrument sweeptimes
greater than or equal to 20 ms
Measurement aids include four
tunable markers for direct and
relative signal measurements

Powerful signal and
processing functions perform
complex data analysis
Interactive function and data
controls simplify operation
Dedicated keys make
basic operation easy
Today’s HP 8566B Offers
Exceptional microwave performance
Decision-making capability
Enhanced processing speed
Preselected millimeter coverage
Advanced functions
Downloadable programming capability
Distributed processing with a computer
Proven reliability, performance,
and support

EMC Measurement
Solutions
Commercial and MIL EM1
Receivers
The HP 8566B spectrum analyzer
forms the heart of two powerful and
flexible EM1 receivers. These receivers
are ideal for commercial and military
EM1 compliance testing from 20 Hz
to 40
Test Systems Tailored to
Your Needs
For EM1 troubleshooting and
pre-qualification testing, use
your HP 8566B spectrum
analyzer with components and
accessories from HP’s complete
line of EM1 products. The many
offerings include current probes,
line impedance stabilization
networks
positioning equipment, EM1
measurement software, an
RF preselector, and a
quasi-peak adapter.
antennas,
The HP 8571A receiver is optimized
for military EM1 testing, making both
peak and average detection measurements using impulse bandwidths. The
HP 85728 includes all the features
and capabilities of the HP 85718, but
adds quasi-peak detection and specialized IF bandwidths for commercial
compliance measurements.
Both receivers offer
amplitude accuracy over their full
20 Hz to 22
required by MIL-STD 461 and CISPR
Publication 16. For higher frequency
measurements, a 22 to 40
downconverter can be added. The
receivers include a built-in, 1 to
26.5
50 MHz input port with a built-in
limiter and rugged attenuator.
They are also compatible with HP’s
EM1 measurement software and
complete line of test accessories.
amplifier and a 20 Hz to
absolute
frequency range, as
block
Accessories That
Enhance Performance
Millimeter Mixers
Preselected Mixers
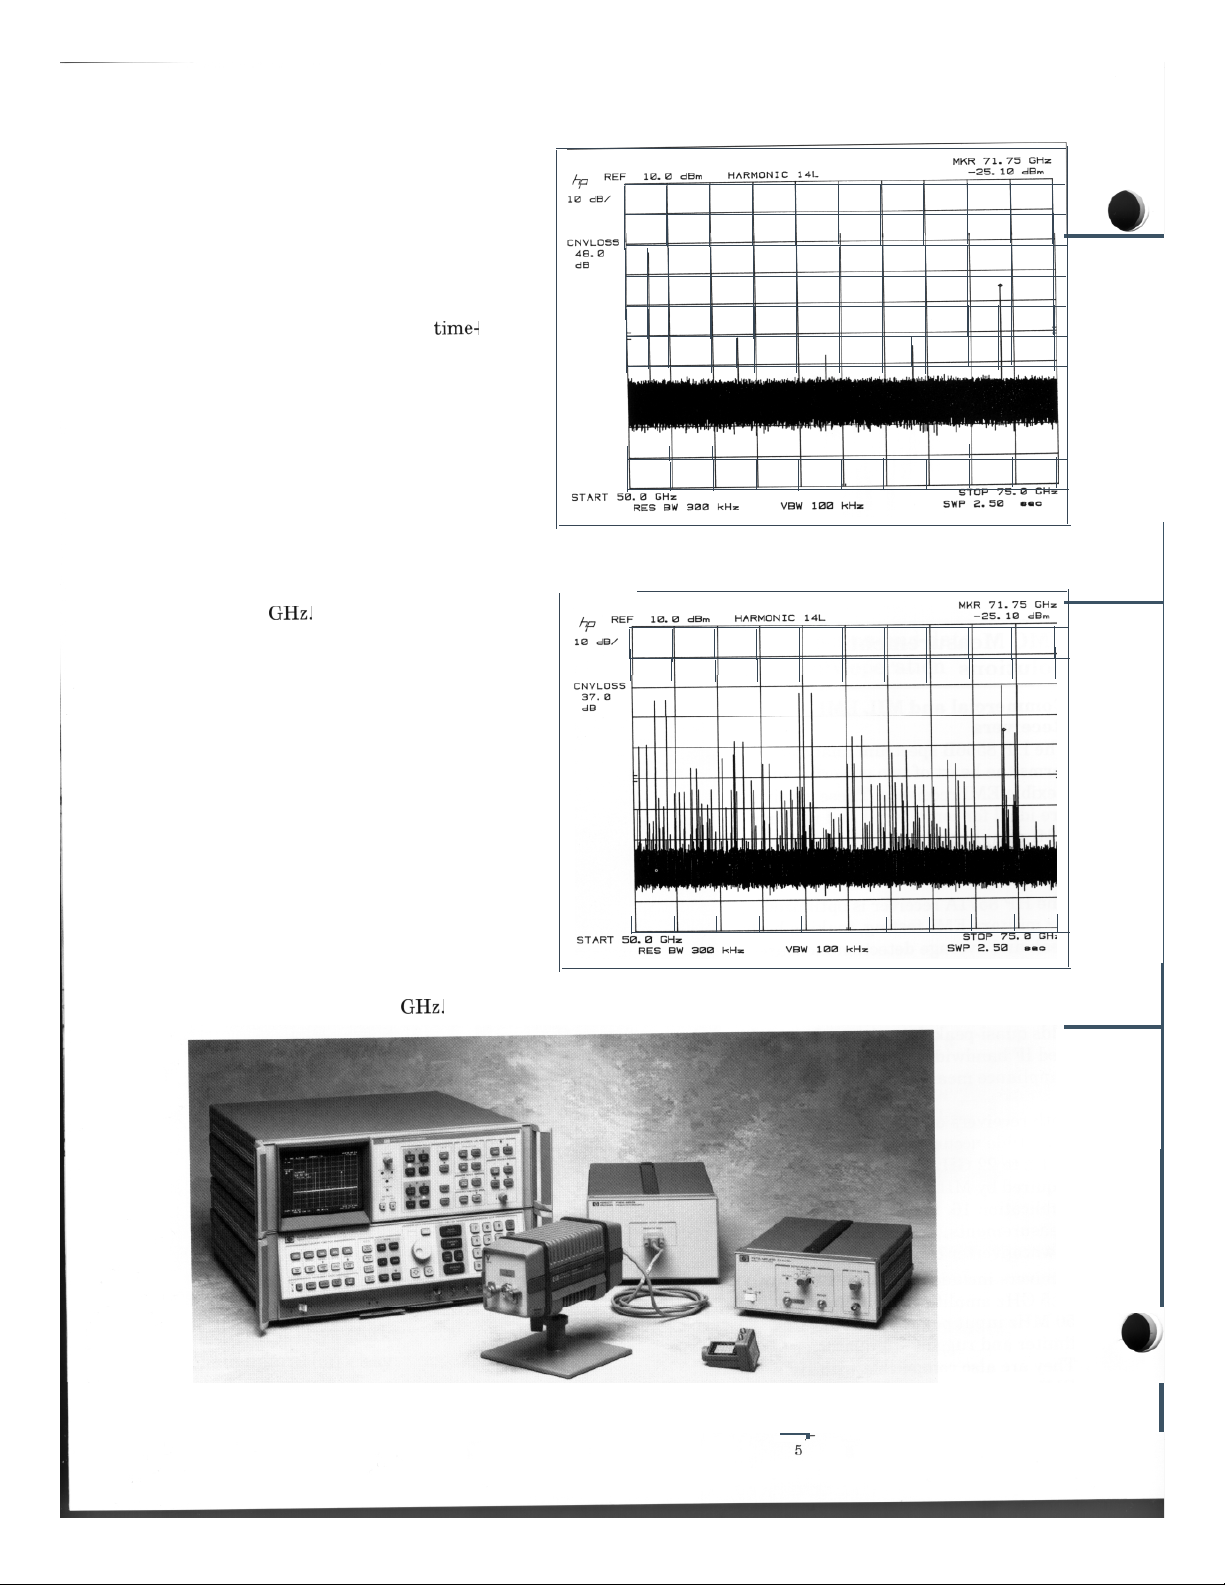
The HP 11974 series preselected
mixers eliminate the need for
consuming signal identification
routines at millimeter
frequencies. With preselection,
no images or multiples are
generated to confuse measure-
ments. These external mixers
allow you to quickly locate true
signals, and they simplify
software development for
automated measurements.
The HP 11974 series mixers are
available in four bands covering
26.5 to 75
Preselected mixers eliminate images and multiples.
Harmonic Mixers
The HP 11970 series waveguide
mixers are general-purpose
external harmonic mixers. They
offer flat frequency response and
low conversion loss without
requiring external dc bias or
tuning adjustment. The HP 11970
series mixers are offered in six
bands covering 18 to 110
e
Harm onic mixin g ext ends frequency range.

Tracking Sources
Add high dynamic range scalar
measurement capability to the
HP 8566B. The HP 856448 and
856458 portable tracking
sources allow you to use your
spectrum analyzer for measuring
transmission and reflection
characteristics of devices.
You can also characterize
harmonic distortion,
intermodulation distortion,
spurious products, and more.
The tracking sources give the
HP 8566B dynamic range greater
than 125
up to 12.5
and greater than 105
through 22
Other features include:
swept offset tracking for mixer
testing and swept
measurements
up to leveled output power
standalone CW source capability
REF
10
START 2.0
0.0
AES 3
10
MKA A-8.02
-94.90
STOP 22.0
2.00
High dynamic range scalar m easurement

Microwave Preamplifier
Boost the sensitivity of the
HP 8566B spectrum analyzer
with the HP 8449B microwave
preamplifier. This low noise, high
gain preamplifier has a
frequency range of 1 to 26.5
Sensitivity improvements of up
to 25
analyze very low level signals in
dramatically reduced time, using
wider bandwidths. Low return
loss on the input and output
ports of the preamplifier
minimizes mismatch uncertainty.
Displayed Average Noise Level,
0
(characteristic)
allow you to detect and
Attenuation, 10 Hz RBW
1.0to2.5 -155
2. 0
to
5.8
12.5
18 .6
to
5.8
12.5
to
to
18.6
22
-154
-150
-144
-140
I
Computers and Plotters
The HP 8566B spectrum analyzer
works with computers that support
HP BASIC, including HP 9000
Series 200 and 300 computers and
IBM PC/AT-compatible models.
The HP 7440 and 7550 plotters
are recommended for use with
the HP 8566B. Data can be sent
directly from the analyzer to the
plotter, without the need for a
computer.
Specifications
Specifications
over the 0” to 55” C temperature range (unless otherwise noted), with
autocoupled
Characteristics
instrument performance.
Frequency
Measurement Range 100 Hz to 22 dc-coupled input;
up to 325
Frequency Reference Error
Aging Rate
Temperature Stability< 7 x over 0” to 55” C range
Center Frequency
Center Frequency Readout Accuracy
Spans
frequency reference error x center frequency
Spans
where n is the harmonic mixing number, depending
on center frequency:
(After adjusting freq zero, add 30% of RES BW
setting if error correction is not used.)
Zero Span
center frequency)
Frequency Span
0 Hz, 100 Hz to 22 over IO division CRT horizontal
axis; variable in approximately 1% increments. Two
FULL SPAN keys select spans from 0 to 2.5
from 2 to 22
Frequency Span Readout Accuracy
Spans
separation
Spans n x 5 MHz of indicated frequency
separation
Start or Stop Frequency Same as center frequency
describe the instrument’s warranted performance
operation and preselector
information about non-warranted
with external mixers
1 x and 2.5 x
0 Hz to 22
n x 5 MHz of frequency span +
0 Hz)
n x 5 MHz of frequency span + n x 100
+ frequency reference error x center frequency)
n Center Frequency
1
100 Hz to 5.8
2 5.8 to 12.5
3 12.5 to 18.6
4
(frequency reference error x
and
n x 5 MHz % of indicated frequency
0
10
20
30
40
50
60
70
80
10Hz100
Fig.
1. Typical spectrum analyzer resolution
Hz
1
10
100
1
Offset Frequency
10 MHz
Stability
Residual FM (typical) For fundamental mixing
50 peak-to-peak, freq. span 5 MHz.
Drift Because analyzer is phase-locked at beginning of
each sweep, drift occurs only during time of one sweep.
Frequency Span
100
100
MHz
Center Frequency Drift’
IO Hz/min of sweeptime
500 of sweeptime
5 of sweeptime
Typical, after 1 hr warmup at stabilized temp
COUPLED FUNCTION not required.
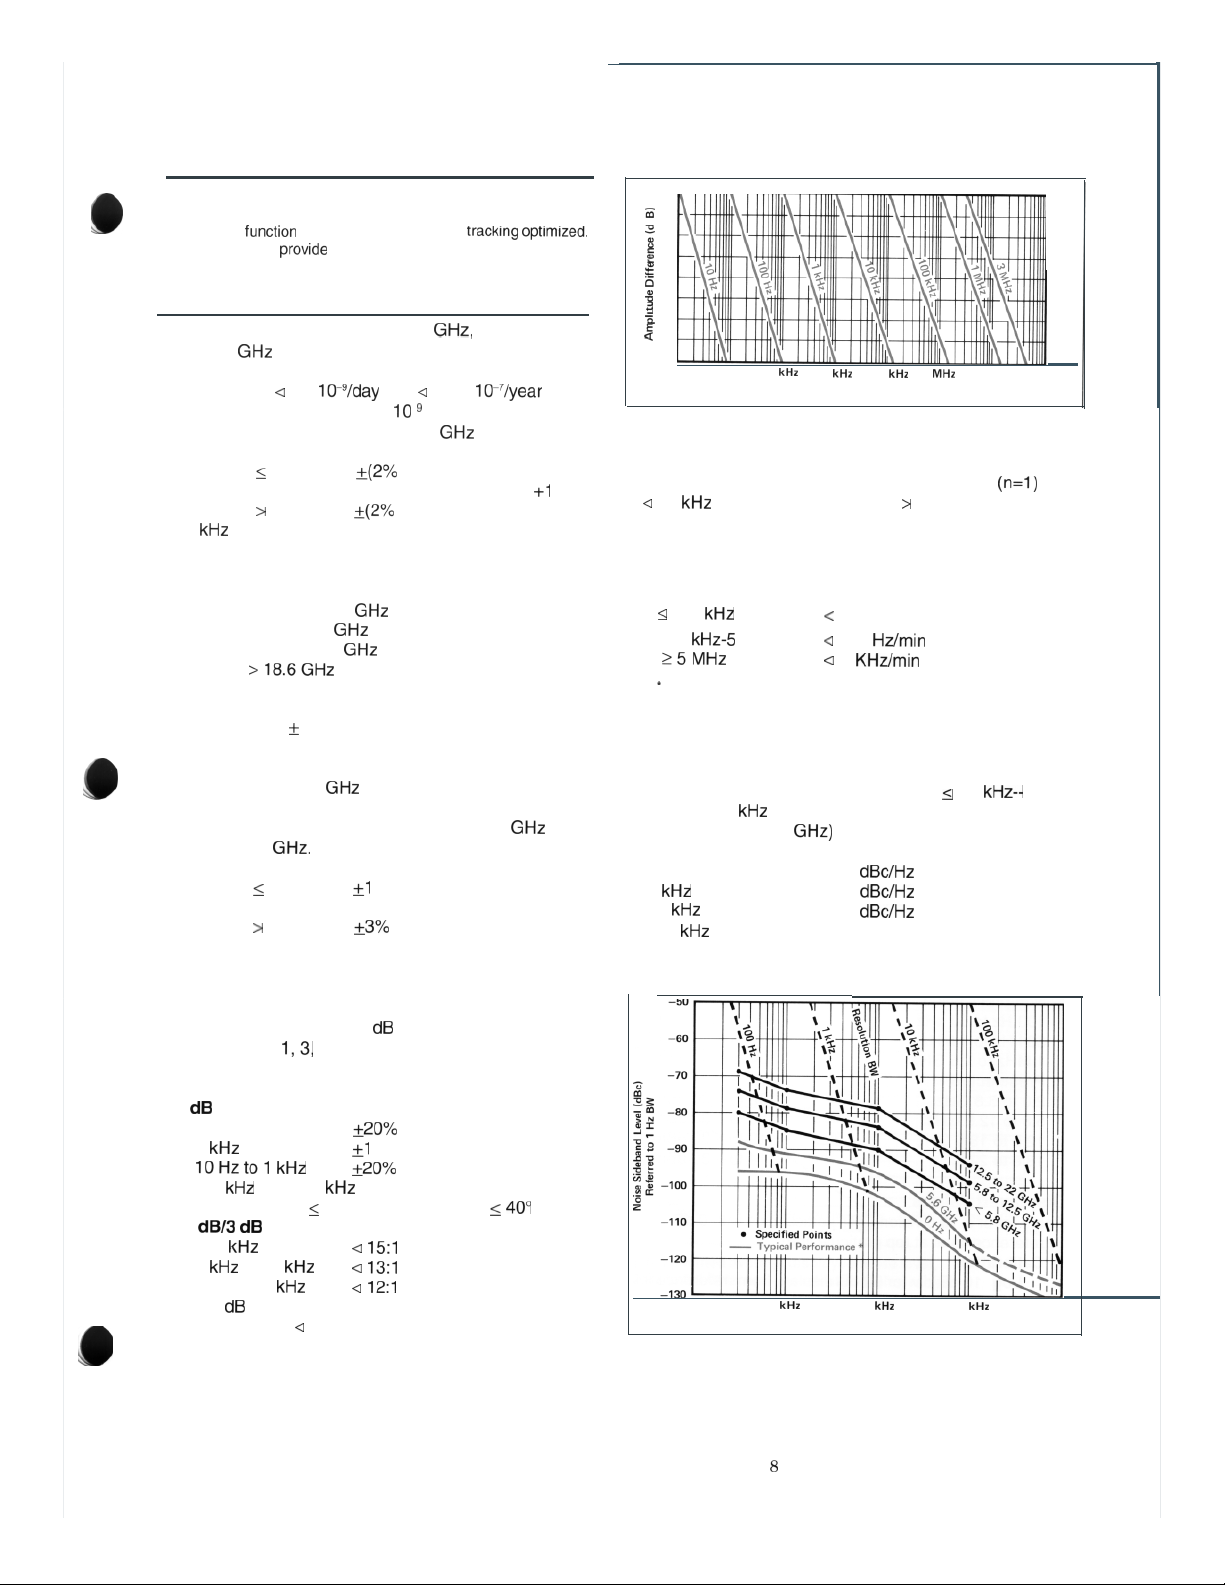
Spectral Purity
Noise Sidebands (for frequency span
except 100 offset--and center frequency
Hz
from 100
to 5.8
Offset from Carrier Sideband Level
320 Hz
1
IO
-80
-85
-90
100 -105 dBc/Hz
25
Typical Noise Sideband Performance
100 MHz
Resolution
Resolution Bandwidth 3
to 3 MHz in a
10 sequence. Bandwidth may be
bandwidths of IO Hz
selected manually or coupled to frequency span
(AUTO mode).
3
Bandwidth Accuracy
3 MHz
3 to 1 MHz
0%
(30 and 100 bandwidth accuracy figures
apply only with
60
Bandwidth Selectivity Ratio
100
3 to 30
30 Hz to 1
to 3 MHz
90% relative humidity, C.)
(60 points on IO Hz bandwidth are
separated by
100 Hz.)
Bandwidth Shape
Synchronously tuned, approximately Gaussian
100 Hz
1
10 100
Frequency Offset From Carrier
Fig. 2. Single sideband noise normalized
to 1 Hz BW vs offset from carrier
1 MHz

Typical analyzer and SSB noise at 5.0 center
Fig. 3.
frequency. May be limited by average noise level.
Power-Line-Related Sidebands
(for line conditions
Offset
from
Carrier
Hz -70
-75
in Power Requirements
Center
12.6 18.6
6.8 to
12.6
-60
18.6
22
Typical’
Amplitude
Measurement Range
Measurement range is the total amplitude range over which
the analyzer can measure signal responses. The
is determined by sensitivity (10 Hz RBW and 0
attenuation) and the high value by damage level.
Tuned Frequency
Non-preselected
100 Hz to 50
50 to 1 MHz
Range
95 to + 30
112 to + 30
1 MHz to 2.5
Preselected
2.0 to 5.8
5.8 to 12.5
12.5 to 18.6
18.6 to 22
Displayed Values
Scale (over a division CRT vertical axis with 0
reference level at top graticule line)
Calibration
Log
dB/div for 90 display from reference level.
Expanded from reference level:
5 dB/div for 50
2 dB/div for 20
1 dB/div for 10
Linear 10% of ref
display
display
display
when calibrated voltage
value
RF input
Reference Level
Range
Log
volts. Readout expandable to to -119.9
(-139.9 for 1 kHzRBW)*
Linear 7.07 V to 2.2
expandableto 223.6 V to 2.2
*
for 1 RBW)*
Maximum total power not to exceed damage level
to -99.9 or equivalent in
full scale. Readout
(0.22
Accuracy
The sum of the following factors determines the accuracy of
the reference level readout. Measurement technique used
after calibration with CAL signal determines applicability of
uncertainty sources. Specifications given with preselector
tracking optimized using MARKER PRESELECTOR PEAK.
With corrected readout (SHIFT W and SHIFT X executed
just prior to measurement), 20” to
and minimum one hour warmup time.
Calibrator Uncertainty
Frequency Response (Flatness) Uncertainty
(10
attenuation)
to
100 Hz to 2.5
2.0 to 12.5
12.5 to 20
20 to 22.0
Cumulative, 100 Hz to 20
Absolute Amplitude Calibration Uncertainty
The uncertainty of setting the frequency response
curve absolutely when using the internal
CAL signal or other calibration signal in the
100 Hz to 2.5
band (10 input attenuation).
Resolution Bandwidth Switching Uncertainty
Referenced to 1 MHz RES BW
30 Hz
3 MHz
MHz
f0.2
f0.2
Log Scale Switching Uncertainty
Log Fidelity
Incremental
over 0 to 80 display
Cumulative
over 0 to 90
Hz RBW
over 0 to 90
.O over 0 to 80
Linear Fidelity
of reference level over top
divisions of the display
IF Gain Uncertainty Reference to -10
reference level with 10 input attenuation.
Reference Level
3
RBW
RBW 100 Hz-l
RBW 30 Hz
0 to -59.9
0 to -79.9
0 to -79.9
-80 to -100
RBW 10 Hz
0 to -79.9
-80 to -100
C temperature range,
f2.2
0.3
0.3
0.3
2.0
1 .O
2.0
9

Log Digitization Uncertainty
10
5
2 dB/div
1 dB/div
0.2
fO.l
0.04
0.02
Linear Digitization Uncertainty
Error Correction Accuracy (applicable when SHIFT W
and SHIFT X are executed)
0.4
Reference Line Accuracy Equals the sum of reference
level accuracy plus the scale fidelity between the
reference level and the reference line level.
Dynamic Range
Spurious Responses (signals generated by the
analyzer due to input signals) for signals
at the input mixer, all harmonic and intermodulation
distortion
Second Harmonic Distortion
70 below input signal.
(for mixer levels -40
100 Hz to 50 MHz -70
50 to 700 MHz -80
700 MHz to 2.5
For mixer levels -10
2 to 22
-70
-100
Image, Multiple, and Out-of-Band Responses
Image responses are due to input signals that are two
times the IF frequency above or below the tuned
frequency. Multiple responses are due to input signals
mixing with more than one LO harmonic. Out-of-band
responses are due to input signals outside of the
selected frequency band.
Applied
Tuned
Frequency Frequency
O-2.5
2.0-5.8
O-2.5
NA
2.0-5.8 5.8-12.5 12.5-18.6 18.6-22.0
-60 -60 -60
-60
5.8-l 2.5 -60 -70 -60 -60
12.5-18.6
18.6-22.0
*Image Responses:
-45dBc
-40 -60 -60
-60
18.6-20.0 -50 20.0-22
-70 dBc*
Residual Responses (signals displayed by the analyzer
independent of input signals), 0
input attenuation, no
input signal.
100 Hz to 5.8
5.8 to 12.5
-100 dBm*
-95
12.5 to 18.6 -85
*Limited by the appropriate DANL or -100 whichever is greater.
18.6 to 22
-80
Gain Compression
1 .O 100 Hz to 22 with -5 at input mixer
Displayed Average Noise Level (Sensitivity)
0
input attenuation, Hz RBW
100 Hz to 50
50 to 1 .O MHz
1 .O MHz to 2.5
-95
-112
-134
2.0 to 5.8 -132
5.8 to 12.5 -125
12.5 to 18.6
18.6 to 22
-114
-60
Fig. 4. Typical optimum dynamic range
-30
Level
-20 -10
Third Order Intermodulation Distortion
Third Order Intercept
5 MHz to 5.8
5.8 to 18.6
18.6 to 22
2 to 22
for 100 MHz
+ 5 (typical)
+ 50 (typical)
signal separation
0
-140
100 Hz
Fig. 5. Specified average displayed noise level,
100 Hz to 2.5 non-preselected tuning range
10

Fig. 6. Specified average displayed noise level,
2.0 to 22 preselected tuning range
Marker
(frequency and amplitude are read out continuously)
Marker Type Frequency Accuracy
Normal
Delta
same as center frequency accuracy
same as frequency span accuracy
Amplitude Accuracy
Normal
same as reference level accuracy +
scale fidelity between the reference
level and marker position
Delta
same as frequency response
uncertainty and scale fidelity
between two markers
Sweep Time Accuracy (1 to 1500s
full sweep)
200 second sweep time, 10%
200 second sweep time, 30%
Inputs
RF Input
100 Hz to 22
female connector, dc-coupled
Maximum Input Level
Continuous power:
ac
from 50 ohm source
Mixer protected by diode limiter,
100 Hz-2.5
Pulse power: 100 W, 1 pulse width with
50 input attenuation
I 0 peak power to input mixer)
(
100 damage level
Input Attenuator0
SWR (typical)
Input
Attenuation
to 70 in steps
Tune Frequency
100Hzto
2.5 5.8
1.2
0 dB*
‘when tuned to within
2.3
IF Input
Maximum Input Level
ac
+10 continuous power from
50 ohm source
20 V with rise time of 1
dc
MHz of signal
precision type-N
2 to
1.5
3.0
5.8 to
22
1.9
3.0
External Sweep Trigger Input (rear panel) Must be
2.4 V (5 V max), 1 kohm nominal input impedance.
External Frequency Reference Input
5 MHz
25 Hz or MHz Hz, 0 to
Must equal
50 ohm nominal input impedance. Analyzer performance
will be degraded unless frequency reference phase noise
and spurious signals are
(1 Hz) referred to 10 MHz at a 100 Hz to 10
40 single sideband
offset.
Quasi-Peak (rear panel; nominal values)
Video Input 0 to 2 V, 139 ohm input impedance
21.4 MHz IF Input
Nominally -11
with 10
input attenuation, 50 ohm input impedance
Calibrator (front panel)
100 MHz
-10
(frequency reference error x 100 MHz)
0.3 50 ohm impedance, nominal
1st LO (front panel)
2.3 to 6.1
50 ohm impedance, nominal
Sweep and Tune Output (rear panel)
-1
of tuned frequency (2% + 10
kohm impedance, nominal
Display Outputs (typical parameters)
X, Y, and Z outputs for auxiliary CRT displays.
Z
BLANK
1 V for full deflection
0 to 1 V intensity modulation, -1 V blank
TTL level 2.4 V for blanking
Compatible with most oscilloscopes.
Recorder Outputs (typical parameters)
Outputs to drive all current HP X-Y recorders using positive
or TTL pen uplift.
Horizontal Sweep Output (X-axis)
A voltage proportional to the horizontal sweep of the
frequency sweep generator. 0 V for left edge,
0
V for right edge; 1.7 kohm impedance, nominal.
Video Output (Y-axis)
Detected video output (before A-D conversion)
proportional to vertical deflection of the CRT trace
100
from 0 to 1 V; 475 ohm impedance,
nominal.
Output (Z-axis)
During sweep, pen down 0 V from
During retrace, pen up
V from kohm source
ohm source
21.4 MHz Output (rear panel, typical)
21.4 MHz; 50 ohm impedance, nominal: -20
for a signal
at reference level. In log scales, the IF output logarithmically
related to RF input signal; in linear, the output is linearly
related.
Frequency Reference (rear panel, typical)
10.000 MHz, 0
50 ohm output impedance
10 MHz Output (rear panel, typical)
5 to ohm output impedance
Video Output 0 to 2 V,
Cathode Ray Tube
aluminized
10 ohm output impedance
Post deflection accelerator,
phosphor, electrostatic focus and
deflection.
Viewing Area
Approximately 9.6 cm vertically
by 11.9 cm horizontally (3.8 in x 4.7 in)
17

General Specifications
.
Environmental
Temperature
Operation 0” to 55” C
Storage
Increased internal temperatures may result if the
rear panel air filters are not cleaned regularly.
Altitude
Operation
Storage
Power Requirements
or 240 V
standby). 400 Hz operation with Option 400.
Humidity
Operation Type tested to 95% relative humidity,
Storage
Conducted and radiated interference is within the
requirements of
CEO3 (Air Force), and
VDE 0871 and FTZ
Warm-Up Time
Operation Requires 30 minute warm-up from cold
Frequency Reference (typical)
Weight
Total, net
RF section, net
IF display section, net
RF section, shipping
IF display section, shipping
Dimensions
(Allow 100 mm, 4 inch
clearance at rear panel
for
denote with handles.)
‘457.2 mm (18 in.)
5mm (16 75
-40” to 75” c
4,572 m (15,000 ft)
15,240 m (50,000 ft)
50 to 60 Hz; 100,200, 120,220,
-10%); approximately 650 VA (40 VA in
25” to 40” C, except as noted in electrical
specifications.
5% to 90% relative humidity,
Part 7 RE02 and
Publication 11;
start, 0” to 55” C. Internal temperature
equilibrium is reached after 2-hour
warm-up at stable outside temperature.
Frequency reference aging rate attained
after 24 hour warm-up from cold start at
25” C. Frequency is within 1 x
stabilized frequency within 30 minutes.
cables.
marked with
598.5 mm (23.56 in)
558.8 mm (22 in)
to C
of final
50 kg (112 lb)
29 kg (65 lb)
21 kg (47 lb)
35 kg (78 lb)
27 kg (60 lb)
mm (24.7 in)
Remote Operation
The standard HP 8566B operates on the
Packard Interface Bus (HP-IB). All analyzer control
settings (with the exception of VIDEO TRIGGER
LEVEL, FOCUS, ALIGN, INTENSITY, FREQ ZERO,
AMPTD CAL, and LINE power) are remotely
programmable. Function values, marker frequency/
labels and graphics may be input.
LCL Returns analyzer to local control, if not locked out by
controller.
Service Request
SHIFT r calls an HP-IB request for service.
Interface Functions
T6, SRI, PPO, Cl, C2,
C3, C28, E2
Options
All specifications for options are identical to standard
HP 85668 except as noted.
400 Hz Power Line Frequency Operation (Option 400)
Power Line Related Sidebands
(center frequency from 100 Hz to 5.8
Offset from Carrier
2
2 to 5.5
Power Requirements
Line frequency
Line voltage
Operating Temperature Range
400 Hz
50 Hz to 60 Hz (service only,
not for extended periods) 0” to
A/B traces may be output; CRT
Sideband Level
-55
-65
400 Hz
line frequency
(50 to 60 Hz operation for
servicing only)
100 to 120 v
-10%)
0” to 55” c
C
BACK
Fig.7. Instrument dimensions with and without handles
SIDE
12

HEWLETT
PACKARD
Ordering Information
HP 8566B Spectrum Analyzer 100 Hz to 22
Option
Option 002
Option 010
Option 016
Option 031
Option 080
Option 081
Option
Option
Option 400
Option 462
Option 908
Option 910
Option 913
Option 915
Option
Option W32
Option
Option W52
HP 8566AB
Recommended Accessories
HP 85644A
HP 85645A
HP 8449B
HP 11975A
Preselected Mixers
HP 11974A
HP
HP 11974U
HP 11974V
HP 11974
Option 003
Harmonic Mixers*
HP 11970K
HP 11970A
HP 11970Q
HP 11970T
Option 001
Option 002
HP 11970U
HP 11970V
HP 11970W
Option 009
For more information about other mixers, contact your local HP sales office.
Turbo retrofit kit for any HP 8566B
Turbo option for faster measurements
Rack mount slide kit
Installed EM1 receiver functions
German operating manual
Information card in Japanese
Information card in French
MIL-STD 45662A calibration certification
MIL-STD 45662A calibration certification
with test data
400 Hz operation
100 Hz, 1
and 1 MHz
Impulse bandwidth filters for EM1 measurements
Rack flange kit without handles
Extra operating and test and adjustment manuals
Rack flange kit with handles
Troubleshooting and repair manual set
3-year customer return repair
3-year customer return calibration
5-year customer return repair
5-year customer return calibration
Retrofit kit to convert HP 8566A to HP 8566B
Tracking source 300
Tracking source 300
to 6.5
to 26.5
Preamplifier 1 to 26.5
Amplifier 2 to 8
26.5 to 40
preselected mixer
33 to 50 preselected mixer
40 to 60
50 to 75
preselected mixer
preselected mixer
Delete power supply
18 to 26.5
26.5 to 40
33 to 50
18 to 40
mixer
mixer
mixer
mixers, hardwood case,
Add 40 to 60 mixer
Add 33 to 50
40 to 60
50 to 75
75 to 110
mixers
mixer
mixer
mixer
Mixer connection set adds three l-meter low-loss
SMA cables, wrench, Allen screw driver for any
HP 11970 series mixer.
United States:
Hewlett-Packard Company
4 Choke Cherry Road
Rockville, MD 20850
670 4300
Hewlett-Packard Company
5201
Rolling Meadows, IL 60008
Hewlett-Packard Company
5651 W. Manchester
Los Angeles, CA 90045
Hewlett-Packard Company
2000 South Park Place
Atlanta, GA 30339
Canada:
Hewlett-Packard Ltd.
6877 Drive
Mississauga, Ontario
(416) 678 9430
Europe:
Hewlett-Packard
European Marketing Centre
P.O. Box 999
1180 AZ Amstelveen
The Netherlands
20 547 9999
Japan:
Yokoeawa-Hewlett-Packard Ltd.
Shinjuku-ku
Tokyo 160, Japan
53711315
Latin America
Latin American Region Headquarters
Monte Pelvoux No. 111
Lomas de Chapultepec
11000 Mexico, D.F.
(525) 202 0155
Australia/New Zealand:
Hewlett-Packard Australia Ltd
31-41 Joseph Street
Blackburn, Victoria 3130
Australia 004 394 763)
(03) 895 2895
Far East: Asia Pacific
Hewlett-Packard Asia Pacific Ltd
22/F Bond Centre, West Tower
89 Queensway, Central, Hong Kong
For more information, call your
local HP sales office listed in
telephone directory or an
office listed below for the location
of your nearest sales office.
Data subject to change
Printed in U.S.A.
5091-3385E
Drive
255 9800
337 8035
980 7351
Shinjuku 4 Chome
848 7777
 Loading...