


User's Guide
HP 8510 Pulsed-RF Network Analyzer
ABCDE
08510{90505
No.
Part
HP
Printed
in
USA
March
1995

Notice
The information contained in this do cument is sub ject to change without notice.
Hewlett-Packard makes no warrantyofany kind with regard to this material, including,
but not limited to, the implied warranties of merchantability and tness for a particular
purpose. Hewlett-Packard shall not b e liable for errors contained herein or for incidental or
consequential damages in connection with the furnishing, performance, or use of this material.
Restricted Rights Legend.
Use, duplication, or disclosure by the U.S. Government is sub ject to restrictions as set forth
in subparagraph (c) (1) (ii) of the Rights in Technical Data and Computer Software clause
at DFARS 252.227-7013 for DOD agencies, and subparagraphs (c) (1) and (c) (2) of the
Commercial Computer Software Restricted Rights clause at FAR 52.227-19 for other agencies.
c
Cop
yrigh
t
adaptation, or
cop
ta
the
Rosa
Systems
under
San
Hewlett-P
1988
translation
la
t
yrigh
Division,
ws.
ard
ack
without
1400
Compan
prior
oun
F
.
y
written
taingro
Righ
All
ermission
p
Pkwy,
e
v
ts
San
Reserv
prohibited,
is
ta
ed.
Rosa,
Repro
CA
duction,
except
as
95403-1799
allo
ed
w
CERTIFICATION
Hewlett-Packard Company certies that this product met its publishedspecications at the
time of shipment from the factory. Hewlett-Packard further certies that its calibration
measurements aretraceable to the United States National Institue of Standards and Technology
(NIST, formerly NBS), to the extent al lowed by the institute's calibration facility, and to the
calibration facilities of other International Standards Organization members.
WARRANTY
This Hewlett-Packard instrument product is warranted against defects in material and
workmanship for a perio d of one year from date of delivery. During the warranty period,
Hewlett-Packard Company will, at its option, either repair or replace pro ducts whichproveto
be defective.
For warranty service or repair, this product must be returned to a service facility designated
byHP.Buyer shall prepay shipping charges to HP and HP shall payshippingcharges to
return the pro duct to Buyer. However, Buyer shall pay all shipping charges, duties, and taxes
for products returned to HP from another country.
HP warrants that its software and rmware designated by HP for use with an instrument
will
es
do
unin
execute
arrant
not w
terrupted
programming
its
that the
error
or
operation
free.
instructions
the
of
LIMIT
prop
when
instrumen
ATIONS
erly
t,
OF
or
W
installed
are,
w
soft
ARRANTY
on that
rm
or
instrument.
will
are
w
HP
e
b
y
eration
op
b
or
foregoing
The
Buy
er,
Buy
the
outside
main
NO
of
tenance.
OTHER
DISCLAIMS
AR
P
A
OR
F
arrant
w
er-supplied
vironmen
en
ARRANTY
W
IMPLIED W
THE
TICULAR
not
shall
y
are
w
soft
sp
tal
IS
PURPOSE.
defects
to
apply
terfacing,
in
or
ecications
EXPRESSED
for
OR
ARRANTIES OR
CLUSIVE
EX
resulting
unauthorized
duct,
pro
the
IMPLIED.
CHANT
MER
REMEDIES
improp
from
dication
mo
improp
or
SPECIFICALLY
HP
ABILITY
er
or
er site
tenance
main
misuse,
preparation
FITNESS
AND
THE REMEDIES PROVIDED HEREIN ARE BUYER'S SOLE AND EXCLUSIVE
REMEDIES. HP SHALL NOT BE LIABLE FOR ANY DIRECT, INDIRECT, SPECIAL,
INCIDENTAL, OR CONSEQUENTIAL DAMAGES, WHETHER BASED ON CONTRACT,
TORT, OR ANY OTHER LEGAL THEORY.
ANCE
customer
e
assistanc
e agr
d Sales and Servic
ements
available
e
ar
eOc
e. A
for
ddresses
maintenanc
duct
o
Pr
Hewlett-Packar
dPr
For any assistanc
eprovided at the b
ar
ements
e
agr
e
oducts.
ontact your ne
e, c
ack of this manual.
ASSIST
other
and
arest Hewlett-Packar
iii

Contents
1. Introduction
Organization of This Do cument. . . . . . . . . . . . . . . . . . . . . 1-1
System Description . . . . . . . . . . . . . . . . . . . . . . . . . 1-1
Principles of Pulsed-RF Network Measurements . . . . . . . . . . . . . 1-1
Pulse Measurements Overview . . . . . . . . . . . . . . . . . . . . 1-1
Operating the HP 8510 for Pulsed-RF Measurements . . . . . . . . . . 1-1
Frequency Domain Point-in-Pulse Measurements . . . . . . . . . . . . 1-2
Pulse Prole Domain Measurements . . . . . . . . . . . . . . . . . . 1-2
General Timing Information . . . . . . . . . . . . . . . . . . . . . 1-2
Using External Triggering and Pulse Mo dulation . . . . . . . . . . . . 1-2
High P
Reference
er Measuremen
ow
Data
.
. .
. .
.
.
.
.
.
.
.
.
.
.
.
.
.
.
.
.
.
ts .
.
.
.
. .
. .
. .
. .
.
.
.
.
.
.
.
.
.
.
.
.
.
.
.
1-2
1-2
System
2.
Who
Principles
3.
Pulse
Pulse
Dut
Pulse
Rise/F
Trigger Delay. . . . . . . . . . . . . . . . . . . . . . . . . . . . . 3-2
Pulse Prole Measurement Resolution Perio d . . . . . . . . . . . . . . . 3-3
4. Pulse Measurements Overview
Pulsed-RF S-parameters versus Frequency . . . . . . . . . . . . . . . . 4-1
Pulse
Op
5.
System Connections
Turn On System P
Operator's Chec
Description
.
.
.
.
.
.
.
.
.
.
.
.
.
ts?
.
.
.
.
.
.
.
.
. .
.
.
.
.
.
.
.
.
.
.
.
.
.
.
.
.
.
.
.
.
.
.
.
.
.
ts
.
.
.
.
.
.
.
.
.
.
.
.
.
.
.
.
.
.
. .
. .
.
.
.
.
.
.
.
.
.
.
.
.
.
.
.
.
.
.
.
.
.
.
.
.
.
.
.
. .
. .
.
.
.
.
.
.
.
.
.
.
.
.
.
.
.
.
.
. .
. .
. .
. .
.
.
.
.
.
.
.
.
.
.
.
.
.
.
.
.
.
. .
.
.
.
.
.
.
.
.
.
.
Measuremen
. . . . . . . . . . . . . . . . . . 5-3
t State Files
. . . . . . . . . . . . . . . . . 5-5
.
.
.
.
ts
. . . . . . . . . 5-3
.
.
.
.
.
.
.
.
.
.
.
. .
.
.
.
.
.
w
Net
PRP
PRF
,
.
.
. .
.
.
.
.
Pulsed-RF
for
k
Measuremen
.
.
.
. .
.
.
Measuremen
ork
.
.
.
.
.
.
. .
.
.
.
. .
.
.
.
.
.
Pulsed-RF
e
of
Set
etition
etition
Mak
eration
Op
w
Signal
of
the
T
Flo
Pulsed-RF
eriod,
P
requency
F
.
.
.
.
.
.
. .
.
.
.
.
. .
. .
Domain
HP
Hardware State and Instrumen
k . . . . . . . . . .
riggering
.
8510
. . . . . . . . . . . . . . . . . . . . . . . . .
ower . . . . . .
Chec
Should
Theory
est
T
Rep
Rep
Cycle
y
Width
all Time
Prole
erating
Load Pulse
Pulse Prole Domain Check . . . . . . . . . . . . . . . . . . . . . 5-5
Frequency Domain Check . . . . . . . . . . . . . . . . . . . . . . 5-7
External
.
.
.
.
.
.
.
. 3-2
.
. 5-1
.
2-1
2-2
2-3
3-1
3-1
3-2
3-2
4-3
5-9
Contents-1
6. Frequency Domain Point-in-Pulse Measurements
Measurement Calibration for Point-in-Pulse . . . . . . . . . . . . . . . 6-1
Measurement. . . . . . . . . . . . . . . . . . . . . . . . . . . . . 6-1
Set Pulse Polarity . . . . . . . . . . . . . . . . . . . . . . . . . . 6-1
Set Pulse Width . . . . . . . . . . . . . . . . . . . . . . . . . . 6-2
Set Duty Cycle Limit . . . . . . . . . . . . . . . . . . . . . . . . 6-2
Set Trigger Delay. . . . . . . . . . . . . . . . . . . . . . . . . . 6-2
Connect the Device Under Test . . . . . . . . . . . . . . . . . . . . 6-2
7. Pulse Prole Domain Measurements
Measurement Calibration for Pulse Prole . . . . . . . . . . . . . . . . 7-1
Pulse Prole Domain . . . . . . . . . . . . . . . . . . . . . . . . 7-1
Frequency Domain Using Frequency List . . . . . . . . . . . . . . . . 7-2
Measurement. . . . . . . . . . . . . . . . . . . . . . . . . . . . . 7-4
Set Pulse Polarity . . . . . . . . . . . . . . . . . . . . . . . . . . 7-4
Set Pulse Width . . . . . . . . . . . . . . . . . . . . . . . . . . 7-5
Set Duty Cycle Limit . . . . . . . . . . . . . . . . . . . . . . . . 7-5
Set Measurement Time Span . . . . . . . . . . . . . . . . . . . . . 7-5
.
.
.
. .
. .
. .
.
.
.
.
.
.
.
.
d
erio
Set
Connect
Switc
Measuremen
Device
the
hing Bet
ween
Resolution
t
under
Frequency
P
.
.
est
T
Domain and
. .
. .
Pulse
. .
Prole
. .
.
.
.
Domain
.
.
.
.
.
.
.
.
.
.
.
.
.
.
7-5
7-5
7-7
Information
Cycle
Measuremen
Time
Cycle
t
.
Time
Width
Cycle
y
Prole
Characteristics
el
external
P
a30dBAmplier .
ort 1 and P
User Parameters and Set A
Memories
Normalized
Appropriate
.
. .
.
Limit
Domain
Domain
and
d
erio
P
and Stop
signal
Measuremen
er
w
o
ort 2 A
ttenuators . . . . . . . .
P
and
t
.
.
.
.
.
.
.
.
.
.
.
.
.
.
.
.
.
Time
Stop
rigger
T
Sweep
conditioning .
.
arameters
Measuremen
Measurement
Dela
y Cycle
Dut
Signals
.
.
.
ts
. . . . . . . . . . . . . . . . . . . .
ttenuators .
.
.
.
.
.
.
.
.
.
.
.
.
.
.
.
.
.
.
.
.
.
.
.
.
.
.
.
. .
.
.
.
.
.
.
.
.
.
.
.
.
.
.
.
.
.
.
.
.
.
.
.
.
.
.
. .
.
.
.
.
.
.
.
.
.
.
.
.
.
.
.
.
.
.
.
.
.
.
. .
.
.
.
.
.
.
.
.
.
.
.
.
.
.
.
. .
. .
.
.
.
.
.
.
.
.
.
.
.
.
.
. .
. .
.
.
.
.
.
.
.
.
y
.
.
.
.
.
.
.
Considerations .
.
.
.
.
.
.
.
.
.
. .
.
.
.
.
.
.
.
.
.
.
.
.
.
. .
.
. . . .
els .
. . . . . . . . . . . . .
. . . . . . . . . . . . . 10-5
ttenuators . . . . . . . . . . . . . 10-5
.
.
.
.
.
.
.
.
.
.
.
.
.
.
.
.
Calibration
t
Sequence
.
.
.
.
.
.
.
.
.
.
.
.
.
.
. .
.
.
.
.
.
.
.
.
.
.
. .
.
.
.
.
.
.
.
.
. .
.
.
.
.
.
.
. . . . . . . . . 10-4
. . . 10-5
.
.
. .
.
.
.
.
.
.
.
.
.
.
.
. .
.
.
.
.
.
.
.
.
. .
.
.
.
.
.
.
.
.
.
.
.
.
.
ork
w
Rep
Sw
Pulse
Dut
Pulse
requency
F
Lev
the P
the
Timing
Analyzer
eep
etition
Trigger
High
race
T
the
Calibration
General
8.
Net
Measuremen
Pulse
External
9. Using External Triggering and Pulse Mo dulation
Connect the Pulse Generator . . . . . . . . . . . . . . . . . . . . . . 9-1
10. High Power Measurements
Signal
Connecting
Example
Measure
Measure an Amplier with High Input Lev
Using
Controlling the A
Measure
Changing Signal Path After Calibration . . . . . . . . . . . . . . . . . 10-6
Set the Attenuators . . . . . . . . . . . . . . . . . . . . . . . . . 10-6
Store
View
Selecting
General
. 8-1
.
.
.
.
.
.
.
. 8-5
.
.
.
. 10-3
.
.
.
.
8-3
8-3
8-3
8-3
8-3
8-3
8-4
10-1
10-2
10-3
10-6
10-7
10-7
10-9
Contents-2

General Calibration and Measurement Sequence Using Display Math . . . . 10-9
11. Reference Data
Creating Pulse Hardware State and Instrument State Files . . . . . . . . . 11-1
Pulse Menus . . . . . . . . . . . . . . . . . . . . . . . . . . . . . 11-2
Pulse Conguration Menu . . . . . . . . . . . . . . . . . . . . . . 11-2
DETECTOR: WIDE BW . . . . . . . . . . . . . . . . . . . . . 11-2
DETECTOR: NORMAL BW . . . . . . . . . . . . . . . . . . . 11-3
PULSE WIDTH . . . . . . . . . . . . . . . . . . . . . . . . . 11-3
DUTY CYCLE . . . . . . . . . . . . . . . . . . . . . . . . . . 11-3
PULSE OUT: HIGH . . . . . . . . . . . . . . . . . . . . . . . 11-3
PULSE OUT: LOW. . . . . . . . . . . . . . . . . . . . . . . . 11-3
TRIGGER DELAY . . . . . . . . . . . . . . . . . . . . . . . . 11-3
TRIG MODE: INTERNAL . . . . . . . . . . . . . . . . . . . . 11-3
TRIG MODE: EXTERNAL . . . . . . . . . . . . . . . . . . . . 11-3
HP 8510 Option 008 Added Programming Codes . . . . . . . . . . . . . 11-4
HP 8510 Option 008 Added Query Commands . . . . . . . . . . . . . . 11-4
Contents-3
Figures
1-1. HP 8510 Pulsed-RF Network Analyzer System . . . . . . . . . . . . . 1-3
2-1. Simplied Pulsed-RF Network Analyzer Block Diagram . . . . . . . . . 2-2
2-2. HP 85110A S-Parameter Test Set Signal Flow . . . . . . . . . . . . . 2-4
3-1. Pulse Terms and Denitions . . . . . . . . . . . . . . . . . . . . . 3-3
4-1. Pulsed-RF S-Parameters versus Frequency (Frequency Domain Point-in-Pulse) 4-2
4-2. Pulsed-RF S-Parameters versus Time (Pulse Prole Domain) Measurement
Internal Pulse Output and Internal MeasurementTrigger . . . . . . . 4-4
5-1. System Cable Connections . . . . . . . . . . . . . . . . . . . . . . 5-2
5-2. Typical Response After Recall, Inst. State 8, Frequency, Detector: WB, Mult.
Srce. On . . . . . . . . . . . . . . . . . . . . . . . . . . . . 5-4
.
.
.
.
.
.
.
.
.
.
.
.
. .
. .
. .
. .
er
Prole,
Domain,
5-3.
Pulse Prole,
5-4.
Pulse
5-5.
S
5-6.
11
S
5-7.
11
Amplier
6-1.
Frequency
7-1.
Pulse
7-2.
S
7-3.
21
Minim
7-4.
7-5. S11, Smith
Net
8-1.
Example
8-2.
8-3. External
9-1. External Control of PRP and Duty Cycle . . . . . . . . . . . . . . . 9-2
9-2. Using External Trigger and External Modulation PRP = 10 microseconds,
10-1. Test Set Maximum Signal Levels . . . . . . . . . . . . . . . . . . . 10-2
10-2. Measuring a 30 dB gain Amplier . . . . . . . . . . . . . . . . . . . 10-3
Measuring
10-3.
Option
11-1.
Pulse
User1 a1,
Prole,
requency
F
,
requency
F
,
Prole,
Pulse
,
um
ork
w
Duty Cycle = 50% . . . . . . . . . . . . . . . . . . . . . . . . 9-3
008
S
11
Domain,
Domain,
Gain,
Displa
List
requency
F
Prole,
Time
Chart
Analyzer
ternal
In
Trigger
Amplier
an
Domain,
F
Span,
Mark
Marker
.
.
.
.
Pulse
Pulse
requency
During
y
List
Thru
.
Measuremen
Pulse
and Stop
.
Resolution P
.
.
.
Output
with
ulus,
Stim
.
.
.
Width
Width
Domain
Measuremen
Segmen
.
.
.
.
.
.
Cycle
t
PRP
Sweep
High
and
.
.
.
.
.
.
10
10
t-in-Pulse .
oin
P
Num
t
.
.
.
d
erio
.
.
.
.
and Dut
Timing
Input Lev
System
.
.
.
.
.
.
rigger
s,T
rigger
s,T
Calibration
t
er
b
. .
.
100
=
.
.
.
.
.
.
y Cycle
Diagram
els
Men
1
ns
us
. .
.
.
.
.
.
.
.
.
.
.
.
.
.
.
. .
. .
.
.
.
.
.
.
.
.
.
.
.
s .
5
y
Dela
.
.
.
.
. .
s
15
y
Dela
.
.
.
.
.
.
.
.
.
.
.
.
.
.
.
.
.
.
.
.
.
.
.
. .
.
.
.
.
.
.
.
.
.
.
.
.
.
.
.
.
.
.
.
.
.
.
.
.
.
.
.
.
.
.
.
.
.
.
. .
. .
.
.
.
.
.
.
.
.
.
.
.
.
. .
. .
.
.
.
.
.
.
.
.
.
.
. .
. .
.
.
.
.
.
.
.
.
.
.
.
.
. .
.
.
.
.
.
.
.
.
.
.
.
.
.
.
.
.
.
.
. .
.
.
5-4
5-6
5-6
5-7
5-8
6-3
7-3
7-3
7-4
7-6
7-6
8-2
8-4
8-5
10-4
11-5
Contents-4
1
Introduction
This documentisintended for use with the HP 8510B/C Option 008 Network Analyzer
and is a supplement to the HP 8510B/C Operating and Programming manual. It contains
descriptions of the pulsed-RF network analyzer system features for measurements in the
frequency domain and in the pulse prole domain. With respect to the standard, swept CW
system, op eration of the pulsed-RF system is identical except that the measurement is made
at a specic, known time during each pulse. For information ab out network analysis, please
refer to HP Pro duct Note 8510-10, HP 8510B Introductory User's Guide, for an introduction
to using the front panel for measurement setup, measurement calibration, and basic network
measurements.
Organization
section
This
ts
ten
con
System
duces
tro
In
Principles
of
list
A
con
h
eac
of
Description
HP 8510B/C
the
Pulsed-RF
of
terms
the
of
tains
hapter.
c
and
This
a
Document
hapters
c
the
of
list
Option
Netw
008
ork
denitions used
cumen
do
this
in
Pulsed-RF
measuremen
Measurements
in pulsed-RF
netw
description
brief
a
and
t
capabilit
t
ork measuremen
y
ts.
the
of
.
Pulse Measurements Overview
A description of how the network analyzer measures pulsed-RF S-parameters versus frequency
and versus time.
Operating
Describes the setup, measuremen
the
t calibration, and measuremen
Pulsed-RF
for
8510
HP
system and making pulsed-RF measuremen
Measurements
t pro cess for setting up the
ts.
Introduction
1-1
Frequency Domain Point-in-Pulse Measurements
This chapter contains measurement calibration and measurement procedures to display the
pulsed-RF S-parameters versus frequency.
Pulse Profile Domain Measurements
This chapter contains measurement calibration and measurement procedures to display the
pulsed-RF S-parameters versus time.
General Timing Information
Descriptions of the internal timing to show the system's internal pulse repetition period and
duty cycle capabilities.
Using External Triggering and Pulse Modulation
This section contains information to help you determine if your application requires external
tain
t.
accuracy
mo
pulse
P
High
Discusses
making
when
dulating
er
w
o
the
equipmen
t,
Measurements
considerations
ecial
sp
at
measuremen
ts
instructions
and
high
required
o
p
RF
wer
for
protect
to
lev
connecting
the
els.
the
test
external
system
equipmen
main
and
Reference
option
all
ws
Sho
Data
008
men
structures
u
and
denitions,
ey
k
including
programming
co
des.
1-2
Introduction

Figure
1-1.
HP
8510
Pulsed-RF
Netw
ork
Analyzer
System
Introduction
1-3

System Description
This chapter contains the following information.
A description of the HP 8510 Pulsed-RF Network Analyzer System.
A simplied blo ck diagram of the HP 8510 Pulsed-RF Network Analyzer System.
A signal ow diagram of the HP 85110-series S-parameter Test Set.
Who Should Make Pulsed-RF Measurements?
Pulsed-RF stim
the
y
destro
could
tested
e
b
ust
m
8510 pulsed-RF
HP
The
optimized
pulsed-RF
circuits
a
at
to
in
devices
rm
resp
vides
pro
precisely
ma
o
tw
whic
kno
jor
h
ulus ma
device,
using
are
w
onses.
precise
wn,
areas:
accept
y
PRF
a
netw
feature
or
F
sync
eatable
rep
tests
CW
a
required
e
b
as
h
suc
and
ork
to
set
rst
the
hronization
whic
in
input
in
when
duty
analyzer
e
mak
time,
during
time
the
h
and
where
cases
testing
cycle that
conguration
error-corrected
fully
com
the
the
with
the pulse.
ulus
stim
duce
pro
con
ccurs
o
accurately
bination
pulse, allo
signal
pulsed
a
tin
prior
adds
This
to
output.
application
uous
pack
to
represen
ecialized
sp
S-parameter
wideband
of
wing
extends
device
the
aging, or
ts
S-parameters
of
where the
nal
its
hardw
measuremen
and
IF
HP
the
pulsed,
is
8510
2
signal
test
the
device
application.
an
and
are
of
ts
accurate timing
measured
e
b
to
applications
of
tests
and
same
the
high p
mo
in
ow
Calibration
de.
pulsed-RF
er,
data
is
8510
HP
The
vironmen
en
measuremen
pulsed-RF
our
y
as
t
ou
y
t,
net
measuremen
calibrate
can
w
ork
analyzer
or
F
t.
in the
system
example,
same high
allo
if
po
ws
ou are
y
wer,
calibrate
to
ou
y
making a
pulsed-RF
taken only while the pulse is on. This type of calibration mayprevent damage to calibration
standards that would be damaged in high p ower, CW calibrations.
The recommended conguration of the HP 85108 Pulsed-RF Network Analyzer consists of the
following items.
HP
rm
8510B/C
revision
are
w
net
work
B.05.11
analyzer
greater
or
equipp
ed
(for
Option
with
HP 8510B),
the
008,
or
Wideband
revision
IF,
C.06.54
or
greater
(for
8510
HP
and
HP 8510C).
HP 83622 syn
HP 83624
synthesized sweeper with options 003, 004, and 008.
thesized sw
eeper with options 001, 003, 004, and
HP 85110-series pulsed-RF fundamen
tally mixed S-parameter test set
008.
Also, other external equipmentsuchaspower ampliers, bias supplies and pulse generators
system.
ma
e
b
y
included in
the
System
Description
2-1
The pulsed-RF network analyzer system allows you to select either the normal precision 10
kHz IF bandwidth or the new wideband 3 MHz IF bandwidth. The wide IF and detection
bandwidth allows testing using pulses as short as 1 microsecond but with accuracy comparable
to traditional non-pulsed measurements.
These system components may b e rack-mounted or arranged on a desktop.
Theory of Operation
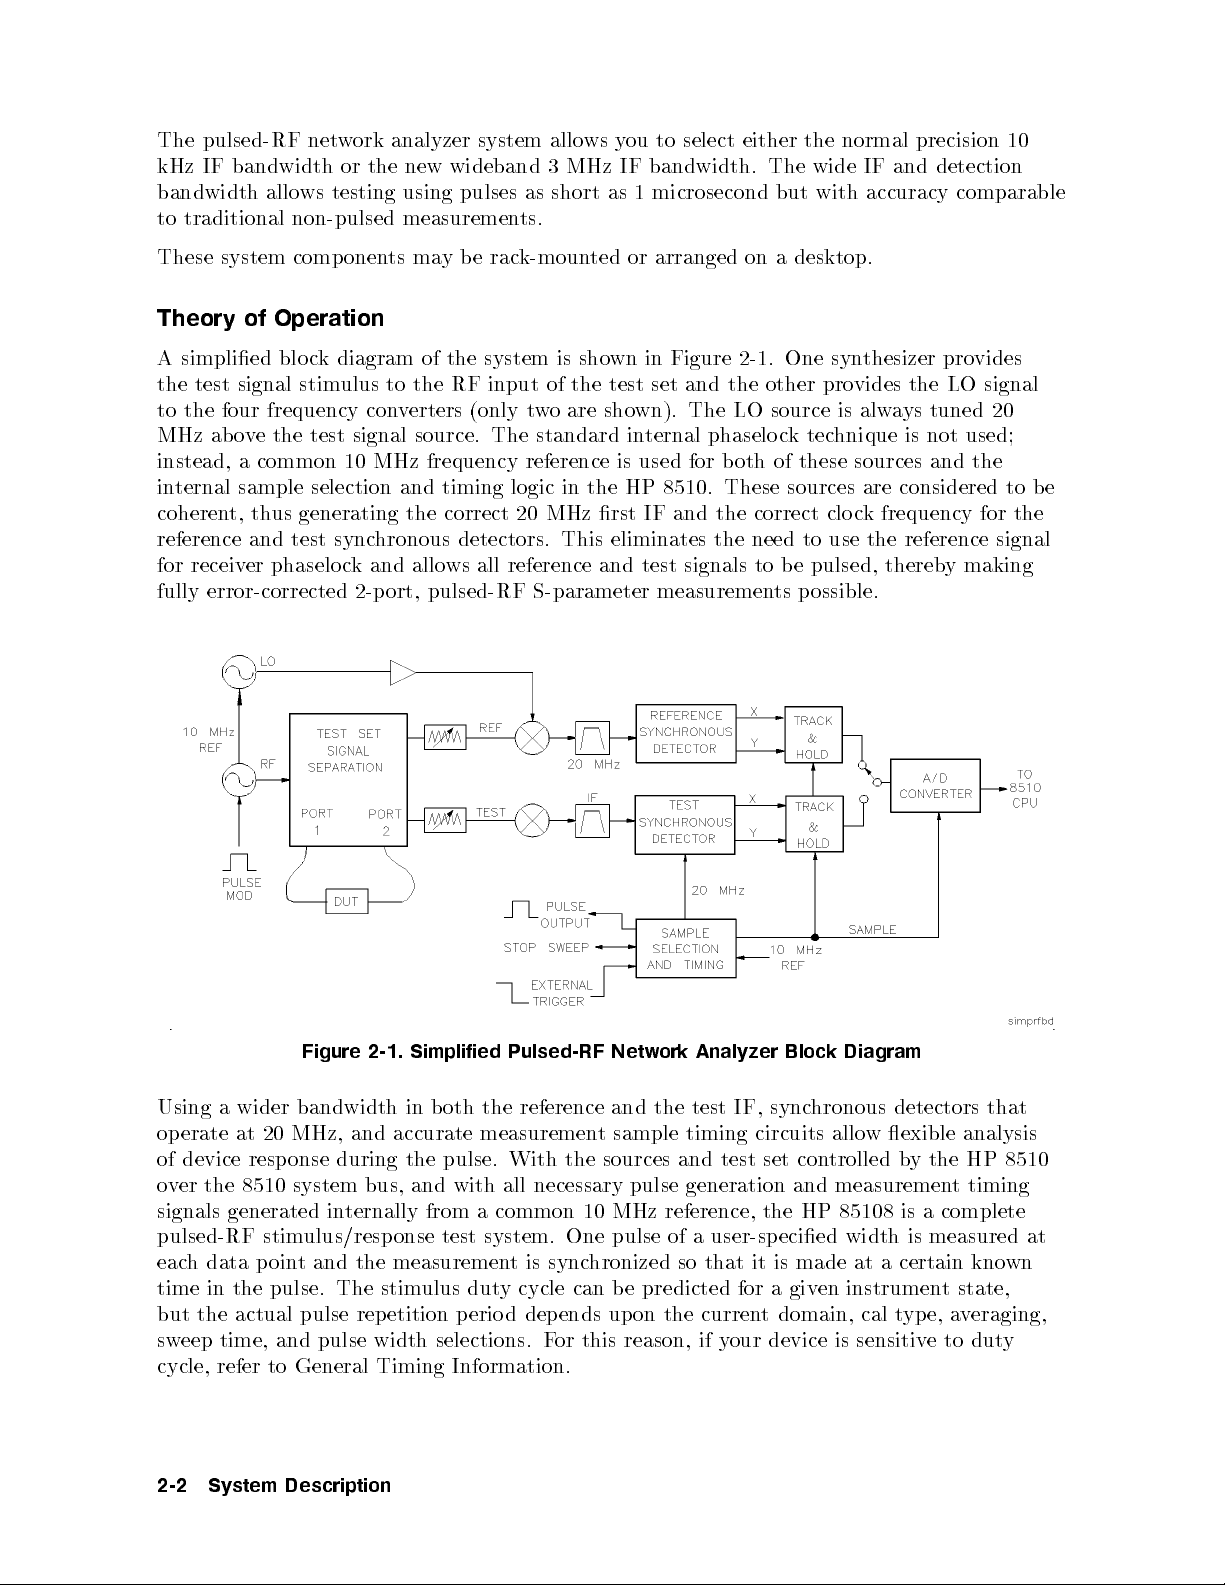
A simplied blo ck diagram of the system is shown in Figure 2-1. One synthesizer provides
the test signal stimulus to the RF input of the test set and the other provides the LO signal
to the four frequency converters (only two are shown). The LO source is always tuned 20
MHz ab ove the test signal source. The standard internal phaselo cktechnique is not used;
instead, a common 10 MHz frequency reference is used for both of these sources and the
internal sample selection and timing logic in the HP 8510. These sources are considered to b e
coherent, thus generating the correct 20 MHz rst IF and the correct clock frequency for the
reference and test synchronous detectors. This eliminates the need to use the reference signal
for receiver phaselock and allows all reference and test signals to be pulsed, therebymaking
fully error-corrected 2-port, pulsed-RF S-parameter measurements p ossible.
Figure 2-1. Simplified Pulsed-RF Network Analyzer Block Diagram
detectors
exible
y the HP 8510
and
in
accurate
Using
erate
op
wider
a
at
bandwidth
MHz,
20
of device resp onse during the
oth the
b
reference
measuremen
and
sample
t
timing
circuits
sync
IF,
test
the
pulse. With the sources and test set con
hronous
allow
trolled b
over the 8510 system bus, and with all necessary pulse generation and measuremen
signals generated in
ternally from a common
pulsed-RF stimulus/resp onse test system. One pulse of a
each data poin
t and the measuremen
t is sync
10 MHz reference, the HP 85108 is a complete
user-specied width is measured at
hronized so that it is made at a certain kno
that
analysis
t timing
wn
time in the pulse. The stimulus duty cycle can be predicted for a given instrument state,
but the actual pulse repetition perio d depends upon the current domain, cal type, averaging,
y
dut
to
eep
sw
cycle,
2-2
time,
refer
System
pulse
and
to General
Description
width
Timing
selections.
Information.
this reason,
or
F
sensitiv
device
our
y
if
is
e
Either the internal logic, the TTL Trigger Input, or the HP-IB Group Execute Trigger from
an external controller can initiate a measurement cycle. When control of the pulse repetition
period and duty cycle is required, the HP 8510 can use the trigger input to synchronize with
the internal or an external pulse mo dulator. The HP 8510 Stop Sweep output can b e used as
a gating signal to tell when the analyzer is ready for the next measurement. The measurement
is made with 100 nanosecond resolution and ab out 200 picosecond uncertainty with respect to
the internally- or externally-generated measurement trigger.
Test Set Signal Flow
Figure 2-2 shows a detailed diagram of the HP 85110-series test set signal separation, signal
routing, and frequency conversion. This is a fundamentally mixed test set, providing four 20
MHz outputs to the network analyzer. Placement of a 0 to 90 db (10 dB/step) attenuator
before each mixer provides control of the signal levels into the mixers while allowing operation
at high PORT 1 and PORT 2 signal levels necessary in many pulsed-RF applications.
The test set has rear panel access links to allow integration of additional test and signal
conditioning equipment in the low-loss main signal paths to the test ports. If your device
exhibits more than about 20 dB of gain, or higher port signal levels are required, refer to the
chapter.
include
test
IF
and
ts
mixing
set.
detectors.
and
detectors.
the HP
IF
This
and
sets
test
8514, 8515,
85110
HP
There
HP
The
erform
p
designed to
are
and
fundamen
applications
are
85104
pulse
the
work
coaxial
8516
mixing
tal
millimeter
measuremen
with the
whic
in
test sets
sets;
test
test
the
h
can
functions
t
normal 10
and
is
set
HP
e
b
describ
HP
the
designed
can
85110
congured
ed
kHz
to
IF
85104
w
e
b
to
here.
ork
w
o
P
High
Hewlett-P
detectors.
and
millimeter
the
with
with
used
with
erate
op
Measuremen
er
ard
k
ac
These
eguide
v
a
w
wideband
normal
the wideband
harmonic
IF
All
Test
four
coaxial
HP
Sets,
coaxial
so
a
test
sets
test
system
sets
can
and
can b
a
equipp
e
e
b
equipp
ed
millimeter-w
ed
for
a
v
to
a
e
include
wide
set.
test
Option
range
001,
applications
of
IF
Switc
hing
including
y
b
for
Multiple
to
up
System
Description
2-3
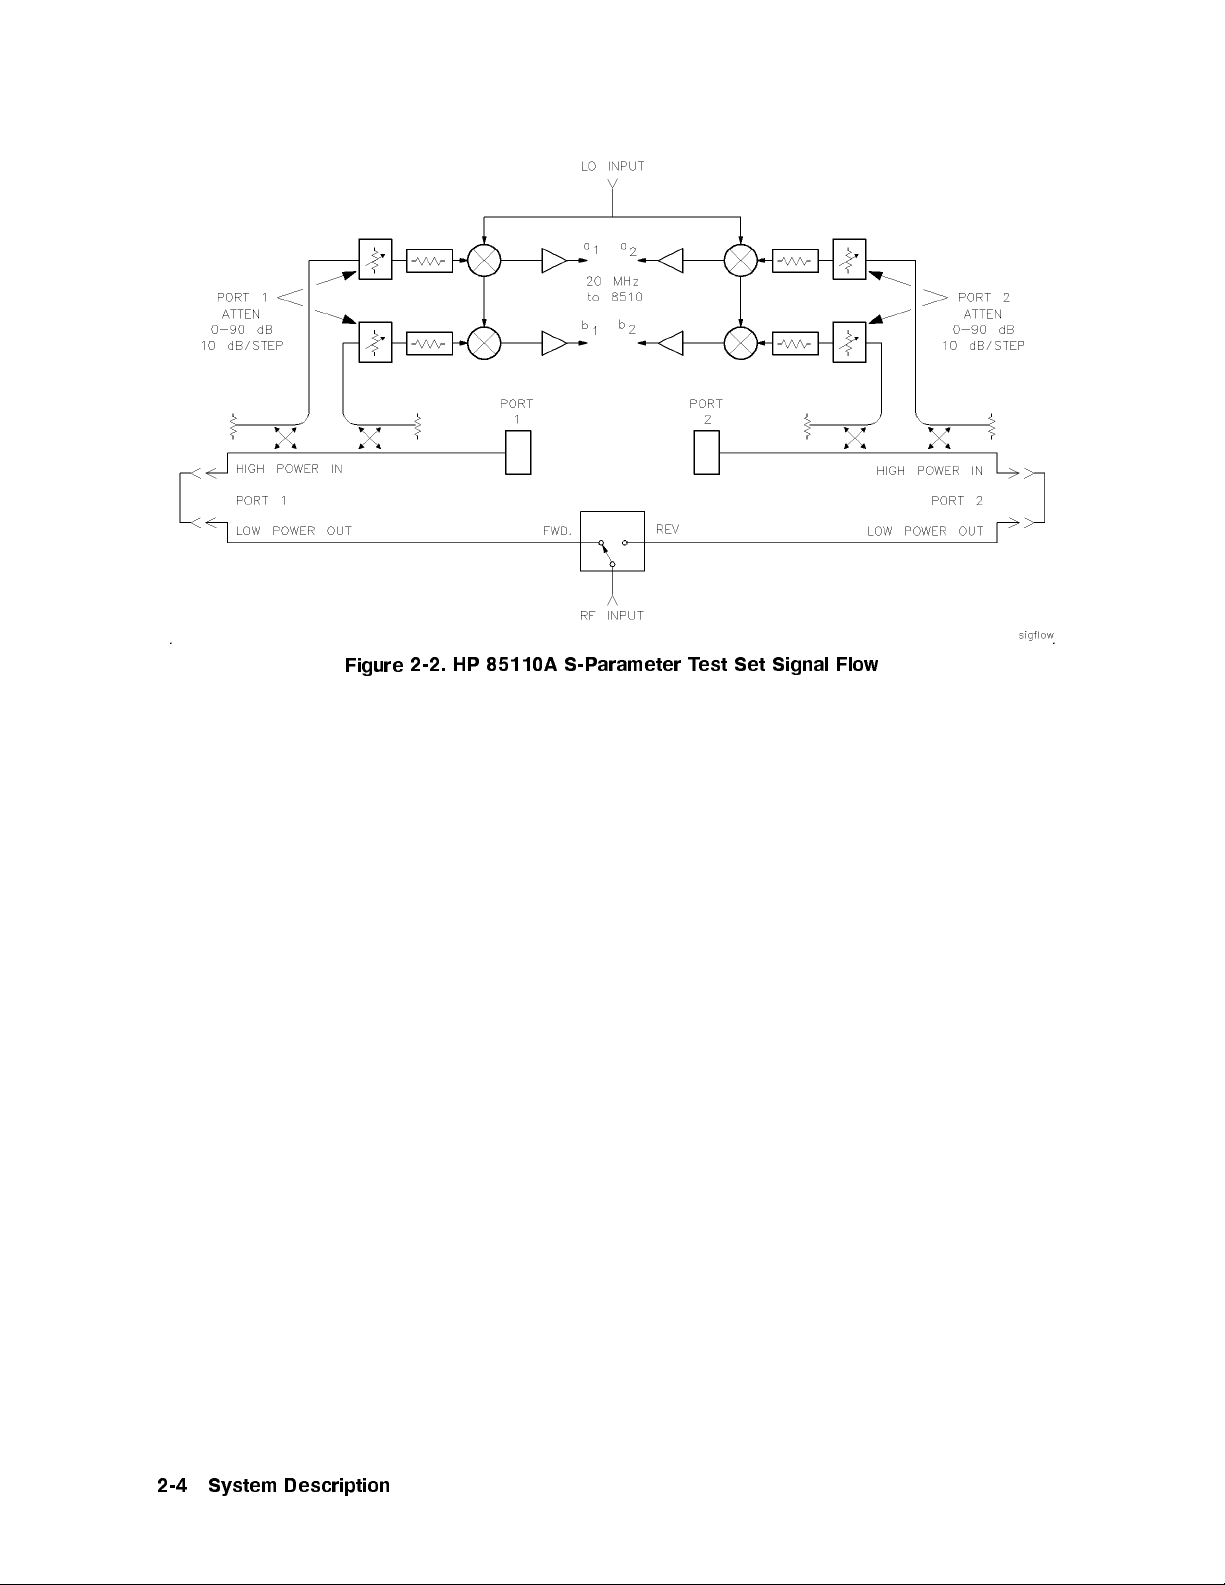
Figure
2-2.
HP
85110A
arameter
S-P
T
est
Signal Flo
Set
w
2-4
System
Description
3
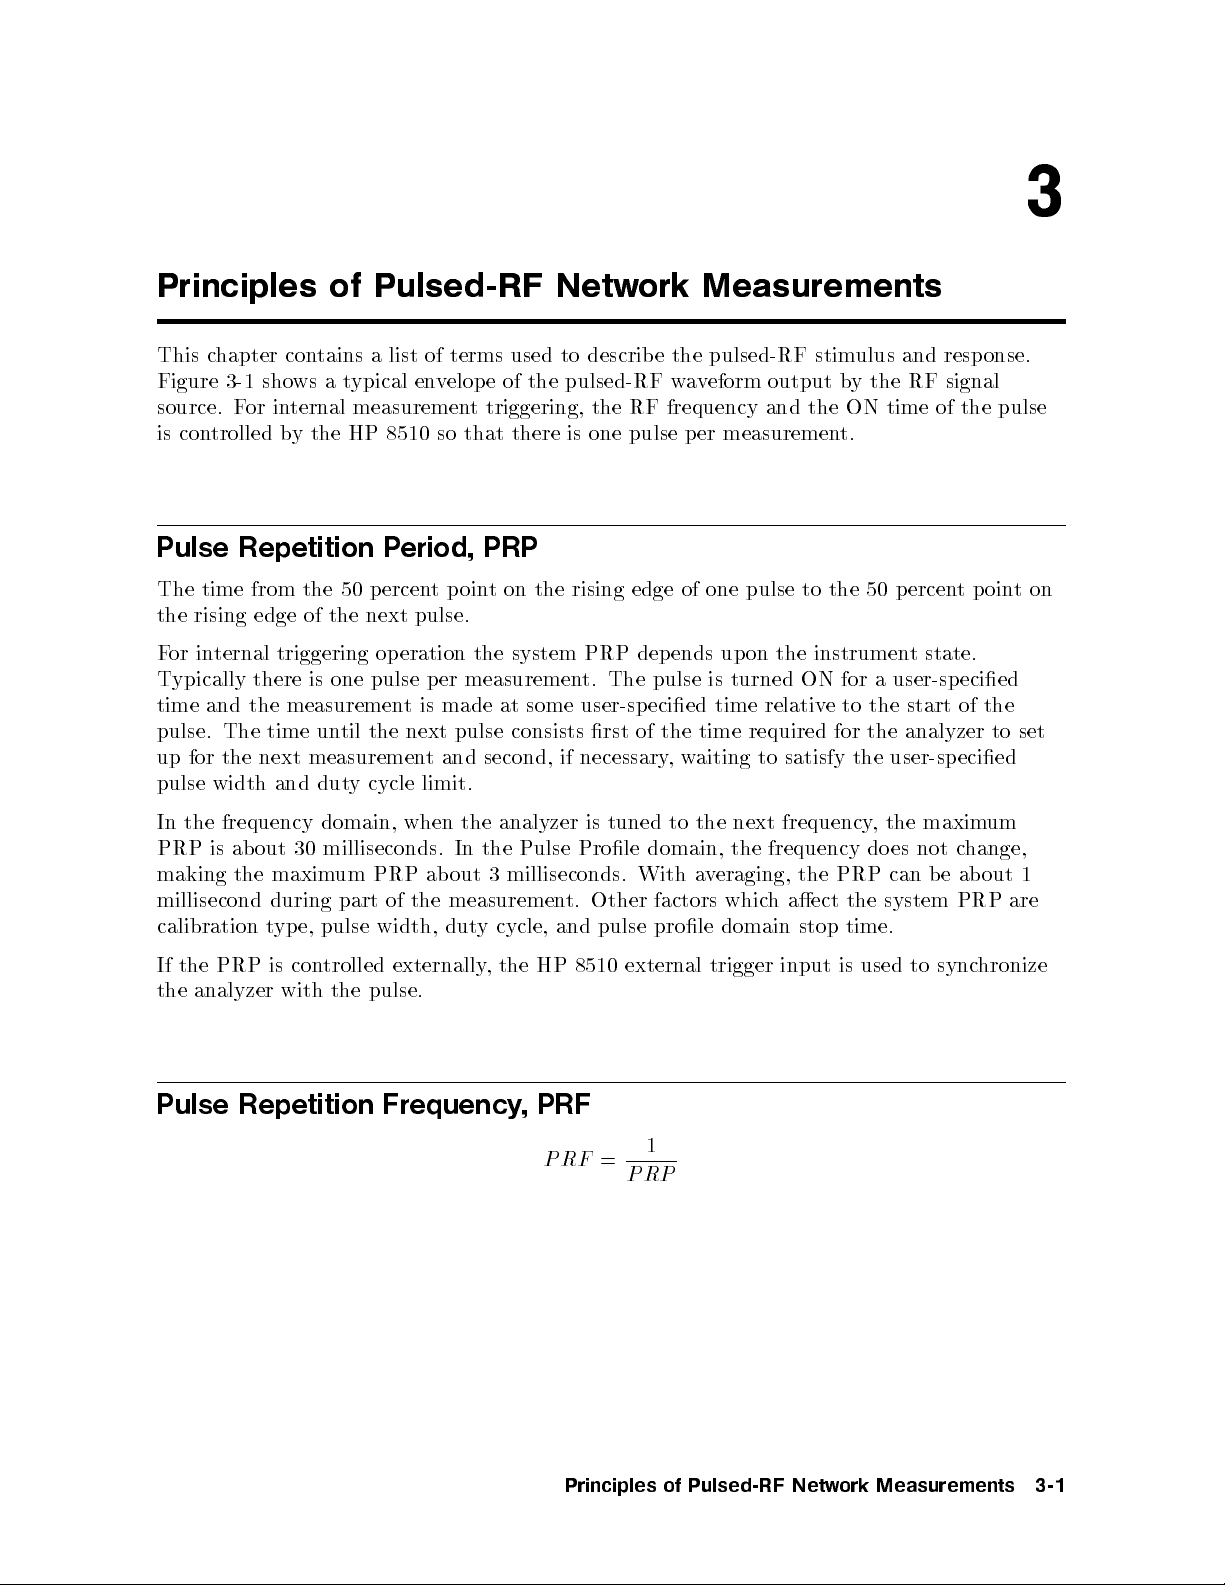
Principles of Pulsed-RF Network Measurements
This chapter contains a list of terms used to describ e the pulsed-RF stimulus and resp onse.
Figure 3-1 shows a typical envelope of the pulsed-RF waveform output by the RF signal
source. For internal measurement triggering, the RF frequency and the ON time of the pulse
is controlled by the HP 8510 so that there is one pulse per measurement.
Pulse Repetition Period, PRP
The time from the 50 percentpoint on the rising edge of one pulse to the 50 percentpointon
pulse.
next
the
of
edge
rising
the
eration
ternal
in
or
F
ypically
T
and
time
for
width
the
is
The
the
frequency
ab
pulse.
up
pulse
In
PRP
making the
millisecond
calibration
PRP
the
If
triggering
is
there
measuremen
the
time
measuremen
next
and
30
out
maxim
during
e,
yp
t
con
is
op
pulse
one
tis
next
the
til
un
cycle
y
dut
domain,
when
milliseconds. In
PRP
um
of
part
width,
pulse
trolled
externally
the analyzer with the pulse.
Pulse
Repetition
Frequency,
the
measuremen
er
p
made at
pulse
and
t
limit.
the
out
ab
measuremen
the
dut
system
some
consists
second,
analyzer
Pulse
the
milliseconds.
3
y cycle,
HP
the
,
PRF
PRF
PRP
The
t.
user-sp
rst
necessary
if
tuned
is
Prole
Other
t.
and pulse
external trigger
8510
=
PRP
up
ends
dep
time
aiting
w
the
a
time
eraging,
v
turned ON
next
the
whic
pulse is
ecied
the
of
,
to
domain,
With
factors
prole domain
1
the
on
relativ
required
satisfy
to
frequency,
frequency
the
aect
h
stop time.
input is
instrumen
user-sp
a
for
the
to
e
the
for
user-sp
the
the
es
do
can
PRP
system
the
used to
t state.
ecied
of
start
analyzer
ecied
maxim
hange,
c
not
ab
e
b
PRP
sync
the
set
to
um
1
out
are
hronize
Principles
Pulsed-RF
of
Netw
Measurements
ork
3-1
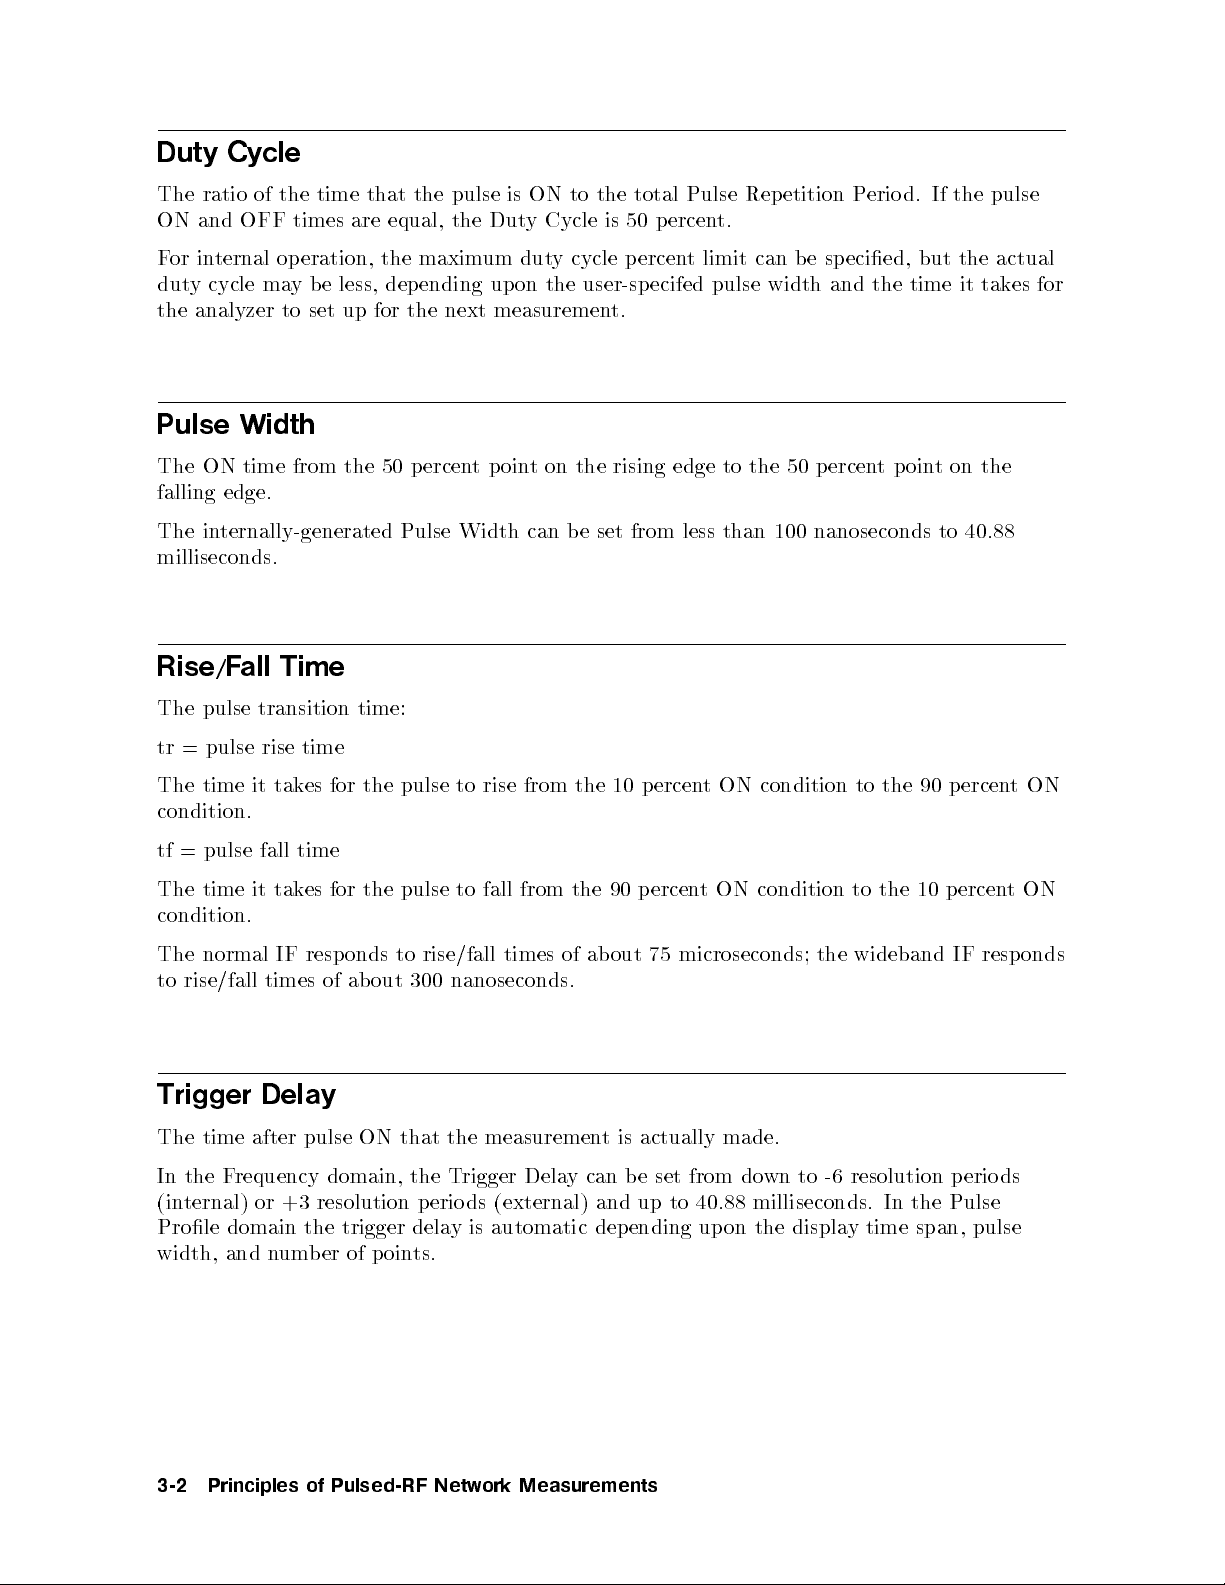
Duty Cycle
The ratio of the time that the pulse is ON to the total Pulse Repetition Period. If the pulse
ON and OFF times are equal, the Duty Cycle is 50 p ercent.
For internal op eration, the maximum duty cycle percent limit can b e specied, but the actual
duty cycle may b e less, depending upon the user-specifed pulse width and the time it takes for
the analyzer to set up for the next measurement.
Pulse Width
The ON time from the 50 percent p oint on the rising edge to the 50 percentpointonthe
falling edge.
The internally-generated Pulse Width can b e set from less than 100 nanoseconds to 40.88
milliseconds.
Time
Rise/F
all
time
es
for
time:
the
pulse
to
rise
from
the
10
The
tr
The
=
pulse
pulse
time
transition
rise
tak
it
condition.
time
fall
pulse
=
tf
90
the
from
fall
to
pulse
the
for
es
tak
it
time
The
condition.
The
normal
IF
resp
onds
rise/fall
to
times
out 75
ab
of
to rise/fall times of about 300 nanoseconds.
y
Trigger
time
The
In the F
Dela
the
that
ON
pulse
after
requency domain, the T
measuremen
rigger Dela
t
y can be set from do
(internal) or +3 resolution p eriods (external) and
Prole domain the trigger dela
width,
and number of p oin
y is automatic depending upon the displa
ts.
ON
t
ercen
p
ON
t
ercen
p
microseconds; the
actually made.
is
condition
condition to
to
the 10
wideband IF
90 p
the
wn to -6 resolution perio
up to 40.88 milliseconds. In the Pulse
y time span, pulse
ercen
ercen
p
ON
t
ON
t
responds
ds
3-2
Principles
Pulsed-RF
of
Netw
Measurements
ork
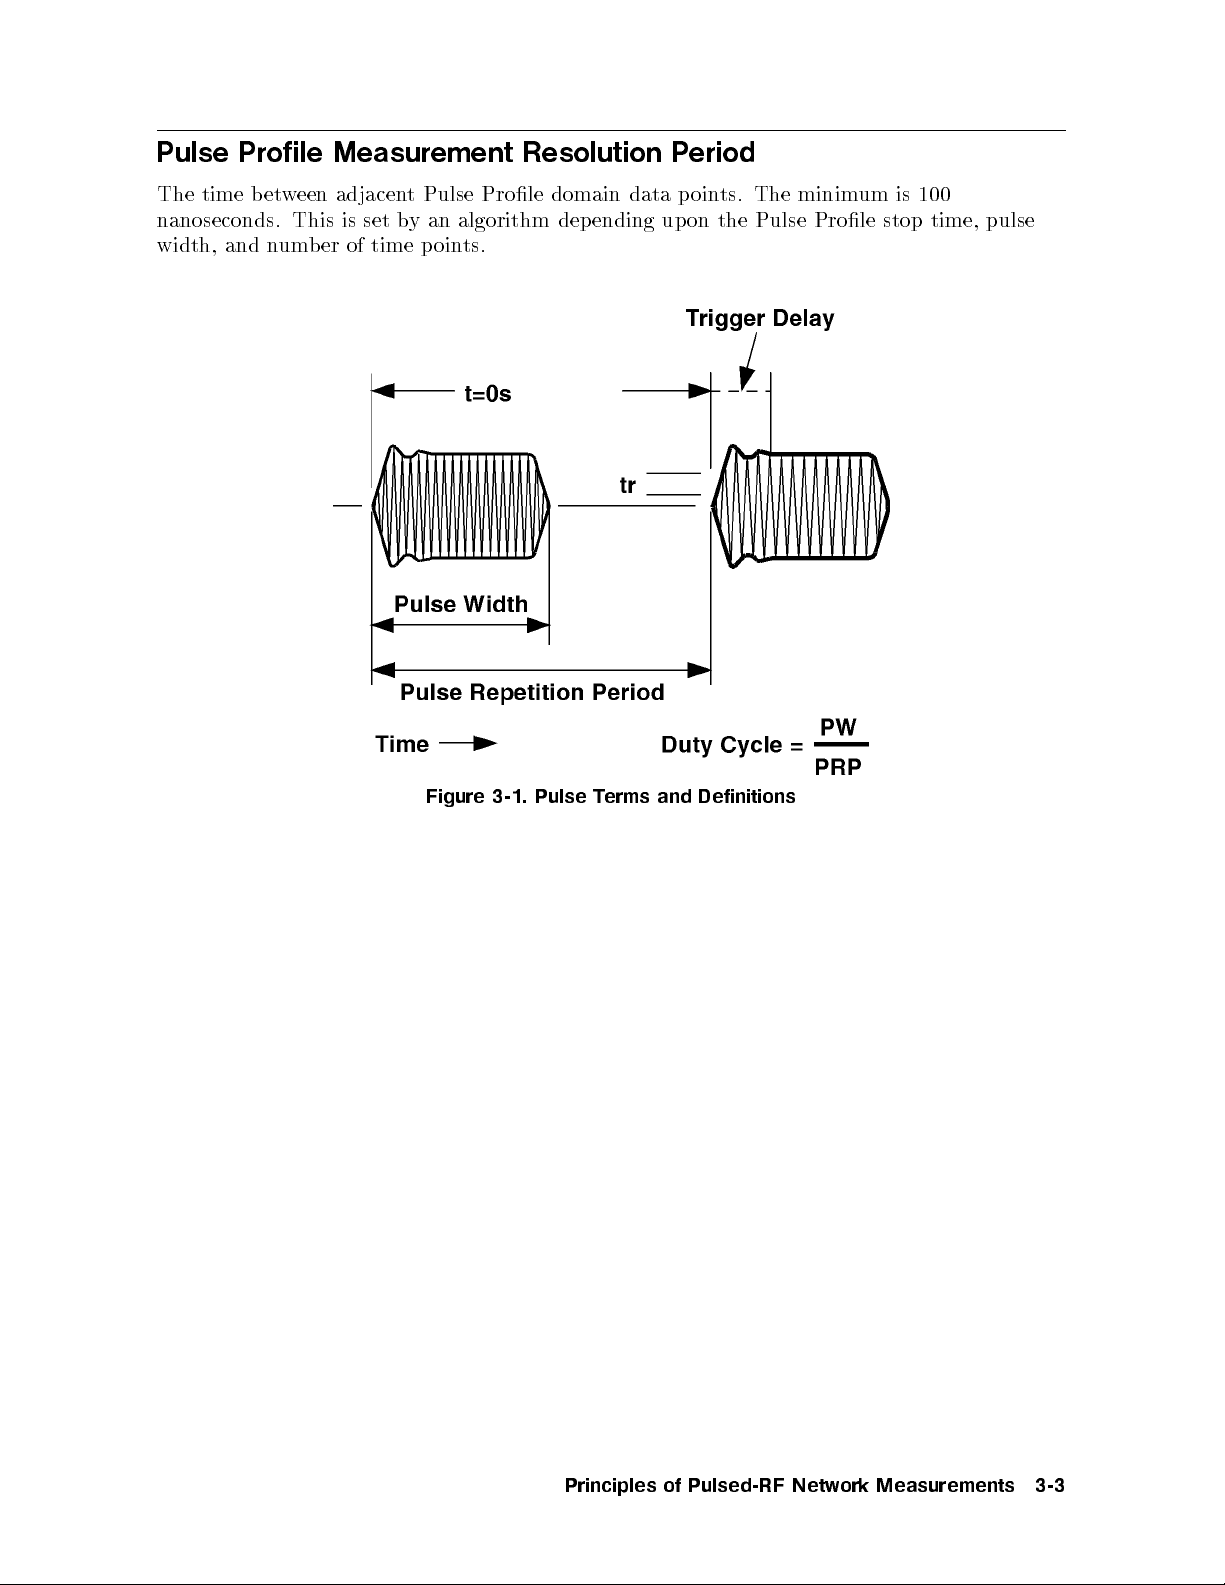
Pulse Profile Measurement Resolution Period
The time b etween adjacent Pulse Prole domain data p oints. The minimum is 100
nanoseconds. This is set by an algorithm depending upon the Pulse Prole stop time, pulse
width, and number of time points.
Figure
3-1.
Pulse
erms
T
Definitions
and
Principles
Pulsed-RF
of
Netw
Measurements
ork
3-3

4
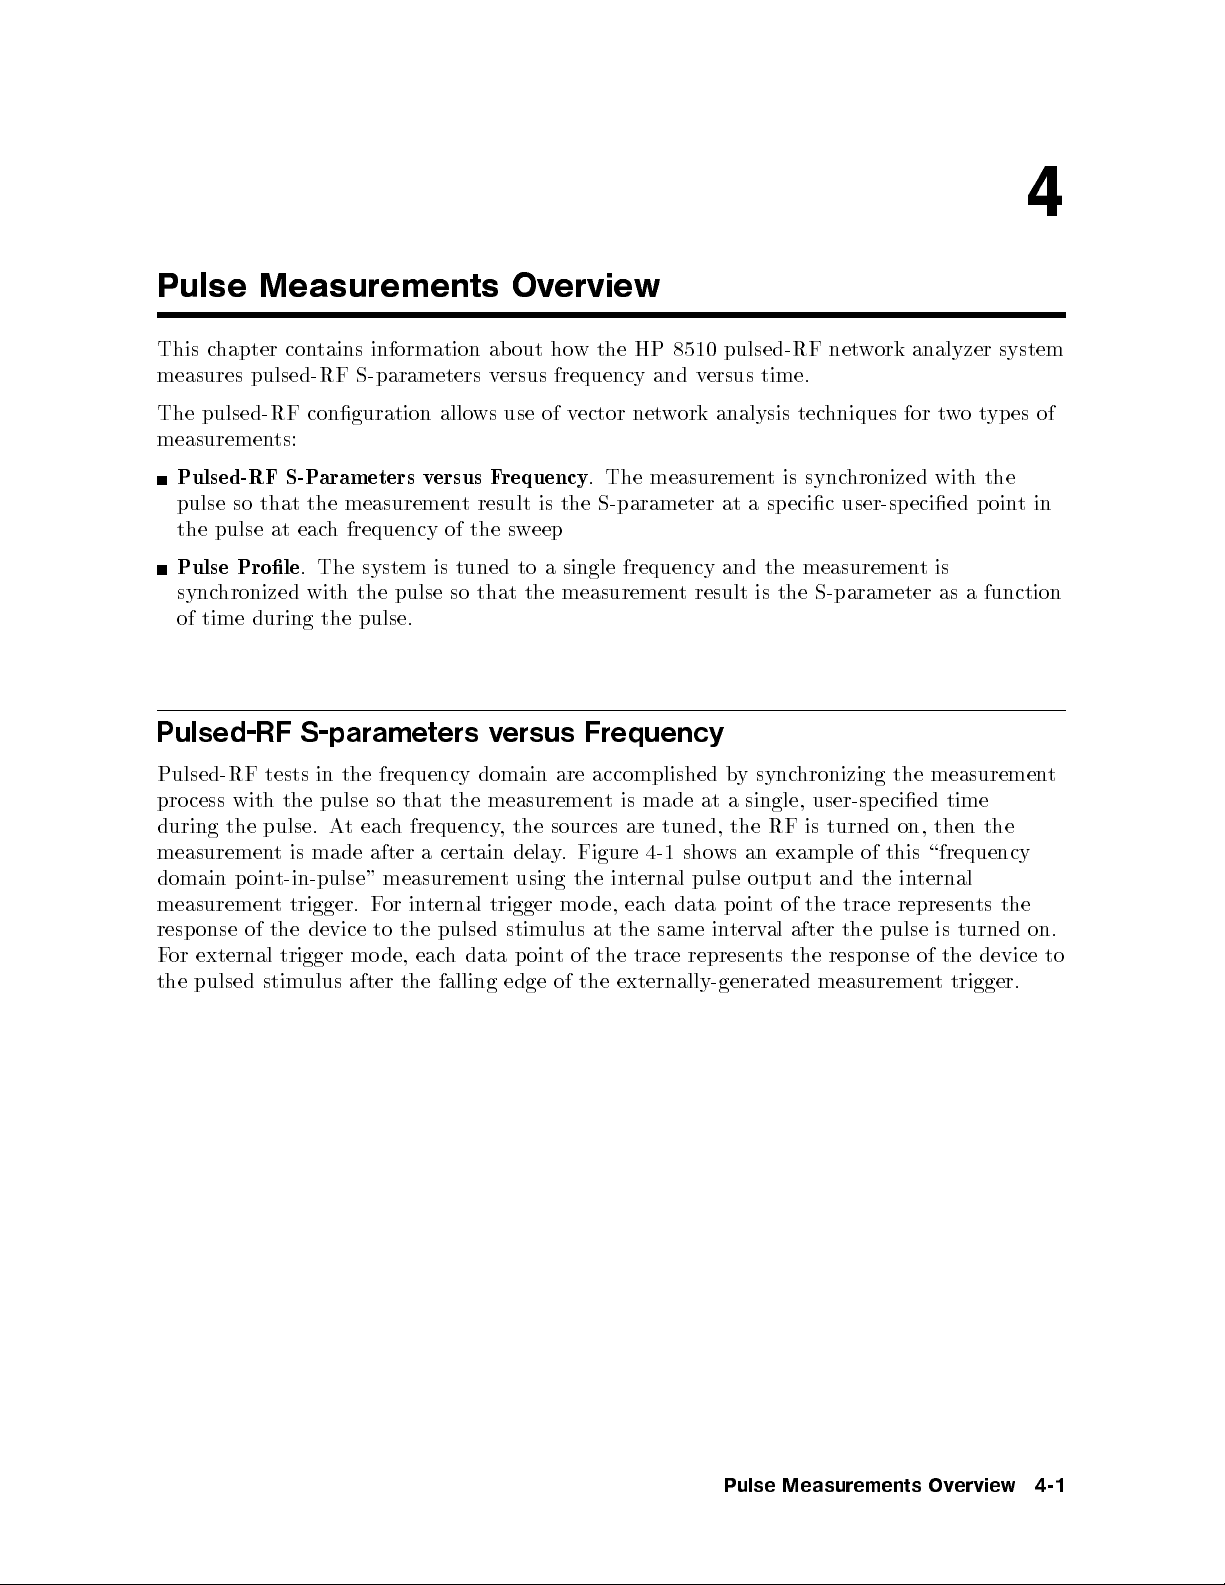
Pulse Measurements Overview
This chapter contains information about how the HP 8510 pulsed-RF network analyzer system
measures pulsed-RF S-parameters versus frequency and versus time.
The pulsed-RF conguration allows use of vector network analysis techniques for twotypes of
measurements:
Pulsed-RF S-Parameters versus Frequency
. The measurementissynchronized with the
pulse so that the measurement result is the S-parameter at a sp ecic user-specied pointin
the pulse at each frequency of the sweep
Pulse Prole
. The system is tuned to a single frequency and the measurementis
synchronized with the pulse so that the measurement result is the S-parameter as a function
of time
during the
Pulsed-RF
with
the
p
of
oin
tests
pulse.
t
t-in-pulse"
t
the
Pulsed-RF
cess
pro
during
measuremen
domain
measuremen
onse
resp
external
or
F
the
is
trigger. F
trigger
pulse.
S-parameters
frequency domain
the
in
the
that
so
pulse
frequency
h
eac
t
A
certain
a
after
made
measuremen
ternal
or in
pulsed
the
mo
to
de,
eac
h
device
ersus
v
measuremen
the
,
dela
using
t
trigger
stim
oin
p
data
Frequency
accomplished
are
is
t
Figure
in
the
de,
at
the trace
are
ternal pulse
eac
the
sources
.
y
mo
ulus
tof
made
tuned,
4-1
data
h
same
sync
y
b
single,
a
at
the
an
ws
sho
output and
oin
p
terv
in
represents
hronizing
user-sp
is turned
RF
example
the
of
t
after
al
the resp
of this
the
trace
the
onse
measuremen
the
ecied
then
on,
\frequency
ternal
in
represen
pulse is
of
time
the
the
ts
turned on.
device
the
the pulsed stimulus after the falling edge of the externally-generated measurementtrigger.
t
to
Measurements
Pulse
Ov
erview
4-1

Figure 4-1. Pulsed-RF S-Parameters versus Frequency (Frequency Domain Point-in-Pulse)
erview
4-2
Pulse
Measurements
Ov

Pulse Profile Domain
Measurements in the Pulse Prole domain create a plot of the resp onse as a function of
time in synchronization with the internal or the external measurement trigger. A repetitive
sampling technique is used, in which the data is reconstructed from samples taken from a
series of pulses. This allows display of the S-parameters versus time during the pulse. Figure
6 is an example of this pro cess showing a timing diagram using the internal pulse mo dulation
and internal measurement trigger. For each pulse, a single point in the pulse is measured. A
prole of the pulse is made by measuring the rst pulse at the user-specied Start time, then
increasing the measurement trigger delayby a certain time increment for each pulse until the
specied number of points is measured.
Time zero is the leading edge of the internally-generated pulse output waveform, or the falling
edge of the externally-generated measurement trigger waveform. The HP 8510 automatically
controls the time incrementbetween samples, called the measurement resolution perio d,
using an algorithm that depends upon the greater of the user-specied pulse width or stop
time. This automatic selection of the time resolution can be seen bychanging the number
of points and the time span. For narrow pulses and small time spans, the measurement
spans,
time
large
d
erio
resolution
can
it
rst
the
p
increase to
sample
can b
external triggering,
ds
erio
resolution
p
e
b
can
multiples
etak
external
the
time
after
as
en up
100
as
small
microseconds. With
of 10
resolution
to 6
trigger
sets
zero.
nanoseconds;
erio
p
zero
time
the
ds
for
prior
and
wide
ternal
in
the
pulses
to
rst
and
measuremen
zero.
time
sample
t
When
can
trigger,
using
tak
e
b
en
three
Measurements
Pulse
Ov
erview
4-3

Pulsed-RF
S-Parameters
Internal
Pulse
ersus
v
Output
Figure
Time
and
4-2.
(Pulse
Internal
Profile
Measurement
Domain)
Measurement
Trigger
4-4
Measurements
Pulse
Ov
erview

5
Operating the HP 8510 for Pulsed-RF Measurements
This chapter describes the setup, measurement calibration, and measurement pro cess for
conguring the system and making frequency domain point-in-pulse measurements and
pulse prole domain measurements. These pro cedures use the internal pulse mo dulation and
internal measurement trigger capabilities of the HP 8510 Option 008. Familiarize yourself
with these capabilities before setting up measurements that use external triggering techniques.
For more detailed information on the standard features of the HP 8510, refer to the HP 8510
Operating and Programming manual.
System
Figure
Notice
the
5-1
that
reference
supplies,
dulators,
mo
equipmen
other
Connections
ws the
sho
the
can
ampliers
and a
cable connections
source
RF
the
e
b
connected
computer.
ma
that
t
LO
y
serv
b
as
es
source
the
to
erify
V
connected
e
the
or
test
these
for
the
10
to
recommended
the
MHz
8510.
HP
rear
set
basic
system.
the
frequency
y
Man
links, external
panel
connections
85108
HP
reference
for
applications
familiarize
and
pulse
the
will
pulse
conguration.
system,
although
also include
generators
ourself
y
with
bias
and
Operating
the
HP
8510
Pulsed-RF
for
Measurements
5-1

Figure
5-1.
System
Cable
Connections
5-2
Operating
the
HP
8510
Pulsed-RF
for
Measurements

Turn On System Power
Turn on rackpower, line power to the sources, test set, and other equipment, and then the HP
8510. Depending up on the contents of HP 8510 Instrument State 8 and the current HP 8510
Hardware State, the system may not be fully operational immediately after initial power up.
Messages to the operator may appear on the screen and beep sounds may be heard. If so, load
the pulse instrument state and hardware state as described below. The rmware revision will
be displayed on the screen. It should be B.05.11 or later for HP 8510B, and C.06.54 or later
for HP 8510C.
Load Pulse Hardware State and Instrument State Files
The pulsed-RF conguration les are supplied with the option 008 equipment. Use the
following procedure to load the hardware state le 8 and the instrument state all le 8 into
HP 8510 memory.
1. Load the conguration tape/disk.
Press
4
TAPE/DISC
NNNNNNNNNNNNNNNNNNNNNNNNNNNNNNNNNNNNNNNNNNNNNNNNNNNNNNNNNNNNNN
5
STORAGE IS TAPE/DISC
.
Load pulse
2.
Press
M
The
the
that
Load
3.
Press
4.
After
Recalling
the
If
shows
This
HP 8510 rear panel PULSE OUTPUT connector is activated. Select the wideband IF by
pressing the following keys.
5.
Press
Note
hardware
N
N
N
N
N
N
N
N
N
N
N
N
N
N
LOAD
enhancemen
HP
pulsed-RF
N
N
N
N
N
N
N
N
LOAD
loading the
wideband IF
4
SYSTEM
N
N
N
N
N
N
N
N
MORE
8510
N
N
N
N
N
N
N
N
N
N
N
N
N
N
INST.
instrumen
that
5
,
Preset
state.
N
N
N
N
N
N
N
N
NNNNNNNNNNNNNN
N
N
N
N
N
N
N
N
N
N
HARDWARE
annotation
t
op
is
instrumen
N
N
N
NN
N
N
N
N
N
N
N
N
N
N
N
STATE
les,
t state
is selected,
wideband
the
NNNNNNNNNNNNNNNNNNNNNNNNNNNNNNNNNNNNNN
MORE
PULSE CONFIG
alw
NN
NN
NN
N
N
N
N
N
N
N
erating
t
N
N
N
N
N
N
N
N
N
N
N
N
N
8
press
8sets
selects
ys
a
N
N
N
N
N
N
N
N
N
N
N
N
NN
STATE
should
the
in
state in
N
N
N
N
N
N
N
N
N
N
N
N
FILE
N
N
N
N
N
N
N
N
N
N
N
N
RECALL
a
W
IF
NN
N
N
N
N
N
N
N
N
N
FILE
m
to
N
N
N
N
N
N
N
N
N
N
.
8
N
N
N
N
N
N
NN
N
N
N
INST.
correct
the
annotation will
detectors
and
NNNNNNNNNNNNNNNNNNNNNNNNNNNNNNNNNNNNNNNNNNNNNNNNNNNNN
N
NN
N
N
N
N
N
N
N
N
DETECTOR:
N
NN
N
N
N
N
N
N
N
N
N
N
N
N
N
inst.
N
DETECTOR: WIDE BW
N
8
ear
app
ultiple
N
N
NN
N
N
N
N
N
N
N
N
N
NN
N
N
N
N
N
N
N
N
N
.
at
source
state
N
N
N
N
N
N
N
N
N
N
N
N
STATE 8
instrumen
are
N
NN
N
N
N
N
N
N
N
N
N
NORMAL
the
8.
N
N
N
N
N
N
N
N
N
N
N
N
N
N
N
N
left
mode.
N
N
NN
N
.
state
t
ear
app
selected
N
N
N
N
N
N
N
N
N
N
N
NN
N
N
BW
side
at
.
.
for
the
and
of
the
pulse
left
that
screen.
eration.
op
side
TTL
the
of
This
the
signal
screen.
sho
ws
at
the
If these les are not a
as describ ed in the Creating Pulse Hardw
vailable, create
the correct hardw
Operating
are state le and instrumen
are and Instrumen
8510
HP
the
t States c
Pulsed-RF
for
hapter.
Measurements
t state le
5-3

Typical Response
After
Recall,
Inst.
Figure
State
5-2.
Frequency
8,
Detector:
,
WB,
Mult.
Srce.
On
5-4
Operating
the
HP
Figure 5-3. Domain, Pulse Profile,
8510
Pulsed-RF
for
Measurements
Marker

Operator's Check
After loading the pulse instrument state and hardware state les, then recalling instrument
state 8, check operation of the pulsed-RF network analyzer (using internal triggering) by
performing the following basic tests. Refer to the menu diagrams on the last pages of this
document.
Pulse Profile Domain Check
1. Connect a short circuit to p ort 1 of the test set.
2.
Press
4
PARAMETER
NNNNNNNNNNNNNN
5
MENU
NNNNNNNNNNNNNNNNNNNNNNN
USER a1
.You are viewing the unratio ed value of the a1
reference signal.
3.
Press
4
DOMAIN
NNNNNNNNNNNNNNNNNNNNNNNNNNNNNNNNNNNNNNNNN
5
PULSE PROFILE
. The signal level is high when the pulse is On and low
when the pulse is O.
4. Press
5.
Press
Change
6.
oin
p
7.
Press
cycle
of
eac
Press
8.
the
9.
Press
pulse c
10.
Press
t,
long
data
h
stop
4
MARKER
4
SYSTEM
the
measuremen
the
N
N
N
N
N
N
N
N
N
N
N
N
N
N
DUTY
ercen
p
pulse
p
4
5
STOP
time to
4
SYSTEM
hanges.
N
N
N
NN
NN
NN
NN
N
N
N
PULSE
5
then move the marker to various points on the trace.
NNNNNNNNNNNNNN
5
pulse
N
N
N
N
N
N
NN
NN
CYCLE
t allo
width
t.
oin
then
,
N
5
N
N
N
N
N
N
N
N
N
N
OUT:
NNNNNNNNNNNNNNNNNNNNNNNNNNNNNNNNNNNNNN
MORE
PULSE CONFIG
width
t time
N
N
N
N
N
N
N
N
then c
,
y
b
wed
and
hange
c
e
hiev
ac
N
NN
NN
N
N
N
N
N
N
N
N
MORE
N
N
N
N
N
N
N
PULSE
N
N
N
N
N
N
N
NN
NN
NN
NN
N
HIGH
N
N
N
N
alue.
v
the
lo
the
NN
N
N
N
N
N
.
for eac
hange
in
ercen
p
w
the
desired
N
N
N
N
N
N
N
N
NN
CONFIG
Notice
the
ternal
Stop
N
N
N
N
N
N
N
N
N
NNNNNNNNNNNNNNNNNNNNNNNNNNNNNNNNNNN
PULSE WIDTH
that
h data
dut
the
measuremen
cycle
y
dut
t
Adjust
time.
displa
NN
NN
N
N
N
N
NN
NN
N
N
N
N
N
N
N
N
N
PULSE
as
poin
.
y
N
N
N
cycle
y
N
N
N
N
N
N
OUT:
.
increase the
ou
y
will
t
limit.
timing
t
increase
will
the pulse
NN
NN
N
N
N
N
N
N
N
N
N
N
N
N
LOW
increase.
This
logic.
N
N
N
N
N
N
Notice
.
pulse width
sets
measuremen
the
width,
that
the
Notice
um
n
the
maxim
that
er
b
p
past a
com
t
p
of
olarit
certain
dut
um
binations
time
ts,
oin
of
y
y
for
and
the
Operating
the
HP
8510
Pulsed-RF
for
Measurements
5-5

1.
Press
and noisy
On
a1,
that the
trace
is
pulse
the
when
at
is
t.
User1
Notice
Profile,
Pulse
ed
pulse
5-4.
measuremen
O.
is
Figure
S
11
to
view
when
the
ratio
the
er
Mark
5-6
Operating
the
HP
8510
Figure
Pulsed-RF
for
Pulse
5-5.
Measurements
Profile,
S
11

This occurs because when the pulse is O, the network analyzer is measuring the ratio of
noise to noise, and since the noise is approximately equal in the reference and test signal
paths, the result is near 0 dB with respect to the On perio d of the pulse. Also, in this
measurement, some large spikes may be seen in the noisy part of the trace. If the noise in the
reference channel instantaneously go es to a very small value, the ratio will increase to a very
large value.
Note
In the Pulse Prole domain:
Without averaging, pulse width and duty cycle settings resulting in less than
about 3 milliseconds PRP will not change the actual system PRP.
With averaging, pulse width and duty cycle settings resulting in less than
about 1 millisecond PRP will not change the actual system PRP.
Also, the PRP and duty cycle can vary during the sweep. To learn more about
control of these values, refer to the General Timing Information chapter.
Frequency Domain Check
N
N
N
N
N
N
N
N
N
N
N
N
N
NN
NN
NN
NN
N
N
N
N
N
1.
Press
2.
the
If
N
N
N
N
N
N
N
N
DETECTOR:
3.
Press
4.
Press
N
N
N
N
N
N
4
DOMAIN
W
NN
N
N
N
N
N
N
N
N
4
MARKER
N
N
N
N
N
N
N
N
PULSE
N
5
FREQUENCY
annotation do
N
N
N
N
N
N
N
N
N
N
N
NN
WIDE
5
N
N
N
N
NN
N
N
N
N
N
N
N
N
WIDTH
N
N
N
N
,
N
N
N
N
NN
N
N
N
N
N
N
BW
then
N
N
N
N
N
N
N
N
N
NN
N
and
N
.
mo
es not
e
v
set the
N
N
.
the
app
mark
ear,
pulse
press
er to
width
4
SYSTEM
arious
v
to
N
N
N
N
N
N
N
N
N
5
MORE
on
ts
oin
p
microseconds.
10
N
N
N
N
N
N
N
N
N
PULSE
the
N
N
N
N
N
NN
N
N
N
N
N
N
N
trace.
N
N
N
N
N
N
N
N
N
N
N
N
NN
CONFIG
N
N
N
N
N
N
Figure
5-6.
S
11
Frequency
,
Domain,
Operating
Pulse
the
Width
HP
8510
10
for
s,Trigger
Pulsed-RF
s
5
y
Dela
Measurements
5-7

1.
Press
4
STIMULUS MENU
NNNNNNNNNNNNNN
5
NNNNNNNNNNNNNNNNNNNNNNNNNNNNNNNNNNNNNN
MORE
TRIGGER MODE
NNNNNNNNNNNNNNNNNNNNNNNNNNNNNNNNNNNNNNNNN
TRIGGER DELAY
.
Change the trigger delay and notice that when the trigger delay is greater than the pulse
width, the trace level decreases to the noise oor because the measurement is b eing made
after the pulse has turned O.
s
15
y
1.
2.
Press
that as
p
data
Press
Figure 5-7.
N
4
SYSTEM
you
oin
NN
NN
NN
N
N
N
5
MORE
increase the
increase.
will
t
N
N
N
N
N
N
N
N
N
N
N
N
N
N
N
N
N
N
DUTY CYCLE
s,Trigger
N
N
N
N
. Change
t,
oin
p
10
the
the
measuremen
S
, Frequency
11
N
N
N
N
N
N
N
N
N
N
N
N
N
N
N
N
PULSE CONFIG
N
NN
NN
N
N
N
N
N
N
N
N
N
N
NN
NN
N
N
N
N
N
N
N
N
N
pulse width
Domain,
N
N
N
N
N
N
N
N
N
N
N
N
past
N
Pulse
N
N
N
N
N
N
N
N
N
N
N
N
NN
NN
N
N
N
N
N
N
N
N
N
N
N
N
PULSE WIDTH
certain
a
Width
N
N
. Change the the duty cycle limit. This changes the maximum duty
pulse
Dela
width
t
v
time
alue.
for
cycle percent allowed by the internal measurement timing logic. Notice that combinations
of long pulse width and low percentduty cycle will increase the measurement time for each
data point.
Cycle
y
Note
requency
F
the
In
Without a
Domain
requency
F
veraging, pulse
System
domain:
about 30 milliseconds PRP will not c
With a
veraging, pulse width
Dut
width and dut
y cycle settings resulting in less than
hange the actual system PRP
and duty cycle settings resulting in less than
.
about 1 millisecond PRP will not change the actual system PRP.
To learn more ab out control of these values, refer to the General Timing
hapter.
Information
c
Notice
h
eac
5-8
Operating
the
HP
8510
Pulsed-RF
for
Measurements

External Triggering Check
Connect the output of the external pulse generator to the HP 8510 rear panel TRIGGER IN
connector and to the RF source PULSE MODULATION INPUT (Figure 9-1). Set the pulse
generator to deliver a continuous TTL pulse train, going low for at least 100 nanoseconds at
any pulse repetition perio d less than about 1 millisecond. Activate the pulse generator pulse
output.
Press
4
STIMULUS MENU
NNNNNNNNNNNNNN
5
NNNNNNNNNNNNNNNNNNNNNNNNNNNNNNNNNNNNNN
MORE
TRIGGER MODE
NNNNNNNNNNNNNNNNNNNNNNNNNNNNNNNNNNNNNNNNNNNNNNNNNNNNNNNNNNN
TRIGGERING EXTERNAL
.
The network analyzer should sweep normally in either the frequency domain or the pulse
prole domain. The analyzer is not aected by excess trigger inputs.
NNNNNNNNNNNNNNNNNNNNNNNNNNNNNNNNNNNNNNNNN
Press
4
DOMAIN
5
PULSE PROFILE
. The trace represents the signal at the RF source Pulse
Modulation Input. The signal level is high when the pulse is On and low when the pulse is
O.
Press
4
MARKER
5
then move the marker to various points on the trace.
Adjust the time span and number of points for the desired display. Notice that the
measurement resolution perio d is set by the pulse width, stop time, and number of points.
N
N
N
N
N
N
N
N
N
N
N
N
N
N
N
NN
NN
NN
NN
N
Press
NN
NN
NN
N
N
N
N
PULSE
Press
4
DOMAIN
N
N
N
N
N
N
NN
4
MARKER
NN
N
N
N
N
N
N
N
N
N
N
N
CONFIG
N
N
N
N
N
5
FREQUENCY
N
NN
NN
NN
NN
N
N
N
N
DETECTOR:
5
then
4
press
ear,
app
not
es
p
do
oin
ts
on
the
trace.
SYSTEM
5
.
NN
NN
NN
NN
N
N
N
N
N
N
N
N
N
N
N
N
N
N
N
N
N
NN
NN
NN
WIDE
the
e
v
mo
N
N
N
N
N
N
N
N
N
mark
N
N
BW
N
N
N
N
N
.
arious
v
to
er
annotation
W
the
If
NN
N
N
N
N
N
N
MORE
NN
NN
NN
the
In
desired
ma
ou
Y
high
es
go
rigger
T
of
Pulse Output
8510
frequency domain,
falling
the
after
time
y
also
to
In
monitor
indicate
and
the
that
Pulse
is not
adjust
rear
the
dulation
Mo
activ
edge
panel
HP
e
trigger
the
trigger
of
8510
Input and
when
STOP
ready
is
external
so
y
dela
in.
SWEEP
to
notice the
triggering
that
output
mak
measuremen
the
with
measurement.
the
e
timing
selected.
is
of
an
the
tak
t
oscillosop
Change
Sw
Stop
es
e.
eep.
place
Stop
the
The
at
Sw
p
the
eep
erio
HP
d
Operating
the
HP
8510
Pulsed-RF
for
Measurements
5-9


6
Frequency Domain Point-in-Pulse Measurements
This chapter contains measurement calibration and measurement procedures to displaythe
pulsed-RF S-parameters versus frequency.
Measurement Calibration for Point-in-Pulse
Measurement calibration for point-in-pulse is accomplished in exactly the same way as for the
standard HP 8510.
NNNNNNNNNNNNNNNNNNNNNNNNNNNNN
not
1. Press
displa
N
N
N
N
N
N
N
N
N
N
DETECTOR:
4
DOMAIN
ed, select
y
NN
NN
NN
NN
N
N
N
frequency
5
FREQUENCY
the wideband
N
N
N
N
N
N
N
NN
NN
NN
NN
N
N
N
N
N
N
N
N
N
N
N
N
N
N
N
N
N
WIDE
BW
.
to
select
the
detector b
y pressing
domain.
4
SYSTEM
If
5
N
N
N
N
N
N
N
MORE
N
N
N
N
N
N
N
N
N
N
N
N
N
N
N
N
N
PULSE
NN
NN
N
N
N
N
N
annotation
W
the
N
N
N
N
N
N
N
N
N
N
NN
NN
CONFIG
is
N
N
N
N
N
2.
Select
the
appropriate
in
for
Note
pulse
8510
HP
standard.
the
indep
pulse
external
for
Note
measuremen
during
the
maxim
ternal
enden
t.
pulse for
um
measuremen
triggering,
assures
of
t
signal
the
output
This
triggering,
ust
m
ou
Y
calibration, then
calibration.
t
when
is set
that
trigger
ou
y
the
set
the
dela
trigger
of
er
b
um
n
Measurement
olarity
Pulse
Set
After instrumen
appearing
P
t preset, the pulse polarity is set to High for the
at the HP 8510 rear panel PULSE OUTPUT connector. Use the follo
procedure to set the pulse polarit y
NNNNNNNNNNNNNN
Press:
4
SYSTEM
5
MORE
NNNNNNNNNNNNNNNNNNNNN
PULSE CONFIG
oin
p
press
ou
y
the
to
calibration
.
y
trol
con
not c
.
NNNNNNNNNNNNNNNNN
k
state
e
is
pulse
to mak
for
to measure
ey
made
width
ethe
during
NNNNNNNNNNNNNNNNNNNNNNNNN
required
ts
the
activ
the
delay
hange it
NNNNNNNNNNNNNNNNNNNNN
PULSE OUT: HIGH
the measuremen
calibration
the
On)
ys
a
alw
(RF
ect
resp
with
cycle
y
dut
and
measurement
measuremen
the
On period of the pulse
N
NNNNNNNNNNNNNNNNNNNNN
or
PULSE OUT: LOW
t, then
during
the
to
during
at
NNNNNNNNNNNNNNNNNNNNNNN
erform
p
standard,
measuremen
ortion
p
On
calibration
correct
the
t.
wing
.
the
of
time
the
t
the
and
of
Frequency
Domain
oint-in-Pulse
P
Measurements
6-1

Set Pulse Width
After instrument preset, the pulse width is set to 10 microseconds. Use the following
procedure to set a dierent pulse width.
NNNNNNNNNNNNNNNNNNNNNNNNNNNNNNNNNNN
Press
PULSE WIDTH
. Use the knob, step keys, or numeric entry to set the desired pulse
width.
Set Duty Cycle Limit
After instrument preset, the duty cycle limit is set to 10%. This means that the maximum
duty cycle will never be allowed to be greater than 10 percent regardless of the pulse width.
NNNNNNNNNNNNNNNNNNNNNNNNNNNNNNNN
To set the duty cycle limit, press
DUTY CYCLE
on the Pulse Conguration menu. Use the
knob, step keys, or numeric entry to set the desired maximum duty cycle limit. Note that
the actual duty cycle may be less.
Set Trigger Delay
frequency
the
zero.
N
N
N
,
on
then
that
Time
the
use
equals
pulse
the
mo
knob,
seconds
zero
dulator.
step
k
After
domain
is when
the
Use
Press
n
or
Preset,
the
measuremen
the HP
wing
follo
4
STIMULUS
umeric
en
trigger
8510
pro
MENU
try
will tak
t
pulse
cedure
set
to
5
dela
output
NN
N
N
N
N
N
N
MORE
the
is
y
e place
set
to
N
N
N
N
NN
N
N
TRIGGER
desired
5
to
set
5 microseconds
to
es
go
trigger
the
N
N
N
N
N
N
N
N
N
N
N
N
N
NN
NN
N
N
N
N
trigger
microseconds.
e
activ
the
.
y
dela
N
N
N
NN
NN
N
N
N
N
N
N
N
N
MODE
dela
N
N
NN
NN
N
N
N
N
N
N
TRIGGER
.
y
This
after time
turning
el
lev
N
N
N
N
N
N
N
N
N
N
N
N
N
N
N
N
N
N
N
DELAY
means
N
N
N
NN
NN
eys,
is
that
noisy
Notice
trace
Connect
Figure
6-1
frequency
trigger
the
if
to
due
Device Under
the
the resp
ws
sho
sweep.
lo
w
signal
y
dela
onse of
set
is
lev
Test
the
els.
outside
to
device
to
the
pulsed-RF
the
time
in
terv
al
stim
that
ulus
the
o
er
v
pulse
the
On,
is
curren
the
t
6-2
Frequency
Domain
oint-in-Pulse
P
Measurements

dynamic
The
wide
the
should
increase
b
IF
e
in
used.
visible
Figure
range can
bandwidth,
general,
In
dynamic
6-1.
increased
e
b
v
a
an
using
range.
Amplifier
eraging
an
Gain, Frequency
eraging,
v
a
IF
using
out
ab
eraging
v
of
factor
factor
a
Domain P
but,
a
256
greater
giv
erages
v
than 256
oint-in-Pulse
system
the
en
maxim
the
is
will
not
noise
um
result
o
value
in
or
an
with
that
y
Frequency
Domain
oint-in-Pulse
P
Measurements
6-3


Pulse Profile Domain Measurements
This chapter contains measurement calibration and measurement procedures to displaythe
pulsed-RF S-parameters versus time.
Measurement Calibration for Pulse Profile
After selection of the pulse prole frequency, measurement calibration for pulse prole
measurements is accomplished in exactly the same way as for the standard HP 8510.
Following are two measurement calibration methods, one for calibration in the Pulse Prole
one
est
b
domain,
our
for y
and the
second for
application.
calibration using
the F
requency
List
feature.
Select
the
7
The pulse
pulse
the
prole
prole
domain
domain
calibration
general-purp
for
and
pro
cedure
is
measuremen
ose
ts
using
simple
familiarize
to
y
a
w
easy
an
correction.
the
can
frequency
timing,
pulse
describ
as
cedure.
calibrate
prole
the
Use
ort
2-P
stabilit
whether
cedure
pro
tage
an
adv
the list
frequency
correction
is
there
,
y
calibration
the
in
or
of calibration
only
while
tec
list
required.
is
tially
essen
frequency
the
connecting
hnique
erformed
p
is
in the
when
Giv
dierence
no
domain
frequency
the
more
en adequate
in
the
in
describ
as
domain
standards
than
signal
the
pulse
once.
pulse
one
lev
accuracy
prole
in the
ed
that
is
prole
accurate
els,
of
domain
second pro
ou
y
Pulse Profile Domain
Perform measurement calibration in the pulse prole domain as follows.
1.
Turn correction o by pressing
N
N
N
N
N
N
N
N
NN
N
N
N
N
N
N
N
N
N
2.
Press
select
3. Press
4
DOMAIN
the
4
START
N
5
FREQUENCY
de.
mo
eep
sw
5
then set the start frequency to
N
N
N
N
NN
N
N
N
to
select
NNNNNNNNNNNNNNNNNNNNNNNNNNNNNNNNNNNNNNNNNNNN
4
5
CORRECTION OFF
CAL
frequency
the
.
4
domain.
Press
STIMULUS
the desired pulse prole frequency
be the frequency measured when the pulse prole domain is selected.
NNNNNNNNNNNNNNNNNNNNNNNNN
4.
NNNNNNNNNN
Press
PULSE PROFILE
function readout sho
NNNNNN
on the Domain men
ws both the time v
u. Press
4
MARKER
alue at the mark
5
and notice that the active
er position
measurement frequency.
ourself
y
onse-only
resp
and 1-P
frequency
and
measured
the
in
ed
main
The
frequencies
all
at
MENU
. This will
and the curren
with
ort
rst
N
N
5
STEP
t
or
data
N
N
N
N
N
N
in
N
N
NN
N
N
to
Pulse
Profile
Domain
Measurements
7-1

5. Select the maximum number of points required for the measurement, then perform the
appropriate measure- ment calibration.
Note that the HP 8510 pulse output is set to the active state (RF always On) during
measurement of the calibration standards. For external triggering, the pulse mo dulation is
operating during the calibration, so the pulse width or time span cannot be changed after
calibration.
6. For the next pulse prole frequency repeat this sequence.
With several cal sets created in this way,you can select each pulse prole frequency in turn by
recalling the corresp onding cal set.
Frequency Domain Using Frequency List
In the ab ove measurement calibration procedure it is necessary to perform a separate
calibration for each pulse prole frequency. This is not a problem for simple response-only
calibrations, but when accuracy considerations require the use of 1-Port or 2-Port calibrations,
connecting the necessary sequence of standards repeatedly can be tedious. As an alternative,
the frequency list feature allows the standards to be connected once for all pulse prole
frequencies.
ws.
follo
erform
P
Press
1.
calibration
the
4
DOMAIN
5
as
N
N
N
N
N
N
N
N
N
N
N
N
N
N
N
N
NN
NN
N
N
FREQUENCY
NN
N
N
N
N
N
to
select
the
frequency
domain.
the
If
ceeding.
pro
2.
Press
3.
Press
each
for
start
um
n
wing sequence
follo
points each.
a.
Press
b.
Press
c.
Press
d.
Press
e.
Press
Figure 7-1
calibration.
W
4
SYSTEM
4
STIMULUS
pulse
and
of
er
b
annotation
5
prole
stop
oin
p
NNNNNNNNNNN
ADD
4
NNNNNNNNNNN
ADD
4
N
N
N
N
N
N
N
N
N
N
N
4
ADD
N
N
NN
N
N
N
N
N
N
N
ADD
4
NNNNNNNNNNNNNN
DONE
shows the resulting displa
is
N
N
N
N
N
N
N
N
N
N
N
N
N
N
N
N
NN
N
N
MORE
frequencies
ts
START54354G/n
START54454G/n54x1
ST
START
NNNNNNNNNNNNNNNNNN
FREQUENCY LIST
MENU
to b
creates a
ART
N
N
PULSE
5
frequency
e displa
4
5
54654
N
N
N
N
N
N
N
N
N
N
N
N
N
N
NN
N
5
NNNNNNNNNNNNNNNNNNNNNNNNN
CONFIG
N
N
NN
N
N
N
N
N
N
N
N
N
N
MORE
EDIT
are
yed
frequency list
5
4
5
5
G/n
G/n54x1
N
N
N
iden
N
NNNNNNNNNNNNNNNNNNNNNNNNNNNNNNNNNNNNNNNNNNNNNNNNNN
NUMBER of POINTS
4
N
displa
not
e
b
ust
N
N
N
N
BW
Edit
of
N
N
N
N
N
N
p
m
.
List
t
oin
pulse
NNNNNNNNNNNNNN
DONE
men
dened
is
in eac
ts
t.
prole
or
F
.
N
N
N
NN
N
N
N
N
N
N
WIDE
y
Eac
um
n
prole
detector
N
N
N
N
N
N
N
N
N
N
N
the
segmen
h
er
b
measuremen
four
4554154x15
wideband
the
ed,
y
N
N
N
N
N
N
N
N
N
NN
N
N
N
x1
N
N
to
N
N
5
5
5
N
N
NN
N
N
DETECTOR:
N
N
N
N
N
N
N
N
N
N
N
N
N
N
NN
LIST
measured.
e
b
tical
in the
NNNNNNNNNNNNNN
DONE
NN
N
N
N
N
N
N
N
N
N
N
N
DONE
N
N
N
NN
N
N
N
N
N
N
N
DONE
. The frequency list will be measured.
y. Proceed with the appropriate measuremen
N
N
N
N
N
N
N
N
N
N
N
N
N
N
N
N
N
displa
to
the
and
pulse
to measure
.
N
.
N
N
.
N
N
selected
Create
u.
h
suc
h segmen
example,
frequencies,
efore
b
a
that
segmen
the
the
is
t
the
of
t
t
51
7-2
Pulse
Profile
Domain
Measurements

4.
5.
Press
Press
The
4
DOMAIN
4
STIMULUS
selected
last
Figure
N
N
N
N
N
N
5
PULSE
MENU
7-1.
N
N
N
N
N
N
N
N
NN
N
N
N
N
PROFILE
N
5
FREQUENCY
segmen
Frequency
N
N
NN
N
N
N
N
N
N
N
N
N
N
N
N
N
N
N
N
NN
N
N
N
N
N
N
N
N
N
N
N
N
N
N
N
N
N
b
will
t
N
N
N
N
N
e
N
N
N
N
N
activ
List
N
N
N
N
N
N
N
LIST
N
N
N
N
N
e.
Displa
N
N
N
N
N
N
N
N
SINGLE
N
N
N
y
N
N
N
N
During
NN
N
N
N
N
N
N
Measurement
N
N
N
N
N
N
N
N
N
N
N
N
N
N
N
N
N
SEGMENT
Calibration
N
N
N
N
N
N
N
.
Figure
7-2.
Pulse
Profile,
Frequency
List
Pulse
Segment
Profile
Number
Domain
1
Measurements
7-3

6. To measure another frequency, select the appropriate active segment.
When either of these calibration procedures is complete, the device can be connected for
measurement.
Again, in both of these procedures, note that when you press the key to measure the
calibration standard, the HP 8510 pulse output is set to the active state (RF always On)
during measurement of the standard. This ensures that the calibration data at every p ointis
with respect to the On portion of the pulse.
Measurement
After calibration, rst view the response of one of the calibration standards. Figure 7-3 is
typical: the trace is at at 0 dB when the pulse is On, and noisy around 0 dB when the pulse
is O. The noise during pulse O will vary depending upon the relative signal levels in the
reference and test signal paths.
Figure 7-3. S21, Pulse Profile, Thru
Set Pulse P
After instrumen
olarity
t preset, the pulse polarit
y is set to High for the On perio d of the pulse
appearing at the HP 8510 rear panel PULSE OUTPUT connector. Use the following
procedure to set the pulse polarit y.
NNNNNNNNNNNNNN
7-4
Press
Pulse
4
SYSTEM
Profile
5
MORE
Domain
NNNNNNNNNNNNNNNNNNNNNNNNNNNNNNNNNNNNNN
PULSE CONFIG
Measurements
NNNNNNNNNNNNNNNNNNNNNNNNNNNNNNNNNNNNNNNNNNNNNNN
PULSE OUT:
HIGH
NNNNNNNNNNNNNNNNNNNNNNNNNNNNNNNNNNNNNNNNNNNN
or
PULSE OUT:
LOW
.

For internal pulse modulation and internal triggering, time equals zero seconds is always the
point where the pulse transitions to the active level. The internal pulse modulator in the RF
source turns the RF pulse On when the analyzer output is p ositive, so the noisy part of the
trace will change location depending on the pulse polarity.
Set Pulse Width
After instrument preset, the pulse width is set to 10 microseconds. To set a dierent pulse
width:
Press
4
SYSTEM
NNNNNNNNNNNNNN
5
NNNNNNNNNNNNNNNNNNNNNNNNNNNNNNNNNNNNNN
MORE
PULSE CONFIG
NNNNNNNNNNNNNNNNNNNNNNNNNNNNNNNNNNN
PULSE WIDTH
.
Use the knob, step keys, or numeric entry to set the desired pulse width.
Set Duty Cycle Limit
After instrument preset, the duty cycle limit is set to 10%. This means that the maximum
duty cycle will never be allowed to be greater than 10 percent regardless of the pulse width.
NNNNNNNNNNNNNNNNNNNNNNNNNNNNNNNN
To set the duty cycle limit, press
step k
knob,
actual dut
eys, or
cycle
y
numeric
y
ma
less.
e
b
entry
DUTY CYCLE
the
set
to
on the Pulse Conguration menu. Use the
desired
maxim
um
dut
y
cycle
limit.
Note
that
the
the
time
minim
4
ter
Span
ho
c
time
larger
whic
um
press
STOP
time span,
oses
et
b
h
sample
4
5
0
w
of
5
the
een
dep
the
4
x1
the
minim
samples,
pulse
ends
resolution
ey
k
9
This
).
5
increase
up
un
um
and th
width
the
on
til
also
possible
us
time
curren
erio
p
time
the
the
sets
stop
the
d
(giv
the
or
t
and
v
start
time
the
alue
the
en
measuremen
stop
um
n
us
th
at
time
to
Measurement
Set
8510
HP
The
w
rm
and
dep
d,
erio
p
um
minim
es
terest.
4
STOP
not
the
c
o view
T
press
do
the pulse
If
of in
automatically
capabilities)
are
ending up
ossible
p
pulse
then
,
5
hange
(or
is longer
Time
on
span
with
eatedly
rep
en
than this
Set Measurement Resolution Period
To nd the resolution perio d, press
e
Activ
the
for
in
measuremen
your
the
alue
v
oin
p
time
required
ts.
hange
c
Connect the Device under T
En
try
est
4
MARKER
area.
c
y
b
t
5
, then move the marker one data p oint and see
time,
the
pulse
If necessary
hanging
the
adjust
,
stop
With the pulse width set, connect the device under test. Figure 7-4
device to the pulsed-RF stimulus at the curren
t frequency
.
8510
HP
time.
oin
p
of
er
b
est
b
the
ottom of
the b
to the
the
view
resolution
width,
hardw
resolution
t
This
ts.
time
minimum
tire
en
erio
p
and n
are
results
resolution,
grid
the
value.
time
the
to
d
er
b
um
shows the response of the
p
in
erio
of
a
d
Pulse
Profile
Domain
Measurements
7-5

Figure
7-4.
Minimum
Time
Span,
Resolution
eriod
P
ns
100
=
measure
o
T
ending
dep
Figure
input
7-5
imp
another
on
up
ws
sho
edance
frequency
calibration
the
S
the
during
11
resp
the
recall
,
pro
using
onse
On time
the
cedure
the
of
appropriate
used.
Smith
the
pulsed-RF
hart
c
cal
stim
or
set
format.
ulus.
frequency
mark
The
list
er
segmen
showing
is
t,
the
7-6
Pulse
Profile
Domain
Figure
Measurements
7-5.
S
,
11
Smith
Chart

Switching Between Frequency Domain and Pulse Profile Domain
The domain in which the measurement calibration was performed is not part of the cal set
limited instrument state. This means that, for example, a cal set created in the frequency
domain could b e turned on for a pulse prole domain measurement with no message to the
operator. Except for the pulse prole calibration procedure in the frequency domain using
Frequency List, a cal set should only be used in the domain in whichit was created.
Press the following keys to switchbetween the frequency domain and the pulse prole domain.
NNNNNNNNNNNNNNNNNNNNNNNNNNNNNNNNNNNNNNNNNNNN
4
5
CORRECTION OFF
CAL
NNNNNNNNNNNNNNNNNNNNNNNNNNNNNNNNNNNNNNNNN
4
5
CORRECTION ON
CAL
4
DOMAIN
NNNNNNNNNNNNNNNNNNNNNNNNNNNNN
CAL SET n
NNNNNNNNNNNNNNNNNNNNNNNNNNNNNNNNNNNNNNNNNNNNNNNNNNNNNNNNNNNNNNNNNNNNNNNNNNNNNNNN
5
FREQUENCY or PULSE PROFILE
This sequence makes certain that the cal set applies to the domain in whichitwas created.
Another metho d is to saveanumber of instrument states, each with the appropriate domain
and cal set, then simply recall the desired instrument state.
If a cal set created in the pulse prole domain is turned On while in the frequency domain, it
is treated as if the calibration were performed using step sweep with the minimum frequency
ts,
oin
prole
set and
pulse
the
p
the
prole
The pulse
span.
resulting
a
if
Also,
domain,
frequency
domain.
trace
in
cal
frequency
the
domain
This
prole domain
errors.
created
set
error
also results
is
co
the
in
set
ecien
in
error
frequency
the
to
ts
trace
co
start
are
errors.
ecien
domain
frequency
applied
ts
to
are
is
each
applied
turned
the
of
corresp
dieren
to
while
On
frequency
onding
frequency
t
the
in
domain
oin
p
pulse
in
t
cal
Pulse
Profile
Domain
Measurements
7-7


8
General Timing Information
Previous examples have used the internal measurement trigger and the internal pulse
generator to demonstrate basic operation of the network analyzer. This setup is suitable for
many applications in which the internal PRP and maximum duty cycle limitations are not
critical to measurement results. If your device is sensitive to pulse rep etition p eriod or duty
cycle you will need to learn more about how these are aected by the instrument state. The
following paragraphs provide information that can be used to predict the internal PRP for
dierent instrument states.
Netw
Figure
cycle.
ork
8-1
or
F
measuremen
next
the
for
Analyzer
the
ws
sho
frequency
the
the HP
t,
measuremen
Measurement
general
measuremen
domain
p
oin
8510 measuremen
aiting
w
then
t,
pro
t
t-in-pulse
cycle
t
the
for
Cycle
w
o
cess
measurement
consists
trigger.
next
the
of
making
of
ork analyzer
w
net
and the
the
prole
pulse
measuremen
measurement
domain
setting
t,
up
General
Timing
Information
8-1

measuremen
h
Eac
external
Trigger
Figure
cycle is
t
Input, or
Netw
8-1.
initiated b
ternal
in
the
ork
ythe
8510
Analyzer
falling edge
dep
logic,
Measurement
the
of
ending
TTL
up
Cycle
whether
on
signal
the
at
external
rear
panel
or
ternal
in
triggering is selected. At the appropriate time after the trigger, the measurement is made.
If averaging is turned On but not completed, the pro cess waits for the next trigger to make
the next measurement for that data point. If averaging is complete but another parameter is
required (2-Port correction is On), the next parameter is selected and the process waits for the
next
the
to
es
v
mo
cess
pro
the
trigger.
next
t,
oin
p
domain,
When
changing
then
w
aits
the
for
data
all
frequency
next
the
for
that
in
if
trigger.
oin
p
frequency
the
is acquired,
t
then
domain,
or
the
time
if
in the
pulse
prole
These times are represen
analyzer con
General
8-2
trols.
Timing
Information
tative t
ypical measuremen
t cycle times using preset v
alues for the

Measurement Cycle Time
Measurement Cycle Times
1ms Next Average
4to8ms Next Parameter
30 to 40 ms Next Frequency Point
(Frequency Domain)
3-4 ms Next Time Point
(Pulse Prole Domain)
that
trols
Con
Time.
eep
Sw
Width.
Cycle
cycle
cycle
Profile
for
Limit.
ercen
p
limit is
triggering
Pulse
Duty
y
dut
y
dut
Pulse
determines the
eect
can
terv
in
pulse
the
When
an
The
When
maxim
t
satised.
Domain
Stop
measuremen
measurement
the
analyzer
equal
al
ys
a
alw
analyzer
the
um
Time.
t
is
to
remains
limit
The time
cycle
otherwise
eep
(Sw
On
otherwise
is
ould b
w
time
cycle time
ready
Time
for
exceeded,
e
alue
v
it
when
are:
the
for
(ms)/Numb
user-sp
the
for
ready
the
curren
the
of
greater
is
next
er of
ecied
the
cess
pro
t
than
measuremen
ts).
oin
P
time.
measuremen
next
ignores
prole
pulse
PRP
the
cycle,
t
triggering
data
y
b
set
t
p
the
cycle,
oin
limit.
Frequency
cycle
y
dut
Domain
limit,
Trigger
trigger
dela
Dela
y
y
will
.
If
con
the
trol the
frequency
minimum
domain
trigger
frequency domain
dela
greater
is
y
measurement
than
time.
Additional considerations are:
Pulse Output is set to the active level during measurementofany calibration standard.
eep retrace.
sw
less
the
than
microseconds
30
immediately
prior
to
Pulse
Pulse
Output is
Output
set
to
set
is
the beginning of the sw
the
the
inactiv
active
e
lev
for
el
during
el
lev
eep for the automatic perio dic IF calibration sequence.
it
un
t
dut
ignores
the
if
the
til
cycle
y
the
cycle
to
Pulse Output remains at the inactiv
el under all conditions when External T
e lev
riggering is
selected.
The automatic perio dic IF calibration sequence is transparen
t to the operator except for the
less than 30 microsecond pulse output immediately prior to the beginning of a sweep. Tothe
operator, the IF calibration sequence will appear to occur at random times, more frequently
just
after
the
HP
8510
turned
is
on, then
less
often
as
the
system
General
temp
erature
Timing
stabilizes.
Information
8-3

Pulse Repetition Period and Duty Cycle Considerations
From this information it can be seen that the pulse repetition perio d and thus the duty cycle
of the pulsed-RF signal applied to the DUT can vary depending upon the instrument state.
For measurements in which the PRP or duty cycle is not important, simply set the pulse
width and the duty cycle controls to an appropriate value and make the measurement. The
specied duty cycle limit will not be exceeded, but the actual duty cycle maybe lessthan
expected.
For example, Figure 8-2 shows the pulse output waveform for various conditions. Figure 8-2a
shows the pulse output when the pulse width is 500 microseconds, the duty cycle limit is 50
percent, and averaging is o. Under these conditions the measurement cycle time is about 3
milliseconds p er trace data p oint in the pulse prole domain, or ab out 30 milliseconds in the
frequency domain. Figure 8-2b shows the same conditions with averaging on and an averaging
factor of four. Now four measurements are taken for each data point with the measurement
cycle time alternating b etween 1 millisecond for each of the measurements required for the
averaging, and the time to move to the next data point. Figure 8-2c shows the measurement
when 2-Port correction is On. Here, the parameter switching time also aects the overall PRP
cycle.
y
dut
and
Figure 8-2. Example Internal Pulse Output PRP and
Duty Cycle
In Figure 8-2, the pulse width is greater than the measurement cycle time, so the duty
function
cycle
y
dut
com
cycle
the
bination
time, the
limit.
the
of
pulse
pulse
o
part
width
of
cycle could
v
the
um
dut
maxim
and
measuremen
General
8-4
approac
allo
alue
cycle
y
cycle
t
Timing
p
100
h
in
ed
w
approac
limit
is
time
Information
This
t.
ercen
measuremen
the
the
hes
increased to
oided
v
a
is
When
t.
measuremen
satisfy
the
y
b
dut
setting
the
cycle
t
y
to
the
the

If you are viewing this with an oscilloscope, notice how the measurement cycle time varies
according to the pulse prole stop time. If the stop time is greater than the pulse width, the
measurement cycle time will extend past the end of the pulse depending up on the time value
of the data point being measured. Depending upon the pulse width, this can result in a lower
percent duty cycle toward the end of the time span.
External Trigger and Stop Sweep Signals
Figure 8-3 shows the relationship b etween the external Trigger Input and the HP 8510 Stop
Sweep output for frequency domain p oint-in-pulse measurements and for pulse prole domain
measurements. For external triggering, Stop Sweep remains Busy (low) until the measurement
cycle is complete. This information is imp ortant for synchronizing the pulse mo dulation to the
external trigger.
It is easy to learn the timing by using an oscilloscope to view Stop Sweep when the external
trigger is applied.
4
Press
train
for at
ignored.
STIMULUS
the
to
least
The
measuremen
MENU
HP 8510
nanoseconds.
100
next
cycle
t
NNNNNNNNNNNNNN
5
rear panel
external
and
NNNNNNNNNNNNNNNNNNNNNNNNNNNNNNNNNNNNNN
MORE
TRIGGER
Excess
trigger
retrace
MODE
TRIGGERING
EXTERNAL TRIGGER
ccur
o
NNNNNNNNNNNNNNNNNNNNNNNNNNNNNNNNNNNNNNNNNNNNNNNNNNNNNNNNNNN
edge
that
after
stop
triggers
falling
automatic.
is
EXTERNAL
INPUT. The
stop
while
ready
is
eep
sw
sw
and
trigger
eep
will
apply a
should
busy
is
initiate
TTL pulse
y
sta
are
w)
(lo
next
the
lo
w
Figure
8-3.
External
Trigger and
Stop
Sw
eep
Timing
General
Diagram
Timing
Information
8-5

When
not op erate (always in the ready state). Timing diagrams for the pulse output signal and
development of the internal measurement trigger are shown in Figure 4-1 and Figure 4-2.
When
trigger input denes time equals zero seconds for each measurement cycle. Stop sweep falls
immediately and stays lowuntil the HP 8510 completes the measurement cycle and is ready to
accept the next trigger. The time p eriod that stop sweep remains busy depends upon the next
measurement function to be performed. Pulse output is turned O for external triggering. As
for internal triggering, the pulse prole measurement resolution p eriod is set by the larger of
pulse width and pulse prole domain stop time.
NNNNNNNNNNNNNNNNNNNNNNNNNNNNNNNNNNNNNN
TRIGGER MODE
NNNNNNNNNNNNNNNNNNNNNNNNNNNNNNNNNNNNNN
TRIGGER MODE
NNNNNNNNNNNNNNNNNNNNNNNNNNNNNNNNNNNNNNNNNNNNNNNNNNNNNNNNNNN
TRIGGERING INTERNAL
NNNNNNNNNNNNNNNNNNNNNNNNNNNNNNNNNNNNNNNNNNNNNNNNNNNNNNNNNNN
TRIGGERING EXTERNAL
is selected, the stop sweep output does
is selected, the falling edge of the external
8-6
General
Timing
Information

Using External Triggering and Pulse Modulation
In applications where it is necessary to maintain close control over the PRP and duty
cycle of the pulsed-RF stimulus, you can use external equipment to provide the TTL pulse
modulation and external trigger signals. When using an external pulse mo dulation signal,
it is necessary to synchronize the network analyzer with the pulse modulation signal so
that the measurement is always made at the same time with resp ect to the stimulus. This
synchronization is accomplished using the HP 8510 external trigger input.
9
Connect
simple metho
A
external
an
Figure
mo
How
net
Please
9-1
dulation
er,
ev
analyzer
ork
w
note
in
connector.
SWEEP
the
to
triggering.
the
pulse
ws
sho
input
our
y
that
When
Pulse
control
dto
generator
simple
a
the
to
application
TRIGGER
ternal
in
for
pulse
the
to
0
IN
Generator
PRP
the
vide
pro
to
this
it
IN
ma
and
In
and to
y
b
setup.
RF source
triggering,
generator
10V connector.
cycle
y
dut
and
mo
pulse
the
HP
pulse
the
to
mo
short
example
desireable
e
the
to
BNC
a
connected
is
the
Otherwise, signals
the
of
dulation
same
rear
8510
dieren
use
dulator.
circuit
TRIGGER
to
pulsed-RF
input
TTL pulse
panel
sync
t
connected
is
IN,
sw
the
on
ulus
stim
RF
the
to
train pro
TRIGGER
hronized
to
the BNC
e
v
mo
line
in
eep
is
source.
vides
IN
inputs
TRIGGER
the
could
use
to
pulse
the
connector.
the
to
short
aect
IN
Using
External
Triggering
and
Pulse
Modulation
9-1

Figure 9-1. External Control of PRP and Duty Cycle
Synchronization is assured because time equals zero seconds for each measurementcycle
(high).
ready
is
eep
sw
stop
after
dened
is
Figure 9-1
RF
the
in
the
as
sho
b
source.
rst
connection
ws
falling
edge
of
of the
an
trigger
external
input
pulse
mo
dulator
instead
of the
ternal
in
mo
dulator
Figure 9-2 sho
pulse mo
percen
dulation input to the RF source is a con
y cycle pulses. The same input is applied to TRIGGER
t dut
EXTERNAL is
9-2
Using
External
ws results using this pulse modulation and triggering metho d
tinuous train of 10 microseconds PRP
IN, and TRIGGERING
selected.
Modulation
Pulse
Triggering
and
when the
,50

Using
Figure
time
time
en
Ev
prole
stop
and
External
is
9-2a
greater
is
out
ab
is
though
the
measuremen
time.
the
than
ositiv
p
Trigger
pulse
in
and External
prole
ulus
stim
the
measuremen
3
e
ternal pulse
resolution
t
domain
PRP
t
output
d
erio
p
Figure 9-2.
Modulation PRP
Multiple
onse.
resp
for
not
set
that
used
algorithm
y
b
eriods
in
Notice
.
resolution p
is
is
=10
external
with
this
microseconds, Duty
visible
pulses
are
triggering
the
to
ect
resp
particular
using
conguration,
greater
the
ecause
b
minim
the
external
the
of
Cycle
the
pulse
50%
=
stop
the
start
um
trigger.
pulse
width
Figure
time
On
One
1.
Press
2.
Press
9-2
of
metho
4
4
the
is
b
the
used
d
DOMAIN
MARKER
frequency
domain
pulse.
trigger
the
set
to
NN
NN
NN
N
N
N
N
N
N
N
N
N
N
N
N
N
N
N
N
N
NN
NN
NN
NN
N
5
PULSE
5
, then move the marker to the point on the pulse you want the frequency
PROFILE
resp
appropriate
an
to
y
dela
N
N
N
N
N
N
N
NN
then
,
appropriate
set
value
Start
trigger
the
with
onse
domain measurement to be made.
3. Press
4
STIMULUS MENU
NNNNNNNNNNNNNN
5
NNNNNNNNNNNNNNNNNNNNNNNNNNNNNNNNNNNNNN
MORE
TRIGGER MODE
NNNNNNNNNNNNNNNNNNNNNNNNNNNNNNNNNNNNNNNNN
TRIGGER DELAY
The currentvalue of the trigger delay will b e displayed. Now press
function.
y
will
N
N
N
N
N
N
N
N
N
N
NN
N
N
N
N
N
N
N
N
N
N
N
FREQUENCY
N
N
N
N
NN
The
.
4.
alue
v
Press
the
at
4
DOMAIN
marker
5
assigned
e
b
Trigger In signal falling edge as set b
y be desirable to complemen
our application
In y
it ma
trigger
the
to
ws
sho
trace
y the trigger dela
dela
at
onse
resp
the
alue.
yv
t the pulse mo dulation and the external
trigger signals.
dela
and
.
the
set
y
is:
Stop
4
=MARKER
time after
measure
to
times.
during
5
. The time
TTL
the
the
Using
External
Triggering
and
Pulse
Modulation
9-3


10
High Power Measurements
Signal Level Characteristics
Use Figure 10-1 to examine the maximum power ratings and normal signal levels present
in the test set. The signal levels are approximate, with signal path loss increasing with
frequency. Note the following characteristics:
Typically, the RF input is about 9 dBm and the loss to the selected test p ort is ab out 9 dB.
With the step attenuators set to zero dB, the loss from the RF input to the a1 or the a2
mixer, and the loss from Port 1 or Port 2 to the b1 or the b2 mixer, are approximately
equal at ab out 26 dB.
Since
the User
of
signal
the
sp
or
F
10
0
is
duce
pro
Caution
eac
mixer
h
includes
Parameters
the
at
el
lev
erformance,
dBm.
p
Higher
ecied
greater uncertain
Comp
oid
v
a
Use the
protect
Install
the
at any input or output. This means that if the device output is greater than
+20 dBm, the switch can b e damaged by +20 dBm present at either LOW
POWER OUT connector.
If the device output is greater than +43 dBm, use appropriate components
protect
to
damage
HP 85110A, and +47 dBm (50 w
a
will sho
test
signal
y
t
ts
onen
damage,
POR
the
appropriate
set
test
the
lev
20
ort.
p
the
lev
due
the
in
observ
T
mixer
orw
F
el is
MHz
wthe
maxim
cause
els
to
test
and
1
input
ard/Rev
set
test
+43
preamplier to
to
el
lev
IF
signal
IF
um
errors due
noise.
b
will
set
wing
follo
ethe
2
T
POR
mixer
the
0
ts
onen
comp
switc
erse
(and
orts
p
w
(20
dBm
oset its
22
out
ab
e
b
as
el
lev
compression,
to
damaged at
e
b
e
erating
op
uators
atten
damage
rear
the
in
the damage
0
h
ard/Rev
Forw
the
applied
atts)
atts) for the HP
ersion loss,
conv
less
dB
measured b
and
certain
precautions:
ulus
(Stim
is
el
lev
extension
panel
level
erse
POR
at
85110L.
than
ythe
o
P
+20
T
the
er
w
lo
signal
er
w
dBm.
is +20
switc
or POR
1
measuremen
input
RF
parameters
user
signal
els.
lev
to
u)
men
protect
to
links
dBm
the
0
h)
2
T
els
lev
o
T
applied
for
t
or
the
High
Measurements
er
w
o
P
10-1

Figure
10-1.
T
est
Set
Maximum
Signal
Lev
els
Connecting
rear
set
test
The
the P
equipmen
OUT eac
tin
connect
h
external
links
panel
and P
ort 1
output
an
to
signal
lab
ort
conditioning
POR
eled
signal
2
forw
the
of
1and
T
paths.
ard/rev
PORT
The
erse
b
can
2
connectors
h.
switc
e
lab
The
used
install
to
W
LO
eled
connectors
external
WER
PO
eled
lab
HIGH
POWER IN connect to the front panel measurementPORT 1 or PORT2.
Note the damage levels indicated in Figure 10-1. The maximum power rating of the
forward/reverse switch is +20 dBm applied at the RF input, or applied to the forward/reverse
poles via either LOWPOWER OUT connector. The maximum signal level applied at either
connectors
2
HIGH
+43
is
PO
dBm
WER
for
connector, or
IN
HP
the
85110A,
to
and
either
+47
the
of
dBm for
fron
the
panel
t
HP
POR
85110L.
1
T
and POR
T
10-2
High
Measurements
er
w
o
P

Example High Power Measurements
The b est procedure for setting signal levels in the test set begins with estimating the input
and output power levels of the device under test. When the test set is congured to handle
these levels, the operating device is connected and the power estimates are veried by
measuring the user parameters. If the estimates were inaccurate, the test set conguration
is changed so that p ower levels at all points in the system are within limits. When this is
accomplished, the device is removed, measurement calibration is performed, then the device is
installed and its S-parameters are measured. Following are two examples of measurements on
high p ower devices.
Measure a 30 dB Amplifier
Figure 10-2 shows the setup for measurement of an amplier having ab out 30 dB of gain.
Using the standard RF source power setting of +9 dBm, the signal level at Port 1 is ab out +0
dBm, the level at the b2 mixer is about +5 dBm, and the signal level at the reverse pole of
the forward/reverse switch is about +30 dBm. In order to avoid damage:
The ATTENUATOR PORT 2: step attenuator must be set to at least 20 dB to protect the
b2
mixer;
and,
atten
An
signal
isolator,
An
hoice
c
est
b
erformance
p
insertion
the
lev
uator
at
el
pro
ecause
b
for the
loss
isolator
or
the rev
viding
it
from
rev
erse p
out
ab
can
erse
the
preserv
rev
added in
e
b
ust
m
the
of
ole
30 dB
of isolation
ethe
measuremen
ole
p
erse
the rear
h
switc
dynamic
will
ts
switc
the
of
to
b
range
e
b
b
et
panel POR
+20
w
elo
P
een
w
for
obtained
ort
P
to
h
ort
rev
dBm.
2
erse
ecause
b
2,
and
and
to
links
T2
switc
the
measuremen
isolator
the
a2.
to
reduce
is
h,
ts.
will
the
the
Better
minimize
Figure
10-2.
Measuring
Amplifier
gain
dB
30
a
High
Measurements
er
w
o
P
10-3

Measure an Amplifier with High Input Levels
Figure 10-3 shows the setup for measurement of an amplier with about 20 dB of gain that
needs an input level of ab out 40 dBm. A 40 dB gain amplier is installed in the rear panel
PORT 1 links to b oost the signal level to the desired value without exceeding +43 dBm (20
watts). The signal level at the test port is about +60 dBm, making the signal levels at the a1
mixer and the b1 mixer over +30 dBm. In order to avoid damage:
The ATTENUATOR PORT 1: attenuator must be set to 30 dB in order to reduce the a1
and b1 signal levels to below010 dBm;
On the transmission return side, the amplier output is about 60 dBm, making it necessary
to add 20 dB of loss b etween it and Port 2 in order to reduce the signal level incidentat
Port 2 to less than +43 dBm for the HP 85110A, and +47 dBm for the HP 85110L;
The ATTENUATOR PORT 2: step attenuator must be set to 30 dB in order to protect the
b2 mixer; and
The reverse pole of the forward/reverse switchmust be protected by installing an attenuator
or isolator in the rear panel PORT 2 links to reduce the signal level at the reverse pole of
dBm.
+20
w
elo
b
to
h
switc
the
necessary
the
vides
pro
a
high
it
w
o
p
terminate
to
er atten
uator that
through
the
The
loss
ould
w
arm
coupler is
will
and
otherwise
coupler.
the
of
used in
probably
required.
e
b
transmission
the
vide
pro
A
a
more
high
return
stable
wer
o
p
signal
signal
path
path
termination is
ecause
b
than
required
Use
these
examples
as
a
guide
considerations that
for
are
sp
ecial
to
y
our
test
setup.
10-4
High
Amplifier
Measuring
Figure
Measurements
er
w
o
P
10-3.
an
with
els
Lev
Input
High

Using the Port 1 and Port 2 Attenuators
The Port 1 and Port 2 step attenuators are used to adjust the signal level into the mixers and
thus protect the mixers from excessively high signal levels. Note that the attenuators do not
change the Port 1 or Port 2 signal levels.
Controlling the Attenuators
Set the step attenuators as follows.
Press
4
STIMULUS MENU
Use the knob, STEP keys, or numeric entry to set the attenuator from 0 dB to 90 dB in 10
dB steps. Familiarize yourself with operation of the step attenuators by measuring the user
parameters.
Measure User Parameters and Set Attenuators
In order to maintain specied performance, the IF signal levels are less than010 dBm as
user
the
y
N
N
N
N
N
b
4
ARAMETER
P
N
N
N
N
N
N
USER
at
N
NN
N
N
N
USER
N
N
N
N
N
N
NN
NN
N
turn
t,
IF signal
N
N
N
N
N
N
N
N
N
N
N
N
N
N
N
NN
N
an
N
N
b1
4
oin
p
y
N
N
N
N
N
N
N
N
N
N
N
N
N
N
N
N
N
a2
3
NN
NN
N
N
N
N
N
N
N
N
N
N
N
N
N
N
N
N
N
N
N
N
N
N
measured
measuremen
erify the
v
Press
format.
Press
dBm
Press
N
N
N
N
N
REDEFINE PARAMETER
NNNNNNNNNNNNNNNNNNNNNNNNNNNNNNNN
5
POWER MENU
parameters.
measuremen
a
on
levels
5
MENU
N
N
observ
and
the
in
t
N
N
.
N
N
N
N
N
N
N
N
N
N
N
N
N
N
N
N
DRIVE
as follo
NN
N
N
N
N
N
N
N
N
N
N
USER
trace,
NN
NN
N
N
N
N
N
N
N
N
N
NN
e
N
N
NNNNNNNNNNNNNNNNNNNNNNNNNNNNNNNNNNNNNNNNNNNNNNNNNNNNNNNN
ATTENUATOR PORT: 1
appropriate
mark
N
N
and
signal
N
N
N
N
NN
er, then
observ
the
N
N
N
N
N
N
N
N
an
N
N
N
lev
A
N
N
N
N
N
N
Connect
t
ws.
N
N
N
N
N
N
N
N
N
N
N
N
N
a1
1
IF
the
increase
NN
N
N
N
N
N
N
N
N
N
N
N
DRIVE: PORT
measure the
the
e
either
If
el.
TTENUA
N
NN
NN
.
2
IF
TOR
NNNNNNNNNNNNNNNNNNNNNNNNNNNNNNNNNNNNNNNNNNNNNNNNNNNNNNNN
or
ATTENUATOR PORT: 2
ort
P
device
signal
at
user parameters
in
el
lev
is
b1
or
a1
1
T:
POR
the
greater
v
or
1
LOG
alue.
Port
in order
than
2for
MA
0
.
each
to
G
10
el.
Observ
Press
applied to Port 1. If either a2 or b2 is greater than010 dBm at anypoint in the trace,
increase the
In some applications it may b e necessary to measure the signal at b2 with the signal applied
to Port 2. For this measurement:
Press
N
N
REDEFINE PARAMETER
Observe the IF signal lev
Before calibration, measure these user parameters with the calibration standards, then with
the device under test connected and op
Generally, set the attenuators to obtain the maximum possible mixer input signal level
(less than010 dBm) with the device connected and op erating. This will provide the b est
signal-to-noise
calibration.
measuremen
e
N
N
N
N
NN
NN
NN
NN
N
N
N
N
N
N
N
N
N
N
N
N
N
N
2b2
USER
NNNNNNNNNNNNNNNNNNNNNNNNNNNNNNNNNNNNNNNNNNNNNNNNNNNNNNNN
ATTENUATOR PORT: 2
N
N
N
N
N
N
NN
N
N
N
N
N
N
N
N
N
N
N
NN
N
N
N
N
N
USER
N
N
N
N
N
N
N
N
N
N
N
NN
N
N
N
N
N
N
N
b2
2
N
N
N
N
N
NN
N
N
N
N
N
N
N
N
N
N
NN
ratio
best
or
F
t.
signal
IF
the
lev
N
N
N
and observ
N
N
N
.
N
N
N
N
N
N
N
NN
N
N
N
N
N
N
N
el.
the
for
accuracy
e the
N
N
N
N
N
N
NN
N
N
N
N
N
N
N
N
DRIVE
measuremen
N
N
N
N
DRIVE: PORT 2
do
,
IF signal
value.
N
N
N
N
N
NN
N
N
N
N
N
c
not
N
N
N
N
N
N
N
NN
N
N
N
N
N
N
erating.
Then
t.
hange
lev
N
N
N
N
NN
N
N
N
remo
either
N
el.
.
This
the device
e
v
atten
ws
sho
uator
the
b
High
et
and
w
P
lev
een
w
o
the
with
el
erform
p
calibration
Measurements
er
measuremen
signal
and
t
10-5

Changing Signal Path After Calibration
If any attenuator or other external equipmentischanged after calibration, the measurement
results cannot b e specied except byyour own estimation of the error contribution of
the change. For example, when the p ort attenuation is changed with correction On, the
CAUTION: CORRECTION MAY BE INVALID is displayed. The operator must judge
whether the error is tolerable in the particular application and how to comp ensate for the
change.
The only reason to change the internal attenuators or external equipmentbetween calibration
and measurement is to maximize the levels under both conditions, thus minimizing
uncertainty due to noise. Many factors will enter into the decision of whether it is more
accurate to calibrate at a low signal level without changing the setup, or change the setup
to optimize levels for both calibration and measurement. Changing the Port 1 or the
Port 2 attenuator do es not seriously change the test set mismatch, directivity, or isolation
characteristics, but will change the frequency response magnitude and phase. This dierence
in the frequency response b etween calibration and measurement can be normalized using the
HP 8510 trace memories.
the
e
v
the
impro
setup?
application
The
question
calibration enough
ttenuators
A
the
Set
to
risk
Do
is:
greater
increasing
es
error
tributions
con
the
signal
lev
ossible
p
els
during
c
y
b
calibration
hanging
minimize
If
only
the
hanged,
c
attenuators
2
ort
P
or
1
ort
P
are
the
cedure
pro
wing
follo
can
errors.
signal
IF
est
b
P
2
ort
for
atten
1
uators
atten
to
uators
the
Connect
1.
lev
P
2.
With
3.
setting
ou
y
If
during
els
erform
an
view the
or a
short
a
calibration.
appropriate
the
appropriate
required for
response
and
thru
measuremen
standard
operating
short
of a
the
set
t
connected,
the test
circuit,
and
1
ort
P
calibration.
the
set
device.
notice
that
ort
P
Port
c
atten
2
1and
hanging
uators
ort
P
the
has negligible eect on the S11marker reading, and that changing Port 2 attenuators has
negligible eect on the S22marker reading. This is due to the way that the attenuators are
paired. Both the reference and the test signal are changed an approximately equal amount.
However, when viewing S21or S12,changing the Port 1 or Port 2 attenuators osets the
mark
reading
er
dierence
the
y
b
in
alues.
v
2
ort
P
1and
ort
P
the
Store Trace Memories
The main frequency response eects of c
hanging the atten
using the HP 8510 trace memories and trace mathematics as follo
1. Connect the thru used for calibration. Set the p ort atten
measurement of the device. Recheck the user parameter levels then press
2.
Press
trace
measuremen
4
DISPLA
the
is
NNNNNNNNNNNNNNNNNNNNNNNNNNNNNNNNNNNNNNNNN
DATA
!
resp
5
Y
frequency
t.
MEMORY
onse
store
to
dierence
the
of
S
the
21
trace
S
uators can be comp ensated for b
ws.
alue used for
memory
calibration
een
w
4
S
21
uators to the v
default
in
signal
path
trace
et
b
21
5
.
This
1.
and
the
y
10-6
High
Measurements
er
w
o
P

3. Press
4
S
12
54
DISPLAY
5
DATA
!
MEMORY
to store the S12trace in trace memory 2. This
trace is the frequency response dierence of the S12signal path between calibration and
measurement.
Now that these traces are stored, they can be used to normalize the corrected data.
View the Normalized Parameters
Use these traces to normalize the corrected data to the new levels after the attenuation is
changed. This example uses normalization only for S21and S12. Press the following keys to
view the corrected parameters.
NNNNNNNNNNNNNNNNNNNNNNNNNNNNNNNNNNNNNNNNNNNN
1.
2.
Press
Press
4
DISPLAY
4
S
11
NNNNNNNNNNNNNNNNNNNNNNNNNNNNNNNNNNNNNNNNN
5
DISPLAY: DATA
5
and view the S11measurement.
.
3. Press
4. Press
4
5
and view the S22measurement.
S
22
4
5
and view the S21measurement. If the thru is connected, the transmission
S
21
coecient should be 160.
Press
5.
View
the
4
and
5
S
12
S
measuremen
12
view
the
12
the
If
t.
measuremen
connected,
is
thru
t.
e
transmission
the
ecien
co
should
t
b
S
160.
Normalization
selected
Since
and
these
are
application.
connected
require
to
additional
turned
is
o
normalization
accurate,
is necessary
it
If
ports
test
the
to
steps
for
turned
is
eatable
rep
c
to
connected
or
adequately
11
on
atten
hange
and
to
uators,
other
b
comp
S
measuremen
22
view
parts
een
w
et
ensate
S
this
21
the
and
sequence
the
of
rear
the
for
ts,
S
.
12
test
panel
hanges.
c
then
may
setup,
links,
appropriate
the
eectiv
e
b
ecially
esp
this
pro
in
e
comp
cedure
memory
our
y
onen
ma
ts
y
S
the
Selecting the Appropriate Measurement Calibration
The HP 8510 pulsed-RF network analyzer system allo ws you to calibrate in the same
environmentasyour measurement. For example, if you are making a high power, pulsed-RF
measurement, you can calibrate in the same high p ower, pulsed-RF mode. Calibration data is
calibration
only
en
tak
standards
while
that
w
the
ould
pulse is
damaged
e
b
on.
This
in
yp
t
high
calibration
of
e
wer,
o
p
calibrations.
CW
ma
y
prev
t damage
en
to
is
y also inuence the decision of
Signal lev
els available for calibration and for measuremen
which error model to use for the measuremen
If appropriate signal lev
measurement, the HP
2-Port or TRL 2-P
ort, pro
els can be ac
8510 2-Port accuracy enhancemen
vides b est accuracy b
hieved for all parameters during calibration
t.
ypro
tma
and
t error mo del, either the HP 8510 F
viding best c
haracterization and remo
ull
val
of the systematic errors in the test setup. If the device is noninsertable, the HP 8510 Adapter
Removal calibration procedure can be implemented using the Full 2-Port and/or the TRL
calibration.
ort
2-P
High
Measurements
er
w
o
P
10-7

However, there are applications in which the 2-Port error model cannot be used. There are
others in which better results are produced using other calibration techniques described later.
These are the reasons that 2-Port correction cannot be used eectively:
1. Very low signal levels of the S22and S12measurement will probably reduce the accuracy of
the S11and S21measurements.
Using 2-Port correction, the values of all four parameters are used to nd the corrected
value for the displayed parameter. If, for example, the reverse parameters are not
representative of their actual values due to insucient signal levels, then their
contribution to the accuracy enhancement algorithm will cause errors. This leads to noisy,
nonrepeatable data for the other parameters, even if their measured data is representative.
2. Equipment external to the HP test set must be switched depending upon the parameter
being measured.
There is no means of automatically switching equipment external to the test set dep ending
upon the S-parameter b eing measured.
Using 2-Port correction, all four S-parameters are automatically selected in sequence,
and there is no signal available to indicate which parameter is being measured. If
dynamic
measuremen
del
mo
est
T
3.
calibration
range
t
cannot
conguration
set
and
considerations
dieren
of
e used.
b
t
hanges
c
measuremen
e
mak
parameters,
error
t.
necessary
it
the
terms
to
automatic
than
other
hange
c
switc
frequency
test
the
hing used
resp
conguration
set
onse
2-Port
et
b
in the
een
w
for
error
hange
c
hanges to
c
If
directivit
the
measured
frequency
the displa
using
Calibration
these
of
all
In
parameter.
the
,
y
during
onse
resp
section
situations
or
F
set
test
isolation,
calibration,
the
haracteristics
c
memory
y
this
in
example,
w
et
b
source
features
hapter.)
c
b
the
use
een
est
the
or
then
c
Resp
calibration
matc
load
corrected
the
the test
of
HP
the
of
will
hoice
onse
and
h,
set c
8510B.
e
b
the
or
measuremen
frequency
or
data
hange,
(See
a
use
to
onse
Resp
t
resp
e
b
will
ensation
comp
Changing
the
separate
& Isolation
signican
onse
in
error mo
tly
co
error
error.
If only
can
Signal
del for
calibration for
ecien
pro
e
b
P
the
vided
ath
each
ts
After
the
S21and S12parameters, and 1-Port calibrations for the S11and S22parameters. Combining
error models like this allows setup, calibration, and measurement for each parameter
to be accomplished independently. After separate calibration for each parameter, the
forward/reverse switch in the test set will resp ond to front panel parameter selections, and
set
cal
the
Combining
Basic Net
selected
the
for
is
dels
mo
error
work Measuremen
parameter
describ
ts portion,
will
HP
the
in
ed
with the Cal men
8510
erating and
Op
u in the S-P
Programming
arameter T
est Set
man
ual,
recalled.
e
b
Calibration Error Mo dels section.
10-8
High
Measurements
er
w
o
P

General Calibration and Measurement Sequence
Specify device input/output requirements.
Congure test set for these levels, plus guardband.
Connect operating device and verify levels.
Adjust levels for best dynamic range.
Perform measurement calibration.
Measure op erating device S-parameters.
General Calibration and Measurement Sequence Using Display Math
Specify device input/output requirements.
Congure test set for these levels, plus guardband.
els.
lev
erify
v
Connect
erating
op
device
and
Congure
Connect
Change
erform
P
standards
setup for
measuremen
device.)
Connect
appropriate
Connect op
normalization
Use
setup
erating
for
b
to
and
est
device.
dynamic
est
b
erify
v
dynamic
calibration.
t
standards
device
view
range.
els.
lev
range
(Before
j
store
and
parameters.
during
calibration.
ving
sa
reference traces.
cal
set,
congure
setup
for
erating
op
High
Measurements
er
w
o
P
10-9


Reference Data
Creating Pulse Hardware State and Instrument State Files
If the HP pulsed-RF system tape is not available, create the necessary les as follows.
11
Press
1.
2. Set
4
PRESET
system bus
N
4
SYSTEM
N
5
HP-IB ADDRESSES
NNNNNNNNNNNNNNNNNNNNNNNNNNNNN
SOURCE #1
NNNNNNNNNNNNNNNNNNNNNNNNNNNNN
SOURCE #2
the
set
to
5
HP-IB addresses
N
N
N
N
N
N
N
N
N
N
N
N
N
N
N
N
N
NN
NN
NN
NN
N
N
N
NNNNN1NNNNN9NNNNNNNN
x1
NNNNN1NNNNN8NNNNNNNN
x1
.
Network Analyzer
HP-IB Addresses
System Bus
8510 16
System Bus 17
Source #1 19 (RF)
Set
est
T
Plotter
ter
Prin
Disc
Source
P
RF
instrumen
N
N
N
N
NN
NN
NN
NN
#2
ASS-THR
Switc
t
sources:
of
N
N
N
N
N
h
to
U
akno
wn state.
18
20
05
01
00
(LO)
31
31
de.
sweep
Set
3.
Press
4. Multiple
mo
4
STIMULUS MENU
source con
trol.
5
N
N
N
N
N
N
N
N
STEP
N
N
N
NN
N
.
Edit the Multiple Source conguration to set the
and tune the receiv
NNNNNNNNNNNNNN
4
SYSTEM
5
MORE
NNNNNNNNNNNNNNNNNNNNNNNNNNNNNNNNNNNNNNNNNNNNNNN
N
N
N
N
N
N
N
N
SOURCE
N
NN
N
N
N
N
N
N
N
N
N
N
FREQUENCY
DEFINE
N
N
N
N
N
N
OFFSET
er to 20 MHz as follows:
NNNNNNNNNNNNNNNNNNNNNNNNNNNNNNNNNNNNNNNNNNNNNNN
EDIT MULT. SRC.
NNNNNNNNNNNNNNNNNNNNNNNNNNNNNNNNNNNNNNNNNNNNNNNNNN
1
MULTIPLIER
N
N
N
N
N
N
N
N
N
N
N
N
N
N
N
N
N
N
N
N
N
N
N
N
N
N
N
N
N
N
N
N
N
N
N
N
0
x1
N
N
N
N
N
N
N
DONE
N
N
N
N
N
NUMER
N
N
LO source 20 MHz abo
NNNNNNNNx1NNNNNNNNNNNNNNNNNNNNNNNNNNNNNNNNNNNNNNNNNNNNNNNNNNNNN
MULTIPLIER
DENOM.
ve the test source
NNNNNNNN
x1
Reference
Data
11-1

NNNNNNNNNNNNNNNNNNNNNNNNNNNNNNNNNNNNNNNNNNNNNNN
DEFINE SOURCE 2
NNNNNNNNNNNNNNNNNNNNNNNNNNNNNNNNNNNNNNNNNNNNNNNNNN
OFFSET FREQUENCY
NNNNNNNNNNNNNNNNNNNNNNNNNNNNNNNNNNNNNNNNNNNNNNN
DEFINE RECEIVER
NNNNNNNNNNNNNNNNNNNNNNNNNNNNNNNNNNNNNNNNNNNNNNNNNNNNNNNN
MULT. SRC. ON/SAVE
M
annotation app ears.
Other settings for pulsed-RF operation are as follows:
4
SYSTEM
W
NNNNNNNNNNNNNNNNNNNNNNNNNNNNNNNNNNNNNNNNNNNNNNN
PULSE OUT: HIGH
test signal source)
4
SYSTEM
4
SYSTEM
4
STIMULUS
5.
Finally
NNNNNNNNNNNNNN
5
MORE
annotation app ears.
NNNNNNNNNNNNNN
5
MORE
NN
NN
N
N
N
N
N
N
N
N
5
MORE
N
N
N
N
N
N
N
5
MORE
NN
SA
VE
N
5
INST.
4
,
NNNNNNNNNNNNNNNNNNNNNNNNNNNNNNNNNNNNNNNNNNNNNNNNNNNNN
MULTIPLIER NUMER.
NNNNN2NNNNN0NNNNNNNNNNN
M/
NNNNNNNNNNNNNNNNNNNNNNNNNNNNNNNNNNNNNNNNNNNNNNNNNNNNNNNN
CONSTANT FREQUENCY
NNNNNNNNNNNNNNNNNNNNNNNNNNNNNNNNNNNNNN
PULSE CONFIG
NNNNNNNNNNNNNNNNNNNNNNNNNNNNNNNNNNNNNNNNNNNN
or
PULSE OUT: LOW
NNNNNNNNNNNNNNNNNNNNNNNNNNNNNNNNNNNNNNNNNNNNNNNNNN
SYSTEM PHASELOCK
NN
NN
N
N
N
N
N
N
N
N
N
N
N
N
N
N
N
N
NN
NN
N
N
N
N
N
N
N
POWER
N
N
N
N
N
N
N
N
N
POWER
N
N
N
N
N
N
N
N
N
N
N
STATE
N
NN
NN
LEVELING
NN
NN
N
N
N
N
N
N
N
N
N
N
MENU
N
N
N
N
NN
NN
N
N
N
N
N
N
N
N
N
N
N
N
N
N
N
N
N
N
N
N
N
N
N
N
N
N
(POWER
NN
N
N
N
N
N
N
N
N
N
N
N
NN
NNNNNNNNx1NNNNNNNNNNNNNNNNNNNNNNNNNNNNNNNNNNNNNNNNNNNNNNNNNNNNN
NNNNNNNNNNNNNN
DONE
NNNNNNNNNNNNNNNNNNNNNNNNNNNNNNNNNNNNNNNNNNNNNNNNNNNNN
DETECTOR: WIDE BW
(depending on pulse modulator; HIGH for 834x
NNNNNNNNNNNNNN
NONE
N
N
N
NN
NN
N
N
N
N
N
N
POWER
NN
N
N
N
N
N
N
N
N
N
N
SOURCE
N
N
N
N
N
N
N
NN
NN
N
N
N
N
N
N
N
N
N
N
N
N
N
N
N
N
N
UP)
N
N
N
N
N
NN
NN
NN
N
N
N
N
N
NN
NN
SOURCE
N
N
N
N
N
N
N
N
N
8
MULTIPLIER DENOM.
NNNNN2NNNNN0NNNNNNNNNNN
NN
N
N
N
N
N
N
N
N
N
N
N
N
N
N
1: INTERNAL
N
N
N
N
N
N
N
N
N
N
N
N
N
N
N
1
N
.
NNNNNNNNNNNNNN
M/
DONE
N
N
N
N
N
N
N
N
N
N
N
N
N
N
NN
NN
NN
N
N
4
4
5
5
9
x1
N
N
N
N
N
N
N
N
SOURCE
N
N
N
N
N
N
N
N
N
POWER
NN
NN
N
N
N
N
N
N
N
N
N
N
N
N
NN
NN
2: EXT.
N
N
NN
NN
N
N
N
N
SOURCE
NNNNNNNN
x1
NN
NN
N
N
N
N
N
N
N
N
N
N
N
N
N
N
N
N
N
NN
NN
NN
NN
N
N
N
N
N
N
N
N
N
N
N
N
N
N
N
N
N
N
N
LEVEL
N
N
N
N
N
N
N
N
N
N
N
N
4
2
0
.
4
4
4
5
5
1
.
5
5
0
x1
instrumen
the
Store
pulse
the
Store
4
APE/DISC
T
pulse
Store
N
N
4
STORE
In order to restore a known instrument state, you can
Pulse Menus
eral
Sev
DOMAIN, STIMULUS, and SYSTEM men
Pulse Configuration Menu
The new Pulse Conguration men
DETECTOR: WIDE BW
N
5
INST. STATE
new men
t
hardware
N
N
N
N
N
NN
N
N
N
N
N
N
N
N
N
N
5
STORAGE
instrument
N
N
N
N
N
N
N
N
N
N
N
NN
NN
NN
NN
N
N
N
N
v
ha
us
state.
N
N
N
N
N
N
N
N
N
N
N
N
N
N
N
IS
state from
N
NN
NN
NN
NN
N
N
N
N
N
N
1-8
een
b
e
N
N
N
N
N
N
N
N
N
N
NN
N
N
N
TAPE
N
N
N
N
N
created
N
N
N
N
STORE
Inst.
N
NN
NN
NN
N
N
N
N
N
N
N
INST. STATE
uisreac
N
N
N
N
N
NN
N
N
N
N
N
N
N
N
N
N
N
NN
to
N
N
N
N
N
N
N
N
MORE
State
NN
NN
N
N
N
N
N
N
N
N
N
N
N
N
ort
supp
u structures.
hed by pressing
N
N
NN
N
N
N
N
N
N
N
HARDWARE
8.
N
N
N
N
N
N
N
N
N
NN
NN
(POWER
the
N
N
NN
N
le on
state
are
hardw
and
le
state
e/disc
tap
N
N
N
N
N
N
N
N
N
N
N
N
N
N
N
N
N
N
NN
N
N
N
NN
NN
pulse applications.
N
N
N
N
N
N
N
N
N
NN
UP)
4
RECALL
4
STATE
N
N
N
N
N
N
N
8
SYSTEM
as
N
N
N
N
N
N
N
NN
N
N
N
N
N
5
N
NN
NN
NN
NN
N
N
N
N
N
N
N
FILE 8
N
N
N
N
N
N
N
NN
NN
N
INST. STATE 8
NNNNNNNN
5
follo
N
N
N
N
N
N
N
FILE
N
N
N
N
N
.
N
N
N
N
N
N
N
N
MORE
ws:
N
N
N
N
N
N
N
N
NN
N
N
.
8
N
N
N
N
N
N
N
N
N
N
N
NN
NN
NN
NN
N
N
These
NNNNNN
.
app
NNNNNNNNNNNNNNNNNNNNNNNNN
NNNNNNNN
PULSE CONFIG
ear
in
the
NNNNN
.
Selects
requency
F
domain.
11-2
wide
the
domain
Reference
bandwidth
(Preset
Data
path
IF
selects
and
Normal
detectors.
alw
BW);
Must
ys
a
rst
selected
selected
e
b
automatically
man
ually
for
for
Pulse
Prole

DETECTOR: NORMAL BW
Selects the precision 10 kHz IF path and detectors (Preset).
PULSE WIDTH
Sets the width of the pulse from the HP 8510 rear panel. PULSE OUTPUT connector.
Range:06 res. perio ds to 40.88 ms; Preset 10s.
DUTY CYCLE
For internal triggering, sets the maximum allowed duty cycle. Range: 0 to 100 p ercent. Preset
10 percent.
PULSE OUT: HIGH
Selects the polarit y of the TTL Pulse Output to High for the On p eriod of the pulse (Preset).
PULSE OUT: LOW
Selects the polarit y of the TTL Pulse Output to Low for the On perio d of the pulse.
rigger
T
MORE,
TRIGGER
Activ
measuremen
TRIG
Selects
TRIG
Selects
Mo
TRIGGER
DELAY
only
e
MODE:
in
the
MODE:
falling
the
MODE.
requency
in the
t
F
trigger
INTERNAL
ternal
measuremen
EXTERNAL
edge of
and
The
u.
Men
de
the measurement trigger.
T
new
domain,
actual
the
t
the TTL
rigger
Mo
used
measuremen
trigger
signal input
men
de
set
to
(Preset).
is
u
the
Range:
t.
at the
reac
dela
HP
hed
y
0
8510
b
y pressing
b
een
w
et
40.88
to
s
rear
STIMULUS,
in
the
ms;
panel
Preset
or
5
ternal
TRIGGER
external
s.
as
IN
Reference
Data
11-3

HP 8510 Option 008 Added Programming Codes
Following is the list of programming co des added for Option 008.
HP 8510 Option 008 Added Programming Codes
Programming Code Description
DETENORB; DETEWIDB; Select Precision Detector (10 kHz
bandwidth) Select Wide Bandwidth Detector (1.5 MHz). Selected
automatically for PULP;.
DUTC
4
5
; Set duty cycle limit percentmaximum.
value
(Actual duty cycle can be less.)
EXTTOFF; EXTTPOIN; Select Internal measurement trigger.
Select External measurement trigger.
Select
high.
e
activ
or
s,
start
pulse
trigger
activ
w.
lo
e
Select Pulse
pulse
sets
pulse
s;
10
time.
Prole domain.
prole
prole
PULOHIGH;
PULP;
alue(time
[v
W
PUL
alue(time
[v
TRID
PULOLO
sux)];
sux)]; Set
W;
Pulse
Select
Output
Pulse
PULSE
Pulse
Set
width.
200
ns,
minim
and
measurement
.
y
dela
Output
OFILE.
PR
Output
Automatically
1
ns,
um
sample
minim
resolution
span,
um
to
100
HP 8510 Option 008 Added Query Commands
F
ollo
wing
are
the
Query
commands
8510
HP
added
Option
for option
Added
008
008.
Query
Commands
DETE?; Detector Bandwidth
PULO?; Pulse Output
EXTT?; MeasurementTrigger mo de
Domain
11-4
Reference
DOMA?;
Data

Figure
11-1.
Option
008
Domain,
Stimulus,
and
System
Menus
Reference
Data
11-5

 Loading...