

Page 1

Agilent
4287A RF LCR Meter
1 MHz - 3 GHz
Data Sheet
Page 2

2
Specifications
Specifications describe the instrument’s warranted performance over
the temperature range of 5 °C to 40 °C (except as noted). Supplemental
performance characteristics are intended to provide helpful information for
using certain non-warranted performance parameters with the instrument.
These are denoted as SPC (supplemental performance characteristics),
typical, or nominal. Warmup time must be greater than or equal to
30 minutes after power on for all specifications.
Page 3

3
Basic Measurement Characteristics
Measurement parameters
Measurement range
Source characteristics
Frequency
Impedance parameters |Z|, |Y|, Ls, Lp, Cs, Cp, Rs, Rp, X, G, B, D, Q, θz[°],
Measurement range 200 mΩ to 3 kΩ
θz [rad], θy[°], θy [rad]
(A maximum of four parameters can be displayed at one
time.)
(Frequenc y = 1 MHz,
Averaging factor = 8,
Oscillator level ≥ –33 dBm,
Measurement uncertainty ≤± 10 %,
Calibration is performed within 23 °C ± 5 °C,
Measurement is performed within ± 5 °C from the
calibration temperature
Range 1 MHz to 3 GHz
Resolution 100 kHz
Uncertainty ± 10 ppm (23 °C ± 5 °C)
± 20 ppm (5 °C to 40 °C)
Page 4

4
Basic Measurement Characteristics
Oscillator level
Output Impedance
*1. It is possible to set more than 0 dBm (447 mV, 8.94 mA) oscillator level at
frequency > 1 GHz. However, the characteristics at this setting are not guaranteed.
*2. When the unit is set at mV or mA, the entered value is rounded to 0.1 dBm resolution.
Range
Cable length: 1m
Power (when 50 Ω LOAD is
connected to the test port)
Current (when SHORT is
connected to the test port)
Voltage (when OPEN is
connected to the test port)
–40 dBm to 1 dBm (Frequency ≤ 1 GHz)≥
–40 dBm to 0 dBm (Frequency > 1 GHz )
0.0894 mA
0.0894 mA
4.47 mV
4.47 mV
rms
rms
to 502 mV
rms
to 447 mV
rms
to 10 mA
to 8.94 mA
rms
rms
(Frequency ≥ 1 GHz)
rms
(Frequency > 1 GHz )
rms
(Frequency ≥ 1 GHz)
(Frequency > 1 GHz )
*1
Cable length: 2m (when Option 4287A-020 is used)
Power Subtract the following attenuation from the power
(setting value) at 1 m cable length:
Attenuation [dB] = 0.37×
F
(F: Frequency [GHz])
Resolution
0.1 dB
*2
Uncertainty
Cable length: 1 m
Power (when 50 Ω LOAD is
connected to the test port)
Frequency ≤ 1 GHz ± 2 dB (23 ± 5 ºC)
± 4 dB (5 ºC to 40 ºC)
*1
*1
Frequency > 1 GHz ± 3 dB (23 ± 5 ºC)
± 5 dB (5 ºC to 40 ºC)
Cable length: 2 m (when Option 4287A-020 is used)
Power Add 1 dB to the uncertainty at 1 m cable length.
Output impedance 50 Ω (nominal)
Page 5

5
Basic Measurement Characteristics
Measurement accuracy
Conditions of accuracy specifications
Measurement uncertainty
Temperature 23 ± 5 °C
Accuracy-specified plane 7-mm connector of 3.5-mm-7-mm adapter
When OPEN/SHORT/LOAD
calibration is performed:
connected to 3.5-mm terminal of test heads
|Z|,|Y|
q
L, C, X, B
R, G
D
EaEb+
-------------------------
D
tan 1< 1D
at
at
Q
at
()
x
100
D
0.1≤ EaEb+
x
EaEb+
------------------------
tan 1<
Q
()
x
100
EaEb+()±
EaEb+()
---------------------------
±
E
EaEb+()1Q
-----------------------------------------------------
±
1D
------------------------
±
1Q
-----------------------------------------------------
±
1Q
[%]
[rad]
100
+()1D
aEb
2
+()
tan
x
±
tan
()
x
100
2
tan
+()
x
tan
±
()
x
2
+()×±
2
+()×±
EaEb+
-------------------------
()
100
EaEb+
------------------------100
+
E
aEb
-------------------------
()
100
+
E
aEb
------------------------100
[%]
x
[%]
x
10
------------------------
at
E
+
aEb
When
OPEN/SHORT/LOAD/LOWLOSS C calibration is performed
(SPC):
|Z|,|Y|
10≥≥
Q
x
±
2
Q
x
E
EaEb+
-----------------------100
+()±
aEb
[%]
Page 6

6
Basic Measurement Characteristics
Definition of each parameter
q
L, C, X, B
R, G
D
E
c
----------
tan 1<
D
()
x
100
D
0.1≤ E
x
Q
E
c
----------
tan 1<
Q
()
x
100
E
c
----------
±
[rad]
100
E
+()2EcDx()
aEb
EaEb+()2EcQx()
1D
+()
-------------------------------------------------------
±
1D
±
c
----------
±
100
1Q
+()
-------------------------------------------------------
±
±
1Q
+±
+±
E
2
x
x
2
x
x
c
----------
tan
()
100
E
c
----------
tan
()
100
E
c
----------
tan
()
100
E
c
----------
tan
()
100
2
2
[%]
[%]
10
------
Q
10≥≥
x
E
c
Dx =
Qx =
Ea =
Oscillator level ≥ –
Frequency ≥ 1 MHz,
≤ 100 MHz
Frequency > 100 MHz,
≤ 500 MHz
Frequency > 500 MHz,
≤ 1 GHz
Frequency > 1 GHz,
≤ 1.8 GHz
33
dBm
E
2
c
----------
±
Q
x
100
Measurement value of D
Measurement value of Q
(Within ± 5 °C from the calibration temperature.
Measurement accuracy applies when the calibration
is performed at 23 °C ± 5 °C. When the calibration is
performed beyond 23 °C ± 5 °C, the measurement
accuracy decreases to half that described.)
± 0.65 [%]
± 0.8 [%]
± 1.2 [%]
± 2.5 [%]
Page 7

Frequency > 1.8 GHz,
≤ 3 GHz
± 5 [%]
Oscillator level < –33
dBm
Frequency ≥ 1 MHz,
≤ 100 MHz
± 1 [%]
Frequency > 100 MHz,
≤ 500 MHz
± 1.2 [%]
Frequency > 500 MHz,
≤ 1 GHz
± 1.2 [%]
Frequency > 1 GHz,
≤ 1.8 GHz
± 2.5 [%]
Frequency > 1.8 GHz,
≤ 3 GHz
± 5 [%]
E
b
=
[%]
(| Z
x
|: Measurement value of |Z|)
E
c
=
[%] ( F : Frequency [MHz])
Z
s
= (Within ± 5 °C from the calibration temperature.
Measurement accuracy applies when the calibration
is performed at 23 °C ± 5 °C. When the calibration is
performed beyond 23 °C ± 5 °C, the measurement
accuracy decreases to half that described.)
Oscillator level ≥ –33 dBm,
Averaging factor ≥ 8
± (20 + 0.5 × F ) [mΩ] ( F: Frequency [MHz])
Oscillator level ≥ –33 dBm,
Averaging factor < 7
± (50 + 0.5 × F ) [mΩ] ( F: Frequency [MHz])
± (100 + 0.5 × F ) [mΩ] ( F: Frequency [MHz])
Y
o
= (Within ± 5 °C from the calibration temperature.
Measurement accuracy applies when the calibration
is performed at 23 °C ± 5 °C. When the calibration is
performed beyond 23 °C ± 5 °C, the measurement
accuracy decreases to half that described.)
± (30 + 0.15 × F) [µS] ( F: Frequency [MHz])
± (50 + 0.15 × F) [µS] ( F: Frequency [MHz])
± (100 + 0.15 × F) [µS] ( F: Frequency [MHz])
Z
s
Z
x
-------- YoZx•+
100×±
0.06
0.08 F×
1000
-------------------+
±
( )
( )
Oscillator level ≥ –33 dBm,
Oscillator level ≥ – 33 dBm,
Averaging factor ≥ 8
Oscillator level ≥ – 33 dBm,
Averaging factor < 7
Oscillator level ≥ – 33 dBm,
7
Basic Measurement Characteristics
Page 8

8
Basic Measurement Characteristics
NOTE: At the following points, measurement error may exceed the specifica-
tions described here due to the 4287A’s spurious characteristics:
109.7 MHz, 153.6 MHz, 177.2 MHz, 256.0 MHz, 329.1 MHz, 460.8 MHz, 768.0 MHz
Examples of calculated impedance measurement accuracy
Figure 1. Oscillator level ≥ –33 dBm, averaging factor ≥ 8, temperature deviation ≤ 5 °C
100µ
10k
100pF
10pF
1mH
1pF
100ƒF
100µH
10µH
10ƒF
1µH
10%
5%
2%
1nF
1%
10nF
1µF
1M 10M 100M 1G 3G
10m
]
S
[
|
Y
|
100m
1m
10
1k
100
]
Ω
[
|
Z
|
10
1
1
100m
C
100nF
Frequency [Hz]
100nH
10nH
L
1nH
100pH
10pH
Page 9

Figure 2. Oscillator level ≥ –33 dBm, averaging factor ≤ 7, temperature deviation ≤ 5 °C
Figure 3. Oscillator level < –33 dBm, temperature deviation ≤ 5 °C
9
Basic Measurement Characteristics
100µ
10k
100pF
10pF
1mH
1pF
100ƒF
100µH
10µH
10ƒF
1µH
10%
5%
2%
1nF
1%
10nF
1µF
1M 10M 100M 1G 3G
10m
]
S
[
|
Y
|
100m
1m
10
1k
100
]
Ω
[
|
Z
|
10
1
100m
C
100nF
1
Frequency [Hz]
100nH
10nH
L
1nH
100pH
10pH
100ƒF
100µH
100µ
10m
]
S
[
|
Y
|
100m
1m
10
10pF
10k
100pF
1k
1nF
100
]
Ω
[
|
Z
|
10
1
100m
C
10nF
100nF
1
1µF
1M 10M 100M 1G 3G
1mH
10%
5%
2%
1pF
Frequency [Hz]
10µH
10ƒF
1µH
100nH
10nH
L
1nH
100pH
10pH
Page 10
10
Basic Measurement Characteristics
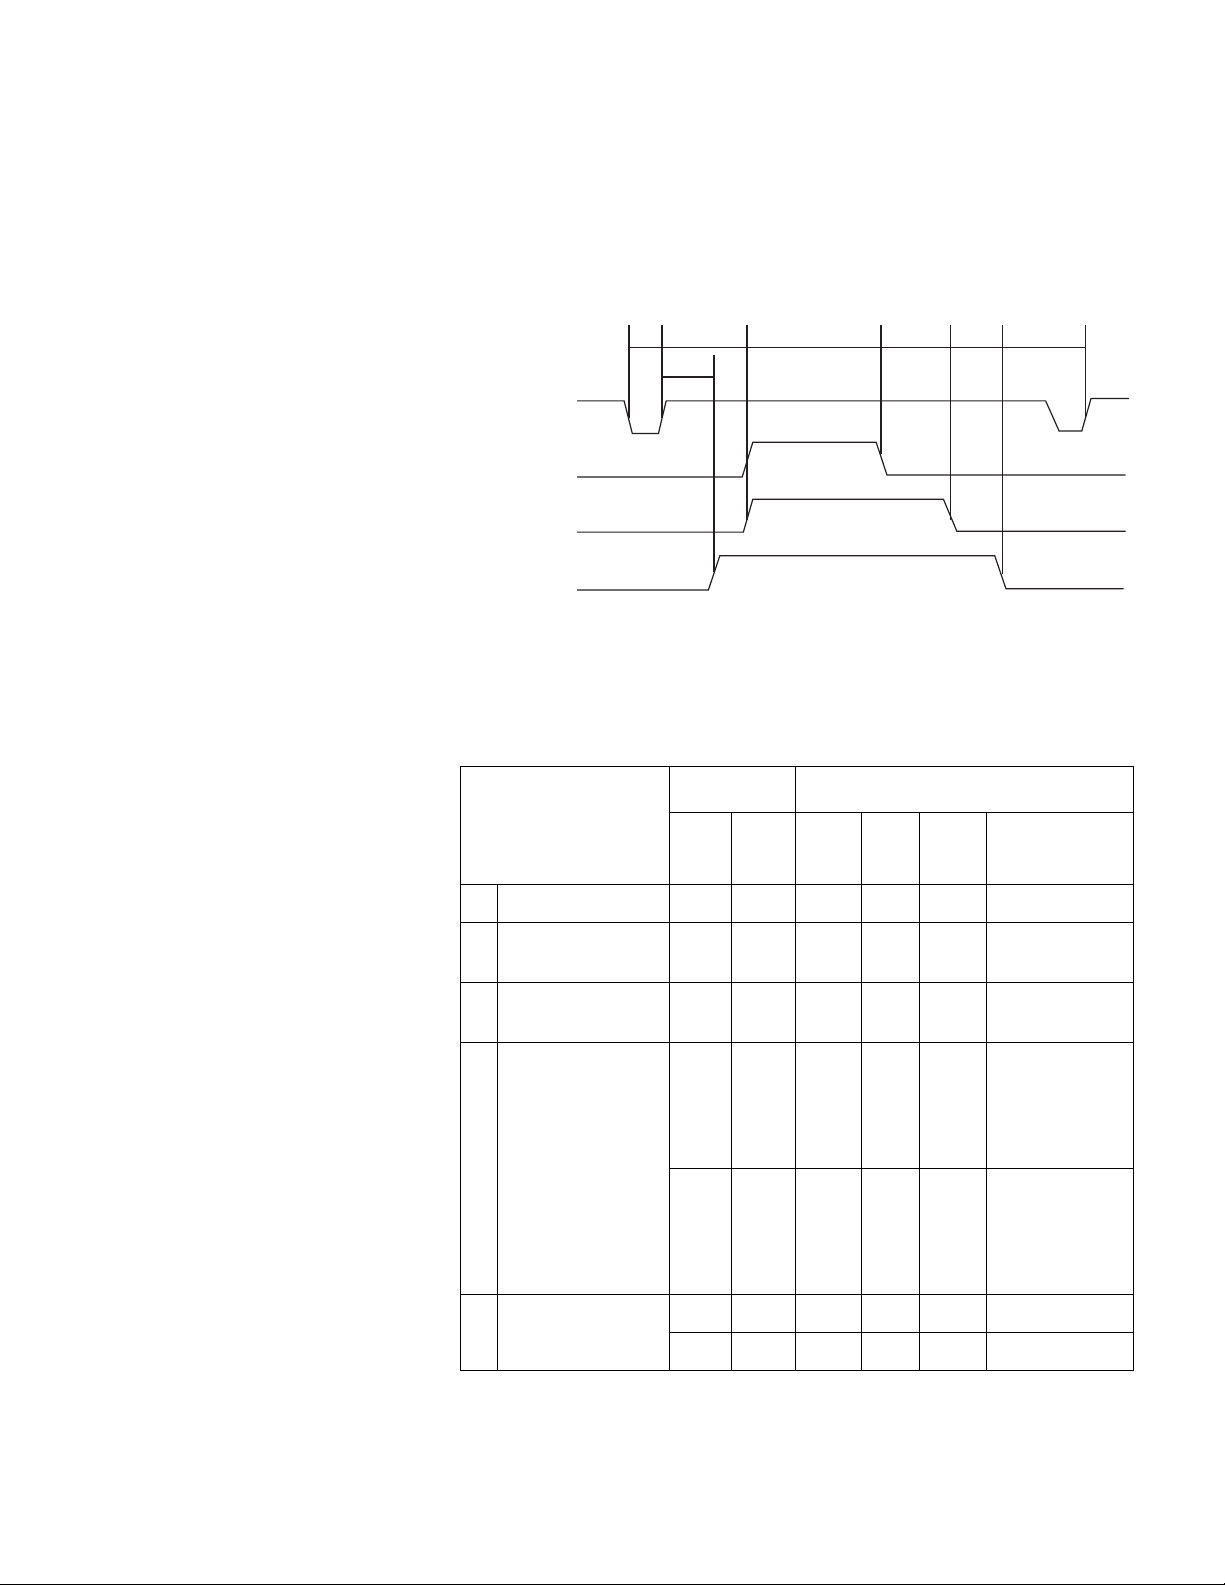
Timing chart and measurement time (SPC)
Timing chart of handler interface signal (SPC)
Figure 4. Timing chart of handler interface
Table 1. Value T1 through T7
Trigger Signal
/INDEX
/EOM
/READY_FOR_TRIG
T1
T3 T4 T5 T6 T7
T2
Name Time Conditions (not affected)
Min. Max. Display R
T1 Trigger pulse width 2 µs ∞
T2 Trigger response time
0.2 ms 1.1 ms - - -
Com-
dc
parator
Meas.
---
Other
(READY_FOR_TRIG)
T3 Trigger response time
0.2 ms 1.3 ms - - -
(INDEX, EOM)
T4 Measurement time 5.6 ms 6.9 ms - OFF - 1 point
measurement,
Trigger delay time
= 0, Measurement
delay time = 0
7.6 ms 8.9 ms - O N - 1 point
measurement,
Trigger delay time
= 0, Measurement
delay time = 0
T5 Measurement value
0.1 ms 0.9 ms - - OFF
calculation time
0.3 ms 1.1 ms - - ON
Page 11

11
Basic Measurement Characteristics
Table 1. Value T1 through T7
Name Time Conditions (not affected)
T6 READY_FOR_TRIG
setup time
Min. Max. Display R
0.3 ms 1.1 ms OFF - -
10.3 ms 11.2 ms ON OFF OFF List measurement
12.1 ms 13.1 ms ON ON ON List measurement
14.5 ms 15.4 ms ON ON ON List measurement
16.8 ms 17.8 ms ON ON ON List measurement
18.4 ms 19.7 ms ON ON ON Single point
dc
Meas.
Comparator
Other
display, Ls-Q
measurement, 1
point measurement
display, Ls-Q
measurement, 1
point measurement
display, Ls-Q
measurement, 2
point measurement
display, Ls-Q
measurement, 3
point measurement
measurement
display, Ls-Q
measurement, 1
point measurement
T7 Trigger waiting time 0 ∞ ---
Page 12
12
Basic Measurement Characteristics
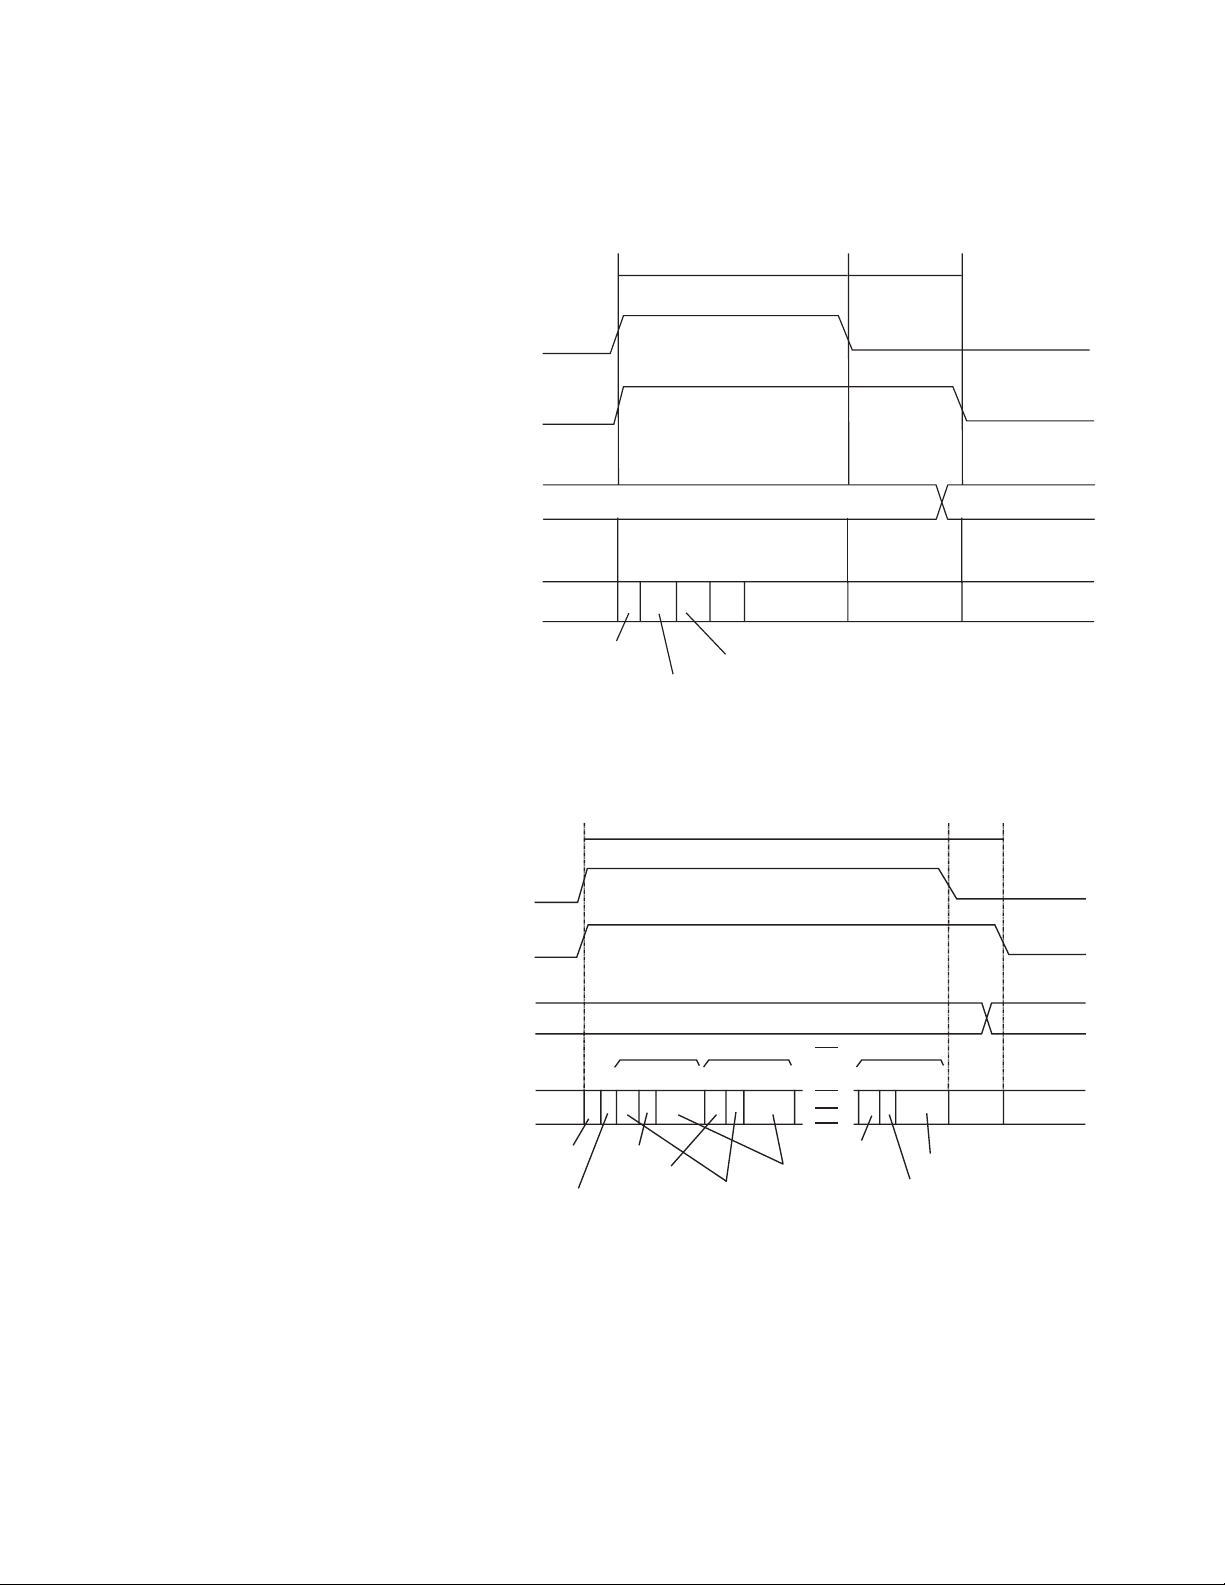
Details of measurement time (T4)
Figure 5. Measurement time T4 at single point measurement
Figure 6. Measurement time T4 at list measurement
/INDEX
/EOM
T4 T5
Sorting result
output
(Previous sorting results)
Ts T t Tp Tr Tm
Internal
process
Meas.
condition
setup
Trigger delay
Rdc
Measurement
meas.
Meas. point
delay time
(user's setup)
time (user's setup)
T4 T5
/INDEX
/EOM
Sorting result
output
Internal
process
Trigger delay time
Meas.
condition
setup
(user's setup)
Meas. point 1
Ts T t Tp Tr TsTm Tp Tm
Rdc
meas.
(Previous sorting results) Sorting results
Meas. point 2
Meas. point
delay time
Measurement
Meas.
condition
setup
(user's setup)
Meas. data
Meas. point N
Ts Tt
Meas.
condition
setup
math.
Tm
Measurement
Meas. point
delay time
(user's setup)
Sorting results
Meas. data
math.
N:
Number of meas.
point in the table
Page 13

13
Basic Measurement Characteristics
Table 2. Value Ts,Tt,Tp,Tr and Tm (typical)
NOTE: Time settings Ts, Tt, Tp, Tr and Tm indicated in Figure 6 are the values
taken when the instrument is making a measurement without receiving any
external request (such as user actions through the front panel key, keyboard,
or mouse) and without performing non-measurement tasks (such as printout
and network connection handling) while the display of measurement results
is off.
Table 3. Value Ts (typical)
*1. To set this, use the :TRIG:DEL command.
*2. To set this, use the :TRIG:SEQ2:DEL command.
*3. For example, this can be a level change from –15 dBm to –10 dBm.
*4. For example, this can be a level change from –20 dBm to –15 dBm.
*5. This applies when the averaging factor is 1. Add 3.9 [ms] with every increase of the
averaging factor by 1.
*6. For example, this can be a frequency change from 1.7 GHz to 1.8 GHz.
*7. f: Test signal frequency [Hz] currently in effect, fp: Test signal frequency [Hz] in the
last measurement.
*8. For example, this can be a frequency change from 1.8 GHz to 1.9 GHz.
*9. For example, this can be a frequency change from 1.8 GHz to 1.7 GHz.
*10. For example, this can be a frequency change from 1.7 GHz to 1.6 GHz.
Ts T rigger delay time
Tt Rdc measurement time 2.0 ms
Tp Measurement point delay time
Tr Analog
measurement
time
Tm Measurement
Measurement
condition
setup time
data acquirement
time
Time [ms]
0.0 ms to 1000.0 ms
0.0 ms to 1000.0 ms
•If the test signal level has changed
*1
*2
*3
crossing
–12.95 dBm or –22.95 dBm since the last
measurement cycle: 300 ms
•If the test signal level has changed
*4
without
crossing –12.95 dBm or –22.95 dBm or if
there is no level change in the test signal:
.
See table below
*5
6.9 ms
Change in test signal frequency
Ts [ms]
since last measurement cycle
No change 0
Increase Change in frequency
crossing 1.73995 GHz
*6
Change in frequency
without crossing 1.73995 GHz
Decrease Change in frequency
crossing 1.73995 GHz
*9
Change in frequency without
crossing 1.73995 GHz
*10
3.4 + 1 × (f - fp) / 1E9
1 × (f - fp) / 1E9
*8
1.7 + 2 × (fp - f) / 1E9
2 × (fp - f) / 1E9
*7
*7
*7
*7
Page 14

14
Basic Measurement Characteristics
Single-point measurement (typical)
This section provides an example of measurement time calculation based on
the conditions shown in the following table:
NOTE: When measurement cycles are repeated at the single point, Ts is
normally 0 ms because the test signal settings do not change. However,
Ts may not be 0 ms if you start a new measurement cycle with the
measurement conditions shown in the table above immediately after
performing measurement with different conditions.
List measurement (typical)
This section provides an example of measurement time calculation for one
cycle of list measurement based on the conditions shown in the following
table:
Measurement point settings Test signal frequenc y 100 MHz
Trigger delay time 3.0 ms
Measurement point delay time 0 ms
R
measurement Of f
dc
Test signal lev el 0 dBm
Averaging factor 2
Measurement
condition
table settings
(with two
measurement points
defined)
Trigger delay time 2.0 ms
Measurement point delay time 1.0 ms
R
measurement On
dc
Point 1 Test signal frequency 100 MHz
Test signal level 0 dBm
Averaging factor 2
Point 2 Test signal frequency 800 MHz
Test signal level 0 dBm
Averaging factor 1
Page 15

15
Basic Measurement Characteristics
For Tt, Tp, and Tr, these settings are applied regardless of the measurement
point settings: Tt = 2.0 ms; Tp = 1.0 ms; Tr = 2.0 ms (Rdc measurement on).
• Ts and Tm at point 1
Between point 2 (previous conditions) and point 1, the test signal changes
in frequency from 800 MHz to 100 MHz but does not change in level. Thus,
Ts is determined as follows:
Ts = 2 x (0.8E9 - 0.1E9) / 1E9 = 1.4 ms
The averaging factor is 2 for the point. This determines Tm as follows:
Tm = 6.9 + 3.9 = 10.8 ms
• Ts and Tm at point 2
Between point 1 and point 2, the test signal changes in frequency from
100 MHz to 800 MHz but does not change in level. Thus, Ts is determined
as follows:
Ts = 1 x (0.8E9 - 0.1E9) / 1E9 = 0.7 ms
The averaging factor is 1 for the point. This determines Tm as follows:
Tm = 6.9 ms
Thus, the measurement time is determined as follows:
Ts (at point 1) + Tt + Tp + Tr + Tm(at point 1) + Ts (at point 2) + Tp +
Tm (at point 2) = 1.4 + 2.0 + 1.0 + 2.0 + 10.8 + 0.7 + 1.0 + 6.9 = 25.8 ms
/INDEX
/EOM
Measurement
status
4287ape013
2.0 1.02.0 1.4 + 10.8 = 12.2 1.0 7.6
Measurement on point 1
Rdc
Trigger
delay
measurement
Measurement
point delay
25.8
Measurement
Measurement
point delay
on point 2
Page 16

16
Basic Measurement Characteristics
Measurement data transfer time through GPIB (typical)
Conditions:
Host computer: HP9000 Series / Model 715
Display: OFF
Measurement mode: List measurement
Measurement parameters: Ls and Q
Evaluation method: Average value of 10,000 times repeated measurements
Table 4. Measurement data transfer time through GPIB (typical)
Switching time for setup change by GPIB (typical)
Conditions:
Host computer: HP9000 Series / Model 715
Display: OFF
Measurement mode: List measurement
Measurement parameters: Ls and Q
Evaluation method: Average value of 10,000 times repeated measurements
Table 5. Switching time for setup change by GPIB (typical)
Number of measurement
points
1 10.0 ms 10.0 ms
2 12.0 ms 13.5 ms
3 15.0 ms 15.0 ms
Required time for FETCH? command
Rdc measurement OFF Rdc measurement ON
Conditions Time
Measurement table switching at list
measurement (required time for executing
:SOUR:LIST:TABL 1 command and *opc?
command)
8.8 ms
Page 17

17
Measurement Support Functions
Error correction function
Available calibration and compensation
Calibration/compensation data measurement point
OPEN/SHORT/LOAD
Calibration
Low-Loss Capacitor
Calibration
Port Extension
Compensation
(Fixture Selection)
OPEN/SHORT
Compensation
Connect OPEN, SHORT, and LOAD standards to the
desired reference plane and measure each kind of
calibration data. The reference plane is called calibration
reference plane.
Connect the dedicated standard (Low-Loss Capacitor) to the
calibration reference plane and measure the calibration data.
When a device is connected to the terminal that is extended
from the calibration reference plane, set theelectrical length
between the calibration plane and the device contact. Select
a model number of the registered testfixtures in the 4287A's
softkey menu or enter the electrical length for user's test
fixture.
When a device is connected to the terminal that is extended
from the calibration reference plane, make OPEN and
SHORT states at the device contact and measure each kind
of compensation date.
Data Measurement
Points
Same as measurement points which is set in the
measurement point setup display. (Changing the frequency
or oscillator level settings after the calibration or
compensation makes the calibration and compensation data
invalid.)
Page 18

18
Measurement Support Functions
DC resistance (Rdc) measurement
Trigger function
Averaging function
Display
List measurement function
Test signal level monitor function
Measurement range 0.1 Ω to 100 Ω
Measurement resolution 1 mΩ
Test signal lev el 1 mA (maximum)
Error correction OPEN/SHOR T/LO AD Calibration, OPEN/SHORT
Compensation. (Changing the frequency or oscillator
level settings after the calibration or compensation
makes the calibration and compensation data invalid.)
Measurement uncertainty
1
( )
R
: DC resistance measurement v alue [Ω]
dut
(Within ± 5 °C from the calibration temperature.
Measurement accuracy applies when the calibration
is performed at 23 °C ± 5 °C. When the calibration is
performed beyond 23 °C ± 5 °C, the measurement
accuracy decreases to half that described.)
0.05
--------R
dut
R
dut
--------------+
10000
[%]
100×+±
Trigger mode Internal, External (external trigger input connector or
handler interface), Bus (GPIB or LAN), Manual (front key)
Setting range 1 to 100 (integer)
Type/Size Color LCD, 8.4 inch
Resolution 640 dots × 480 lines
Number of measurement points 32 points for each table (maximum)
Number of tables 8 tables
Uncertainty of monitor value
30 10
A: Uncertainty of oscillator level [dB]
B: Uncertainty of impedance measurement [%]
A
-----20
( )
1– 100× B++±
[%](SPC)
Page 19

19
Measurement Support Functions
Mass storage
Interface
GPIB
Handler interface
LAN interface
Built-in flexible disk drive 3.5 inch, 720 KByte or 1.44 KByte, DOS format
Non-volatile memory size
Option 4287A-010 2 GByte (minimum)
Option 4278A-011 30 MByte (minimum)
Standard conformity IEEE 488.1-1987,IEEE 488.2-1987
Available functions
(function code)
Numerical data transfer format ASCII
Protocol IEEE 488.2-1987
SH1,AH1,T6,TE0,L4,LE0,SR1,RL0,PP0, DT1,DC1,C0,E2
Connector type 36 pin D-SUB connector
Signal type Negative logic, opto-isolated, open collector output
Output signal • BIN sort result (BIN 1 to BIN 13,
OUT_OF_GOOD_BINS)
• DC resistance pass/fail (DCR_OUT_OF_RANGE)
• Overload (OVLD)
• Alarm (ALARM)
• End of analog measurement (INDEX)
• End of measurement (EOM)
• Ready for trigger (READY_FOR_TRIG)
Input signal • External trigger (EXT_TRIG)
• K ey lock (KEY_LOCK)
Pin location See the follo wing figure. Refer to Programming
Manual for the definition of each pin.
Standard conformity 10 Base-T or 100 Base-TX (automatically switched),
Ethertwist, RJ45 connector
Protocol TCP/IP
Functions Telnet, FTP
Page 20

20
Measurement Support Functions
Measurement terminal (at test head)
Rear panel connectors
External reference signal input connector
Internal reference signal output connector
External trigger input connector
Connector type 3.5-mm (female) connector
Frequency 10 MHz ± 10 ppm (SPC)
Level ≥ 0 dBm (SPC)
Input impedance 50 Ω (nominal)
Connector type BNC (female)
Frequency 10 MHz (nominal)
(can be conv erted to 7-mm connector using the
3.5 mm-7 mm adapter)
Uncertainty of frequency Same as frequency uncertainty described in“Source
Characteristics” on page 3
Level +2 dBm (nominal)
Output impedance 50 Ω (nominal)
Connector type BNC (female)
Level L O W threshold voltage: 0.5 V
HIGH threshold voltage: 2.1 V
Input le vel range: 0 to +5 V
Pulse width (Tp) ≥ 2 µsec (SPC)
See Figure 8 for definition of Tp
Polarity Positive or Ne gative (selective)
Connector type BNC (female)
Page 21

21
Measurement Support Functions
Figure 7. Pin location of handler interface
Figure 8. Definition of pulse width (Tp)
/ B I N 1
/ B I N 2
/ B I N 3
/ B I N 4
/ B I N 5
/ B I N 6
/ B I N 7
/ B I N 8
/ B I N 9
/ O U T _ OF _ GOOD _ B I N S / B I N 10
E X T _ T R I G
E X T _ D C V
+ 5 V
Tp
Tp
5V
1 19
2 20
3 21
4 22
5 23
6 24
7 25
8 26
9 27
10 28
11 29
12 30
13 31
14 32
15 33
16 34
17 35
18 36
5V
/ BIN 11
/ BIN 12
/ BIN 13
/READY_FOR_TRIG
/ RDC_OUT_OF_RANGE
/ OVLD
/ KEY _ LOCK
(reserved)
E X T _ D C V
/ A L A R M
/ I N D E X
/ E O M
C O M
Tp
Tp
0V
Positive trigger signal Negative trigger signal
0V
Page 22

22
General Characteristics
Environment conditions
Operating condition
Non-operating storage condition
Temperature 5 °C to 40 °C
Humidity (at wet bulb
temperature ≤ 29 °C, without
condensation)
Flexible disk drive
non-operating condition
Flexible disk drive
operating condition
Altitude 0 to 2,000 m (0 to 6,561 feet)
Vibration 0.5 G maximum, 5 Hz to 500 Hz
Warmup time 30 minutes
20% to 80% RH
15% to 90% RH
Temperature – 20 °C to + 60 °C
Humidity (at wet bulb
temperature ≤ 45 °C, without
condensation)
Altitude 0 to 4,572 m (0 to 15,000 feet)
Vibration 1 G maximum, 5 Hz to 500 Hz
15% to 90% RH
Page 23

23
General Characteristics
Other specifications
EMC European Council Directive 89/336/EEC
IEC 61326-1:1997+A1
CISPR 11:1990 / EN 55011:1991 Group 1, Class A
IEC 61000-4-2:1995 / EN 61000-4-2:1995
4 kV CD / 8 kV AD
IEC 61000-4-3:1995 / EN 61000-4-3:1996
3 V/m, 27-1000 MHz, 80% AM
IEC 61000-4-4:1995 / EN 61000-4-4:1995
1 kV power / 0.5 kV Signal
IEC 61000-4-5:1995 / EN 61000-4-5:1995
0.5 kV Normal / 1 kV Common
IEC 61000-4-6:1996 / EN 61000-4-6:1996
3 V, 0.15-80 MHz, 80% AM
IEC 61000-4-11:1994 / EN 61000-4-11:1994
100% 1cycle
NO TE-1: When tested at 3 V/m according to EN
61000-4-3:1996, the measurement accuracy will be within
specifications over the full immunity
27 to 1000 MHz except when the analyzer frequency is
identical to the transmitted interference signal test
frequency range of
test
frequency.
NOTE-2: When tested at 3 V according to EN
61000-4-6:1996, the measurement accuracy will be within
specifications over the full immunity test frequency range of
0.15 to 80 MHz except when the analyzer frequency is
identical to the transmitted interference signal test frequency.
AS/NZS 2064.1/2 Group 1, Class A
Safety European Council Directive 73/23/EEC
IEC 61010-1:1990+A1+A2 / EN 61010-1:1993+A2
INSTALLATION CATEGORY II, POLLUTION
DEGREE 2
INDOOR USE
IEC60825-1:1994 CLASS 1 LED PRODUCT
CAN/CSA C22.2 No. 1010.1-92
Power requirement 90 V to 132 V, or 198 V to 264 V (automatically switched),
47 Hz to 63 Hz, 350 VA max.
Weight
Main unit 16 kg (SPC)
Test head 0.3 kg (SPC)
Dimensions
Main unit See Figure 9 through Figure 11
Test head See Figure 12
Page 24

24
General Characteristics
Figure 9. Main unit dimensions (front view, in millimeters, typical)
Figure 10. Main unit dimensions (rear view, in millimeters, typical)
425.6
221.62
27.51
58.8
426.29
18.13
84.55
107.84
24.61
16.51
35.34
421.44
44.97
20.45 20.39 20.25 38.8 39.29
130.44
62.540.6
214.36
136.85
120.79
139.55
148.55
53.34
30
30.24
Page 25

25
General Characteristics
Figure 11. Main unit dimensions (side view, in millimeters, typical)
Figure 12. Test head dimensions (in millimeters, typical)
389.7432
221.62
12.77
21.02
16.97
24.24
23.4
214.36
17.33
18
23.54
7.2
4-M4 Effective Depth 5.6
9.17
10
10
89.72
40
7.3
54.9
9.03
116
9.03
Page 26

26
General Characteristics
The number indicated by ”x” in the part number of each manual or sample program disk,
0 for the first edition, is incremented by 1 each time a revision is made. The latest edition
comes with the product.
Agilent 16195B 7-mm calibration kit, 16195B 7-mm calibration kit, 3.5 mm - 7 mm adapter, a
keyboard, a mouse, a power cable, and an operation manual are not furnished as standard.
Furnished accessories
Options
Order model/option number Description Qty
Agilent 4287A RF LCR meter (main unit) 1
Agilent 4287A
Test head (with 1 m cable) 1
N (m)-SMA (f) adapter 3
Wrench (for 3.5 mm/SMA connector) 1
4287A-004 Add working standard set 1
4287A-020 Add test fixture extension cable set 1
4287A-700 16195B calibration kit 1
4287A-720 3.5 mm - 7 mm coaxial adapter 1
4287A-810 Add keyboard 1
4287A-820 Add mouse 1
4287A-ABJ Japan-Japanese localization 1
4287A-ABA U.S.-English localization 1
4287A-0BW Add service manual 1
4287A-1CM Rack flange kit 1
4287A-1CN Front handle kit 1
4287A-1CP Handle/rack mount kit 1
Page 27

27
Option 4287A-004 Working Standard Set Characteristics
Furnished devices
DC resistance
Short device 1.0 × 0.5 mm (part number: 16191-29005)
1.6 × 0.8 mm (part number: 16191-29006)
2.0 × 1.25 mm (part number: 16196-29007)
3.2 × 1.6 mm (part number: 16196-29008)
Resistor 1.0 × 0.5 mm (part number: 5182-0433)
1.6 × 0.8 mm (part number: 5182-0434)
2.0 × 1.25 mm (part number: 5182-0435)
3.2 × 1.6 mm (part number: 5182-0436)
Resistor 51 Ω± 0.5%
Page 28

Agilent Technologies’ Test and Measurement Support, Services, and Assistance
Agilent Technologies aims to maximize the value you receive, while minimizing your risk and problems.
We strive to ensure that you get the test and measurement capabilities you paid for and obtain the
support you need. Our extensive support resources and services can help you choose the right Agilent
products for your applications and apply them successfully. Every instrument and system we sell has
a global warranty. Support is available for at least five years beyond the production life of the product.
Two concepts underlie Agilent’s overall support policy: “Our Promise” and “Your Advantage.”
Our Promise
Our Promise means your Agilent test and measurement equipment will meet its advertised performance
and functionality. When you are choosing new equipment, we will help you with product information,
including realistic performance specifications and practical recommendations from experienced test
engineers. When you use Agilent equipment, we can verify that it works properly, help with product
operation, and provide basic measurement assistance for the use of specified capabilities, at no extra
cost upon request. Many self-help tools are available.
Your Advantage
Your Advantage means that Agilent offers a wide range of additional expert test and measurement
services, which you can purchase according to your unique technical and business needs. Solve
problems efficiently and gain a competitive edge by contracting with us for calibration, extra-cost
upgrades, out-of-warranty repairs, and onsite education and training, as well as design, system
integration, project management, and other professional engineering services. Experienced Agilent
engineers and technicians worldwide can help you maximize your productivity, optimize the return
on investment of your Agilent instruments and systems, and obtain dependable measurement
accuracy for the life of those products.
Agilent T&M Software and Connectivity
Agilent’s Test and Measurement software and connectivity products, solutions and developer network
allows you to take time out of connecting your instruments to your computer with tools based on PC
standards, so you can focus on your tasks, not on your connections. Visit
www.agilent.com/find/connectivity
for more information.
By internet, phone, or fax, get assistance with all your
test & measurement needs
Online Assistance:
www.agilent.com/find/assist
Product specifications and descriptions in this document
subject to change without notice.
© 2003 Agilent Technologies, Inc.
Printed in USA, May 6, 2003
5968-5758E
Phone or Fax
United States:
(tel) 800 452 4844
Canada:
(tel) 877 894 4414
(fax) 905 282 6495
China:
(tel) 800 810 0189
(fax) 800 820 2816
Europe:
(tel) (31 20) 547 2323
(fax) (31 20) 547 2390
Japan:
(tel) (81) 426 56 7832
(fax) (81) 426 56 7840
Korea:
(tel) (82 2) 2004 5004
(fax) (82 2) 2004 5115
Latin America:
(tel) (305) 269 7500
(fax) (305) 269 7599
Taiwan:
(tel) 0800 047 866
(fax) 0800 286 331
Other Asia Pacific
Countries:
(tel) (65) 6375 8100
(fax) (65) 6836 0252
Email:
tm_asia@agilent.com
www.agilent.com/find/emailupdates
Get the latest information on the products
and applications you select.
 Loading...