

Page 1

V
i
r
t
u
a
l
d
i
g
i
t
i
i
p
e
h
e
h
e
e
h
e
h
e
a
t
t
e
e
e
r
n
r
r
r
n
r
r
a
a
n
n
n
n
V
i
r
t
u
a
l
d
i
c
c
,
,
,
,
o
o
,
,
g
i
g
o
E
E
E
E
E
E
p
p
t
h
t
t
t
h
t
t
V
i
r
t
u
a
l
d
O
s
c
i
l
l
o
s
S
S
S
S
s
s
P
P
P
P
P
P
c
O
O
O
O
O
O
O
s
c
i
l
l
O
s
c
2
-
c
h
a
n
n
e
l
,
1
5
0
2
-
c
h
a
n
n
e
l
,
2
-
c
h
a
n
n
4
-
c
h
a
n
4
4
-
c
h
-
c
h
a
a
n
n
n
n
n
e
e
e
e
1
l
,
1
l
,
1
l
,
1
l
,
1
5
5
5
5
5
0
0
0
0
0
M
M
M
M
M
M
i
o
l
l
o
1052
1052
10521052
H
z
,
H
H
H
H
H
S
z
,
z
,
1054
1054
10541054
z
,
S
z
,
z
,
l
l
l
s
s
s
e
e
e
e
e
e
t
t
t
t
t
t
U
U
U
s
e
r
’
s
M
a
n
u
a
l
s
e
r
’
s
M
s
e
r
a
’
s
M
a
n
n
u
u
a
l
a
l
Pôle Test et Mesure de CHAUVIN-ARNOUX
Parc des Glaisins - 6, avenue du Pré de Challes
F - 74940 ANNECY-LE-VIEUX
Tél. +33 (0)4.50.64.22.22 - Fax +33 (0)4.50.64.22.00
Find Quality Products Online at: sales@GlobalTestSupply.com
Copyright ©
www.GlobalTestSupply.com
X03046A00 - Ed. 01 - 11/07
Page 2

Contents
Contents
General Instructions Chapter I
Introduction..........................................................................4
Precautions and safety measures........................................4
Symbols used ......................................................................5
Warranty..............................................................................5
Maintenance and metrological verification............................6
Unpacking - Repacking........................................................6
Cleaning...............................................................................6
Description of the Instrument Chapter II
Preparation for use ............................................................. 7
Presentation.........................................................................8
Operation.............................................................................9
General view......................................................................10
Measurement terminal block (illustration)...........................10
Back panel (illustration)......................................................10
ETHERNET network..........................................................12
"Oscilloscope" Instrument Chapter III
Display.............................................................................. 14
Menus
"Vertical" menu ......................27
"Trigger" menu ......................41
"Horizontal" menu ......................55
"Display" menu ......................57
"Measurement" menu ......................60
"Memory" menu ......................67
"Util" menu ......................74
"?" Help menu » ......................81
"Oscilloscope with SPO Persistence" instrument Chapter IV
"Instrument" menu ......................26
Selection............................................................................82
Presentation...................................................................... 82
Display...............................................................................83
Menus ......................85
"Recorder" Instrument Chapter VI
Presentation.......................................................................88
Selection............................................................................88
Display.............................................................................. 88
Menus
"Vertical" menu ....................100
"Trigger" menu ....................101
"Display" menu ....................104
"Measurement" menu ....................105
"Memory" menu ....................106
"Util" menu ....................108
"?" Help menu » ....................109
Find Quality Products Online at: sales@GlobalTestSupply.com
I - 2 150 MHz virtual digital oscilloscopes
www.GlobalTestSupply.com
Page 3

Contents
Contents (contd.)
"Harmonics Analyser" Instrument Chapter VI
Presentation............................................................................110
Selection.................................................................................110
Display ...................................................................................110
Menus
"Vertical" menu ......................113
"Horizontal" menu ......................114
The "Memory", "Util", "Help?" menus » ......................115
Applications Chapter VII
Display of the calibration signal..............................................116
Probe compensation...............................................................119
Automatic measurements.......................................................120
Cursor measurements............................................................121
Cursor offset measurements..................................................122
Video signal display................................................................124
Examination of a specific TV line............................................126
Automatic measurement in "Analyser" mode.........................127
Display of slow events............................................................129
Measurement in "Recorder" Mode.........................................130
ETHERNET network...............................................................132
WEB Server............................................................................133
Technical Specifications Chapter VIII
"Oscilloscope" Mode............................................................137
Vertical deviation................................................................. 137
Horizontal deviation (time base)..........................................138
Trigger circuit.......................................................................139
Acquisition chain..................................................................140
Display.................................................................................141
Miscellaneous......................................................................141
"Harmonic Analyser" Mode.................................................142
"Recorder" Mode..................................................................142
Error messages.......................................................................143
Communication interfaces......................................................144
Remote programming.............................................................144
General Specifications Chapter IX
Environment............................................................................145
Mains power supply................................................................145
Electromagnetic compatibility.................................................145
Mechanical Specifications Chapter IX
Casing ....................................................................................145
Packaging...............................................................................145
Supply Chapter X
Accessories.............................................................................146
Index
To update the embedded software, log on to the Internet site:
www.chauvin-arnoux.com
Find Quality Products Online at: sales@GlobalTestSupply.com
150 MHz virtual digital oscilloscopes I - 3
www.GlobalTestSupply.com
Page 4

General Instructions
General Instructions
Introduction
Precautions and
safety measures
You have just acquired an MTX 1054 (MTX 1052) – congratulations on
your choice and thank you for your confidence in the quality of our
products. It consists of:
• 150 MHz, 4 channel (MTX 1054) or 2 channel (MTX 1052),
oscilloscope without display device
• SCOPEin@BOX software
This instrument comes with a data acquisition and pre-processing card and
its own mains supply. It is managed by resident, embedded flash software
that can be updated from a PC via the
SCOPEin@BOX software.
This software communicates with the "host PC" via an ETHERNET
interface.
This instrument has the following operating modes:
"Oscilloscope" Instrument
"Harmonics Analyser" Instrument
"Recorder" Instrument
"SPO" Analogue Persistence display
"FFT" representation
This instrument complies with safety standard EN 61010-1 (2004), single
insulation, relative to electronic measurement instruments and complies with
the EMC standards corresponding to residential and industrial environments.
For optimum service, read this manual carefully and comply with the
operating precautions.
Failure to comply with these warnings and/or user instructions is liable to
cause damage to the equipment. This could be dangerous to the user.
• It is designed for use:
- indoors
- in an environment with pollution level 2
- at an altitude of less than 2000m
- at a temperature between 0°C and 40°C
- with relative humidity of less than 80% up to 31°C
• It can be used for measurements on 300 V CAT II circuits in relation to
earth and can be powered by a 240 V, CAT II network
definition of
measurement
categories
CAT I: Measurement category I corresponds to measurements taken on circuits
not directly connected to the network.
Example: protected electronic circuits
CAT II: Measurement category II corresponds to measurements taken on circuits
Example: power supply for domestic appliances and portable tools
CAT III: Measurement category III corresponds to measurements on building
CAT IV
directly connected to low-voltage installations.
installations.
Example: measurements on distribution panels, cabling, etc.
: Measurement category IV corresponds to measurements taken at the
source of low-voltage installations.
Example
: meters and measurement on overvoltage protection devices.
Find Quality Products Online at: sales@GlobalTestSupply.com
II - 4 150 MHz virtual digital oscilloscopes
www.GlobalTestSupply.com
Page 5

General Instructions
General instructions (contd.)
before use
during use
Symbols used
• Comply with environmental and storage conditions.
• Ensure the three-wire power lead - phase/neutral/earth – that comes with
the instrument is in good condition.
It complies with standard EN 61010-1 (2004): it should be connected to
the instrument as well as the network (variation from 90 to
264 VAC).
Read carefully all the notes preceded by the symbol .
Connect the instrument to an outlet with a ground pin.
The instrument power supply is equipped with an electronic protection
system which is reset automatically when the fault is eliminated.
Be sure not to obstruct the ventilation holes.
As a safety measure, use only suitable leads and accessories supplied
with the instrument or approved by the manufacturer.
When the instrument is connected to the measurement circuits, never
touch an unused terminal.
Warning: Risk of danger.
Refer to the user manual to find out the nature of the potential hazards and
the action necessary to avoid such hazards.
Selective sorting of waste for the recycling of electrical and electronic
equipment. In accordance with the WEEE 2002/96/EC directive: should not
be processed as household waste.
Earth
Warranty
This equipment is warranted to be free of defects in materials or
workmanship, in accordance with the general terms and conditions of sale.
During this period, the manufacturer only can repair the equipment.
The manufacturer reserves the right to carry out repair or replacement of
all or part of the equipment.
In the event that the equipment is returned to the manufacturer, initial
transport costs shall be borne by the customer.
The warranty does not apply in the event of:
• improper use of the equipment or use in connection with
incompatible equipment
• modification of the equipment without explicit authorization from the
manufacturer’s technical services
• repair carried out by a person not certified by the manufacturer
• adaptation for a specific application, not included in the definition of
the equipment or the user's manual
• an impact, a fall or a flooding.
Find Quality Products Online at: sales@GlobalTestSupply.com
150 MHz virtual digital oscilloscopes II - 5
www.GlobalTestSupply.com
Page 6

General Instructions
General instructions (contd.)
Maintenance,
Metrologic
verification
Unpacking,
re-packing
Before the equipment is opened, it must be disconnected from the mains
supply and the measurement circuits, and the operator must not become
charged with any static electricity. This could cause the destruction of
internal parts.
Any adjustment, servicing or repair of the unit under power must be
undertaken only by qualified personnel, after reading the instructions in
this manual.
A qualified person is a person who is familiar with the installation, its
construction, its use and the hazards that exist. They are authorized to
activate and deactivate the installation and equipment, in compliance with
the safety instructions.
Information and contact details: Get in touch with your nearest distributor.
All the equipment was verified mechanically and electrically before
shipping.
When you receive it, carry out a quick check to detect any damage that
may have occurred during transport.
If necessary, contact our sales department immediately and register any
legal reservations with the carrier.
In the event of reshipping, it is preferable to use the original packaging.
Indicate the reasons for the return as clearly as possible in a note attached
to the equipment.
Cleaning
- Turn the instrument off.
- Clean it with a damp cloth and soap.
- Never use abrasive products or solvents.
- Allow to dry before any further use.
Find Quality Products Online at: sales@GlobalTestSupply.com
II - 6 150 MHz virtual digital oscilloscopes
www.GlobalTestSupply.com
Page 7

Description of the Instrument
Description of the Instrument
Preparation for use
Instructions before
activation
Error messages See §. Technical specifications P. 143.
Mains power
supply
This is a user manual for the MTX 1052 and MTX 1054.
Most screen copies are made from an MTX 1054.
Check the good condition of the power supply cable to be connected, first
to the back of the instrument and then to a 50-60Hz power socket with an
earth link.
When lit, the LED at the back indicates that the mains voltage is correct
for the oscilloscope.
Connect the oscilloscope and the "Host PC" to the "Ethernet Network" or
directly to one another via the Ethernet twisted cable.
The oscilloscope power supply is designed for:
•
a power supply that can vary from 90 to 264 VAC (nominal range
of use 100 to 240 VAC)
•
a frequency between 47 Hz and 63 Hz.
Fuse
consumption
Type: Time delay
2.5 A
250 V
5 x 20 mm
This protection fuse must only be replaced with an identical model.
Replacement must only be performed by qualified personnel.
Contact your nearest distributor.
Activation Connect the oscilloscope to the 50-60 Hz network.
Wait for about one minute before starting the
"SCOPEin@BOX" application software. Refer to the "First Installation"
Reducing
instructions that come with the instrument.
When you exit the "SCOPE in@BOX" software, the remote virtual
oscilloscope switches to reduced consumption mode (except in
"Recorder" Instrument mode). Channels are put on standby but the
microprocessor remains active.
When a new work session is opened, the oscilloscope is automatically
switched to normal consumption.
To save working parameters correctly, exit the "SCOPEin@BOX"
software before disconnecting the instrument from the 50-60 Hz network
or Ethernet network.
Find Quality Products Online at: sales@GlobalTestSupply.com
150 MHz virtual digital oscilloscopes II - 7
www.GlobalTestSupply.com
Page 8

Description of the Instrument
SPO
mtx 1052
Harmonic
analyser
Description of the instrument (contd.)
Presentation
This is a four-in-one instrument:
•
a traditional Oscilloscope with the FFT function for analysing
signals present in electronics and electrotechnical applications
•
an SPO Oscilloscope (Smart Persistence Oscilloscope) that
enables an analogue display to be reproduced and rare
phenomena displayed
•
a Harmonics Analyser to represent the fundamental and the first
31 harmonics of low-frequency signals (50-60 Hz network)
•
a Recorder, to capture unique or slow signals
Oscilloscope
mtx 1054
Recorder
display
The instrument works with a constant acquisition depth of 50,000 counts.
The principal control functions can be accessed directly on the PC control
panel. The adjustment parameters can be modified using the mouse.
Interfaces
This instrument comes with two interfaces:
•
ETHERNET for remote management of the instrument
••••
USB for programming the IP address or controlling the
instrument using SCPI commands.
Find Quality Products Online at: sales@GlobalTestSupply.com
II - 8 150 MHz virtual digital oscilloscopes
www.GlobalTestSupply.com
Page 9

Description of the Instrument
Description of the instrument (contd.)
Operation
"LOCAL" The instrument is directly connected to the control PC via an "Ethernet
"NETWORK" The instrument and control PC can be connected to the ETHERNET
Minimum PC
configuration
required
The instrument can operate in two modes:
twisted cable".
The PC controls one instrument at a time.
network with an untwisted Ethernet cable.
A different IP address must first be programmed on each instrument.
The SCOPEin@BOX software can be activated several times from the PC
to control several instruments at a time. By keeping one instrument
displayed on the PC screen and putting the other instruments as icons, all
the instruments can then be controlled in turn.
With the SCOPEin@BOX software, it is not possible to open an
instrument already open.
• Processor Pentium II or equivalent
• Memory 64 Mb
• Disk space 100 Mb
Installation of
SCOPEin@BOX
• Ports USB 1.1
• Ethernet Network Adapter 10BaseT
• Operating systems - Windows 98 - Millennium - 2000 - XP - Vista
The SCOPEin@BOX software operates with the NI-VISA V3.01
version: this version is included in the installation programme
supplied.
If a more recent version of NI-VISA is already installed on the PC, it
must first be uninstalled.
Please refer to the "First Installation" instructions that come with the
instrument.
Find Quality Products Online at: sales@GlobalTestSupply.com
150 MHz virtual digital oscilloscopes II - 9
www.GlobalTestSupply.com
Page 10
Description of the Instrument
Description of the instrument (contd.)
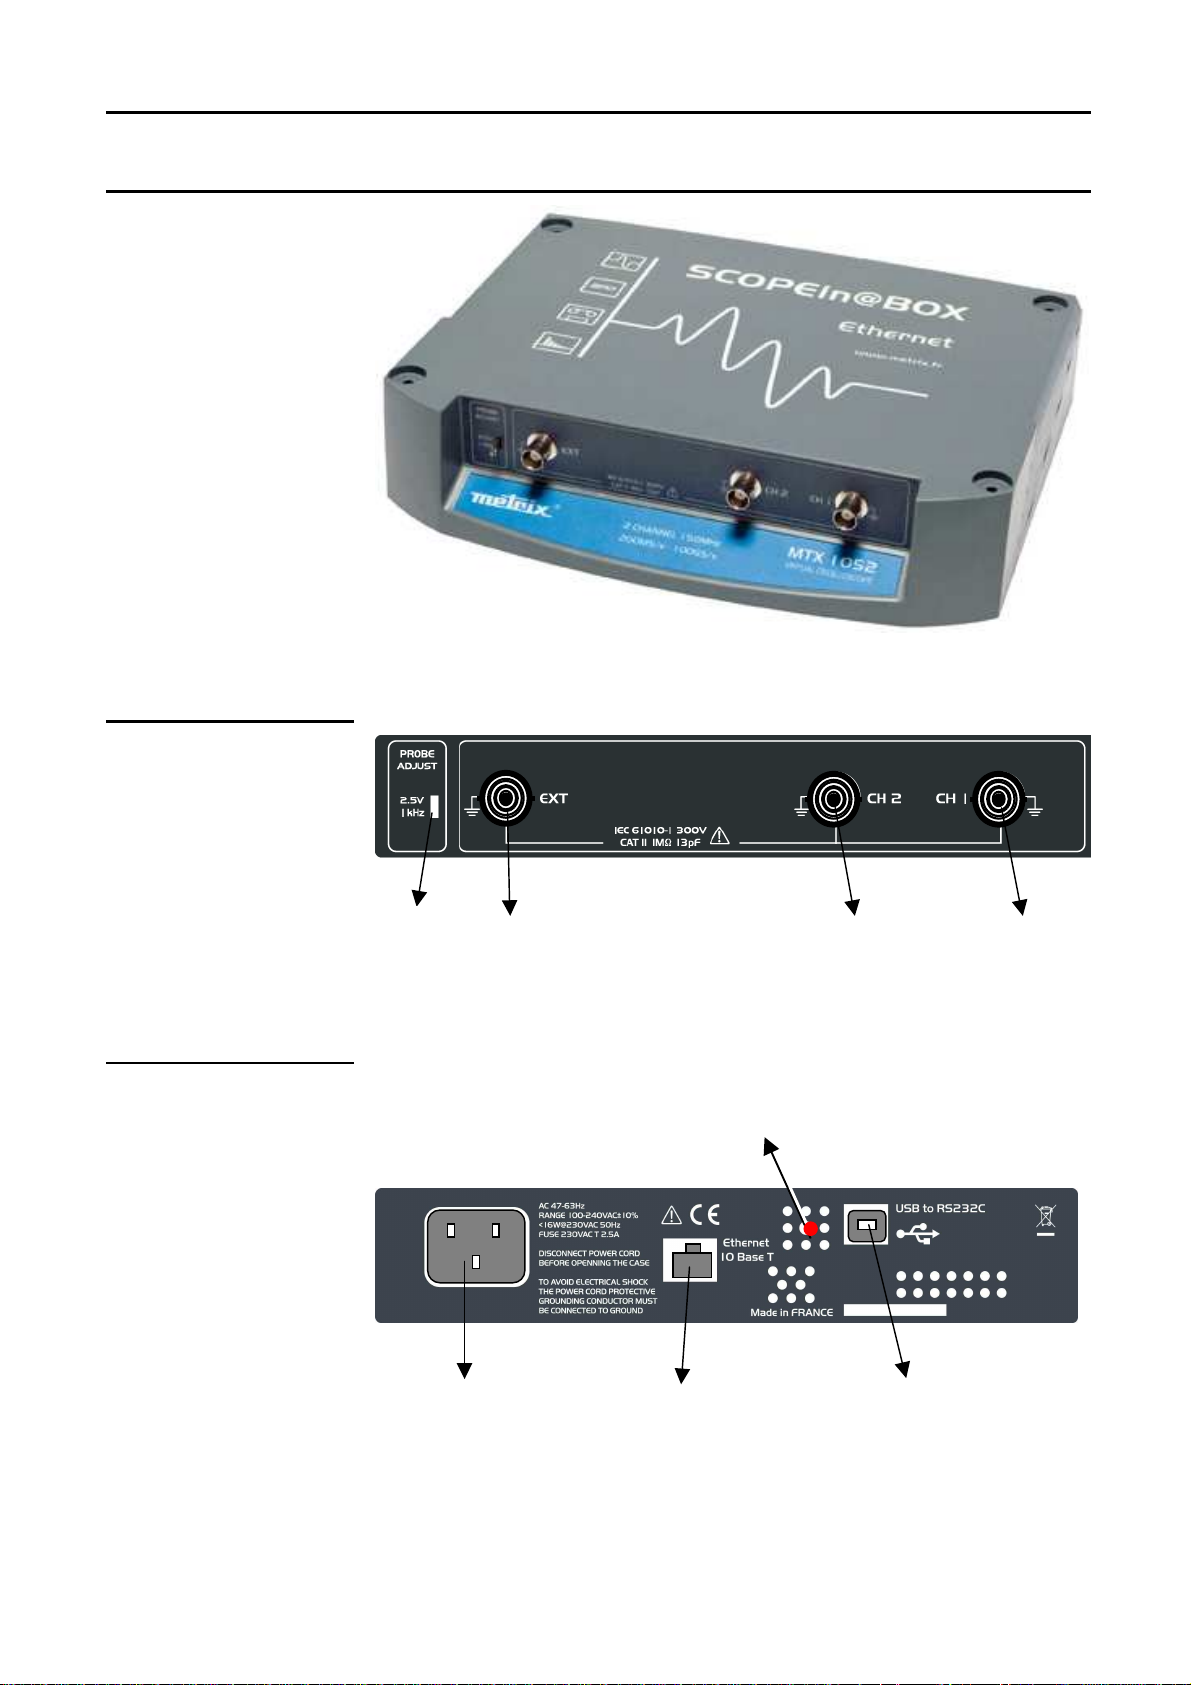
MTX 1052
General view
Terminal
(connection)
Rear panel
Calibrator
Signal input EXT Signal input CH2 Signal input CH1
output
A lit red LED indicates that the device is on.
Mains supply
RJ45 ETHERNET
connector
USB to RS232
interface connector
Find Quality Products Online at: sales@GlobalTestSupply.com
II - 10 150 MHz virtual digital oscilloscopes
www.GlobalTestSupply.com
Page 11

Description of the Instrument
CH1 signal
CH3 signal
CH2 signal
Description of the instrument (cont'd)
MTX 1054
General view
Terminal
(connection)
Rear panel
Calibrator
output
input
input
input
Ditto MTX 1052.
Ch1 signal
input
Find Quality Products Online at: sales@GlobalTestSupply.com
150 MHz virtual digital oscilloscopes II - 11
www.GlobalTestSupply.com
Page 12

Description of the Instrument
Host ID
Description of the instrument (contd.)
General principles
of the ETHERNET
ETHERNET and TCP/IP (Transmission Control Protocol/Internet Protocol)
are used to communicate on a company network.
network
Addressing Each piece of equipment under TCP/IP has a physical address (MAC
ADDRESS) and an Internet address (IP).
ETHERNET
physical address
A physical address or MAC ADDRESS, stored in the ROM, identifies each
piece of equipment on the network. The physical address enables the
equipment to determine the source of data "packet" transmission.
The physical address is a number coded over 6 bytes represented in
hexadecimal form.
Equipment manufacturers obtain physical addresses from the IEEE
organisation and assign them to the products manufactured in incremental
order. Each instrument has a unique MAC ADDRESS that cannot be
modified by the user.
IP address
An IP address is coded over 4 bytes, displayed in decimal format.
( Example: 132.147.250.10). Each field may be coded between 0 and
255 and is separated by a decimal point.
Unlike the physical address, the IP address can be modified by the user.
You must ensure that the IP address assigned to the instrument is
unique on your network. If an address is duplicated, network
operation becomes random.
The IP address is made up of two parts:
the network identifier (Network ID) for a given physical network
the host identifier (Host ID) identifying a specific item of equipment on the
same network.
There are 5 addressing classes. Only classes A, B and C are used to
identify the equipment. See below:
Class A
0XXXXXXX XXXXXXXX XXXXXXXX XXXXXXXX
Network ID Host ID
Class B
10XXXXXX XXXXXXXX XXXXXXXX XXXXXXXX
Nnetwork ID
Class C
110XXXXX XXXXXXXX XXXXXXXX XXXXXXXX
Network ID Host ID
Find Quality Products Online at: sales@GlobalTestSupply.com
II - 12 150 MHz virtual digital oscilloscopes
www.GlobalTestSupply.com
Page 13

Description of the Instrument
Description of the instrument (contd.)
FTP protocol
HTTP protocol
To communicate on the network, the equipment (oscilloscope, PC, printer)
must use a compatible IP address (identical Network ID field).
FTP (File Transfer Protocol) is used in the oscilloscope for fast file transfers to
or from a PC.
To use it, open the browser on the PC and, in the URL field, type the IP
address of the instrument, preceded by "ftp:"
Example: ftp://192.168.3.1
The oscilloscope is an FTP server.
With this protocol, the instrument can function as a Web server. You can
access the usual adjustments:
Display of traces on your PC via a browser (EXPLORER, NETSCAPE, …)
To use it, open the browser on the PC and, in the URL field, type the IP
address of the instrument, preceded by "http:"
Example: http://192.168.3.1
See §. Applications p. 133.
To be able to display the traces, you must install Java Virtual Machine JVM
SUN 1.4.2 (or higher) on your PC. This JVM can be downloaded from the
site:
http://java.sun.com/
).
Find Quality Products Online at: sales@GlobalTestSupply.com
150 MHz virtual digital oscilloscopes II - 13
www.GlobalTestSupply.com
Page 14

"Oscilloscope" Instrument
a.
Oscilloscope Instrument - Display
Display
Oscilloscope
Control Panel
All the oscilloscope functions can be accessed and parameters set via:
a. the drop-down menus
b. the tool bar
c. the setting boxes
d. the control buttons
b.
c.
d.
a. the drop-down
menus
b. the tool bar
1. 2. 3. 4. 5. 6. 7. 8. 9. 10. 11. 12. 13. 14. 15.
1.
Direct access to the oscilloscope
2.
Direct access to the display in SPO
3.
Direct access to the recorder
4.
Direct access to the harmonics analyser
5.
Direct access to the Trigger Parameters window
6.
Display of the grid
7.
Display of sensitivity, coupling and band limitation on the Trace windows
8.
Direct access to display of the XY trace
9.
Direct access to FFT representation
10.
Choice of the measurement reference
11.
Display of manual cursors
12.
Screenshot function, which freezes the reference traces on the screen
13.
Direct access to the print window
14.
Export to EXCEL
15.
Direct access to the operating instructions in .pdf format
Find Quality Products Online at: sales@GlobalTestSupply.com
III - 14 150 MHz virtual digital oscilloscopes
www.GlobalTestSupply.com
Page 15

Oscilloscope Instrument - Display
1.
"Oscilloscope" Instrument (contd.)
Oscilloscope
Control
c. the settings
boxes
2.
(contd.)
3.
1.
Vertical box
2.
Trigger box
3.
Horizontal box
Find Quality Products Online at: sales@GlobalTestSupply.com
150 MHz virtual digital oscilloscopes III - 15
www.GlobalTestSupply.com
Page 16

"Oscilloscope" Instrument (contd.)
Oscilloscope Instrument - Display
Oscilloscope
Control
Vertical box
Settings
Probe
(contd.)
CHx MATHx MEMx Channel selection
Probe Probe coefficient setting
Volt/div Selection of vertical sensitivity
Coupling Selection of input coupling
Position Setting for the trace vertical position
BWL Bandwidth limitation selection
Autoset CHx Vertical CHx autoset activation buttons
The offset multiplying coefficient of the probe assigns a multiplying
coefficient to the sensitivity of the channel in question.
The variation range is: 0 to 100 000.
The Volt/div channel vertical scale will be modified by the Probe value.
Ensure you reset the Probe coefficient value to 1 by disconnecting the
probe from the input.
Volt/div.
Input coupling AC blocks the DC component input signal and attenuates signals below
Vertical position
BWL
Vertical sensitivity: 15 calibres ranging from 2.5 mV / div. to 100 V / div.
10 Hz.
DC transmits the input signal to the DC and AC components.
GND internally, the instrument links the input of the channel selected at the
0 V reference level (with this coupling, the input impedance 1 MΩ //
13 pF is retained).
Variation range: ±10 div.
There are 4 possible bandwidth limitations for the vertical channel:
none, 15 MHz, 1.5 MHz and 5kHz.
BWL limits the bandwidth of the channel and its trigger circuit, attenuates
display noise and optimises triggering.
Autoset CHx
automatically adjusts vertical sensitivity to the signal present on CHx
channel input.
Find Quality Products Online at: sales@GlobalTestSupply.com
III - 16 150 MHz virtual digital oscilloscopes
www.GlobalTestSupply.com
Page 17

Oscilloscope Instrument - Display
"Oscilloscope" Instrument (contd.)
Trigger box
Settings
Auto Mode Automatic acquisition and refreshment, even in the
absence of a trigger event
Triggered Acquisition and refreshment of the screen for each
trigger event
Single stroke Acquisition of the signal and refreshment of the
screen on the first trigger after resetting of the trigger
by clicking on
Principal trigger trigger on edge
Pulse trigger on pulse width
Delay delayed trigger
Point trigger after point
TV trigger on video signal
Line trigger on mains supply
Sources selection of the trigger source.
CH1, CH2, CH3 or CH4 (MTX 1054)
CH1, CH2 or EXT (MTX 1052)
Edge selection of the + trigger edge
selection of the - trigger edge
Level trigger level in mV
AUTO LEVEL 50 % automatically adjusts the trigger level to 50% of the
peak-to-peak amplitude of the signal.
Horizontal box
Settings
d. the control
buttons
T/div Sweep coefficient or acquisition time base
H-pos Trigger Horizontal position of the trigger
activates a general AUTOSET
for each active trace) and displays them in an
adjoining window
signals
captures the current traces (transfer of 50,000 points
launches / stops RUN/STOP acquisition
activates the Fast Fourier Transform (FFT) of the
Find Quality Products Online at: sales@GlobalTestSupply.com
150 MHz virtual digital oscilloscopes III - 17
www.GlobalTestSupply.com
Page 18

"Oscilloscope" Instrument (contd.)
FFT box
(if the function is
activated)
Oscilloscope Instrument - Display
Settings
1.
2.
1. Vertical sensitivity of the graphic representation (10 dB/div if log
representation, depends on the sensitivity of the channel on a linear
scale)
2. Position of the origin of the traces in relation to the graphic
representation origin
Horizontal sensitivity of traces: directly linked
order to limit time signal discontinuity effects
to the time base of the time representation
Choice of window type for the FFT calculation in
Choice of vertical representation scale for the curve
If an autoset is carried out with the FFT window active, the
frequency scale will be automatically set so as to position the
fundamental on the first environment division.
Find Quality Products Online at: sales@GlobalTestSupply.com
III - 18 150 MHz virtual digital oscilloscopes
www.GlobalTestSupply.com
Page 19

Oscilloscope Instrument - Display
calculation of the
"Oscilloscope" Instrument (contd.)
FFT representation
(Fast FOURIER
Transform)
Real-time
FFT
Description The Fast Fourier Transform is calculated according to the equation:
Reminder: Activation by clicking on the button in the
Horizontal box or on the icon on the tool bar.
The Fast FOURIER Transform (FFT) is used to calculate the
discrete representation of a signal in the frequency domain, based on its
discrete representation in the time domain.
FFT can be used in the following applications:
• measurement of the different harmonics and the distortion of a signal,
• analysis of a pulse response,
• search for noise source in logic circuits.
The FFT is calculated over 2500 points.
The instrument simultaneously displays the FFT and the trace f(t).
N
1
−
2
X (k) =
1 2
N
x n j
* ( )*exp −
∑
N
n
=−
2
nk
π
N
for k ∈ [0 (N – 1) ]
with: x (n): a sample in the time domain
X (k): a sample in the frequency domain
N: resolution of the FFT
n: time index
k: frequency index
The displayed trace represents the amplitude in V or dB of the various
signal frequency components depending on the selected scale.
The DC component of the signal is removed by software.
Find Quality Products Online at: sales@GlobalTestSupply.com
150 MHz virtual digital oscilloscopes III - 19
www.GlobalTestSupply.com
Page 20

"Oscilloscope" Instrument (contd.)
The finite duration of the study interval results in a convolution in the signal
frequency domain with a function sinx/x.
This convolution modifies the graphic representation of the FFT because of
the lateral lobes characteristic of the sinx/x function (unless the study
interval contains an whole number of periods).
Oscilloscope Instrument - Display
Five types of weighting windows are offered:
•
Rectangular
•
Hamming
•
Hanning
•
Blackmann
•
Flattop
The following table enables the user to choose the type of window
according to the type of signal, the desired spectral resolution and the
amplitude measurement accuracy:
Frequency
resolution
the best
good
good
poor
poor
Window
Rectangular
Hamming
Hanning
Blackman
Flat Top
Type of signal
transient
random
random
random or
mixed
sine wave
Spectral
resolution
poor
reasonable reasonable - 42 dB
good
the best
good
Amplitude
accuracy
poor
reasonable - 32 dB
good
the best
Highest
lateral lobe
- 13 dB
- 74 db
- 93 dB
The following table gives the theoretical maximum amplitude error for each
type of window:
Window
Rectangular
Hamming
Hanning
Blackman
Flat Top
Theoretical max. error in dB
3.92
1.75
1.42
1.13
< 0.01
This error is linked to the calculation of FFT when there is not a whole
number of periods for the signal in the observation window.
Shannon's theorem must be observed, that is to say the sampling
frequency "Fe" must be more than twice the maximum frequency contained
in the signal.
If this condition is not met, spectrum folding phenomena are observed.
For example, if the sampling frequency "Fe" is too low, the following will
occur:
- Truncating of the spectrum beyond "Fe/2"
- Modification of the spectrum below "Fe/2" (due to the overlap of several
staggered spectra).
Find Quality Products Online at: sales@GlobalTestSupply.com
III - 20 150 MHz virtual digital oscilloscopes
www.GlobalTestSupply.com
Page 21

Oscilloscope Instrument - Display
on
Square signal of
amplitude 2.5 Vpp
"Oscilloscope" Instrument (contd.)
Signal injected
CH1:
frequency 10.0 kHz
FFT obtained with a
rectangular window
and a logarithmic
vertical scale
(10 dB/div.)
FFT units
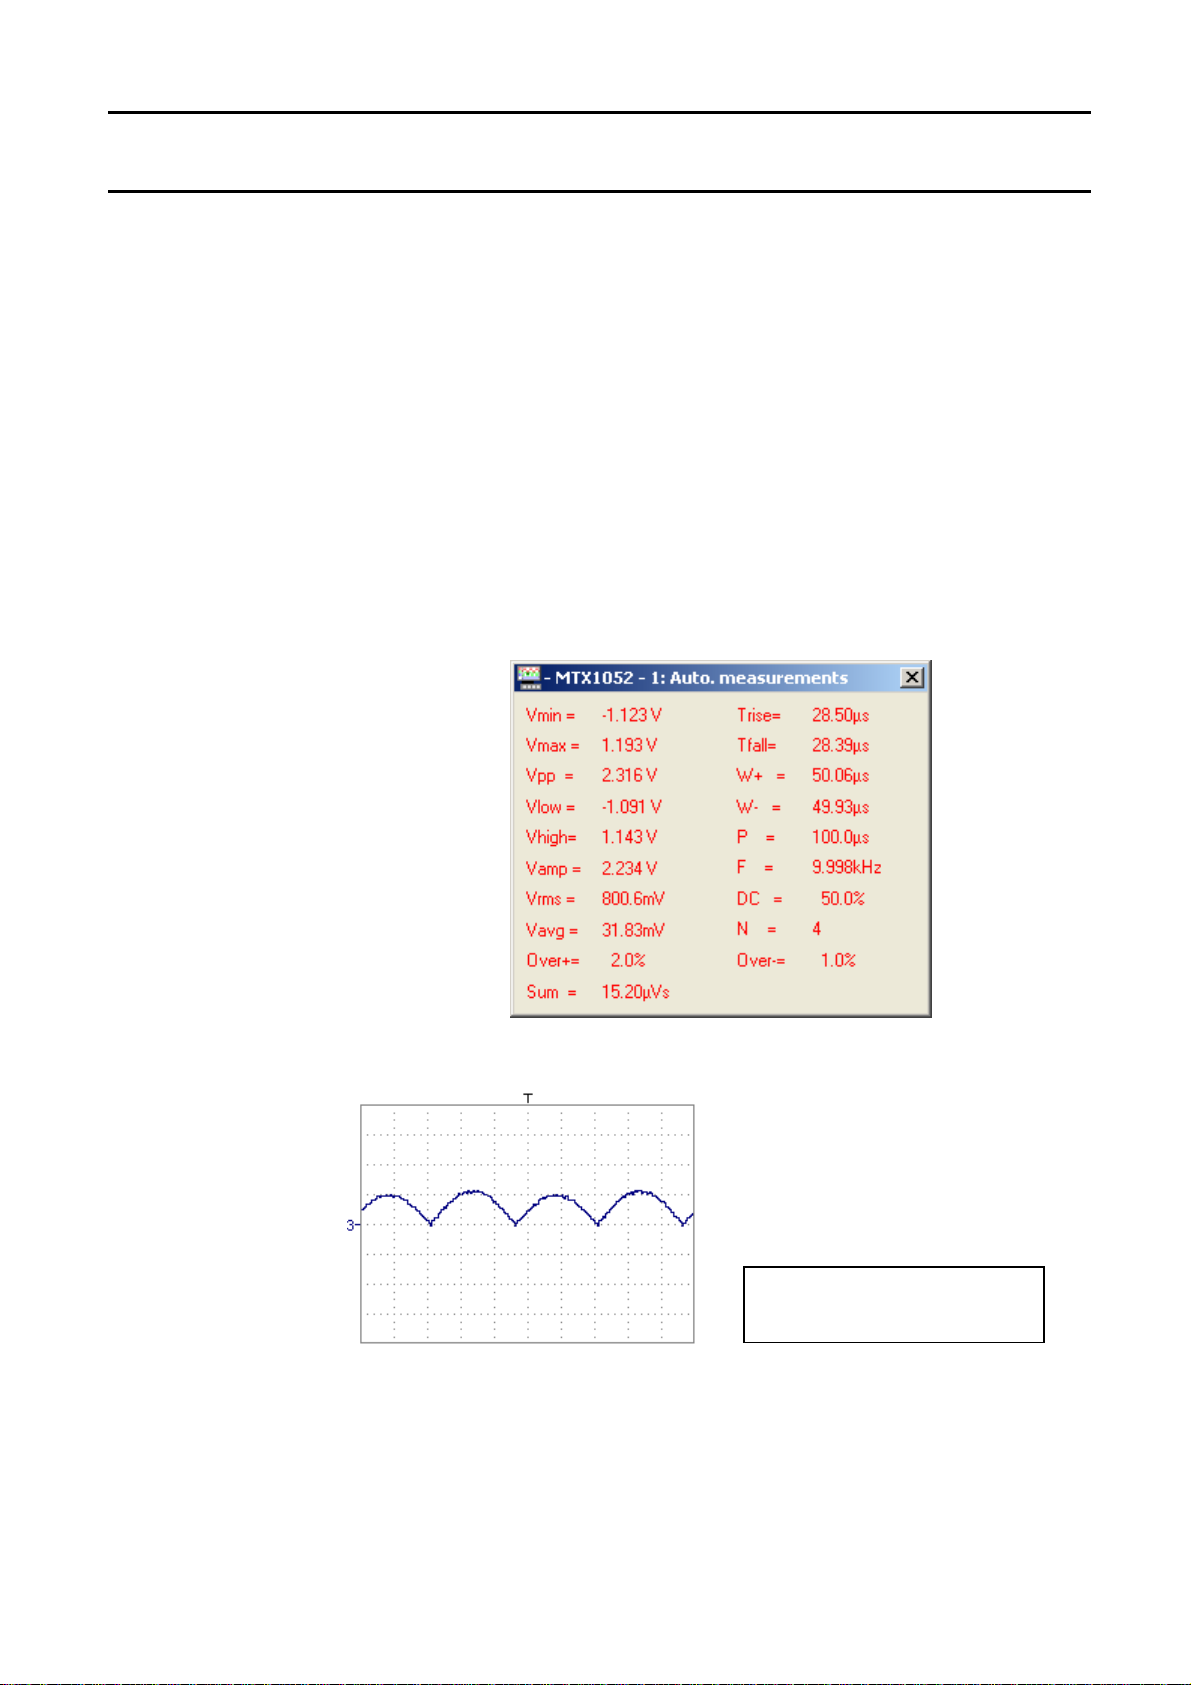
The frequency of the fundamental is 10.1 kHz and that of the harmonic
3 to 30.3 kHz and the difference of level between the fundamental and the
first harmonic is 9.56 dB (which corresponds to an amplitude of the 3rd
harmonic, equal to around 33% of that of the fundamental).
Horizontal unit: this is calculated from the sweep coefficient:
Unit (in Hz/div.) =
Vertical unit: 2 possibilities are offered:
12.5
sweep coefficient
Ex: = 6.25 kHz
12.5
2 ms
a) Linear scale: by checking the linear scale in the FFT box
in V/div. = unit of the signal in its time representation V/div.
b) Logarithmic scale: by checking the logarithmic scale
Find Quality Products Online at: sales@GlobalTestSupply.com
150 MHz virtual digital oscilloscopes III - 21
www.GlobalTestSupply.com
Page 22

"Oscilloscope" Instrument (contd.)
Oscilloscope Instrument - Display
Logarithmic scale
Logarithmic scale dB/div - Flat Top window:
the level 0 dB corresponds to a sine wave signal with an amplitude 1 Vrms.
We injected a sine wave signal with an amplitude 1 Veff and a frequency 50
kHz on the CH1 input of the oscilloscope; below is the FFT obtained with
the logarithmic and linear scales and a Flattop window:
Amplitude of the fundamental -0.204 dB frequency 50.6 kHz:
the vertical position indicator of the FFT representation is at -50 dB.
Linear scale
Find Quality Products Online at: sales@GlobalTestSupply.com
III - 22 150 MHz virtual digital oscilloscopes
Amplitude of the fundamental 1.40 V frequency 50.6 kHz
www.GlobalTestSupply.com
Page 23

Oscilloscope Instrument - Display
"Oscilloscope" Instrument (contd.)
Graphic
representation
The FFT representation indicates symmetry in relation to the frequency
origin; only positive frequencies are displayed.
•
The "• " symbol, appearing before one of the options indicates the scale
selected.
•
The (window) MAX can be automatically located by clicking on the
button opposite. Cursor 1 is therefore positioned on the MAX of the
representation on the screen when pressed.
•
The exact location of the MAX around the active cursor (± 25 div) is
obtained by clicking on the 2nd button opposite. The MAX search zone is
evidenced when the button is pressed by a black rectangle around the
cursor.
•
Manual measurement can be carried out on the frequency
representation with the "unattached cursors"
( §. Measurement Menu Unattached manual cursors.
To avoid distorting the spectral content of the signal and obtain the
most accurate calculation of the FFT, it is advisable to work with a
signal peak-to-peak amplitude of 3 to 7 div.
If the amplitude is too low, accuracy will be reduced, and if it is too high,
over 8 divisions, the signal will be distorted, leading to the appearance of
undesirable harmonics.
Simultaneous time and frequency representation of the signal facilitates
monitoring of changes in the signal amplitude.
Effects of under-sampling on frequency representation:
If the sampling frequency is not correctly adjusted (less than or twice the
maximum frequency of the signal to be measured), the high-frequency
components will be under-sampled and appear in the graphic
representation of the FFT by symmetry (aliasing).
•
The Autoset function enables the above phenomenon to be avoided and
the horizontal scale adapted to make the representation more readable.
•
The "Zoom" function is active in FFT.
Find Quality Products Online at: sales@GlobalTestSupply.com
150 MHz virtual digital oscilloscopes III - 23
www.GlobalTestSupply.com
Page 24

"Oscilloscope" Instrument (contd.)
Oscilloscope Instrument - Display
Rectangular
Hamming
Hanning
Blackman
Flat Top
Time representation
of signal to be
analyzed
Weighting window
In the calculation of the FFT, the type of window applied is selected with the
up/down scroll bars or by clicking on the Window field in the FFT box.
Before calculating the FFT, the oscilloscope weights the signal to be
analyzed by means of a window acting as a band-pass filter. The choice of
window type is essential to distinguish between the various lines of a signal
and to make accurate measurements.
Weighted signal
Frequency
representation of
signal calculated by
FFT
Find Quality Products Online at: sales@GlobalTestSupply.com
III - 24 150 MHz virtual digital oscilloscopes
www.GlobalTestSupply.com
Page 25

Oscilloscope Instrument - Display
7.
4.
3.
"Oscilloscope" Instrument (contd.)
Display
Oscilloscope Trace
Panel
Boxes displaying
the values of
manual measures
dt, dv 1/dt
(contd.)
Trace display box
1.
Display of sensitivity, coupling and channel bandwidth limit
2.
Position of the Trigger T
3.
Magnifying glass button: activation of the dynamic horizontal zoom
4.
Display of the trace time base
5.
Current status of acquisition
6.
Locking of the Trigger to avoid untimely movement with the mouse
7.
Find Quality Products Online at: sales@GlobalTestSupply.com
150 MHz virtual digital oscilloscopes III - 25
Position (0 V) of the channels
www.GlobalTestSupply.com
1. 1. (MTX 1054, only)
2.
5.
6.
Page 26
Oscilloscope Mode - The "Instrument" Menu
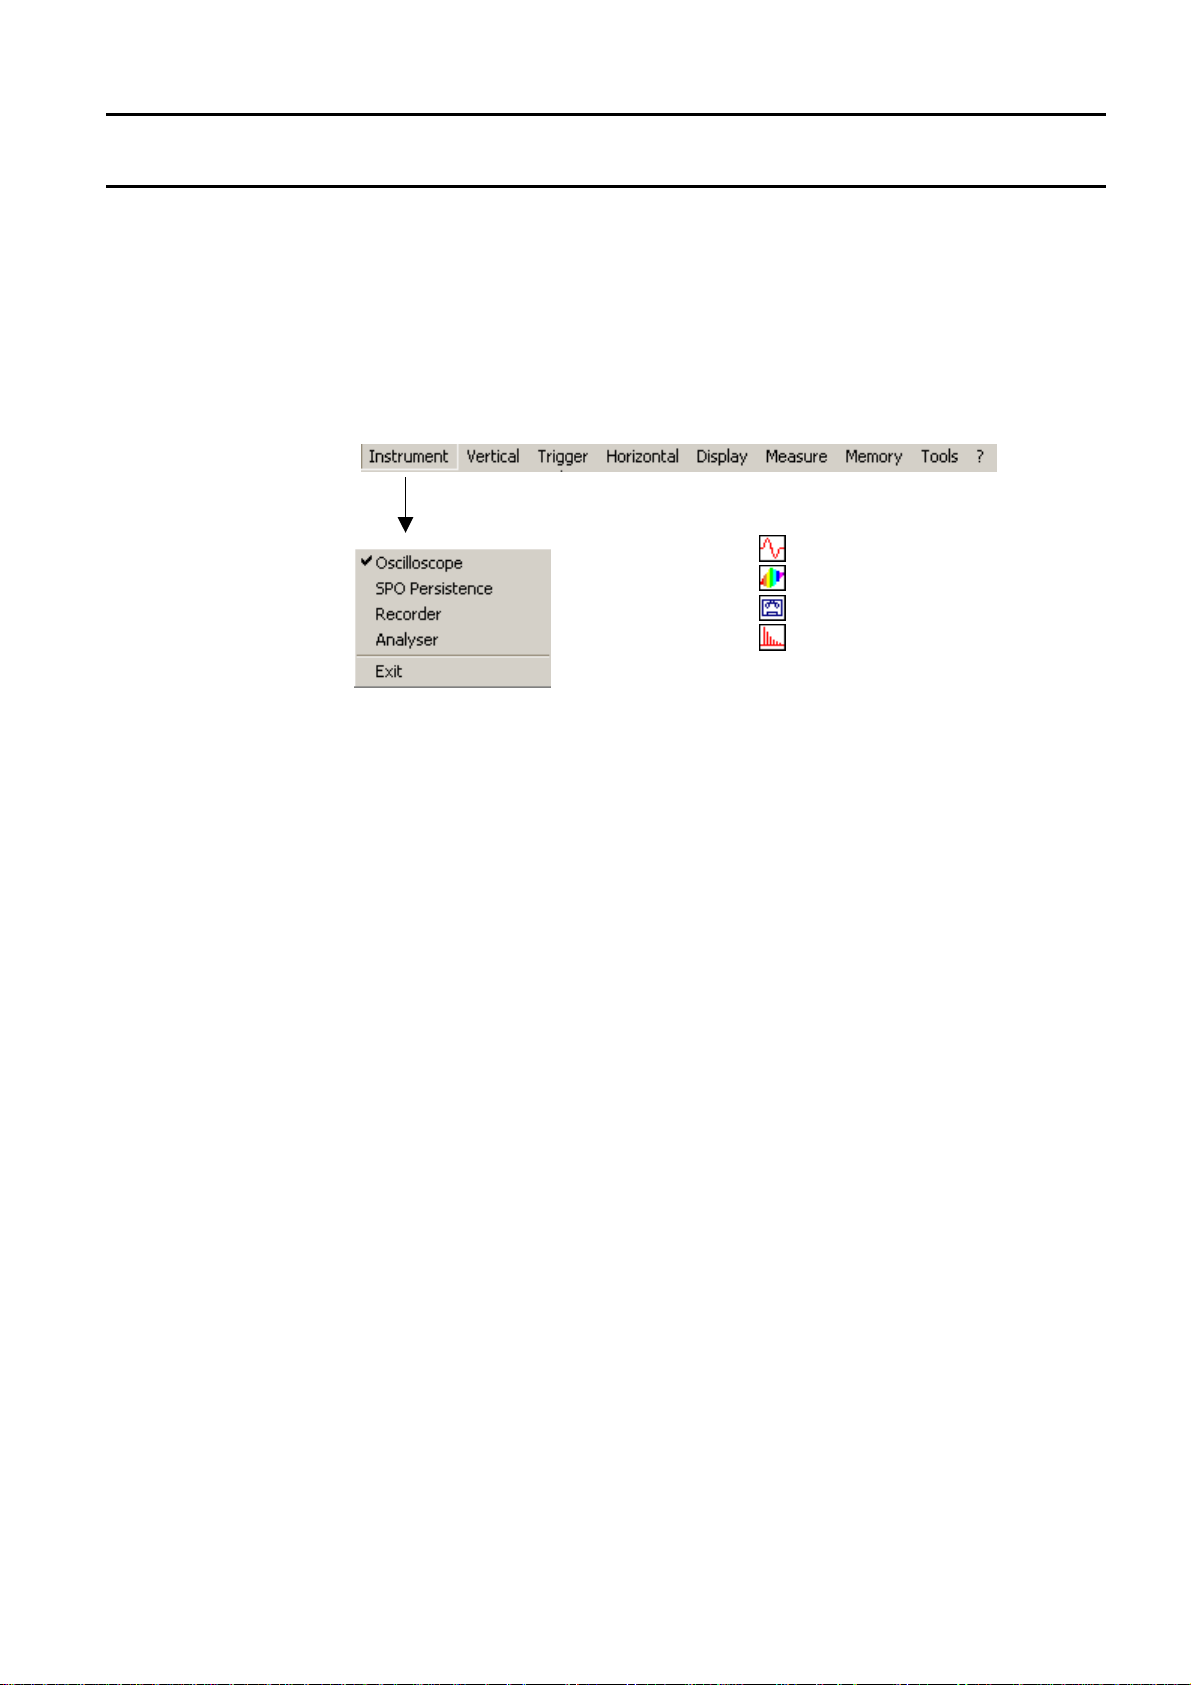
"Oscilloscope" Instrument (contd.)
The "Instrument"
menu
This menu:
•
• selects the instrument,
• •
• exits the application, saving the current operating
context.
corresponds to the on the tool bar
corresponds to the on the tool bar
corresponds to the on the tool bar
corresponds to the on the tool bar
Find Quality Products Online at: sales@GlobalTestSupply.com
III - 26 150 MHz virtual digital oscilloscopes
www.GlobalTestSupply.com
Page 27

Oscilloscope Mode - The "Vertical" menu
"Oscilloscope" Instrument (contd.)
The "Vertical"
menu
MTX 1054
MTX 1052
•
selects a vertical unit for each channel,
•
defines / activates the "MATHS" functions.
CH1 CH2 CH3 CH4
vertical unit
Math1 …2 …3 …4
inputs the measuring unit of the channel concerned. This unit can be encoded
using a maximum of 3 characters (e.g.: VAC …)
gives access to the window for definition of the mathematical functions that
can also be directly accessed from the "Vertical" box with a right click on the
CHx channel labels.
A mathematical function can be input by:
1.
automatic input, with the assistance of the predefined functions editor
2.
callup of a ".fct" function file from the FCT file management menu
3.
direct input of the function via the keyboard in the edit window
In all cases, the user can use the edit function manually (maximum of 100
characters).
erases the content of the input box.
Don't forget to check this box if you wish to display the result of this function
before confirming your choice with the OK button.
Whether or not the function is activated, its definition is memorised, even
when the instrument has been turned off, until replaced by a new expression.
cancels the window without modifying the initial definition of the function or its
possible activation.
makes a syntaxical, semantic analysis of the function input and closes the
window, activating or not activating the function if the box
Find Quality Products Online at: sales@GlobalTestSupply.com
150 MHz virtual digital oscilloscopes III - 27
is checked
www.GlobalTestSupply.com
Page 28

Oscilloscope Mode - The "Vertical" menu
"Oscilloscope" Instrument (contd.)
Function definition
1. Editing a
predefined function
The multiple-choice dialogue boxes help the user to define the elementary
functions on channels (channel inversion, addition, subtraction,
multiplication and division).
2. ".FCT" file
management
Once the elements have been selected, input is validated by pressing
and the elementary function desired is generated (with
automatic scaling management) in the input window.
Mathematical functions stored in ".FCT" extension files can be saved or
recalled.
To call up a function: click on and select the desired file from
the management window.
The function is selected with the mouse and it is loaded with
The mathematical function is then copied into the edit window.
Find Quality Products Online at: sales@GlobalTestSupply.com
III - 28 150 MHz virtual digital oscilloscopes
www.GlobalTestSupply.com
Page 29

Oscilloscope Mode - The "Vertical" menu
"Oscilloscope" Instrument (contd.)
Three examples
of mathematical
functions come with
the software
C1MULC2 .FCT
function
These functions, stored in the project FCT directory are:
•
C1MULC2.FCT
•
SQUARE.FCT
•
DAMPSINE.FCT
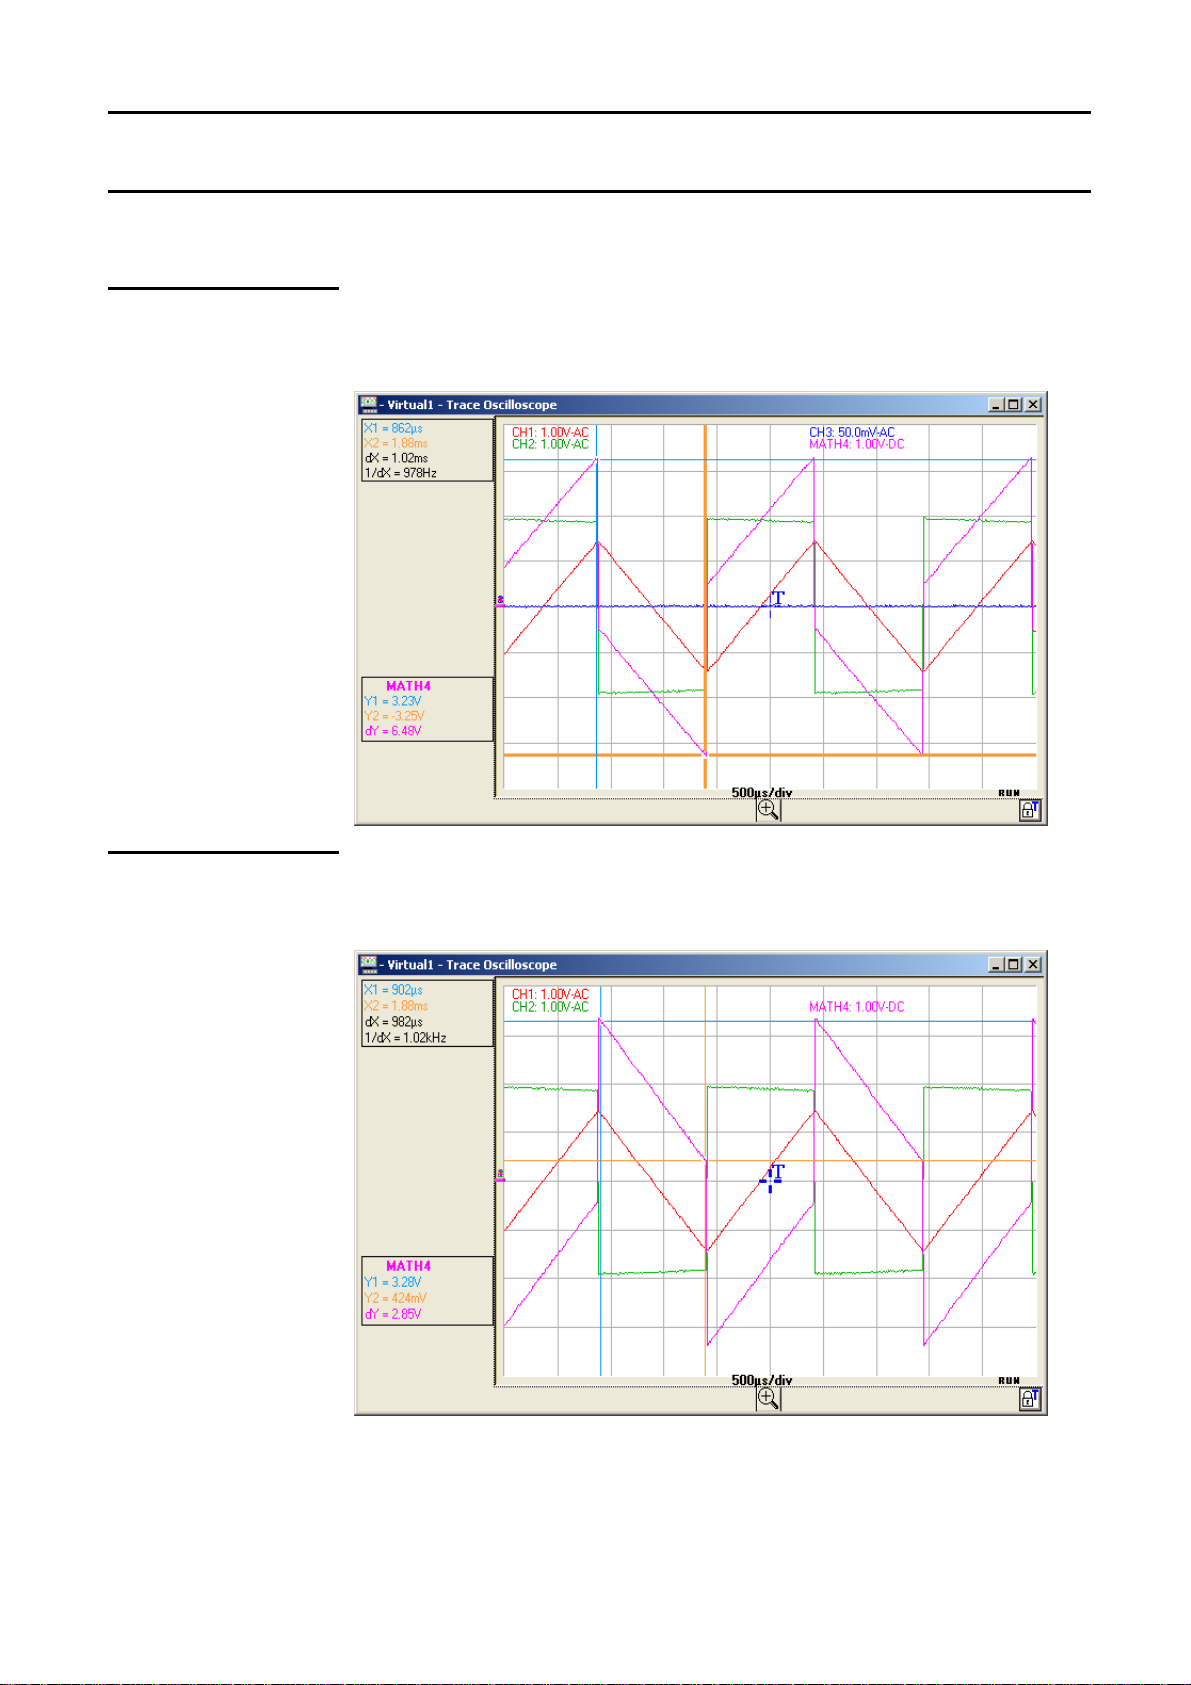
The C1MULC2.FCT = CH1*CH2/divv(4) calculates the product of 2 traces,
scaling the result so that it is framed in the screen.
The divv(4) factor is used to optimize the display as long as the source
signals have sufficient dynamics and no overshooting.
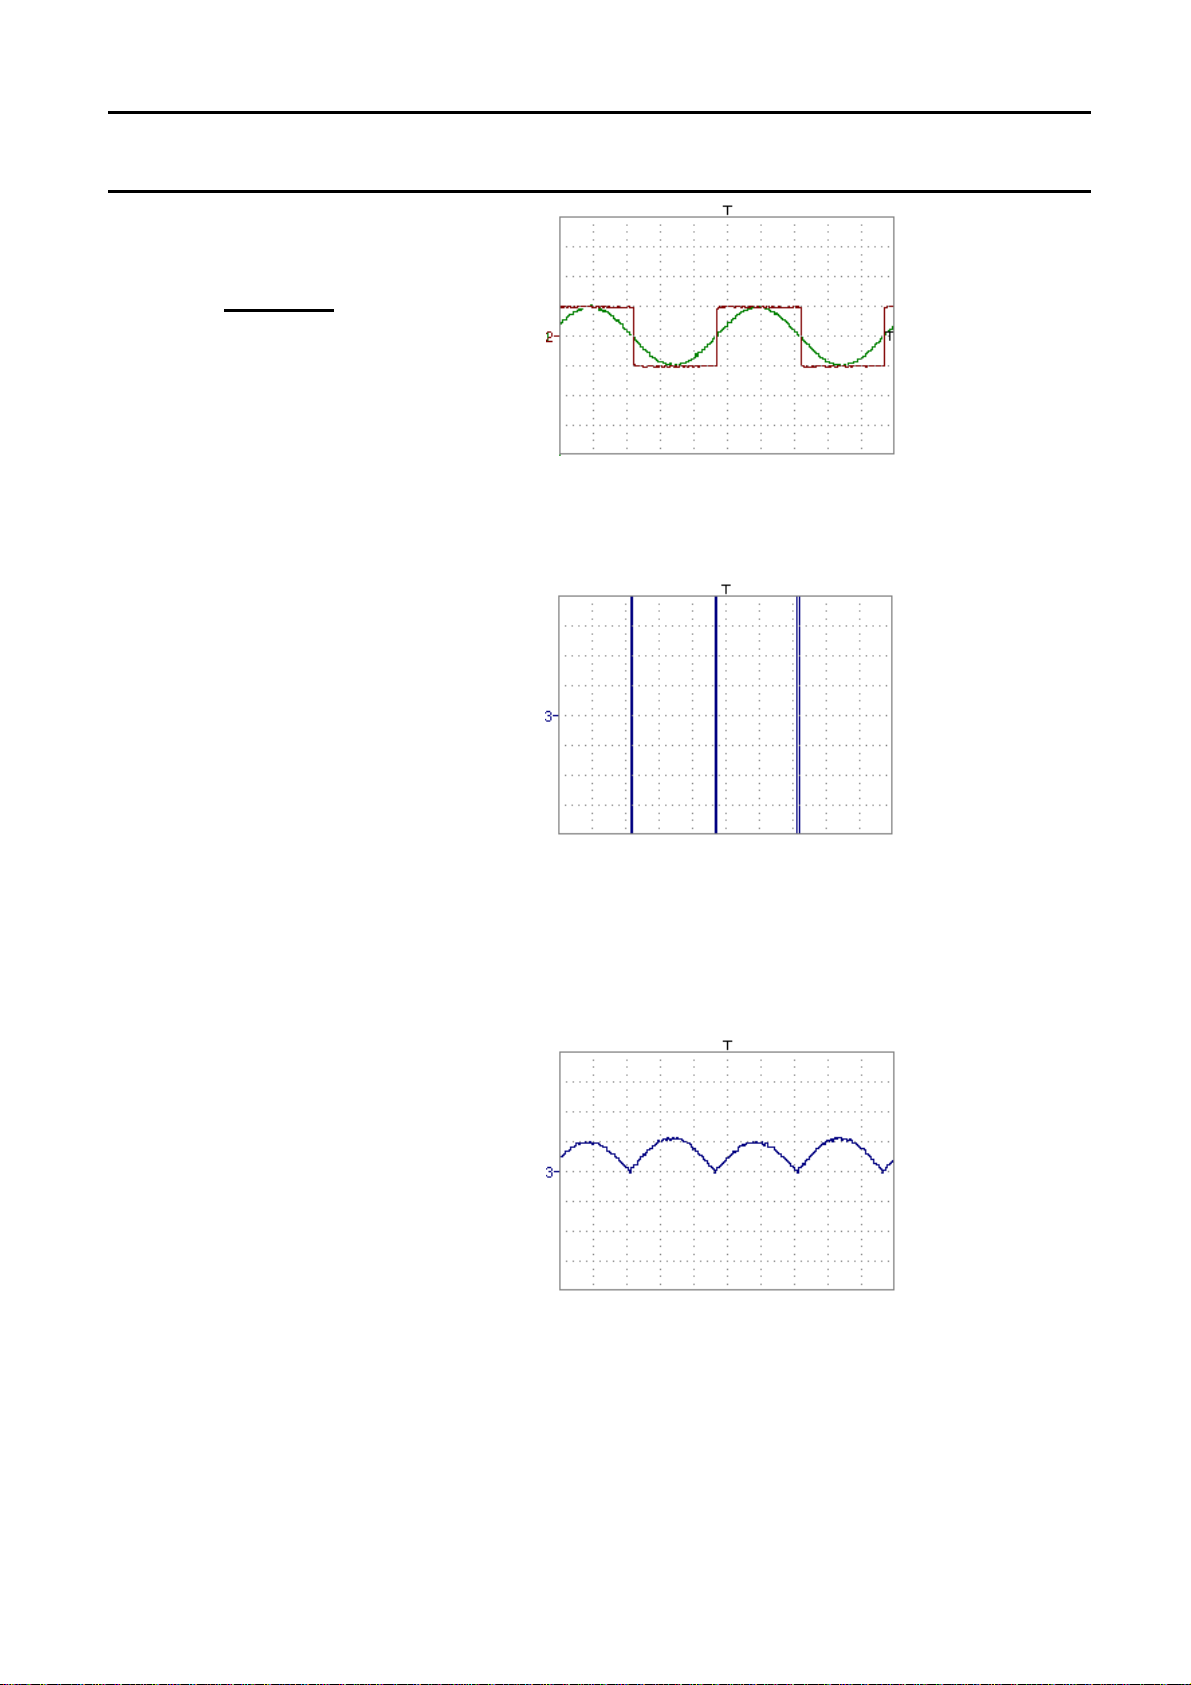
We have injected a square signal onto channel CH1 and a triangular signal
on channel CH2, centred on 0 Volts. We represent the result of the MATH3
= C1MULC2.FCT function on channel 3.
SQUARE.FCT
function
This is the definition of a square signal using the first 4 harmonics of a
Fourier series development.
math4 = SQUARE.FCT
math4 = (sin(pi*t/divh(2)) + sin(3*pi*t/divh(2))/3 + sin(5*pi*t/divh(2))/5
+ sin(7*pi*t/divh(2))/7)*divv(4)
Find Quality Products Online at: sales@GlobalTestSupply.com
150 MHz virtual digital oscilloscopes III - 29
www.GlobalTestSupply.com
Page 30

Oscilloscope Mode - The "Vertical" menu
"Oscilloscope" Instrument (contd.)
DAMPSINE.FCT
function
This is the definition of a damped sine wave.
3. Manual input
8 basic
mathematical
functions can be
linked to the traces
Math3 = sin (pi*t/divh(1))*exp(-t/divh(6))*divv(4)
This is an enhanced mode in which the user inputs the desired
mathematical function on the keyboard.
For information purposes, a list of the key words recognised by the
mathematical interpreter is available in the multiple-choice dialogue box.
These key words are basic functions recognised by the instrument’s
mathematical interpreter.
divh( (“horizontal division”)
divv( (“vertical division”)
step(
sin( (“sine”)
cos( (“cosine”)
exp( (“exponential”)
log( (“logarithmic”)
sqrt( (“square root”)
(“step”) using “t” (∗)
(∗) t = abscissa of the sample (point) in the 50,000-sample (points) depth
acquisition memory.
divh(1) is equivalent to 5,000 samples (points) = 1 horizontal division.
The result of the calculation of a function is always an LSB. To obtain a
vertical division deviation, 32,000 LSBs are needed (amplitudes are
calculated using a virtual 19 dynamic 8 div. virtual ADC).
divv(1) = 1 vertical division = 32,000 LSBs.
With certain mathematical formulae, the calculation time may be long
Find Quality Products Online at: sales@GlobalTestSupply.com
III - 30 150 MHz virtual digital oscilloscopes
and the application slowed down.
www.GlobalTestSupply.com
Page 31
Oscilloscope Mode - The "Vertical" menu
"Oscilloscope" Instrument (contd.)
Use of elementary
maths functions on
CH1 CH2 CH3 CH4
Examples
Sum of CH1 + CH2
Difference CH1 - CH2
CH1 red trace
CH2 green trace
MATH4 = ch1 + ch2 pink trace
CH1 red trace
CH2 green trace
MATH4 = ch1 - ch2 pink trace
Find Quality Products Online at: sales@GlobalTestSupply.com
150 MHz virtual digital oscilloscopes III - 31
www.GlobalTestSupply.com
Page 32

Oscilloscope Mode - The "Vertical" menu
"Oscilloscope" Instrument (contd.)
Product (CH1 * CH2
)
CH1 red trace
CH2 green trace
MATH4 = (ch1 * ch2) / divv(1) pink trace
Multiplication by divv(1) is necessary to translate the result of the
multiplication into divisions.
Division CH1 / CH2 CH1 red trace
CH2 green trace
MATH4 = (divv(1) * ch1) / ch2 pink trace
Division by divv(1) is necessary to translate the result of the division into
divisions.
Find Quality Products Online at: sales@GlobalTestSupply.com
III - 32 150 MHz virtual digital oscilloscopes
www.GlobalTestSupply.com
Page 33

Oscilloscope Mode - The "Vertical" menu
"Oscilloscope" Instrument (contd.)
Use of maths
functions
Examples
Divv() function
used on its own
Math3 = divv(3)
blue trace
The trace is equal to 3 vertical divisions.
divv(3) = 3 x 32,000 LSBs = 3 vertical divisions
Step() function
associated with a
trace
Math3 = ch1 * step (t - divh(4))
CH1 red trace
Math3 blue trace
Math2 is at 0 vertical divisions as long as t (time) is less than four horizontal
divisions.
Math3 is equal to CH1 when t (time) becomes greater than four horizontal
divisions.
To facilitate signal observation, a vertical difference of 1div. was introduced,
acting on the vertical position of channels CH1 and Math3.
Find Quality Products Online at: sales@GlobalTestSupply.com
150 MHz virtual digital oscilloscopes III - 33
www.GlobalTestSupply.com
Page 34

Oscilloscope Mode - The "Vertical" menu
"Oscilloscope" Instrument (contd.)
Math3 = ch1 * step (divh(4) - t)
CH1 red trace
Math3 blue trace
Math3 is equal to CH1 as long as t (time) is less than four horizontal
divisions.
Math3 is at 0 vertical divisions when t (time) becomes greater than four
horizontal divisions.
Find Quality Products Online at: sales@GlobalTestSupply.com
III - 34 150 MHz virtual digital oscilloscopes
www.GlobalTestSupply.com
Page 35
Oscilloscope Mode - The "Vertical" menu
"Oscilloscope" Instrument (contd.)
Appropriate use of the
operators for display
optimisation
Example 1
Vhigh ch1 = 1 vertical division => 1 x 32,000 LSBs = 32,000 LSBs
Vhigh ch2 = 1 vertical division => 1 x 32,000 LSBs = 32,000 LSBs
Multiplication of two
traces
math3 = ch1 * ch2
A considerable high and low overrun is noted.
Vhigh math3 = ch1 x ch2 = 1 vertical division x 1 vertical division
= 32,000 LSBs x 32,000 LSBs = 1024 106 LSBs
> (4 vertical divisions = 128,000 LSBs)
The function divv (vertical division) is necessary to optimise the display.
math3 = (ch1 * ch2) / divv(1)
Divv(1) can be used to divide by 32,000 (1 vertical division = 32,000 LSBs):
the result of the multiplication is translated into divisions on the screen.
If Vpp of ch1 and ch2 had been 8 vertical divisions, the multiplication
would have had to be divided by divv(4).
When mathematical functions associated with traces are used, the
dynamics of the result obtained must be verified.
Correction of the result of the operations by mathematical functions (divv(),
divvh(), / …) is recommended to optimize the screen display.
Find Quality Products Online at: sales@GlobalTestSupply.com
150 MHz virtual digital oscilloscopes III - 35
www.GlobalTestSupply.com
Page 36
Oscilloscope Mode - The "Vertical" menu
"Oscilloscope" Instrument (contd.)
For immediate interpretation of the results, configure the vertical
parameters of Math3.
In our example:
•
The multiplication of CH1 by CH2 involves the multiplication of volts by
volts, so the result is in square volts.
"div" of the measurement unit of math3 can be replaced by V2 (square
volts).
•
A vertical division represents 5 V x 5 V = 25 V² (vertical sensitivity of
CH1 x vertical sensitivity of CH2).
The coefficient of Math3 can be replaced by 25 to obtain the result of
the automatic math3 measurements immediately.
•
Then select math3 as the reference for the automatic and manual
measurements (see "MEASUREMENT" menu).
•
Then display the table of the 19 automatic measurements obtained on
the math3 trace (see "MEASUREMENT" menu):
•
The measurements displayed are the result of the multiplication of the
two CH1 and CH2 traces in the right unit (V2).
Math3 vertical scale = 25 V2
Vpp math3 = 25 V2
Find Quality Products Online at: sales@GlobalTestSupply.com
III - 36 150 MHz virtual digital oscilloscopes
www.GlobalTestSupply.com
Page 37

Oscilloscope Mode - The "Vertical" menu
"Oscilloscope" Instrument (contd.)
Association
of functions
Generation of a
sine wave using
the sin() function
Math3 = divv(3) * sin (2 * pi * t / 10 000) blue colour trace.
The trace obtained is a sine wave produced using the sin (sine) function,
according to its mathematical definition (2 x π x Frequency).
The amplitude is 6 divisions (divv(3) x 2 = 3 x 32,000 LSBs x 2).
The period equal to 10,000 samples (2 horizontal divisions) depends on the
time base.
The same trace can be obtained using the divh() function:
Math3 = divv(3) * sin (2 * pi * t / divh(2))
In this example, divh(2) is equivalent to 10,000 samples.
Note: 1 horizontal division = 5,000 samples
The value in seconds of the period T = divh(2) equal to 10,000 samples
(2 horizontal divisions) depends on the time base calibre
(in s/div.)
Find Quality Products Online at: sales@GlobalTestSupply.com
150 MHz virtual digital oscilloscopes III - 37
www.GlobalTestSupply.com
Page 38

Oscilloscope Mode - The "Vertical" menu
"Oscilloscope" Instrument (contd.)
Generation of a
sine wave by the
cos() function
Sine wave trace by the cos (cosine) function
Math3 = divv(3) * cos (2 * pi * t / divh(2)) blue colour trace
The trace obtained with the cos() function is dephased by 90° in relation to
the one obtained with the sin() function..
If the sine function is programmed on CH2 and the cosine function on CH3
and the dephasing between the 2 channels is measured, we can check this
result:
Find Quality Products Online at: sales@GlobalTestSupply.com
III - 38 150 MHz virtual digital oscilloscopes
www.GlobalTestSupply.com
Page 39

Oscilloscope Mode - The "Vertical" menu
damped sine wave
"Oscilloscope" Instrument (contd.)
The XY representation of these 2 traces will give a circle:
Generation of a
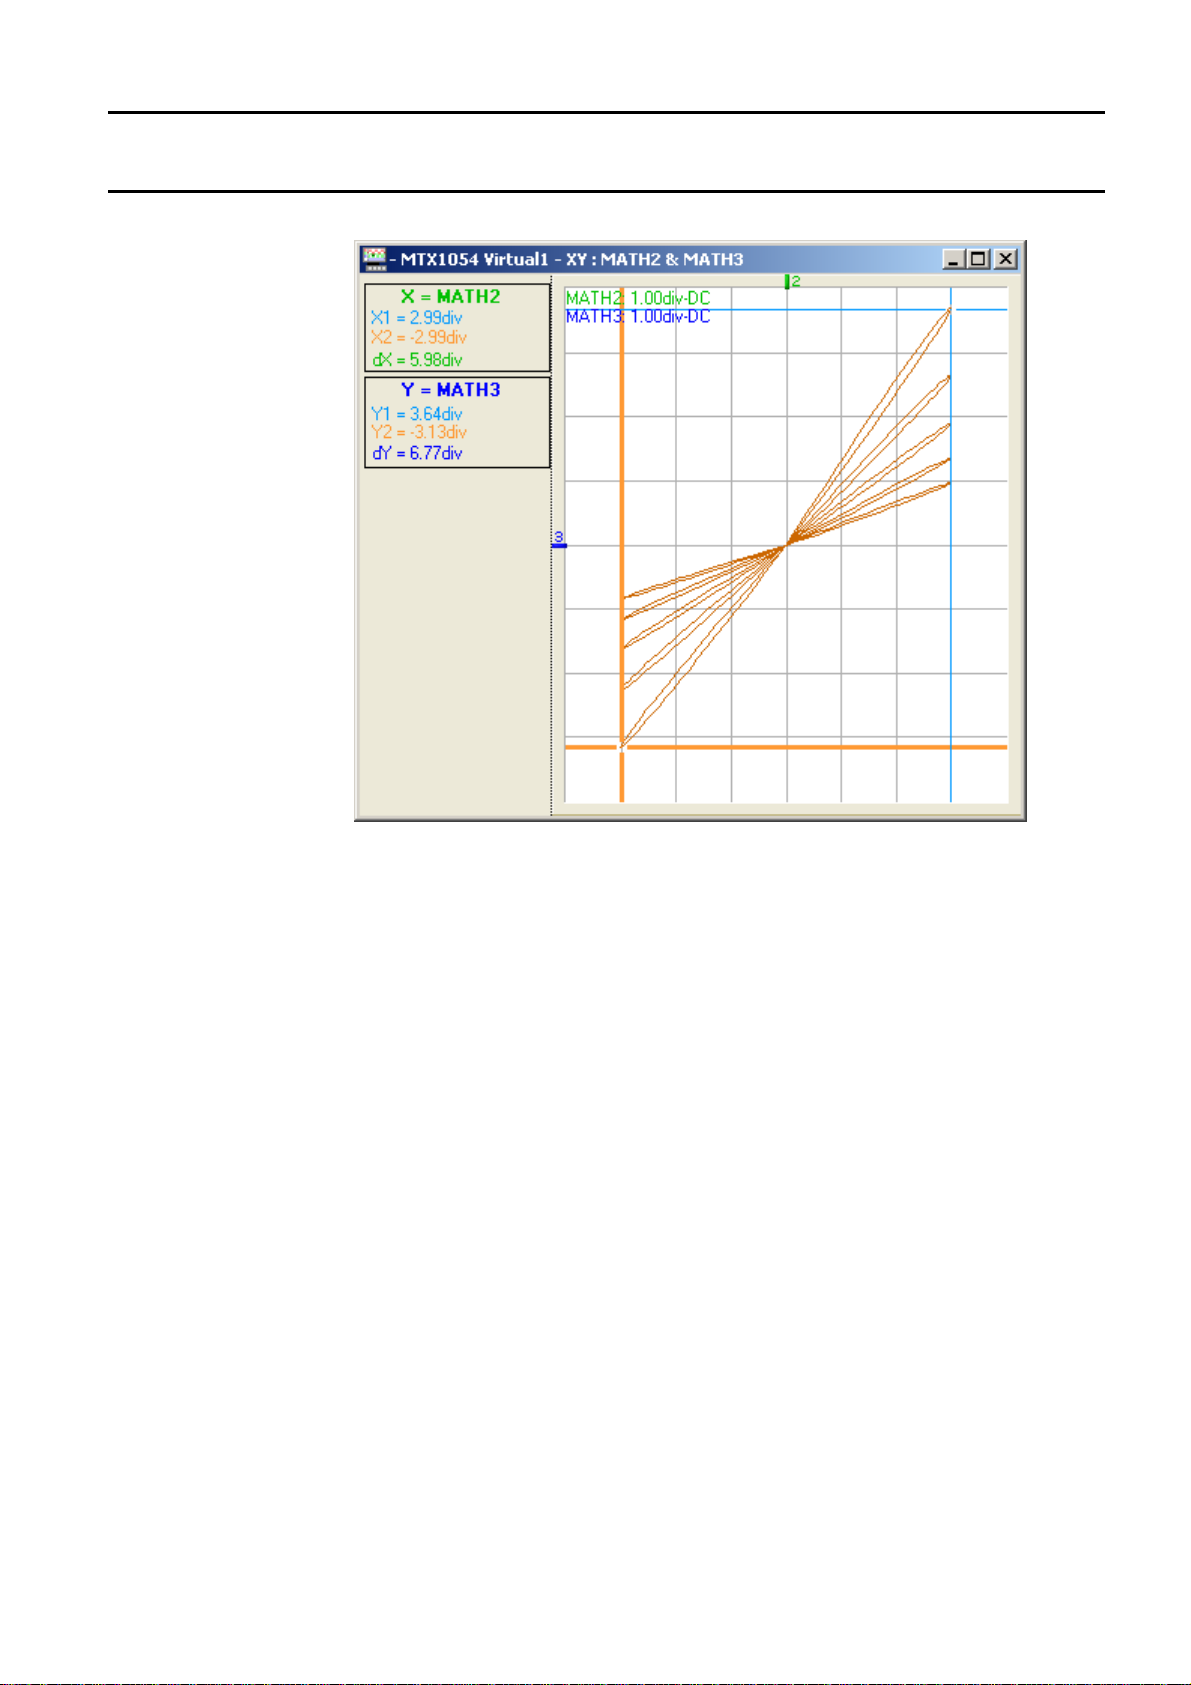
Math3 = sin (pi * t / divh(1)) * exp (-t / divh(6)) * divv(4) blue colour trace
sin (pi * t / divh(1)) defines the number of periods on the screen.
exp (-t / divh(6)) defines the damping level.
Note: exp (-t) is equal to:
exp(-5000) when you reach the first horizontal division.
exp(-50,000) when you reach the tenth horizontal division.
Find Quality Products Online at: sales@GlobalTestSupply.com
150 MHz virtual digital oscilloscopes III - 39
www.GlobalTestSupply.com
Page 40
Oscilloscope Mode - The "Vertical" menu
"Oscilloscope" Instrument (contd.)
In this case, the XY representation of the Math2 and Math3 traces gives:
Find Quality Products Online at: sales@GlobalTestSupply.com
III - 40 150 MHz virtual digital oscilloscopes
www.GlobalTestSupply.com
Page 41

Oscilloscope Instrument - The "Trigger" menu
"Oscilloscope" Instrument (contd.)
The "Trigger"
menu
(here MXT 1054)
Find Quality Products Online at: sales@GlobalTestSupply.com
150 MHz virtual digital oscilloscopes III - 41
Direct access to the Trigger menu with the icon opposite.
www.GlobalTestSupply.com
Page 42

"Oscilloscope" Instrument (contd.)
Oscilloscope Instrument - The "Trigger" menu
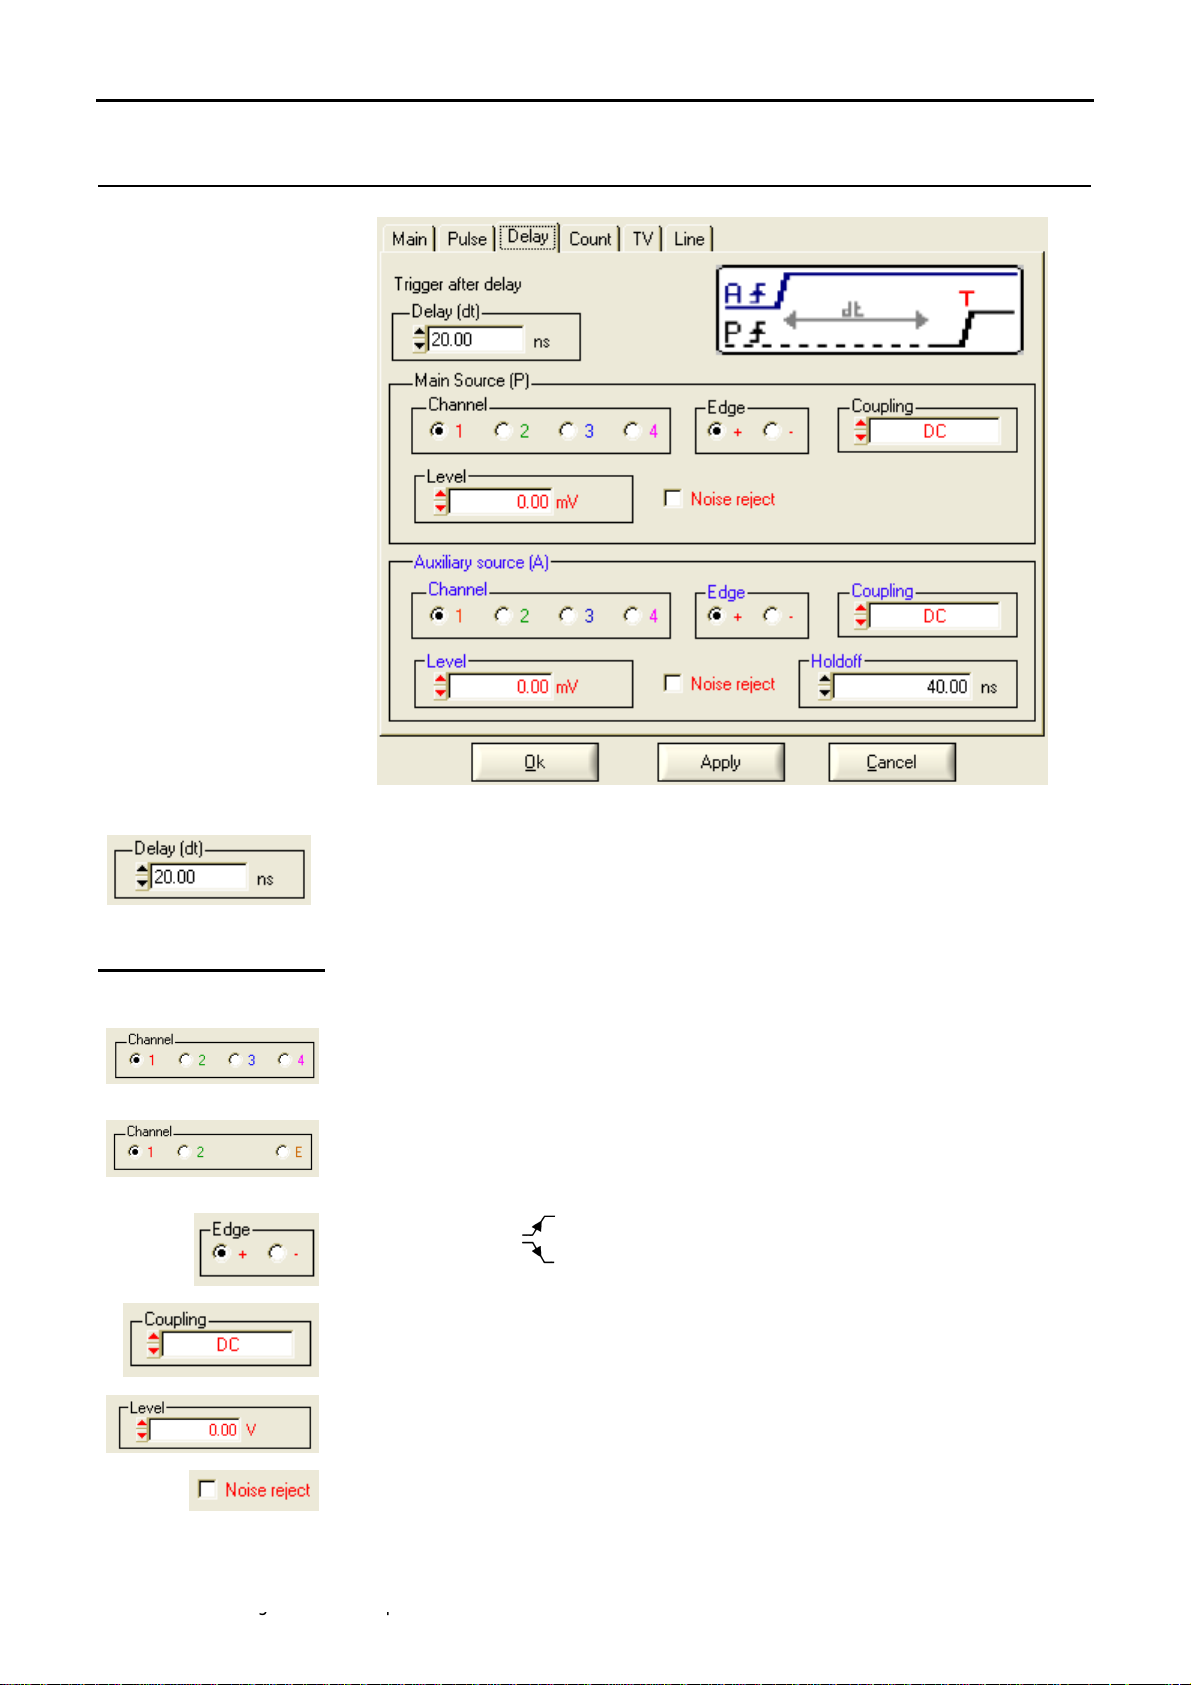
Definition
The instrument has "advanced trigger" capability.
• The "Delay" and "Count" trigger modes require parameterization of a
second "auxiliary" trigger source. The auxiliary source may be the same
as the main source.
The trigger choice is validated by exiting from the menu with OK.
If …
… the user exits from the Main tab
… the user exits from the Pulse tab he is in Pulse trigger mode.
etc.
Then …
he is in Main trigger mode.
etc.
• There is only one Holdoff, although it can be programmed from the Main,
Delay, Count, TV and Line tabs.
When Delay or Count is being used, the Holdoff applies the auxiliary
source.
In the other cases, Holdoff applies to the main trigger source.
• Each trigger source has its own specific attributes: Coupling, Level,
Edge, Noise Reject, Filter
Trigger parameters 6 trigger modes: Main
Pulse
Delay
Count
TV
Line
each one can be accessed via a tab in the "Trigger parameters" window.
Find Quality Products Online at: sales@GlobalTestSupply.com
III - 42 150 MHz virtual digital oscilloscopes
www.GlobalTestSupply.com
Page 43

Oscilloscope Instrument - The "Trigger" menu
"Oscilloscope" Instrument (contd.)
Trigger on
MAIN edge
MTX 1054: Choice of main source: channel 1, 2, 3 or 4
MTX 1052: Choice of main source: channel 1, 2 or Ext
+ rising trigger slope
- falling trigger slope
AC - DC - LF reject - HF reject
The trigger symbol takes on the colour of the active trigger channel. The
active coupling of the trigger channel is indicated beside the Trigger symbol
in the "Oscilloscope Trace" window.
AC
TAC symbol
AC coupling (10 Hz to 200 MHz):
blocks the DC component of the signal.
DC
LF Reject
HF Reject
Find Quality Products Online at: sales@GlobalTestSupply.com
150 MHz virtual digital oscilloscopes III - 43
T symbol
DC coupling (0 to 200 MHz):
allows the entire signal through
T
LF
symbol
Reject of source signal frequencies < 10 kHz
facilitates observation of signals with a DC component or an
unwanted low frequency
THF symbol
Rejection of source signal frequencies > 10 kHz:
facilitates observation of slow signals with high-frequency noise
www.GlobalTestSupply.com
Page 44

"Oscilloscope" Instrument (contd.)
adjusts the trigger level by moving the scrollbar with the mouse or directly
entering the value with the keyboard. The variation range is ± 8 vertical
divs.
No Hysteresis ≈ 0.6 div.
Yes Hysteresis ≈ 1.5 div.
Variation range: from 40.00 ns to 10.5 s
disables the trigger for a predefined period
stabilises the trigger on pulse trains.
When adjustment is finished, clicking on the button:
applies the new trigger parameters by exiting the window
applies the new parameters without exiting the window
exits the window without applying the new parameters
Oscilloscope Instrument - The "Trigger" menu
Example
Signal injected on CH1: trains of 4 sine wave signals with a frequency of
4 kHz and amplitude 2.5 Vcc with no DC component, separated by 1 ms.
Oscilloscope adjustment:
- Vertical sensitivity: 0.5 V/div.
- Time base: 500 µs/div.
- Trigger source: channel 1
- Trigger level: 0.250 V
- Edge: rising
The Holdoff stabilises the signal by inhibiting the trigger for a value of
between 2.8 ms and 3.8 ms (e.g. Holdoff = 3 ms).
Find Quality Products Online at: sales@GlobalTestSupply.com
III - 44 150 MHz virtual digital oscilloscopes
www.GlobalTestSupply.com
Page 45

Oscilloscope Instrument - The "Trigger" menu
"Oscilloscope" Instrument (contd.)
Trigger on
PULSE
Selection of pulse-width trigger.
In all cases, the effective trigger occurs on the pulse trailing edge.
< triggers on a pulse if its width is less than the value set
= triggers on a pulse if its width is equal to the value set
> triggers on a pulse if its width is greater than the value set
The pulse width is defined by the crossing of the signal with the
vertical Trigger level
MTX 1054: Choice of main source: channel 1, 2, 3 or 4
MTX 1052: Choice of main source: channel 1, 2 or Ext
Pulse type: + positive or - negative
The choice of the edge + (rising) or- (falling) defines the pulse polarity:
edge + defines a positive pulse between and
edge - defines a negative pulse between and
Filters the trigger channel: AC - DC - LF reject - HF reject
Variation range: ±8 div.
Trigger sensitivity changes from ≈ 0.6 div. to ≈ 1.5 div.
Variation range: from 40.00 ns to 10.5 s
if pulse > = < the value specified (variation
Find Quality Products Online at: sales@GlobalTestSupply.com
150 MHz virtual digital oscilloscopes III - 45
www.GlobalTestSupply.com
range from 20.00 ns to 10.5 s,
our example: 20.00 ns)
Page 46
"Oscilloscope" Instrument (contd.)
Oscilloscope Instrument - The "Trigger" menu
Example
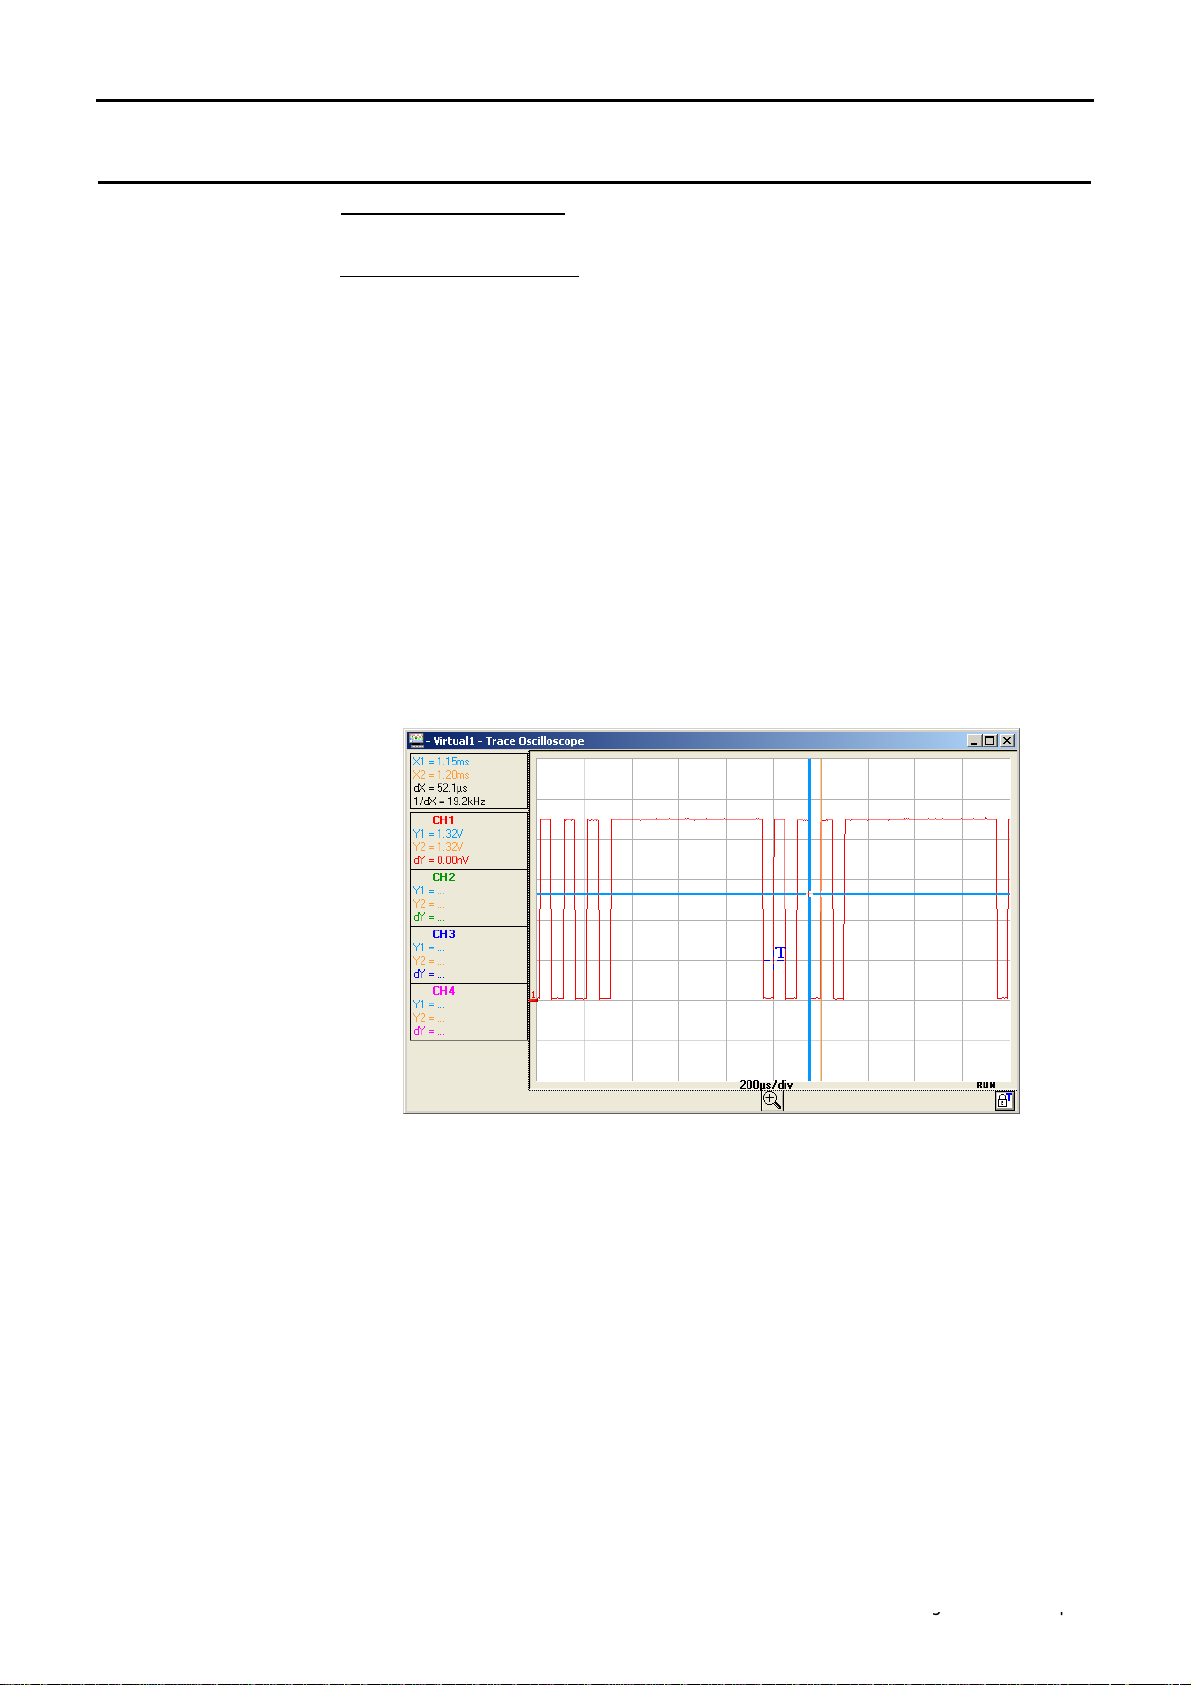
Signal injected on CH1: trains of 4 negative pulses with amplitude 2.25 Vcc,
no DC component, and a frequency of 10 kHz, separated by 500 µs.
Oscilloscope adjustment:
- Vertical sensitivity: 0.5 V/div.
- Time base: 200 µs/div.
- Trigger mode: Pulse
- Trigger source. : CH 1
- Trigger level: : 0.5 V
- Trigger on pulse: negative
- Trigger condition : "if the pulse width is < 50.05 µs"
The oscilloscope is triggered when the negative pulse width is less than the
specified pulse width (50.05 µs + tolerance).
Measurement of the negative pulse width is triggered on the falling edge
and the trigger is effective on the rising edge, if the pulse width meets the
comparison criterion chosen.
Find Quality Products Online at: sales@GlobalTestSupply.com
III - 46 150 MHz virtual digital oscilloscopes
www.GlobalTestSupply.com
Page 47
Oscilloscope Instrument - The "Trigger" menu
"Oscilloscope" Instrument (contd.)
Trigger with
DELAY
Main source
Selection of edge trigger with delay
The delay is triggered by the auxiliary source.
Effective triggering occurs after the end of the delay on the next event from
the main source.
MTX 1054: Trigger source: channel 1, 2, 3 or 4
MTX 1052: Trigger source: channel 1, 2 or Ext
+ for rising edge
- for falling edge
AC - DC - LF reject - HF reject
Variation range: ±8 div.
Trigger sensitivity changes from: ≈ 0.6 div. to ≈ 1.5 div.
Find Quality Products Online at: sales@GlobalTestSupply.com
150 MHz virtual digital oscilloscopes III - 47
www.GlobalTestSupply.com
Page 48

"Oscilloscope" Instrument (contd.)
Oscilloscope Instrument - The "Trigger" menu
Auxiliary source
Example
MTX 1054: Trigger source: channel 1, 2, 3 or 4
MTX 1052: Trigger source: channel 1, 2 or Ext
Trigger edge: + or -
AC - DC - LF reject - HF reject
Variation range: ±8 div.
Trigger sensitivity changes from: ≈ 0.6 div. to ≈ 1.5 div.
Variation range: from 40.00 ns to 10.5 s
If the same source is selected for main and auxiliary trigger, the level,
edge, coupling and noise reject have the same values.
Signal injected on CH1: trains of 4 pulses with amplitude 2.25 Vcc and a
frequency of 10 kHz, separated by 600 µs.
Oscilloscope adjustment:
- Vertical sensitivity: 0.5 V/div.
- Time base: 200 µs/div.
- Trigger mode: Delay
- Main channel: CH1
- Auxiliary channel: CH 1
- Trigger level: 0.5 V
- Trigger condition: 1st rising edge of the main source (CH1) occurring
after the first rising edge of the auxiliary source
(CH1)and a delay of 90 µs
The trigger is active after the end of the delay (90.0 µs) on the first ascending
edge.
The oscilloscope therefore triggers on the 2nd rising edge of the signal
since the delay in relation to the 1st rising edge is 100 µs.
Find Quality Products Online at: sales@GlobalTestSupply.com
III - 48 150 MHz virtual digital oscilloscopes
www.GlobalTestSupply.com
Page 49

Oscilloscope Instrument - The "Trigger" menu
Trigger with
"Oscilloscope" Instrument (contd.)
COUNT
Main source
Selects the edge trigger with counting of events.
Events are counted on the main source and this is triggered by the auxiliary
source.
The trigger position is situated after the end of the count on the next trigger
event from the main source.
The symbolic representation of counting mode corresponds to a series of
positive edges.
Range from 2 to 16,384
MTX 1054: Trigger source: channel 1, 2, 3 or 4
MTX 1052: Trigger source: channel 1, 2 or Ext
Trigger edge: + -
AC - DC - LF reject - HF reject
Variation range: ± 8 div.
Trigger sensitivity changes from: ≈ 0.6 div. to ≈ 1.5 div.
Find Quality Products Online at: sales@GlobalTestSupply.com
150 MHz virtual digital oscilloscopes III - 49
www.GlobalTestSupply.com
Page 50

"Oscilloscope" Instrument (contd.)
Oscilloscope Instrument - The "Trigger" menu
Auxiliary source
Example
MTX 1054: Trigger source: channel 1, 2, 3 or 4
MTX 1052: Trigger source: channel 1, 2 or Ext
Trigger edge: + -
AC - DC - LF reject - HF reject
Variation range: ± 8 div.
Trigger sensitivity changes from: ≈ 0.6 div. to ≈ 1.5 div.
Variation range: from 40.00 ns to 10.5 s
Signal injected on CH1: trains of 4 pulses with amplitude 2.25 Vcc and a
frequency of 10 kHz, separated by 600 µs.
Oscilloscope programming:
- Vertical sensitivity: 0.5 V/div.
- Time base: 200 µs/div.
- Trigger mode: Count
- Main trigger source: CH 1
- Auxiliary trigger source: CH1
- Number of events: 3
Trigger occurs on the 4th rising edge of the signal (the 1st rising edge on the
auxiliary channel triggers counting, the oscilloscope counts 3 rising edges
on the main channel and acquisition is then triggered).
Find Quality Products Online at: sales@GlobalTestSupply.com
III - 50 150 MHz virtual digital oscilloscopes
www.GlobalTestSupply.com
Page 51

Oscilloscope Instrument - The "Trigger" menu
"Oscilloscope" Instrument (contd.)
Trigger on
TV
Trigger on a specific line number. The trigger position corresponds to the
edge before line synchronisation go-ahead.
• 625 lines (SECAM or PAL)
• 525 lines (NTSC)
The symbolic representation of TV trigger corresponds to a positive video
signal.
MTX 1054: Trigger source: channel 1, 2, 3 or 4
MTX 1052: Trigger source: channel 1, 2 or Ext
Video signal polarity: + positive or - negative
+ Direct video
- Reverse video
Variation range: from 40.00 ns to 10.5 s
Standard 625 or 525 lines (PAL/SECAM, NTSC)
Line N°: from 0 to 525 or 625 depending on the stan dard
Find Quality Products Online at: sales@GlobalTestSupply.com
150 MHz virtual digital oscilloscopes III - 51
www.GlobalTestSupply.com
Page 52
"Oscilloscope" Instrument (contd.)
Oscilloscope Instrument - The "Trigger" menu
Example
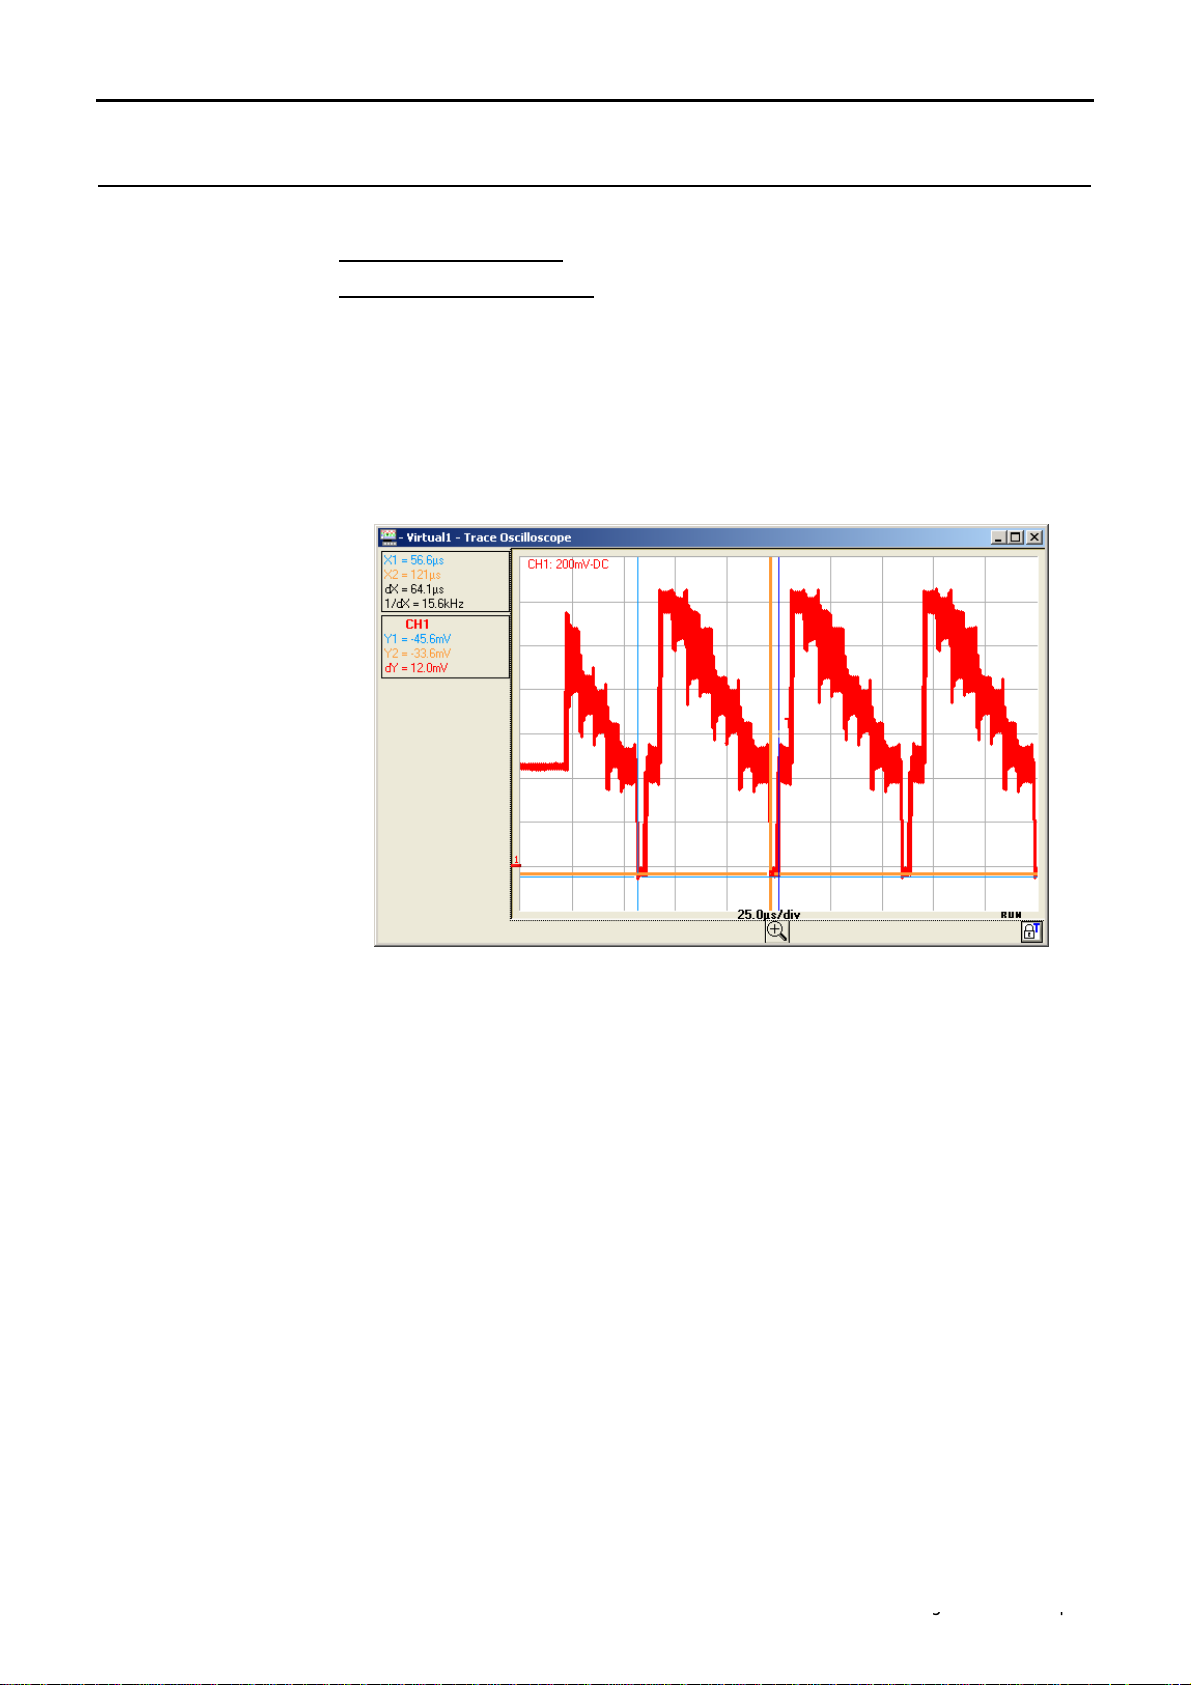
Video signal display (SECAM)
Signal injected on CH1: video signal with a 625-line amplitude approx. 1.2V
Oscilloscope programming:
- Vertical sensitivity: 200 mV/div.
- Time base: 25 µs/div.
- Trigger mode: TV
- Polarity: +
- Line number: 25
- Manual measurements: line frequency period with dX and 1 / dX
Find Quality Products Online at: sales@GlobalTestSupply.com
III - 52 150 MHz virtual digital oscilloscopes
www.GlobalTestSupply.com
Page 53

Oscilloscope Instrument - The "Trigger" menu
"Oscilloscope" Instrument (contd.)
Trigger on LINE
Trigger slope: + or -
Variation range: from 40.00 ns to 10.5 s
Find Quality Products Online at: sales@GlobalTestSupply.com
150 MHz virtual digital oscilloscopes III - 53
www.GlobalTestSupply.com
Page 54

"Oscilloscope" Instrument (contd.)
Oscilloscope Instrument - The "Trigger" menu
Example
Frequency:
50 Hz
Display of the 50 Hz network signal
Signal injected on CH1: an image of the instrument power voltage
(mains voltage: 230 VAC ± 10%, 50 Hz)
Oscilloscope programming:
- Vertical sensitivity: 100 V/div.
- Time base: 5 ms/div.
- Trigger mode: Line
- Trigger slope: +
- Manual measurements: dt , dv
Position the manual measurement cursors to determine the frequency and
amplitude of the 50 Hz mains supply signal.
Amplitude:
623 V peak-to-peak
The status of the trigger circuit is indicated on the bottom right of the
Oscilloscope trace window; in the previous example it is in STOP.
Find Quality Products Online at: sales@GlobalTestSupply.com
III - 54 150 MHz virtual digital oscilloscopes
www.GlobalTestSupply.com
Page 55

Oscilloscope Instrument - The "Horizontal" menu
"Oscilloscope" Instrument (contd.)
The "Horizontal"
menu
Repetitive signal
Example
programmes:
• the repetitive signal
• Min/Max Acquisition
• average rate
The "" symbol indicates that the "Repetitive Signal" option has been
selected.
Activation of this option increases the time definition of a trace (up to
100 Gs/s) for a repetitive signal.
For time bases of less than 50 µs/div. (zoom mode not active), the
repetitive signal displayed is reconstituted by adding together successive
acquisitions.
Measurement on a microprocessor timing clock.
Min/Max Acquisition
If the signal is not repetitive, do not use this option as the aggregate
representation could be incorrect.
If Repetitive Signal mode is not selected, the time resolution will be 10 ns
(or 5 ns, if only one channel is active in single stroke). In this mode, all the
counts displayed are updated with each acquisition.
To indicate that repetitive signal mode is not selected, the "Non repetitive
Signal" message is displayed at the top of the window:
allows the signal to be sampled at high frequency (100 MS/s), even for
slow time base speeds. The display represents extreme value samples,
the Min and Max.
It is possible:
• to detect incorrect representation due to under-sampling
• to display short-term events (Glitch, > 10 ns).
Whatever time base is used, short-term events (Glitch, > 10 ns) are
displayed.
The "" symbol indicates that the "Min/Max Acquisition" mode is active.
Find Quality Products Online at: sales@GlobalTestSupply.com
150 MHz virtual digital oscilloscopes III - 55
www.GlobalTestSupply.com
Page 56

Oscilloscope Instrument - The "Horizontal" menu
"Oscilloscope" Instrument (contd.)
Average rate
No averaging
Average rate: 2
Average rate: 4
Average rate: 16
Average: rate 64
Selection of a rate to calculate an average for the displayed samples.
Example: attenuation of the random noise observed on a signal.
The averaging rates are: no averaging or
average rate: 2
average rate: 4
average rate: 16
average rate: 64
The calculation is performed using the following formula:
Pixel N = Sample*1/Average rate + Pixel
with:
Sample Value of new sample acquired at abscissa t
Pixel N Ordinate of pixel with abscissa t on the screen, at moment N
Pixel N-1 Ordinate of pixel with abscissa t on the screen, at moment N-1
(1-1/Average rate)
N-1
It is only possible to obtain the average rate if the Repetitive Signal option is
activated.
Find Quality Products Online at: sales@GlobalTestSupply.com
III - 56 150 MHz virtual digital oscilloscopes
www.GlobalTestSupply.com
Page 57

Oscilloscope Instrument - The "Display" menu
"Oscilloscope" Instrument (contd.)
The "Display"
menu
Grid
Vertical unit
sets the parameters for the following displays:
•
Grid
•
Vertical unit
•
Display mode: Vector or Envelope
•
Zoom Off
•
XY
Display with or without grid lines
Display in the Oscilloscope Trace
FFT Trace and
XY Trace windows
of the vertical unit,
the input coupling and
the BWL selection of each active channel.
Display modes
Envelope
Vector
There are two display modes available:
A vector is traced at the centre of the sample.
The minimum and maximum observed on each horizontal position of the
screen are displayed. This mode is used to display drifting in time or
modulation.
The “” symbol indicates the active display mode.
Find Quality Products Online at: sales@GlobalTestSupply.com
150 MHz virtual digital oscilloscopes III - 57
www.GlobalTestSupply.com
Page 58

Oscilloscope Instrument - The "Display" menu
"Oscilloscope" Instrument (contd.)
Zoom Off
Horizontal ZOOM
« »
Selecting Zoom Off returns the user to the non-zoom representation of
traces: clicking on the button has the same effect.
A dynamic zoom is obtained by clicking on the button at the foot of
the Oscilloscope Trace or FFT Trace panel.
A static zoom is obtained by clicking on the button on the
Oscilloscope Control panel. The Zoom Off function only applies to the
dynamic zoom.
Enlarge mode (dynamic horizontal zoom) is indicated by the presence of
the 3 buttons opposite, at the foot of the Oscilloscope Trace or FFT Trace
panel.
When the FFT function is activated, the dynamic zoom on the time
representation is not operative.
Find Quality Products Online at: sales@GlobalTestSupply.com
III - 58 150 MHz virtual digital oscilloscopes
www.GlobalTestSupply.com
Page 59

Oscilloscope Instrument - The "Display" menu
"Oscilloscope" Instrument (contd.)
XY…
Validation of XY mode.
The instrument adds a window containing the XY representation to the
current f(t) and FFT representations. The windows are simultaneously
updated.
F(t) and XY
representation of
these signals
The XY source menu is used for assigning one of the 4 traces available
to the X (horizontal) and Y axes (vertical).
MTX 1054: MTX 1052:
Validation of selections using the button opposite.
• Each axis is graduated into 8 divisions.
• The X and Y axes have the nr. of the channel that is assigned to them.
• The " • " symbols indicate the traces selected for each axis.
Example
Find Quality Products Online at: sales@GlobalTestSupply.com
150 MHz virtual digital oscilloscopes III - 59
XY
CH1&CH2
In XY mode, there are 2 manual measurement cursors
X1 Y1) and (X2 Y2). The vertical calibres of the traces selected for XY
(
display are indicated on the top left of the window.
The manual measurement cursors of the XY Trace window are separate
from those of the Oscilloscope Trace window.
www.GlobalTestSupply.com
: trace window:
XY representation
Page 60
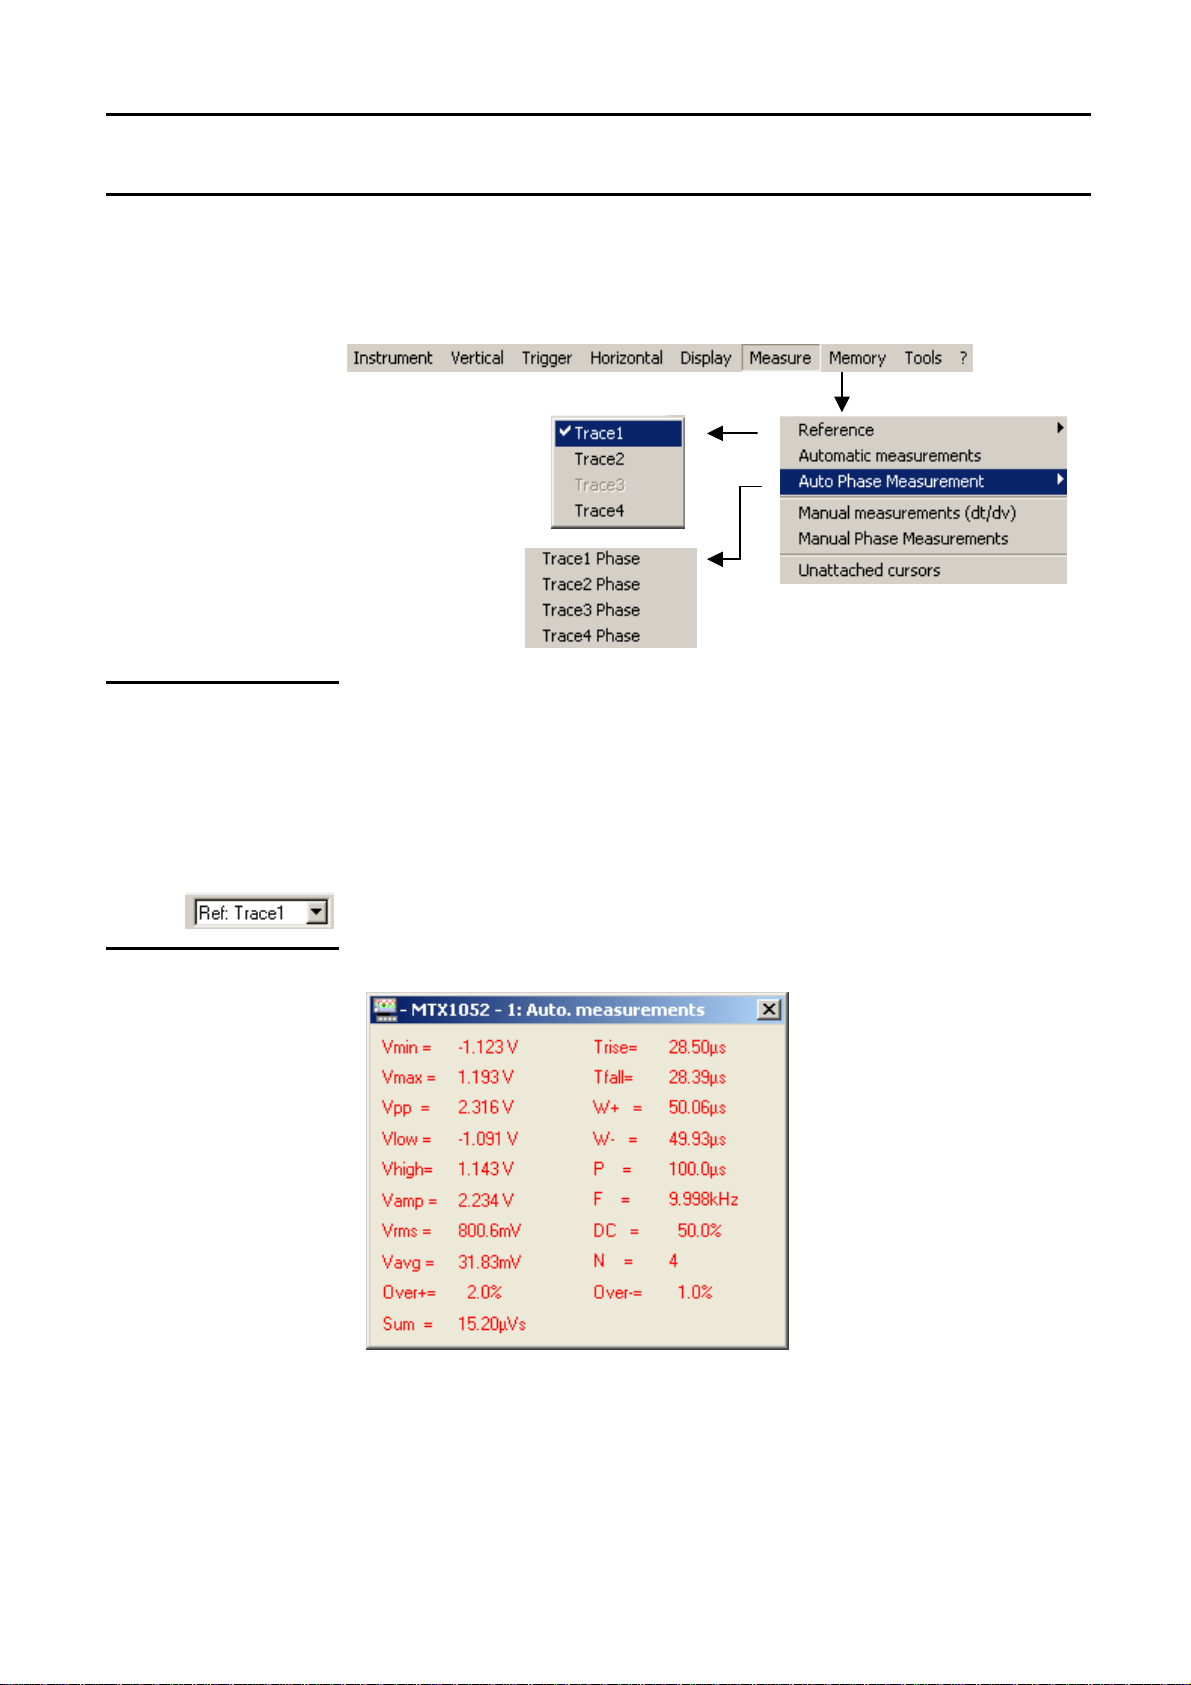
Oscilloscope Instrument - The "Measurement" menu
"Oscilloscope" Instrument (contd.)
The
"Measurement"
menu
Reference
Trace 1
Trace 2
Trace 3
Trace 4
selects the Reference Trace for:
•
automatic measurement
•
phase measurement (automatic or manual)
•
measurement with a manual cursor
Selecting one of the active traces for which automatic or manual
measurements are to be made.
Only active traces can be selected. Inactive traces are shown greyed out.
Automatic
measurements
The "" symbol indicates the reference trace selected.
The measurement reference "Ref: Trace 1, 2, 3, 4" can also be selected
from the toolbar.
Opens the Automatic measurements window.
The 19 automatic measurements are made on the reference trace
selected. All the measurements that can be performed on this trace are
displayed and refreshed.
(- - - -) is displayed for measurements that cannot be performed.
The window is closed by clicking on the x icon.
Find Quality Products Online at: sales@GlobalTestSupply.com
III - 60 150 MHz virtual digital oscilloscopes
www.GlobalTestSupply.com
Page 61

Oscilloscope Instrument - The "Measurement" menu
"Oscilloscope" Instrument (contd.)
Activation of automatic measurement does not display the cursors in the
trace display window. For measurements on periodic signals, choose the
time base coefficient so that at least 2 signal periods are displayed on the
screen.
19 automatic
measurements
Vmin
Vmax
Vpp
Vlow
Vhigh
Vamp
Vrms
Vavg
Over+
Tm
Td
W+
W-
DC
Over-
Sum
minimum peak voltage
maximum peak voltage
peak-to-peak voltage
established low voltage
established high voltage
amplitude
rms voltage
average voltage
positive overshoot
rise time
fall time
positive pulse width (at 50 % of Vamp)
negative pulse width (at 50 % of Vamp)
P
period
F
frequency
cyclic ratio
N
number of pulses
negative overshoot
sum of elementary areas (= integral)
•
Measurement
conditions
The measurements are made on the displayed part of the trace.
•
Any change to the signal will lead to updating of the measurements.
They are refreshed in step with acquisition.
•
For greater accuracy of the measurements displayed:
1.
represent at least two complete periods for the signal
2.
choose the calibre and vertical position so that the peak-to-peak
amplitude of the signal to be measured is represented on 4 to 7
divisions of the screen.
Find Quality Products Online at: sales@GlobalTestSupply.com
150 MHz virtual digital oscilloscopes III - 61
www.GlobalTestSupply.com
Page 62

Oscilloscope Instrument - The "Measurement" menu
P
bas
haut
moy
L
L
tm td
"Oscilloscope" Instrument (contd.)
Automatic
measurement
presentation
T = 1/F
W+ W-
100%
90%
Vavg
50%
10%
0%
t0t1t2 t3t4t5
>5%T
Trise
Tfall
• Positive overshoot = [100 * (Vmax – Vhigh)] / Vamp
• Negative overshoot = [100 * (Vmin – Vlow)] / Vamp
Vmax
Vhigh
Vamp Vpp
Vlow
Vmin
>5%T
t6
i n
=
1
•
Vrms =
•
Vavg =
Y
= value of the point representing zero Volts
GND
[ (y y ) ]
∑
n
i 0
i n
=
1
∑
n
i 0
=
−
i
=
(y y )
−
i
GND
GND
2 1/2
Find Quality Products Online at: sales@GlobalTestSupply.com
III - 62 150 MHz virtual digital oscilloscopes
www.GlobalTestSupply.com
Page 63
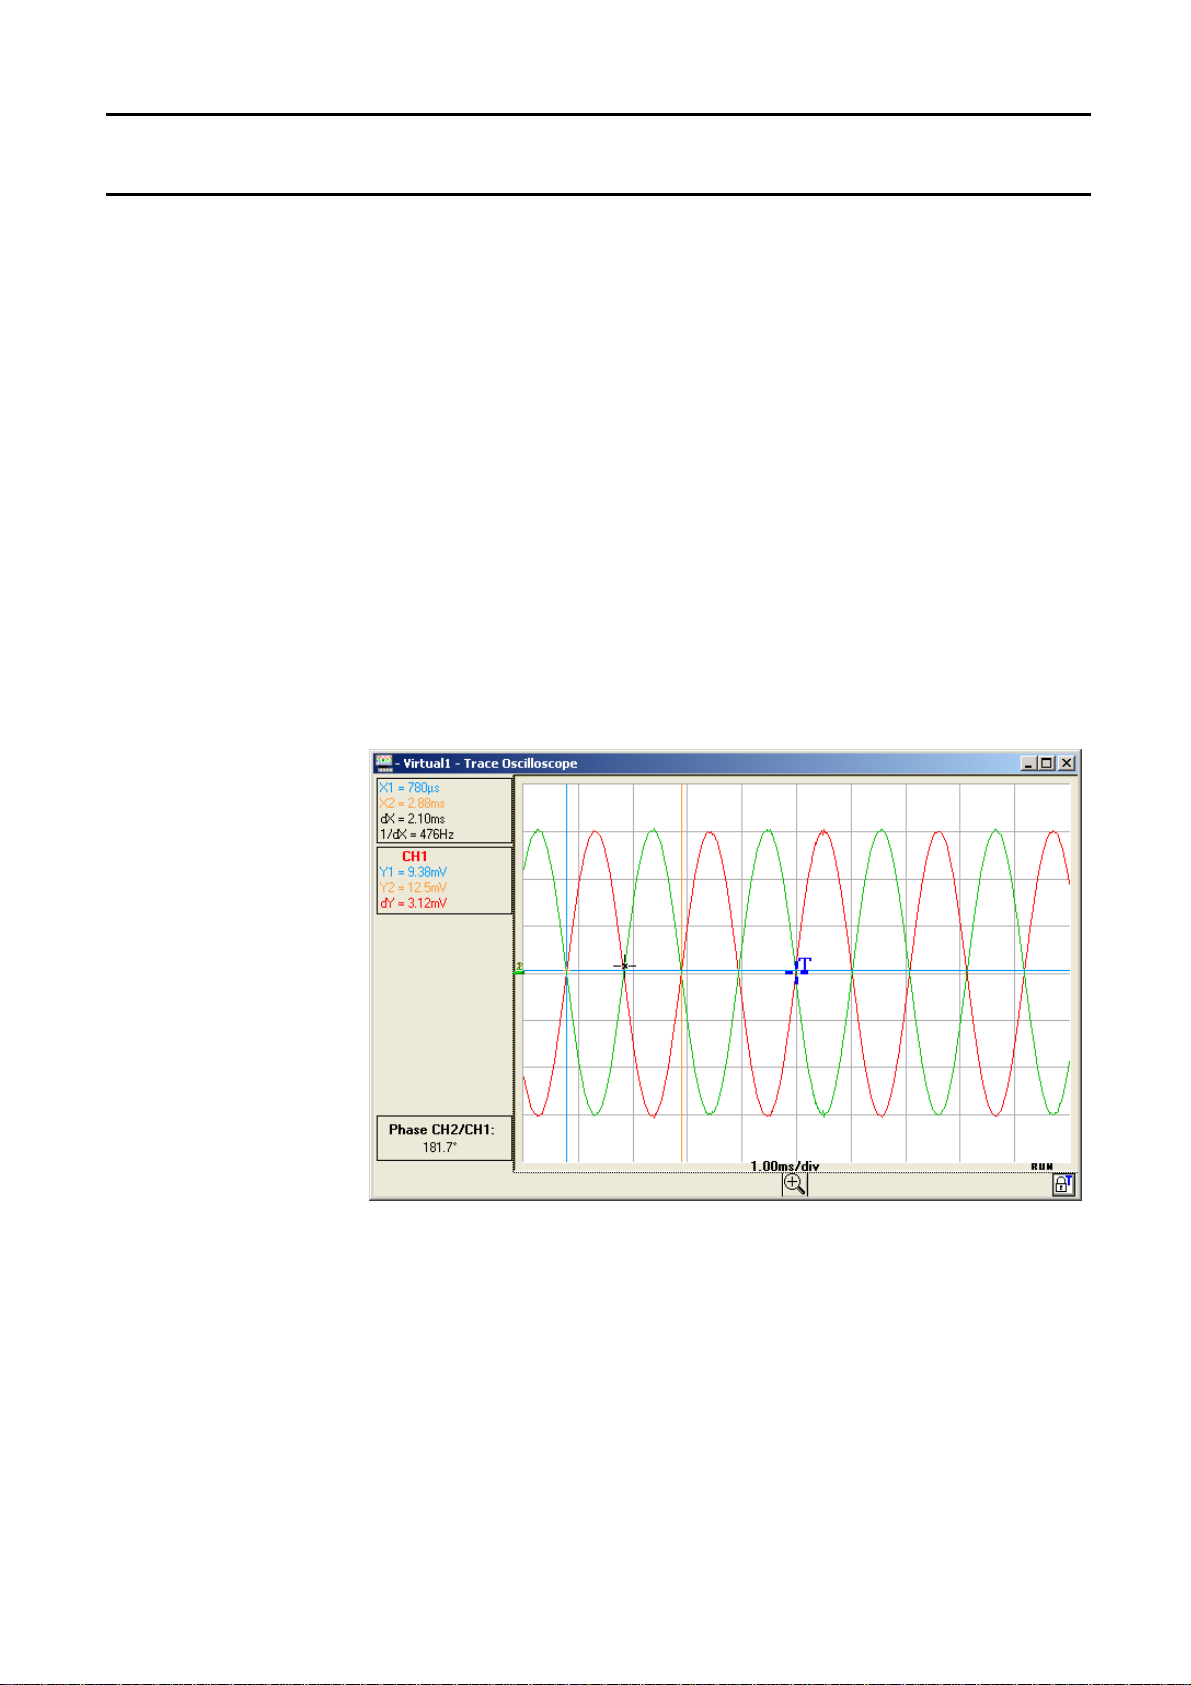
Oscilloscope Instrument - The "Measurement" menu
"Oscilloscope" Instrument (contd.)
Measurement phase
Trace1 Phase
Trace2 Phase
Trace3 Phase
Trace4 Phase
Measurement of a trace phase compared with a reference trace (See §.
Reference Measurement).
Selecting of the trace on which phase measurements are to be performed.
To deactivate phase measurement, deselect the selected phase
measurement.
Automatic phase measurement:
•
The "
•
Activation of phase measurement displays 3 cursors:
2 automatic measurement cursors on the reference trace
indicate the signal period (blue and yellow cursors).
A black cursor is positioned on the trace where
phase measurement is to be carried out (CH2 in our example).
These 3 cursors are automatically placed on the reference and
measurement traces; they cannot be moved.
•
The phase measurement (in °) of the trace selected (CH2) compared with
the reference trace (CH1) is indicated in the measurement display zone (
Example: CH2/CH1 phase = 181.7°).
"
symbol indicates the trace selected for phase measurement.
Find Quality Products Online at: sales@GlobalTestSupply.com
150 MHz virtual digital oscilloscopes III - 63
www.GlobalTestSupply.com
Page 64

Oscilloscope Instrument - The "Measurement" menu
"Oscilloscope" Instrument (contd.)
If the measurement cannot be performed, " - - - -" is displayed . For
example, if the time base chosen does not enable 2 complete signal
periods to be represented:
Manual
measurements
(dt, dv)
Cursor measurements
The blue and yellow measurement cursors are displayed as soon as the
menu is activated.
The two measurements made are:
dX = dt
dY = dv
The measurements performed and the cursors are linked to the selected
reference trace (see §. Reference Measurement).
•
The "" symbol indicates that the manual measurements
(time deviation between the two cursors)
(voltage deviation between the two cursors).
(dt, dv) are active.
• The measurement cursors can be moved directly with the mouse.
Find Quality Products Online at: sales@GlobalTestSupply.com
III - 64 150 MHz virtual digital oscilloscopes
www.GlobalTestSupply.com
Page 65
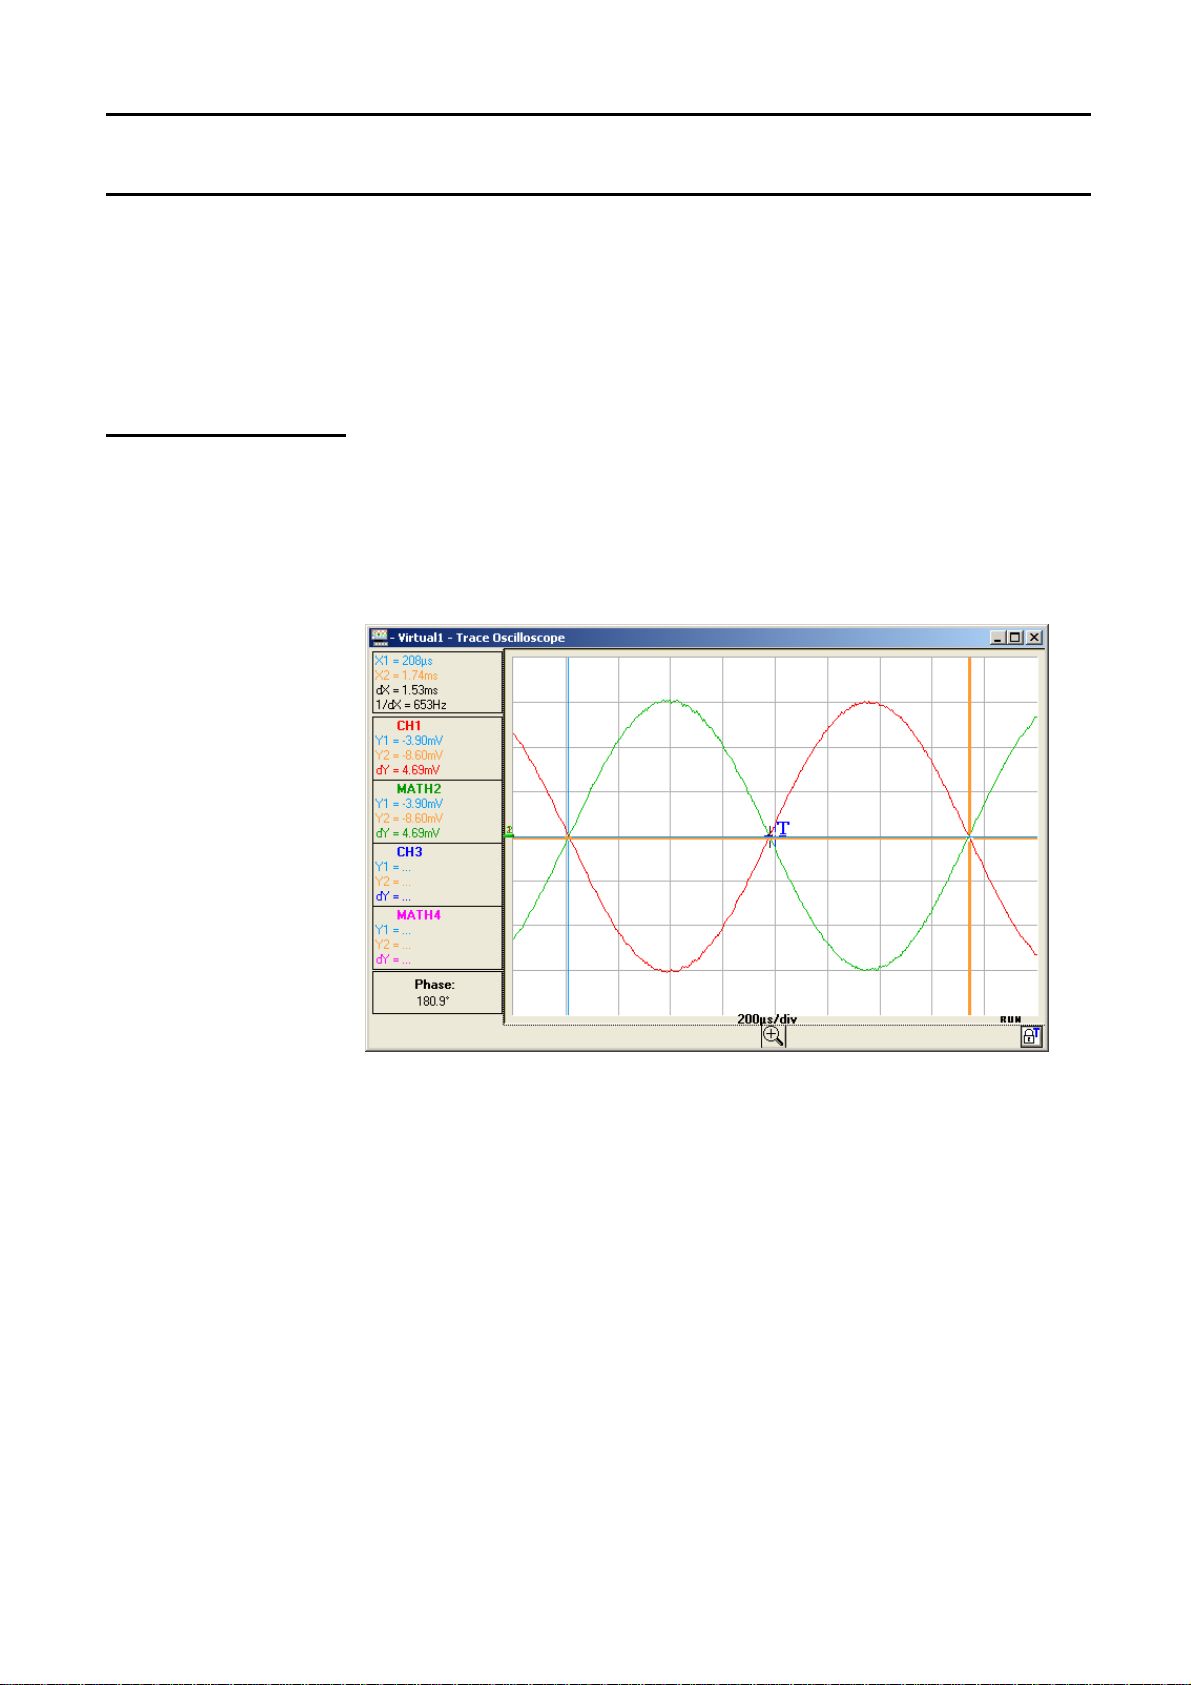
Oscilloscope Instrument - The "Measurement" menu
"Oscilloscope" Instrument (contd.)
Manual phase
measurement
• If the unattached cursors option is not activated (see §. Measurement).
the cursors will remain linked to the reference trace during movement.
If the option is active, the cursors can be moved anywhere in the trace
display window.
• The dt and dv measurements in relation to the selected reference
are indicated in the measurement display area.
Example: (1)dt = dX = 1.05 ms, dv = dY = 1.21V
If manual phase measurement is selected:
The three cursors are unattached and can be placed anywhere in the
trace display window:
The blue and yellow cursors determine the reference period for
calculation of the phase and the dephasing value displayed depends on
the position of the black cursor in relation to these 2 cursors.
For manual measurement of the phase, a signal on the screen is all that
is needed.
Find Quality Products Online at: sales@GlobalTestSupply.com
150 MHz virtual digital oscilloscopes III - 65
www.GlobalTestSupply.com
Page 66

Oscilloscope Instrument - The "Measurement" menu
"Oscilloscope" Instrument (contd.)
Unattached manual
cursors
to link/unlink the (blue and yellow) manual measurement cursors to/from
the reference trace.
When the "Unattached cursors" menu is selected, the blue and yellow
cursors can be moved freely over the whole screen.
•
The "" symbol indicates that the "Unattached cursors"
menu is active.
• To deactivate this menu, de-select it with the mouse.
• For automatic measurement and automatic phase measurement, the
cursors are fixed: they cannot be moved. The Unattached cursors menu
will be inactive.
Particular case
If Automatic Measurement and Manual Measurement are both activated,
the 2 displays are simultaneous:
•
The automatic measurement window is still active.
•
The manual "dv, dt" measurement values corresponding to cursor
positions are displayed beside the trace in the Oscilloscope Trace
window.
Find Quality Products Online at: sales@GlobalTestSupply.com
III - 66 150 MHz virtual digital oscilloscopes
www.GlobalTestSupply.com
Page 67

Oscilloscope Instrument - The "Memory" menu
"Oscilloscope" Instrument (contd.)
The "Memory"
menu
Trace 1 Ref. 1
Trace 2 Ref. 2
Trace 3 Ref. 3
Trace 4 Ref. 4
saves and calls up the following files: settings (.CFG)
trace (.TRC)
samples (.TXT)
function (.FCT)
Saving of the trace selected to its volatile reference memory:
Example: Trace 1 in Ref. 1. 1
The 4 traces have their reference memory.
The time base coefficient and vertical sensitivity of the reference are
indicated in the colour of the reference:
Example REF1: 1ms, 200mV and REF2: 1ms,50mV
• Only the 500 counts displayed on the screen are stored (not the 50
kcounts acquired); as a result, a Ref. x cannot be zoomed.
• All active channels can be simultaneously referenced with the icon
on the toolbar.
Find Quality Products Online at: sales@GlobalTestSupply.com
150 MHz virtual digital oscilloscopes III - 67
www.GlobalTestSupply.com
Page 68

Oscilloscope Instrument - The "Memory" menu
"Oscilloscope" Instrument (contd.)
• To facilitate comparison, the reference trace must have the same
characteristics as the associated trace (sensitivity and time base)
• A trace can only be saved in its reference memory if it is present on the
screen
• The memorized traces are displayed in a light colour, accompanied by
their reference number.
• The "" symbol in the menu means that the corresponding trace
has been saved in the reference memory and that it is present on the
screen.
• A reference trace cannot be moved.
• A reference memory can be deactivated by deselecting it via the
Memory menu.
The trace in Ref. is not lost if you exit and open a new work session with the
same instrument settings file (MTX1052, in our example).
Saving a trace:
Save .TRC
Save.TXT Saving files for export to another application
Find Quality Products Online at: sales@GlobalTestSupply.com
III - 68 150 MHz virtual digital oscilloscopes
Saving a Trace (in the non-volatile memory, the PC hard disk): 50,000
counts are saved.
It can be saved in two formats: ".TRC" or ".TXT".
Saving files to recall them in the trace window
The files saved will take the extension .TRC; they can be recalled via the
"Memory Trace Recall TRC" menu.
The files saved have the extension .TXT; they cannot be recalled by the "Trace
Recall TRC" menu for screen display.
standard format for use in another programme (spreadsheet, etc.).
( Example:
However, they can be exported in a
Microsoft EXCEL) using the menu "Util Export to EXCEL".
www.GlobalTestSupply.com
Page 69

Oscilloscope Instrument - The "Memory" menu
"Oscilloscope" Instrument (contd.)
Example of saving
a .TRC trace file
When the menu "Memory Save.'TRC’ Trace1" menu is selected, the
following window is displayed:
• Choose the save directory.
Enter the name of the file to be saved using the keyboard ( :
• Click on to save the file.
The name of the file saved takes the extension .TRC .
• Trace1 is saved as a .TXT file via the menu "Memory Save ‘*.TXT
Trace1". The name of the file saved then takes the extension .TXT (text
format) .
• To exit the menu without saving, click on .
test.TRC
).
Find Quality Products Online at: sales@GlobalTestSupply.com
150 MHz virtual digital oscilloscopes III - 69
www.GlobalTestSupply.com
Page 70

Oscilloscope Instrument - The "Memory" menu
"Oscilloscope" Instrument (contd.)
Recall .TRC
If "Memory Trace Recall ‘.TRC’ Trace1" is selected, the following
window is displayed:
The list contains the .TRC files saved in the C:\TRC directory via the
"Trace Save.TRC" menu.
Select a file and click on to call it up.
The trace is displayed on the channel selected, CHx ( : CH1):
On the Oscilloscope control panel:
- CH1 is replaced with MEM1
- the Autoset button is replaced with the time base value
and by the name of the trace record saved.
(∗)
(∗) MATH3, MATH4
for the MTX 1052
To exit the “Open“ window without calling up a trace, click on the button
Find Quality Products Online at: sales@GlobalTestSupply.com
III - 70 150 MHz virtual digital oscilloscopes
opposite.
www.GlobalTestSupply.com
Page 71

Oscilloscope Instrument - The "Memory" menu
"Oscilloscope" Instrument (contd.)
If the user does a CAPTURE of the traces ( : MEM1, CH2, CH3 and
CH4) the following window is displayed:
In the above
example, MTX 1054:
The following are indicated in this window:
• the current time base in s/div (black colour) corresponding to the
channels not saved
• the time base of the trace saved (colour of the MEMx trace)
• When ZOOM coefficient values are changed, the CHx channel time
base coefficients change.
• If manual cursors are present, the values of dX
and dYs are indicated, corresponding to the CHx and MEMx channels,
for all the ZOOM coefficients.
The channels CH2, CH3, CH4 are acquired with a time base coefficient of
100µs/div.
The channel saved MEM1 was acquired with a time base coefficient of
200µs/div.
If a ZOOM coefficient of 2 is applied to these 4 traces, the time bases
zoomed are 50µs/div. for CH2, CH3, CH4 traces and
MEM1 trace.
100µs/div. for the
Find Quality Products Online at: sales@GlobalTestSupply.com
150 MHz virtual digital oscilloscopes III - 71
www.GlobalTestSupply.com
Page 72

Oscilloscope Instrument - The "Memory" menu
"Oscilloscope" Instrument (contd.)
On the traces zoomed, the value of dX between the X1 and X2 cursors is:
dX = 73.9µs for the CH2, 3, 4 traces and dX = 148µs for MEM1.
When a trace is recalled, "MEMx" appears in the destination trace channel
zone. The sensitivity, coupling and band limitation become those of the
trace restored (they cannot be modified).
Find Quality Products Online at: sales@GlobalTestSupply.com
III - 72 150 MHz virtual digital oscilloscopes
www.GlobalTestSupply.com
Page 73

Oscilloscope Instrument - The "Memory" menu
"Oscilloscope" Instrument (contd.)
Settings
saving or recalling an instrument settings.
Saving if selected, opens the following window:
• The Filename box contains the default name *.CFG This file contains
the parameters of the instrument configuration when the window is
opened.
• Enter the filename with the keyboard
Recall
• Click on to save the instrument settings.
(save file: extension .CFG)
To exit the window without saving.
if selected, opens the following window:
• This window shows a list of the files (.CFG) saved via the "Settings
Save" menu.
• Select the file to be called up by clicking with the mouse.
• Then click on the button to recall the settings saved.
Find Quality Products Online at: sales@GlobalTestSupply.com
150 MHz virtual digital oscilloscopes III - 73
To exit the menu without recalling the settings.
www.GlobalTestSupply.com
Page 74

Oscilloscope Instrument - The "Tools" menu
"Oscilloscope" Instrument (contd.)
The "Tools" menu
Network
allows the following functions to be carried out:
•
network settings
•
printing
•
export to Excel
•
choice of language
•
system info display
•
software updating
configures the oscilloscope Ethernet link
MAC address
Find Quality Products Online at: sales@GlobalTestSupply.com
III - 74 150 MHz virtual digital oscilloscopes
This is unique and cannot be modified by the user. It identifies the
instrument on the network.
IP address The user may keep the default IP address or enter a new
one via the keyboard.
Subnet mask Input of the network mask
Gateway Programming of the gateway IP address (if a gateway is
used)
Validation of the new configuration settings.
Exit without validation
www.GlobalTestSupply.com
Page 75

Oscilloscope Instrument - The "Util" menu
"Oscilloscope" Instrument (contd.)
Print …
Export to EXCEL…
This window allows the selection of the panel(s) that you wish to print. The
paper orientation (Portrait/Landscape) is selected with the switch opposite.
Start printing
Exit without printing
•
either by clicking on the icon on the toolbar
•
or via the menu "Util Export to EXCEL".
The following menu appears: ”Loading samples …”
It indicates the transfer of 50,000 samples corresponding to each trace
active at the time of the click.
Once the transfer is finished, the Capture Trace and Export to Excel
windows are displayed.
Find Quality Products Online at: sales@GlobalTestSupply.com
150 MHz virtual digital oscilloscopes III - 75
www.GlobalTestSupply.com
Page 76

Oscilloscope Instrument - The "Tools" menu
"Oscilloscope" Instrument (contd.)
Traces captured at
the time of the click
The memory zone to be exported corresponds to the one displayed in the
black frame of the first trace, itself represented on the lower graph. It can be
delimited using the Horizontal Zoom and by moving the frame with
the mouse or the buttons opposite.
The time necessary for an export to EXCEL depends on the number of
samples to be exported.
○
Export activation
window
Find Quality Products Online at: sales@GlobalTestSupply.com
III - 76 150 MHz virtual digital oscilloscopes
www.GlobalTestSupply.com
Page 77
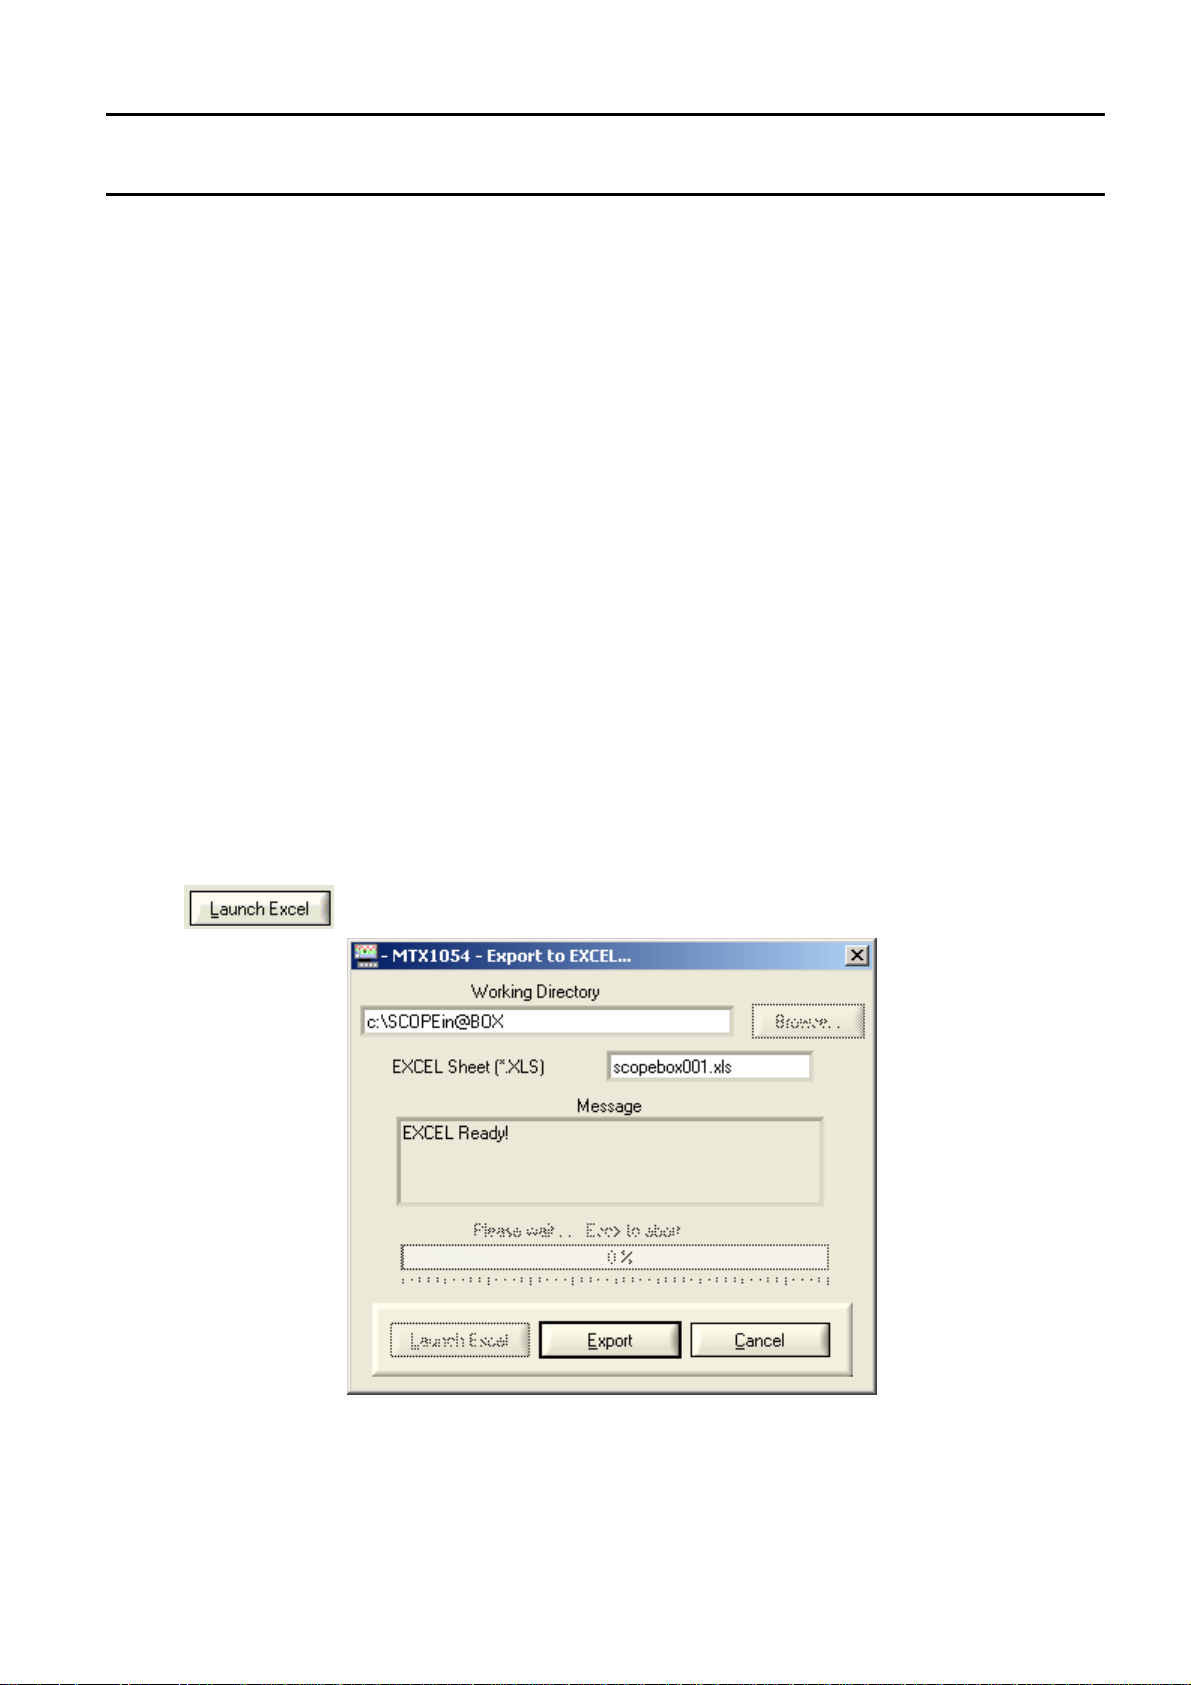
Oscilloscope Instrument - The "Util" menu
"Oscilloscope" Instrument (contd.)
•
Name the EXCEL spreadsheet (default name: scopebox001.xls).
•
Choose the Working directory by clicking on "Browse"
•
Click on Done.
•
Start Excel by clicking on the corresponding button.
Find Quality Products Online at: sales@GlobalTestSupply.com
150 MHz virtual digital oscilloscopes III - 77
www.GlobalTestSupply.com
Page 78
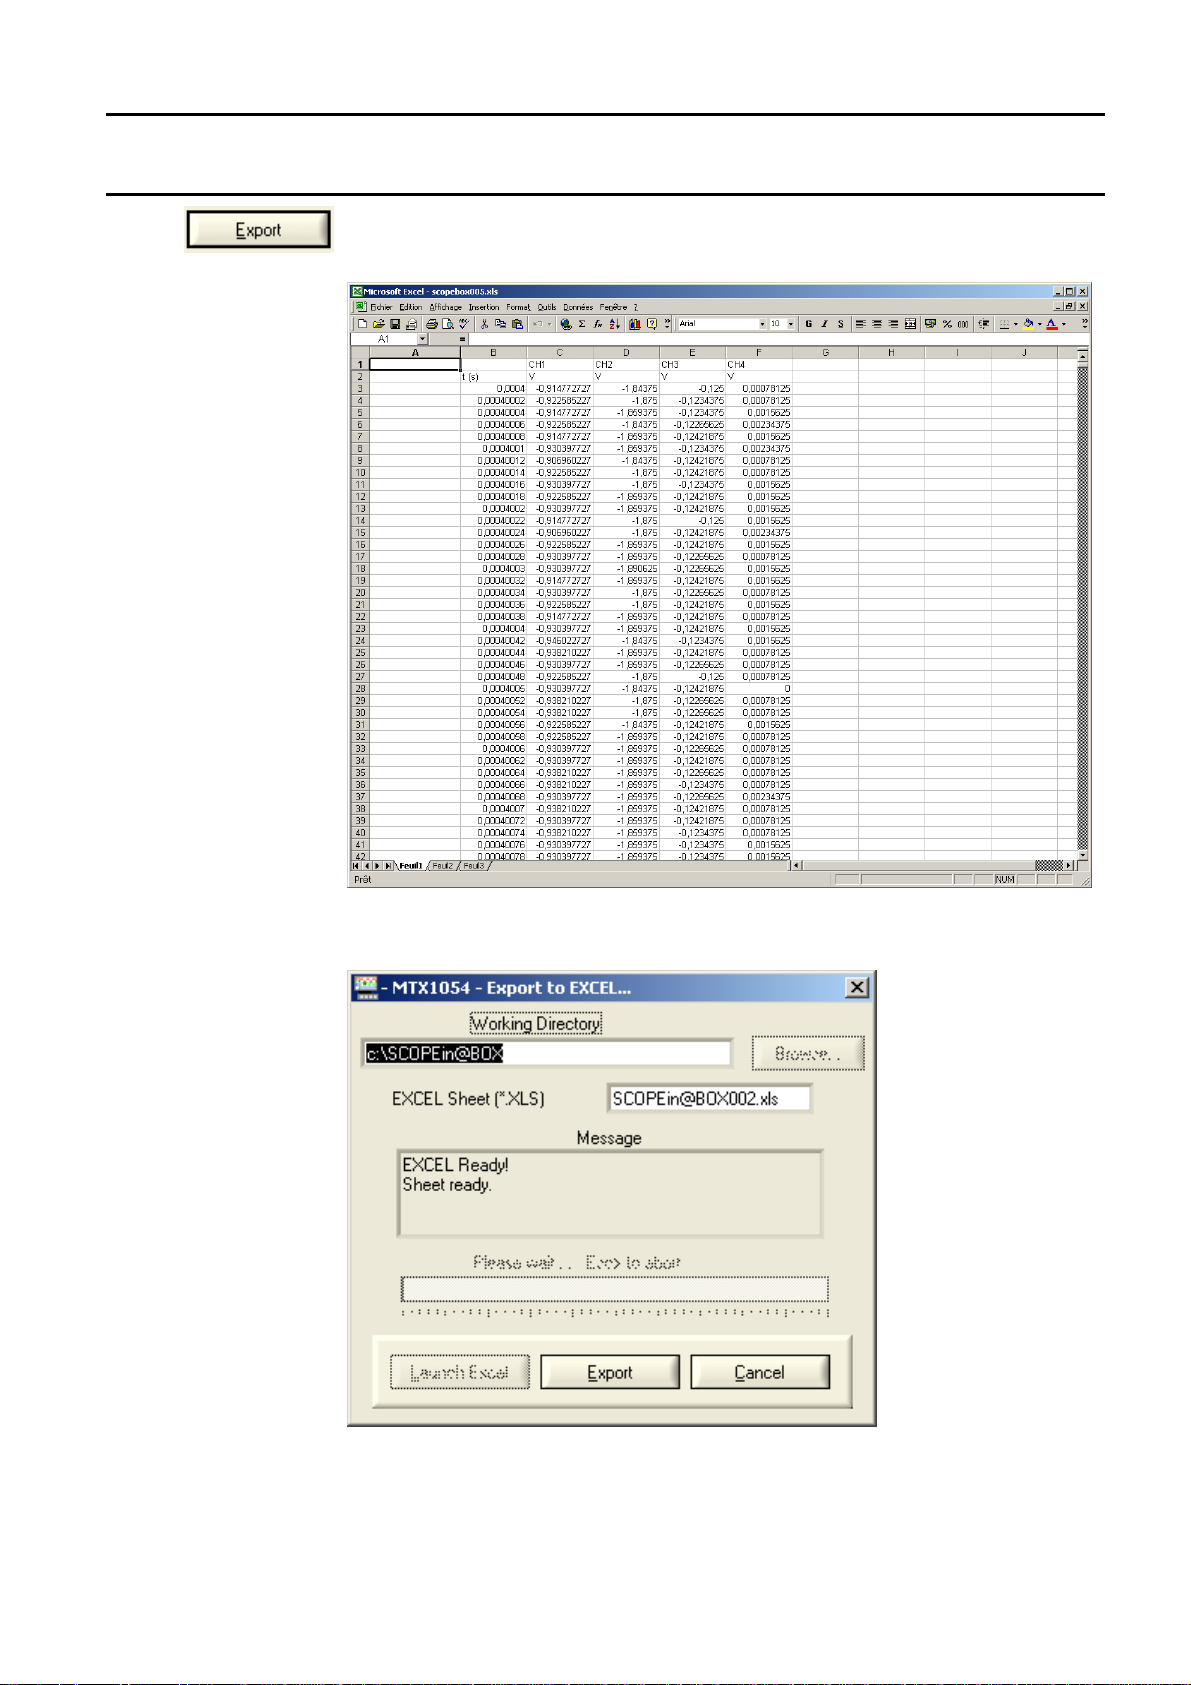
Oscilloscope Instrument - The "Tools" menu
"Oscilloscope" Instrument (contd.)
•
Start the export by clicking on Export.
When the operation has finished the message Sheet Ready is displayed in
the Message box.
Find Quality Products Online at: sales@GlobalTestSupply.com
III - 78 150 MHz virtual digital oscilloscopes
www.GlobalTestSupply.com
Page 79
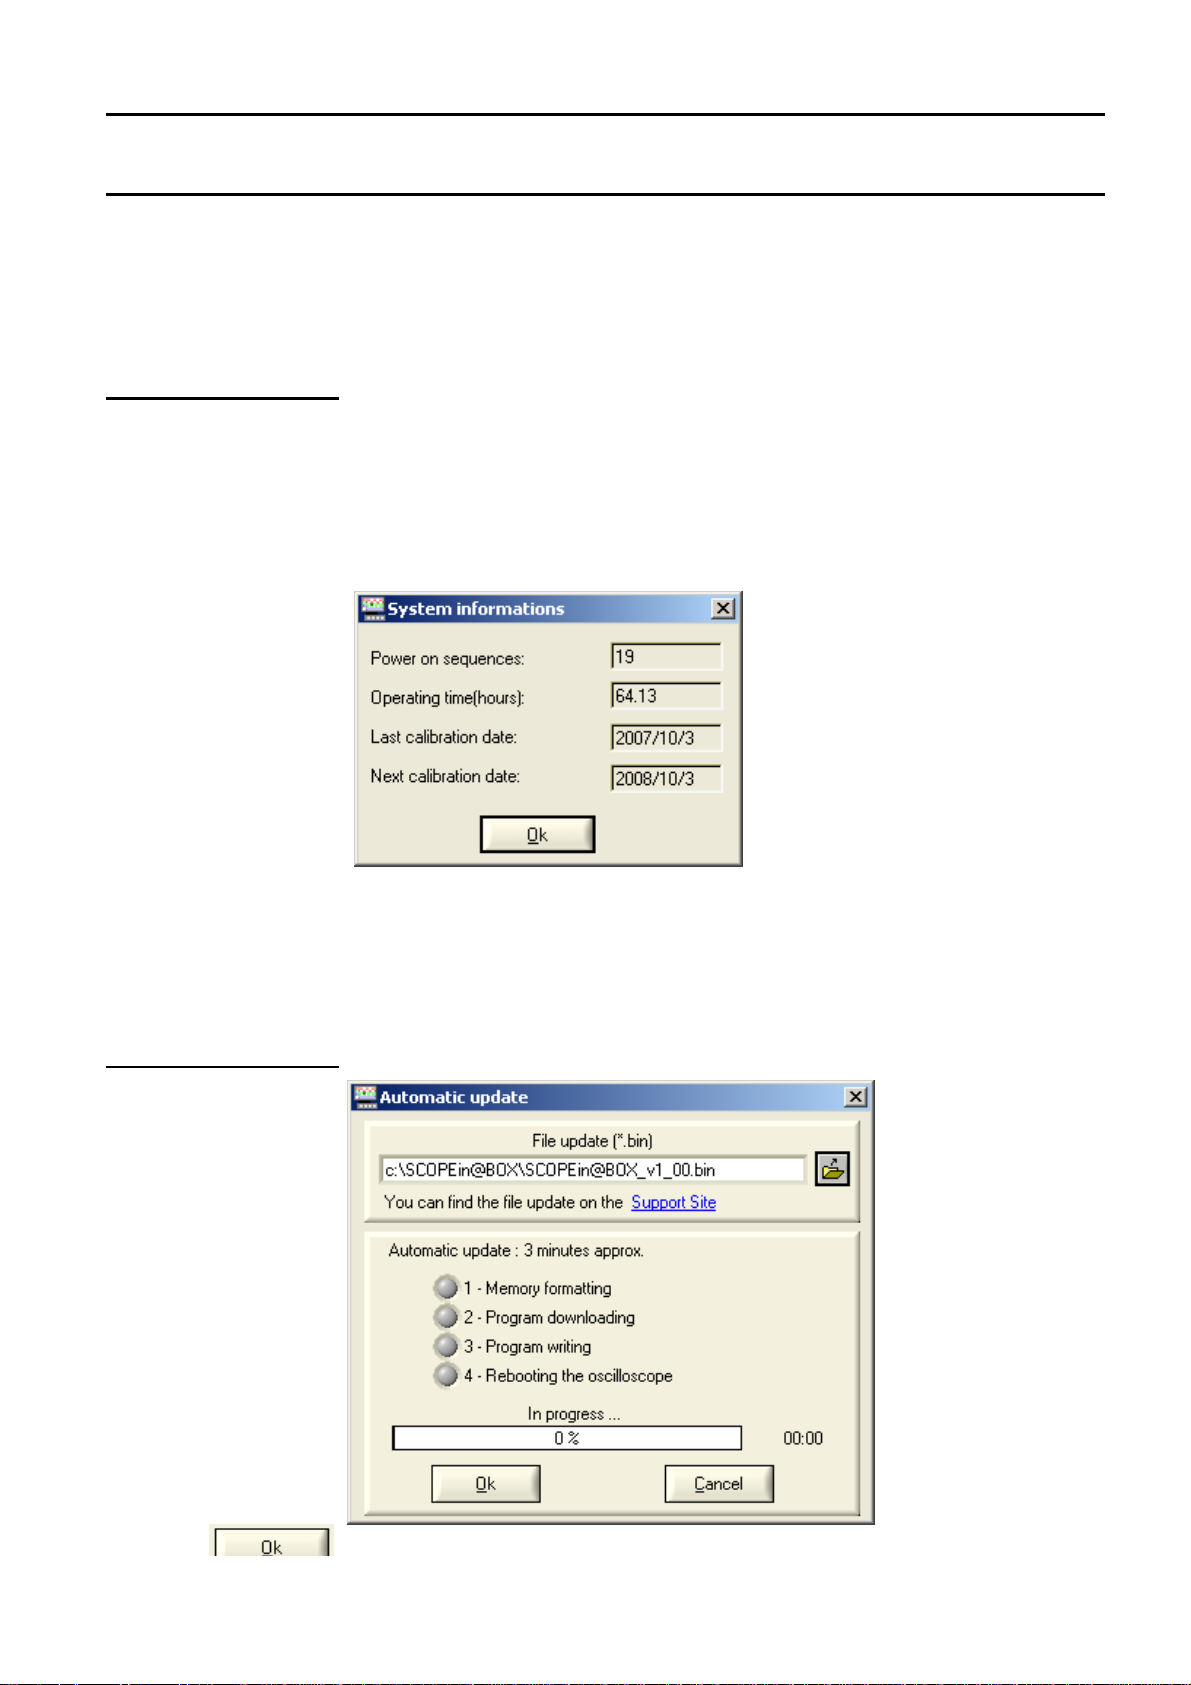
Oscilloscope Instrument - The "Util" menu
Upgrade
"Oscilloscope" Instrument (contd.)
Language
System info …
Selection of the language:
•
English
•
Français
•
Deutsch
•
Español
•
Italiano
Display of data concerning the operation of the instrument since it was first
used:
•
the number of times switched on
•
the number of hours of use
•
the date last calibrated
•
the recommended date for the next calibration.
firmware …
The instrument time is automatically set to that of the PC when a working
session is set up.
When a working session is closed, the instrument switches to low
consumption mode, if not in recorder mode.
It automatically switches to normal consumption when a new working
session is set up.
•
Select the new version of the embedded software to be loaded.
•
Click on the button opposite.
Find Quality Products Online at: sales@GlobalTestSupply.com
150 MHz virtual digital oscilloscopes III - 79
www.GlobalTestSupply.com
Page 80

Oscilloscope Instrument - The "Tools" menu
"Oscilloscope" Instrument (contd.)
4 steps
A red LED and bargraph indicate the progress of the update.
When the update is finished, the instrument restarts with the new
embedded software.
If a problem occurs during the update (: power cut during step 2), the
following message is displayed:
1. Check the instrument connection to the Ethernet network.
2.
Check for the presence of the mains supply (the red LED on the back
panel of the instrument should be lit)
3. Wait for 3 minutes (installation of the software in the memory).
4.
Then go to the menu Util Network.
5. Click on the OK button in the Ethernet Configuration window.
6.
Restore the Ethernet connection.
Find Quality Products Online at: sales@GlobalTestSupply.com
III - 80 150 MHz virtual digital oscilloscopes
www.GlobalTestSupply.com
Page 81

Oscilloscope Instrument – The "Help" Menu
"Oscilloscope" Instrument (contd.)
The "?" Menu
Help
About …
opens the virtual oscilloscope user manual. The user can read the
chapters of the manual with the oscilloscope still operative.
This function can also be accessed by clicking on the icon on the
toolbar.
opens the following window with:
•
the PC software version: SCOPEin@BOX V1.00
•
The embedded Firmware version: MTX1054,V1.00/7/A0A
the name of the instrument,
- embedded software version,
- configuration (Analyser, Recorder ...)
- hardware version.
Click on the window to close.
Reminder
Find Quality Products Online at: sales@GlobalTestSupply.com
150 MHz virtual digital oscilloscopes III - 81
By logging on to the www.chauvin-arnoux.com web site, the user can
download updates after inputting identification details.
A product support technician will answer any questions via the email
address.
www.GlobalTestSupply.com
Page 82

Oscilloscope with SPO Persistence Instrument
Parallèle
"Oscilloscope with SPO Persistence" instrument
Selection
Presentation
Smart Persistence Oscilloscope (SPO) mode is activated from the
Instrument menu.
SPO Persistence:
•
displays unstable, transient phenomena and glitch
•
displays the evolution of the signal over a period of time, jitter and
modulation in the same way as when an analogue oscilloscope is used
•
causes acquisition to persist for a set period of time in order to observe
trace aggregation.
The light intensity or colour assigned to the point on the screen diminishes
if not renewed when a new acquisition process is implemented.
Acquisition is made according to 3 dimensions:
- time
- amplitude
- occurrence, which is a new dimension.
Acquisition SPO processing optimises the detection of transitory phenomena:
without SPO with SPO
Acquisition tasks and processing are
serial.
1 acquisition = 1 display
Acquisition
Representation on the screen of 500
points out of the 50,000 points
acquired.
Display of a segment to link the two
points.
Traitement
Affichage
Acquisition tasks and processing are in
parallel.
The number of acquisitions per second
can be multiplied by 100. The idle time
between two acquisitions is thus
considerably reduced.
N acquisitions = one display
Acquisition
Representation on the screen of 50,000
points acquired using an appropriate
compression system.
Display of a cloud of points not
interconnected. No interpolation.
Traitement
rapide
Affichage
Occurrence SPO brings a statistical dimension to the breakdown of samples.
The colour or light intensity highlight signal irregularities. They also enable a
distinction to be made between rare points and frequent points.
These settings can be modified by adjusting the persistence period.
Find Quality Products Online at: sales@GlobalTestSupply.com
IV - 82 150 MHz virtual digital oscilloscopes
www.GlobalTestSupply.com
Page 83
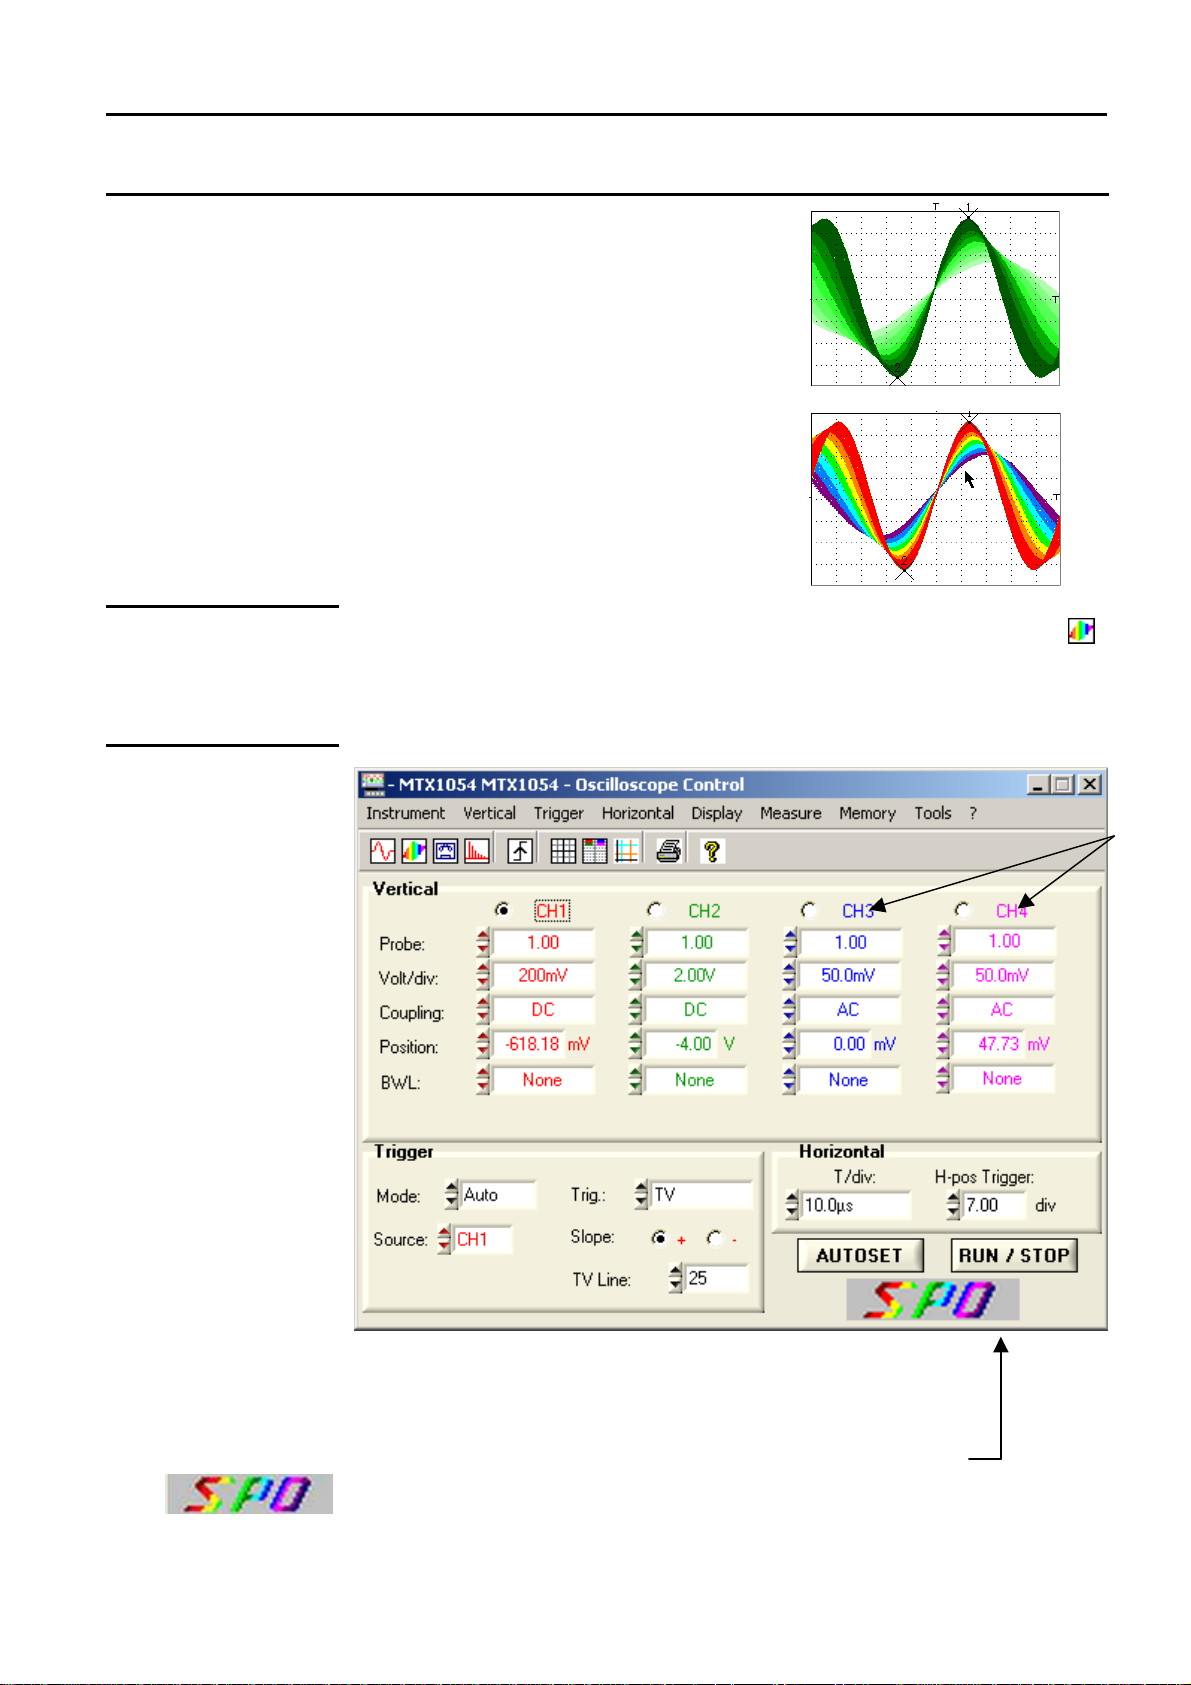
Oscilloscope with SPO Persistence Instrument
"Oscilloscope with SPO Persistence" instrument
Examples
Display
SPO Control Panel
Monochrome representation (one
colour per trace):
- the dark green points recur
frequently,
- the light green points recur less
frequently.
Multicolour representation:
- the red points are often renewed
- the purple points are renewed less
often.
On the Instrument menu, click on SPO Persistence (or click on the SPO
icon on the toolbar).
The Oscilloscope Control Panel and Oscilloscope Trace display window
appear.
(∗) MATH3, MATH4 for
the MTX 1052
(∗)
The toolbars and drop-down menus are identical to those in
Oscilloscope mode, the settings boxes also.
An SPO sign at the bottom right of the screen indicates to the
user that the oscilloscope is operating in analogue persistence
mode.
Find Quality Products Online at: sales@GlobalTestSupply.com
150 MHz virtual digital oscilloscopes IV - 83
www.GlobalTestSupply.com
Page 84
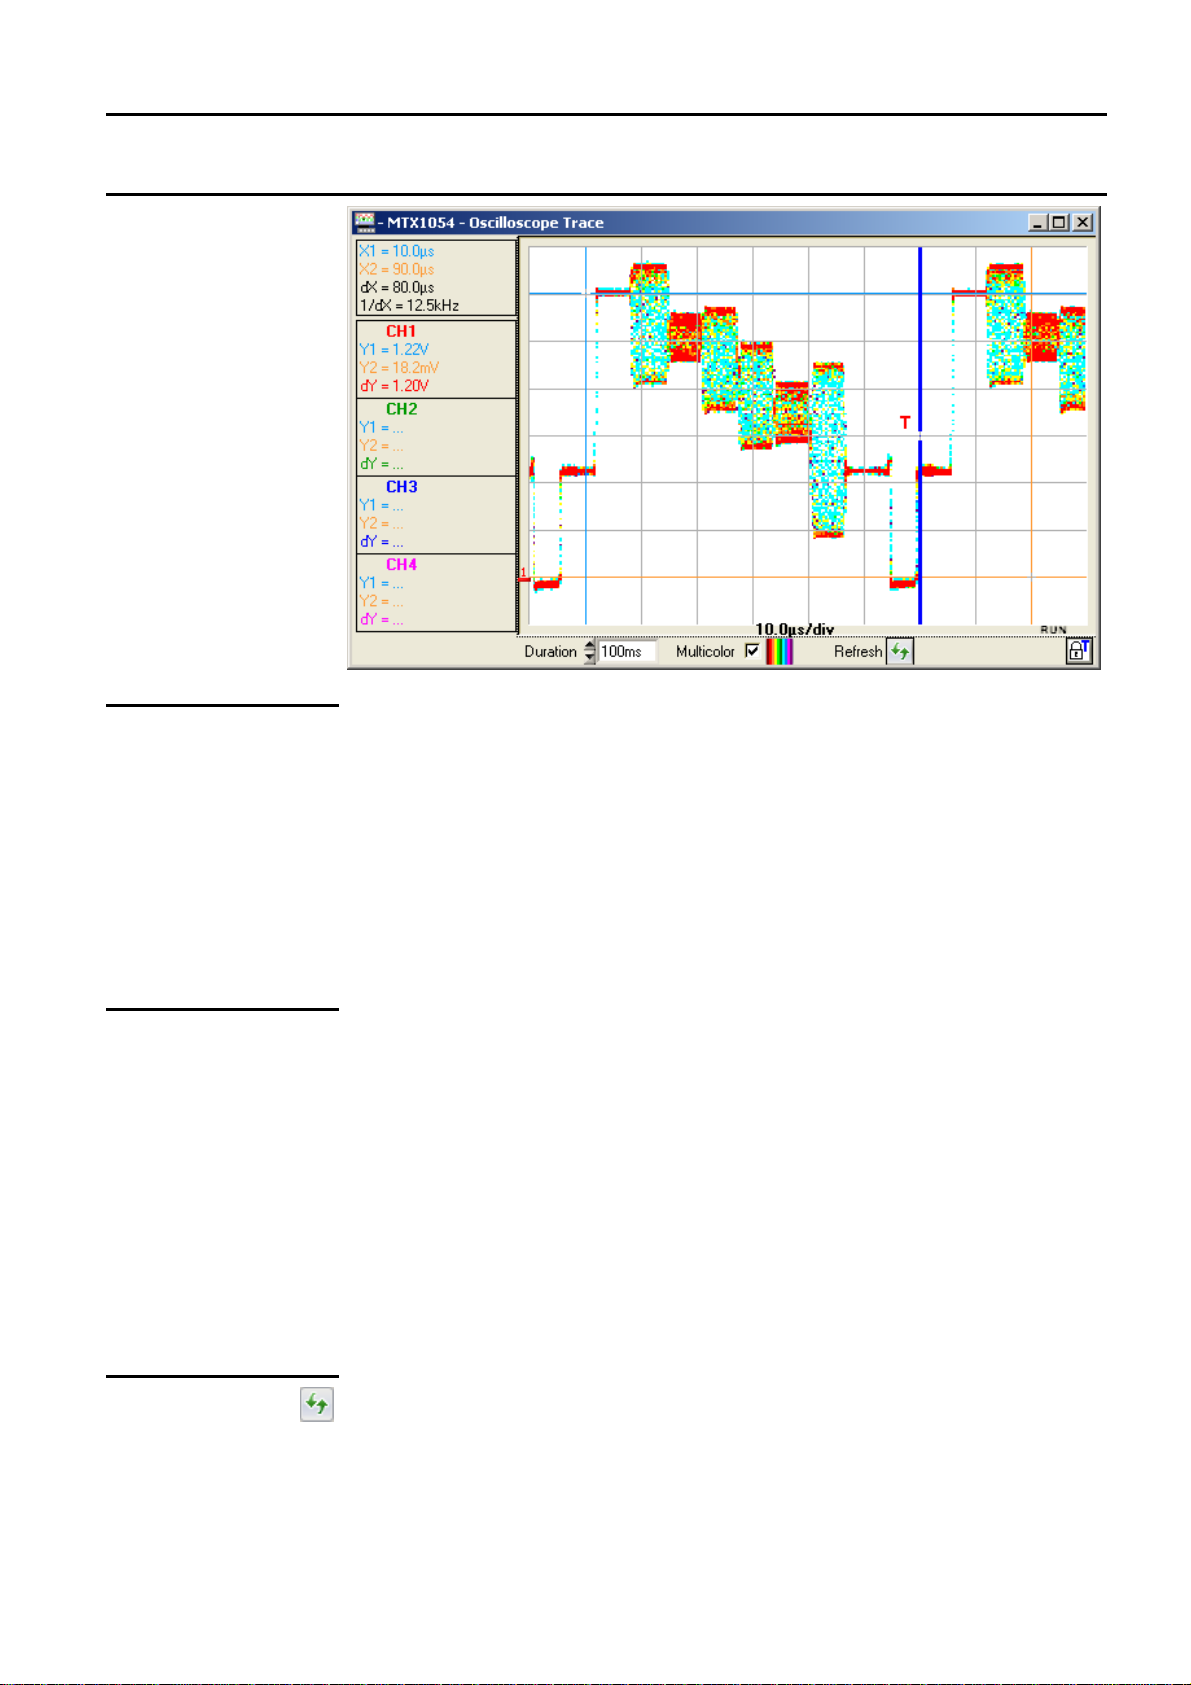
Oscilloscope with SPO Persistence Instrument
"Oscilloscope with SPO Persistence" Instrument (contd.)
Oscilloscope Trace
Window
Period
Multicolour
Setting the point persistence period:
• 100 ms
• 200 ms
• 500 ms
• 1 s
• 2 s
• 5 s
• 10 s
• infinit
started are aggregated)
Setting the representation type:
• With Multicolour validated:
- the brightest colour is assigned to the most frequent points:
red
- the dullest colour is assigned to the least frequent points:
purple
• With Multicolour not validated:
- the darkest colour is assigned to the most frequent points:
( Example: bright red for channel CH1)
- the lightest colour to the least frequent points
( Example: very light red for channel CH1)
e (all the points acquired since the last time acquisition was
Screen refreshment
By clicking on this button, the points displayed are erased and the
acquisition system reset.
Find Quality Products Online at: sales@GlobalTestSupply.com
IV - 84 150 MHz virtual digital oscilloscopes
www.GlobalTestSupply.com
Page 85

Oscilloscope with SPO Persistence Instrument
"Oscilloscope with SPO Persistence" instrument
Menus
Vertical
Trigger
Horizontal
Display
Measurement
Memory
The Vertical menu limits the user to the choice of the vertical unit.
Mathematical functions cannot be defined.
Ditto Oscilloscope mode.
The Horizontal menu limits the user to the selection/deselection of Min/Max
acquisition mode.
The Display menu limits the user to activation/deactivation of display of the
grid or units, coupling and limitation of the band of each channel active on
the trace.
The Measurement menu is limited to manual measurement with unattached
cursors and manual phase measurement.
This menu enables traces to be saved/recalled to/from .PER files and
instrument settings in .CFG files.
Tools
"?"
This menu is identical to oscilloscope mode but no EXCEL export is
possible.
This menu is identical to the one in Oscilloscope mode.
Find Quality Products Online at: sales@GlobalTestSupply.com
150 MHz virtual digital oscilloscopes IV - 85
www.GlobalTestSupply.com
Page 86

Oscilloscope with SPO Persistence Instrument
(blank page required)
Find Quality Products Online at: sales@GlobalTestSupply.com
IV - 86 150 MHz virtual digital oscilloscopes
www.GlobalTestSupply.com
Page 87

Oscilloscope with SPO Persistence Instrument
(blank page required)
Find Quality Products Online at: sales@GlobalTestSupply.com
150 MHz virtual digital oscilloscopes IV - 87
www.GlobalTestSupply.com
Page 88

"Recorder" Instrument
Recorder Instrument - Display
Presentation
Selection
Display
Recorder Control
Panel
The recorder makes it possible to observe very slow phenomena that are
not visible in Oscilloscope mode.
It enables signals to be acquired over a maximum period of one month.
In addition, this mode is used to capture faults according to various criteria.
These faults can be stored in the form of files on the computer.
•
Open the Instrument menu and click on Record or
•
Click on the Recorder icon on the toolbar
All the oscilloscope functions can be accessed and parameters set via:
a. the drop-down menus
b. the tool bar
c. the setting boxes
d. the control buttons
a.
b.
(∗)
c.
d.
(∗) MATH3, MATH4
for the MTX 1052
Find Quality Products Online at: sales@GlobalTestSupply.com
V - 88 150 MHz virtual digital oscilloscopes
www.GlobalTestSupply.com
Page 89

Recorder Instrument - Display
"Recorder" Instrument (contd.)
a. the drop-down
menus
b. the tool bar
c. the setting boxes
1.
There is no Horizontal menu
The functions of the icons on the toolbar are identical to those of the
oscilloscope.
(∗)
(∗) MATH3, MATH4
for the MTX 1052
2.
3.
Vertical box: the same as in Oscilloscope mode, the DC coupling is the
1.
only one permitted for each channel due to the low frequency of the
signals analysed in this mode.
2. Trigger box: see the description on the next page.
3. Horizontal box: see the description on P. 93.
4. RUN / STOP and CAPTURE command buttons:
RUN: starts acquisition
STOP: stops acquisition.
4.
transfers the 50,000 points of a recording to the PC.
Find Quality Products Online at: sales@GlobalTestSupply.com
150 MHz virtual digital oscilloscopes V - 89
www.GlobalTestSupply.com
Page 90

the signal goes outside
"Recorder" Instrument (contd.)
Recorder Instrument - Display
Trigger box
Level 1
Level 2
Type
Adjustment of the main trigger threshold level using the mouse or
keyboard.
Adjustment of the auxiliary trigger level using the mouse or keyboard. This
adjustment is only active if the Exterior trigger Type is selected (otherwise
the Level2 box is greyed out).
This window indicates the trigger type of the channel. Recorder mode
enables a condition to be simultaneously monitored for each active
channel.
Pretrig is
monitored for
each type of
trigger.
No trigger: if all the channels are in this mode, the instrument observes
the trace indefinitely (continuously). When stopped, only 50,000 points are
saved.
••••
Lower than:
triggering takes place when the
signal drops below the Level1
threshold
lower trigger
threshold.
••••
Lower/higher than
triggering takes place when the
signal drops below or rises above
the threshold.
••••
Higher than:
lower trigger
threshold
upper trigger
triggering takes place when the
signal rises above the threshold.
••••
Outside:
triggering takes place when the
signal goes outside the window
threshold
thresholds
upper trigger
the window
defined by the two thresholds,
Level1 and Level2.
Trigger:
A half-division hysteresis is applied to prevent ill-timed triggers.
Find Quality Products Online at: sales@GlobalTestSupply.com
V - 90 150 MHz virtual digital oscilloscopes
www.GlobalTestSupply.com
Page 91

Recorder Instrument - Display
"Recorder" Instrument (contd.)
Example:
Case 1
- Channel 1 is set with a 1.00V “Greater than” trigger for Level1.
- Channel 2 is set with a “Exterior” type trigger defined by a Level1 = 5.00V
and a Level2 = 4.00V.
- Channels 3 and 4 do not have any trigger.
(∗) MATH4 for the
MTX 1052
In this case, the trigger takes place on CH1 when the signal exceeds a level
of 1.00V.
(∗)
There is no trigger on CH2 because the signal amplitude is within the
window defined by Level1 = 5.00V and Level2 = -4.00V and the
programmed trigger condition is: "Outside" the window specified.
Find Quality Products Online at: sales@GlobalTestSupply.com
150 MHz virtual digital oscilloscopes V - 91
www.GlobalTestSupply.com
Page 92
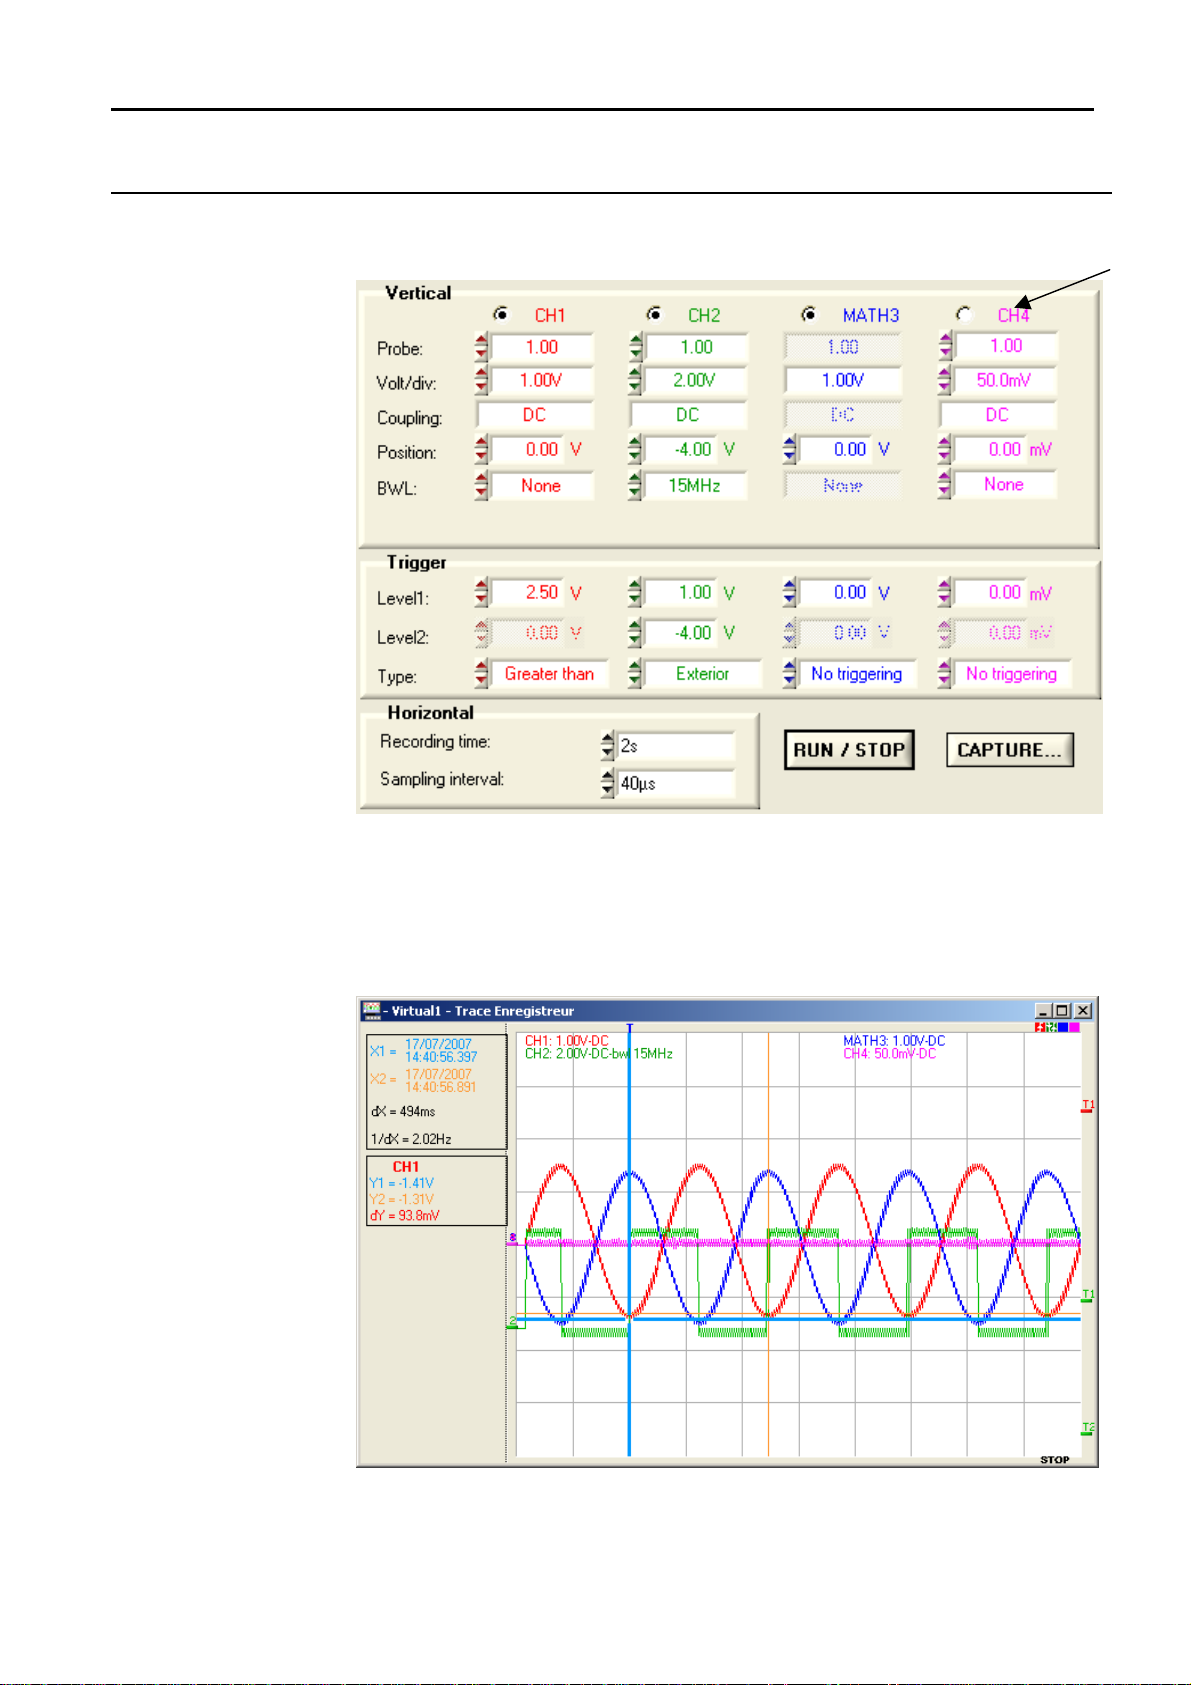
"Recorder" Instrument (contd.)
Recorder Instrument - Display
Example:
(∗) MATH4 for the
MTX 1052
Case 2
- Channel 1 is set with a 2.5V “Greater than” trigger for Level1.
- Channel 2 is set with an “Exterior" type trigger.
In this case, triggering takes place on channel CH2 since the condition on
channel CH1 is not met.
(∗)
Triggering takes place on the rising edge of CH2 when the
signal on channel CH2 exceeds 1.00V and goes out of the window specified
by "Level1 = 1.00V and Level2 = -4.00V".
Find Quality Products Online at: sales@GlobalTestSupply.com
V - 92 150 MHz virtual digital oscilloscopes
www.GlobalTestSupply.com
Page 93
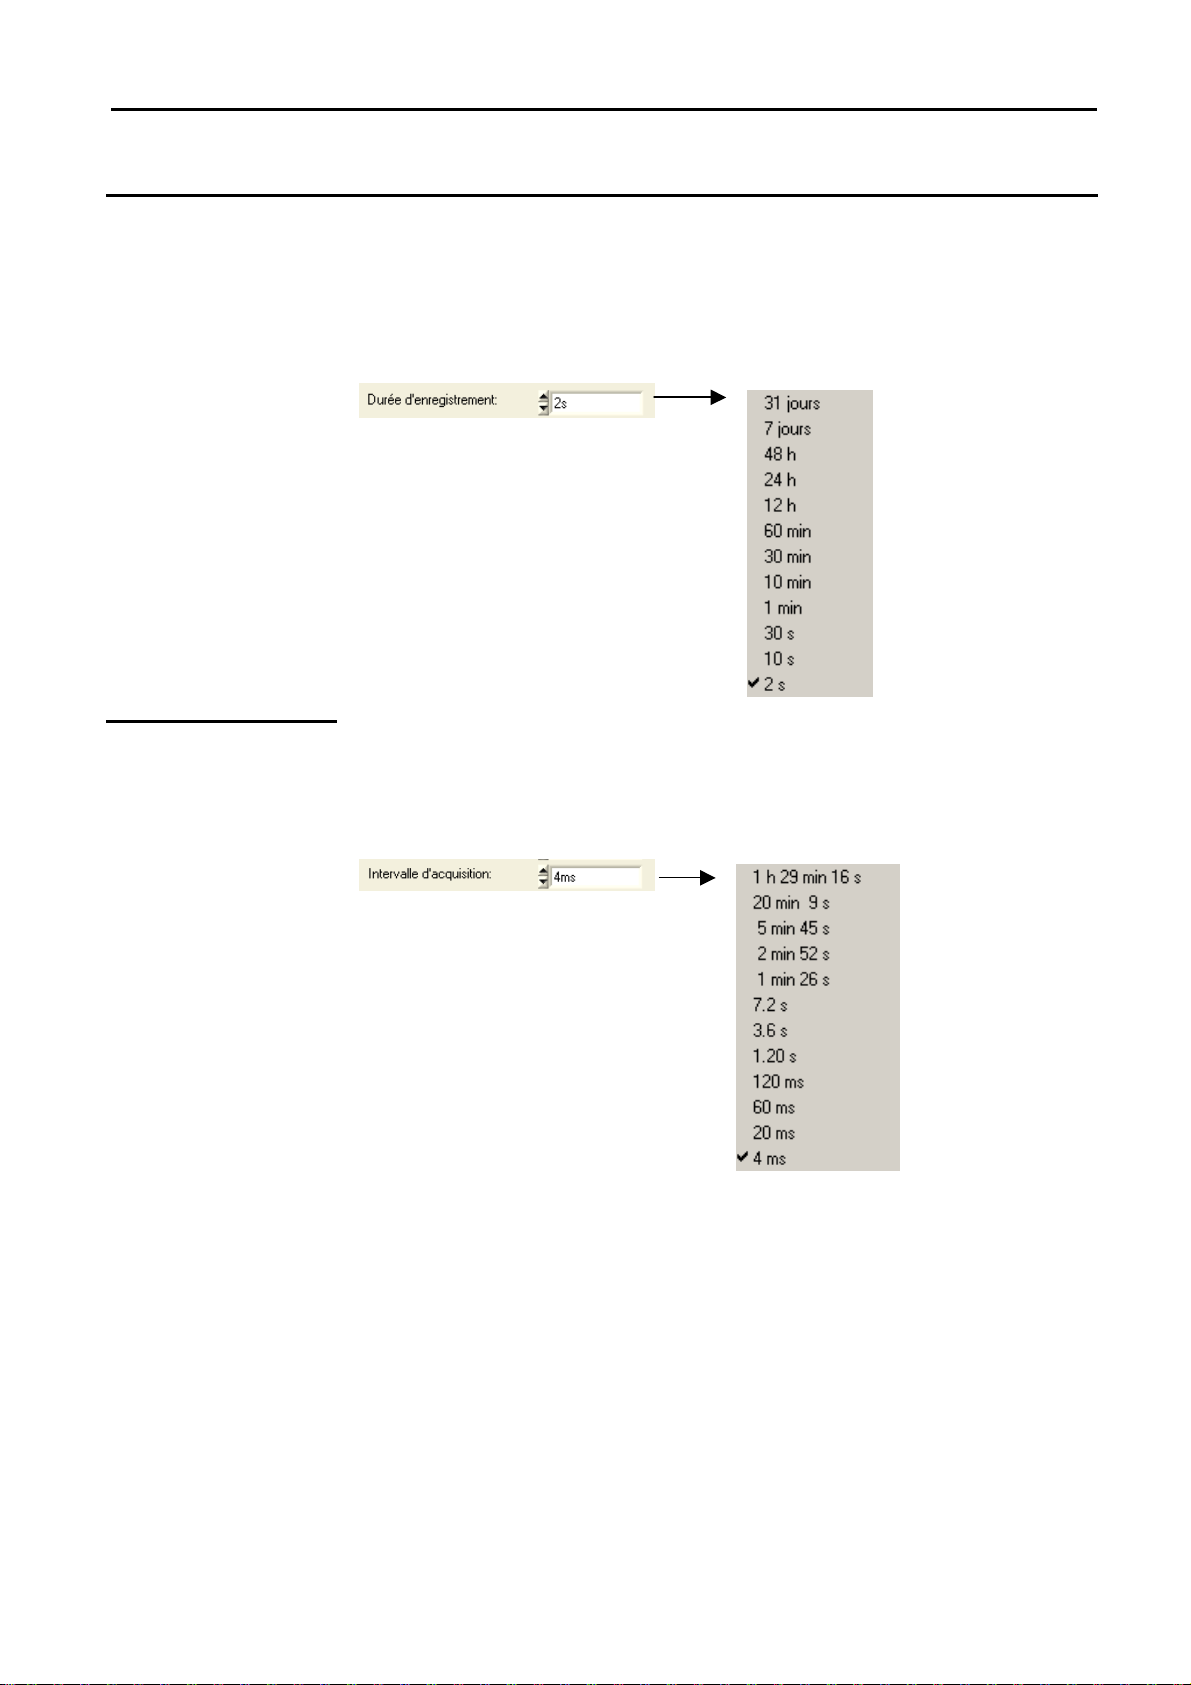
Instrument Enregistreur - La Visualisation
Instrument « Enregistreur » (suite)
Pavé « Horizontal »
Durée
d’enregistrement
Intervalle
d’acquisition
Dans ce pavé, il est possible de régler la :
Plage de variation 2 s à 31 jours : il s’agit du temps écoulé entre le 1er
point du défaut et le dernier
(Rappel : le trigger arrive 2 divisions d’écran après le 1er échantillon
visualisé, dans le cas de la visualisation d’un seul défaut).
Il s’agit du temps qui sépare 2 points de l’acquisition.
Plage de variation : 40µs à 53,57s en « Capture 1 défaut »
Plage de variation : 4ms à 1h29mn16s en « Capture 100 défauts ».
Ces deux valeurs sont corrélées. Lorsque l’utilisateur en modifie une,
l’autre est recalculée automatiquement.
Pour pouvoir régler ces valeurs, il faut agir avec la souris sur l’un des deux
ascenseurs.
Un clic dans les boîtes fait apparaître les valeurs disponibles et la valeur à
appliquer peut ainsi être sélectionnée par simple clic.
Find Quality Products Online at: sales@GlobalTestSupply.com
Oscilloscopes numériques virtuels, 150 MHz V - 93
www.GlobalTestSupply.com
Page 94

"Recorder" Instrument (contd.)
Recorder
”Trace Panel”
Recorder Instrument - Display
Display box for
manual cursor
measurements X1,
X2, Y1, Y2
Trace display box
Capture 1 fault
9.
11.
7.
10.
This display is only possible if manual measurements
(dt/dv) are activated (see Measurements menu).
1. 2. 8. 1. 3.
4.
5.
4.
6.
7.
1.
Display of the sensitivity, coupling and bandwidth of the channels activated
2.
Position of the Trigger T
3.
Types of trigger selected on the channels
4.
Traces
5.
Levels of trigger associated with the channels
6.
Current status of acquisition
7.
Recording start/end date/time
8.
Manual cursors
9.
Position "0 V" of the channels
10.
Selection of the fault to be displayed
11.
Display of the fault number
Find Quality Products Online at: sales@GlobalTestSupply.com
www.GlobalTestSupply.com
V - 94 150 MHz virtual digital oscilloscopes
Page 95

Recorder Instrument - Display
"Recorder" Instrument (contd.)
Trace display box
Capture 100 fault
1. 2.
6.
7.
8.
9. 5.
1.
Display of the sensitivity, coupling and bandwidth of the channels activated
2.
Types of trigger selected on the channels
3.
Levels of trigger associated with the channels
4.
Current status of acquisition
5.
Transition to the Next/Previous 10 faults
6.
Position "0 V" of the channels
7.
Fault separator
8.
Number of the 10 faults displayed
9.
Selection of the fault to be displayed
3.
4.
Trace display box
File capture
Number of files
created
Trigger types
Trigger higher than the last channel activated
Trigger lower than the last channel activated
Trigger higher/lower than the last channel activated
Trigger outside the window of the last channel activated
The colour of the level indicator is that of the channel activated.
Find Quality Products Online at: sales@GlobalTestSupply.com
150 MHz virtual digital oscilloscopes V - 95
www.GlobalTestSupply.com
Page 96
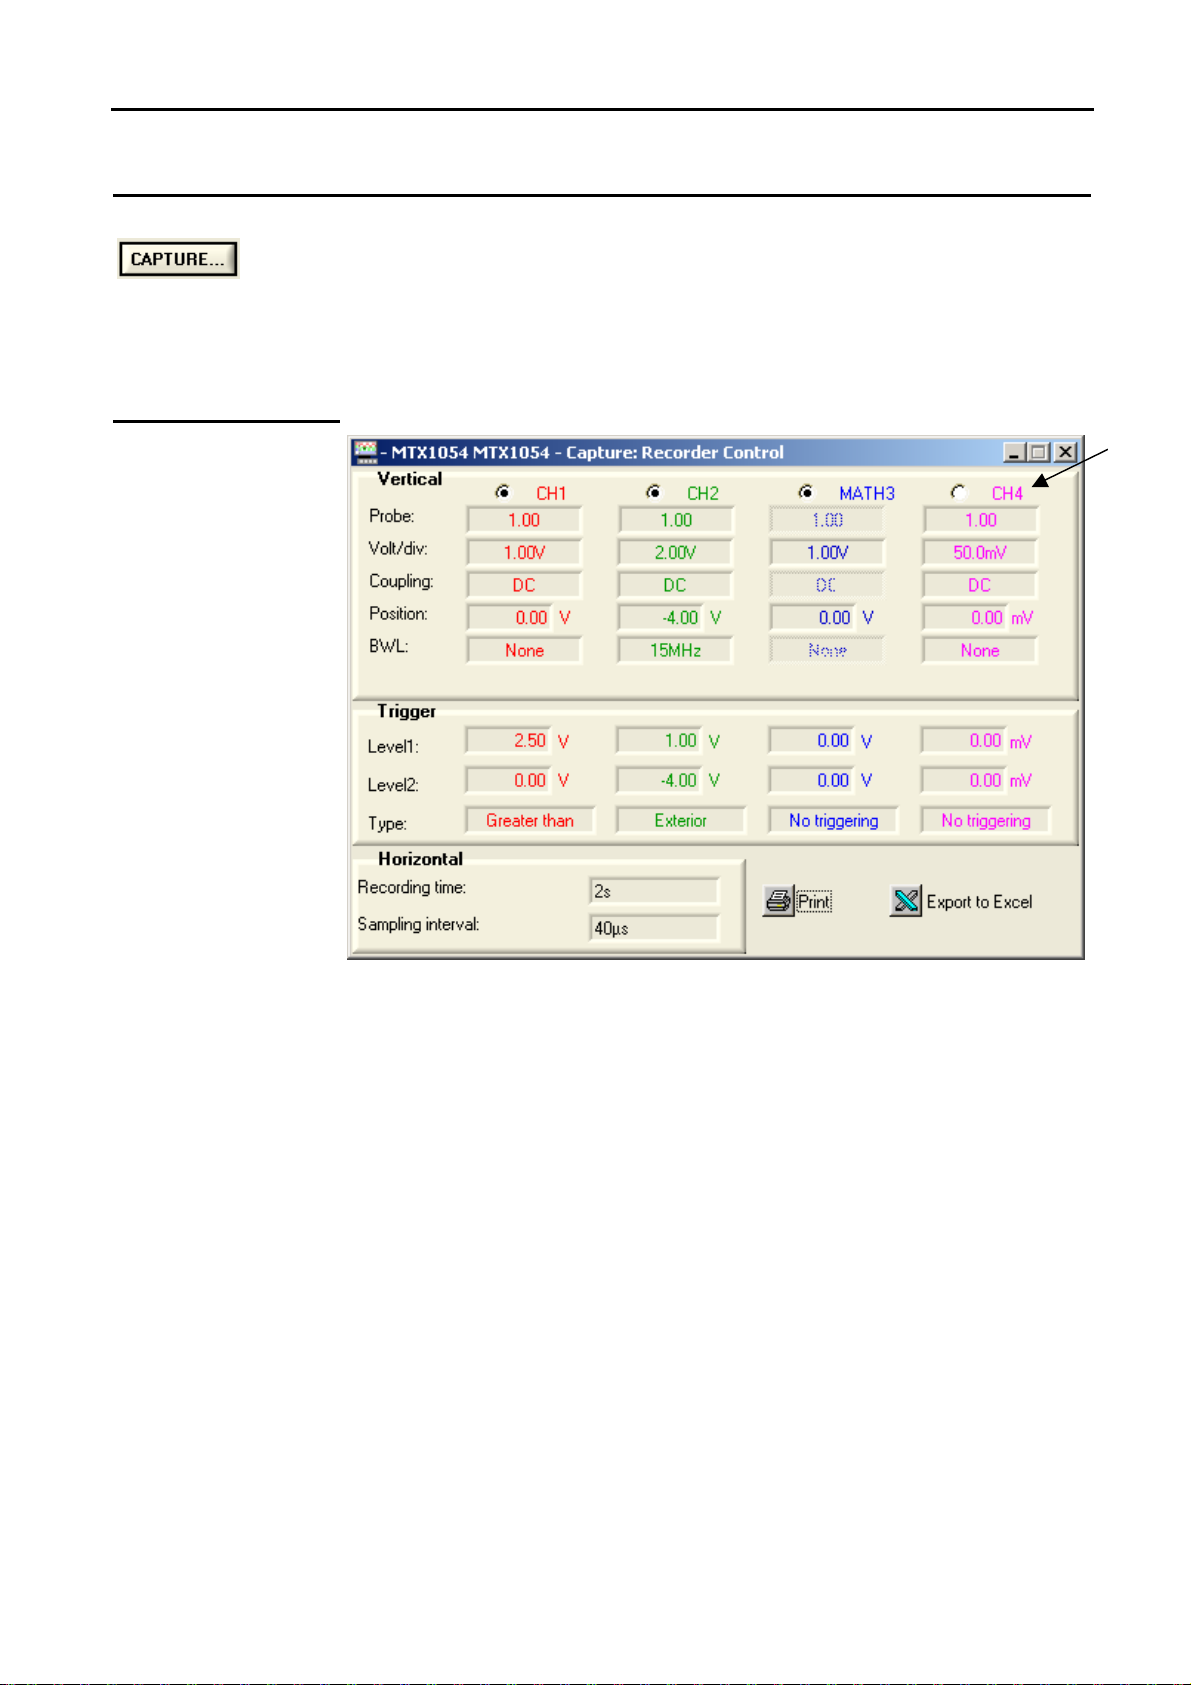
"Recorder" Instrument (contd.)
Recorder Instrument - Display
Display with the
button
Capture: Recorder
Control Panel
This button transfers the 50,000 points corresponding to a recording to the
PC and analyses them.
When this button is pressed, two additional windows are opened after
downloading:
•
Capture: Recorder Control
•
Capture: Recorder Trace
(∗)
(∗) MATH4 for
the MTX 1052
This panel indicates the values of the various parameters used to capture
this recording:
•
vertical,
•
horizontal
•
and trigger
at the moment the user clicks on the capture button.
It is associated with the Capture: Recorder Trace panel (next page)
When one of the 2 windows is closed, they disappear at the same time.
Find Quality Products Online at: sales@GlobalTestSupply.com
V - 96 150 MHz virtual digital oscilloscopes
www.GlobalTestSupply.com
Page 97

Recorder Instrument - Display
"Recorder" Instrument (contd.)
Capture: Recorder
Trace Panel
Capture 1 fault
13.
14.
15.
1. 2. 3. 4.
5.
6.
7.
8.
9.
10.
Selection of the traces to be displayed:
1.
Trigger
2.
Display of the entire recording
3.
Delimitation of the expanded zone
4.
Expansion of the zone to be displayed
5.
Compression of the zone to be displayed
6.
Back to the display of the entire recording
7.
Manual cursors
8.
Trigger level
9.
Trigger type
10.
End date and time of the expanded zone
11.
Time base
12.
Trigger position
13.
Manual cursor measurement display zone
14.
Position "0 V" of the channels
15.
Number of the fault displayed
16.
Start date and time of the expanded zone
17.
Find Quality Products Online at: sales@GlobalTestSupply.com
150 MHz virtual digital oscilloscopes V - 97
17. 16 12. 11.
www.GlobalTestSupply.com
Page 98

"Recorder" Instrument (contd.)
On this panel, both the complete recording and zoomed zone are
displayed with a rectangle indicating the position of this zone in the
recording.
The 2 cursors (blue and yellow) can be moved to take manual
measurements in the zoomed trace.
The position of the trigger in the recording is symbolised by the T.
•
The horizontal zoom factor can be adjusted by clicking on the
magnifying glass icons .
•
The zoomed zone can be moved:
slowly to the left or right by clicking on
Recorder Instrument - Display
or by 8 divisions by clicking on .
The values displayed have the same significance as in Oscilloscope
mode.
Maximum and minimum searches are possible:
Display Min & Max TraceX Menu .
Manual and automatic measurements can be activated.
Find Quality Products Online at: sales@GlobalTestSupply.com
V - 98 150 MHz virtual digital oscilloscopes
www.GlobalTestSupply.com
Page 99
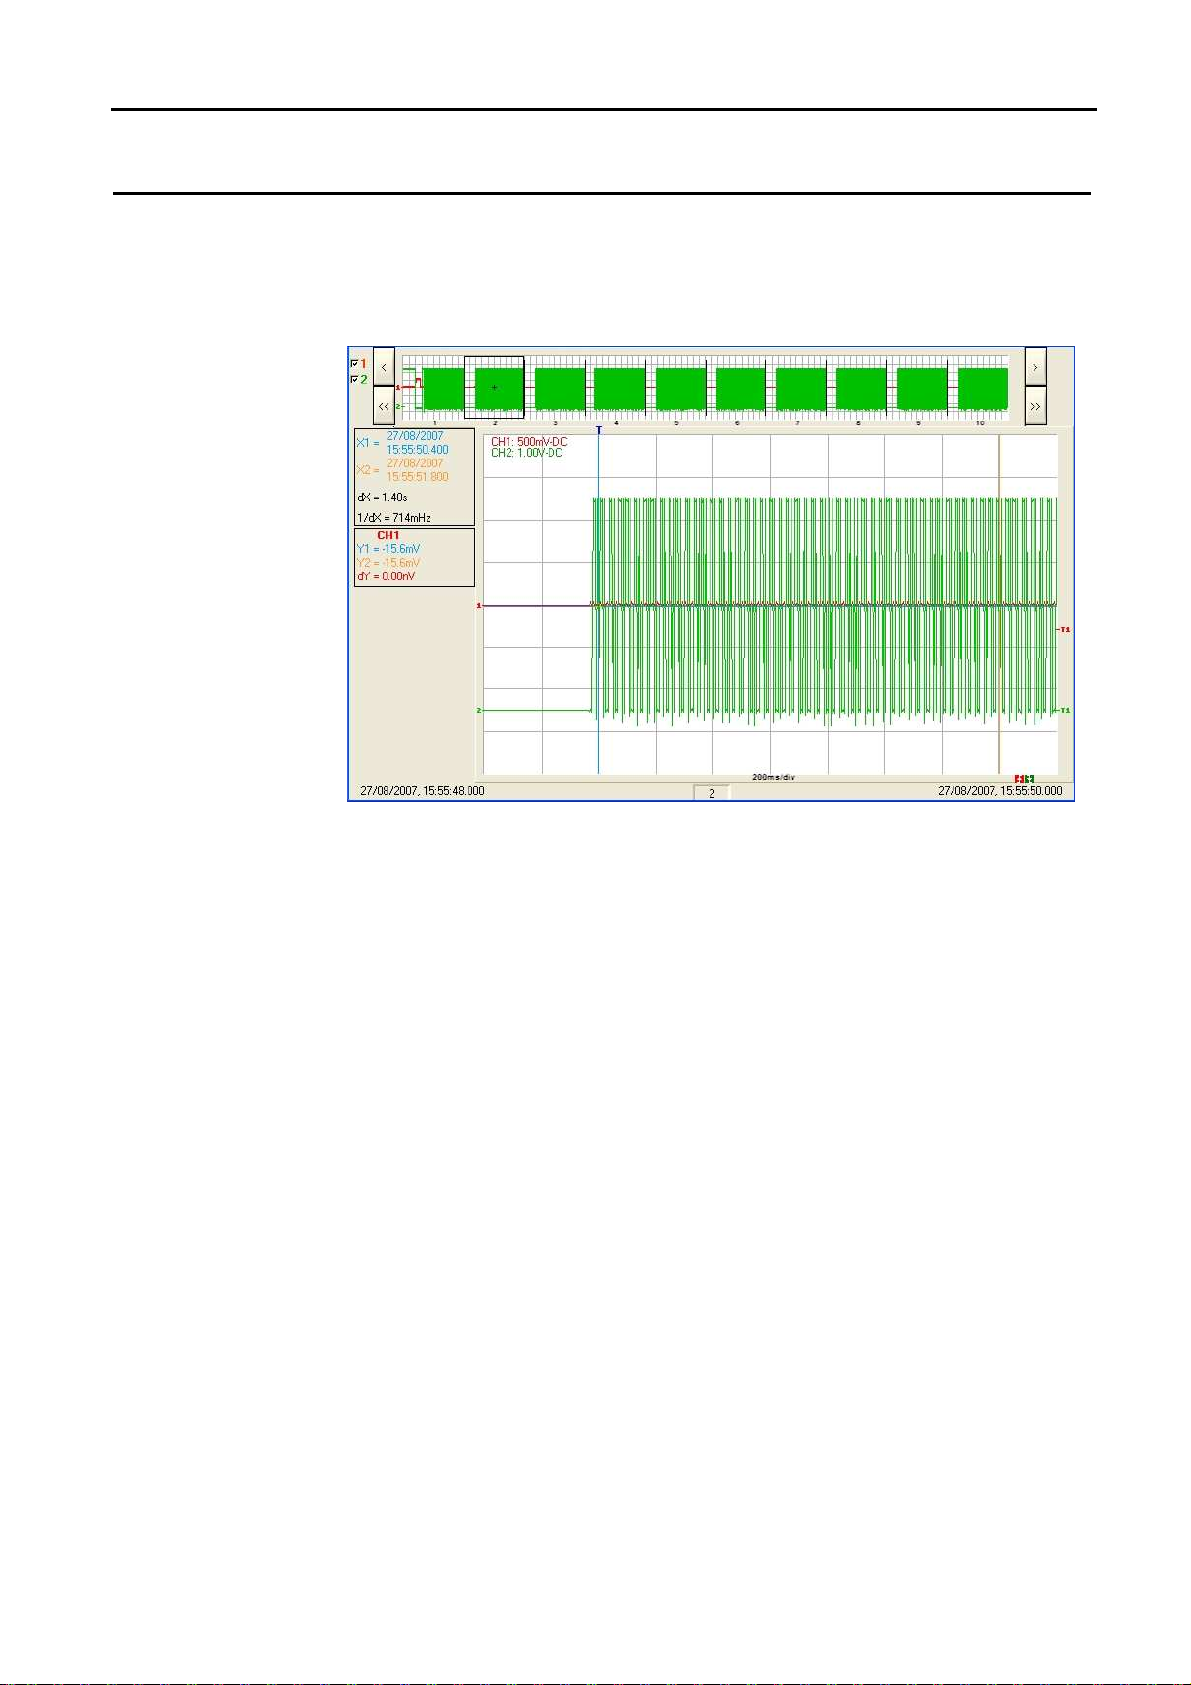
Recorder Instrument - Display
"Recorder" Instrument (contd.)
Capture: Recorder
Trace Panel
Capture 100
faults (or file capture)
Find Quality Products Online at: sales@GlobalTestSupply.com
150 MHz virtual digital oscilloscopes V - 99
www.GlobalTestSupply.com
Page 100

"Recorder" Instrument (contd.)
Oscilloscope Mode - The "Vertical" menu
The "Vertical"
menu
is identical to the one described in Oscilloscope mode. See P. 27.
MTX 1054
MTX 1052
Find Quality Products Online at: sales@GlobalTestSupply.com
V - 100 150 MHz virtual digital oscilloscopes
www.GlobalTestSupply.com
 Loading...