

Page 1
AIR INLENT TEMPERATURE (AIT) SENSOR
PRODUCT DATA
PERFORMANCE ELECTRONICS
AIR INLET TEMPERATURE (AIT) SENSOR
PART NUMBER 30-2010
FEATURES
• Design for Manufacturability
• Cost Effective
• Robust Design
• Few Components & Assembly Processes
• Thermistor Technology
• 100% Calibration Certified
Thermal & Electrical Properties Mechanical Characteristics
Typical Voltage Supply
Operating Temperature
Resistive Range(Ω
Dissipation Constant
Thermal Time Constant
Accuracy
)
Thermal Time Constant
Step Change in Temperature
Tc
Sensor Thermal Response
500
τ
5Vdc
-40°C to 135°C
See Table
N/A
‡
< 15 seconds
‡‡
See Table
‡‡
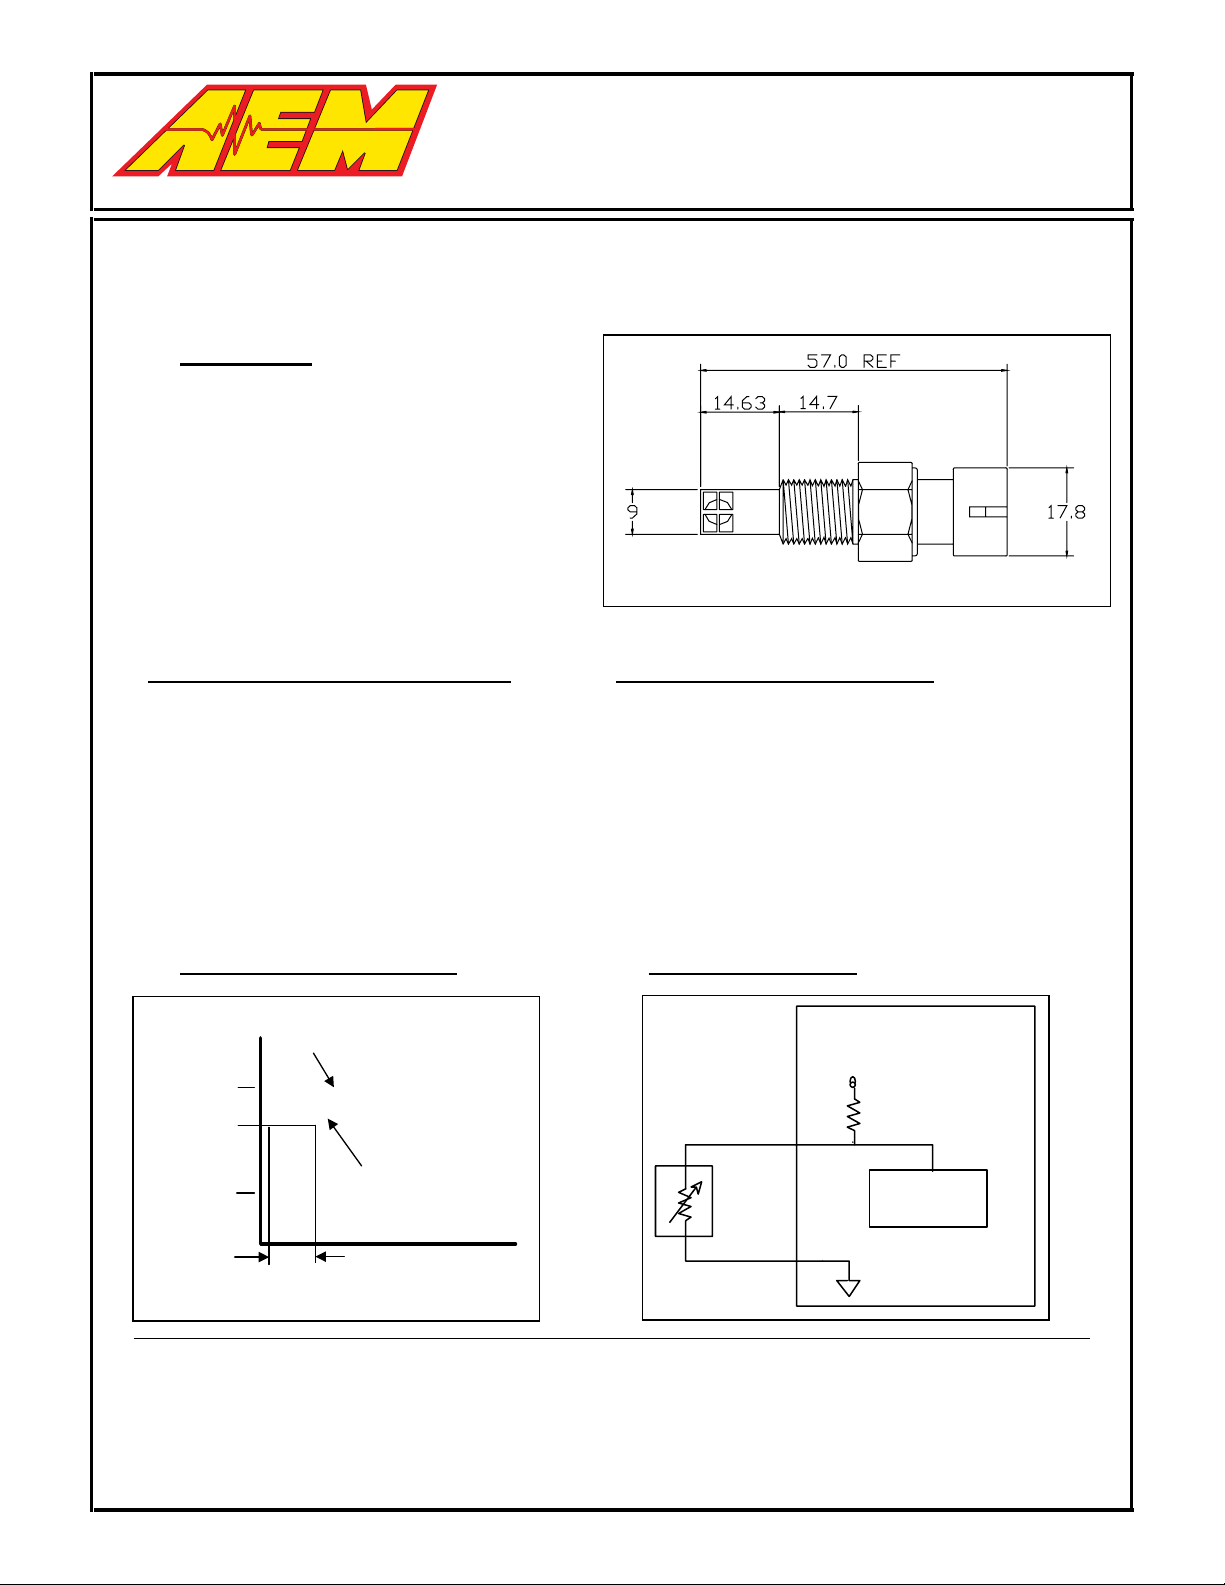
Sensor Body Material
Connector
Basket
Hex Size
Thread Size
Sealing Pressure
Installation Torque
Overall Weight
Circuit Schematic
Sensor
5 V
R
pull-up
Converter
GND
Brass Housing
PBT 30% GF
PBT 40% GF
18.90mm (3/4”)
3/8” - 18 NPT
200 kPa
20 N-m, dynamic
33.3g
ECM
A/D
‡
The ratio, at a specified ambient temperature, of the change in the power dissipation of the sensor to the
resultant temperature change of the thermistor. Test medium: silicone oil.
‡‡
The time required for the sensor to achieve 63.2% of its steady state value when subjected to a step change
in ambient temperature [Tc=(Tf-Ti)*63.2%+Ti]. Test medium: silicone oil.
Page 2
AIR INLET TEMPERATURE (AIT) SENSOR
PRODUCT DATA
PERFORMANCE ELECTRONICS
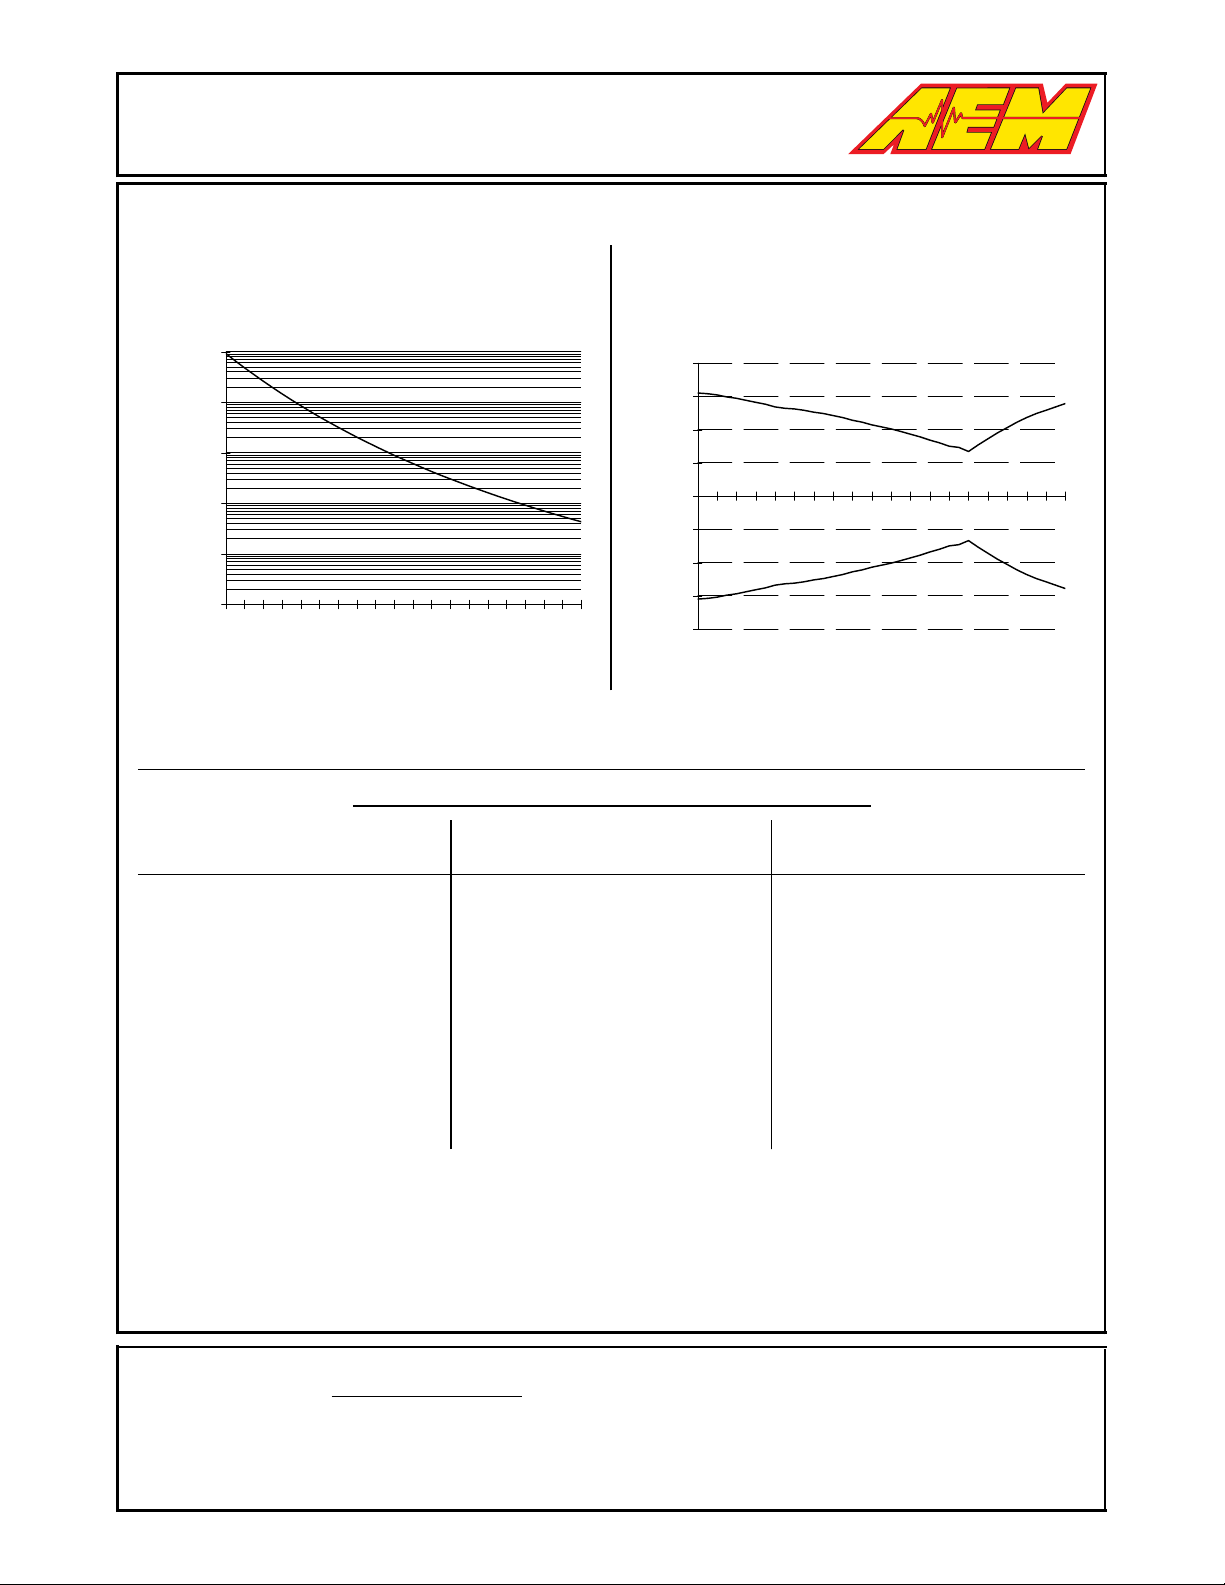
Unload Resistance-Temperature
Characteristic Chart
100000
)
10000
Ω
1000
100
10
Sensor Resistance (
1
Temperature (°C)
Note: Temperature Sensor Calibration Resistance Guaranteed by 100 % Automated Calibration Certification.
1.5
0.5
-0.5
Accuracy (°C)
-1.5
Temperature Accuracy Chart
2
1
0
-40
-1
-2
-25
5
20
-10
Temperature (°C)
35
50
65
80
95
110
125
140
Temp (°C) Ω)*
-40
-35
-30
-25
-20
-15
-10
-5
10
15
20
Important:
*Note:
99,326
71,332
51,791
37,994
28,146
21,044
15,873
12,073
0
5
The values above are for the unloaded thermistor, as shipped from AEM Performance Electronics, and does not reflect
the effects of application system errors and aging.
Please contact AEM Performance Electronics for the resistance vs. temperature curve for your temperature sensor
application. Due to self-heating effects of the thermistor, the resistance is dependent on the application.
Since thermistors are "continuous function devices", resistance vs. temperature data is available for numbers
beyond those specified above.
R( R(±%)
10.46
10.00
9.55
9.11
8.67
8.25
7.83
7.42
9,256
7,153
5,572
4,373
3,457
7.02
6.72
6.43
6.14
5.85
Unloaded Resistance-Temperature Characteristic Table
Ref. Acc.
(±°C)
1.6
1.5
1.5
1.5
1.5
1.4
1.4
1.4
1.3
1.3
1.3
1.3
1.3
Temp (°C) Ω)*
25
30
35
40
45
50
55
60
65
70
75
80
85
R( R(±%)
2,752
2,205
1,778
1,443
1,177
965
796
660
551
462
389
329
279
5.56
5.28
5.00
4.72
4.45
4.18
3.94
3.71
3.47
3.24
3.01
2.79
2.57
Ref. Acc.
(±°C)
1.2
1.2
1.2
1.1
1.1
1.1
1.0
1.0
1.0
0.9
0.9
0.8
0.8
Temp (°C) Ω)*
90
95
100
105
110
115
120
125
130
135
140
145
150
R( R(±%)
238.1
203.9
175.3
151.3
131.0
113.9
99.4
87.0
76.4
67.3
59.4
52.6
46.7
2.35
2.13
2.00
2.24
2.45
2.63
2.79
2.92
3.03
3.11
3.18
3.22
3.24
Ref. Acc.
(±°C)
0.8
0.7
0.7
0.8
0.9
1.0
1.0
1.1
1.2
1.2
1.3
1.3
1.4
For more information contact:
AEM Performance Electronics
2205 126th Street
Hawthorne, CA. 90250
Phone:
(310) 484-2322
Fax:
(310) 484-0152
E-mail:
tech@aempower.com
 Loading...