

Page 1

U3700 Series
Cover
User’s Guide
MANUAL NUMBER
Applicable Models
U3741
U3751
U3771
U3772
FOE-8440185H00
2004
C
ADVANTEST CORPORATION
All rights reserved.
First printing November 20, 2004
Printed in Japan
Page 2

Page 3

Certificate of Conformity
Certificate of Conformity
This is to certify, that
Spectrum Analyzer
U3700 Series
instrument, type, designation
complies with the provisions of the EMC Directive 89/336/EEC (All of these factors are
revised by 91/263/EEC,92/31/EEC,93/68/EEC) in accordance with EN61326
and Low Voltage Directive 73/23/EEC (All of these factors are revised by 93/68/EEC)
in accordance with EN61010.
ADVANTEST Corp. ROHDE&SCHWARZ
Tokyo, Japan Europe GmbH
Munich, Germany
3700.05
Page 4

Page 5
No. CR B00
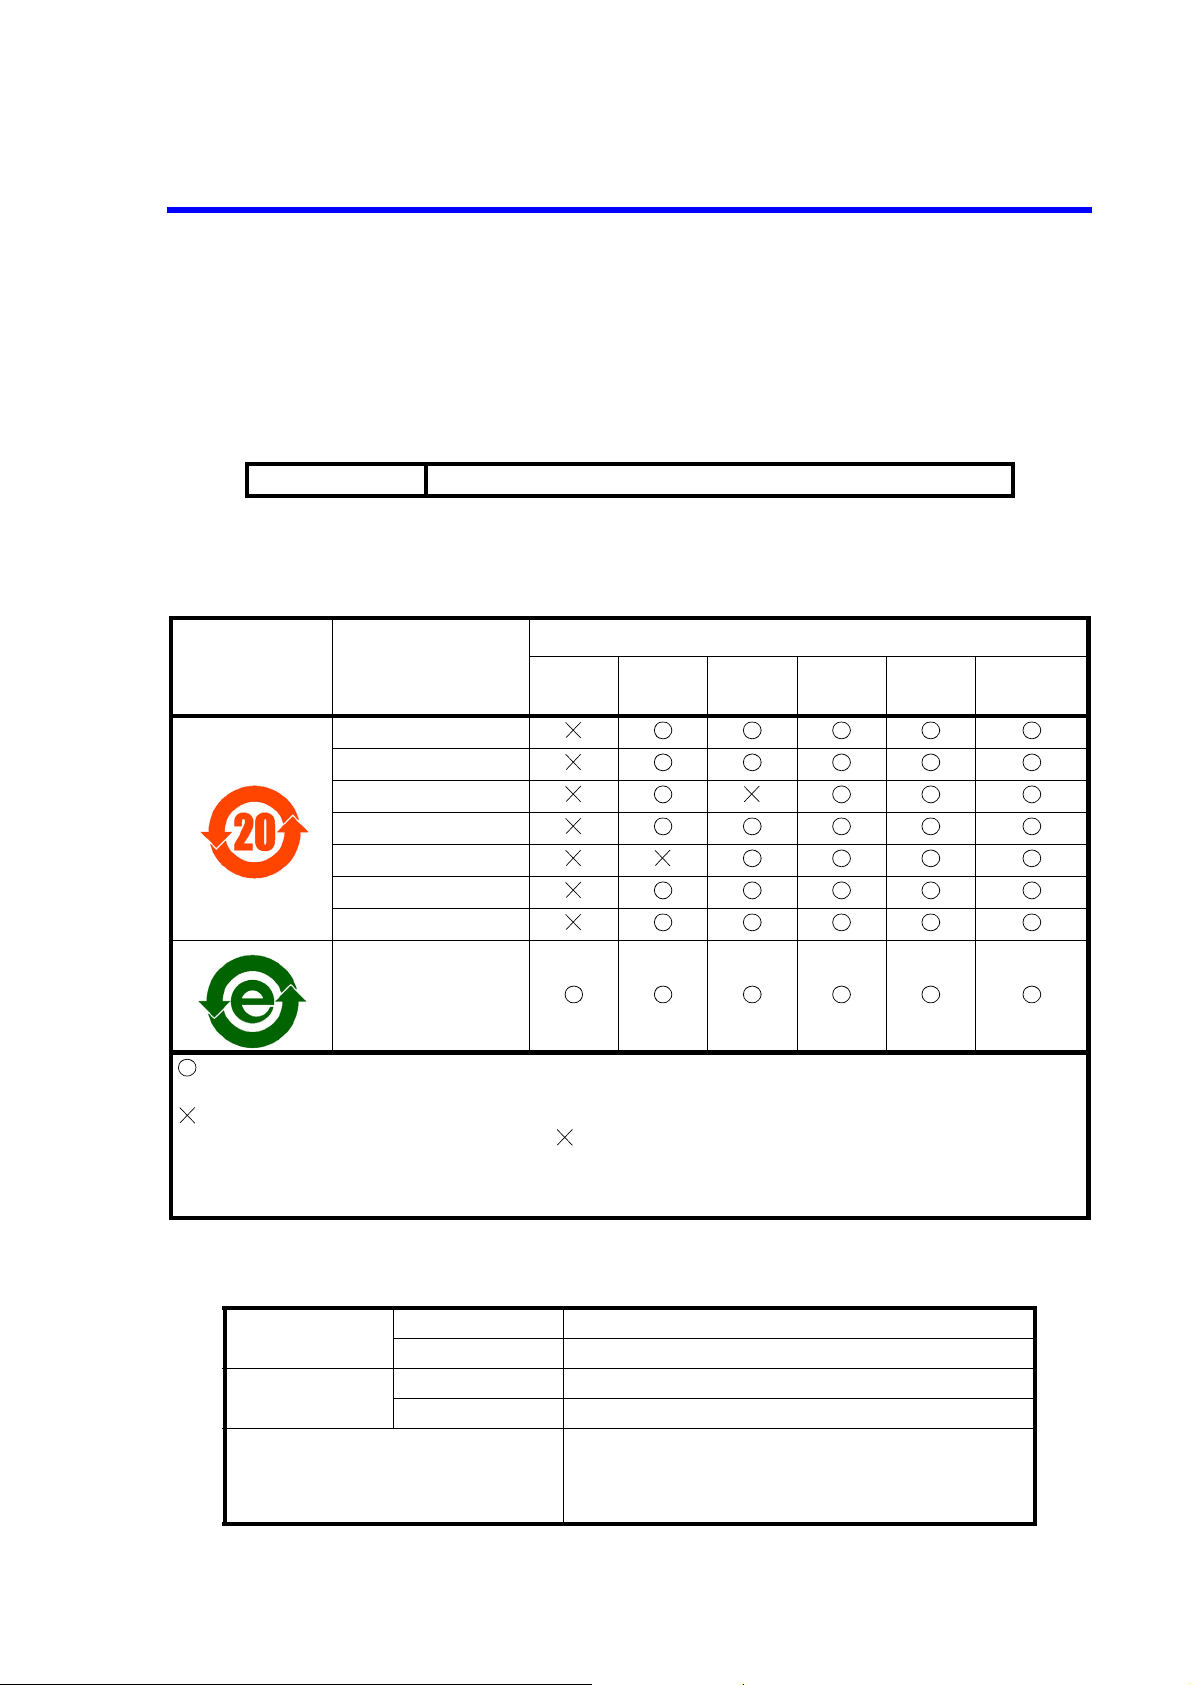
有毒有害物质含量信息说明书
• 本有毒有害含量含量说明内容是为了贯彻 [ 电子信息产品污染控制管理办法 ] 而
编制的。
This document is made for Chinese Administration on the Control of Pollution Caused by Electronic Information Products, unofficially called "China-RoHS".
この文書は、中国の「電子情報製品汚染防止管理弁法」のための文書です。
适用机种
U3741, U3751, U3771, U3772
1. 产品中贴有电子信息产品污染控制标志及
产品中有毒有害物质或元素的名称及含量
电子信息产品污染
控制标志
部件名称
Main frame
Boards
Power supply parts
Cable
LCD Panel
Module
Parts
CD-ROM
铅
(Pb)
汞
(Hg)
有毒有害物质或元素
镉
(Cd)
六价铬
(Cr(VI))
多溴联苯
(PBB)
多溴二苯醚
(PBDE)
: 表示该有毒有害物质在该部件所有均质材料中的含量均在 SJ/T11363-2006 规定的限量要求以下。
: 表示该有毒有害物质至少在该部件的某一均质材料中的含量超出 SJ/T11363-2006 规定的限量要求。
(企业可在此处,根据实际情况对上表中打 的技术原因进行进一步说明。)
本表对此次发送产品中所有部件中有毒有害物质的含量,全部作了注明。另外,也有可能包含了与本次
发送的产品无关的部件的相关信息。
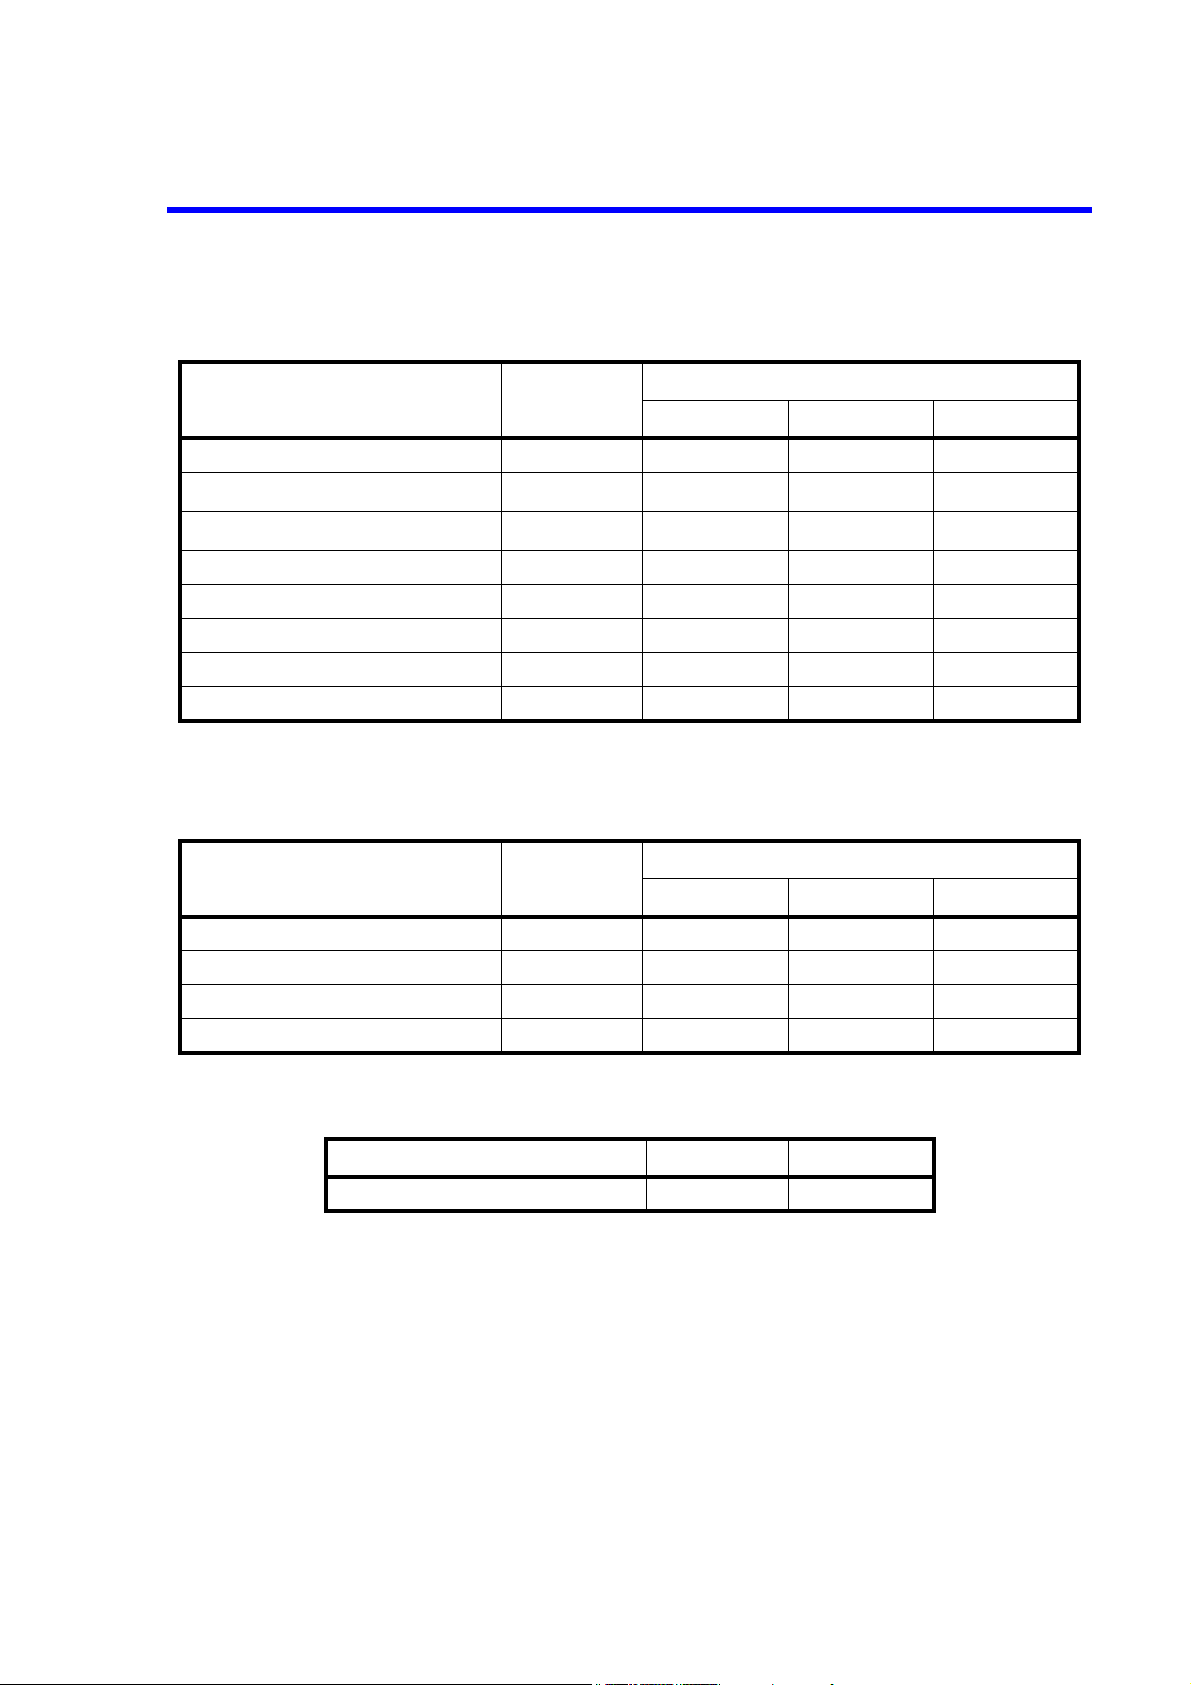
2. 环保使用期限内的使用条件
运作环境
设置环境
温度范围
相对湿度 在 85% 以下 (但是,不得结霜)
温度范围
相对湿度 在 85% 以下 (但是,不得结霜)
周围环境
0°C ~ +50°C
-20°C ~ +60°C
不会产生腐蚀性气体的地方
不是直射阳关的地方
灰尘少的地方
没有震动的地方
CR-1
Page 6

Page 7

TABLE OF CONTENTS
U3700 Series User’s Guide
TABLE OF CONTENTS
1. INTRODUCTION ....................................................................................... 1-1
1.1 Contents of This Manual ................................................................................... 1-1
1.2 Product Overview .............................................................................................. 1-2
1.3 Conventions of Notation Used in This Document ............................................ 1-2
1.4 Advantest Homepage ........................................................................................ 1-3
2. PRECAUTIONS WHEN USING THE U3700 .................................... 2-1
2.1 If a Fault Occurs ................................................................................................ 2-1
2.2 Removing the Case ........................................................................................... 2-1
2.3 Electromagnetic Interference ............................................................................ 2-1
2.4 Note when Turning on the Power ..................................................................... 2-1
3. SETUP ............................................................................................................ 3-1
3.1 Inspection on Delivery ...................................................................................... 3-1
3.2 Locating This Instrument .................................................................................. 3-3
3.2.1 Operating Environment .............................................................................. 3-3
3.3 Power Supply .................................................................................................... 3-4
3.3.1 Using the AC Power Supply ....................................................................... 3-4
3.3.1.1 AC Power Requirements ............................................................................ 3-4
3.3.1.2 Connecting the Power Cable ...................................................................... 3-5
3.3.2 Using a Battery ........................................................................................... 3-6
3.3.2.1 Battery Mount System ................................................................................ 3-6
3.3.2.2 Charging the Battery ................................................................................... 3-7
3.3.3 Using the External DC Power Supply ........................................................ 3-8
3.3.3.1 DC Power Requirements ............................................................................ 3-8
3.3.3.2 Connecting the DC Power Cable ................................................................ 3-8
3.4 Caution when Connecting Peripherals .............................................................. 3-9
3.5 Checking Operations ......................................................................................... 3-10
4. INSTRUMENT CONFIGURATION AND BASIC OPERATIONS 4-1
4.1 Panel and Screen Descriptions .......................................................................... 4-1
4.1.1 Names and Functions of Each Part on the Front Panel .............................. 4-1
4.1.2 Names and Functions of Each Part on the Screen ...................................... 4-7
4.1.3 Names and Functions of Each Part on the Rear Panel ............................... 4-9
4.2 Basic Operation ................................................................................................. 4-10
4.2.1 Menu Operation and Data Entry ................................................................. 4-10
4.3 Basic Measurement ........................................................................................... 4-13
4.3.1 Calibration .................................................................................................. 4-13
4.3.2 Displaying Spectrum and Operating Markers ............................................ 4-17
4.3.3 How to Cancel the UNCAL Message ........................................................ 4-22
4.3.4 Identifying an Image Signal ....................................................................... 4-25
4.3.5 Hard Copy Output ...................................................................................... 4-27
4.3.5.1 Output to a Printer ...................................................................................... 4-27
4.3.5.2 File Output to USB Memory ...................................................................... 4-28
C-1
Page 8

U3700 Series User’s Guide
Table of Contents
4.3.6 Measuring by using the TG (OPT76/OPT77) ............................................ 4-30
4.3.7 USER Key .................................................................................................. 4-36
4.4 Measurement Examples .................................................................................... 4-37
4.4.1 Using the Normalize Function and Level Correction Table ...................... 4-37
4.4.2 W-CDMA Channel Power Measurement ................................................... 4-43
4.4.3 W-CDMA Adjacent Channel Leakage Power (ACP) Measurement ......... 4-45
4.4.4 W-CDMA Spurious Measurement ............................................................. 4-48
4.4.5 CN Measurement in Terrestrial Digital Broadcasting ................................ 4-51
4.4.6 Television Signal Measurement ................................................................. 4-57
4.4.7 VSWR Measurement .................................................................................. 4-59
5. MENU MAP, FUNCTIONAL EXPLANATION ............................... 5-1
5.1 Menu Index ....................................................................................................... 5-1
5.2 Functional Descriptions .................................................................................... 5-7
5.2.1 SYSTEM .................................................................................................... 5-7
5.2.2 APPLI ......................................................................................................... 5-17
5.2.3 FILE ............................................................................................................ 5-18
5.2.4 COPY ......................................................................................................... 5-24
5.2.5 HELP .......................................................................................................... 5-24
5.2.6 MEAS 1 ...................................................................................................... 5-25
5.2.7 MEAS 2 ...................................................................................................... 5-36
5.2.8 TRACE ....................................................................................................... 5-43
5.2.9 MKR ........................................................................................................... 5-47
5.2.10 PEAK .......................................................................................................... 5-50
5.2.11 MKR→ ....................................................................................................... 5−54
5.2.12 TG (Option) ................................................................................................ 5-55
5.2.13 FREQUENCY ............................................................................................ 5-57
5.2.14 SPAN .......................................................................................................... 5-61
5.2.15 AMPLITUDE ............................................................................................. 5-62
5.2.16 EXT CFG (Extended Configuration options) ............................................. 5-65
5.2.17 CPL (Coupled function) ............................................................................. 5-72
6. OVERVIEW OF REMOTE CONTROL ............................................... 6-1
6.1 Remote Control ................................................................................................. 6-1
6.1.1 Types of Systems ........................................................................................ 6-1
6.1.2 Selecting the Command Set ........................................................................ 6-1
6.2 GPIB Remote Control System .......................................................................... 6-2
6.2.1 What is the GPIB? ...................................................................................... 6-2
6.2.2 Setting up the GPIB .................................................................................... 6-3
6.2.3 GPIB Bus Functions ................................................................................... 6-4
6.2.3.1 GPIB Interface Functions ........................................................................... 6-4
6.2.3.2 Responses to Interface Messages ............................................................... 6-4
6.3 LAN Remote Control System ........................................................................... 6-6
6.3.1 Setting up the LAN ..................................................................................... 6-6
6.3.2 Setting the IP Address ................................................................................ 6-8
6.3.3 Control from a Controller ........................................................................... 6-9
6.4 Message Exchanging Protocol .......................................................................... 6-10
6.4.1 Buffers ........................................................................................................ 6-10
C-2
Page 9

U3700 Series User’s Guide
Table of Contents
6.4.2 Message Exchange ..................................................................................... 6-10
6.5 Command Syntax .............................................................................................. 6-11
6.5.1 Command Syntax ....................................................................................... 6-11
6.5.2 Data Formats .............................................................................................. 6-12
6.5.3 Status Byte .................................................................................................. 6-13
6.6 GPIB Remote Programming ............................................................................. 6-19
6.7 AT Command Index .......................................................................................... 6-19
6.8 AT Command List ............................................................................................. 6-24
6.8.1 Frequency ................................................................................................... 6-24
6.8.2 Level ........................................................................................................... 6-26
6.8.3 Bandwidth ................................................................................................... 6-27
6.8.4 Sweep ......................................................................................................... 6-28
6.8.5 Trigger ........................................................................................................ 6-28
6.8.6 Trace ........................................................................................................... 6-29
6.8.7 Pass/Fail ...................................................................................................... 6-32
6.8.8 Display ........................................................................................................ 6-33
6.8.9 Marker ........................................................................................................ 6-34
6.8.10 Peak and Marker Move .............................................................................. 6-36
6.8.11 Peak ............................................................................................................ 6-37
6.8.12 Measurement .............................................................................................. 6-38
6.8.13 Counter ....................................................................................................... 6-41
6.8.14 Power .......................................................................................................... 6-42
6.8.15 EMC ........................................................................................................... 6-46
6.8.16 Calibration .................................................................................................. 6-46
6.8.17 Save/Recall ................................................................................................. 6-47
6.8.18 File Management ........................................................................................ 6-49
6.8.19 Config ......................................................................................................... 6-49
6.8.20 Preset .......................................................................................................... 6-50
6.8.21 GPIB ........................................................................................................... 6-50
6.8.22 Others ......................................................................................................... 6-51
6.8.23 TG ............................................................................................................... 6-52
6.8.24 Units ........................................................................................................... 6-53
6.9 Example of Remote Control Programs ............................................................. 6-54
6.9.1 Basic Steps for GPIB Bus Control ............................................................. 6-54
6.9.1.1 Reading the GPIB Control Library for Visual Basic .................................. 6-54
6.9.1.2 Program Examples Using VB .................................................................... 6-54
6.9.1.3 Sample Programs for Reading Data ........................................................... 6-57
6.9.1.4 Sample Programs for Inputting or Outputting Trace Data ......................... 6-62
6.9.1.5 Example Program for Screen Image Output .............................................. 6-69
6.9.1.6 Example Program Which Uses the TS (Take Sweep) Command .............. 6-70
6.9.1.7 Example Programs Which Use the Status Byte ......................................... 6-71
6.9.1.8 Program Examples Using the LAN ............................................................ 6-72
6.10 SCPI Command Reference ............................................................................... 6-75
6.10.1 Command Reference Syntax ...................................................................... 6-75
6.10.2 Common Commands .................................................................................. 6-77
6.10.3 List of Commands ...................................................................................... 6-78
6.10.3.1 Subsystem-CALCulate ............................................................................... 6-78
6.10.3.2 Subsystem-CALibration ............................................................................. 6-84
6.10.3.3 Subsystem-CONFigure ............................................................................... 6-85
6.10.3.4 Subsystem-COUPle .................................................................................... 6-85
C-3
Page 10

U3700 Series User’s Guide
Table of Contents
6.10.3.5 Subsystem-DISPlay .................................................................................... 6-85
6.10.3.6 Subsystem-FETch ....................................................................................... 6-89
6.10.3.7 Subsystem-FORMat ................................................................................... 6-90
6.10.3.8 Subsystem-HCOPy ..................................................................................... 6-90
6.10.3.9 Subsystem-INITiate .................................................................................... 6-91
6.10.3.10 Subsystem-INPut ........................................................................................ 6-91
6.10.3.11 Subsystem-MMEMory ............................................................................... 6-91
6.10.3.12 Subsystem-OUTPut .................................................................................... 6-92
6.10.3.13 Subsystem-READ ....................................................................................... 6-92
6.10.3.14 Subsystem-SENSe ...................................................................................... 6-94
6.10.3.15 Subsystem-SOURce ................................................................................... 6-103
6.10.3.16 Subsystem-SYSTem ................................................................................... 6-103
6.10.3.17 Subsystem-TRACe ..................................................................................... 6-104
6.10.3.18 Subsystem-TRIGger ................................................................................... 6-105
6.10.3.19 Subsystem-UNIT ........................................................................................ 6-105
6.10.3.20 Units ........................................................................................................... 6-106
6.10.4 Example Programs in which SCPI Commands Are Used .......................... 6-107
7. SPECIFICATIONS ...................................................................................... 7-1
7.1 U3741 Performance Specifications ................................................................... 7-2
7.1.1 Frequency ................................................................................................... 7-2
7.1.2 Sweep ......................................................................................................... 7-3
7.1.3 Amplitude ................................................................................................... 7-3
7.1.4 Amplitude Accuracy ................................................................................... 7-4
7.1.5 Dynamic Range .......................................................................................... 7-4
7.1.6 Input and Output ......................................................................................... 7-5
7.2 U3751 Performance Specifications ................................................................... 7-6
7.2.1 Frequency ................................................................................................... 7-6
7.2.2 Sweep ......................................................................................................... 7-7
7.2.3 Amplitude ................................................................................................... 7-7
7.2.4 Amplitude Accuracy ................................................................................... 7-8
7.2.5 Dynamic Range .......................................................................................... 7-8
7.2.6 Input and Output ......................................................................................... 7-9
7.3 U3771/U3772 Performance Specifications ....................................................... 7-10
7.3.1 Frequency ................................................................................................... 7-10
7.3.2 Sweep ......................................................................................................... 7-11
7.3.3 Amplitude ................................................................................................... 7-11
7.3.4 Amplitude Accuracy ................................................................................... 7-12
7.3.5 Dynamic Range .......................................................................................... 7-13
7.3.6 Input and Output ......................................................................................... 7-14
7.4 General Specifications ...................................................................................... 7-15
7.5 Options .............................................................................................................. 7-16
7.5.1 Option 10 2-Channel Input Option (Can be Installed only in the U3741) . 7-16
7.5.2 Option 15 75 Ω Input .................................................................................. 7-17
7.5.3 Option 20 High Stability Frequency Reference ......................................... 7-18
7.5.4 Option 28 EMC Filter ................................................................................. 7-19
7.5.5 Option 53 Time Domain Analysis Option .................................................. 7-19
7.5.6 Option 70 High C/N ................................................................................... 7-19
7.5.7 Option 75 75 Ω Tracking Generator ........................................................... 7-21
C-4
Page 11

U3700 Series User’s Guide
Table of Contents
7.5.8 Option 76 Tracking Generator .................................................................... 7-22
7.5.9 Option 77 6 GHz Tracking Generator ........................................................ 7-23
8. OPTIONS AND ACCESSORIES ........................................................... 8-1
8.1 Options .............................................................................................................. 8-1
8.2 Accessories ........................................................................................................ 8-2
9. MAINTENANCE ........................................................................................ 9-1
9.1 Cleaning ............................................................................................................ 9-1
9.1.1 Cabinet Cleaning ........................................................................................ 9-1
9.1.2 Cleaning of Other Parts .............................................................................. 9-2
9.2 About Calibration .............................................................................................. 9-2
9.3 About Replacement of Limited-Life Parts ........................................................ 9-2
9.4 Method of Storing the Instrument ..................................................................... 9-3
9.5 Transportation ................................................................................................... 9-3
9.6 Notes for Requesting Repair, Replacement of Parts, and Periodic Calibration 9-3
9.6.1 Work Request ............................................................................................. 9-3
9.6.2 Destination and Phone Number for Contact ............................................... 9-3
9.7 List of Error Messages ...................................................................................... 9-4
9.8 In Case of Difficulty .......................................................................................... 9-9
9.9 Product Disposal and Recycle ........................................................................... 9-10
APPENDIX ................................................................................................................. A-1
A.1 Initial Setting List .............................................................................................. A-1
A.2 Principle of Operation ....................................................................................... A-4
A.2.1 Input Saturation .......................................................................................... A-4
A.2.2 Root Nyquist Filter ..................................................................................... A-5
A.3 Glossary ............................................................................................................. A-7
A.4 dB Conversion Formula .................................................................................... A-13
A.5 Menu Map List .................................................................................................. A-14
A.6 TV Channel Table (Japan) ................................................................................ A-27
A.6.1 CATV Channel Number and Frequency .................................................... A-27
A.6.2 VHF/UHF Channel Number and Frequency .............................................. A-29
A.6.3 Terrestrial Digital Broadcasting Channel Number and Frequency ............ A-31
A.6.4 Satellite Broadcasting (BS-IF Band) Channel Number and Frequency ..... A-33
A.6.5 110 CS (CS-IF Band) Channel Number and Frequency ............................ A-33
U3741 DIMENSIONAL OUTLINE DRAWING............................................. EXT-1
U3751 DIMENSIONAL OUTLINE DRAWING............................................. EXT-2
U3771 DIMENSIONAL OUTLINE DRAWING............................................. EXT-3
U3772 DIMENSIONAL OUTLINE DRAWING............................................. EXT-4
C-5
Page 12

U3700 Series User’s Guide
Table of Contents
U3741/U3751/U3771/U3772 QUICK GUIDE..................................................GUIDE-1
ALPHABETICAL INDEX ..................................................................................... I-1
C-6
Page 13

U3700 Series User’s Guide
LIST OF ILLUSTRATIONS
No. Title Page
3-1 Operating Environment ..................................................................................................... 3-3
3-2 Connecting the Power Cable ............................................................................................. 3-5
3-3 Attachment of a Ferrite Core 1 ......................................................................................... 3-9
3-4 Attachment of a Ferrite Core 2 ......................................................................................... 3-9
3-5 POWER Switch ............................................................................................................... 3-10
3-6 Initial Screen ..................................................................................................................... 3-11
3-7 Connecting the CAL Signal .............................................................................................. 3-12
4-1 Front Panel ........................................................................................................................ 4-1
4-2 Extended Function Key Block .......................................................................................... 4-2
4-3 Soft Key Block .................................................................................................................. 4-3
4-4 Input and Output Connectors Block ................................................................................. 4-4
4-5 Operation Key Block ........................................................................................................4-5
4-6 Screen Display .................................................................................................................. 4-7
4-7 Rear Panel ......................................................................................................................... 4-9
4-8 Initial Setting Screen ......................................................................................................... 4-14
4-9 Connecting the CAL Signal (RF INPUT1 connector) ...................................................... 4-15
4-10 Connecting the CAL Signal (RF INPUT2 connector) ...................................................... 4-16
4-11 Connecting the CAL Signal .............................................................................................. 4-18
4-12 Setting the Center Frequency ............................................................................................ 4-19
4-13 Completing the Setting of the measurement conditions ................................................... 4-19
4-14 Displaying the Peak Search .............................................................................................. 4-20
4-15 Measuring the Difference of Frequency and Level by Using the Delta Marker .............. 4-21
4-16 Connecting the CAL Signal .............................................................................................. 4-23
4-17 Displaying the UNCAL Message ..................................................................................... 4-24
4-18 Canceling the UNCAL Message ....................................................................................... 4-24
4-19 Connecting the TG Mesurement ....................................................................................... 4-31
4-20 Connecting the Unit Under Test ....................................................................................... 4-33
4-21 Measurement Display for Channel Power ........................................................................ 4-52
4-22 Measurement Display for Noise Power Converted into 5.6 MHz Bandwidth ................. 4-54
4-23 VSWR Measurement ........................................................................................................ 4-59
6-1 GPIB Connection .............................................................................................................. 6-3
6-2 LAN Setup ........................................................................................................................ 6-6
6-3 Connection of Cross-over Cables ..................................................................................... 6-7
6-4 Status Register Arrangement ............................................................................................ 6-14
6-5 Details of Status Register .................................................................................................. 6-15
6-6 Structure of the Status Byte Register ................................................................................ 6-16
6-7 Relationship between the Screen Graticule and Trace Data ............................................. 6-62
A-1 Block Diagram of the Input Section ................................................................................. A-4
A-2 Relation Between Input and Output of the Mixer ............................................................. A-4
A-3 Characteristics of the Root Nyquist Filter ........................................................................ A-6
A-4 Resolution Bandwidth .......................................................................................................A-7
A-5 IF Gain Uncertainty .......................................................................................................... A-7
A-6 Noise Sidebands ................................................................................................................ A-8
F-1
Page 14

U3700 Series User’s Guide
List of Illustrations
No. Title Page
A-7 Spurious Response ............................................................................................................ A-9
A-8 Occupied Bandwidth .........................................................................................................A-10
A-9 Bandwidth Selectivity ....................................................................................................... A-10
A-10 Bandwidth Switching Uncertainty .................................................................................... A-11
A-11 VSWR ............................................................................................................................... A-12
F-2
Page 15

U3700 Series User’s Guide
LIST OF TABLES
No. Title Page
3-1 Standard Accessories ........................................................................................................ 3-2
3-2 Option Accessories ........................................................................................................... 3-2
3-3 OPT10 Accessories ........................................................................................................... 3-2
3-4 Power Requirements .........................................................................................................3-4
4-1 USB Memory Devices Whose Operation with this Instrument has Already Checked .... 4-29
5-1 Character allocation table .................................................................................................5-22
6-1 GPIB Interface Functions ................................................................................................. 6-4
6-2 Connection of 10BASE-T Cross-over Cables .................................................................. 6-7
6-3 Connection of 10BASE-T Straight Cables ....................................................................... 6-7
6-4 Trace Point Specification Codes ....................................................................................... 6-63
6-5 Binary Data Output Format Specified Code ..................................................................... 6-63
6-6 I/O Format ......................................................................................................................... 6-64
6-7 Absolute Value Output Format ......................................................................................... 6-65
8-1 Options .............................................................................................................................. 8-1
8-2 Accessories ....................................................................................................................... 8-2
9-1 Limited-Life Parts ............................................................................................................. 9-2
T- 1
Page 16

Page 17

U3700 Series User’s Guide
1. INTRODUCTION
1. INTRODUCTION
This chapter describes the contents of this manual and the product overview of the U3700 series Spectrum
Analyzer to help you get the most out of this manual.
1.1 Contents of This Manual
This manual can be used by novices or experienced users of this instrument. You may read through this manual from Chapter 1 to learn more about this instrument or you may refer to the table of contents, which is
found at the beginning of each chapter and directly jump to the section that you need.
The contents of each chapter are as follows:
CHAPTER 1. INTRODUCTION This chapter describes the contents of this manual and the
product overview.
CHAPTER 2. PRECAUTIONS WHEN USING
THE U3700
CHAPTER 3. SETUP This chapter describes how to setup this instrument. After
CHAPTER 4. INSTRUMENT CONFIGURATION AND BASIC OPERATIONS
CHAPTER 5. MENU MAP, FUNCTIONAL
EXPLANATION
CHAPTER 6. OVERVIEW OF REMOTE CONTROL
CHAPTER 7. SPECIFICATIONS This chapter describes the specifications of this instrument.
CHAPTER 8. OPTIONS AND ACCESSORIES This chapter describes options and accessories which are
CHAPTER 9. MAINTENANCE This chapter describes how to care for this instrument such
This chapter describes precautions when using this instrument. Read this chapter before using this instrument.
setting up this instrument in an appropriate location, turn
on the power and check that this instrument starts correctly.
This chapter describes the functions of each part of the
panel and the screen of this instrument. You can learn how
to operate this instrument from the operations and simple
examples.
This chapter describes the menu structure and functions of
soft keys.
This chapter describes how to connect and set the GPIB
and LAN interfaces, and also describes the program examples used when programming and table of commands.
sold separately.
as cleaning, calibration, and storage to maintain the high
performance and smooth functioning of this instrument.
Also this chapter describes how to identify problems and
the relevant procedures to follow.
APPENDIX This chapter describes the following information:
• Initial Setting List
• Principles of measurement
• Technical terms used in this manual
•Menu Map List
1-1
Page 18

U3700 Series User’s Guide
1.2 Product Overview
1.2 Product Overview
The U3700 series spectrum analyzers are compact, lightweight, and portable.
The U3700 series spectrum analyzers are ideal for use in the field because they operate on battery and can
be used anywhere.
The main features of this instrument are as follows:
• Wide frequency measurement range
U3741: 9 kHz - 3 GHz
U3751: 9 kHz - 8 GHz
U3771: 9 kHz - 31.8 GHz
U3772: 9 kHz - 43 GHz
• High-speed and high-accuracy sweep
Frequency span accuracy: 1% or less
20 ms sweep time
• Extremely low noise level:
-135 dBm @ 5 GHz (typical value, built-in preamplifier ON)
-120 dBm @ 40 GHz (typical value)
• High measurement level accuracy
±0.8 dB Frequency range 10 MHz - 3.1 GHz
±1.0 dB Frequency range 3.1 GHz - 8 GHz
• 3-way power supply system: AC, DC, and attachable battery
• Compact: Approximately 308 mm (W) × 175 mm (H) × 209 mm (D)
• Lightweight:
U3741: Approximately 5.0 kg or less (without option)
U3751: Approximately 5.6 kg or less (without option)
U3771/U3772: Approximately 6 kg or less (without option)
1.3 Conventions of Notation Used in This Document
The panel and soft key notations used in this manual are described below.
Panel key: Bold Example: FREQUENCY, SPAN
Soft keys: Bold italics Example: Center, Span
NOTE: Screen displays and diagrams such as external view of the main unit in this manual are those of the U3771
in the U3700 series.
1-2
Page 19

U3700 Series User’s Guide
1.4 Advantest Homepage
1.4 Advantest Homepage
The product information for the U3700 series Spectrum Analyzer is published on the Advantest homepage
(http://www.advantest.co.jp).
On the homepage, sample software can be downloaded and the following information can be browsed: Application notes such as the GP-IB command table and technical notes.
How to access
Select "English", "PRODUCTS & SUPPORTS", "Electronic Measuring Instruments", and "Product" from
the top page, and then choose a product model to be browsed.
1-3
Page 20

Page 21

U3700 Series User’s Guide
2. PRECAUTIONS WHEN USING THE U3700
2. PRECAUTIONS WHEN USING THE U3700
This chapter describes precautions when using this instrument. Read this chapter before using this instrument.
2.1 If a Fault Occurs
If any smoke, smell, or noise emanates from this instrument, turn off the MAIN POWER switch, remove the
power cable from the AC power connector, and then contact an Advantest sales representative immediately.
2.2 Removing the Case
The case of this instrument should only be opened by Advantest service engineers.
2.3 Electromagnetic Interference
This instrument may cause electromagnetic interference and affect television and radio. If this instrument's
power is turned off and any electromagnetic interference that may be present is reduced, then this instrument
has caused the interference.
Electromagnetic interference from this instrument may be prevented by the following precautions.
• Changing the direction of the antenna of the television or radio.
• Placing this instrument on the other side of the television or radio.
• Placing this instrument away from the television or radio.
• Using a different power source for the television or radio, and this instrument.
2.4 Note when Turning on the Power
When turning on the power, do not connect a DUT to this instrument.
2-1
Page 22

Page 23

U3700 Series User’s Guide
3. SETUP
This chapter describes how to set up this instrument on delivery. Topics covered in this chapter are:
• 3.1 Inspection on Delivery
• 3.2 Locating This Instrument
• 3.3 Power Supply
• 3.4 Caution when Connecting Peripherals
• 3.5 Checking Operations
3.1 Inspection on Delivery
After receiving the product, inspect the outside and the accessories according to the following procedure.
1. Check that the shipping container and the cushioning material are not damaged.
IMPORTANT: If the shipping container or the cushioning material is damaged, keep them until the following
inspections are complete.
3. SETUP
2. Check that the outside of the product is not damaged.
WARNING: If any outside components of the product such as the cover, panel (front or rear), LCD display,
power switch, or connector are damaged, do not turn on the power. You may receive an electrical
shock.
3. Check that the standard accessories listed in Table 3-1 (and option accesories listed in Table 3-2) are
complete and they are not damaged.
If any of the following occur, contact an Advantest sales representative.
• The shipping container or the cushioning material is damaged, or signs of stress are found.
• The outside of the product is damaged.
• The standard accessories are incomplete or are damaged.
• Defects are found in the operation check.
3-1
Page 24
U3700 Series User’s Guide
3.1 Inspection on Delivery
Table 3-1 Standard Accessories
Name Model
Quantity
U3741 U3751 U3771/U3772
Power cable A01412 1 1 1
Input cable (50 Ω) A01037-0300
N(m)-BNC(f) adaptor JUG-201A/U
*1
1
*1
1
11
11
Ferrite core ESD-SR-120 3 3 3
Ferrite core E04SR150718 1 1 1
BNC-SMA adaptor HRM-517 0 0 1
Adapter for RF INPUT2 HE-A-PJ 0 0 1
U3700 Series User's Guide BU3700S 1 1 1
*1 The quantity decreases to zero when the 75 Ω option (OPT15) is included.
Table 3-2 Option Accessories
Quantity
Name Model
OPT 15 OPT76/O PT77 OPT75
Input cable (75 Ω) A01045 1 0 0
N(m)-BNC(f) adaptor JUG-201A/U 0 1 0
C15-type adapter NCP-NFJ 1 0 1
NC-BNC adapter BA-A165 1 0 1
Table 3-3 OPT10 Accessories
Name Model Quantity
N(m)-BNC(f) adaptor JUG-201A/U 1
3-2
Page 25
3.2 Locating This Instrument
This section describes the installation environment in which this instrument runs successfully.
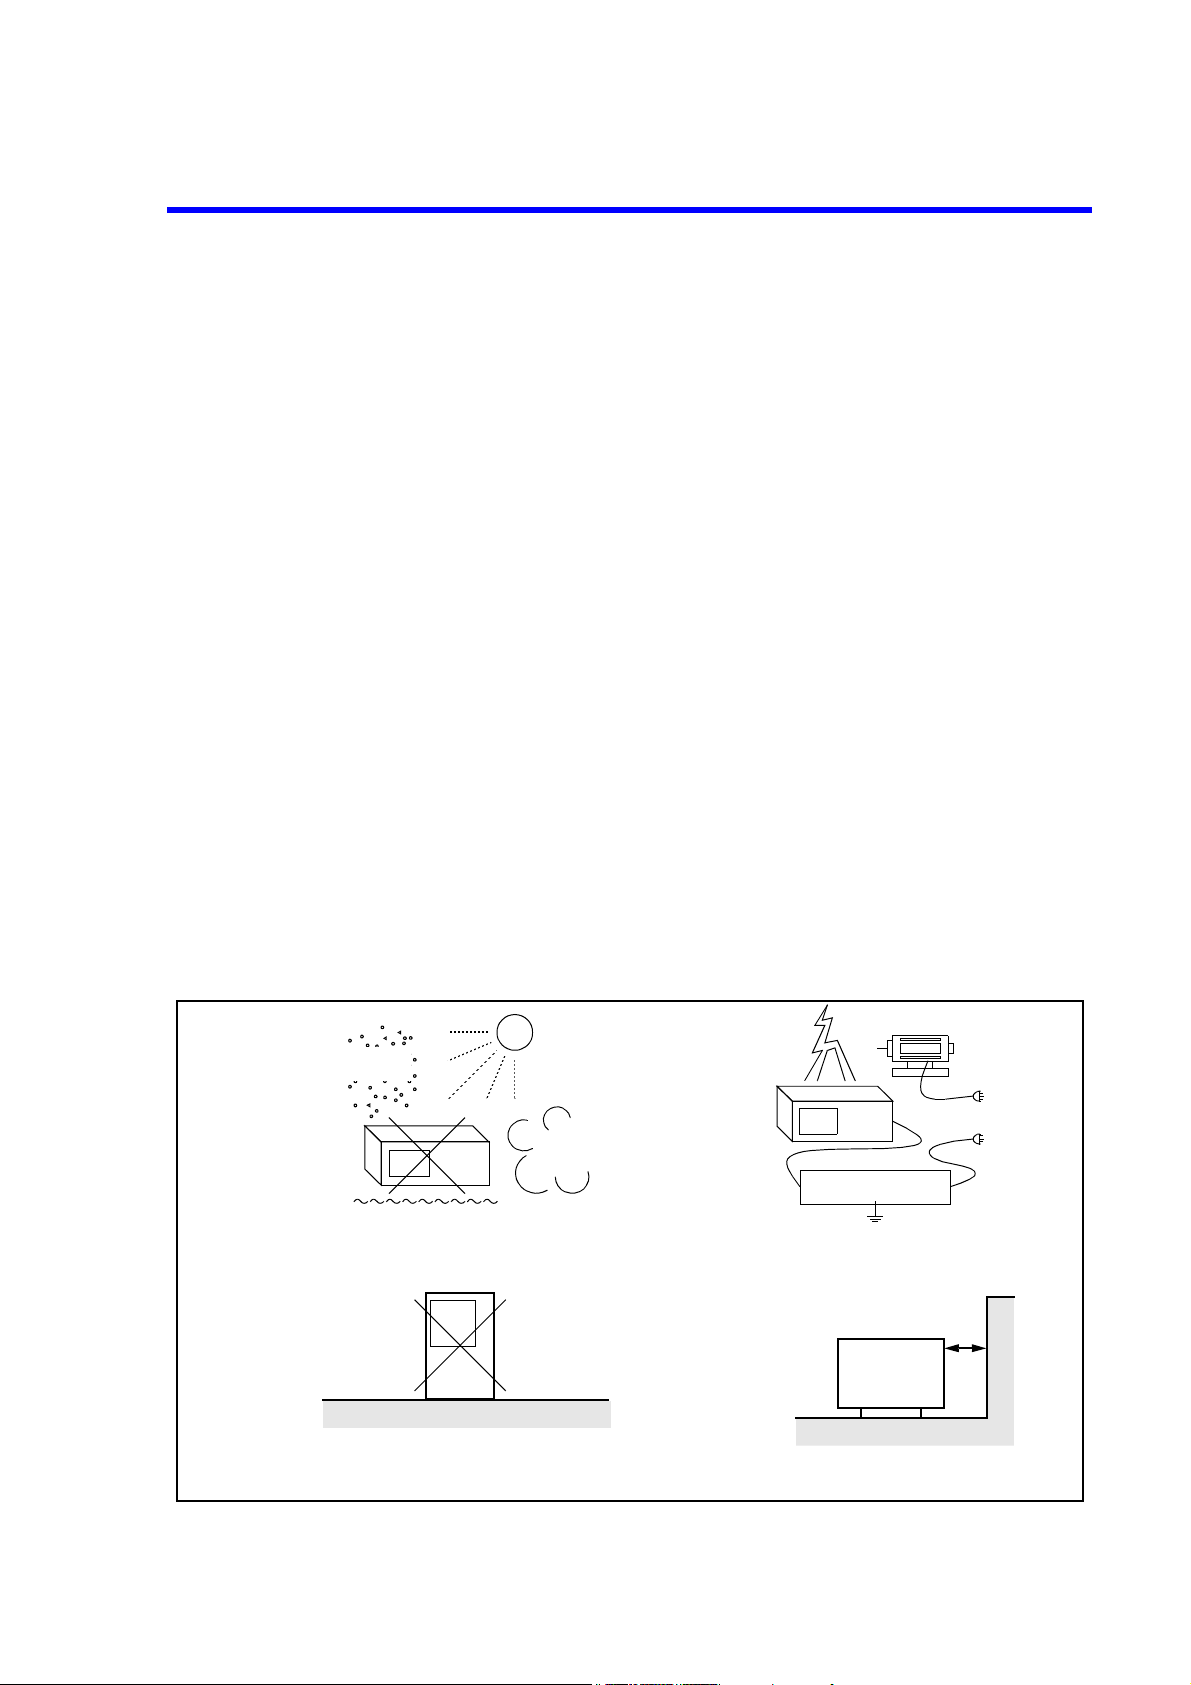
3.2.1 Operating Environment
Install this instrument in an environment in which the following conditions are satisfied.
• Ambient temperature: 0°C to +50°C (operating temperature)
-20°C to +60°C (storage temperature)
• Relative humidity: 85 percent or less with no condensation
• An area free from corrosive gas
• An area away from direct sunlight
• A dust-free area
• An area free from vibrations
• A low noise area
Although this instrument has been designed to withstand a certain amount of noise from the AC power
line, it should be used in a low noise area.
Use a noise cut filter if ambient noise is unavoidable.
U3700 Series User’s Guide
3.2 Locating This Instrument
• An area in which the airflow is not obstructed
There is an exhaust-cooling fan and exhaust vents on both sides of this instrument. Do not obstruct the
fan and vents. If there is insufficient airflow around the vents, the internal temperature will rise and the
instrument may operate incorrectly. Keep a space of 10 centimeters between the side panel and the
wall. Do not use this instrument on its side.
Direct sunlight
Dust
Corrosive
gas
Line Filter
Vibration
• Avoid operating in these areas.
Side
• Do not use this instrument on its side.
Figure 3-1 Operating Environment
• Use a noise cut filter if noise is unavoidable
on the AC power line.
Side
• Keep a space of 10 centimeters from
the wall.
3-3
Page 26
U3700 Series User’s Guide
3.3 Power Supply
3.3 Power Supply
This instrument can use the following three types of power sources.
• An AC Power Supply
Automatically switches the power supply voltage between 100 V AC and 200 V AC.
•A battery
Use an external battery pack (A870008).
Recommended battery pack: DIONIC90 (Manufactured by Anton Bauer Inc.)
• An external DC power supply
Use an external DC power cable (A114020).
CAUTION: Connect this instrument to an AC power supply, DC power supply, or battery.
3.3.1 Using the AC Power Supply
This section describes power requirements and how to connect the power cable.
3.3.1.1 AC Power Requirements
The AC power requirements of this instrument are shown in Table 3-4. Check that the power supply, which
is supplied to this instrument, satisfies the conditions shown in Table 3-4.
Table 3-4 Power Requirements
100 V AC 200 V AC Remarks
Power supply voltage range 90 V - 132 V 198 V - 264 V Automatically switches
Frequency range 47 Hz - 63 Hz
Power consumption 100 VA or less
WARNING: Make sure the power supply, which is supplied to this instrument, satisfies the power requirements.
If the power requirements are not satisfied, this instrument may be damaged.
the input voltage between
100 V AC and 200 V AC.
3-4
Page 27
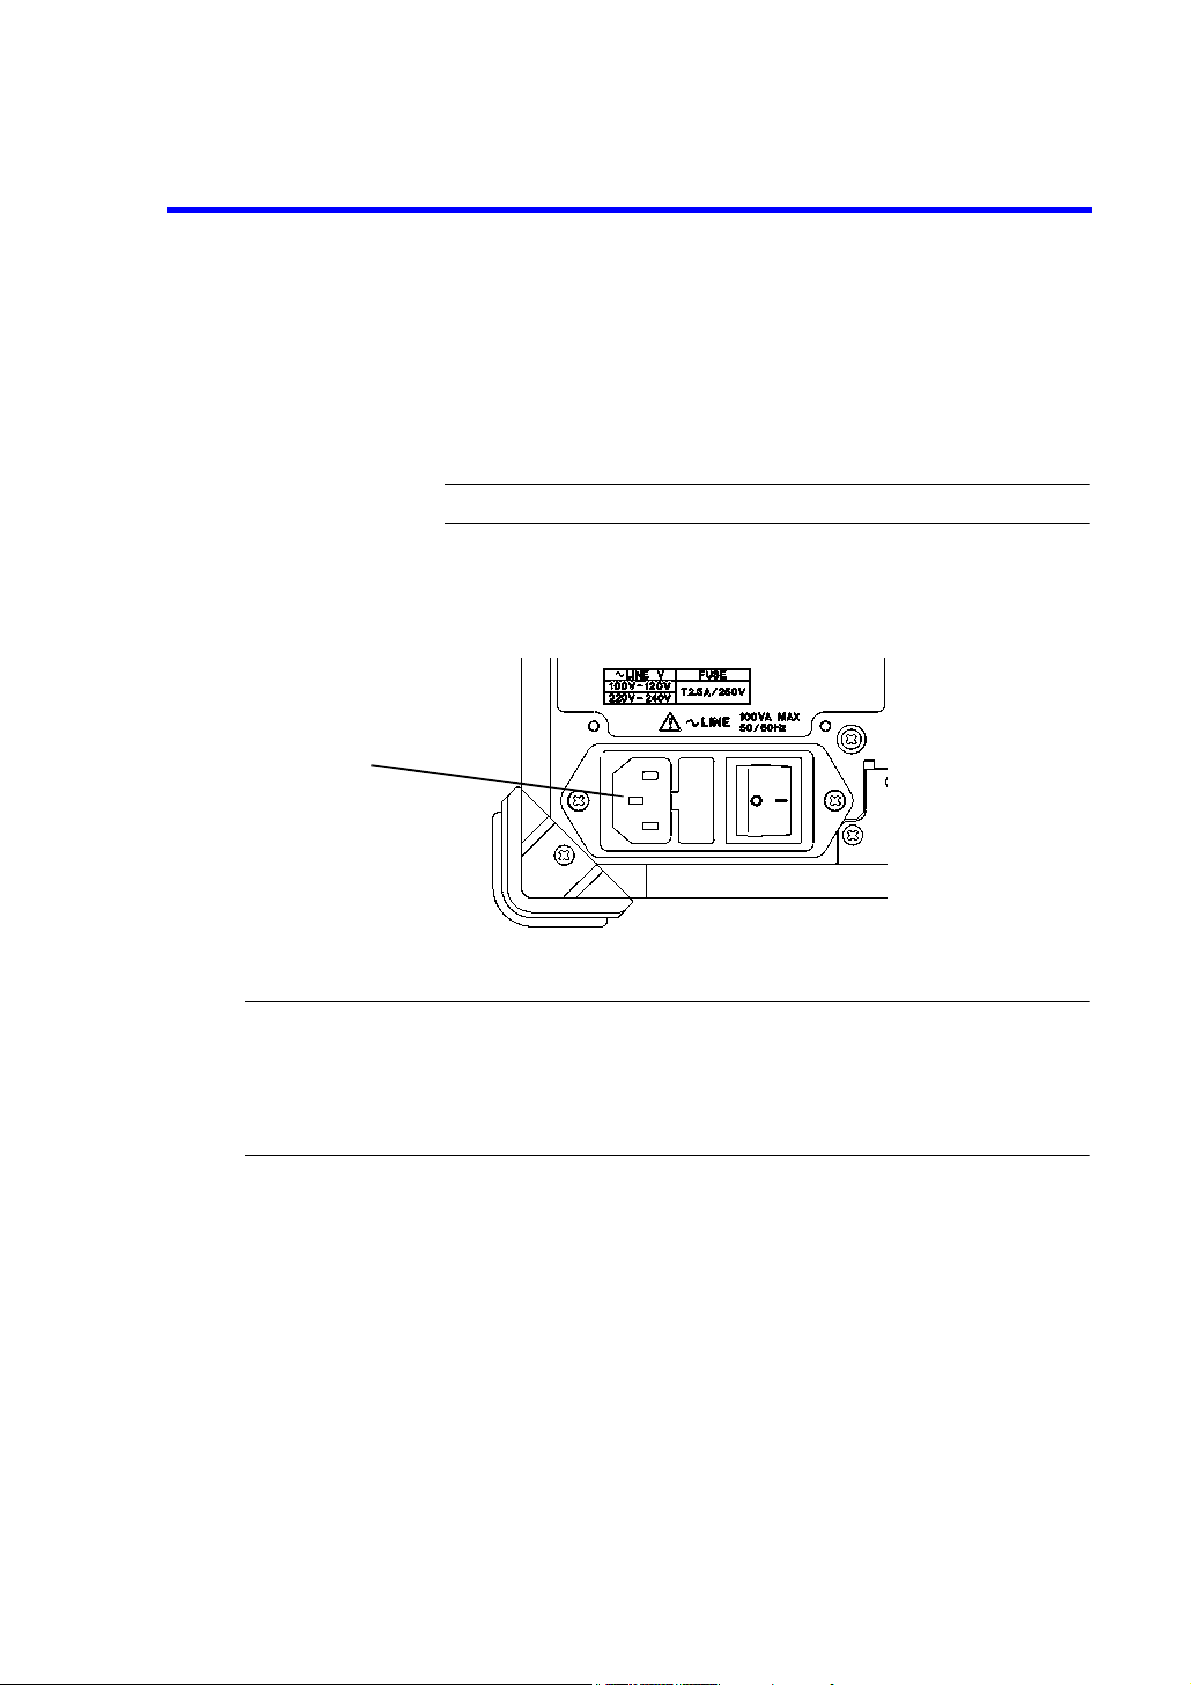
3.3.1.2 Connecting the Power Cable
This instrument includes a three-core power cable with a grounding conductor. To prevent accidents
caused by electric shocks, use the included power cable and securely connect to the ground through a
three-pin power outlet.
1. Check that the included power cable is not damaged.
WARNING: Never use a damaged power cable. You may receive an electrical shock.
2. Connect the AC power connector on the rear panel of this instrument to a threepin power outlet that has a protected ground terminal by using the included power
cable (See Figure 3-2).
AC power connector
U3700 Series User’s Guide
3.3.1 Using the AC Power Supply
Figure 3-2 Connecting the Power Cable
WARNING:
• Use a suitable power cable for the power supply voltage. Use a power cable that complies with the safety
standards in your country (Refer to "Safety Summary").
• To prevent any danger of electrical shock, connect the power cable to a three-pin power outlet that is connected to a protected ground terminal. The instrument will not be grounded if an extension cord, which
does not include a protected ground terminal, is used.
3-5
Page 28
U3700 Series User’s Guide
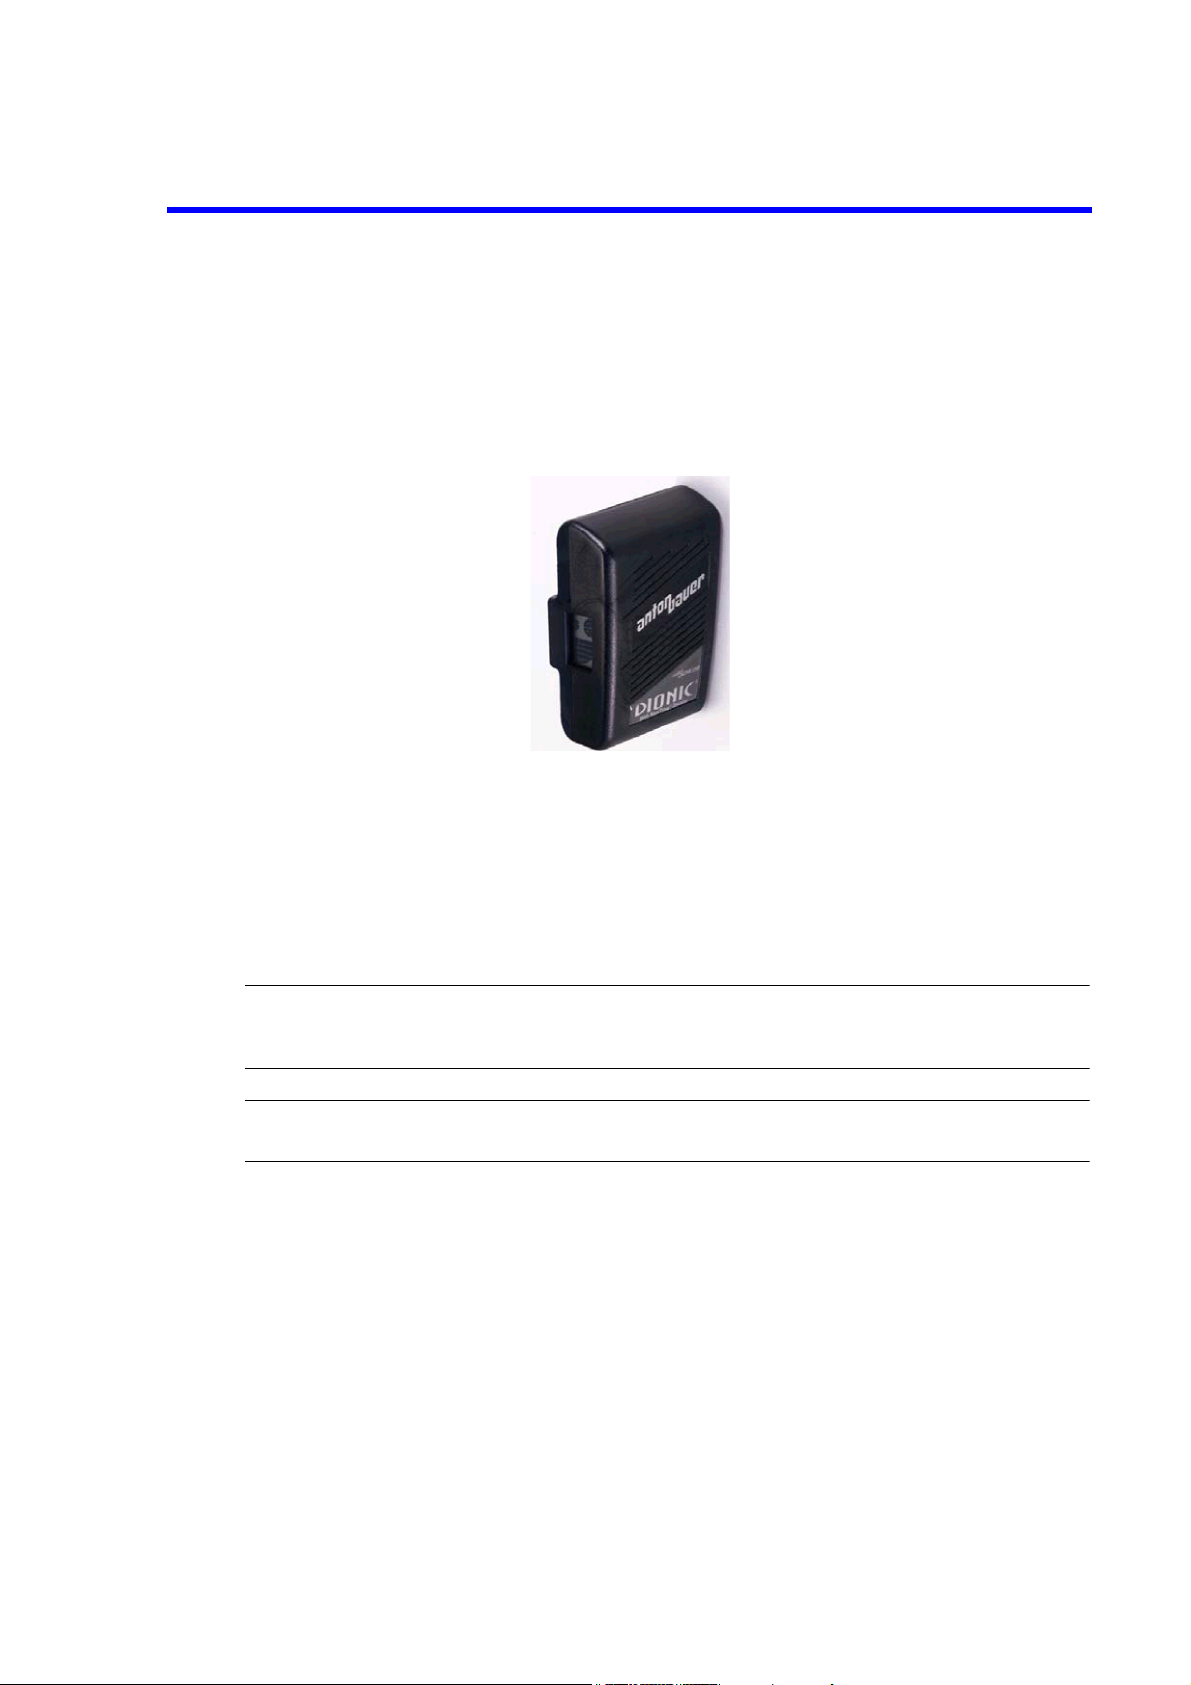
3.3.2 Using a Battery
3.3.2 Using a Battery
The U3700 series can use a battery as a power source.
An Anton Bauer's battery pack can be used in the U3700 series.
The DIONIC 90 compact lithium-ion battery pack is recommended.
The DIONIC 90 battery pack specifications
Capacity: 90 WH Nominal
Output voltage:14.4 V
Weight: Approx. 0.7 kg
Dimensions: 133 × 89 × 54 mm
For more information, refer to the battery pack operation manual.
INFORMATION:Runtime (hours) U3741: 3 hours
NOTE: The battery life varies depending on the usage situation.
If using a battery stored over the long term, check the runtime in advance.
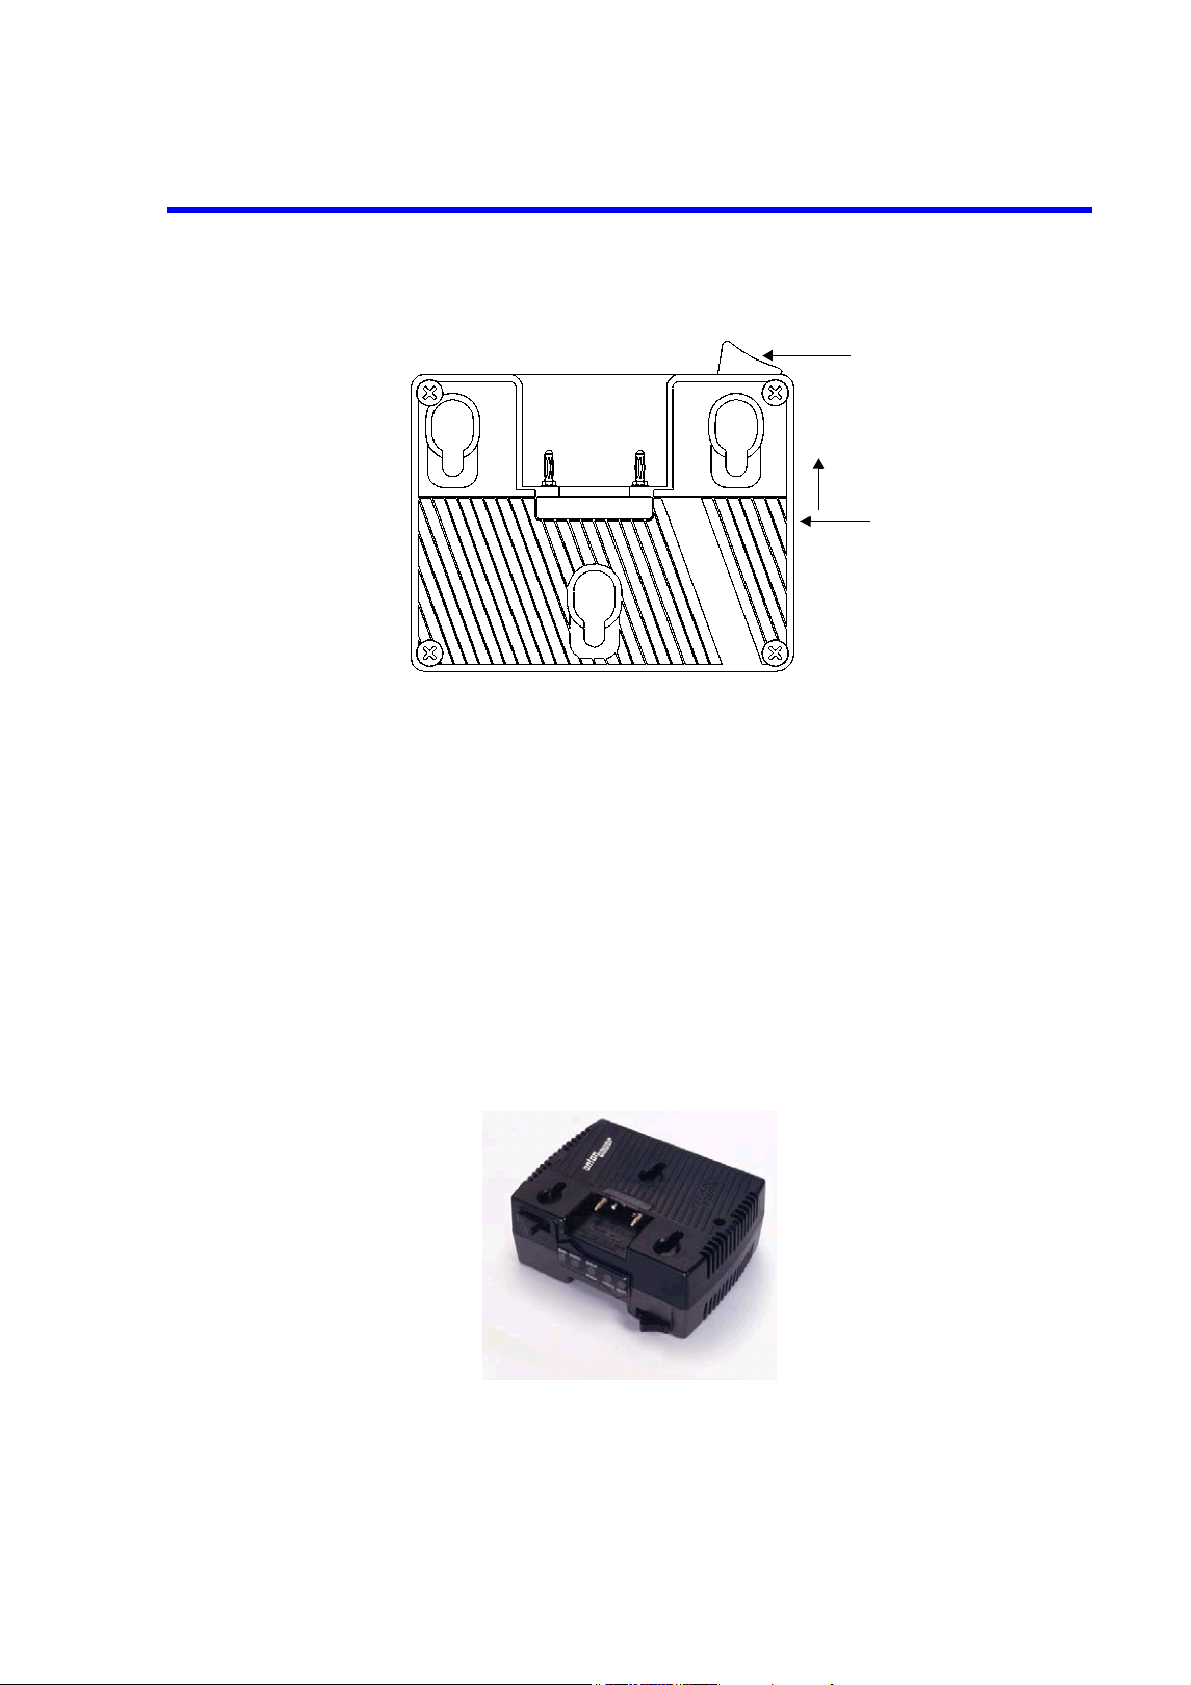
3.3.2.1 Battery Mount System
The QR Gold Mount System, which is included in professional video cameras worldwide, is included in
this instrument.
1. How to remove and replace the battery pack
Align the side of the battery pack that contains the connector with the battery mount on the rear panel
of this instrument and push it in and down. The battery is attached when a “click” is heard.
Turn off the power supply of this instrument when detaching the battery. To detach the battery, lift the
battery up while pushing the eject button on the battery mount.
U3751: 2.5 hours
U3771/72: 2 hours
3-6
Page 29
U3700 Series User’s Guide
3.3.2 Using a Battery
Eject Button
Locking
Slide switch for locking
2. Locking the Eject button
The slide switch to lock the Eject button is located on the right side of the battery mount (lower side
of the Eject button).The Eject button is locked by setting the slide switch to upper side.Set the slide
switch to the lower side and release the lock before the battery pack is attached or detached.
3.3.2.2 Charging the Battery
This instrument cannot charge the external battery pack.
Use a suitable battery charger for the battery pack.
• For the DIONIC 90
The TITAN TWIN charger (A870009) is recommended.
When the TITAN TWIN charger is used, the charging time is approximately 5.5 hours.
3-7
Page 30
U3700 Series User’s Guide
3.3.3 Using the External DC Power Supply
3.3.3 Using the External DC Power Supply
3.3.3.1 DC Power Requirements
DC power supply Requirements
Power supply voltage range +11 V to +17 V
Power consumption 70 W or less
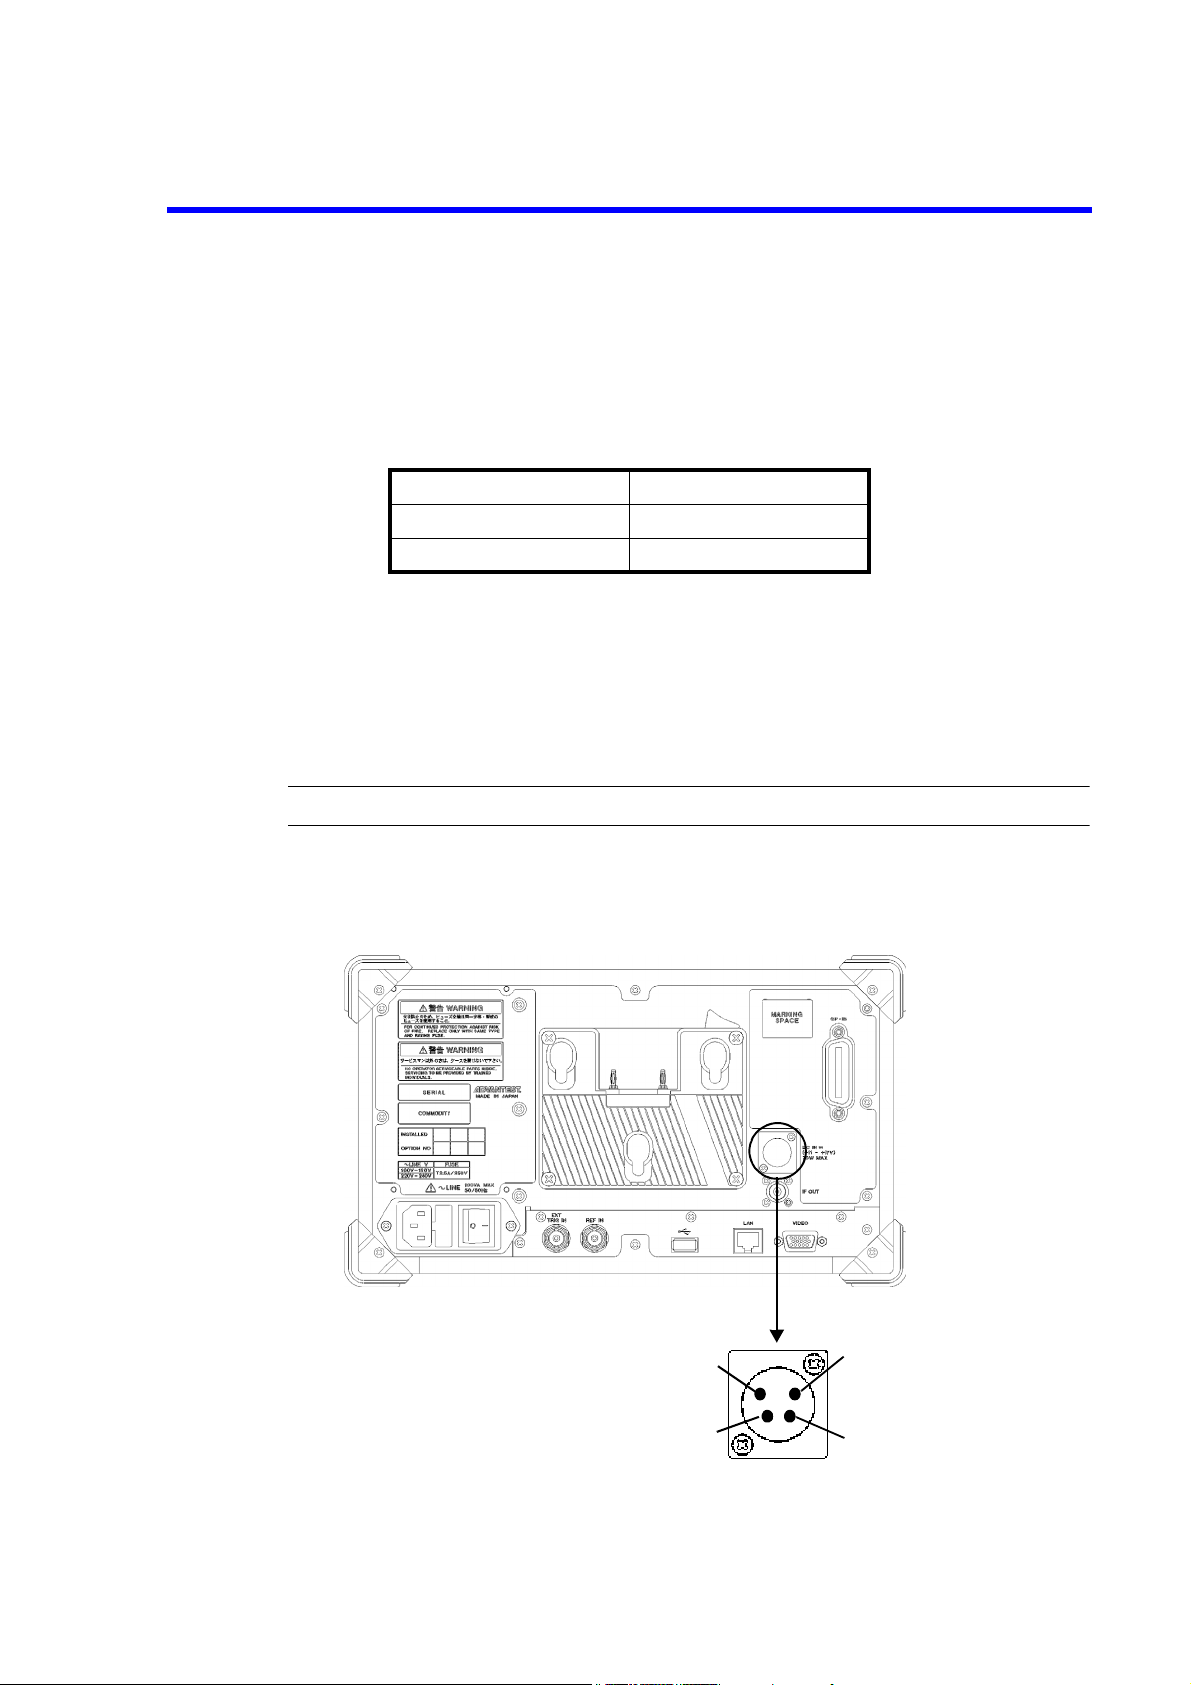
3.3.3.2 Connecting the DC Power Cable
1. Remove the AC power cable and detach the battery.
2. Connect an A114020 (Sold separately) external DC power cable to the DC power supply input connector on the rear panel.
CAUTION: Do not reverse the polarity of the DC power supply.
3. To remove the DC power cable, turn off the power supply of this instrument and remove the external
DC power cable while pushing the button on the cable connector.
DC power supply input connector (XLR 4 pins)
[Connector pin location]
Pin number 1: GND
Pin number 2: N.C
Pin number 3: N.C
Pin number 4: + terminal
1
2
4
3
3-8
Page 31

U3700 Series User’s Guide
3.4 Caution when Connecting Peripherals
3.4 Caution when Connecting Peripherals
Use shielded cables when connecting peripherals to the USB and LAN connectors on this instrument.
Attach the included ferrite core (ESD-SR-120) to the cable.
Figure 3-3 Attachment of a Ferrite Core 1
When connecting an earphone to the PHONE connector, attach the included ferrite core (E04SR150718) to
the earphone cable.
Figure 3-4 Attachment of a Ferrite Core 2
3-9
Page 32

U3700 Series User’s Guide
3.5 Checking Operations
3.5 Checking Operations
This section describes how to check operations by using the calibration function of this instrument. Check
that this instrument operates correctly by following the procedure below.
Starting this instrument
1. Connect the power cable according to "3.3.1.2 Connecting the Power Cable".
2. Turn on the AC power switch on the rear panel.
3. Three seconds after turning on the AC power switch on the rear panel, press the
power switch on the front panel to turn on the instrument.
The power supply and the green power light turn on.
Figure 3-5 POWER Switch
4. The system boots up and the program starts.
3-10
Page 33

U3700 Series User’s Guide
3.5 Checking Operations
5. The result of the self-diagnostics and the initial screen are displayed.
The initial screen display may differ from Figure 3-6 depending on the status of
the settings when the power supply was last turned off.
Figure 3-6 Initial Screen
MEMO: If any error message is displayed, refer to “9. MAINTENANCE”.
3-11
Page 34

U3700 Series User’s Guide
3.5 Checking Operations
Running calibration
6. Connect as shown in Figure 3-7 by using the included N-BNC adaptor and input
cable (A01037-300).
Figure 3-7 Connecting the CAL Signal
IMPORTANT: Perform calibration after allowing a warm up time of at least 5 minutes.
7. Press the SYSTEM key of this instrument and select Calibration from the soft
menu.
8. Select Calibrate ALL on the next soft menu.
It takes approximately two minutes to complete the autocalibration.
9. Check that no error message is displayed at the end of the calibration.
MEMO: If any error message is displayed, refer to “9. MAINTENANCE”.
Turning off the power supply
10. Press the power switch on the front panel.
The power supply and the power light turn off.
For more information on how to perform autocalibration, refer to
“4.3.1 Calibration”.
3-12
Page 35

U3700 Series User’s Guide
4. INSTRUMENT CONFIGURATION AND BASIC OPERATIONS
4. INSTRUMENT CONFIGURATION AND BASIC OPERATIONS
This chapter describes the functions of each part on the panels and screen, and describes the basic operations
of this instrument by using measurement examples.
4.1 Panel and Screen Descriptions
This section describes the names and functions of each part on the front panel, screen, and rear panel.
4.1.1 Names and Functions of Each Part on the Front Panel
This section describes the names and functions of each part on the front panel.
9
8
3
2
1
1. POWER switch with lamp Switches the power supply between ON and OFF.
2. Extended function key block The keys in this block set the extended functions.
3. PHONE connector 8-ohm earphone terminal for demodulated AM/FM audio signals.
4. USB connector Enables a memory device or printer to be connected.
5. Color LCD Displays measurement data or setting conditions.
6. Soft key block The keys in this block select items from the soft menu on the dis-
4
5
Figure 4-1 Front Panel
The lamp turns on while the power turns on
play.
67
4-1
Page 36

U3700 Series User’s Guide
4.1.1 Names and Functions of Each Part on the Front Panel
7. Input connector lamp Indicates the input connector is enabled.
U3741/U3751: Only RF INPUT 1 is enabled.
8. Input and output connectors block The connectors in this block are used in measurements.
9. Operation key block The keys in this block are used for changing settings.
1
2
3
4
5
6
7
8
Figure 4-2 Extended Function Key Block
1. Key lock key with lamp Locks the key input.
Toggles the key lock between ON and OFF.
The lamp turns on while the key input is locked.
2. LOCAL key Cancels the remote control function.
REMOTE lamp The lamp turns on when the instrument is in the remote state.
3. SYSTEM setting Sets the operational conditions of an interface.
Preset key Initializes the settings of this instrument.
4. APPLICATION key Switches between the applications of this instrument.
5. FILE key Loads and saves data.
6. COPY key Outputs screen data.
7. HELP key Explains the soft menu.
NOTE: HELP is loaded and functions when the HELP key is
pressed at the first time after the power is turned on.
8. SHIFT key with lamp Sets the shift mode which allows the functions indicated by the
green font to be selected.
Turns on while the shift mode is set.
4-2
Page 37

U3700 Series User’s Guide
4.1.1 Names and Functions of Each Part on the Front Panel
1
2
3
Figure 4-3 Soft Key Block
1. CLEAR key Cancels data entry mode.
2. Soft menu key The soft key 1 to 7 correspond with the soft menu 1 to 7 indicated
3. RETURN key Returns to the previous soft menu.
to the left respectively.
Press the soft key to select the soft menu.
4-3
Page 38

U3700 Series User’s Guide
4.1.1 Names and Functions of Each Part on the Front Panel
1
2
4
3
U3741: For the 75 Ω option (OPT15 and OPT75)
Figure 4-4 Input and Output Connectors Block
1. CAL OUT connector Outputs the calibration signal.
2. TG OUTPUT connector Outputs the tracking generator signal. (Option)
3. RF INPUT1 connector Input the signal to be measured.
Measurement frequency range:
U3741: 9 kHz - 3 GHz
U3751/U3771/U3772: 9 kHz - 8 GHz
4. RF INPUT2 connector Input the signal to be measured.
Measurement frequency range
U3771: 10 MHz to 31.8 GHz
U3772: 10 MHz to 43 GHz
4-4
CAUTION:
1. Do not apply an RF power or DC voltage that exceeds the limited value to the INPUT and OUTPUT connectors.
Be careful of static electricity. Internal circuit components such as the input attenuator and mixer may
be damaged.
2. The precision microwave connector is used as the RF INPUT2 connector.
This connector is compatible with the K connector (K connector is a trademark of Anritsu Corporation)
and can be connected to a common SMA connector.
Be careful when handling this connector because the connector is delicate and is damaged easily.
Use the included adapter (HE-A-PJ) if the connection and disconnection to this connector are performed frequently.
3. For the 75 Ω option (OPT15 and OPT75), input and output connectors are changed to 75 Ω type connectors.
If a 50 Ω cable or connector is connected to a 75 Ω connector, the center contact of the 75 Ω connector
may be damaged.
Verify that cables and connectors, which are used, are 75 Ω type.
Page 39

U3700 Series User’s Guide
4.1.1 Names and Functions of Each Part on the Front Panel
1
2
3
4
5
6
7
8
9
10
11
12
13
14
15
19
18
17
16
Figure 4-5 Operation Key Block
1. MEAS 1 Selects a measurement such as Channel Power, OBW or ACP.
2. MEAS 2 Selects a measurement such as Noise/Hz, X dB down or Counter.
3. USER Allocates soft menu keys to be used.
4. TRACE Sets the trace function.
5. MKR Displays the marker.
6. PEAK Searches for a peak on a trace.
7. MKR→ Sets the values of the marker to that of another function.
8. TG Sets the tracking generator. (Option)
9. FREQUENCY Sets the center frequency.
10. SPAN Sets the frequency span.
11. AMPLITUDE Sets the level.
12. EXT CFG Sets the sweep mode and trigger.
13. CPL Sets the RBW, VBW, and sweep time.
4-5
Page 40

U3700 Series User’s Guide
4.1.1 Names and Functions of Each Part on the Front Panel
14. Keypad There are numeric keys (0 to 9) and decimal point key.
15. - (Backspace)key Enters the minus sign and corrects entered data.
16. Unit key Selects a unit and determines the entered value.
GHz Sets a unit of GHz, +dBm, or dB.
MHz Sets a unit of MHz, -dBm, sec, V, or W.
kHz Sets a unit of kHz, mV, msec, or mW.
Hz Sets a unit of Hz, μsec, CH, μV, o r μW.
Can also be used as the ENTER key
17. Step key Enters data at each step.
18. Data knob Fine tunes the entered data.
19. START/STOP key Starts or stops the sweep.
4-6
Page 41

4.1.2 Names and Functions of Each Part on the Screen
4.1.2 Names and Functions of Each Part on the Screen
This section describes the names and functions of each part on the screen of this instrument.
U3700 Series User’s Guide
2324
25
1
2
3
4
5
6
7
22
21
8
20
10
9
18
19
11
12
13
14
17
16
15
Figure 4-6 Screen Display
1. Reference level Displays the reference level setting value.
2. Amplitude scale in log mode or linear mode
Displays the amplitude scale setting in log mode.
3. Active function Displays the function enabled by the keypad or data knob.
4. Level scale Displays the level scale.
5. Center frequency or start frequency
Displays the center frequency or start frequency.
6. Resolution bandwidth (RBW) Displays the resolution bandwidth setting value.
Displays the font color of RBW in green if RBW is set in the manual mode.
7. User’s title Displays the description of the details of the measured data.
8. Video bandwidth (VBW) Displays the video bandwidth setting value.
Displays the font color of VBW in green if VBW is set in the manual mode.
4-7
Page 42

U3700 Series User’s Guide
4.1.2 Names and Functions of Each Part on the Screen
9. Number of times averaging is performed
10. Sweep time Displays the sweep time setting value.
11. Frequency span or stop frequency Displays the frequency span or stop frequency.
12. High-sensitivity (Hi-sensitivity) Displays HiS while the preamplifier is set to On.
13. RF attenuator Displays the attenuator setting value.
14. UNCAL message Displays UNCAL while the manual settings are inappropriate.
15. Image Suppression Displays IS while the image suppression function is set to On.
16. Level offset Displays LOF while the reference offset is set to On.
17. Frequency offset Displays FOF while the frequency offset is set to On.
18. Marker area Displays the marker frequency (time) and level.
19. Date Displays the current date and time.
20. Measurement function display Displays the currently performed measurement function.
Displays the set and current number of times averaging is performed.
Displays the font color of SWP in green if SWP is set in the manual mode.
Displays the font color of ATT in green if ATT is set in the manual
mode.
21. Trace and trace detector Displays the selected trace mode and trace detector mode.
The trace with * displayed at the beginning is the active trace.
For a display of two traces or more, the trace with * is displayed
at the front.
22. Trace point Displays "501 pts" while the number of trace points is set to 501
23. Input impedance 75 Ω Displays "75 Ω" while the Input Impedance is set to 75 Ω.
24. External reference signal Displays Ref EX1 while the external reference signal is selected.
25. R3162/R3131 mode ON R3131 mode: Displays "*" while the R3131 mode is set to ON in
points.
U3741.
R3162 mode: Displays "*" while the R3162 mode is set to ON in
U3751/U3771/U3772.
4-8
Page 43

4.1.3 Names and Functions of Each Part on the Rear Panel
4.1.3 Names and Functions of Each Part on the Rear Panel
This section describes the names and functions of each part on the rear panel.
U3700 Series User’s Guide
11
10
9
8
1
2
1. AC power connector Connects this instrument to the AC power supply by using the
2. AC power switch Switches the AC power ON and OFF.
3. EXT TRIG connector Inputs the external trigger signal (TTL level).
4. EXT REF connector Inputs the external reference signal.
5. USB A connector Enables a memory device or printer to be connected.
6. LAN connector For 10BaseT-specific LAN connector
7. VIDEO connector Connects to the monitor for VGA specification.
8. IF OUT connector Outputs an IF signal of 21.4 MHz.
9. DC INPUT connector Connects to the external DC power supply.
10. Battery mount The Anton Bauer’s battery pack can be used.
11. GP-IB connector Connects to the external controller when the remote-control is
4
3
Figure 4-7 Rear Panel
included power cable.
used through the GPIB interface.
5
6
7
4-9
Page 44

U3700 Series User’s Guide
4.2 Basic Operation
4.2 Basic Operation
This section describes the menu operation, data entry, and usage of the basic measurement functions.
4.2.1 Menu Operation and Data Entry
Panel keys and soft menus are used to operate this instrument.
Press a panel key to display its menu to the right of the screen. Certain panel keys such as the LOCAL key
do not display a soft menu.
The menu items are arranged according to the soft keys.
The number of the menu item accords with the number of the related soft key.
Press a soft key to select the related menu.
Certain soft keys display another menu.
The following describes the functions of the panel key and soft key.
1. Selecting a menu
To set the measurement conditions, press the panel key and select the menu.
Press AMPLITUDE.
The reference level setting value is displayed in the active function display area and the following
Level menu is displayed to the right of the screen.
1 Ref Level
2 ATT
3 dB/div
4 Vertical Scale LIN/LOG
5 Units
6 Slide Screen ON/OFF
7 More 1/2
The frame of the 1 Ref Level menu is displayed in red. This red frame menu means that data can be
entered.
4-10
2. Data entry
If the set value is displayed in the active function display area, it can be changed by using keypad,
step key, or data knob.
• Data entry by using the keypad
Enter data by using the keypad, decimal point key, BK SP (backspace) key, and minus (-) key.
If any wrong numbers are entered by using the keypad, use the BK SP to delete a character to
the left and enter the correct number. If no data is entered and BK SP is pressed, “- (minus)” is
entered.
After entering data, press the unit key (ENTER) to complete the entry.
If any other panel key is pressed before the unit key is pressed, any entered data becomes invalid.
Example: Set the reference level to -20 dBm by using the keypad.
Press -, 2, 0, GHz(+dBM) or 2, 0, MHz(-dBM).
Page 45

U3700 Series User’s Guide
4.2.1 Menu Operation and Data Entry
• Data entry by using the step key
The step key enters data in the defined step size. Pressing decreases data and pressing
increase data.
Example: Set the reference level to 0.0 dBm by using the step key.
Press the step key . The reference level is set to -10.0 dBm. Press the step
key again to set to 0.0 dBm.
• Data entry by using the data knob
The data knob enters data in the determined display resolution. The data knob is available for
the fine adjustment of the entry data.
Example: Set the reference level to 0.5 dBm by using the data knob.
Rotating the data knob in the clockwise direction increases the reference level
in steps of 0.1 dBm. Rotate the data knob until the display of the active function display area shows 0.5 dBm.
Rotating the data knob in the counterclockwise direction decreases the reference level in steps of 0.1 dBm.
•ACTIVE OFF
Pressing the CLEAR key hides the active function display area.
Data cannot be entered if the active function display area is hidden.
To redisplay the active function display area, press a panel key or soft key.
3. Menu layer
Certain soft menus have at the right end and the sub menu is displayed by pressing the soft key.
Certain soft menus such as ON/OFF or AUTO/MNL switch the setting by pressing the soft key.
Press MKR. The following Marker menu is displayed.
1 Select Marker
2 Marker ON/OFF
3 Marker Trace A/B/C
4 Delta Mode
5 Peak Menu
6 Clear All
7 More 1/2
• Switching the setting
If a menu includes a dual-state button such as ON/OFF or AUTO/MNL, the state can be
switched by pressing the soft key. The selected setting is displayed convexly.
The non-selected setting is displayed concavely.
Example: Press 2 Marker ON/OFF.
The setting is turned OFF and the markers disappear.
Press 2 Marker ON/OFF again to turn the setting ON and the markers re-appear.
• Sub menu display
Pressing a soft key, which has to the right of the menu, displays a sub menu.
Example: Press 4 Delta Mode . The following Peak menu is displayed.
1 Delta ON/OFF
4-11
Page 46

U3700 Series User’s Guide
4.2.1 Menu Operation and Data Entry
• RETURN
Press RETURN to return to the previous menu from the sub menu.
4. Using SHIFT
The SHIFT key is used for selecting functions, which are indicated in green on the key.
These functions are described below.
• PRESET Returns to the initial settings.
• ROOT Returns the soft menu to the top menu.
• RF1 Selects RF INPUT1. (U3771/U3772)
• RF2 Selects RF INPUT2. (U3771/U3772)
To perform the function, which is written on the key in green, press the SHIFT key and then press
each key.
Pressing the SHIFT key turns on its LED and the shift mode is available.
Press the SHIFT key again to cancel the shift mode. The green LED turns off and the shift mode is
unavailable.
Other keys
Nothing is printed on these keys, but they have the functions shown below.
• USER Sets and cancels the USER menu.
• COPY Displays the Copy menu.
• Select Marker Returns one selected marker number.
5. Displaying a dialog box
Pressing certain soft keys displays a dialog box.
• Selecting items Select the horizontal items by using the data knob and select the vertical items
by using the step keys.
• Entering numeric values
Enter values by using the keypad and unit key.
• Determining the setting
Press the unit key (ENTER) to determine.
4-12
Page 47

U3700 Series User’s Guide
4.3 Basic Measurement
4.3 Basic Measurement
This section uses the following measurement examples to describes basic measurement procedures which
will allow the user to become familiar with the operation of this instrument.
4.3.1 Calibration
4.3.2 Displaying Spectrum and Operating Markers
4.3.3 How to Cancel the UNCAL Message
4.3.4 Identifying an Image Signal
4.3.5 Hard Copy Output
4.3.1 Calibration
Correcting the measurement by using the calibration factor, which is acquired from the calibration, can
increase the measurement accuracy.
Calibration items
1. Total Gain
Measuring the calibration signal of -20 dBm and acquiring the level difference
2. Step ATT
Minimizing the level error when switching STEP ATT at 20 MHz
3. RBW
Optimizing the RBW adjustment and minimizing the level error when switching
RBW
4. PBW
(Noise power bandwidth)
IMPORTANT: Perform calibration after allowing a warm up time of 5 minutes or more.
Required equipment
This instrument
Conversion adaptor: N (m)-BNC (f)
Conversion adaptor: BNC (f)-SMA (m)
Input cable: BNC (m)-BNC (m)
4-13
Page 48

U3700 Series User’s Guide
4.3.1 Calibration
Turning on the power supply
1. Verify that the AC power switch on the rear panel is set to OFF.
2. Connect the included power cable to the AC power connector on the rear panel.
CAUTION: To prevent damage, do not supply a voltage and frequency, which
exceed the specified range, to this instrument.
3. Connect the power cable to an electrical outlet.
4. Turn on the AC power switch on the rear panel.
After turning on the AC power switch, wait for three seconds or more
5. Turn on the power switch on the front panel.
MEMO: The display may be different depending on the state of the instrument when
the power was last turned off.
Initialization
NOTE: Before turning the power on, remove the USB memory key.
Otherwise, the system does not start.
Initializes the settings of this instrument.
6. Press SHIFT and SYSTEM(PRESET).
Initial setting conditions are loaded.
4-14
Figure 4-8 Initial Setting Screen
Page 49

U3700 Series User’s Guide
4.3.1 Calibration
Selecting the input connector
For the U3741 and U3751, only RF INPUT1 can be used as the input connector.
No need to select the input connector.
For the U3771 and U3772, select the input to be performed the calibration.
Press SHIFT and - (RF1).
RF INPUT1 is selected.
Press SHIFT and 0 (RF2).
RF INPUT2 is selected.
The calibration of either RF INPUT1 or RF INPUT2 can be performed first.
The following describes the procedure in which the calibration of RF INPUT1 is performed first.
Connecting the input signal
Connect the calibration signal.
7. Attach the N(m)-BNC(f) adaptor to the RF INPUT1 connector on the front panel.
Connect the included BNC (m)-BNC (m) input cable to the CAL OUT connector
on the front panel and the N(m)-BNC(f) adaptor.
Figure 4-9 Connecting the CAL Signal (RF INPUT1 connector)
8. Press SYSTEM.
9. Press 6 Calibration on the soft key menu.
The Calibration menu is displayed.
4-15
Page 50

U3700 Series User’s Guide
4.3.1 Calibration
10. Press Calibrate All on the Calibration menu.
Calibration starts.
The following message is displayed if the calibration of RF INPUT1 is complete.
First step of calibration completed.
Connect the calibrator to RF2 connector.
Then press OK to continue.
The calibration is canceled if Hz is pressed.
To perform the calibration of RF INPUT2, change the cable connection.
11. Attach the BNC(f)-SMA(m) adapter to the RF INPUT2 connector on the front
panel.
Connect the included BNC(m)-BNC(m) input cable to the CAL OUT connector
on the front panel and the BNC(f)-SMA(m) adapter.
4-16
Figure 4-10 Connecting the CAL Signal (RF INPUT2 connector)
12. Press and select OK.
Press Hz to start the calibration.
Page 51

4.3.2 Displaying Spectrum and Operating Markers
4.3.2 Displaying Spectrum and Operating Markers
This section describes how to display spectrums and use markers by using the CAL signal of this instrument.
The level difference between the CAL signal and its second harmonics are measured as an example.
Required equipment
This instrument
Conversion adaptor: N (m)-BNC (f)
Input cable: BNC (m)-BNC (m)
Turning on the power supply
IMPORTANT: Use this instrument within a specified temperature range to perform
accurate measurements. Perform calibration after allowing a warm up
time of 5 minutes or more.
U3700 Series User’s Guide
Initialization
1. Verify that the AC power switch on the rear panel is set to OFF.
2. Connect the included power cable to the AC power connector on the rear panel.
CAUTION: To prevent damage, do not supply a voltage and frequency, which
exceed the specified range, to this instrument.
3. Connect the power cable to an electrical outlet.
4. Turn on the AC power switch on the rear panel.
After turning on the AC power switch, wait for three seconds or more.
5. Turn on the power switch on the front panel.
MEMO: The display may be different depending on the state of the instrument when
the power was last turned off.
Initialize the settings of this instrument.
6. Press SHIFT and SYSTEM(PRESET).
Initial setting conditions are loaded.
4-17
Page 52

U3700 Series User’s Guide
4.3.2 Displaying Spectrum and Operating Markers
Connecting the input signal
Connecting the calibration signal.
7. Attach the N(m)-BNC(f) adaptor to the INPUT connector on the front panel.
Connect the included BNC (m)-BNC (m) input cable to the CAL OUT connector
on the front panel and the N(m)-BNC(f) adaptor.
Figure 4-11 Connecting the CAL Signal
Setting measurement conditions
Setting the measurement conditions to observe the input signal more easily.
After initialization, the center frequency can be set.
8. Press 3, 0, and MHz.
The center frequency is set to 30 MHz.
4-18
Page 53

4.3.2 Displaying Spectrum and Operating Markers
Figure 4-12 Setting the Center Frequency
U3700 Series User’s Guide
9. Press SPAN.
The current frequency span is displayed in the active function display area and
the Span menu is displayed.
10. Press 4, 0, and MHz.
The frequency span is set to 40 MHz.
11. Press AMPLITUDE.
The current reference level is displayed in the active function display area and the
Level menu is displayed.
12. Press -, 1, 0, and GHz(dBm).
The reference level is set to -10 dBm.
Figure 4-13 Completing the Setting of the measurement conditions
4-19
Page 54

U3700 Series User’s Guide
4.3.2 Displaying Spectrum and Operating Markers
Displaying a marker on the peak
13. Press PEAK.
The marker is displayed on the peak and the frequency (approximately 20 MHz)
and level (approximately -20 dBm) of the marker are displayed in the marker area
Displaying a delta marker
14. Press MKR.
15. Press 2, 0, and MHz.
Figure 4-14 Displaying the Peak Search
The Marker menu used for the marker function is displayed.
Press 4 Delta Mode.
Press 1 Delta ON/OFF.
The delta marker is displayed and the frequency difference and level difference
between the marker and delta marker are displayed in the marker area.
MKΔ 0 Hz
0.00 dB
The active marker is displayed on the second harmonics, which is 20 MHz away
from the CAL signal.
The differences of frequency and level between two signals are displayed in the
marker area.
MKΔ 20.00 MHz
-52.21 dB
4-20
Page 55

U3700 Series User’s Guide
4.3.2 Displaying Spectrum and Operating Markers
Figure 4-15 Measuring the Difference of Frequency and Level by Using the Delta Marker
4-21
Page 56

U3700 Series User’s Guide
4.3.3 How to Cancel the UNCAL Message
4.3.3 How to Cancel the UNCAL Message
The setting among the resolution bandwidth (RBW), video bandwidth (VBW), frequency span (Span), and
sweep time (Sweep Time) affect to each other.
If the combination of these settings in the manual setting is inappropriate, the UNCAL message is displayed at the bottom to the right of the scale. If the UNCAL message is displayed, the measurement level
accuracy cannot be guaranteed.
Change the following settings to cancel the UNCAL message.
• Expand the resolution bandwidth (RBW).
• Expand the video bandwidth (VBW).
• Slow the sweep time (Sweep Time).
• If RBW or VBW cannot be changed, narrow the frequency span (Span).
IMPORTANT: Accurate measurement data cannot be acquired while the UNCAL message is displayed.
This section describes how to cancel the UNCAL message, which was generated because of the fast sweep
time, by changing the RBW setting.
Required instruments
This instrument
Conversion adaptor: N (m)-BNC (f)
Input cable: BNC (m)-BNC (m)
Turning on the power supply
IMPORTANT: Use this instrument within the specified temperature range to perform accurate measurements.
Perform calibration after allowing a warm up time of 5 minutes or more.
1. Verify that the AC power switch on the rear panel is set to OFF.
2. Connect the included power cable to the AC power connector on the rear panel.
CAUTION: To prevent damage, do not supply a voltage and frequency, which
exceed the specified range, to this instrument.
3. Connect the power cable to an electrical outlet.
4. Turn on the AC power switch on the rear panel.
After turning on the AC power switch, wait for three seconds or more.
4-22
5. Turn on the power switch on the front panel.
MEMO: The display may be different depending on the state of the instrument when
the power was last turned off.
Page 57

Initialization
Initialize the settings of this instrument.
6. Press SHIFT and SYSTEM(PRESET).
Initial setting conditions are loaded.
Connecting the input signal
Connect the calibration signal.
7. Attach the N(m)-BNC(f) adaptor to the INPUT connector on the front panel.
Connect the included BNC (m)-BNC (m) input cable to the CAL OUT connector
on the front panel and the N(m)-BNC(f) adaptor.
U3700 Series User’s Guide
4.3.3 How to Cancel the UNCAL Message
Figure 4-16 Connecting the CAL Signal
Setting measurement conditions
Set the measurement conditions to observe the input signal more easily.
8. Press FREQUENCY, 2, 0, and MHz.
The center frequency is set to 20 MHz.
9. Press CPL, Sweep Time AUTO/MNL, 2, 0, and kHz (ms).
The sweep time is set to 20 ms.
10. Press SPAN, 1, 0, and kHz.
The span is set to 10 kHz.
The RBW is automatically set to 300 Hz according to the span setting and
UNCAL message is displayed.
The sweep time setting of 20 msec is too fast for the set conditions.
4-23
Page 58

U3700 Series User’s Guide
4.3.3 How to Cancel the UNCAL Message
Figure 4-17 Displaying the UNCAL Message
How to cancel the UNCAL message
11. Press CPL, RBW AUTO/MNL, 1, and kHz.
Setting the RBW to 1 kHz cancels the UNCAL message because the sweep time
of 20 msec meets the set conditions.
Figure 4-18 Canceling the UNCAL Message
4-24
Page 59

4.3.4 Identifying an Image Signal
This function is available only for the U3751, U3771, and U3772.
This instrument may display an image signal depending on the input signal.
If measuring an unknown frequency signal, the real signal and image signal must be identified before starting the measurement.
The Image Suppression and Signal Identification functions can be used to identify the image signal.
Image Suppression function
Detects image signals and automatically deletes them from the display.
Press FREQUENCY, More1/2, and Image Suppression ON/OFF.
[OFF]
U3700 Series User’s Guide
4.3.4 Identifying an Image Signal
[ON]
"IS" is displayed at the bottom right of the screen when the Image Suppression function is set to ON.
White font: Indicates that the calculation process of Image Suppression is correctly performed.
Red font: Indicates that the calculation process of Image Suppression is being performed or the
calculation results are indefinite.
For example, when the center frequency is changed or the frequency of the input signal changes.
4-25
Page 60

U3700 Series User’s Guide
4.3.4 Identifying an Image Signal
Signal Identification function
The frequencies of Image signals are shifted and displayed in each sweep.
The displayed frequencies of real signals do not change.
Press FREQUENCY, More1/2, and Signal Identification ON/OFF.
Real signal Image signal
4-26
Page 61

4.3.5 Hard Copy Output
4.3.5.1 Output to a Printer
Printer connection
When using a printer which is used for the first time,
1. Turn off the power of the printer and this instrument and connect the printer to
the USB connector on the front or rear panels of this instrument.
2. Turn on the power of the printer.
3. Turn on the power of this instrument.
Anytime after the second time the printer is used, the printer can be connected to this
instrument even if the power of this instrument is turned on.
U3700 Series User’s Guide
4.3.5 Hard Copy Output
Output to a printer
1. Specify the printer as the output device in COPY Config.
SYSTEM, More1/2, Copy Config,
or
SHIFT, COPY
Select PRT (printer) from the Copy Device menu.
2. Press the COPY key or Copy in the Copy menu to start printing.
Printers whose operation has been checked
Manufacturer Model name
Epson PM-900C, PM-760C, PM-740C, PM-2200C, PM-G720, PX-V500
HP HP5650, HP6122, Deskjet5740, Deskjet6840, Photosmart7830
Canon iP4200
MEMO: The printing time can be reduced by performing the following:
1. Start copying during a sweep stop.
2. Use White and Black for Color Pattern.
4-27
Page 62

U3700 Series User’s Guide
4.3.5 Hard Copy Output
4.3.5.2 File Output to USB Memory
Connecting a USB memory device
1. Connect a memory device to a USB port on the front or rear panels of this instrument.
2. Press SYSTEM, More1/2, Copy Config, Screen Shot Config, and Media.
A dialog box is displayed.
Select a memory device by using the key and confirm it by using the Hz key.
4-28
3. Press the Media key.
The dialog box closes.
File output
1. Selecting a file format
Select the PNG or BMP format by pressing SYSTEM, More1/2, Copy Config,
Screen Shot Config, and File Format PNG/BMP.
2. File name
COPYxxx.BMP(PNG) is used as the file name.
File number xxx is specified by Auto Inc Index and automatically increments by
1 each time a file is saved when Auto Inc is set to ON.
The file name COPY.BMP(PNG) is fixed when Auto Inc is set to OFF.
3. Output
Images on the screen can be saved to the USB memory device by pressing the
COPY key.
Page 63

U3700 Series User’s Guide
4.3.5 Hard Copy Output
4. Time Stamp
A time stamp (date and time), which uses the same format as the computer, is
included in a file.The order in which files are saved can be checked by using this
time stamp.
The date and time can be checked and set by panel operations or GPIB commands.
Examples of GPIB commands:
• Command to check the date and time
Date: SETDATE?
Time: SETTIME?
• Command to set the date and time
Date: SETDATE yy/mm/dd
Time: SETTIME hh/mm/ss
•Example
Set the date to January 1, 2005.
SETDATE 050101
Set the time to 10:10.
SETTIME 101000
Table 4-1 USB Memory Devices Whose Operation with this Instrument has Already Checked
Manufacturer Model name
BUFFALO RUF-C128ML/U2,
RUF2-M128/256/1G, RUF2-E2GL-BL
HAGIWARA HUD-128PJ *
IO DATA EasyDisk EDP-128, TB-B128, TB-ST2G/K
LEXAR JumpDrive 128MB
SanDisk CruzerMini 128MB,
SDCZ4-128-J65 *, SDCZ23-002G-J65N
ADTEC AD-UMX128MSB *
GREEN HOUSE GH-UFD128PLZ *
ELECOM MF-PU2128SV *, MF-AU202GSV
Princeton PFU-2JU/128/256/512/1G
Transcend TS2GJF160
* For the 256-MB type, the operation with this instrument has also
been checked.
NOTE: The USB memory key with a security function cannot be used.
4-29
Page 64

U3700 Series User’s Guide
4.3.6 Measuring by using the TG (OPT76/OPT77)
4.3.6 Measuring by using the TG (OPT76/OPT77)
Measures the characteristics of the bandpass filter, whose pass band is located near the frequency of 1900
MHz.
(Measuring the insertion loss and pass bandwidth of the filter)
Required equipment
This instrument
Conversion adaptor: N (m)-BNC (f) ×2
Input cable: BNC (m)-BNC (m)
Turning on the power supply
IMPORTANT: Use this instrument within the specified temperature range to perform accurate measurements.
Perform calibration after allowing a warm up time of 5 minutes or more.
Initialization
1. Verify that the AC power switch on the rear panel is set to OFF.
2. Connect the included power cable to the AC power connector on the rear panel.
CAUTION: To prevent damage, do not supply a voltage and frequency, which
exceed the specified range, to this instrument.
3. Connect the power cable to an electrical outlet.
4. Turn on the AC power switch on the rear panel.
After turning on the AC power switch, wait for three seconds or more.
5. Turn on the power switch on the front panel.
MEMO: The display may be different depending on the state of the instrument when
the power was last turned off.
Initialize the settings of this instrument.
6. Press SHIFT and SYSTEM(PRESET).
Initial setting conditions are loaded.
4-30
7. Regarding U3771 and U3772, press SHIFT and - (RF1) to select RF INPUT1.
Page 65

Connecting the cable
U3700 Series User’s Guide
4.3.6 Measuring by using the TG (OPT76/OPT77)
1. Attach the N(m)-BNC(f) adapters to the RF INPUT1 connector and the TG
OUTPUT connector on the front panel and then connect the BNC(m)-BNC(m)
cable to both connectors.
Figure 4-19 Connecting the TG Mesurement
Setting the measurement conditions to allow easier measurement of the input signal.
2. Press FREQUENCY, 1, 9, 0, 0, and MHz.
The center frequency is set to 1900 MHz.
3. Press SPAN, 2, 0, 0, and MHz.
The frequency span is set to 200 kHz.
4. Press AMPLITUDE, dB/div, and 2dB/div.
The level display scale is set to 2 dB/div.
5. Press TG, TG Level, 5, and MHz(-dBm).
The output level of the tracking generator is set to -5 dBm.
6. Press TG ON/OFF to turn on the TG output.
4-31
Page 66

U3700 Series User’s Guide
4.3.6 Measuring by using the TG (OPT76/OPT77)
Performing the normalization
MEMO: The frequency response errors of accessories used in the measurement such as cables and adapters can
be removed by performing the normalization and the accurate measurement can be performed.
1. Press Normalize.
The TG Normz menu is displayed.
2. Press Reference Line ON/OFF, 5, and MHz(-dBm).
The Reference Line position, at which the normalization is performed, is set to 5 dB.
3. Press Capture Normz Data.
The normalization data is acquired based on the set Reference Line position.
4. Press Normalize Correction ON/OFF.
The normalization is performed.
CAUTION: If the settings of the center frequency, frequency span, reference level,
or level display scale are changed after the normalization is performed,
the normalization subsequent to this change does not perform correctly.
Re-perform the normalization after changing the settings.
4-32
Page 67

U3700 Series User’s Guide
4.3.6 Measuring by using the TG (OPT76/OPT77)
Connecting the unit under test
1. Connect the unit under test to TG OUTPUT and RF INPUT1 of this instrument
as shown in Figure 4-20.
Figure 4-20 Connecting the Unit Under Test
Unit under test
4-33
Page 68

U3700 Series User’s Guide
4.3.6 Measuring by using the TG (OPT76/OPT77)
CAUTION:
In the frequency response measurement by using the TG, the level measurement
error may be larger even if the UNCAL message is not displayed on the screen.
Increase the sweep time until the displayed waveform does not change.
The TG response affects the measurement accuracy in the following cases:
• The unit under test has high Q and sharp level change characteristics. (For
example, crystal filter)
• The measurement is performed in the wide frequency span.
4-34
Measuring the insertion loss
1. Press Delta Ref Line ON/OFF.
The MKΔ value displays the level difference to the reference line.
2. Press PEAK.
The marker level indicates the insertion loss of the filter.
Page 69

U3700 Series User’s Guide
4.3.6 Measuring by using the TG (OPT76/OPT77)
Measuring the 1-dB bandwidth
1. Start from the state of the insertion loss measurement.
Press MEAS2, XdB Down, XdB Level, 1, GHz(+dBm), and Execute XdB
Down.
A marker is displayed at the right and left points on the waveform at a level which
is 1 dB below the peak.
The marker frequency indicates the 1-dB bandwidth of the filter.
4-35
Page 70

U3700 Series User’s Guide
4.3.7 USER Key
4.3.7 USER Key
A soft menu related to operation keys and extended function keys can be set to the USER key menu.
The operability is improved by allocating functions, which are frequently-used or are located in a deep
multilayer menu, to the USER key menu.
How to set a function menu to the USER menu
1. Display a function menu, which is set to the USER menu, in the soft menu display area.
2. Press SHIFT and then USER.
3. Press a menu key to be set.
If canceling the setting, press any other operation key.
If setting an additional function menu to the USER menu, repeat the above procedure.
How to delete a function menu from the USER menu
1. Press USER to display the USER menu.
2. Press SHIFT and then USER.
3. Press a menu key to be deleted.
If deleting an additional soft key, repeat the above procedure.
4-36
Page 71

U3700 Series User’s Guide
4.4 Measurement Examples
4.4 Measurement Examples
Descriptions regarding "Turning on the power" and "Initializing this instrument" are omitted from this chapter.
4.4.1 Using the Normalize Function and Level Correction Table
When a signal is measured by using a long measurement cable, the measurement level accuracy can be
improved by correcting the cable frequency loss.
Functions used in this measurement
1. TG option + Normalize function → Cable loss measurement
2. Level correction table
DUT
Measuring the cable loss
1. Connect TG OUTPUT and RF INPUT1 by using the input cable included with
Long measurement cable
this instrument.
2. Press FREQUENCY, 2, 0, MHz, SPAN, 1, MHz, TG, and TG ON/OFF (ON).
The center frequency is set to 20 MHz, the frequency span is set to 1 MHz, and
the TG (option) is set to ON.
4-37
Page 72

U3700 Series User’s Guide
4.4.1 Using the Normalize Function and Level Correction Table
3. Press EXT CFG, Ref/Disp Lines, and Reference Line ON/OFF (ON).
The reference line is displayed on the screen.
Reference line
4. Turn the knob to adjust the reference line to the TG signal.
5. Press FREQUENCY, 1, ., 5, GHz, SPAN, 3, and GHz.
The center frequency is set to 1.5 GHz and the frequency span is set to 3 GHz.
6. Press TG, Normalize, Capture Normz Data, and Normalize Correction ON/
OFF (ON).
7. Connect TG OUTPUT and RF INPUT1 by using a cable that is actually used for
this measurement.
The frequency characteristic of the cable used in the measurement is displayed.
4-38
Page 73

U3700 Series User’s Guide
4.4.1 Using the Normalize Function and Level Correction Table
8. Press MKR, Delta Mode, Delta ON/OFF (ON), Ref Object, and Reference
Line.
The marker delta mode is set.
The marker value shows a cable loss based on a frequency of 20 MHz.
9. Move the marker and read a cable loss for each frequency.
For this measurement, 10 frequency points from 300 MHz to 3 GHz are used.
4-39
Page 74

U3700 Series User’s Guide
4.4.1 Using the Normalize Function and Level Correction Table
Creating the correction table
10. Press AMPLITUDE, More 1/2, and Edit Corr Factor.
The Correction Factor Table is displayed.
The cursor is positioned at the frequency setting text field of correction point 1.
11. Press 3, 0, 0, and MHz.
The correction point 1 frequency is set to 300 MHz.
The cursor moves to the level setting text field.
12. Press 0, ., 8, and GHz.
The correction value of correction point 1 is set to 0.8 dB.
The cursor moves to the frequency setting text field of correction point 2.
13. Repeat the above procedure and complete the correction table.
4-40
Page 75

Using the correction table
14. Press AMPLITUDE, More 1/2, and Correction Factor ON/OFF (ON).
U3700 Series User’s Guide
4.4.1 Using the Normalize Function and Level Correction Table
The displayed measurement value is corrected based on the correction table.
Correction Factor OFF
Cable loss: 3.13 dB at 3 GHz
Correction Factor ON
The cable frequency loss is corrected.
Frequency: 2.1 GHz
Measurement value: -12.9 dBm
Frequency: 2.1 GHz
Measurement value: -10.5 dBm
4-41
Page 76

U3700 Series User’s Guide
4.4.1 Using the Normalize Function and Level Correction Table
Available range of the correction value
Up to ±100 dB can be set as the correction value.
The correction value of the first correction point is applied to frequencies from 0 Hz
to the first correction point frequency.
Correction values between points where correction values are set are obtained by
using a method of linear interpolation.
The correction value of the last correction point is applied to frequencies following to
the last correction point frequency.
4-42
Page 77

4.4.2 W-CDMA Channel Power Measurement
This section describes a measurement example of the W-CDMA signal by using the MEAS1 function.
• The maximum input level of this instrument
RF1: +30 dBm ±50 VDC (U3741)
RF1: +30 dBm ±15 VDC (U3751/U3771/U3772)
RF2: +10 dBm ±25 VDC (U3771/U3772)
CAUTION:
1. When measuring signal power that exceeds the maximum input level, connect an external attenuator to
ensure that the input level does not exceed it.
A band rejection filter may be required depending on the standard.
2. When turning the power on, do not connect a DUT to this instrument.
3. Before turning the power off, disconnect the DUT from this instrument.
The W-CDMA mobile station signal, whose frequency is 1952.4 MHz and level is +24 dBm, is measured.
U3700 Series User’s Guide
4.4.2 W-CDMA Channel Power Measurement
DUT
Setting measurement conditions
1. Press FREQUENCY, 1, 9, 5, 2, ., 4, and MHz.
The center frequency is set to 1952.4 MHz.
2. Press SPAN, 1, 0, and MHz.
The frequency span is set to 10 MHz.
3. Press AMPLITUDE, More 1/2, Ref Offset ON/OFF (ON), 3, 0, and GHz.
A value of 30 dB, which is the attenuation of the external attenuator, is added to
a level reading value.
30 dB
Attenuator
4-43
Page 78

U3700 Series User’s Guide
4.4.2 W-CDMA Channel Power Measurement
4. Press MEAS1 and Channel Power.
A window that shows the measurement channel width is displayed at the center
of the screen.
5. Press Channel Width, 3, ., 8, 4, and MHz.
The channel width is set to 3.84 MHz.
Measuring the channel power
6. Press Execute ON/OFF (ON).
The channel power measurement starts.
The detector is automatically set to RMS.
4-44
The measurement result is displayed.
A display line that shows the channel power is displayed.
Page 79

U3700 Series User’s Guide
4.4.3 W-CDMA Adjacent Channel Leakage Power (ACP) Measurement
4.4.3 W-CDMA Adjacent Channel Leakage Power (ACP) Measurement
A signal of 2100 MHz output from the W-CDMA transmitter is measured.
DUT
Attenuator
Examples of measurement specifications
Channel space Specified bandwidth Specification
5 MHz 3.84 MHz 45 dB
10 MHz 3.84 MHz 50 dB
CS2
BS2
BS1
CS1
CS2
CS1
BS2BS1
Setting measurement conditions
1. Press FREQUENCY, 2, 1, 0, 0, and MHz.
The center frequency is set to 2100 MHz.
2. Press SPAN, 2, 5, and MHz.
The frequency span is set to 25 MHz.
CS: Channel space
BS: Specified bandwidth
4-45
Page 80

U3700 Series User’s Guide
4.4.3 W-CDMA Adjacent Channel Leakage Power (ACP) Measurement
CAUTION:
Set the frequency span according to the following conditions.
• For Nyquist Filter OFF:
SPAN > 2*CS + BS
• For Nyquist Filter ON:
SPAN > 2*CS + (1 + Roll Off Factor)*Symbol Rate
3. Press AMPLITUDE, More 1/2, Ref Offset ON/OFF(ON), 3, 0, and GHz.
A value of 30 dB, which is the attenuation of the external attenuator, is added to
a level reading value.
4. Press MEAS1 and ACP.
The ACP menu is displayed.
Setting the CS/BS table
5. Press Channel Definition.
The CS/BS table is displayed.
The cursor is positioned at the Channel Space 1 setting text field.
6. Press 5 and MHz.
Channel Space 1 is set to 5 MHz.
The cursor moves to the Channel Bandwidth 1 setting text field.
7. Press 3, ., 8, 4, and MHz.
Channel Bandwidth 1 is set to 3.84 MHz.
The cursor moves to the Channel Space 2 setting text field.
8. Press 1, 0, and MHz.
Channel Space 1 is set to 10 MHz.
The cursor moves to the Channel Bandwidth 2 setting text field.
9. Press 3, ., 8, 4, and MHz.
Channel Bandwidth 2 is set to 3.84 MHz.
10. Press RETURN.
4-46
Page 81

Measuring the ACP
U3700 Series User’s Guide
4.4.3 W-CDMA Adjacent Channel Leakage Power (ACP) Measurement
11. Press Execute ON/OFF (ON).
The ACP measurement starts.
The detector is automatically set to RMS.
Displaying the channel bandwidth
12. Press Config and Ch Windows ON/OFF (ON).
The set channel bandwidth window is displayed on the screen.
The frequency span must be set so that all channels are included in it.
4-47
Page 82

U3700 Series User’s Guide
4.4.4 W-CDMA Spurious Measurement
4.4.4 W-CDMA Spurious Measurement
The spurious response is measured in frequency bands higher than 30 MHz.
DUT
Examples of measurement specifications
Frequency range RBW Spurious level
9 kHz ∼ 150 kHz 1 kHz -13 dBm
150 kHz ∼ 30 MHz 10 kHz -13 dBm
30 MHz ∼ 1 GHz 100 kHz -13 dBm
1 GHz ∼ 12.75 GHz (*) 1 MHz -13 dBm
(*) In a frequency range from 1.8935 GHz to 1.9196 GHz and the 300-kHz
RBW, the spurious level is -41 dBm or less.
Setting measurement conditions
Attenuator
4-48
1. Press TRACE, Detector, and Posi.
Detector is set to Posi to perform the spurious measurement.
2. Press MEAS1, Spurious, and Bands Definition.
The Spurious Bands table is displayed.
The cursor is positioned at the start frequency setting text field of frequency band
1.
3. Press 3, 0, and MHz.
The start frequency is set to 30 MHz and the cursor moves to the stop frequency
setting text field.
4. Press 1 and GHz.
The stop frequency is set to 1 GHz and the cursor moves to the RBW selection
button from Auto and Manual.
If selecting Auto, press Hz.
If selecting Manual, turn the knob clockwise for one click to select the Manual
button, and then press Hz.
Page 83

U3700 Series User’s Guide
4.4.4 W-CDMA Spurious Measurement
5. Select Manual, and then press 1, 0, 0, and kHz.
The RBW is set to Manual and 100 kHz.
6. Repeat the above procedure and set the VBW to Manual and 100 kHz, the SWP
to Auto, the ATT to Manual and 20 dB, the Ref Level to 0 dBm, and the Preamp
to Off.
The cursor moves to the limit value setting text field.
7. Press -, 1, 3, and GHz.
The limit value is set to -13 dBm, and then the cursor moves to the start frequency
setting text field of the next frequency band.
8. Repeat the above procedure and complete the Spurious Bands table.
9. Press RETURN.
The spurious measurement menu is displayed.
4-49
Page 84

U3700 Series User’s Guide
4.4.4 W-CDMA Spurious Measurement
Measuring the spurious response
10. Press Execute ON/OFF (ON).
The spurious response in each frequency band that changes after a sweep is measured according to the measurement conditions set in the Spurious Bands table.
Characters that indicate a frequency band, in which the spurious response is
being measured, are displayed in yellow.
If the measured value is equal to the set limit value or less, the judgment is PASS.
If the measured value is more than the set limit value, the judgment is FAIL.
11. Press Results.
Measurement results in each frequency band are displayed.
4-50
Page 85

4.4.5 CN Measurement in Terrestrial Digital Broadcasting
4.4.5 CN Measurement in Terrestrial Digital Broadcasting
The difference (CN ratio) between a carrier level (C) and noise level (N) in terrestrial digital broadcasting
is measured.
When measuring the CN ratio, connect the 75-Ω impedance converter (ZT-130NC) to the RF1 input connector of this instrument. Set the measurement unit to dBμV.
50 Ω
ZT-130NC
70 Ω
U3700 Series User’s Guide
Setting the measurement unit
1. Press AMPLITUDE, Units, and dB
The measurement unit is set to dBμV.
2. Press AMPLITUDE, More1/2, and Input Impedance 50/75 (75).
The conversion loss of the 75-Ω impedance converter (ZT-130NC) is corrected
for the measured value.
TV signal
μ
V.
4-51
Page 86

U3700 Series User’s Guide
4.4.5 CN Measurement in Terrestrial Digital Broadcasting
Measuring the carrier level (C)
Setting this instrument
Measurement mode: Channel power measurement function
Center frequency: Center frequency in the channel
SPAN 10 MHz
RBW: 30 kHz
VBW: 300 kHz
Measurement bandwidth: 5.6 MHz
(Channel power bandwidth)
4-52
Figure 4-21 Measurement Display for Channel Power
Procedure (Example for 27 channels)
1. Press FREQUENCY, 5, 5, 7, ., 1, 4, 2, 8, 5, 7, and MHz.
The center frequency is set to 557.142857 MHz.
2. Press SPAN, 1, 0, and MHz.
The frequency span is set to 10 MHz.
Page 87

U3700 Series User’s Guide
4.4.5 CN Measurement in Terrestrial Digital Broadcasting
3. Press AMPLITUDE and then press to adjust a signal peak on the third scale
from the top.
4. Press CPL, RBW AUTO/MNL, 3, 0, kHz, VBW AUTO/MNL, 3, 0, 0, and kHz.
The RBW is set to 30 kHz and the VBW is set to 300 kHz.
5. Press MEAS1 and Channel Power.
A window that shows the measurement channel width is displayed in the center
of the screen.
6. Press Channel Width, 5, ., 6, and MHz.
The channel width is set to 5.6 MHz.
4-53
Page 88

U3700 Series User’s Guide
4.4.5 CN Measurement in Terrestrial Digital Broadcasting
7. Press Execute ON/OFF (ON).
The channel power measurement begins.
8. The measurement result is displayed in the Channel Power window.
C = 58.33 dBμV (Figure 4-21)
Measuring the noise level (N)
Setting this instrument
Measurement mode: Noise/Hz measurement function
Measurement noise area frequency:
SPAN: 10 MHz
RBW: 100 kHz
VBW: 1 kHz
Measurement bandwidth: 5.6 MHz
Averaging count: 30 times
Noise that is adjacent to the measurement signal and
not affected by the signal
(A value for the Noise/Hz conversion)
4-54
Figure 4-22 Measurement Display for Noise Power Converted into 5.6 MHz
Bandwidth
Procedure
9. Press Execute ON/OFF (OFF).
The channel power measurement is canceled.
Page 89

U3700 Series User’s Guide
4.4.5 CN Measurement in Terrestrial Digital Broadcasting
10. Press CPL, RBW AUTO/MNL, 1, 0, 0, kHz, VBW AUTO/MNL, 1, and kHz.
The RBW is set to 100 kHz and the VBW is set to 1 kHz.
11. Press MKR and then press to move the marker into a noise area.
12. Press TRACE, Calc, Power Average, Start/Stop (Start), Max Sweep Count, 3,
0, and Hz (Enter).
The Max Sweep Count is set to 30.
13. Press MEAS 2, Noise/Hz, 5, ., 6, and MHz.
14. Press dB
The measurement begins.
μ
V/Sqrt (Hz) ON/OFF (ON).
4-55
Page 90

U3700 Series User’s Guide
4.4.5 CN Measurement in Terrestrial Digital Broadcasting
15. The measurement result is displayed in the Noise-Marker 1 window.
N = 34.26 dBμV (Figure 4-22)
Calculating the CN ratio
The CN ratio can be obtained by calculating the values, which are measured from the
carrier (C) and noise (N) level measurements.
(C: a value in step 8, N: a value in step 15)
CN ratio = C - N = 58.33 - 34.26 = 24.07 dB
4-56
Page 91

4.4.6 Television Signal Measurement
Japanese television channels are pre-saved to OPT15 (75 Ω input option).
The table can be read using the Recall function and a measurement frequency can be set using the channel
number.
Registered files and setting conditions
1_CATV_CH: CATV channel (See A.6.1)
2_VHF&UHF_CH: VHF and UHF channels (See A.6.2)
3_BS_IF_CH: BS-IF channel (See A.6.4)
4_CS_IF_CH: CS-IF channel (See A.6.5)
5_Digital_CH: Terrestrial digital channel (See A.6.3)
6_Digital_Noise: Terrestrial digital noise measurement
7_Digital_ChPower: Terrestrial digital channel power measurement
Recall the file and refer to the registered channel table. The center frequency can be set using the channel
number.
Change SPAN, REF LEVEL, and input attenuator settings according to the operating environment.
U3700 Series User’s Guide
4.4.6 Television Signal Measurement
NOTE: When the 6_Digital_Noise file is recalled, the input attenuator is set to 0 dB.
Be careful of the input signal level.
Example of recalling the 7_Digital_ChPower file and measuring the Channel 28 power
Procedure
1. Press FILE and Recall.
The Recall window is displayed.
2. Turn the knob to select the 7_Digital_ChPower.dat file.
4-57
Page 92

U3700 Series User’s Guide
4.4.6 Television Signal Measurement
3. Press Hz or .
The 7_Digital_ChPower.dat file is determined as a file to be recalled.
4. Press Hz or .
Select the Recall button.
5. Press Hz.
The terrestrial digital broadcasting channel table and measurement conditions are
recalled and set.
6. Press FREQUENCY, 2, 8, and Hz.
The center frequency is set to 563.14 MHz, that is for Channel 28.
At the same time, the channel power measurement starts and then the measurement result is displayed.
4-58
Page 93

4.4.7 VSWR Measurement
Reflection characteristics of an antenna and filter are measured by using the SWR bridge.
A return loss and VSWR at a marker point are displayed.
1. Connect the SWR bridge as shown in Figure 4-23 VSWR Measurement.
U3700 Series User’s Guide
4.4.7 VSWR Measurement
In
Figure 4-23 VSWR Measurement
2. Execute normalization without connecting a DUT to the TEST port of the SWR
bridge.
Set CENTER, SPAN, and REF in accordance with the DUT.
Press TG, Reference Line ON/OFF(ON), 2, 0, and MHz.
Set the reference line to -20 dBm.
Press TG and TG ON/OFF(ON).
Set the TG output to ON.
Press Normalize, Capture Normz Data, and Normalize Correction ON/
OFF(ON).
Normalization is executed while the TEST port is open.
CAUTION: If a setting condition is changed after normalization is executed, re-
execute normalization.
Bridge
DUT
Out
TEST
4-59
Page 94

U3700 Series User’s Guide
4.4.7 VSWR Measurement
3. Connect the DUT to the TEST port of the SWR bridge.
Press VSWR ON/OFF(ON).
A return loss and VSWR at the marker point are displayed.
4-60
Page 95

U3700 Series User’s Guide
5. MENU MAP, FUNCTIONAL EXPLANATION
5. MENU MAP, FUNCTIONAL EXPLANATION
This chapter describes the configurations and functions of the soft keys displayed on the touch screen.
Menu Index: This section can be used to refer to the keys in this chapter.
Menu Map: This section shows the menu configurations of the panel keys.
Functional Descriptions: This section describes the functions of the panel keys and soft keys.
5.1 Menu Index
Operation Key Pages Operation Key Pages
%AM Meas ON/OFF .............................. 5-37, 5-40
%OBW .................................................... 5-25, 5-30
0.5 dB/div ................................................ 5-62, 5-63
1 dB/div ................................................... 5-62, 5-63
1/Delta Mkr ON/OFF .............................. 5-47, 5-48
10 dB/div ................................................. 5-62, 5-63
2 Channel ON/OFF ................................. 5-17
2 Channel Preset ..................................... 5-17
2 Channels Viewer .................................. 5-17
2 dB/div ................................................... 5-62, 5-63
3GPP DL Modulation ............................. 5-17
5 dB/div ................................................... 5-62, 5-63
A-B→A ................................................... 5-43, 5-45
A-B→B ................................................... 5-43, 5-46
A-B→C ................................................... 5-43, 5-46
ACP ......................................................... 5-25, 5-30
A-DL→A ................................................ 5-43, 5-46
All Auto .................................................. 5-72, 5-73
AMPLITUDE ......................................... 5-62
Annotations ON/OFF .............................. 5-7, 5-9
APPLI ..................................................... 5-17
ATT ......................................................... 5-62
ATT AUTO/MNL ................................... 5-62
Attenuation 0 dB ..................................... 5-62
Auto ........................................................ 5-72, 5-73
Auto Inc Index ........................................ 5-8, 5-13
Auto Inc ON/OFF ................................... 5-8, 5-13
Auto name Index ..................................... 5-18, 5-20
Auto Tune ............................................... 5-61
Auto-name Radix .................................... 5-18, 5-20
Average ................................................... 5-43, 5-44,
5-45
Average Control ...................................... 5-25, 5-26,
5-27, 5-28,
5-29, 5-30,
5-32, 5-36,
5-38, 5-39
Average ONCE/SLIDE ........................... 5-25, 5-26,
5-27, 5-28,
5-29, 5-30,
5-32, 5-36,
5-38, 5-40,
5-43, 5-44,
5-45
Average PAUSE/CONT ......................... 5-36, 5-38,
5-40, 5-43,
5-44
Average Power ........................................ 5-25, 5-29
Average START/STOP .......................... 5-36, 5-38,
5-39, 5-43,
5-44
Averaging ON/OFF ................................ 5-25, 5-26,
5-27, 5-28,
5-29, 5-30,
5-32
B-A→A ................................................... 5-43, 5-45
B-A→B ................................................... 5-43, 5-45
B-A→C ................................................... 5-43, 5-46
Bands Definition ..................................... 5-26, 5-33,
5-34
B-DL→B ................................................ 5-43, 5-46
Black and White ...................................... 5-8, 5-12
Blank ....................................................... 5-43, 5-44
Calc ......................................................... 5-43, 5-44
Calibrate ALL ......................................... 5-7, 5-11
Calibration .............................................. 5-7, 5-11
Calibration Corrections ON/OFF ............ 5-7, 5-11
Calibration F Int Ref ............................... 5-7, 5-11
Capture Normz Data ............................... 5-55
Carrier Bandwidth ................................... 5-26, 5-31,
5-32
Center ...................................................... 5-57
Center CH ON/OFF ................................ 5-57, 5-58
CF Step Size AUTO/MNL ..................... 5-57
5-1
Page 96

U3700 Series User’s Guide
5.1 Menu Index
Ch Windows ON/OFF ............................ 5-26, 5-31,
5-32
Channel Definition .................................. 5-26, 5-31
Channel Input .......................................... 5-57, 5-58
Channel Position ..................................... 5-25, 5-27
Channel Power ........................................ 5-25, 5-27
Channel Width ........................................ 5-25, 5-27
Channels Config ..................................... 5-57, 5-58
Clear All .................................................. 5-47, 5-48
Clear Others ............................................ 5-47, 5-48
Coarse ..................................................... 5-7, 5-11
Color Mode Color/Gray .......................... 5-8, 5-15
Color Pattern ........................................... 5-8, 5-12
Color1 ..................................................... 5-8, 5-12
Color2 ..................................................... 5-8, 5-12
Command Reference Syntax .................. 6-76
Config ..................................................... 5-26, 5-31,
5-32, 5-47,
5-50
Config Driver .......................................... 5-8, 5-15
Context A/B ............................................ 5-66, 5-70,
5-71
Context RF2|RF1 .................................... 5-17, 5-18
Continuous Down ON/OFF .................... 5-36, 5-38
Continuous Peak ON/OFF ...................... 5-47, 5-50
Copy ........................................................ 5-8, 5-13
Copy All to Flash .................................... 5-18, 5-20
Copy All to USB ..................................... 5-18, 5-20
Copy Config ............................................ 5-8, 5-13
Copy Device FILE/PRT .......................... 5-8, 5-13
Correction Factor ON/OFF ..................... 5-62, 5-64
Counter Position ..................................... 5-36, 5-40
Couple to DL OFF/ABV/BLW ............... 5-47, 5-50,
5-51
Couple to Line 1 OFF/ABV/BLW .......... 5-47, 5-50,
5-51
Couple to Line 2 OFF/ABV/BLW .......... 5-47, 5-50,
5-51
Couple to Win OFF/IN/OUT .................. 5-47, 5-50,
5-51
CPL ......................................................... 5-72
Date Time ............................................... 5-8, 5-12
dB/div ...................................................... 5-62, 5-63
dBc/Hz ON/OFF ..................................... 5-36, 5-37
dBm ......................................................... 5-62, 5-63
dBm/Hz ON/OFF .................................... 5-36, 5-37
dBmV ...................................................... 5-62, 5-63
dBμV ....................................................... 5-62, 5-63
dBμV/sqrt(Hz) ON/OFF ......................... 5-36, 5-37
dBμVemf ................................................ 5-62, 5-63
dBpW ...................................................... 5-62, 5-63
Default .................................................... 5-7, 5-11
Default Conditions .................................. 5-25, 5-26,
5-27, 5-28,
5-29, 5-30,
5-32, 5-34,
5-35, 5-36,
5-39
Delay ....................................................... 5-65, 5-66
Delete ...................................................... 5-62, 5-64
Delete Band ............................................. 5-26, 5-33,
5-35
Delete Channel ........................................ 5-26, 5-31
Delete Entry ............................................ 5-47, 5-50,
5-52, 5-65,
5-69
Delete Line .............................................. 5-57, 5-59
Delta Mode ............................................. 5-47, 5-48
Delta ON/OFF ......................................... 5-47, 5-48
Delta Ref Line ON/OFF ......................... 5-55, 5-56
Delta to CF .............................................. 5-54
Delta to CF Step ...................................... 5-54
Delta to Mkr Step .................................... 5-54
Delta to Span ........................................... 5-54
Det Avg Mode RMS/Video .................... 5-43, 5-45
Detector ................................................... 5-43, 5-45
Detector AUTO/MNL ............................. 5-43, 5-45
Display Line ON/OFF ............................ 5-43, 5-46,
5-47, 5-50,
5-51, 5-65,
5-69
Display List ON/OFF .............................. 5-47, 5-48,
5-50, 5-53
Display REL/ABL/ABR ......................... 5-36, 5-38
Each Item ................................................ 5-7, 5-11
Edit Channel Formula ............................. 5-57, 5-59
Edit Channel Table ................................. 5-57, 5-59
Edit Corr Factor ...................................... 5-62, 5-64
Edit Date Time ........................................ 5-8, 5-12
Edit Limit Lines ...................................... 5-47, 5-50,
5-52
EMC ........................................................ 5-72
EMC Filter ON/OFF ............................... 5-72
Execute ON/OFF .................................... 5-25, 5-26,
5-27, 5-28,
5-29, 5-30,
5-32, 5-34,
5-36, 5-37,
5-38, 5-39,
5-40, 5-41
Execute Self Test .................................... 5-8, 5-16
Execute X dB Down ............................... 5-36, 5-37
5-2
Page 97

U3700 Series User’s Guide
5.1 Menu Index
Execute X dB Left .................................. 5-36, 5-37
Execute X dB Right ................................ 5-36, 5-37
EXT CFG ................................................ 5-65
Ext Trigger Level .................................... 5-65, 5-66
External ................................................... 5-65, 5-66
Factory Init .............................................. 5-8, 5-16
FILE ........................................................ 5-18
File Control ............................................. 5-8, 5-14,
5-18, 5-19
File Format BIN/XML ............................ 5-18, 5-20
File Format PNG/BMP ........................... 5-8, 5-13
Fine ......................................................... 5-7, 5-11
Fixed Mkr ON/OFF ................................ 5-47, 5-48
FM Meas ................................................. 5-37, 5-41
Format ..................................................... 5-8, 5-13
Format Media .......................................... 5-18, 5-20
Formula 1 ON/OFF ................................. 5-57, 5-60
Formula 2 ON/OFF ................................. 5-57, 5-60
Formula 3 ON/OFF ................................. 5-57, 5-60
Free Run .................................................. 5-65, 5-66
Freq Input Mode CALC/TABLE ............ 5-57, 5-58
Freq vs Time ........................................... 5-66, 5-70
Freq vs Time ON/OFF ............................ 5-66, 5-70
Freq Zoom ............................................... 5-66, 5-70
FREQUENCY ........................................ 5-57
Frequency Correction ON/OFF .............. 5-7, 5-11
Frequency Counter .................................. 5-36, 5-40
Frequency Offset ON/OFF ..................... 5-57
Frequency Pos ......................................... 5-66, 5-70
Frequency Reference .............................. 5-7, 5-9
Frequency Reference INT/EXT/XTL ..... 5-7, 5-9
Frequency Zoom ON/OFF ...................... 5-66, 5-70
Full Span ................................................. 5-61
Fundamental ON/OFF ............................ 5-36, 5-40
Gate Delay .............................................. 5-65, 5-67
Gate Width .............................................. 5-65, 5-67
Gated Sweep ........................................... 5-65, 5-67
Gated Sweep ON/OFF ............................ 5-65, 5-67
GPIB Address ......................................... 5-7, 5-10
Graph ON/OFF ....................................... 5-26, 5-32
Graphic .................................................... 5-66
Graphic Z 1 Screen ................................. 5-66, 5-69
Graphic Z 2 Screens ................................ 5-66, 5-70
Graphic Zoom 1 ON/OFF ....................... 5-66, 5-69
Graphic Zoom 2 ON/OFF ....................... 5-66, 5-70
Harmonic ................................................ 5-36, 5-39
Harmonic Max Order .............................. 5-36, 5-40
High Sensitivity ON/OFF ....................... 5-62, 5-64
IF ............................................................. 5-65, 5-66
Image Suppression ON/OFF ................... 5-57, 5-60
Init Table ................................................. 5-26, 5-31,
5-33, 5-35,
5-62, 5-64
Input and Output ..................................... 7-5, 7-9,
7-14
Input Impedance 50/75 ........................... 5-62, 5-63
Insert ....................................................... 5-62, 5-64
Insert Band .............................................. 5-26, 5-35
Insert Channel ......................................... 5-26, 5-31
Insert Entry ............................................. 5-47, 5-50,
5-52, 5-65,
5-69
Insert Line ............................................... 5-57, 5-59
Intermod .................................................. 5-36, 5-38
Items ........................................................ 5-18, 5-21
LAN IP Address ...................................... 5-7, 5-10
Last Span ................................................. 5-61
Level ....................................................... 5-65, 5-66
Limit Line 1/2 ......................................... 5-47, 5-50,
5-52, 5-65,
5-69
Limit Line Edit ........................................ 5-65, 5-69
Limit Lines .............................................. 5-65, 5-68
Limit Setup ............................................. 5-36, 5-39
Line 1 ABV/BLW ................................... 5-65, 5-68
Line 1 ON/OFF ....................................... 5-65, 5-68
Line 2 ABV/BLW ................................... 5-65, 5-68
Line 2 ON/OFF ....................................... 5-65, 5-68
Link to Marker ON/OFF ......................... 5-36, 5-40
Marker ON/OFF ..................................... 5-47, 5-48
Marker Trace A/B/C ............................... 5-47, 5-48
Math ........................................................ 5-43, 5-45
Max Hold ................................................ 5-43, 5-44
Max Hold Continuous ............................. 5-43, 5-45
Max Order ............................................... 5-36, 5-38
Max Sweep Count ................................... 5-25, 5-26,
5-27, 5-28,
5-29, 5-30,
5-32, 5-36,
5-38, 5-39,
5-43, 5-44
MEAS 1 .................................................. 5-25
MEAS 2 .................................................. 5-36
Measuring Window ................................. 5-65, 5-67
Media ...................................................... 5-8, 5-15,
5-18, 5-23
Medium ................................................... 5-72, 5-73
Menu ON/OFF ........................................ 5-8, 5-14,
5-15
Min ATT ................................................. 5-62
Min Hold ................................................. 5-43, 5-44
Min Max Peak ......................................... 5-47, 5-50,
5-3
Page 98

U3700 Series User’s Guide
5.1 Menu Index
5-52
Min Peak ................................................. 5-47, 5-50,
5-52
MKR ....................................................... 5-47
Mkr Step AUTO/MNL ........................... 5-47, 5-48
Mkr to CF ................................................ 5-54
Mkr to CF Step ....................................... 5-54
Mkr to Mkr Step ..................................... 5-54
Mkr to Ref ............................................... 5-54
MKR→ ................................................... 5-54
Mod. Freq to Sweep Time ON/OFF ....... 5-37, 5-41
Mode FULL/CARR ................................ 5-26, 5-31
Mode Index/Value .................................. 5-47, 5-49
More 1/2 .................................................. 5-7, 5-12,
5-18, 5-20,
5-36, 5-38,
5-40, 5-43,
5-46, 5-47,
5-48, 5-50,
5-52, 5-54,
5-57, 5-60,
5-62, 5-63,
5-72, 5-73
Narrow .................................................... 5-72, 5-73
Nega ........................................................ 5-43, 5-45
Next Band ............................................... 5-26, 5-35
Next Min Peak ........................................ 5-47, 5-50,
5-52
Next Peak ................................................ 5-47, 5-50
Next Peak Left ........................................ 5-47, 5-50
Next Peak Right ...................................... 5-47, 5-50
Noise/Hz ................................................. 5-36, 5-37
Noise/x Hz .............................................. 5-36, 5-37
Normal .................................................... 5-43, 5-45
Normalize ................................................ 5-55
Normalize Correction ON/OFF .............. 5-55
Nyq Roll Off Factor ................................ 5-26, 5-31,
5-33
Nyq Symbol Rate .................................... 5-26, 5-31,
5-33
Nyquist Filter ON/OFF ........................... 5-26, 5-31,
5-32
OBW ....................................................... 5-25, 5-30
OFF ......................................................... 5-43, 5-45,
5-46
On Trace A/B/C ...................................... 5-25, 5-26,
5-27, 5-28,
5-29, 5-30,
5-32, 5-34,
5-36, 5-38,
5-40
Others HIDE/SHOW .............................. 5-47, 5-48
Paper Format ........................................... 5-8, 5-15
Parser AT/SCPI ....................................... 5-7, 5-11
Pass/Fail Config ...................................... 5-65, 5-68
Pass/Fail ON/OFF ................................... 5-36, 5-39,
5-65, 5-68
Pause Time .............................................. 5-37, 5-42
PBW ........................................................ 5-7, 5-11
PEAK ...................................................... 5-50
Peak + X dB Down ................................. 5-36, 5-38
Peak Delta Y ........................................... 5-37, 5-41,
5-47, 5-50
Peak List Frequency ................................ 5-47, 5-50,
5-52
Peak List Level ....................................... 5-47, 5-50,
5-53
Peak Menu .............................................. 5-47, 5-48
Peak to CF ............................................... 5-54
Peak to Ref .............................................. 5-54
Peak Zoom .............................................. 5-61
PLL BW .................................................. 5-72, 5-73
Posi .......................................................... 5-43, 5-45
Power Average ........................................ 5-43, 5-44
Previous Band ......................................... 5-26, 5-35
Print Config ............................................. 5-8, 5-15
R3131 Mode ON/OFF ............................ 5-7, 5-11
R3162 Mode ON/OFF ............................ 5-7, 5-10
Range FULL/WIN .................................. 5-25, 5-29
RBW 1 MHz ........................................... 5-72
RBW 120 kHz ......................................... 5-72
RBW 200 Hz ........................................... 5-72
RBW 9 kHz ............................................. 5-72
RBW Auto .............................................. 5-72
RBW AUTO/MNL ................................. 5-72
RBW CAL .............................................. 5-7, 5-11
Recall ...................................................... 5-18, 5-21
Ref Freq .................................................. 5-7, 5-9
Ref Freq 10 MHz .................................... 5-7, 5-9
Ref Level ................................................. 5-62
Ref Object ............................................... 5-47, 5-48
Ref Offset ON/OFF ................................ 5-62, 5-63
Ref Power CHN/PEAK .......................... 5-26, 5-32
Ref/Disp Lines ........................................ 5-65, 5-69
Reference Line ........................................ 5-47, 5-48
Reference Line ON/OFF ......................... 5-55, 5-56,
5-65, 5-69
Reference Marker ................................... 5-47, 5-48
Refresh .................................................... 5-43, 5-44
Refresh(Write) ........................................ 5-43, 5-44
Remote Control ....................................... 5-7, 5-10
Remove File ............................................ 5-8, 5-14,
5-4
Page 99

U3700 Series User’s Guide
5.1 Menu Index
5-18, 5-19
Rename File ............................................ 5-8, 5-14,
5-18, 5-19
Report HIDE/SHOW .............................. 5-7, 5-11
Reset Context .......................................... 5-66, 5-71
Resolution ............................................... 5-36, 5-40
Resolution 1 Hz ...................................... 5-36, 5-40
Resolution 1 kHz .................................... 5-36, 5-40
Resolution 10 Hz .................................... 5-36, 5-40
Resolution 100 Hz .................................. 5-36, 5-40
Restore Defaults ...................................... 5-25, 5-26,
5-27, 5-28,
5-29, 5-30,
5-32, 5-34,
5-35, 5-36,
5-39
Results ..................................................... 5-26, 5-35
Round Grid Values ON/OFF .................. 5-62, 5-64
Sample .................................................... 5-43, 5-45
Save ......................................................... 5-18
Save as .................................................... 5-18, 5-19
Save Defaults .......................................... 5-25, 5-26,
5-27, 5-28,
5-29, 5-30,
5-32, 5-34,
5-35, 5-36,
5-39
Screen Shot Config ................................. 5-8, 5-13
Select ....................................................... 5-50
Select Marker .......................................... 5-47, 5-48,
5-50
Selecting the Command Set .................... 6-1
Self Test .................................................. 5-8, 5-16
Shift X ON/OFF ...................................... 5-65, 5-68
Shift Y ON/OFF ...................................... 5-65, 5-69
Show Mask ON/OFF .............................. 5-26, 5-32
Show ON/OFF ........................................ 5-8, 5-13
Signal Identification ON/OFF ................ 5-57, 5-60
Signal Track ............................................ 5-47, 5-49
Signal Track ON/OFF ............................. 5-47, 5-49
Slide Screen ON/OFF ............................. 5-62, 5-63
Slope NEG/POS ...................................... 5-65, 5-66,
5-67
Sound ...................................................... 5-37, 5-41
Sound AM/FM ........................................ 5-37, 5-41
Source ..................................................... 5-65, 5-66,
5-67
SPAN ...................................................... 5-61
Span ........................................................ 5-61
SPAN/RBW ON/OFF ............................. 5-72, 5-73
Spectrum Analyzer ................................. 5-17
Spectrum Emission ................................. 5-25, 5-32
Spectrum RF1 ......................................... 5-17
Spectrum RF2 ......................................... 5-17
Spurious .................................................. 5-25, 5-34
Start ......................................................... 5-57
Start CH Offset ON/OFF ........................ 5-57, 5-58
Start CH ON/OFF ................................... 5-57, 5-58
Step ATT CAL ........................................ 5-7
Stop ......................................................... 5-57
Stop CH Offset ON/OFF ........................ 5-57, 5-58
Stop CH ON/OFF ................................... 5-57, 5-58
Store ........................................................ 5-7, 5-11,
5-43, 5-46
Subtract ................................................... 5-43, 5-45
Sweep Mode SGL/CNT .......................... 5-65, 5-66
Sweep Time AUTO/MNL ...................... 5-72
SYSTEM ................................................. 5-7
Table Init ................................................. 5-47, 5-50,
5-52, 5-57,
5-59, 5-65,
5-69
Table No. 1/2/3 ....................................... 5-26, 5-35
TG ........................................................... 5-55
TG Freq. Offset ON/OFF ........................ 5-55
TG Level ................................................. 5-55
TG Level Offset ON/OFF ....................... 5-55
TG ON/OFF ............................................ 5-55
Time vs Time .......................................... 5-66, 5-70
Title ......................................................... 5-18, 5-22
Total Gain RF Path 1 .............................. 5-7, 5-11
Total Gain RF Path 2 .............................. 5-7, 5-11
Total Power ............................................. 5-25, 5-28
TRACE ................................................... 5-43
Trace A/B/C ............................................ 5-43, 5-44,
5-45, 5-46,
5-55, 5-56
Trace Points 501/1001 ............................ 5-7, 5-11
TRC→A .................................................. 5-43, 5-46
TRC→B .................................................. 5-43, 5-46
TRC→C .................................................. 5-43, 5-46
Trigger .................................................... 5-65, 5-66
Units ........................................................ 5-62, 5-63
User Password ......................................... 5-8, 5-12
VBW AUTO/MNL ................................. 5-72
VBW/RBW ON/OFF .............................. 5-72, 5-73
Version .................................................... 5-7, 5-9
Vertical Scale LIN/LOG ......................... 5-62, 5-63
Video ....................................................... 5-65, 5-66
View ........................................................ 5-43, 5-44
Volts ........................................................ 5-62, 5-63
Volume .................................................... 5-37, 5-42
5-5
Page 100

U3700 Series User’s Guide
5.1 Menu Index
VSWR ON/OFF ...................................... 5-55, 5-56
Watts ....................................................... 5-62, 5-63
White and Black ...................................... 5-8, 5-12
Window ................................................... 5-25, 5-29
Window HIDE/SHOW ........................... 5-65, 5-67
Window Position ..................................... 5-25, 5-29,
5-47, 5-50,
5-51, 5-65,
5-66, 5-67,
5-69, 5-70
Window Sweep ON/OFF ........................ 5-65, 5-67
Window Width ........................................ 5-25, 5-29,
5-47, 5-50,
5-51, 5-65,
5-66, 5-67,
5-69, 5-70
Write ....................................................... 5-43, 5-44
Write Protect ON/OFF ............................ 5-8, 5-14,
5-18, 5-19
X ABS/CF/FA ......................................... 5-65, 5-68
X dB Down ............................................. 5-36, 5-37
X dB Level .............................................. 5-36, 5-37
X-Search Domain ................................... 5-47, 5-50
Y ABS/REF/DL ...................................... 5-65, 5-68
Y Range ON/OFF ................................... 5-47, 5-49
Y- Search Domain .................................. 5-47, 5-50,
5-51
Zero Span ................................................ 5-61
Zoom and Contexts ................................. 5-65, 5-69
Zoom Position ......................................... 5-66, 5-70
Zoom Width ............................................ 5-66, 5-70
5-6
 Loading...