

Page 1

Cover
R3267 Series
Spectrum Analyzer
Operation Manual (Vol.2)
MANUAL NUMBER
Applicable models
R3264
R3267
R3273
FOE-8335034D00
1998
C
ADVANTEST CORPORATION
All rights reserved.
First printing October 1, 1998
Printed in Japan
Page 2

Safety Summary
No. ESF00
Safety Summary
To ensure thorough understanding of all functions and to ensure efficient use of this instrument, please read the
manual carefully before using. Note that Advantest b ear s absolutely no responsibility for the result of oper ations
caused due to incorrect or inappropriate use of this instrument.
If the equipment is used in a manner not specified by Advantest, the protection provided by the equipment may
be impaired.
• Warning Labels
Warning labels are applied to Advantest products in locations where specific dangers exist. Pay
careful attention to these label s during handling . Do not remove or tear these l abels. If yo u have
any questions regarding warning labels, please ask your nearest Advantest dealer. Our address
and phone number are listed at the end of this manual.
Symbols of those warning labels are shown below together with th eir meaning.
DANGER: Indicates an imminently hazardous situation which will result in death or serious
WARNING: Indicates a potentially hazardous situation which w ill result in death or serious
CAUTION: Indicates a potentially hazardous situation which will result in personal injury or
• Basic Precautions
Please observe the following precautions to prevent fire, burn, electric shock, and personal injury.
• Use a power cable rated for the voltage in question. Be sure however to use a power cable
conforming to safety standards of your nation when using a product overseas.
• When in serting the plug into the electrical outlet, fir st turn the power switch OFF and then
insert the plug as far as it will go.
• When removing the plug from the electrical outlet, first turn the power switch OFF and then
pull it out by gripping the plug. Do not pull on the power cabl e its el f. Make sure your hand s
are dry at this time.
• Before turning on the power, be sure to check that the supply voltage matches the voltage
requirements of the instrument.
personal injury.
personal injury.
a damage to property including the product.
• Be sure to plug the power cable into an electrical outlet which has a safety ground terminal.
Grounding will be defeated if you use an extension cord which does not include a safety
ground ter minal.
• Be sure to use fuses rated for the voltage in question.
• Do not use this instrument with the case open.
• Do not place objects on top of this product. Also, do not place flower p ots or other containers
containing liquid such as chemicals near this product.
Safety-1
Page 3
Safety Summary
• When the prod uct has ventilation outlets, do not stick or drop metal or easily flammable objects into the ventilation outlets.
• When using the product on a cart, fix it with belts to avoid its drop.
• When connecting the product to peripheral equipment, turn the power off.
• Caution Symbols Used Within this Manual
Symbols indicating items requiring caution w hich are used in this m anual are s hown below to gether with their meaning.
DANGER: Indicates an item where there is a danger of serious personal injur y (d eath or seri-
ous injury).
WARNING: Indicates an item relating to personal safety or health.
CAUTION: Indicates an item relating to possible damage to the product or instrument or relat-
ing to a restriction on operation.
• Safety Marks on the Product
The following safety marks can be found on Advantest products.
: ATTENTION - Refer to manual.
: Protective ground (earth) terminal.
: DANGER - High voltage.
: CAUTION - Risk of electric shock.
• Replacing Parts with Limited Life
The following parts used in the instrument are main parts with limited life.
Replace the parts listed below after their expected lifespan has expired.
Note that the estimated lifespan for the parts listed below may be shortened by factors such as
the environment where the instrument is stored or used, and how often the instrument is used.
The parts inside are not user-replaceable. For a part replacement, please contact the Advantest
sales office for servicing.
There is a possibility that each product uses different parts with limited life. For more information, refer to Chapter 1.
Safety-2
Page 4
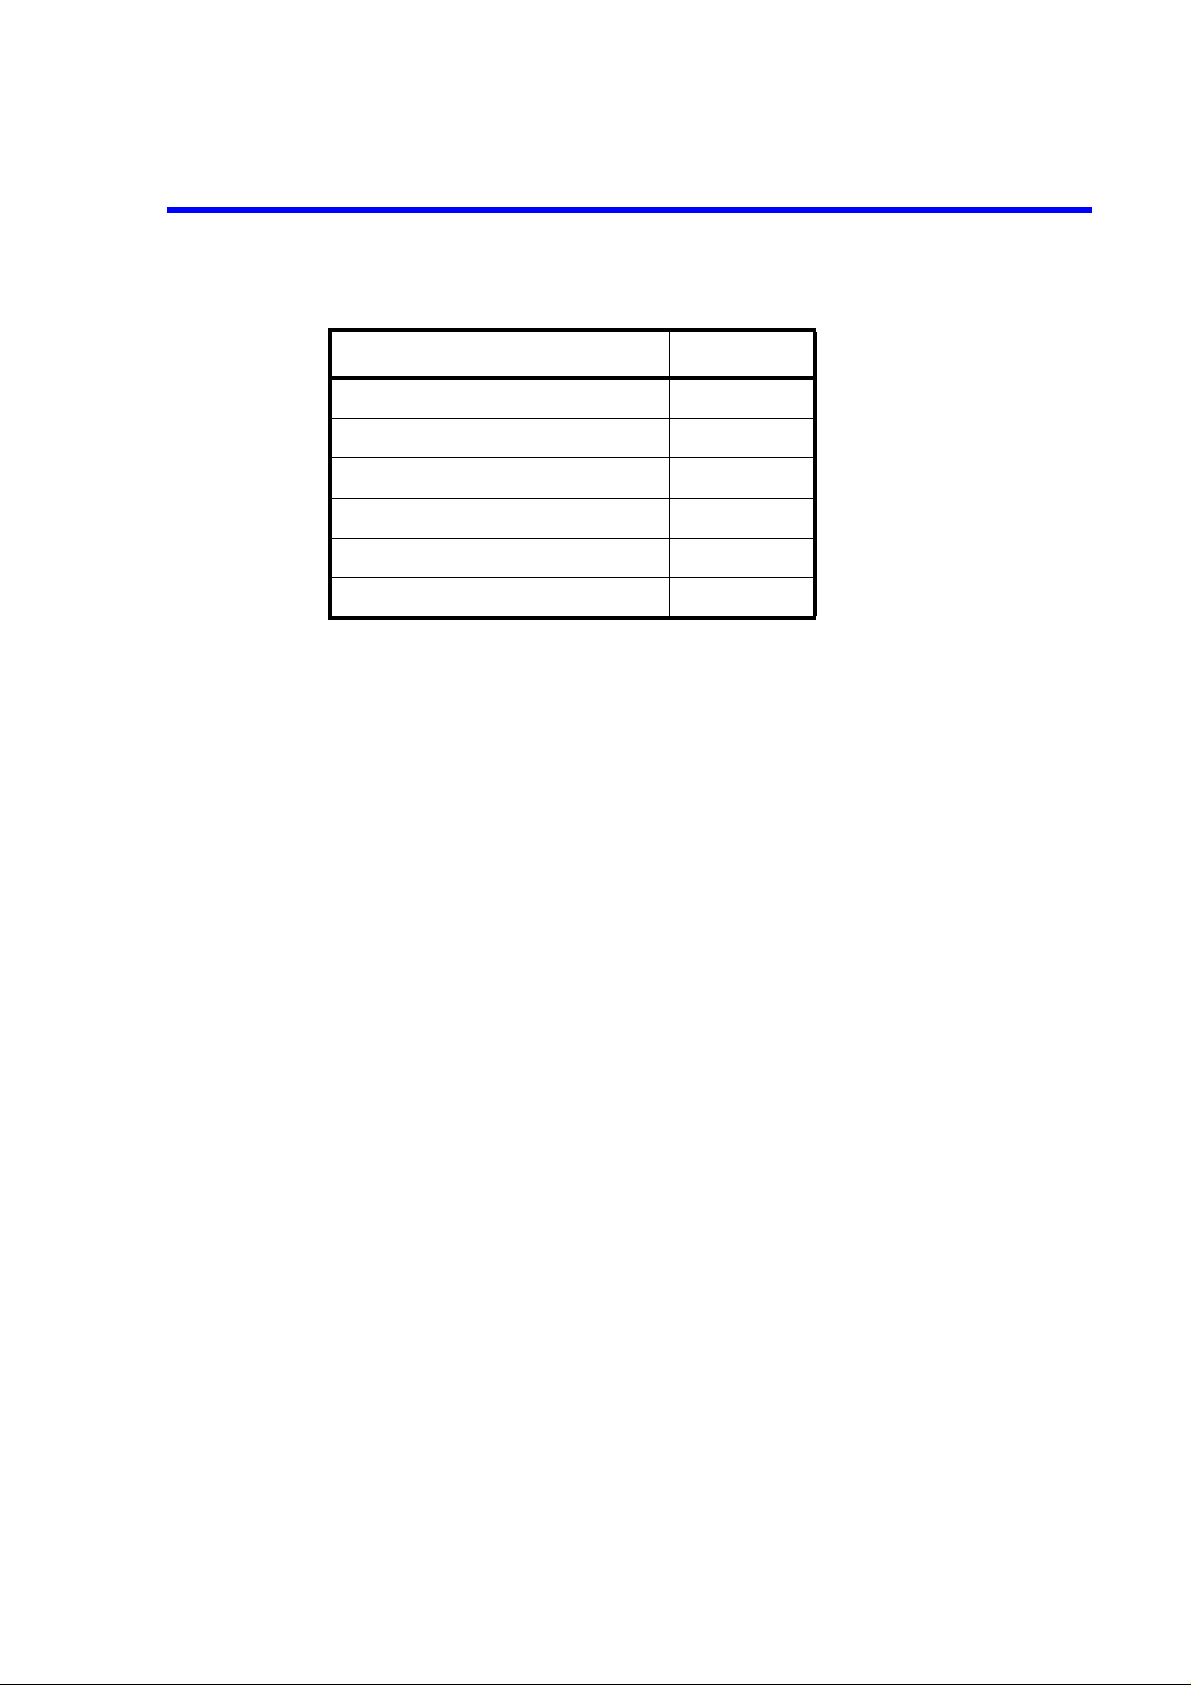
Main Parts with Limited Life
Part name Life
Unit power supply 5 years
Fan motor 5 years
Electrolytic capacitor 5 years
LCD display 6 years
LCD backlight 2.5 years
Floppy disk drive 5 years
• Hard Disk Mounted Products
The operational warnings are listed below.
• Do not move, shock and vibrate the product while the power is turned on.
Reading or writing data in the hard disk unit is performed with the memory disk turning at a
high speed. It is a very delicate process.
Safety Summary
• Store and operate the products under the following environmental conditions.
An area with no sudden temperature changes.
An area away from shock or vibrations.
An area free from moisture, dirt, or dust.
An area away from magnets or an instrument which generates a magnetic field.
• Make back-ups of important data.
The data stored in the dis k may b ecome damag ed if the prod uct is mishand led. The h ard di sc
has a limited life span which depends on the operational conditions. Note that there is no
guarantee for any loss of data.
• Precautions when Disposing of this Instrument
When disposing of harmful substances, be sure dispose of them properly with abiding by the
state-provided law.
Harmful substances: (1) PCB (polycarbon biphenyl)
(2) Mercury
(3) Ni-Cd (nickel cadmium)
(4) Other
Items possessing cyan, organic phosphorous and hexadic chromium
and items which may leak cadmium or arsenic (excluding lead in sol
der).
Example: fluorescent tubes, batteries
Safety-3
Page 5
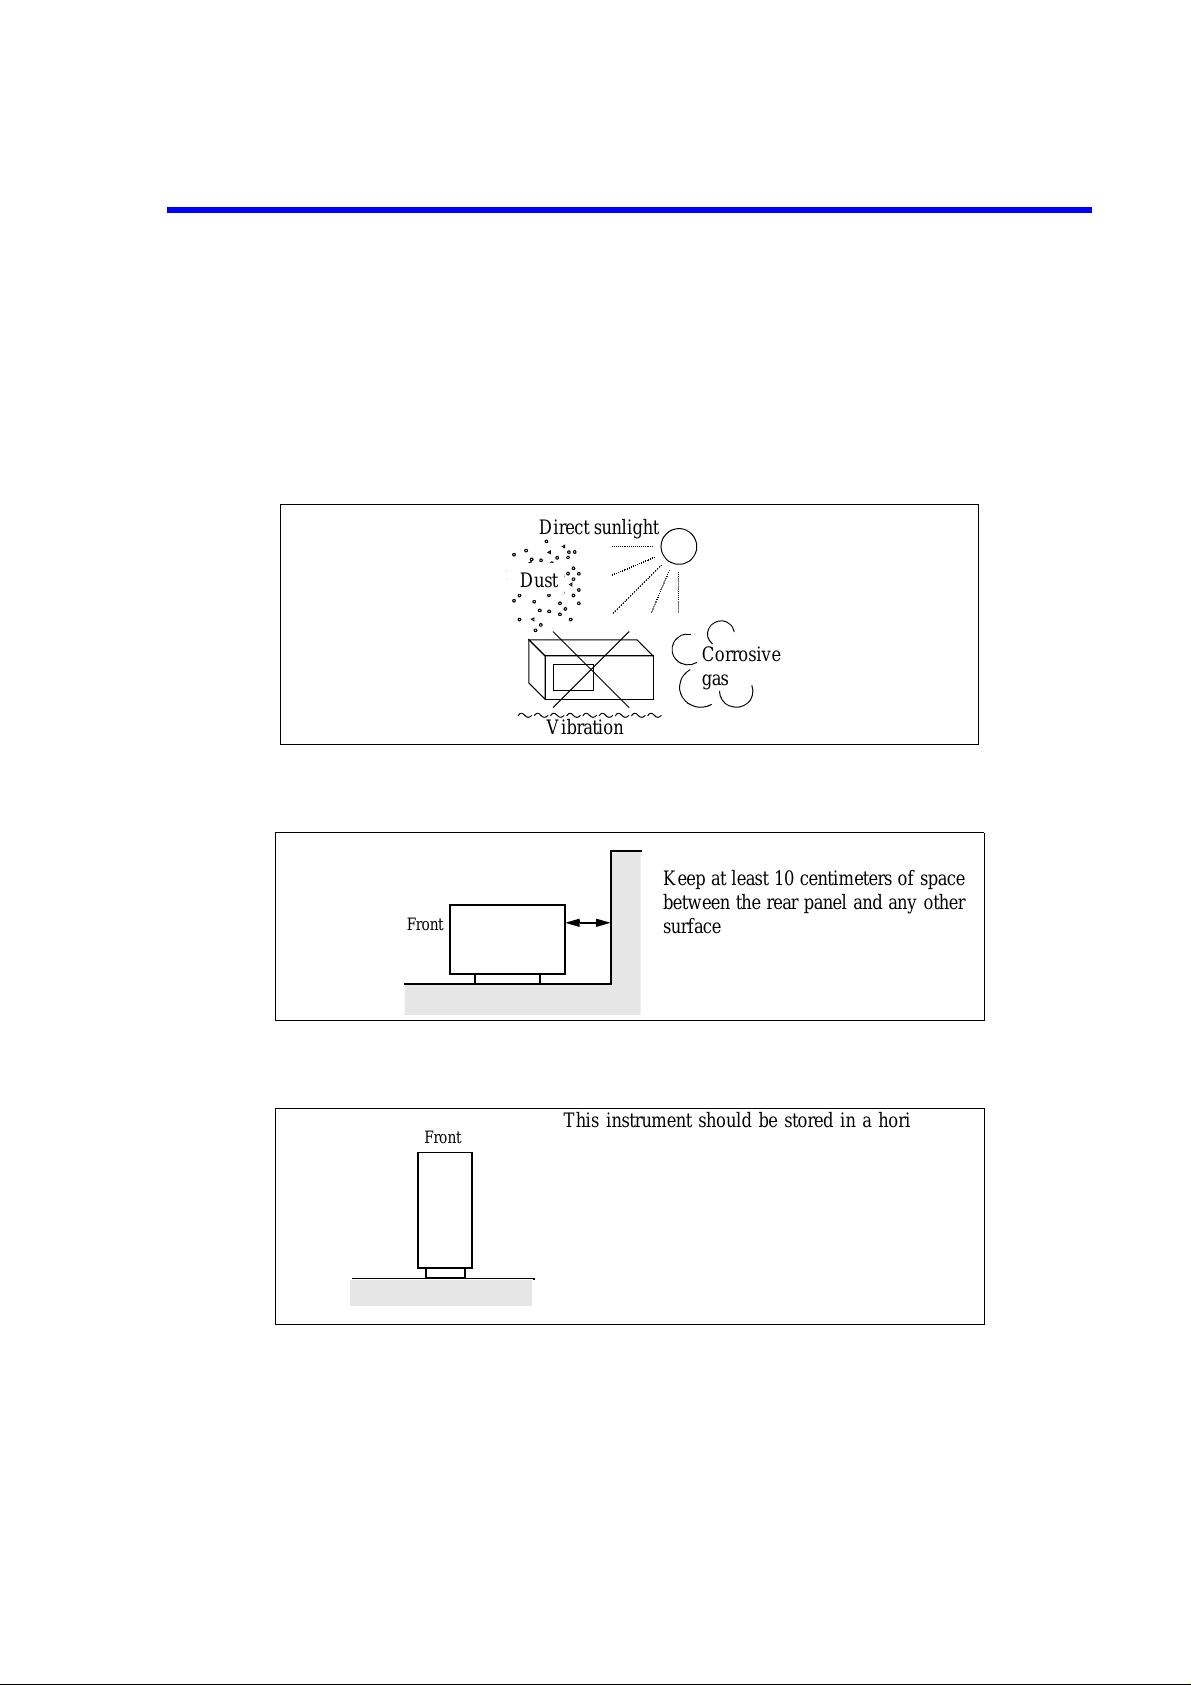
Environmental Conditions
This instrument should be only be used in an area which satisfies the following conditions:
• An area free from corrosive gas
• An area away from direct sunlight
• A dust-free area
• An area free from vibrations
Direct sunlight
Dust
Corrosive
gas
Vibration
Figure-1 Environmental Conditions
• Operating position
Keep at least 10 centimeters of space
between the rear panel and any other
Front
Figure-2 Operating Position
• Storage position
Front
This instrument can be used safely under the following conditions:
• Altitude of up to 2000 m
This instrument should be stored in a horizontal
position.
When placed in a vertical (upright) position for
storage or transportation, ensure the instrument is
stable and secure.
-Ensure the instrument is stable.
-Pay special attention not to fall.
Figure-3 Storage Position
surface
Safety-4
• Installation Categories II
• Polluti on Degree 2
Page 6

PREFACE
R3267 Series Spectrum Analyzer Operation Manual (Vol.2)
PREFACE
This manual (VOL.2) describes how to test the performance of the R3267 Series.
A separate volume (VOL.1) describes the oper ations, perfo rmance and remote prog ramming of the R326 7 Series.
(1) Configuration of this manual
1. Performance Verification Describes how to test performance.
(2) Typeface conventions used in this manual
• Panel keys and soft keys are printed in a contrasting typestyle to make them stand out from the text as
follows:
Panel keys: Boldface type Example: FREQ, FORMAT
Soft keys: Boldface and italic type Example: Center, Trace Detector
• When a series of key operations are described using a comma between two keys.
• There are various soft menus used to switch between two states such as ON/OFF and AUTO/MNL.
For example, when turning off the Display ON/OFF function, the annotation "Display ON/
OFF(OFF)" is used.
When switching the RBW AUTO/MNL function to MNL, the annotation "RBW AUTO/MNL(MNL)"
is used.
Preface-1
Page 7

TABLE OF CONTENTS
TABLE OF CONTENTS
R3267 Series Spectrum Analyzer Operation Manual (Vol.2)
1 PERFORMANCE VERIFICATION
1.1 Preparation ........................................................................................................... 1-1
1.2 Procedure ............................................................................................................. 1-4
1.2.1 Frequency Reference Output Accuracy ........................................................ 1-4
1.2.2 Frequency Reference Output Accuracy
(when the OPT21, OPT22 and OPT23 are installed) ................................... 1-6
1.2.3 Accuracy of Frequency Readout and Frequency Counter ............................ 1-8
1.2.4 Frequency Span Accuracy ............................................................................ 1-11
1.2.5 Calibration Amplitude Accuracy .................................................................. 1-14
1.2.6 IF Gain Uncertainty ...................................................................................... 1-15
1.2.7 Input Attenuator Switching Accuracy .......................................................... 1-18
1.2.8 Frequency Response ..................................................................................... 1-21
1.2.9 Scale Fidelity ................................................................................................ 1-26
1.2.10 RBW Switching Uncertainty ........................................................................ 1-31
1.2.11 RBW Accuracy and Selectivity ................................................................... 1-33
1.2.12 Noise Sidebands ............................................................................................ 1-36
1.2.13 Displayed Average Noise Level ................................................................... 1-39
1.2.14 Residual FM .................................................................................................. 1-43
1.2.15 Residual Response ........................................................................................ 1-46
1.2.16 Gain Compression ......................................................................................... 1-49
1.2.17 Second Harmonic Distortion ........................................................................ 1-53
1.2.18 Third Order Intermodulation Distortion ....................................................... 1-57
1.2.19 Image, Multiple and Out of Band Responses (For the R3267/73) ............... 1-62
1.2.20 Sweep Time Accuracy .................................................................................. 1-68
1.3 Performance Check Sheet .................................................................................... 1-71
1.3.1 Frequency Reference Output Accuracy ........................................................ 1-71
1.3.2 Frequency Readout Accuracy and Frequency Counter Marker .................... 1-71
1.3.3 Frequency Span Accuracy ............................................................................ 1-72
1.3.4 Calibration Amplitude Accuracy .................................................................. 1-73
1.3.5 IF Gain Uncertainty ...................................................................................... 1-73
1.3.6 Input Attenuator Accuracy ............................................................................ 1-75
1.3.7 Frequency Response ..................................................................................... 1-76
1.3.8 Scale Fidelity ................................................................................................ 1-84
1.3.9 Resolution Bandwidth Switching ................................................................. 1-85
1.3.10 Resolution Bandwidth Accuracy and Selectivity ......................................... 1-86
1.3.11 Noise Sidebands ............................................................................................ 1-86
1.3.12 Displayed Average Noise Level ................................................................... 1-87
1.3.13 Residual FM .................................................................................................. 1-87
1.3.14 Residual Response ........................................................................................ 1-87
1.3.15 Gain Compression ......................................................................................... 1-88
1.3.16 Second Harmonics Distortion ....................................................................... 1-88
1.3.17 Third Order Intermodulation Distortion ....................................................... 1-88
.......................................................... 1-1
C-1
Page 8

R3267 Series Spectrum Analyzer Operation Manual (Vol.2)
Table of Contents
1.3.18 Image, Multiple, Out of Band ....................................................................... 1-89
1.3.19 Sweep Time Accuracy .................................................................................. 1-90
ALPHABETICAL INDEX
.................................................................................... I-1
C-2
Page 9

R3267 Series Spectrum Analyzer Operation Manual (Vol.2)
LIST OF ILLUSTRATIONS
No. Title Page
1-1 Setup for Measuring a Frequency Reference Output Accuracy ....................................... 1-5
1-2 Connections for Measuring the Frequency Reference Output Accuracy
(when the OPT21, OPT22 and OPT23 are installed) ....................................................... 1-6
1-3 Setup for Measuring a Frequency Readout Accuracy and Frequency Counter ................ 1-8
1-4 Setup for Measuring a Frequency Span Accuracy ............................................................ 1-11
1-5 Setup for Measuring a IF Gain Uncertainty ...................................................................... 1-15
1-6 Setup for Measuring an Input Attenuator Accuracy ......................................................... 1-19
1-7 Setup for Measuring a Frequency Response ..................................................................... 1-22
1-8 Setup for Measuring a Scale Fidelity ......................................................... ...... ..... ............ 1-26
1-9 Setup for Measuring a Noise Sidebands ........................................................................... 1-37
1-10 Setup for Measuring a Residual FM ........................ .................................. ...... ................. 1-43
1-11 Setup for the Gain Compression ....................................................................................... 1-50
1-12 Setup for Measuring a Second Harmonics Distortion ...................................................... 1-54
1-13 Setup for Measuring a Third Order Intermodulation Distortion ....................................... 1-58
1-14 Setup for Measuring a Image, Multiple, Out of Band ...................................................... 1-62
1-15 Setup for Measuring a Sweep Time Accuracy ................................................................. 1-68
F-1
Page 10

R3267 Series Spectrum Analyzer Operation Manual (Vol.2)
List of Tables
No. Title Page
1-1 Instrument Required ......................................................................................................... 1-1
1-2 Frequency Span Setting at a Center Frequency of 2 GHz ................................................ 1-9
1-3 Center/Span Frequencies for the R3267 ........................................................................... 1-12
1-4 Center/Span Frequencies for the R3273 ........................................................................... 1-13
1-5 IF Gain Uncertainty Setting ................................................. ..... .................................. ...... 1-17
1-6 RBW Setting ..................................................................................................................... 1-17
1-7 Input Attenuator Setting .................................................................................................... 1-20
1-8 1 dB Step Scale Fidelity Setting ....................................................................................... 1-28
1-9 HP8495H and HP3325B Settings ..................................................................................... 1-29
1-10 Settings on the HP3325B in relation to the Reference Output Level ............................... 1-30
1-11 RBW Switching Uncertainty Setting ................................................................................ 1-32
1-12 3 dB Band Width Setting .................................................................................................. 1-34
1-13 60 dB Band Width Setting ................................................................................................ 1-35
1-14 Offset Setting at a Center Frequency of 1 GHz ............................................................... 1-38
1-15 Center Frequency Setting for Displayed Average Noise Level ........................................ 1-41
1-16 Start and Stop Frequencies Setting ................................................................................... 1-42
1-17 Third Order Intermodulation Distortion ........................................................................... 1-59
1-18 Third Order Intermodulation Distortion (When the Preselector is Used) ....................... 1-61
1-19 Image, Multiple, Out of Band Setting (Center Frequency: 2 GHz) .................................. 1-64
1-20 Image, Multiple, Out of Band Setting for the R3273 ....................................................... 1-65
1-21 Image, Multiple, Out of Band Setting for the R3267 ....................................................... 1-66
1-22 Sweep Time Setting .......................................................................................................... 1-70
T-1
Page 11
R3267 Series Spectrum Analyzer Operation Manual (Vol.2)
1 PERFORMANCE VERIFICATION
This chapter explains how to check the R3267 Series. We recommend that you have a copy of the performance check sheet with you when performing these checks . If a prob lem occurs with th e R3267 Seri es, contact ADVANTEST service center with measurement data filled out on the performance check sheet
(including the model, s erial n umber and so on ). For i nformati on on how to s hip the R3267 Series for repa irs,
refer to Section 1.5.3, "Transporting" in Vol.1.
NOTE: Perform the CAL ALL before starting this performance verification tests.
1.1 Preparation
This chapter decribes the instruments using on this performance verification tests.
NOTE:
1. The R3267 Series to be tested should be warmed up for at least 30 minutes before starting tests. Any additional
instrument used for this performance verification tests should be warmed up as appropriate.
2. Make sure that the test instrument used meets its own published specifications and that all connectors are clean,
before starting test. All connectors should be firmly connected.
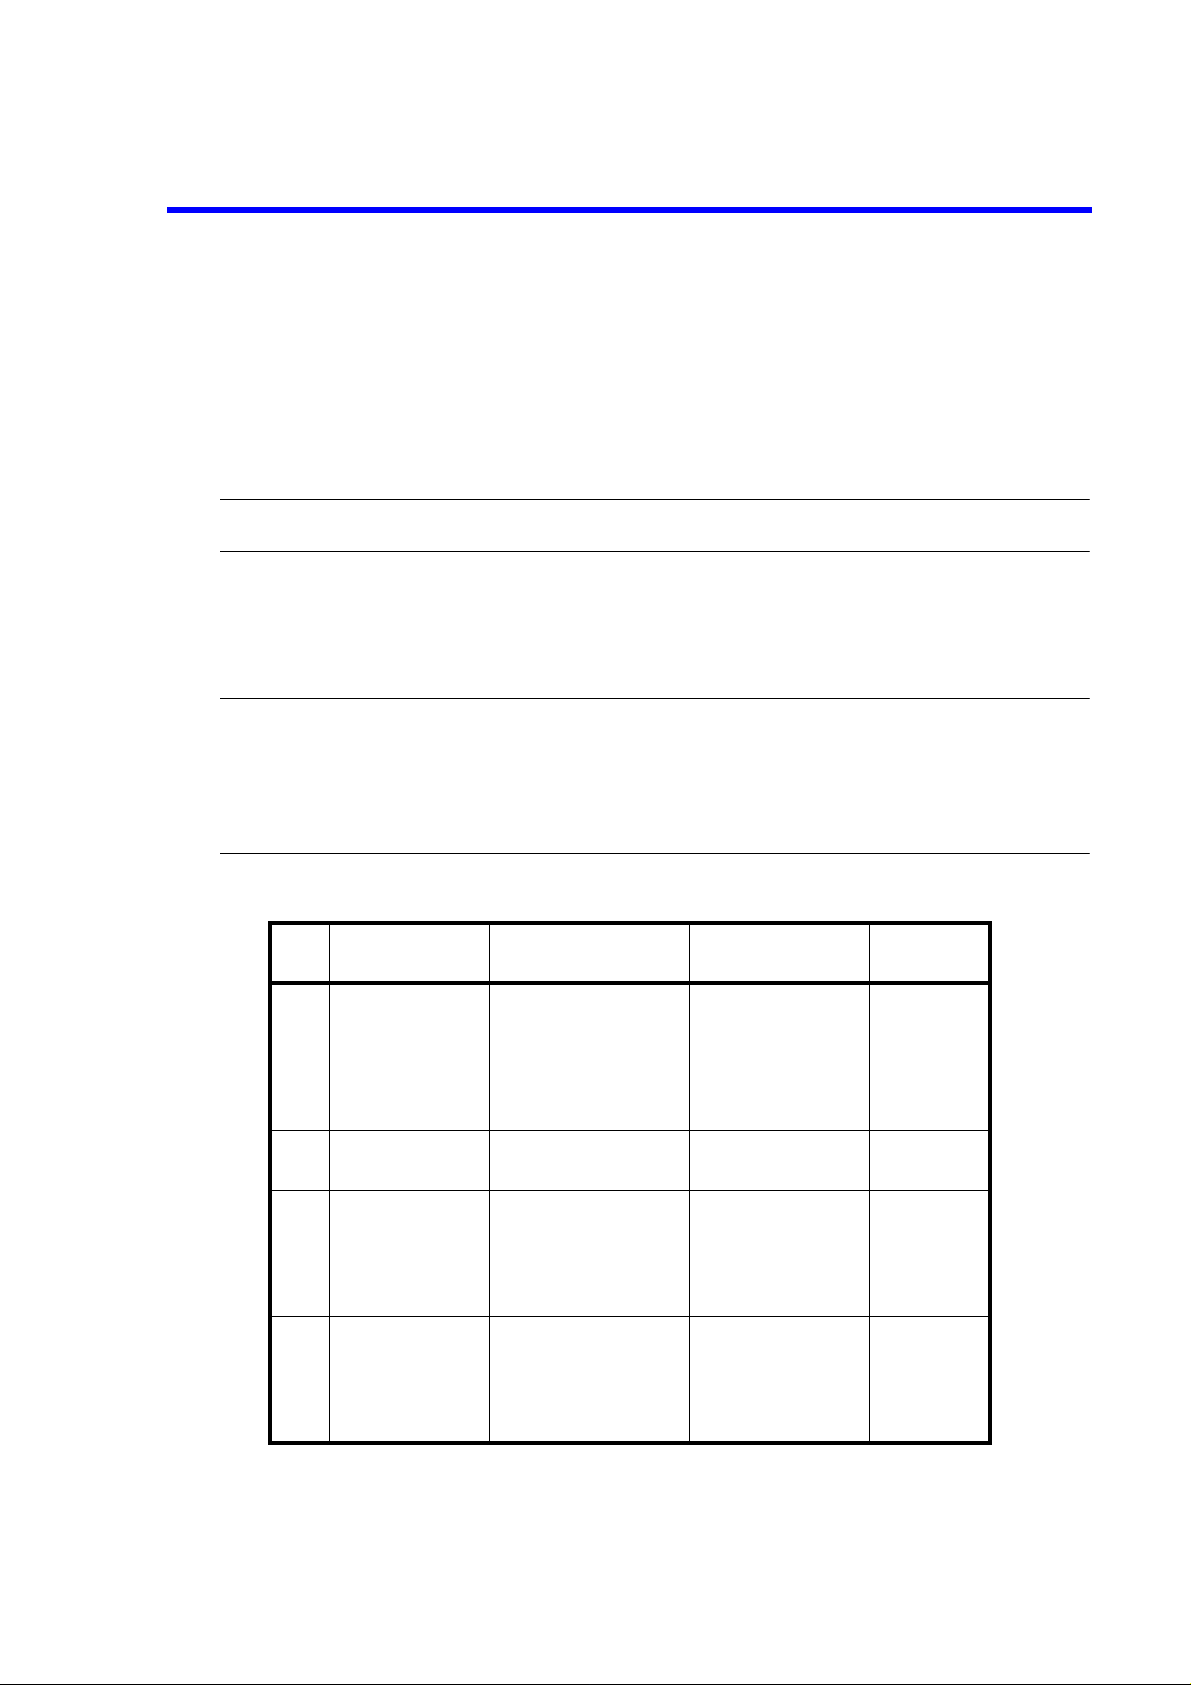
1.1 Preparation
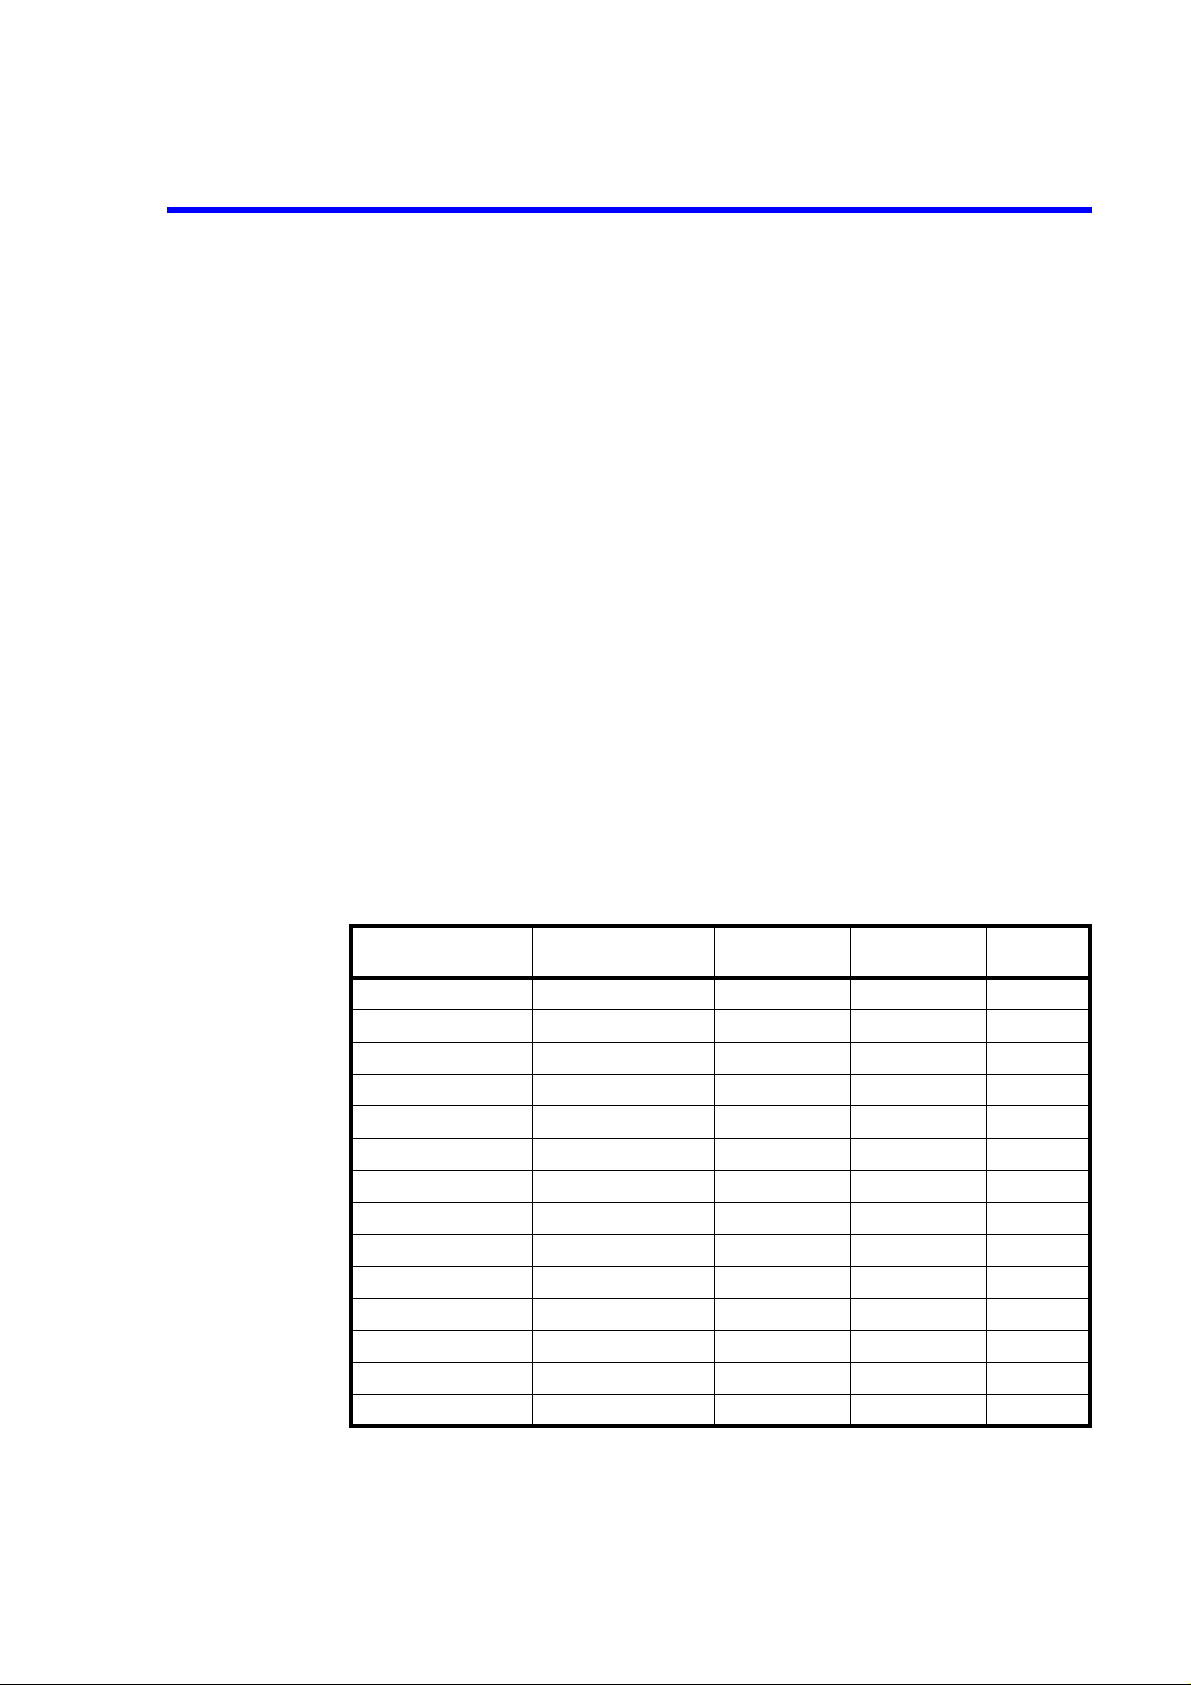
Table 1-1 Instrument Required (1 of 3)
No. Instrument Specification
1Frequency
Standard
2Frequency
Counter
3 Signal Generator Frequency Range:
4 Signal Generator Frequency Range:
Output Frequency :
10 MHz
Stability: 5×10
Output Impedance : 50
Ω Output Level:
1 Vpp or more
Resolution: 0.1 Hz R5372
10 MHz to 18 GHz
Output Level:
-15 dBm to +10 dBm
Stability: 1×10
10 MHz to 27 GHz
Output Level:
-15 dBm to +10 dBm
Stability: 1×10
-10
-6
-6
/ day
/ year
/ year
Recommended
Model
R3031
ADVANTEST
ADVANTEST
SMP02
(with B11 option)
Rohde&Schwarz
SMP03
(with B11 option)
Rohde&Schwarz
Quantity
1
1
1
1
1-1
Page 12
R3267 Series Spectrum Analyzer Operation Manual (Vol.2)
1.1 Preparation
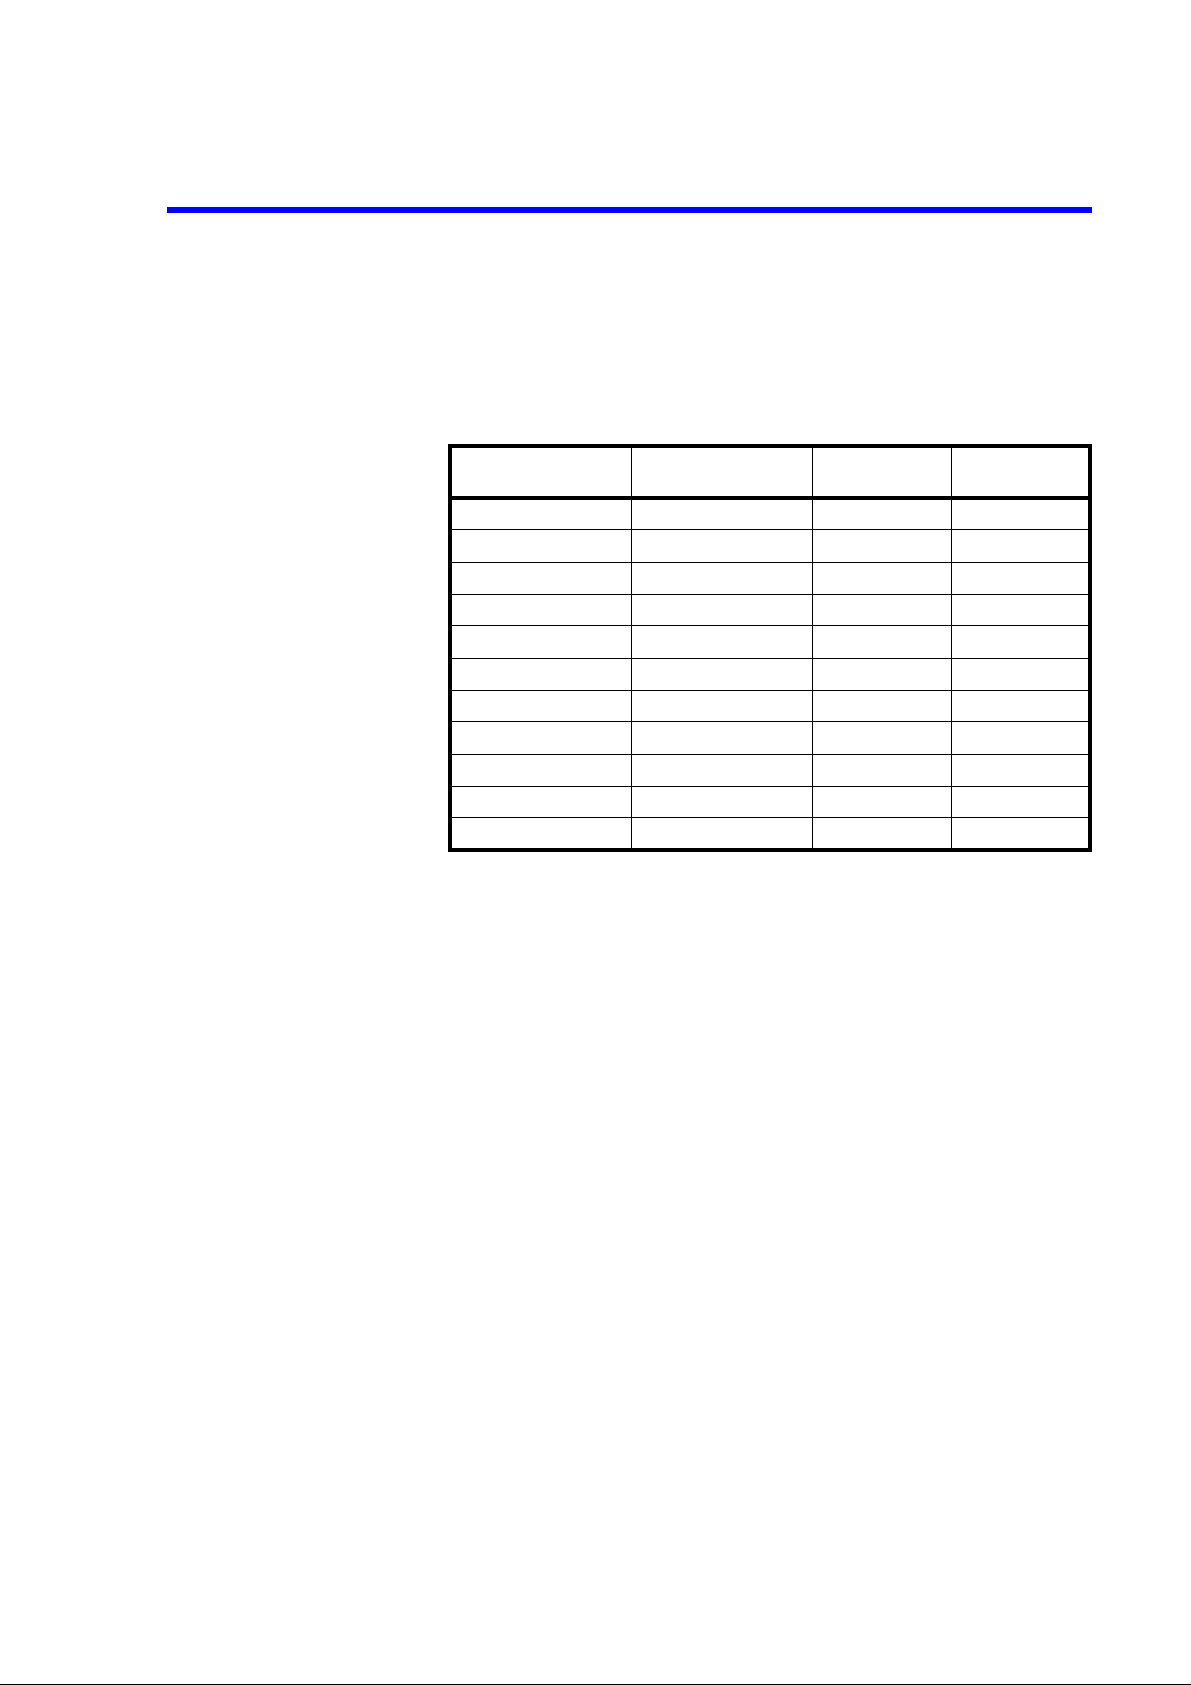
Table 1-1 Instrument Required (2 of 3)
No. Instrument Specification
5 Signal Generator Frequency Range:
10 MHz to 2.5 GHz
Output Level:
-20 dBm to +1 0 dB m
Residual SSB
Phase Noise
at 1 kHz offset:
less than -115 dBc/Hz
at 10 kHz offset:
less than -124 dBc/Hz
at 100 kHz offs et:
less than -130 dBc/Hz
6Function
Generator
7Power Meter
Power Sensor
Frequency Range:
10 mHz to 20 MHz
Output Level:
-10 dBm to +1 3 dB m
Stability: 5×10⁻⁶/ year
Frequency Range:
10 MHz to 26.5 GHz
Input Level:
1µW to 100 mW
Maximum SWR:
1.25 (26.5 GHz)
Recommended
Model
HP8663A
Hewlett Packard
HP3325B
Hewlett Packard
NRVS
NRV-Z52
Rohde&Schwarz
Quantity
1
1
1
81 dB Step
Attenuator
9 10 dB Step
Attenuator
10 Attenuator Driver HP11713A
11 Terminator Impedance: 50 Ω RNA
12 3 dB Attenuator Impedance: 50 Ω
13 20 dB Attenuator Impedance: 50 Ω
Attenuation Range:
0 dB to 12 dB
Frequency Range:
DC to 18 GHz
Attenuation Range:
0 dB to 70 dB
Frequency Range:
DC to 18 GHz
Attenuation: 3 dB
SMA(m)-SMA(f)
Attenuation: 20 dB
SMA(m)-SMA(f)
HP8494H
Hewlett Packard
HP8495H
Hewlett Packard
Hewlett Packard
Rohde&Schwarz
DEF-000685-1
ADVANTEST
DEE-000480-1
ADVANTEST
1
1
1
1
1
1
1-2
Page 13
R3267 Series Spectrum Analyzer Operation Manual (Vol.2)
Table 1-1 Instrument Required (3 of 3)
1.1 Preparation
No. Instrument Specification
14 Power Splitter Frequency Range:
10 MHz to 26.5 GHz
Insertion Loss:
6 dB (nominal)
15 Power Devider Frequency Range:
20 MHz to 1.5 GHz
Isolation:
greater than 18 dB
16 Power Devider Frequency Range:
2 GHz to 18 GHz
Isolation:
greater than 18 dB
17 Low-pass Filter Cutoff Frequency:
2.2 GHz
Rejection (3 GHz):
greater than 40 dB
Rejection (3.8 GHz):
greater than 80 dB
18 RF Cable Impedance: 50 Ω
BNC(m)-BNC(m)
Length:
Approx. 1.5 m
Recommended
Model
1579
Weinschel
DDUL-20A-100
Merrimac
DDUL-24M-10G
Merrimac
DEE-001172-1
ADVANTEST
MI-09
ADVANTEST
Quantity
1
1
1
1
2
19 RF Cable Impedance: 50 Ω
SMA(m)-SMA(m)
Frequency Range:
DC to 26.5 GHz
Maximum SWR:
1.45 at 26.5 GHz
Length:
Approx. 0.7 m
20 Adapter N(m)-SMA(f) Generic
21 Adapter SMA(f)-SMA(f) Generic
22 Adapter N(f)-BNC(m) Generic
23 Adapter N(m)-BNC(f) Generic
A01002
ADAVNTEST
3
5
1
1
3
1-3
Page 14
R3267 Series Spectrum Analyzer Operation Manual (Vol.2)
1.2 Procedure
1.2 Procedure
This section describes the method of how to test the performance verification of the R3267 Series.
NOTE: In the following procedure, the values used are for the recommended instruments.
When using other instruments, use the values conforming to the specifications of each instrument.
1.2.1 Frequency Reference Output Accuracy
This section explains how to check the reference frequency accuracy of the spectrum analyzer using the
calibration signal.
For checking the frequency reference output accuracy when the OPT21 , OPT22 an d OPT 23 ar e installed,
refer to Section 1.2.2, "Frequency Reference Output Accuracy (when the OPT21, OPT22 and OPT23 are
installed)."
CAUTION: If the frequency reference of the R3267 Series is set to EXT, perform 15 minutes wa rm-up opera-
tion after instrument preset.
Specifications:
30 MHz ± 3 Hz
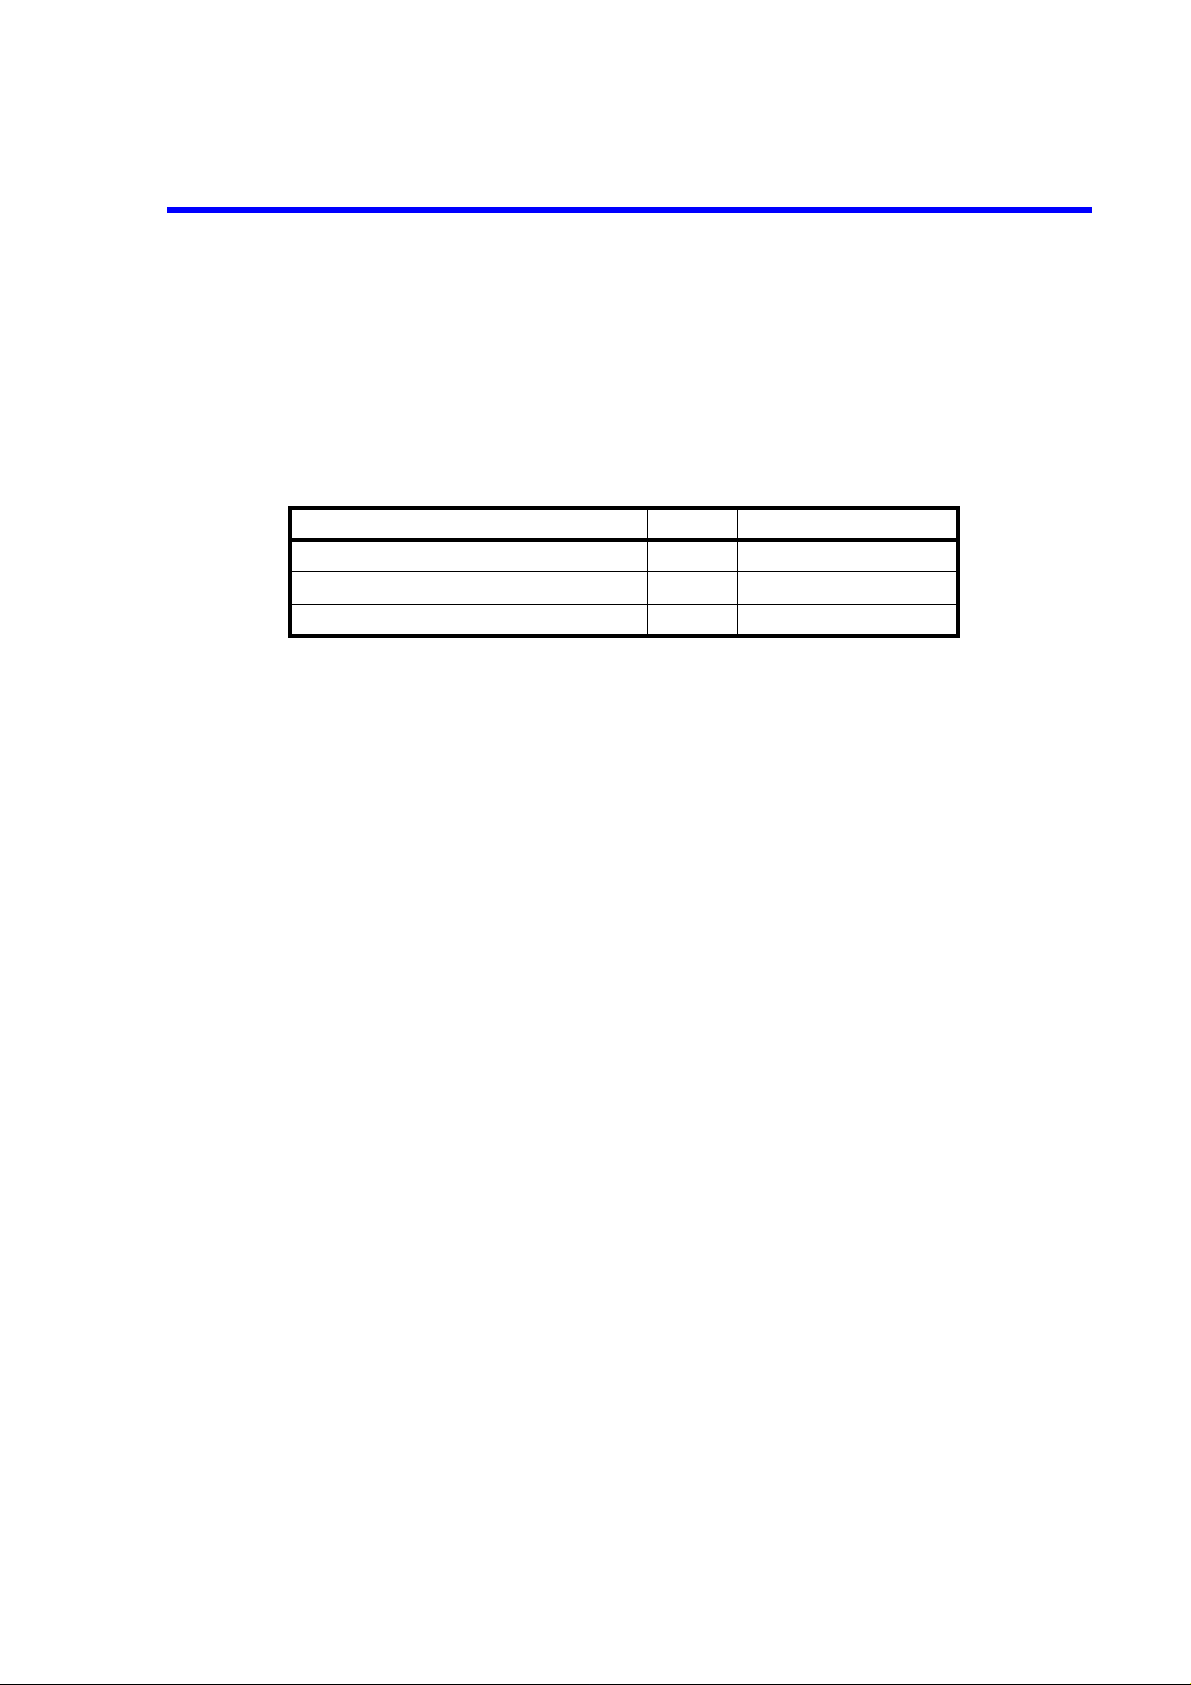
Instruments Required
Instruments QTY Recommended Model
Frequency Standard 1 R3031
Frequency Counter 1 R5372
RF Cable BNC(m)-BNC(m) 2 MI-09
Adapter N(m)-BNC(f) 1
1-4
Page 15
Procedures:
Setup
R3267 Series Spectrum Analyzer Operation Manual (Vol.2)
1.2.1 Frequency Reference Output Accuracy
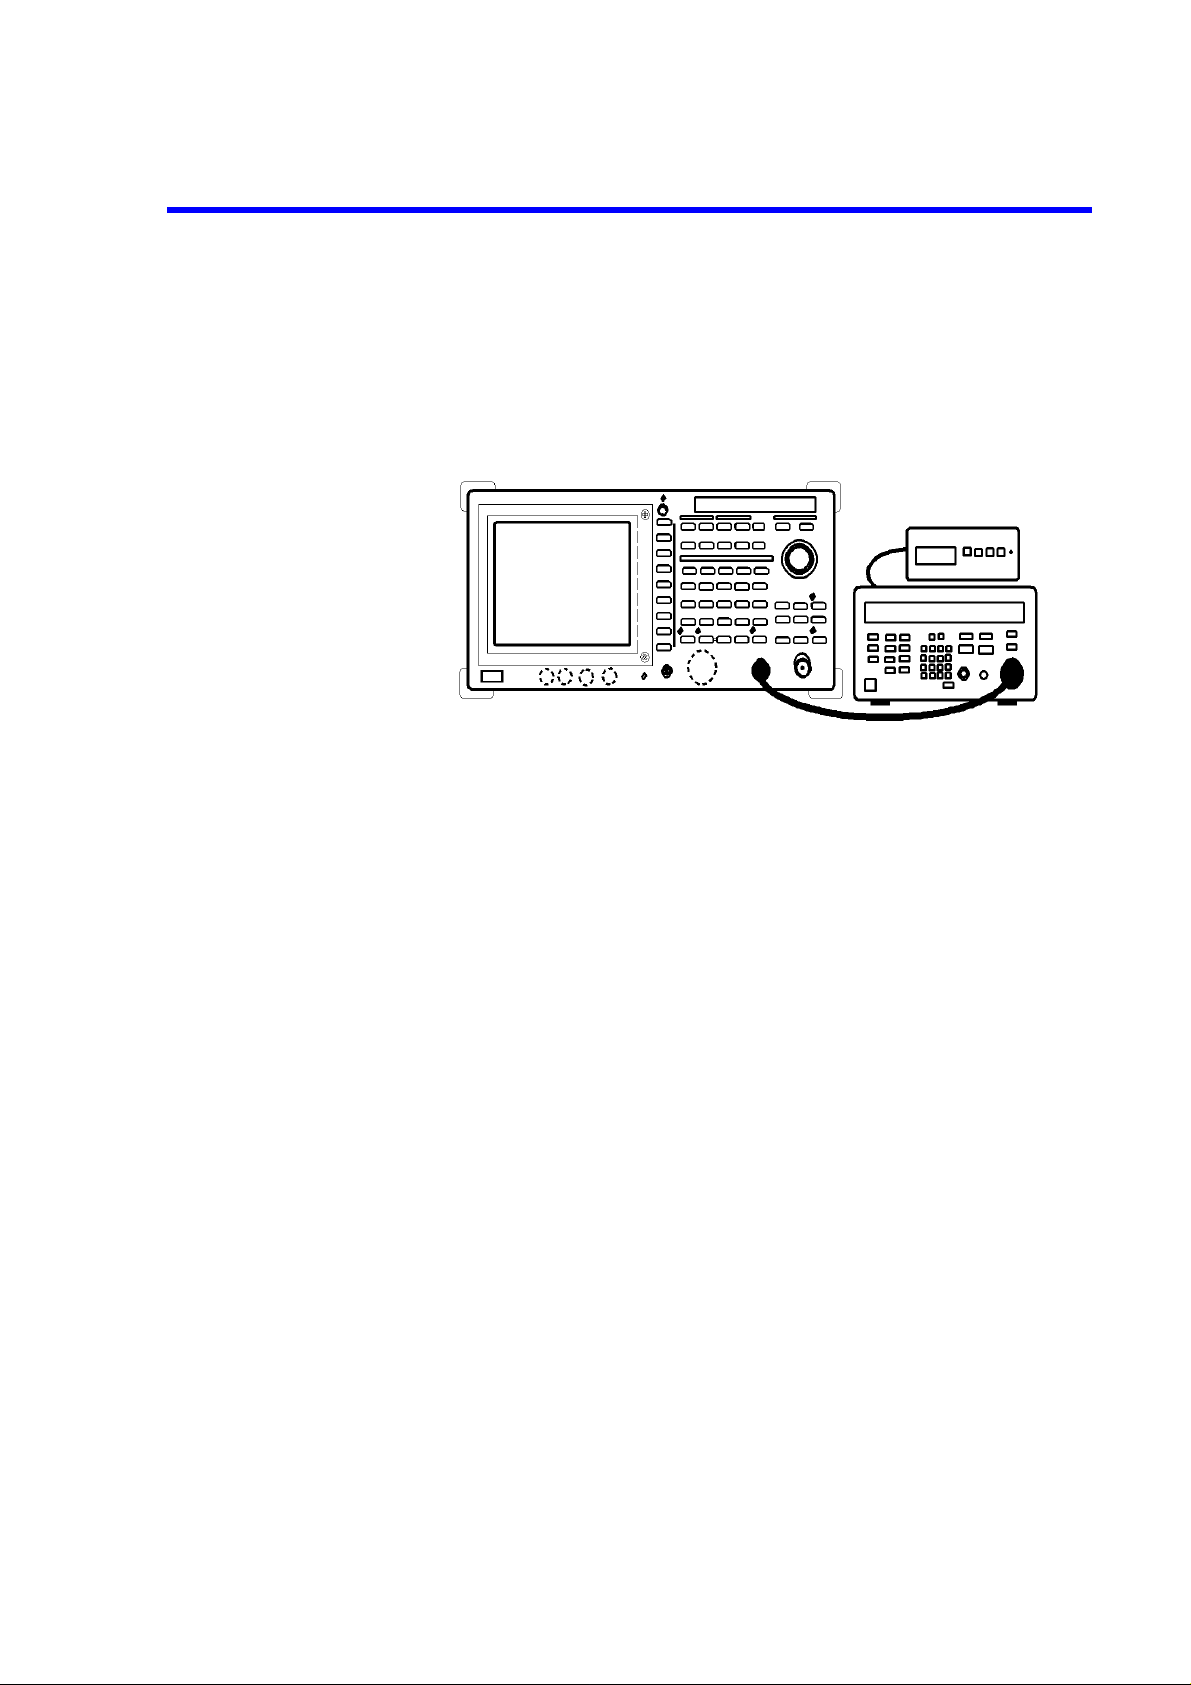
1. C onnect th e frequency counter and t he frequ ency stand ard as sh own in Figu re 1-
1.
Figure 1-1 Setup for Measuring a Frequency Reference Output Accuracy
Setting the Frequency Counter
2. Set the R5372 controls as follows:
Input: B
Resolution: 0.1 Hz
10 MHz Reference: External
Initialization
3. Press SHIFT and CONFIG(PRESET).
4. Wait for the frequency counter to settle down.
5. Record the counter reading on the performance check sheet.
1-5
Page 16
R3267 Series Spectrum Analyzer Operation Manual (Vol.2)
1.2.2 Frequency Reference Output Accuracy (when the OPT21, OPT22 and OPT23 are installed)
1.2.2 Frequency Reference Output Accuracy
(when the OPT21, OPT22 and OPT23 are installed)
This section explains how to check the freq uency r eference ou tput accuracy when the OPT21, OPT22 and
OPT23 are installed. Input the signal from the s ignal g enerato r into the s pectrum analy zer, an d meas ur e it
using the counter function of the spectrum analyzer.
CAUTION: If the frequency reference of the R3267 Series is set to EXT, perform 15 minutes wa rm-up opera-
tion after instrument preset.
Specifications:
1 GHz ± 80Hz (OPT21)
1 GHz ± 20Hz (OPT22)
1 GHz ± 5Hz (OPT23)
Instruments Required
Instruments QTY Recommended Model
Frequency Standard 1 R3031
Signal Generator 1 SMP03
RF Cable BNC(m)-BNC(m) 1 A01002
RF Cable SMA(m)-SMA(m) 1 MI-09
Adapter N(m)-SMA(f) 1
Procedures:
Setup
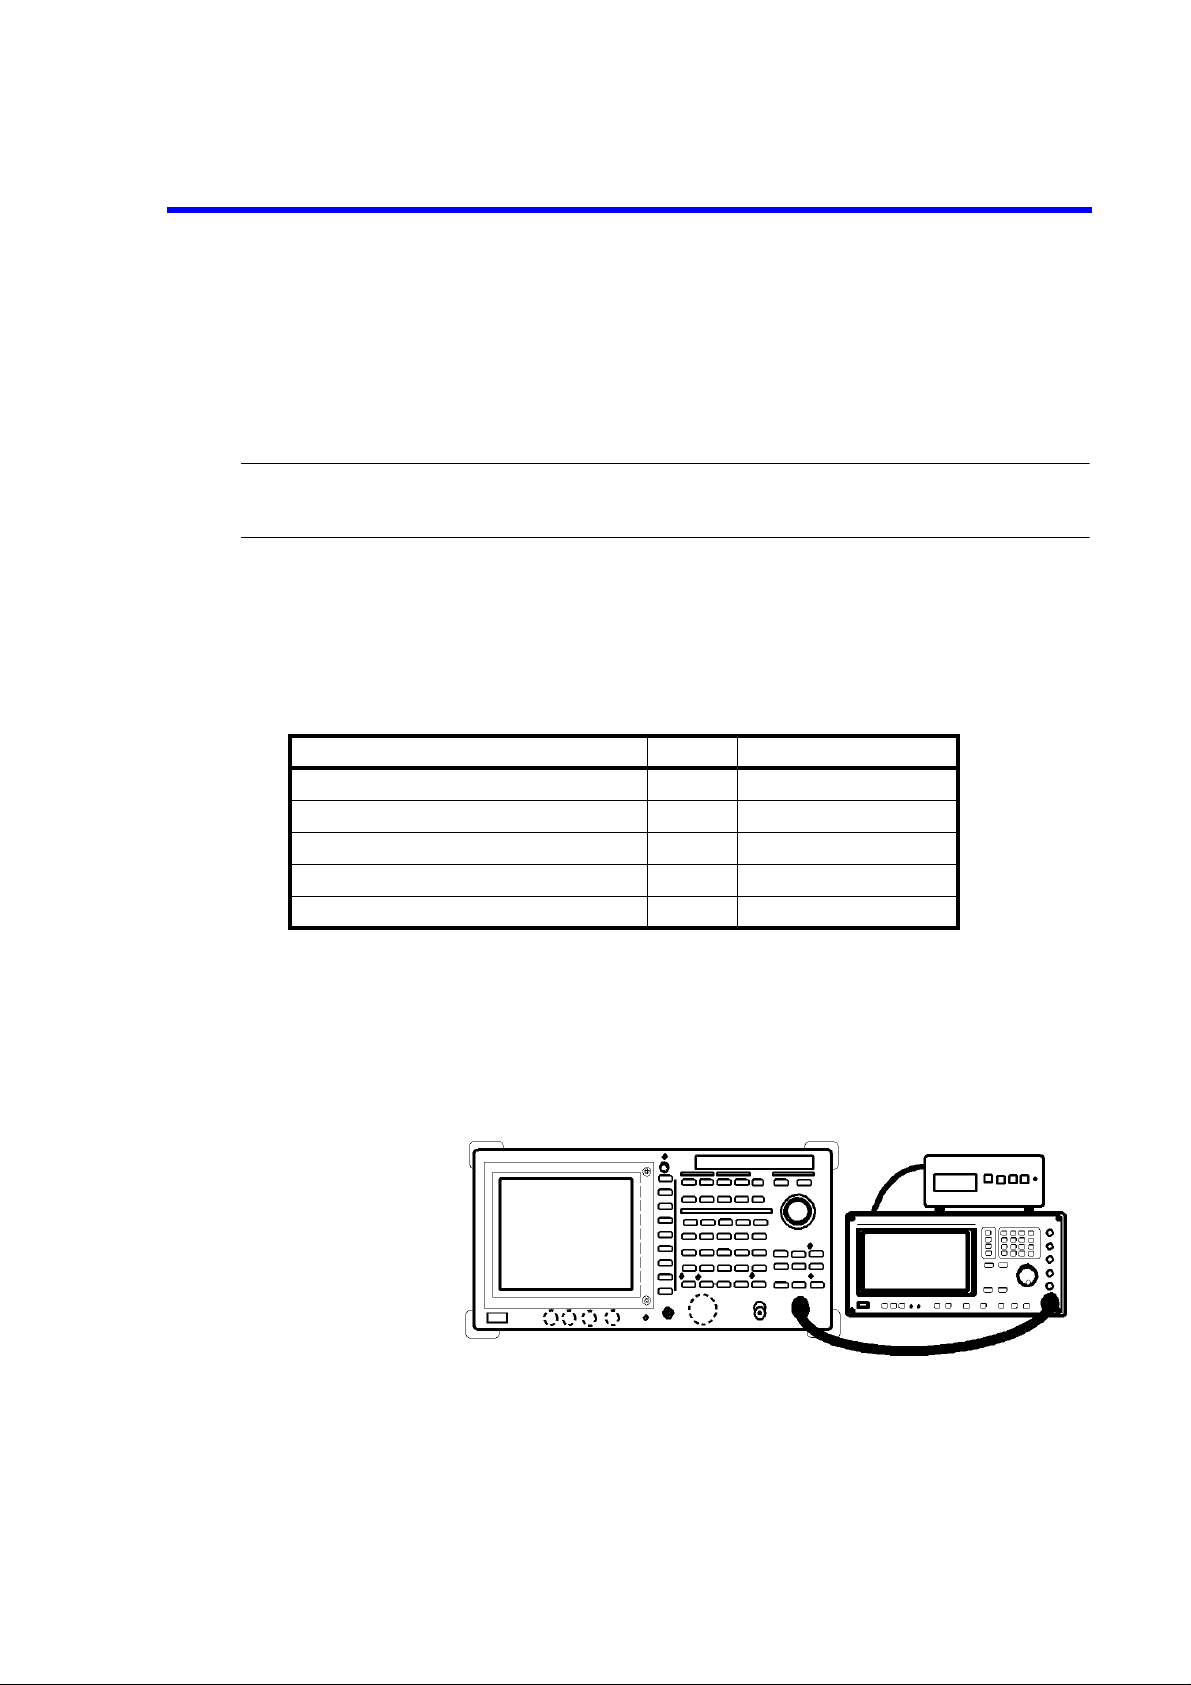
1. Connect the signal generator as shown in Figure 1-2.
Figure 1-2 Connections for Measuring the Frequency Reference Output
Accuracy (when the OPT21, OPT22 and OPT23 are installed)
1-6
Page 17

R3267 Series Spectrum Analyzer Operation Manual (Vol.2)
1.2.2 Frequency Reference Output Accuracy (when the OPT21, OPT22 and OPT23 are installed)
Initialization
2. Press SHIFT and CONFIG(PRESET).
Measurement using a center frequency of 1 GHz
3. Set the SMP03 controls as follows:
Frequency: 1 GHz
Output level: -10 dBm
10 MHz Reference: External
4. Press FREQ, 1 and GHz.
5. Press SPAN, 1 and MHz.
6. Press SCRH.
7. Press MEAS, Counter and Resolution 1 Hz.
8. Press Counter ON/OFF(ON).
9. Record the frequency of the counter marker reading on the performance check
sheet.
10. Press Counter ON/OFF(OFF).
1-7
Page 18
R3267 Series Spectrum Analyzer Operation Manual (Vol.2)
1.2.3 Accuracy of Frequency Readout and Frequency Counter
1.2.3 Accuracy of Frequency Readout and Frequency Counter
This section explains how to check the accura cy of the frequency readout a nd frequ ency cou nter using the
signal generator.
Specifications:
Accuracy of Frequency Readout
± (0.01 × Frequency span + 0.15 × Resolution bandwidth + 10 Hz)
Accuracy of Frequency Counter marker SPAN < 1 GHz : S/N > 25 dB
± (5 Hz × N + 1 LSD)
N: Harmonic order
Instruments Required
Instruments QTY Recommended Model
Signal Generator 1 SMP03
RF Cable BNC(m)-BNC(m) 1 A01002
RF Cable SMA(m)-SMA(m) 1 MI-09
Adapter N(m)-SMA(f) 1
Procedures:
Setup
Initialization
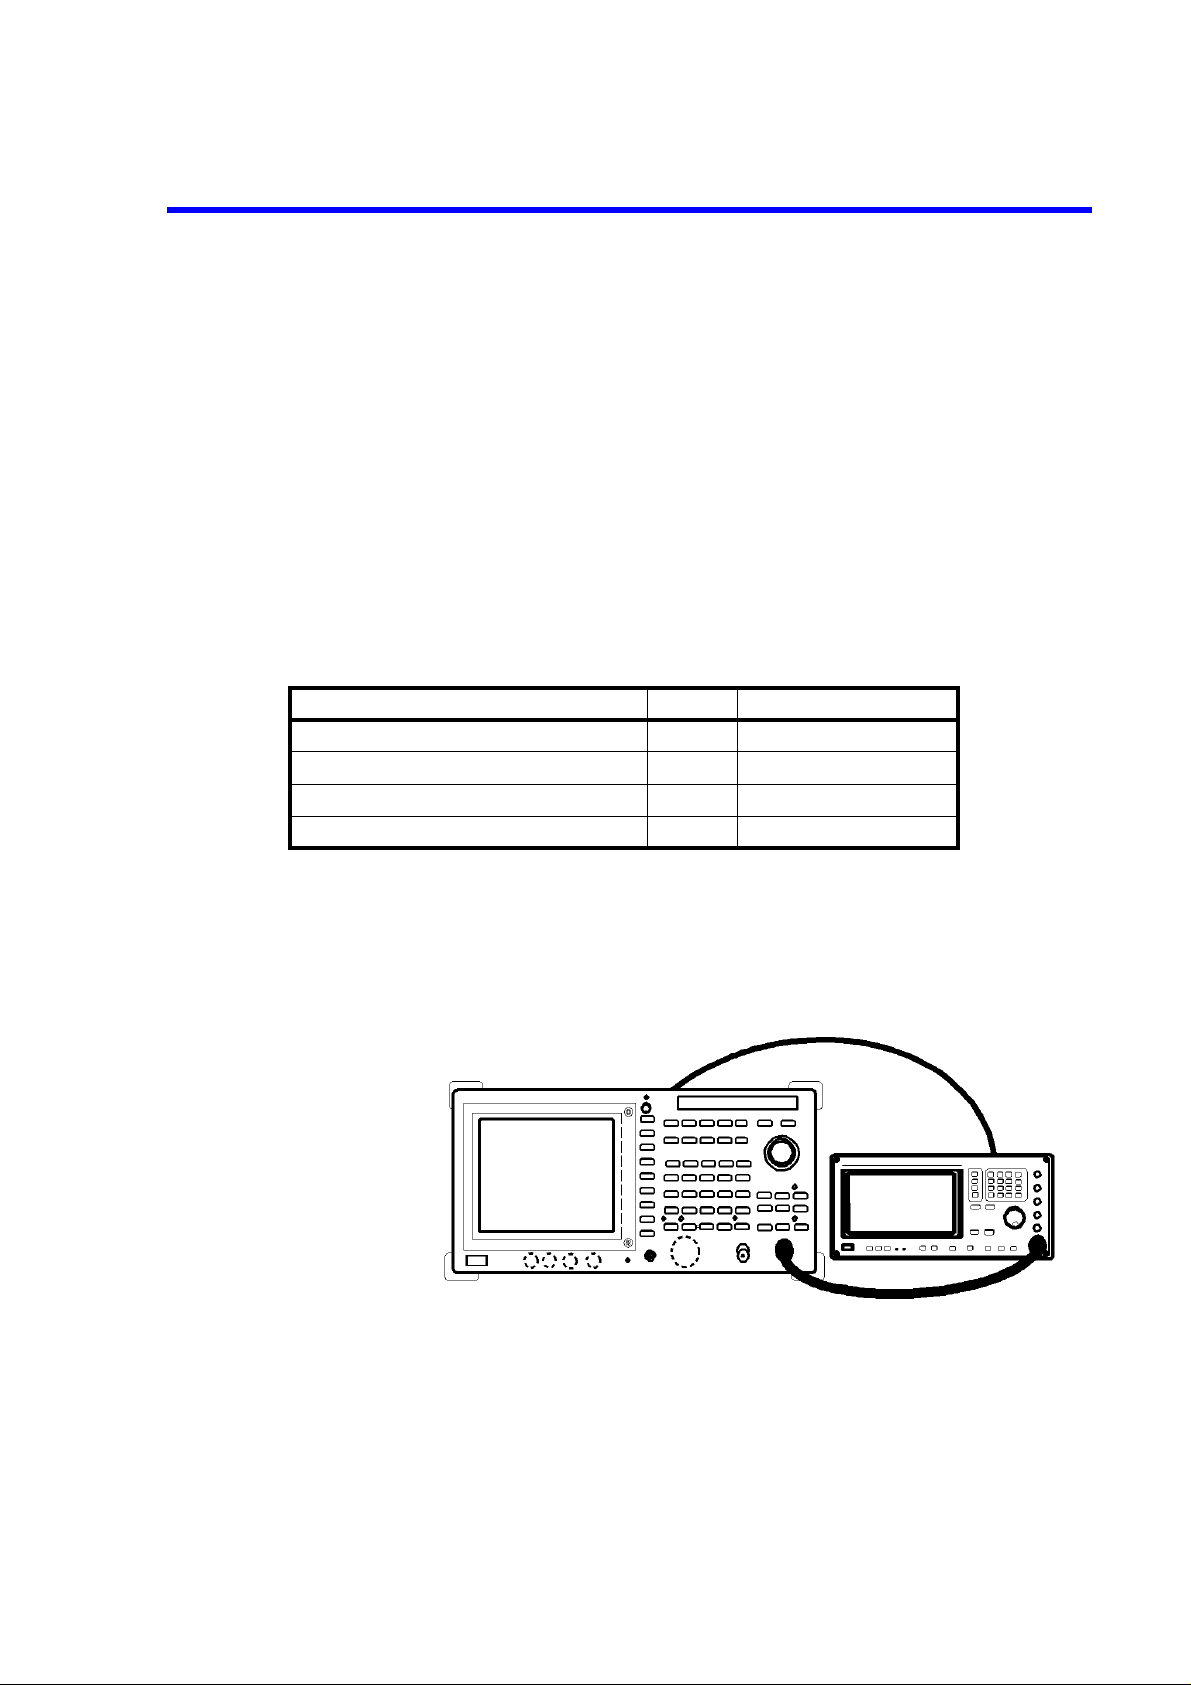
1. Connect the signal generator as shown in Figure 1-3.
Figure 1-3 Setup for Measuring a Frequency Readout Accuracy and
Frequency Counter
2. Press SHIFT and CONFIG(PRESET).
1-8
Page 19
R3267 Series Spectrum Analyzer Operation Manual (Vol.2)
1.2.3 Accuracy of Frequency Readout and Frequency Counter
Measurement using a center frequency of 2 GHz
3. Set the SMP03 controls as follows:
Frequency: 2 GHz
Output level: -10 dBm
10 MHz Reference: External
4. Press FREQ, 2 and GHz.
5. Press SPAN, 1 and MHz.
6. Press SCRH.
7. Record the frequency of the marker reading on the performance check sheet.
8. Repeat steps 5 through 7 for each frequency setting listed on Table 1-2.
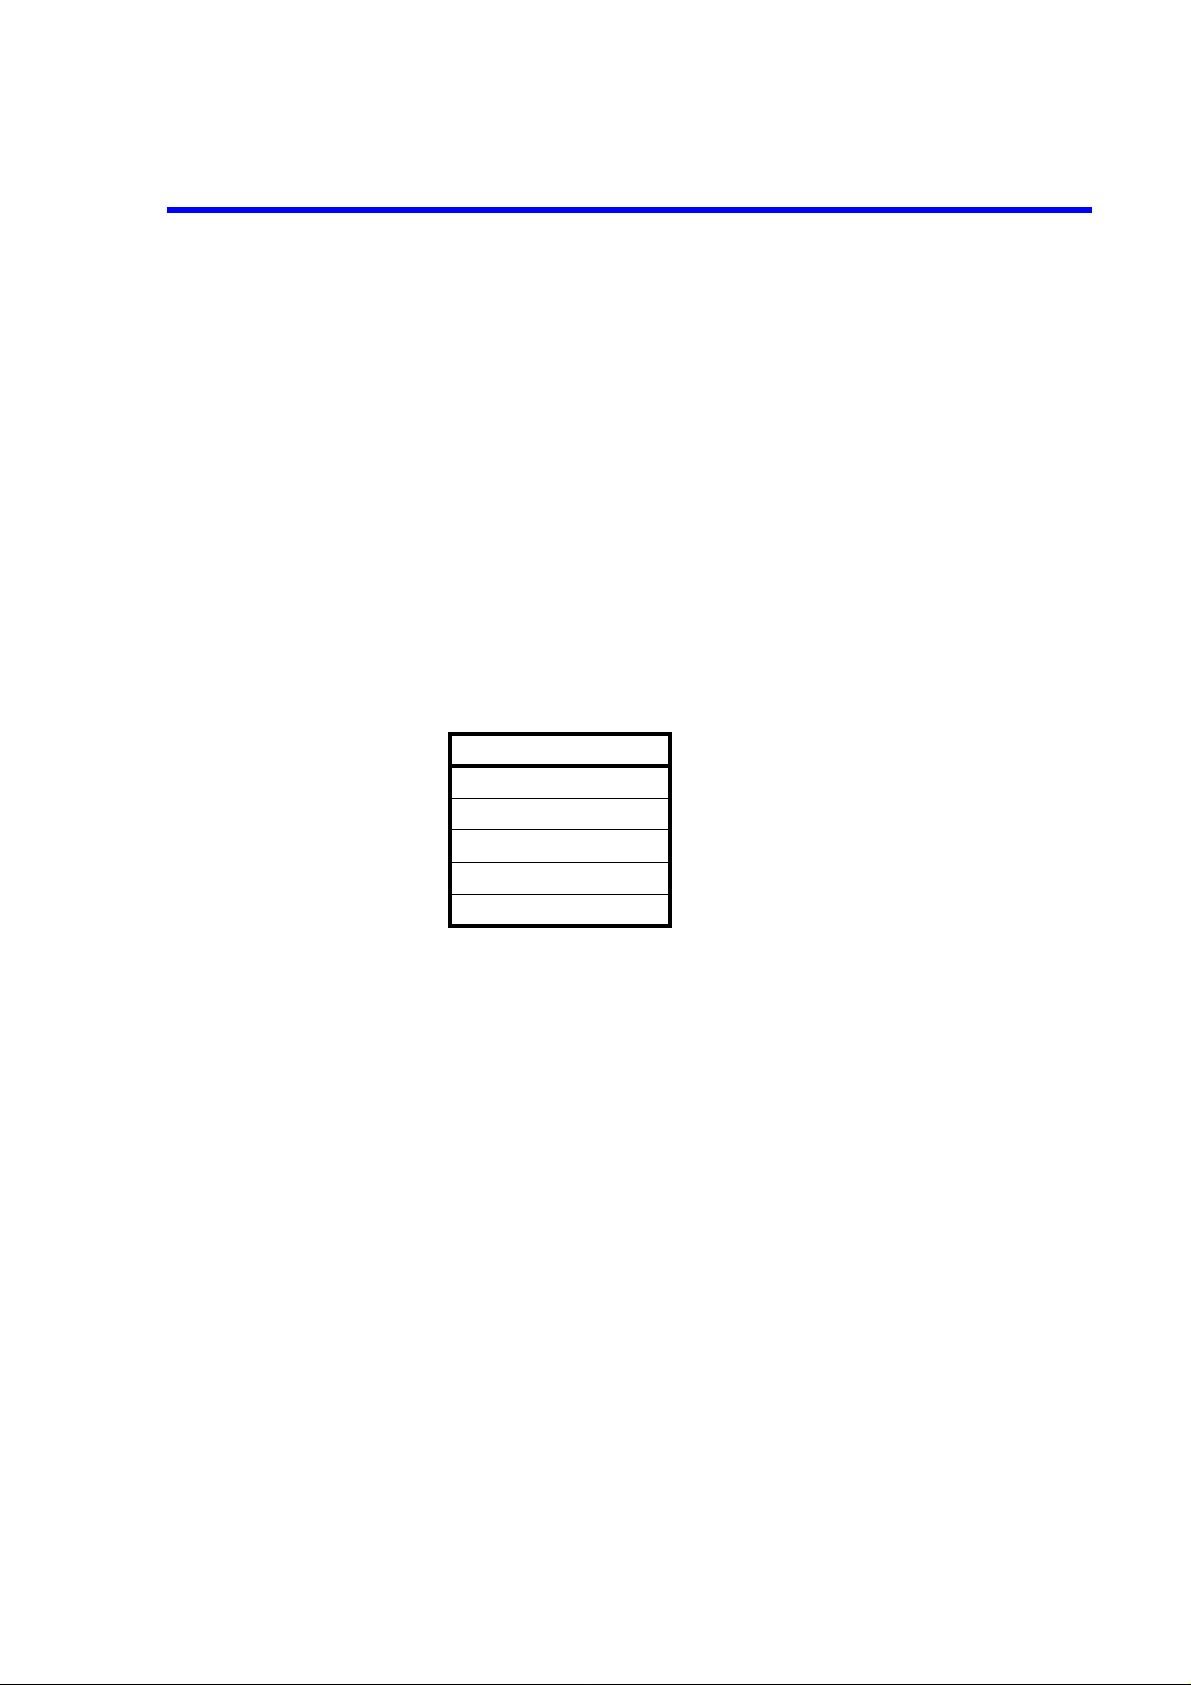
Table 1-2 Frequency Span Setting at a Center Frequency of 2 GHz
Frequency span
10 MHz
20 MHz
50 MHz
100 MHz
2 GHz
Frequency measurement using the counter marker
9. Press SPAN, 1 and MHz.
10. Press SRCH.
11. Press MEAS, Counter and Resolution 1 Hz.
12. Press Counter ON/OFF(ON).
13. Record the frequency of the counter marker reading on the performance check
sheet.
14. Press Counter ON/OFF(OFF).
For the R3267/73
Measurement using a center frequency of 5 GHz
15. Set both the frequency on the SMP03 and the center frequency to 5 GHz and
repeat steps 3 through 14.
1-9
Page 20

R3267 Series Spectrum Analyzer Operation Manual (Vol.2)
1.2.3 Accuracy of Frequency Readout and Frequency Counter
For the R3273 only
Measurement using a center frequency of 11 GHz and 18 GHz
16. Set the frequency on the SMP03 and the center frequency to 11 GHz and repeat
steps 3 through 14.
17. Set the frequency on the SMP03 and the center frequency to 18 GHz and repeat
steps 3 through 14.
1-10
Page 21
1.2.4 Frequency Span Accuracy
This section explains how to check the frequency span accuracy using signals from the signal generator
and the delta marker.
Check the span accuracy using the signal frequency difference measured with the delta marker function.
Specifications:
less than ± 1 % of the frequency span setting
Instruments Required
Instruments QTY Recommended Model
Signal Generator 1 SMP03
RF Cable BNC(m)-BNC(m) 1 A01002
RF Cable SMA(m)-SMA(m) 1 MI-09
Adapter N(m)-SMA(f) 1
R3267 Series Spectrum Analyzer Operation Manual (Vol.2)
1.2.4 Frequency Span Accuracy
Procedures:
Setup
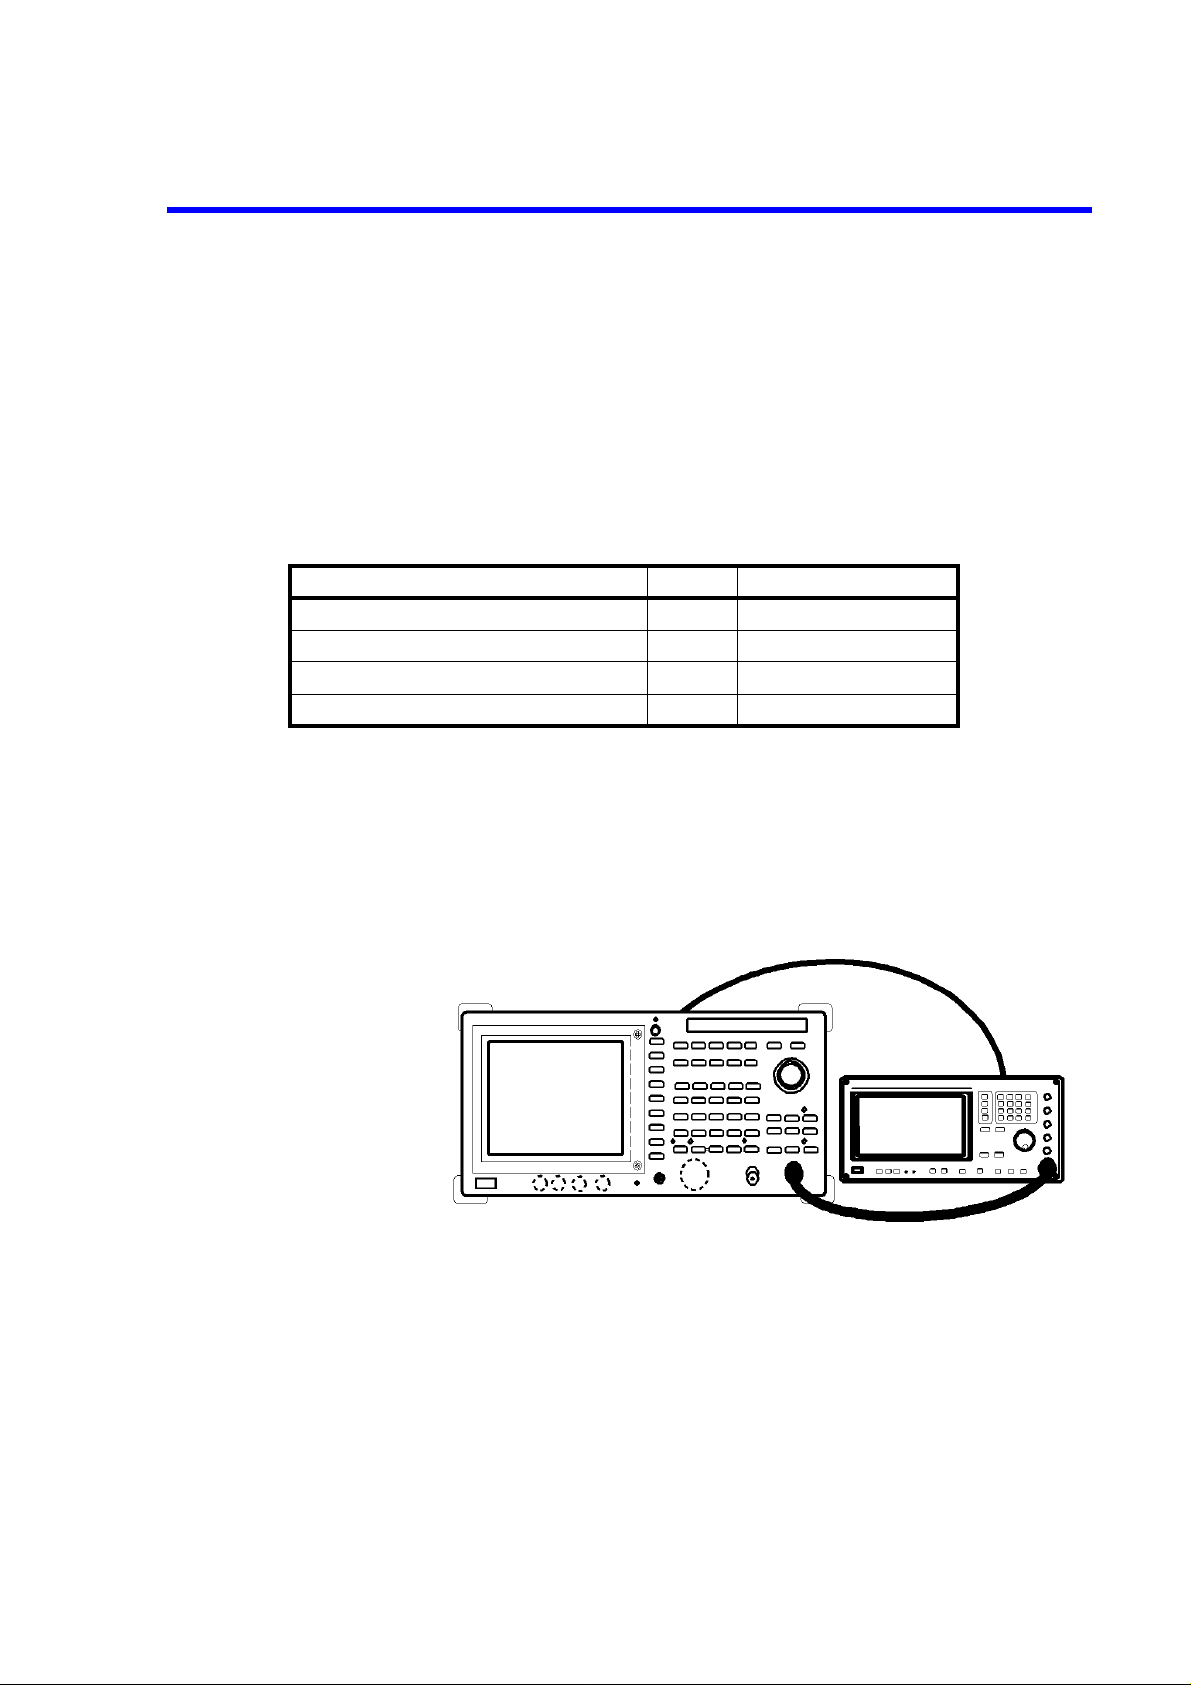
1. Connect the signal generator as shown in Figure 1-4.
Figure 1-4 Setup for Measuring a Frequency Span Accuracy
Setting the signal generator
2. Set the SMP03 controls as follows:
Output level: -5 dBm
10 MHz Reference: External
Initialization
3. Press SHIFT and CONFIG(PRESET).
1-11
Page 22
R3267 Series Spectrum Analyzer Operation Manual (Vol.2)
1.2.4 Frequency Span Accuracy
Measurement of the span accuracy
4. Set the frequency of the SMP03 to 1.999992 GHz.
5. Press FREQ, 2 and GHz.
6. Press SPAN, 2, 0 and kHz.
7. Press SINGLE.
8. Press SRCH, after the sweep has completed.
9. Press MKR, Delta Marker and Delta Marker ON/OFF (ON).
10. Set the frequency of the SMP03 to 2.000008 GHz.
11. Press SINGLE.
12. Press SRCH, after the sweep has completed.
13. Record the frequency of the delta marker reading on the performance check
sheet.
14. Repeat steps 4 through 13 for each frequency setting listed on Table 1-3.
Table 1-3 Center/Span Frequencies for the R3267
SMP03
1st Frequency
1.999980 GHz 2.000020 GHz 2 GHz 50 kHz
1.999940 GHz 2.000160 GHz 2 GHz 400 kHz
1.9992 GHz 2.0008 GHz 2 GHz 2 MHz
1.998 GHz 2.002 GHz 2 GHz 5 MHz
1.996 GHz 2.004 GHz 2 GHz 10 MHz
1.992 GHz 2.008 GHz 2 GHz 20 MHz
1.98 GHz 2.02 GHz 2 GHz 50 MHz
1.96 GHz 2.04 GHz 2 GHz 100 MHz
1.92 GHz 2.08 GHz 2 GHz 200 MHz
1.8 GHz 2.2 GHz 2 GHz 500 MHz
1.6 GHz 2.4 GHz 2 GHz 1 GHz
1.2 GHz 2.8 GHz 2 GHz 2 GHz
2.4 GHz 5.6 GHz 4 GHz 4 GHz R3267/73
0.8 GHz 7.2 GHz 4 GHz 8 GHz R3267/73
SMP03
2nd Frequency
Center
Frequency
Frequency
Span
Remarks
1-12
Page 23
R3267 Series Spectrum Analyzer Operation Manual (Vol.2)
For the R3273 only
Measurement for a center frequency of 10 GHz and 17 GHz.
15. Repeat steps 4 through 13 for each frequencies setting listed on Table 1-4.
Table 1-4 Center/Span Frequencies for the R3273
1.2.4 Frequency Span Accuracy
SMP03
1st Frequency
9.996 GHz 10.004 GHz 10 GHz 10 MHz
9.96 GHz 10.04 GHz 10 GHz 100 MHz
9.6 GHz 10.4 GHz 10 GHz 1 GHz
9.2 GHz 10.8 GHz 10 GHz 2 GHz
16.996 GHz 17.004 GHz 17 GHz 10 MHz
16.96 GHz 17.04 GHz 17 GHz 100 MHz
16.6 GHz 17.4 GHz 17 GHz 1 GHz
16.2 GHz 17.8 GHz 17 GHz 2 GHz
8 GHz 12 GHz 10 GHz 5 GHz
6 GHz 14 GHz 10 GHz 10 GHz
2.4 GHz 17.6 GHz 10 GHz 19 GHz
SMP03
2nd Frequency
Center
Frequency
Frequency
Span
1-13
Page 24
R3267 Series Spectrum Analyzer Operation Manual (Vol.2)
1.2.5 Calibration Amplitude Accuracy
1.2.5 Calibration Amplitude Accuracy
This section explains how to check the output level accuracy of the calibration signal.
Specifications:
-10 dBm ± 0.3 dB
Instruments Required
Instruments QTY Recommended Model
Power Meter and Power Sensor 1 NRVS / NRV-Z52
Adapter N(f)-BNC(m) 1
Adapter N(m)-SMA(f) 1
Procedures:
Initialization
1. Set the unit to dBm on the NRVS.
2. Perform the zeroing of the NRVS.
3. Press SHIFT and CONFIG(PRESET).
Measuring of the CAL OUT level
4. Connect the power sensor to CAL OUT connector through the adapter, N(f)BNC(m) and N(m)-SMA(f) .
5. Set the correction frequency to 30 MHz on the NRVS.
6. Record the level of the power meter reading on the performance check sheet.
1-14
Page 25
1.2.6 IF Gain Uncertainty
This section explains how to check IF gain errors in the RBWs of 1 MHz, 300 kHz and 3 kHz. If the reference level is reduced, the IF gain is increased. The IF gain error can be measured if you deduce the inpu t
level in steps of 1 dB or 10 dB in order to reduce the reference level in steps of 1 dB or 10 dB as in the
input level. In addition, the frequency reference source signal of the generator is supplied from the spectrum analyzer.
Specifications:
Less than ± 0.5 dB Range: 0 to -50 dBm 10 dB Attenuation
Less than ± 0.7 dB Range: 0 to -80 dBm 10 dB Attenuation
Instruments Required
Instruments QTY Recommended Model
Function Generator 1 HP3325B
1 dB Step Attenuator 1 HP8494H
10 dB Step Attenuator 1 HP8495H
Attenuator Driver 1 HP11713A
RF Cable BNC(m)-BNC(m) 3 MI-09
Adapter N(m)-BNC(f) 3
R3267 Series Spectrum Analyzer Operation Manual (Vol.2)
1.2.6 IF Gain Uncertainty
Procedures:
Setup
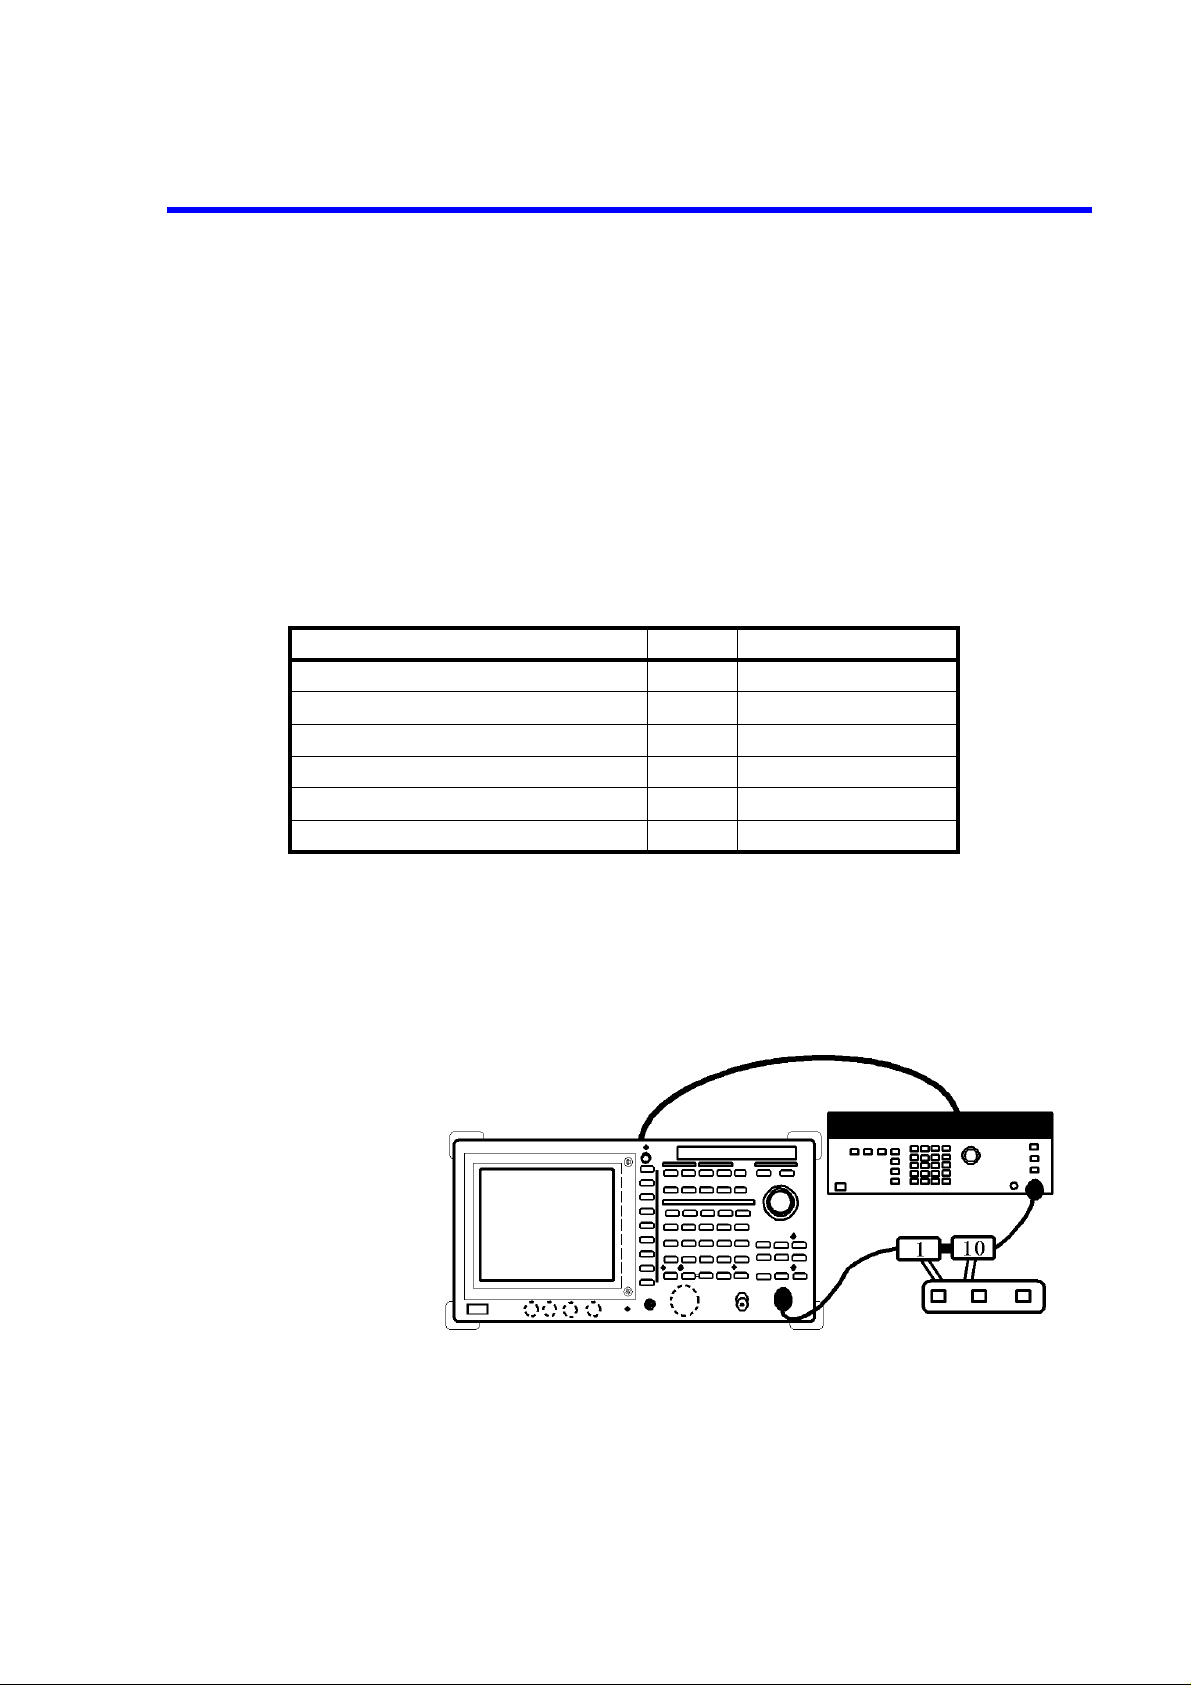
1. Connect the signal generator and step attenuator as shown in Figure 1-5.
Figure 1-5 Setup for Measuring a IF Gain Uncertainty
1-15
Page 26

R3267 Series Spectrum Analyzer Operation Manual (Vol.2)
1.2.6 IF Gain Uncertainty
Setting the function generator
2. Set the HP3325B controls as follows:
Frequency: 11 MHz
Output level: -5 dBm
10MHz Reference:External
Setting the step attenuator
3. Set the HP8494H and HP8495H to 0 dB using the HP11713A.
Initialization
4. Press SHIFT and CONFIG(PRESET).
Setting the measurement conditions
5. Press FREQ, 1, 1 and MHz.
6. Press SPAN and Zero Span.
7. Press LEVEL, dB/div and 1dB/div.
8. Press COUPLE, RBW AUTO/MNL(MNL), 1 and MHz.
9. Press VBW AUTO/MNL(MNL), 1 and Hz.
10. Adjust the output level on the HP3325B to position the trace peak to a level 5
11. Press SINGLE .
12. Press SINGLE, after the sweep is completed.
13. Press A, View A and SRCH, after the sweep is completed.
14. Record the marker readout at the reference value box on the performance check
15. Press B, Write B and MKR.
16. Press Delta Marker, RETURN and Trace Marker Move.
IF gain error measurement
17. Set the attenuation level to 1 dB on the HP11713A.
divisions below the reference line.
sheet.
1-16
18. Press LEVEL, 1 and MHz(-dBm) to set the reference level to -1 dBm.
19. Press SINGLE .
Page 27
R3267 Series Spectrum Analyzer Operation Manual (Vol.2)
1.2.6 IF Gain Uncertainty
20. Press SINGLE, after the sweep is completed.
21. Press SRCH, after the sweep is completed.
22. Record the marker readout on the performance check sheet.
23. Repeat steps 17 through 22 for each frequency setting listed on Table 1-5.
24. Repeat steps 2 through 23 for each frequency setting listed on Table 1-6.
Table 1-5 IF Gain Uncertainty Setting
Step attenuator Reference level
1 dB -1 dBm
2 dB -2 dBm
3 dB -3 dBm
4 dB -4 dBm
5 dB -5 dBm
6 dB -6 dBm
7 dB -7 dBm
8 dB -8 dBm
9 dB -9 dBm
10 dB -10 dBm
20 dB -20 dBm
30 dB -30 dBm
40 dB -40 dBm
50 dB -50 dBm
60 dB -60 dBm
70 dB -70 dBm
80 dB -80 dBm *
*: Make a measurement only when the RBW is
at 3 kHz.
Table 1-6 RBW Setting
RBW setting
3 kHz
300 kHz
1-17
Page 28
R3267 Series Spectrum Analyzer Operation Manual (Vol.2)
1.2.7 Input Attenuator Switching Accuracy
1.2.7 Input Attenuator Switching Accuracy
This section explains how to check the input attenuator switching accuracy . The signal generator freque ncy reference source is supplied from the spectru m analyzer. The input attenuator switching accuracy is calculated based on the 10 dB attenuator.
IF Gain uncertainty is measured when the resolution bandwidth is set to 3kHz and the result is filled in on
the IF Gain uncertainty of the performance check sheet.
NOTE: You may hear some clicking noises during the tests. This is normal.
Specifications:
Reference to 10 dB input attenuation, in the range of 20 dB to 70 dB.
R3264
Less than ± 1.1 dB/5 dB step 9 kHz to 3.5 GHz: Maximum deviation ± 2 dB
R3267
Less than ± 1.1 dB/5 dB step 100 Hz to 8 GHz: Maximum deviation ± 2 dB
R3273
Less than ± 1.1 dB/10 dB step 100 Hz to 12.4 GHz: Maximum deviation ± 2 dB
Less than ± 1.3 dB/10 dB step 12.4 GHz to 18 GHz: Max. deviation ± 2.5 dB
Less than ± 1.8 dB/10 dB step 18 GHz to 26.5 GHz: Max. deviation ± 3.5 dB
Instruments Required
Instruments QTY Recommended Model
Signal Generator 1 SMP02
RF Cable SMA(m)-SMA(m) 2 A01002
RF Cable BNC 1 MI-09
Adapter N(m)-SMA(f) 2
Procedures:
Setup
1. Connect the signal generator as shown in Figure 1-6.
1-18
Page 29
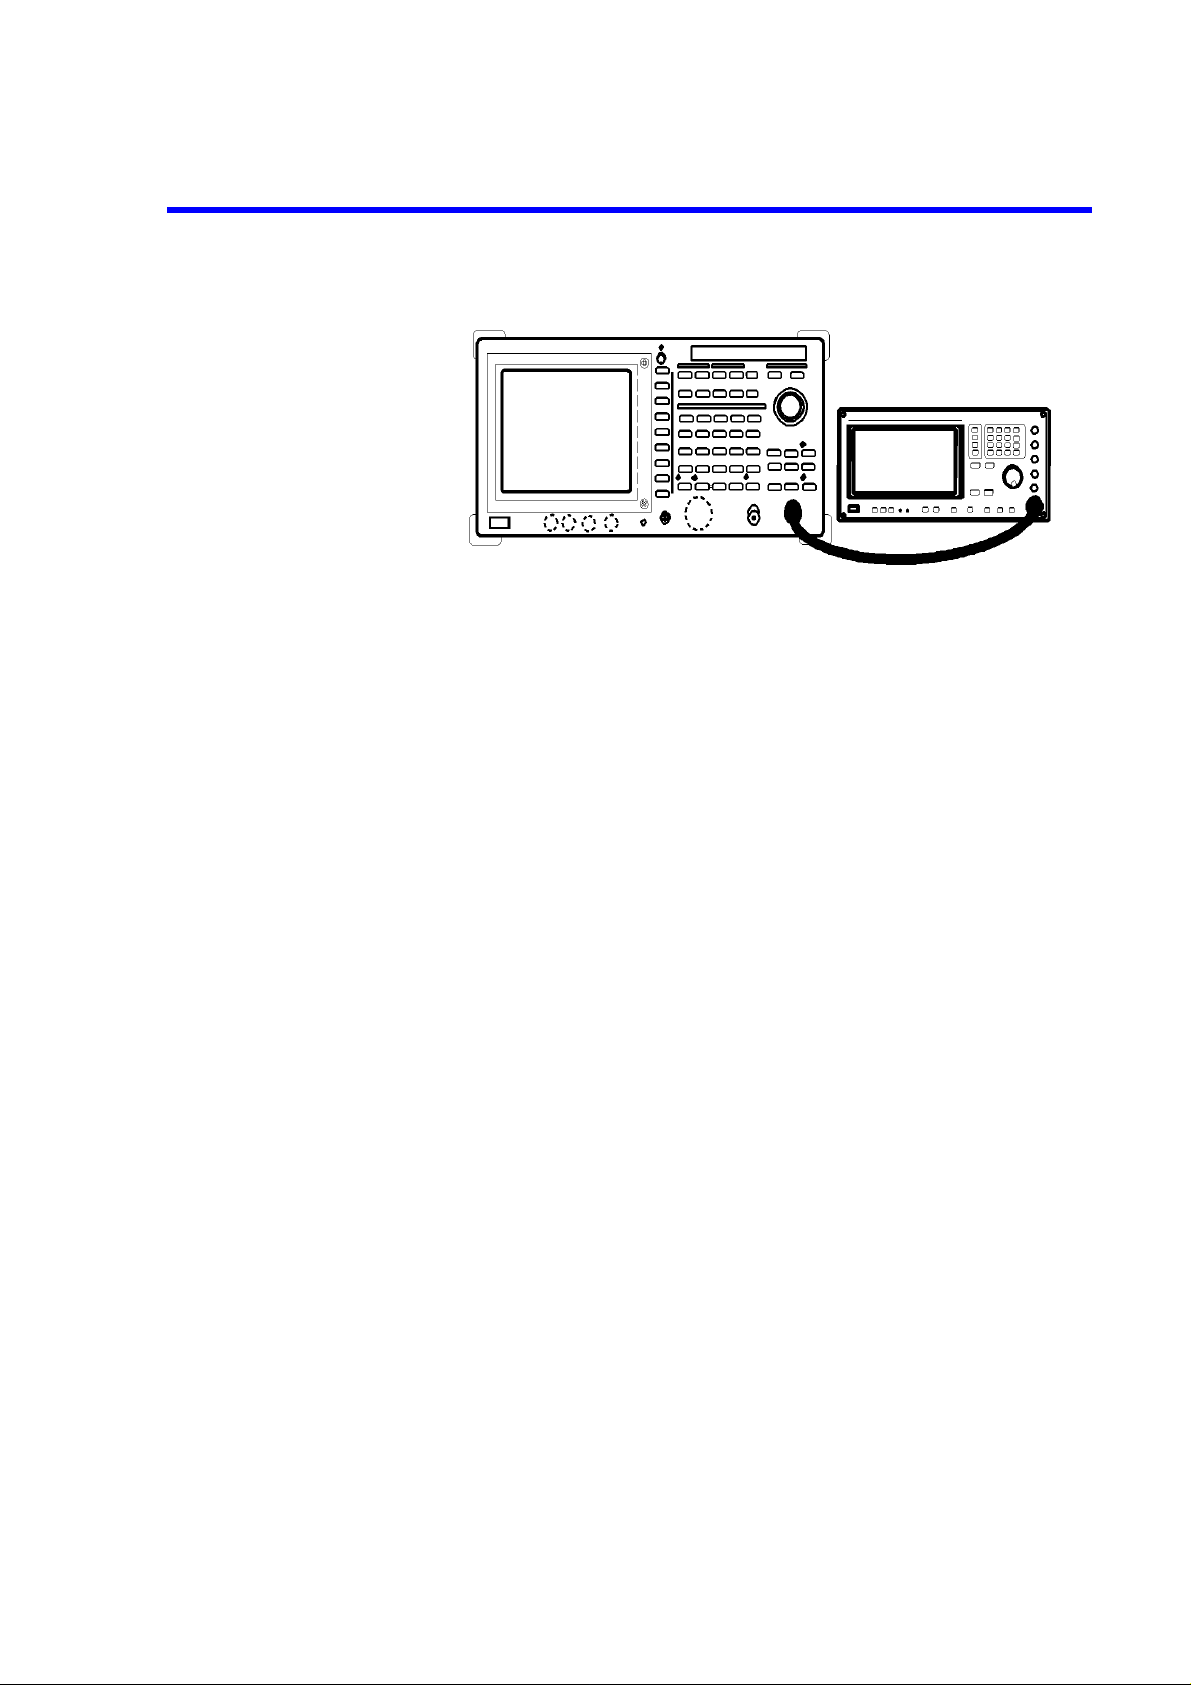
Figure 1-6 Setup for Measuring an Input Attenuator Accuracy
Setting the signal generator
2. Set the SMP03 controls as follows:
Frequency: 2 GHz(R3264 )
Output level: -5 dBm
R3267 Series Spectrum Analyzer Operation Manual (Vol.2)
1.2.7 Input Attenuator Switching Accuracy
4 GHz(R3267 /73)
Initialization
3. Press SHIFT and CONFIG(PRESET).
Setting the measurement conditions
4. Press FREQ, 2 and GHz(R3264).
Press FREQ, 4 and GHz(R3267/73).
5. Press SPAN 1, 0 and kHz.
6. Press LEVEL, 0, MHz(-dBm), dB/div and 1 dB/div.
7. Press COUPLE, RBW AUTO/MNL(MNL) and 3 and kHz.
8. Press VBW AUTO/MNL(MNL), 1, 0 and Hz.
9. Adjust the output level on the SMP02 to position the trace peak to a level 5 divisions below the reference line.
10. Press SINGLE.
11. Press SINGLE, after the sweep has completed.
12. Press SRCH, after the sweep has completed.
13. Record the marker readout at the reference value box on the performance check
sheet.
1-19
Page 30

R3267 Series Spectrum Analyzer Operation Manual (Vol.2)
1.2.7 Input Attenuator Switching Accuracy
14. Press ATT and ATT AUTO/MNL(MNL).
Measuring the attenuator switching accuracy
15. Press ATT, 2, 0 and GHZ(dB) to change the attenuator setting.
16. Press SINGLE.
17. Press SINGLE, after the sweep has completed.
18. Press SRCH, after the sweep has completed.
19. Calculate the switching accuracy using the marker readout and the expression
shown below.
Switching accuracy = Reference Value ( in st ep 13 ) - Mar ker read out (in step 18)
+ IF gain uncertainty (in section 1.2.5)
20. Record the switching accuracy on the performance check sheet.
21. Repeat steps 15 through 20 for each frequency setting listed on Table 1-7.
Table 1-7 Input Attenuator Sett ing
Input Attenuator
Step-to-step accuracy calculation
22. Calculate the step-to-step accuracy for the 20, 30, 40, 50, 60 an d 70 dB ATT settings using the switching accuracy calculated in step 19 together with the following expression, and record the results on the performance check sheet.
Step-to-step accuracy for an input attenuation of x dB = A - B
A: Switching accuracy for an input attenuation of x dB
B: Switching accuracy for an input attenuation of (x -10) dB
For the R3273
20 dB
30 dB
40 dB
50 dB
60 dB
70 dB
1-20
23. Repeat steps 2 thru 22 for a frequency of 15 GHz ( which is set o n the SMP02 and
used as the center frequency).
24. Repeat steps 2 thru 22 for a frequency of 18 GHz ( which is set o n the SMP02 and
used as the center frequency).
Page 31

1.2.8 Frequency Response
This section explains how to check the frequency response of the spectrum analyzer. The s ignal generator
signal is fed through a power splitter and the power level is monitored with a power meter. A signal of 30
MHz is positioned at the display center of the spectrum analyzer so that its level can be used as the reference value.
For each frequency band, a signal with the specified frequency is set so that it can always be displayed in
the display center of the spectrum analyzer and the level relative to the 30 MHz signal is measured.
Specifications:
Set the input attenuator to 10 dB. The frequency ranges for frequency bands 1 thru 3 are valid only
after the preselector has been adjusted.
R3264 Frequency range Frequency band
± 1.5 dB 9 kHz to 3.5 GHz 0
Frequency response relative to the 30 MHz: less than ± 3 dB
R3267 Series Spectrum Analyzer Operation Manual (Vol.2)
1.2.8 Frequency Response
R3267 Frequency range Frequency band
± 1.5 dB 100 Hz to 3.5 GHz 0
± 1.0 dB 50 MHz to 2.6 GHz 0
± 1.5 dB 1.6 GHz to 3.5 GHz 1
± 1.5 dB 3.5 GHz to 7.0 GHz 2
± 1.5 dB 6.9 GHz to 8.0 GHz 3
Frequency response relative to the 30 MHz: less than ± 3 dB
Band switching incertainly: less than ± 0.5 dB
R3273 Frequency range Frequency band
± 1.5 dB 100 Hz to 3.5 GHz 0
± 1.0 dB 50 MHz to 2.6 GHz 0
± 1.5 dB 3.5 GHz to 7.5 GHz 1
± 3.5 dB 7.4 GHz to 15.4 GHz 2
± 4.0 dB 15.4 GHz to 26.5 GHz 3
Frequency response relative to the 30 MHz: less than ± 5 dB
Band switching incertainly: less than ± 0.5 dB
Instruments Required
Instruments QTY Recommended Model
Signal Generator 1 SMP03
Power Meter and Power Sensor 1 NRVS / NRV-Z52
Power Splitter 1 1579
RF Cable SMA(m)-SMA(m) 2 A01002
Adapter N(m)-SMA(f) 3
1-21
Page 32

R3267 Series Spectrum Analyzer Operation Manual (Vol.2)
1.2.8 Frequency Respons e
Procedures:
Initializing the Power meter with the sensor
1. Set the unit to dBm on the NRVS.
2. Perform the zeroing of the NRVS.
Setup
3. Connect the signal generator as shown in Figure 1-7.
Figure 1-7 Setup for Measuring a Frequency Response
Initialization
4. Press SHIFT and CONFIG(PRESET).
Setting the measurement conditions
5. Press FREQ, 3, 0 and MHz.
6. Press SPAN, 4, 0 and MHz.
7. Press LEVEL, 5 and MHz(-dBm).
8. Press COUPLE, RBW AUTO/MNL(MNL), 3 and MHz.
9. Press VBW AUTO/MNL(MNL), 1 and kHz.
10. Press LEVEL, dB/div and 1 dB/div.
11. Press FREQ, CF St e p Si ze AUTO/MNL(MNL), 1, 0, 0 and MHz.
12. Set the SMP03 controls as follows:
Frequency: 30 MHz
Output Level: -4 dBm
Frequency step size: 100 MHz
1-22
Page 33

13. Set the correction frequency to the 30 MHz on the NRVS.
14. Press SRCH.
15. Press Cont Peak ON/OFF(ON).
16. Adjust the output level on the SMP03 using the data knob to obtain a marker
readout of -10±0.09 dBm on the spectrum analyzer.
17. Set the display mode of the NRVS to the relative.
Measuring the frequency band 0
18. (For the R3267 only) Pr ess FREQ, more 1/2 and Pre selector 1.6 G/3 .6 G(3.6G).
19. Press FREQ, 1, 0, 0 and MHz.
20. Set the frequency of the SMP03 to 100 MHz.
21. Set the correction frequency on the NRVS to 100 MHz.
R3267 Series Spectrum Analyzer Operation Manual (Vol.2)
1.2.8 Frequency Response
22. Adjust the output level on the SMP03 (using the data knob) so that the level of
the marker readout is -10 dBm±0.09 dB.
23. Record the reverse sign value of the power meter reading on the performance
check sheet.
24. Press FREQ and .
25. Increase the frequency on the SMP03 by one step.
26. Set the correction frequency of the NRVS to the entire frequency.
27. Repeat steps 22 through 26 up to the center frequency to 3.5 GHz.
Calculating the maximum deviation
28. Calculate the maximum deviation for each of the frequency bands, 100 Hz thru
3.5 GHz and 50 MHz thru 2.6 GHz, by subtracting the minimum value from the
maximum value and then dividing the difference by 2. Record the result on the
performance check sheet.
NOTE: Perform the measurement from step 29 onwards for the R3267 and R3273 only.
Measuring the frequency band 1
29. (For the R3267 only) Pr ess FREQ, more 1/2 and Preselector 1.6 G/3.6 G(1.6G).
30. Press FREQ, 1, ., 7 and GHz(R3267), FREQ, 3, ., 6 and GHz(R3273).
1-23
Page 34

R3267 Series Spectrum Analyzer Operation Manual (Vol.2)
1.2.8 Frequency Respons e
31. Set the frequency of the SMP03 to 1.7 GHz(R3267), 3.6 GHz(R3273).
32. Set the correction frequency on the NRVS t o 1.7 GHz(R32 67), 3.6 G Hz(R3273).
33. Press FREQ, more1/ 2, Pres el Tune and Auto Tune.
34. After the auto tuning is completed, ad just the outp ut level o n th e SMP03 ( using
the data knob) so that the level of the marker readout is -10 dBm±0.09 dB.
35. Record the reverse sign value of the power meter on the perf ormance check sheet.
36. Press FREQ and .
37. Increase the frequency on the SMP03 by one step.
38. Set the correction frequency of the NRVS to entire frequency.
39. Repeat steps 33 through 38 up to the following frequency.
R3267: 3.5 GHz
R3273: 7.4 GHz
Calculating the maximum deviation
40. Calculate the maximum deviation by subtracting the minimum value from the
maximum value on the performance check sheet and then divi ding the difference
by 2. Record the result on the performance check sheet.
Measuring the frequency band 2
41. Press FREQ, 3, ., 6 and GHz(R3267), FREQ, 7, ., 5 and GHz(R3273).
42. (For the R3273 only) Press CF Stepsize AUTO/MNL(MNL), 2, 0, 0 and MHz.
43. Set the frequency of the SMP03 to 3.6 GHz(R3267), 7.5 GHz(R3273).
44. (For the R3273 only) Set the frequency step size on the SMP03 to 200 MHz.
45. Set the correction frequency on the NRVS t o 3.6 GHz(R32 67), 7.5 G Hz(R3273).
46. Press FREQ, more1/ 2, Pres el Tune and Auto Tune.
47. After the auto tuning is completed, ad just the outp ut level o n th e SMP03 ( using
the data knob) so that the level of the marker readout is -10 dBm±0.09 dB.
48. Record the reverse sign value of the power meter on the perf ormance check sheet.
1-24
49. Press FREQ and .
50. Increase the frequency on the SMP03 by one step.
51. Set the correction frequency of the NRVS to entire frequency.
Page 35

52. Repeat steps 46 through 51 up to the following frequency.
R3267: 6.9 GHz
R3273: 15.3 GHz
Calculating the maximum deviation
53. Calculate the maximum deviation by subtracting the minimum value from the
maximum value on the performance check sheet and then divi ding the difference
by 2. Record the result on the performance check sheet.
Measuring the frequency band 3
54. Press FREQ, 7 and GHz(R3267), FREQ, 1, 5, ., 4 and GHz(R3273).
55. Set the frequency of the SMP03 to 7 GHz(R3267), 15.4 GHz(R3273).
56. Set the correction frequen c y o n th e NRVS t o 7 GHz (R3 26 7), 15.4 GH z(R 327 3).
57. Press FREQ, more1/ 2, Pres el Tune and Auto Tune.
R3267 Series Spectrum Analyzer Operation Manual (Vol.2)
1.2.8 Frequency Response
58. After the auto tuning is completed, ad just the outp ut level o n th e SMP03 ( using
the data knob) so that the level of the marker readout is -10 dBm±0.09 dB.
59. Record the reverse sign value of the power meter on the perf ormance check sheet.
60. Press FREQ and .
61. Increase the frequency on the SMP03 by one step.
62. Set the the correction frequency of the NRVS to entire frequency.
63. Repeat steps 57 through 62 up to the following frequency.
R3267: 7.9 GHz
R3273: 26.4 GHz
Calculating the maximum deviation
64. Calculate the maximum deviation by subtracting the minimum value from the
maximum value on the performance check sheet and then divi ding the difference
by 2. Record the result on the performance check sheet.
1-25
Page 36

R3267 Series Spectrum Analyzer Operation Manual (Vol.2)
1.2.9 Scale Fidelity
1.2.9 Scale Fidelity
This section explains how to check the display accuracy for 1 dB/div and 10 dB/div in the log scale and
x1 in the linear scale.
The function generator frequency reference source is supplied from the spectrum analyzer.
Specifications:
log scales
Less than ± 0.2 dB/1 dB
Less than ± 0.85 dB over 0 dB to 90 dB range
Linear scales
Less than ± 5% of Reference Level
Instruments Required
Instruments QTY Recommended Model
Function Generator 1 HP3325B
1 dB Step Attenuator 1 HP8494H
10 dB Step Attenuator 1 HP8495H
Attenuator Driver 1 HP11713A
RF Cable BNC(m)-BNC(m) 3 MI-09
Adapter BNC(f)-N(m) 3
Procedures :
Setup
1. Connect the signal generator and step attenuator as shown in Figure 1-8.
Figure 1-8 Setup for Measur i ng a Scale Fid elity
1-26
Page 37

Setting the function generator
2. Set the HP3325B controls as follows:
Frequency: 11 MHz
Output level: 0 dBm
3. Set the HP8494H and HP8495H to 0 dB using the HP11713A.
Initialization
4. Press SHIFT and CONFIG(PRESET).
Setting the measurement conditions
5. Press FREQ, 1, 1 and MHz.
6. Press SPAN and Zero Span.
7. Press LEVEL, 0, MHz(-dBm), dB/div and 1dB/div.
R3267 Series Spectrum Analyzer Operation Manual (Vol.2)
1.2.9 Scale Fidelity
8. Press COUPLE, RBW AUTO/MNL(MNL), 1 and MHz.
9. Press VBW AUTO/MNL(MNL), 1 and Hz.
10. Press MKR.
Measuring the 1 dB/div Scale fidelity
11. Adjust the output level on the HP3325B so that the marker readout is 0.00±0.1
dB.
12. Press A, View A, B, Write B, MKR, Delta Marker, RETURN and Trace
Marker Move.
13. Increase the attenuation of the HP8494H by 1 dB.
14. Press SINGLE.
15. Press SINGLE, after the sweeping has completed.
16. Record the level of the delta marker reading in the performance check sheet.
17. Calculate the incremental error according to the following formula.and recor d the
result on the performance check sheet.
Incremental error = (the level of the current delta marker reading) - (previous
delta marker level) + 1 dB
18. Repeat steps 13 through 17 for each output level setting listed on Table1-8.
1-27
Page 38

R3267 Series Spectrum Analyzer Operation Manual (Vol.2)
1.2.9 Scale Fidelity
Table 1-8 1 dB Step Scale Fidelity Setting
HP8494H output level
2 dB
3 dB
4 dB
5 dB
6 dB
7 dB
8 dB
9 dB
10 dB
Measuring the 10 dB/div scale fidelity
19. Adjust the HP8494H output level to 0 dB.
20. Press REPEAT.
21. Press LEVEL and 10 dB/div.
22. Press COUPLE, RBW AUTO/MNL(MNL), 3, kHz, A, Write A, B, Blank B,
MKR and Normal Marker.
23. On the HP3325B, adjust the amplitude until the marker reading 0.00 dBm
exactly.
24. Record the HP3325B setting level at the reference output level on the performance check sheet.
25. Press A, View A, B , Write B, MKR, Delta Marker, RETURN and Marke Trace
Move.
26. Adjust the HP8495H output level to 10 dB.
27. Press SINGLE.
28. Press SINGLE, after the averaging has completed.
29. Record the level of the delta marker reading on the performance check sheet.
30. Repeat steps 26 through 29 for each attenuation level setting listed o n T able 1 -9.
1-28
Page 39

Table 1-9 HP8495H and HP3325B Settings
HP8495H Setting
Measuring the linear scale fidelity
31. Set the HP8494H and HP8495H to 0 dB using the HP11713A.
R3267 Series Spectrum Analyzer Operation Manual (Vol.2)
1.2.9 Scale Fidelity
HP3325B Setting
(With reference to the
reference output level)
20 dB 0 dB
30 dB 0 dB
40 dB 0 dB
50 dB 0 dB
60 dB 0 dB
70 dB 0 dB
80 dB -10 dB
90 dB -20 dB
32. Set the HP3325B controls as follows:
Frequency: 11 MHz
Level: 0 dBm
33. Press SHIFT and CONFIG(PRESET).
34. Press FREQ, 1, 1 and MHz.
35. Press SPAN, 1, 0 and kHz.
36. Press ATT, ATT AUTO/MNL(MNL), 2, 0 and GHz(dB).
37. Press LEVEL, 0, GHz(+dBm), Linear and x1.
38. Press COUPLE, RBW AUTO/MNL(MNL), 1 and kHz.
39. Press VBW AUTO/MNL (MNL), 1 and kHz.
40. Press SRCH, Cont Peak ON/OFF(ON).
41. Adjust the output level on the HP3325B so that the trace peak is aligned with the
reference level.
42. Press SINGLE.
43. Record the setting level used in the HP3325B at the reference output level box
on the performance check sheet.
44. Reduce the output level on the HP3325B by 0.92 dB in relation to the reference
output level.
1-29
Page 40

R3267 Series Spectrum Analyzer Operation Manual (Vol.2)
1.2.9 Scale Fidelity
45. Press SINGLE.
46. Press SINGLE, after the averaging has completed.
47. Record the level of the maker reading on the performance check sheet.
48. Repeat steps 44 through 47 for each level setting listed on Table 1-10.
Table 1-10 Settings on the HP3325B in relation to the Reference
Output Level
HP3325B set level
-1.94 dB
-3.10 dB
-4.44 dB
-6.02 dB
-7.96 dB
-10.46 dB
-13.98 dB
-20 dB
1-30
Page 41

1.2.10 RBW Switching Uncertainty
This section explains how to check the RBW switching uncertainty using the calibration output. The
switching accuracy is calculated based on an RBW of 300 kHz.
Specification:
less than ± 0.3 dB 100 Hz to 5 MHz RBW setting : RBW 300 kHz reference
less than ± 1.0 dB 30 Hz RBW setting : RBW 300 kHz reference
Instruments Required
Accessories (BNC cable and adapter)
Procedures :
Initialization
1. Press SHIFT and CONFIG(PRESET).
R3267 Series Spectrum Analyzer Operation Manual (Vol.2)
1.2.10 RBW Switching Uncertainty
Connecting calibration signal
2. Connect the BNC cable from the CAL OUT connector to the INPUT connector.
3. Press SHIFT, 7(CAL), Cal Each Item and RBW Switching.
Setting the reference value (RBW = 300 kHz)
4. Press FREQ, 3, 0 and MHz.
5. Press SPAN, 1 and MHz.
6. Press LEVEL, 5, MHz(-dBm), dB/div, and 1 dB/div.
7. Press COUPLE, RBW AUTO/MNL(MNL), 3, 0, 0 and kHz.
8. Press SINGLE, SRCH and Cont Peak ON/OFF(ON).
9. Press MKR, Delta Marker and Fixed Mark er O N/OF F(ON).
Measurement the RBW switching uncertainty
10. Press COUP L E , RBW AUTO/MNL(MNL), 5 and MHz.
11. Press SPAN, 8 and MHz.
12. Press SINGLE.
13. After the sweeping has completed, record the level of the delta marker reading
on the performance check sheet.
1-31
Page 42

R3267 Series Spectrum Analyzer Operation Manual (Vol.2)
1.2.10 RBW Switching Uncertainty
14. Repeat steps 10 through 13 for each bandwidth and span frequency setting listed
on Table 1-11.
Table 1-11 RBW Switching Uncertainty Setting
RBW setting Frequency span
5 MHz 8 MHz
3 MHz 5 MHz
1 MHz 2 MHz
100 kHz 200 kHz
30 kHz 50 kHz
10 kHz 20 kHz
3 kHz 5 kHz
1 kHz 2 kHz
300 Hz 500 Hz
100 Hz 200 Hz
30 Hz 200 Hz
1-32
Page 43

1.2.11 RBW Accuracy and Selectivity
This section explains how to check a bandwidth of 3 dB and the selectivity. To calculate the selectivity, a
bandwidth of 60 dB is measured first and then the selectivity is calculated (Selectivity = 60 dB BW divided
by 3 dB BW).
Specifications:
Range
10 Hz to 10 MHz; 1, 3, 10 Sequence and 5 MHz
Accuracy
± 15% : 100 Hz, 300 Hz, 1 kHz, 3 kHz, 10 kHz, 30 kHz, 100 kHz, 300 kHz, 1 MHz
± 25% : 30 Hz, 3 MHz, 5 MHz Note: 30 Hz at 25 °C±10 °C
Selectivity
less than 15:1 (RBW = 100 Hz, 300 Hz, 1 kHz, 3 kHz, 10 kHz, 30 kHz, 100 kHz, 300 kHz, 1
MHz, 3 MHz, 5MHz)
less than 20:1 (RBW = 30 Hz)
Instruments Required
R3267 Series Spectrum Analyzer Operation Manual (Vol.2)
1.2.11 RBW Accuracy and Selectivity
Accessories (BNC cable and adapter)
Procedures:
Connecting calibration signal
1. Connect the BNC cable from the CAL OUT connector to the INPUT connector.
Initialization
2. Press SHIFT and CONFIG(PRESET).
Setting the measurement conditions
3. Press FREQ, 3, 0 and MHz.
4. Press LEVEL, 5, MHz(-dBm), dB/div and 1 dB/div.
5. Press A, Trace A Detector and Sample.
Measurement for accuracy of Resolution Bandwidth
6. Press SPAN, 1, 0 and MHz.
7. Press COUPLE, RBW AUTO/MNL(MNL), 5 and MHz.
8. Press SRCH.
9. Press MEAS, x dB Down and Continuous Down ON/OFF(ON).
1-33
Page 44
R3267 Series Spectrum Analyzer Operation Manual (Vol.2)
1.2.11 RBW Accuracy and Selectivity
10. Press SINGLE.
11. After sweep has completed, record the frequency of the marker reading on the
performance check sheet.
12. Repeat steps 10 and 11 for each frequency setting listed on Table 1-12.
Table 1-12 3 dB Band Width Setting
RBW setting Frequency span
3 MHz 5 MHz
1 MHz 2 MHz
300 kHz 500 kHz
100 kHz 200 kHz
30 kHz 50 kHz
10 kHz 20 kHz
3 kHz 5 kHz
1 kHz 2 kHz
300 Hz 500 Hz
100 Hz 200 Hz
30 Hz 200 Hz
Measuring the 60 dB bandwidth
13. Press SHIFT and CONFIG(PRESET).
14. Press FREQ, 3, 0 and MHz.
15. Press SPAN, 3, 0 and MHz.
16. Press COUPLE RBW AUTO/MNL(MNL), 5 and MHz.
17. Press VBW AUTO/MNL (MNL), 1, 0 and kHz.
18. Press A, Trace Detector and Sample.
19. Press SRCH.
20. Press MEAS, x dB Down, x dB Down, 6, 0, GHz(dB) and Continuous Down
ON/OFF(ON).
21. Press SINGLE.
22. Record the frequency of the marker reading on the performance check sheet.
1-34
Page 45

Calculation of the selectivity
23. For each set Resolution Bandwidth, calculate the selectivity using the following
formula. And record the result on the performance check sheet.
(Selectivity) = (60 dB Band Width) / (3 dB Band Width)
24. Repeat steps 15 through 23 for each frequency setting listed on Table 1-13.
Table 1-13 60 dB Band W idth Setting
R3267 Series Spectrum Analyzer Operation Manual (Vol.2)
1.2.11 RBW Accuracy and Selectivity
RBW setting Frequency span
3 MHz 25 MHz
1 MHz 20 MHz
300 kHz 5 MHz
100 kHz 1 MHz
30 kHz 500 kHz
10 kHz 200 kHz
3 kHz 50 kHz
1 kHz 20 kHz
300 Hz 5 kHz
100 Hz 2 kHz
30 Hz 1 kHz
1-35
Page 46

R3267 Series Spectrum Analyzer Operation Manual (Vol.2)
1.2.12 Noise Sidebands
1.2.12 Noise Sidebands
This section explains how to check noise sidebands for a signal of 1.5 GHz and 0 dBm with the offset of
1 kHz, 10 kHz, 100 kHz and 1 MHz.
Specifications:
R3264
Offset 9 kHz ≤ f ≤ 1 GHz 1 GHz< f ≤ 2.6 GHz 2. 6 GHz < f ≤ 3.5 GHz
1 kHz < -100 dBc/Hz < -100 dBc/Hz < -98 dBc/Hz
10 kHz < -113 dBc/Hz < -110 dBc/Hz < -108 dBc/Hz
100 kHz < -118 dBc/Hz < -118 dBc/Hz < -112 dBc/Hz
1 MHz < -135 dBc/Hz < -135 dBc/Hz < -135 dBc/Hz
R3267
Offset 100 Hz ≤ f ≤ 1 GHz 1 GHz< f ≤ 2.6 GHz 2.6 GHz < f ≤ 8 GHz
1 kHz < -100 dBc/Hz < -100 dBc/Hz < -98 dBc/Hz
10 kHz < -113 dBc/Hz < -110 dBc/Hz < -108 dBc/Hz
100 kHz < -118 dBc/Hz < -118 dBc/Hz < -112 dBc/Hz
1 MHz < -135 dBc/Hz < -135 dBc/Hz < -135 dBc/Hz
R3273
Offset 100 Hz ≤ f ≤ 1 GHz 1 GHz< f ≤ 2.6 GHz 2.6 GHz ≤ f < 7.5 GHz
1 kHz < -100 dBc/Hz < -100 dBc/Hz < -98 dBc/Hz
10 kHz < -113 dBc/Hz < -110 dBc/Hz < -108 dBc/Hz
100 kHz < -118 dBc/Hz < -118 dBc/Hz < -112 dBc/Hz
1 MHz < -135 dBc/Hz < -135 dBc/Hz < -135 dBc/Hz
Offset 7.4 GHz ≤ f < 15.4 GHz 15.2 GHz ≤ f < 26.5 GHz
1 kHz < -89 dBc/Hz < -83 dBc/Hz
10 kHz < -102 dBc/Hz < -96 dBc/Hz
100 kHz < -106 dBc/Hz < -100 dBc/Hz
1 MHz < -129 dBc/Hz < -123 dBc/Hz
1 kHz offset and 10 kHz offset : SPAN ≤ 150 kHz
100 kHz offset : 150 kHz < SPAN ≤ 2 MHz
1 MHz offset : SPAN > 2 MHz
1-36
Page 47

R3267 Series Spectrum Analyzer Operation Manual (Vol.2)
Instruments Required
Instruments QTY Recommended Model
Signal Generator 1 HP8663A
RF Cable SMA(m)-SMA(m) 1 A01002
RF Cable BNC(m)-BNC(m) 1 MI-09
Adapter N(m)-SMA(f) 2
Procedures:
Setup
1. Connect the signal generator as shown in Figure 1-9.
1.2.12 Noise Sidebands
Figure 1-9 Setup for Measurin g a Noise Sidebands
2. Set the HP8663A controls as follows:
Frequency: 1.5 GHz
Output level: - 5 dBm
Initialization
3. Press SHIFT and CONFIG(PRESET).
Setting measurement conditions
4. Press FREQ, 1, ., 5 and GHz.
5. Press SPAN, 2, 5, 0 and kHz.
Since the measurement is made for each of 1kHz, 10kHz, 100kHz and 1MHz offset frequency, set the frequency span to 2.5 times each offset frequency, or 2.5
kHz, 25 kHz, 250 kHz and 2.5 MHz. Keep other settings unchanged.
Measurement of Noise Sidebands
The following procedur e is used to measure noise s idebands with an offset of 1 00
kHz.
1-37
Page 48

R3267 Series Spectrum Analyzer Operation Manual (Vol.2)
1.2.12 Noise Sidebands
6. Press SRCH.
7. Press MKR → and Marker → Ref.
8. Press SRCH.
9. Press MEAS, Noise/Hz, dBc/Hz, 1, 0, 0 and kHz.
10. Press LEVEL,
and
.
11. Press A, Average A, 2, 0, and Hz(ENTR).
12. Record the level of the marker reading on th e perf orman ce check sh eet, after the
sweep has completed.
13. Press A, Write A, Level, 0, GHz(dBm), SHIFT and MKR(OFF).
14. Repeat steps 5 through 13 for each frequency setting listed on Table 1-14.
Table 1-14 Offset Setting at a Center Frequency of 1 GHz
Offset Frequency span
1 kHz 2.5 kHz
10 kHz 25 kHz
1000 kHz 2500 kHz
1-38
Page 49

1.2.13 Displayed Average Noise Level
This section explains how to check the displayed average nois e level o f the spectr um analyzer. Terminate
the spectrum analyzer input with a 50 Ω terminator to check the displayed average noise levels at 1 kHz,
10 kHz, 100 kHz, 1 MHz and the frequency at which the noise level is the maximum within the measurement bandwidth.
Specifications:
R3264:less than -100 dBm 10 kHz
less than -101 dBm 100 kHz
less than -125 dBm 1 MHz
less than -(130-2f) dBm 10 MHz to 3.5 GHz f: GHz
R3267: less than -90 dBm 1 kHz
less than -100 dBm 10 kHz
less than -101 dBm 100 kHz
less than -125 dBm 1 MHz
less than -(130-f) dBm 10 MHz to 3.5 GHz f: GHz
less than -125 dBm 3.5 GHz to 8 GHz
R3267 Series Spectrum Analyzer Operation Manual (Vol.2)
1.2.13 Displayed Average Noise Level
R3273: less than -90 dBm 1 kHz
less than -100 dBm 10 kHz
less than -101 dBm 100 kHz
less than -(130-f) dBm 10 MHz to 3.5 GHz f: GHz
less than -125 dBm 3.5 GHz to 7.5 GHz
less than -122 dBm 7.4 GHz to 15.4 GHz
less than -120 dBm 15.2 GHz to 22.0 GHz
less than -117 dBm 22.0 GHz to 26.5 GHz
RBW 100 Hz, VBW 1Hz, Input attenuator 0 dB settings
Instruments Required
Instruments QTY Recommended Model
50 Ω Terminator 1 RNA
Procedures:
Setup
1. Connect the RNA to the RF INPUT.
Initialization
2. Press SHIFT and CONFIG(PRESET).
NOTE: Skip to step 14 for the R3264.
Setting the measurement conditions
3. Press FREQ, 1 and kHz.
1-39
Page 50

R3267 Series Spectrum Analyzer Operation Manual (Vol.2)
1.2.13 Displayed Average Noise Level
4. Press SPAN and ZERO SPAN.
5. Press ATT, Min ATT ON/OFF(OFF), ATT AUTO/MNL(MNL), 0 and
GHz(dB).
6. Press LEVEL, 6, 0 and MHz(-dBm).
7. Press COUPLE, RBW AUTO/MNL(MNL), 3, 0 and Hz.
8. Press VBW AUTO/MNL(MNL), 1 and Hz.
9. Press SWP, Sweep Time Auto/MNL(MNL), 1 and MHz(sec).
Measurement the noise level, 100 Hz to 3.5 GHz Band
10. Press A, AVERAGE A, 1, 0 and Hz(ENTER).
11. Press SRCH, after the averaging has completed.
12. Record the level of the marker reading on the performance check sheet.
13. Press SHIFT and CONFIG(PRESET).
14. Press SPAN and ZERO SPAN.
15. Press ATT, Min ATT ON/OFF(OFF), ATT AUTO/MNL(MNL), 0 and
GHz(dB).
16. Press LEVEL, 6, 0 and MHz(-dBm).
17. Press COUPLE, RBW AUTO/MNL(MNL), 1, 0, 0 and Hz.
18. Press VBW AUTO/MNL(MNL), 1 and Hz.
19. Press SWP, Sweep Time AUTO/MNL(MNL), 1 and MHz(Sec).
20. Press A, Average A, 1, 0 and Hz(ENTR).
21. Press FREQ, 1, 0 and kHz.
22. Press SRCH, after the averaging has completed.
23. Record the level of the marker reading on the performance check sheet.
24. Repeat steps 21 through 23 for each frequency setting listed on Table 1-15.
1-40
Page 51

R3267 Series Spectrum Analyzer Operation Manual (Vol.2)
1.2.13 Displayed Average Noise Level
Table 1-15 Center Frequency Setting for Displayed Average Noise Level
Center frequency
100 kHz
1 MHz
10.1 MHz
101 MHz
501 MHz
1001 MHz
1.5 GHz
2.0 GHz
2.5 GHz
3.0 GHz
3.5 GHz
NOTE: Perform the measurement from step 25 onwards for the R3267 and R32 73 only.
25. Press SHIFT and CONFIG(PRESET).
26. Press FREQ, Start, 3, ., 5, 0, 1 and GHz.
27. Press Stop, 8 and GHz.
For the R3273, the stop frequency is set to 7.5 GHz.
28. Press ATT, Min ATT ON/OFF(OFF), ATT AUTO/MNL(MNL), 0 and
GHz(dB).
29. Press LEVEL, 4, 0 and GHz(-dBm).
30. Press COUPLE, RBW AUTO/MNL(MNL), 3 and MHz.
31. Press VBW AUTO/MNL (MNL), 1, 0, 0 and kHz.
32. Press A, AVERAGE A, 1, 0 and Hz(ENTER).
33. Press SRCH, after the averaging has completed.
34. Press MKR → and MKR → CF.
35. Press A and WRITE A.
36. Press SPAN and Zero Span.
37. Press LEVEL, 6, 0 and MHz(-dBm).
1-41
Page 52

R3267 Series Spectrum Analyzer Operation Manual (Vol.2)
1.2.13 Displayed Average Noise Level
38. Press COUPLE, RBW AUTO/MNL(MNL), 1, 0, 0 and Hz.
39. Press VBW AUTO/MNL (MNL), 1 and Hz.
40. Press SWP, Sweep Time AUTO/MNL(MNL), 1 and MHz(sec).
41. Press SINGLE.
42. Press SRCH, after the sweep has completed.
43. Record the level of the marker reading on the performance check sheet.
For R3273 only, Display Average noise level for remaining bands
44. Repeat steps 25 through 43 for each frequency setting listed on Table 1-16.
Table 1-16 Start and Stop Frequencies Setting
BAND Start frequency Stop frequency
7.5 GHz to 15.4 GHz 7.501 GHz 15.4 GHz
15.2 GHz to 22 GHz 15.201 GHz 22.0 GHz
22 GHz to 26.5 GHz 22.0 GHz 26.5 GHz
1-42
Page 53

1.2.14 Residual FM
This section explains how to check the residual FM of an internal local os cillator in Zero Span Mode. Connect a stable signal to the input and perform a slope detection in Zero Span Mode to measure the residual
FM. The residual FM is expressed as the product of the IF filter slope (Hz/dB) and the change in the measured signal amplitude.
Specifications:
less than 3 Hz × N
Instruments Required
Signal Generator 1 HP8663A
RF Cable SMA(m)-SMA(m) 1 A01002
RF Cable BNC(m)-BNC(m) 1 MI-09
Adapter N(m)-SMA(f) 2
R3267 Series Spectrum Analyzer Operation Manual (Vol.2)
/0.1 sec
P-P
Instruments QTY Recommended Model
1.2.14 Residual FM
Procedures :
Setup
1. Connect the signal generator as shown in Figure 1-10.
Figure 1-10 Setup for Measuring a Residual FM
Setting the signal generator
2. Set the HP8663A controls as follows:
Frequency: 2.5 GHz
Output level: -10 dBm
Initialization
3. Press SHIFT and CONFIG(PRESET).
1-43
Page 54

R3267 Series Spectrum Analyzer Operation Manual (Vol.2)
1.2.14 Residual FM
Setting the measurement conditions
Determining the IF filter slope
4. Press FREQ, 2, ., 5 and GHz.
5. Press SPAN, 1, 0, 0 and kHz.
6. Press SRCH.
7. Press MKR, more 1/2 and Signal Track ON/OFF(ON).
8. Press SPAN, 1 and kHz.
9. Press COUPLE, RBW AUTO/MNL(MNL), 3, 0 and Hz.
10. Press MKR and Signal Track ON/OFF (OFF).
11. Press LEVEL, 5, MHz(-dBm) , dB/div and 1 dB/div.
12. Press SPAN, 2, 0, 0 and Hz.
13. Press SRCH.
14. Press MKR → and MKR → REF.
15. Press SRCH.
16. Press MKR → and MKR → REF.
17. Press SINGLE.
18. Press MKR, more2/ 2, D e l t a Ma rk e r and Delta Marker ON/OFF (ON).
19. Rotate the data knob counter clockwise until the marker reads - 3 dB±0.1 dB.
20. Press MKR, Del ta Marker, Delta Mark er ON/OFF(ON) and rotate the data
knob counter clockwise until the marker reads -6 dB±0.1 dB.
21. Record the frequency and the level of the delta marker reading on the performance check sheet.
22. Calculate the Slope using the follo wing for mula and record the res ult on the performance check sheet.
1-44
Slope =
(the frequency of the delta marker reading)
(the level of the delta marker reading)
[Hz/dB]
Page 55

Measuring the Residual FM
23. Press SHIFT and MKR(OFF).
24. Press REPEAT.
25. Press SPAN and Zero Span.
26. Press COUPLE, VBW AUTO/MNL(MNL), 3, 0, 0 and Hz.
27. Press SWP, Sweep Time AUTO/MNL(MNL), 1, 0, 0 and kHz(ms).
28. Press FREQ and turn the data knob slowly counter-clockwise so that the trace
peak can be positioned to a level 6 divisions below the reference level.
29. Press SINGLE.
30. Press SRCH.
31. Press MKR, Delta Marker and Delta Marker ON/OFF(ON).
R3267 Series Spectrum Analyzer Operation Manual (Vol.2)
1.2.14 Residual FM
32. Press SRCH and Min Peak.
33. Record the level, ∆Level of the Delta Marker reading on the performance check
Calculation Residual FM
34. Calculate the residual FM using the following formula.
sheet.
Residual FM = Slope × ∆Level
[Hz] [Hz/dB] [dB]
1-45
Page 56

R3267 Series Spectrum Analyzer Operation Manual (Vol.2)
1.2.15 Residual Response
1.2.15 Residual Response
This section explains how to check the residual respo nse of a narrow frequency span and narrow reso lution
bandwidth using the display line. Connect a 50 Ω terminator to the spectrum analyzer input connector.
Specifications:
with no signal at input and 0 dB input attenuation
R3264
less than -100 dBm Range: 1 MHz to 3.5 GHz
less than - 90 dBm Range: 300 kHz to 3.5 GHz
R3267
less than -100 dBm Range: 1 MHz to 3.5 GHz
less than - 90 dBm Range: 300 kHz to 8 GHz
R3273
less than -100 dBm Range: 1 MHz to 3.5 GHz
less than - 90 dBm Range: 300 kHz to 26.5 GHz
Instruments Required
Instruments QTY Recommended Model
50 Ω Terminator 1 RNA
Procedures :
Initialization
1. Press SHIFT and CONFIG(PRESET).
Connecting calibration signal
2. Connect the BNC cable from the CAL OUT connector to the INPUT connector.
Checking the CALL OUT signal level
3. Press FREQ, 3, 0 and MHz.
4. press SPAN, 1, 0 and kHz.
5. Press LEVEL, 1, 0 and MHz(-dBm).
6. Press COUPLE, RBW AUTO/MNL(MNL), 3, 0, 0 and Hz.
7. Press ATT, Min ATT ON/OFF(OFF), ATT AUTO/MNL(MNL), 1, 0 and
GHz(dB).
1-46
8. press SRCH.
9. Check the marker level within -10.0dBm±0.3dB
Page 57

R3267 Series Spectrum Analyzer Operation Manual (Vol.2)
10. If the level is out of range, press SHIFT, 7(CAL) and Cal All.
Measurement the residual response on the 1 MHz to 3.5 GHz range
11. Connect the 50 Ω terminator to the input, after the calibration has completed.
12. Press FREQ, 1, ., 3 and MHz.
13. Press SPAN, 2 and MHz.
14. Press ATT, ATT AUTO/MNL(MNL), 0 and GHz(dB).
15. Press LEVEL, 5, 0 and MHz(-dBm).
16. Press COUPLE, RBW AUTO/MNL(MNL), 1, 0, and kHz.
17. Press VBW AUTO/MNL (MNL), 3, 0, 0 and Hz.
18. Press FREQ, CF St e p Si ze AUTO/MNL(MNL), 1, ., 9 and MHz.
1.2.15 Residual Response
19. Press FORMAT, Display Line ON/OFF(ON), 1, 0, 0 and MHz(-dBm).
20. Press SINGLE.
The noise level should be at least 3 dB below the display lin e. If is not, it will
necessary to reduce the Span and RBW setting to reduce the noise level. Set the
frequency step size to 95% or less of the frequency span.
21. If a residual is suspected, press SINGLE again. A residual response presist, but
a noise peak will not.
22. Record any frequency responses above the d isplay line on the perfor mance check
sheet.
23. If a response is marginal, verify the response amplitude as follows. If not, go to
step 34.
24. Press SHIFT, RCL(SAVE), 1 and Hz(ENTR).
25. Press REPEAT and MKR.
26. Move the marker to the trace peak using the data knob.
27. Press MKR → and MKR → CF.
28. Press COUPLE, RBW AUTO/MNL(MNL) and RBW AUTO/MNL(AUTO).
29. Press SPAN and to make the frequency span narrower until th e RBW is set
to 300 Hz.
30. Press SRCH.
1-47
Page 58

R3267 Series Spectrum Analyzer Operation Manual (Vol.2)
1.2.15 Residual Response
31. Press MKR → and MKR → CF.
32. Record any frequency responses above the d isplay line on the perfor mance check
sheet.
33. Press RCL, 1 and Hz(ENTR).
34. Press FREQ and .
35. Repeat steps 20 through 34 until a center frequency of 3.5 GHz is set.
NOTE: Perform the measurement from step 36 onwards for the R3267 and R3273 only.
Residual Response in a range between 3.5 GHz to 7.5 GHz
36. Press FREQ, 3, ., 5, 2, 5 and GHz.
37. Press SPAN, 5, 0 and MHz.
38. Press COUPLE, RBW AUTO/MNL(MNL), 3, 0, 0 and kHz.
39. Press VBW AUTO/MNL (MNL), 3, 0, 0 and Hz.
40. Press FREQ, CF St e p Si ze AUTO/MNL(MNL), 4, 7, ., 5 and MHz.
41. Press FORMAT, Display Line ON/OFF(ON), 9, 0 and MHz(-dBm).
42. Repeat steps 20 through 34 until a center frequency of 7.425 GHz is set.
1-48
Page 59

1.2.16 Gain Compression
This section explains how to check the gain compression. The gain compression is measured as follows:
two signals with a difference of 1 MHz are merged using a power splitter.
One of the two inputs is fixed at -30 dBm and the other input is gradually increased until the fixed input
has been reduced by 1 dB. When the fixed input has been reduced by 1 dB, the level of variable input is
referred to as the gain compression level.
Specifications:
R3264/67
less than -3 dBm(mixer input level): 10 MHz to 100 MHz
less than 0 dBm(mixer input level): >100 MHz
R3273
less than -3 dBm(mixer input level): 10 MHz to 100 MHz
less than 0 dBm(mixer input level): 100 MHz to 3.5 GHz
less than -10 dBm(mixer input level): 3.5 GHz to 7.5 GHz
less than -3 dBm(mixer input level): 7.5 GHz to 26.5 GHz
R3267 Series Spectrum Analyzer Operation Manual (Vol.2)
1.2.16 Gain Compression
Instruments Required
Instruments QTY Recommended Model
Signal Generator 1 SMP02
Signal Generator 1 SMP03
Power Meter and Power Sensor 1 NRVS / NRV-Z52
Power Splitter 1 1579
3 dB Attenuator 1 DEF-000685-1
10 dB Attenuator 1 DEE-000480-1
RF Cable SMA(m)-SMA(m) 3 A01002
Adapter N(m)-SMA(f) 4
Procedures :
Initializing the power meter and the sensor
1. Set the unit to dBm on the NRVS.
2. Perform the zeroing of the NRVS.
Setup
3. Connect the signal generators and the power sensor as shown in Figure 1-11.
1-49
Page 60

R3267 Series Spectrum Analyzer Operation Manual (Vol.2)
1.2.16 Gain Compression
Figure 1-11 Setup for the Gain Compression
Setting the signal generator
4. Set the SMP03 controls as follows:
Frequency: 11 MHz
Output level: -2 dBm
5. Set the SMP02 controls as follows:
Frequency: 10 MHz
Output level: -4 dBm
6. Set the correction frequency on the NRVS to 10.5 MHz.
Initialization
7. Press SHIFT and CONFIG(PRESET).
Measurement a center frequency of 10.5 MHz
8. Press FREQ, 1, 0, ., 5 and MHz.
9. Press SPAN, 2 and MHz.
10. Press ATT, ATT Min ON/OFF(OFF), ATT AUTO/MNL(MNL), 0 and
GHz(dB).
1-50
11. Press LEVEL, 3, 0, MHz(-dBm ), dB/div and 1 dB/div.
12. Turn off the output of the SMP03.
13. Press SRCH.
Page 61

R3267 Series Spectrum Analyzer Operation Manual (Vol.2)
14. Change the output leve l on t he SM P0 2 us ing th e dat a kno b t o adjus t the l evel on
the screen to -30±0.1 dBm.
15. Turn on the output level of the SMP03.
16. Turn the data knob on the SMP03 until the signal level at 5 div in the left hand
part on the R3267 Series screen is lowered by 1 dB from - 30 dBm.If the power
level knob cannot be turned any more, stop it here.
17. Disconnect the RF cable that is connected to the spectrum analyzer, and co nn ect
it to the power sensor.
18. Record the level of the power meter reading on the performance check sheet.
Measurement at a center frequency of 200.5 MHz
19. Set the SMP03, SMP02 and NRVS controls as follows:
SMP03: 200 MHz
SMP02: 201 MHz
Correction frequency(NRVS):200.5 MHz
1.2.16 Gain Compression
20. Press FREQ, 2, 0, 0, ., 5 and MHz.
21. Press SPAN, 2 and MHz.
22. Repeat steps 12 through 18.
NOTE: Perform the measurement from step 23 onwards for the R3267 and R3273 only.
Measurement at a center frequency of 3600.5 MHz
23. Set the SMP03, SMP02 and NRVS controls as follows:
SMP03: 3600 MHz
SMP02: 3601 MHz
Correction frequency(NRVS):3.6 GHz
24. Press FREQ, 3, 6, 0, 0, ., 5 and MHz.
25. Press SPAN, 2 and MHz.
26. Press LEVEL, 1, 0 and MHz(-dBm), dB/div and 10 dB/div.
27. Press SRCH.
28. Press FREQ, more 1/2, Presel Tune and AUTO Tune.
29. Repeat 11 through 18.
1-51
Page 62

R3267 Series Spectrum Analyzer Operation Manual (Vol.2)
1.2.16 Gain Compression
For R3273 only: Measurement at a center frequency of 7600.5 MHz
30. Set the SMP03, SMP02 and NRVS controls as follows:
SMP03: 7600 MHz
SMP02: 7601 MHz
Correction frequency(NRVS):7.6 GHz
31. Press FREQ, 7, 6, 0, 0, ., 5 and MHz.
32. Repeat steps 25 through 29.
1-52
Page 63

1.2.17 Second Harmonic Distortion
This section explains how to check the second harmonic distortion. The output of the sign al generator is
input to the spectrum analyzer through a low-pass filter, the second harmonic distortion frequency is set
to the spectrum analyzer center frequency , and then the second harmonic dist ortion is meas ured. Th e lowpass filter is used to eliminate any harmonic distortion originating at the signal source. The signal generator
frequency reference source is supplied from the spectrum analyzer.
Specifications:
R3264:
less than -70 dBc: 10 MHz to 3.5 GHz (-30 dBm mixer input level)
R3267:
less than -70 dBc: 10 MHz to 3.5 GHz (-30 dBm mixer input level)
less than -90 dBc: >1.6 MHz (-10 dBm mixer input level)
R3273:
less than -70 dBc: 10 MHz to 3.5 GHz (-30 dBm mixer input level)
less than -100 dBc: >3.5 GHz (-10 dBm mixer input level)
R3267 Series Spectrum Analyzer Operation Manual (Vol.2)
1.2.17 Second Harmonic Di stortion
Instruments Required
Instruments QTY Recommended Model
Signal Generator 1 SMP02
Power Meter and Power Sensor 1 NRVS / NRV-Z52
Power Splitter 1 1579
Low-pass Filter 1 DEE-001172-1
RF Cable SMA(m)-SMA(m) 3 A01002
RF Cable BNC(m)-BNC(m) 1 MI-09
Adapter N(m)-SMA(f) 5
Procedures :
Initializing the power meter and the sensor
1. Set the unit to dBm on the NRVS.
2. Perform the zeroing of the NRVS.
Setup
3. Connect the signal generator and the power sensor as shown in Figure 1-12.
1-53
Page 64

R3267 Series Spectrum Analyzer Operation Manual (Vol.2)
1.2.17 Second Harmonic Distortion
Figure 1-12 Setup for Measuring a Second Harmonics Distortion
Setting the signal generator
4. Set the SMP02 controls as follows:
Frequency: 1.5 GHz
Output level: 0 dBm
10 MHz Reference: External
Initialization
5. Press SHIFT and CONFIG(PRESET).
6. Set the correction frequency of the NRVS to 1.5 GHz.
Measurement 100 Hz to 3.5 GHz band
7. Press FREQ, 1, ., 5 and GHz.
8. Press SPAN, 1, 0 and kHz.
9. Press ATT, ATT AUTO/MNL(MNL), 2, 0 and GHz(dB).
10. Press LEVEL, 1, 0 and MHz(-dBm).
11. Press COUPLE, VBW AUTO/MNL(MNL), 3, 0 and Hz.
12. Adjust the output lev el of the SMP02 us i ng t he data kn ob s o that the level of the
power meter reading is -10 dBm ± 0.09 dB.
1-54
13. Press SINGLE.
14. Press SRCH, after the sweep has completed.
Page 65

R3267 Series Spectrum Analyzer Operation Manual (Vol.2)
1.2.17 Second Harmonic Di stortion
15. Press MKR, Delta Marker and F i xed Mark er ON/O F F (ON).
16. Press FREQ, 3 and GHz.
17. Press SINGLE.
18. Press SRCH, after the sweep has completed.
19. Record the level of the marker reading on the performance check sheet.
NOTE: Perform the measurement from step 20 onwards for the R3267 and R3273 only.
Measurement 3.6 GHz or more band
20. Remove the low-pass filter and connect the RF cable between the SMP02 and the
R3267/73.
21. Press SHIFT and CONFIG(PRESET).
22. Press FREQ, 3, ., 8 and GHz.
23. Press SPAN, 5, 0, 0 and kHz.
24. Set the SMP02 controls as follows:
Frequency: 3.8 GHz
Output level: -10 dBm
25. Press SRCH.
26. Press FREQ, more 1/2, Presel Tune and Auto Tune.
27. After the auto tuning has completed, set the SMP02 controls as follows:
Frequency: 1.9 GHz.
Output level: 0 dBm
28. Connect the signal generator and the power sensor as shown in Figure 1-11.
29. Set the correction frequency of the NRVS to 1.9 GHz.
30. Change the output level on the SMP02 using the data knob to adjust the power
meter value to 0 dBm±0.09 dB.
31. Press FREQ, 1, ., 9 and GHz.
32. Press SPAN, 1 and kHz.
33. Press SRCH.
34. Press MKR, Delta Marker and F ixed Marker ON/OFF(ON).
1-55
Page 66

R3267 Series Spectrum Analyzer Operation Manual (Vol.2)
1.2.17 Second Harmonic Distortion
35. Press FREQ, 3, ., 8 and GHz.
36. Press LEVEL, 4, 0 and MHz(-dBm).
37. Press A, Average A, 2, 0 and Hz(ENTR).
38. Press SRCH, after the averaging has completed.
39. Record the level of the delta marker reading on the performance check sheet.
1-56
Page 67

R3267 Series Spectrum Analyzer Operation Manual (Vol.2)
1.2.18 Third Order Intermodulation Distortion
This section explains how to ch eck t he th ir d or der i n t ermod ul at ion d i st or t ion whi ch occurs when two signals are input. Third order intermodulation distortion is reduced by 20 dB when the input signal is reduced
by 10 dB.
Specifications:
R3264:When the mixer input is -30 dBm.
less than -70dBc (less than -50dBc *1): 10MHz to 100MHz band
less than -80dBc (less than -60dBc *1): 100MHz to 1GHz band
less than -85dBc(less than -65dBc *1): 1GHz to 3.5GHz band
*1: Calculated value when the mixer input is -20 dBm.
R3267:When the mixer input is -30 dBm.
less than -70dBc (less than -50dBc *2): 10MHz to 100MHz band
less than -80dBc (less than -60dBc *2): 100MHz to 1.0GHz band
less than -85dBc(less than -65dBc *2): 1.0GHz to 3.5GHz band
less than -90dBc(less than -70dBc *2): 1.6GHz to 8.0GHz band *3
1.2.18 Third Order Intermodulation Distortion
*2: Calculated value when the mixer input is -20 dBm.
*3: When the preselector is used.
R3273:When the mixer input is -30 dBm.
less than -70dBc (less than -50dBc *4): 10MHz to 100MHz band
less than -80dBc (less than -60dBc *4): 100MHz to 1.0GHz band
less than -85dBc (less than -65dBc *4): 1.0GHz to 3.5GHz band
less than -70dBc (less than -50dBc *4): 3.5GHz to 7.5GHz band *5
less than -75dBc (less than -55dBc *4): 7.5GHz to 26.5GHz band *5
*4: Calculated value when the mixer input is -20 dBm.
*5: When the preselector is used.
Instruments Required
Instruments QTY Recommended Model
Signal Generator 1 SMP02
Signal Generator 1 SMP03
Power Meter and Power Sensor 1 NRVS / NRV-Z52
Power Divider 1 DDUL-20A-1000
Power Divider 1 DDUL-24M-10G
RF Cable SMA(m)-SMA(m) 3 A01002
Adapter N(m)-SMA(f) 5
Adapter SMA(f)-SMA(f) 1
1-57
Page 68

R3267 Series Spectrum Analyzer Operation Manual (Vol.2)
1.2.18 Third Order Intermodulation Distortion
Procedures :
Setting the power meter
1. Set the unit to dBm on the NRVS.
2. Perform the zeroing of the NRVS.
Setup
3. Connect the signal generators as shown in Figure 1-13.
1-58
Figure 1-13 Setup for Measuring a Third Order Intermodulation
Distortion
Setting the measurement conditions
4. Set the correction frequency to 20.5 MHz on the NRVS.
5. Set the frequency of the SMP02 to 20.5 MHz.
6. Set the frequency of the SMP03 to 20.6 MHz.
7. Turn off the RF output of the SMP02 a nd the SMP03.
Frequency measurement no using the preselector
8. Press SHIFT and CONFIG(PRESET).
9. Press FREQ, 2, 0, ., 5 and MHz.
Page 69

R3267 Series Spectrum Analyzer Operation Manual (Vol.2)
1.2.18 Third Order Intermodulation Distortion
10. Press SPAN, 1 and MHz.
11. Press ATT, ATT AUTO/MNL(MNL), 1, 0 and GHz(dB).
12. Press LEVEL, 1, 0 and MHz(-dBm).
13. Press COUPLE, RBW AUTO/MNL(MNL), 3 and kHz.
14. Press VBW AUTO/MNL (MNL), 3, 0, 0 and Hz.
15. Connect the power sens or to t he o utpu t of th e po wer dev i der u sin g t he RF cable .
16. Turn on the SMP03 and adjust the level into a -10 dBm ± 0.1 dB reading on
power meter by the data knob of the SMP03.
17. Turn off the RF output of the SMP0 3.
18. Turn on the SMP02 and adjust the level into a -10 dBm ± 0.1 dB reading on
power meter by the data knob of the SMP02.
19. Turn on the RF output of the SMP03.
20. Disconnect the cable connected to the power sensor, and connect it to the spectrum analyzer input.
21. Press SINGLE.
22. Press SRCH, after the sweep has completed.
23. Press MKR →, MKR → REF and SINGLE.
24. Press SRCH, after the sweep has completed.
25. Press MKR and Delta Marker.
26. Third order intermo dulation di stortion app ear at two frequen cies: one is 100 kHz
higher the one input frequency, and the other is 100 kHz lower the other input.
Record one of the third order intermodulation distortion levels, whichever is
greater, on the performance check sheet.
27. Repeat Steps 4 through 26 for each frequency setting listed on Table 1-17.
Table 1-17 Third Order Intermodulation Distortion
SMP02 SMP03
105 MHz 105.1 MHz 105 MH z 300 Hz 105 MHz
1500 MHz 1500.1 MHz 1500 MHz 300 Hz 1.5 GHz
Center
Frequency
VBW NRVS
1-59
Page 70

R3267 Series Spectrum Analyzer Operation Manual (Vol.2)
1.2.18 Third Order Intermodulation Distortion
NOTE: Perform the measurement from step 28 onwards for the R3267 and R3273 only.
Frequency measurement using the preselector
28. Set the correction frequency to 3600 MHz on the NRVS.
29. Set the frequency of the SMP02 to 3600 MHz.
30. Set the frequency of the SMP03 to 3600.1 MHz.
31. Turn off the RF output of the SMP02 an d t he SMP03.
32. Press SHIFT and CONFIG(PRESET).
33. Press FREQ, 3, 6, 0, 0 and MHz.
34. Press SPAN, 1 and MHz.
35. Press ATT, ATT AUTO/MNL(MNL), 1, 0 and GHz(dB).
36. Press LEVEL, 1, 0 and MHz(-dBm).
37. Disconnect the RF cable that is conn ected to the power divider, and c onn ect it to
the spectrum analyzer.
38. Turn the SMP03 output on and set the output to -20 dBm.
39. Press SRCH.
40. Press FREQ, More 1/2, Presel Tune and AUTO Tune.
41. Press COUPLE, RBW AUTO/MNL(MNL), 3 and kHz.
42. Press VBW AUTO/MNL (MNL), 3 , 0, 0 and Hz.
43. Disconnect the RF cable that is connected to the spectrum analyzer, and co nn ect
it to the power sensor.
44. Changing the output l evel on the S MP03 us ing the data knob to adj ust the pow er
meter value to -10 dBm±0.1 dB.
45. Turn off the RF output of the SMP0 3.
1-60
46. Turn on the SMP02 and adjust the level into a -10 dBm ± 0.1 dB reading on
power meter by the data knob of the SMP02.
47. Turn on the RF output of the SMP03.
Page 71

R3267 Series Spectrum Analyzer Operation Manual (Vol.2)
1.2.18 Third Order Intermodulation Distortion
48. Disconnect the cable connected to the power sensor, and connect it to the spectrum analyzer input.
49. Press SINGLE.
50. Press SRCH, after the sweep has completed.
51. Press MKR →, MKR → REF and SINGLE.
52. Press SRCH, after the sweep has completed.
53. Press MKR and Delta Marker.
54. Third order intermo dulation di stortion app ear at two frequen cies: one is 100 kHz
higher the one input frequency, and the other is 100 kHz lower the other input.
Record one of the third order intermodulation distortion levels, whichever is
greater, on the performance check sheet.
55. Repeat Steps 28 through 54 for each frequency setting listed on Table 1-18.
Table 1-18 Third Order Intermodulation Distortion
(When the Preselector is Used)
SMP02 SMP03 Center
VBW NRVS
Remarks
Frequency
2000 MHz 2000.1 MHz 2000 MHz 300 Hz 2.00 GHz R3267 only
8000 MHz 8000.1 MHz 8000 MHz 300 Hz 8.00 GHz R3273 only
1-61
Page 72

R3267 Series Spectrum Analyzer Operation Manual (Vol.2)
1.2.19 Image, Multiple and Out of Band Responses (For the R3267/73)
1.2.19 Image, Multiple and Out of Band Responses (For the R3267/73)
This section explains how to check the image, multiple and out of band responses for each band.
Specifications:
R3267:
less than -70 dBc 10 MHz to 8 GHz Band
R3273:
less than -70 dBc 10 MHz to 18 GHz Band
less than -60 dBc 10 MHz to 23 GHz Band
less than -50 dBc 10 MHz to 26.5 GHz Band
Instruments Required
Instruments QTY Recommended Model
Signal Generator 1 SMP03
Power Meter and Power Sensor 1 NRVS / NRV-Z52
Power Splitter 1 1579
RF Cable SMA(m) - SMA(m) 2 A01002
Adapter N(m)-SMA(f) 4
Procedures :
Initializing the power meter and the sensor
1. Set the unit to dBm on the NRVS.
2. Perform the zeroing of the NRVS.
Setup
3. Connect the signal generator and the power sensor as shown in Figure 1-14.
1-62
Figure 1-14 Setup for Measuring a Image, Multiple, Out of Band
Page 73

1.2.19 Image, Multiple and Out of Band Responses (For the R3267/73)
Setting the signal generator
4. Set the SMP03 controls as follows:
Frequency: 2 GHz
Output level: 0 dBm
Initialization
5. Press SHIFT and CONFIG(PRESET).
Setting the measurement conditions
6. Press FREQ, 2 and GHz.
7. Press SPAN, 5 and MHz.
8. Press COUPLE, RBW AUTO/MNL(MNL), 1, 0, 0 and kHz.
9. Press VBW AUTO/MNL(MNL), 3, 0, 0 and Hz.
R3267 Series Spectrum Analyzer Operation Manual (Vol.2)
10. Set the correction frequency of the NRVS to 2 GHz.
11. Adjust the output lev el of the SMP03 us i ng t he data kn ob s o that the level of the
power meter reading is 0.0 dBm±0.1 dB.
12. Press SINGLE.
13. Press SRCH, after the sweep has completed.
14. Press MKR, Delta Marker and F ixed Marker ON/OFF(ON).
Measurement in the range of 100 Hz to 3.6 GHz band
15. Press REPEAT.
16. Set the SMP03 controls as follows:
Frequency: 1957.159 MHz
17. Set the correction frequency of the NRVS to 1.96 GHz.
18. Adjust the output lev el of the SMP03 us i ng t he data kn ob s o that the level of the
power meter reading is 0.0 dBm ± 0.1 dB.
19. Press SINGLE.
20. Press SRCH, after the sweep has completed.
21. Record the level of the Delta marker reading on the performance check sheet.
22. Repeat steps 15 through 21 for each frequency setting listed on Table 1-19.
1-63
Page 74

R3267 Series Spectrum Analyzer Operation Manual (Vol.2)
1.2.19 Image, Multiple and Out of Band Responses (For the R3267/73)
Table 1-19 Image, Multiple, Out of Band Setting
(Center Frequency: 2 GHz)
BAND Signal generator
100 Hz to 3.6 GHz 1157.159 MHz 1.16 GHz
10462.841 MHz 10.46 GHz
8231.4205 MHz 8.23 GHz
For the R3273 only, Measurement in the range of 3.5 GHz to 7.5 GHz band
Measurement at 5.5 GHz
23. Press FREQ, 5, ., 5 and GHz.
24. Set the frequency of the SMP03 to 5.5 GHz.
25. Set the correction frequency on the NRVS to 5.5 GHz.
26. Adjust the output lev el of the SMP03 us i ng t he data kn ob s o that the level of the
power meter reading is 0.0 dBm ± 0.1 dB.
27. Press REPEAT.
28. Press SHIFT and MKR(OFF).
Correction Frequency of
NRVS
29. Press SRCH, FREQ, more 1/2, Presel Tune and AUTO Tune.
30. Press SINGLE, SRCH, MKR, Delta Marker and Fixed Marker O N/OFF(ON).
31. Repeat steps 15 through 21 for each frequency setting listed on Table 1-20.
1-64
Page 75

R3267 Series Spectrum Analyzer Operation Manual (Vol.2)
1.2.19 Image, Multiple and Out of Band Responses (For the R3267/73)
Table 1-20 Image, Multiple, Out of Band Setting for the R3273
BAND Center Frequency SMP03 Frequency
3.5 GHz to 7.5 GHz 5.5 GHz 6342.841 MHz 6.34 GHz
5.5 GHz 11421.421 MHz 11.4 GHz
5.5 GHz 17342.841 MHz 17.3 GHz
5.5 GHz 23267.262 MHz 23.3 GHz
7.4 GHz to 15.4 GHz 12.0 GHz 12842.841 MHz 12.8 GHz
12.0 GHz 5789.29 MHz 5.79 GHz
12.0 GHz 18210.71 MHz 18.2 GHz
12.0 GHz 24421.421 MHz 24.4 GHz
15.2 GHz to 23.3 GHz 21.0 GHz 21842.841 MHz 21.8 GHz
21.0 GHz 6719.053 MHz 6.72 GHz
21.0 GHz 13859.527 MHz 13.9 GHz
23 GHz to 26.5 GHz 24.4 GHz 25242.841 MHz 25.2 GHz
24.4 GHz 5783.935 MHz 5.78 GHz
24.4 GHz 11989.29 MHz 12.0 GHz
24.4 GHz 18194.645 MHz 18.2 GHz
For the R3273 only, Measurement in the range of 7.4 GHz to 15.4 GHz band
Correction Frequency of
NRVS
Measurement at 12 GHz
32. Press FREQ, 1, 2 and GHz.
33. Set the frequency of the SM03 to 12 GHz.
34. Set the correction frequency of the NRVS to 12 GHz.
35. Repeat steps 26 through 31 for each frequency setting listed on Table 1-20.
For the R3273 only, Measurement in the range of 15.2 GHz to 23.3 GHz band
Measurement at 21 GHz
36. Press FREQ, 2, 1 and GHz.
37. Set the frequency of the SM03 to 21 GHz.
38. Set the correction frequency of the NRVS to 21 GHz.
39. Repeat steps 26 through 31 for each frequency setting listed on Table 1-20.
1-65
Page 76

R3267 Series Spectrum Analyzer Operation Manual (Vol.2)
1.2.19 Image, Multiple and Out of Band Responses (For the R3267/73)
For the R3273 only, Measurement in the range of 23 GHz to 26.5 GHz band
Measurement at 24.4 GHz
40. Press FREQ, 2, 4, ., 4 and GHz.
41. Set the frequency of the SM03 to 24.4 GHz.
42. Set the correction frequency of the NRVS to 24.4 GHz.
43. Repeat steps 26 through 31 for each frequency setting listed on Table 1-20.
For the R3267 only, Measurement in the range of 3.5 GHz to 8 GHz band
Measurement at 7 GHz
44. Press FREQ, 7 and GHz.
45. Set the frequency of the SM03 to 7 GHz.
46. Set the correction frequency of the NRVS to 7 GHz.
47. Adjust the output lev el of the SMP03 us i ng t he data kn ob s o that the level of the
power meter reading is 0.0 dBm ± 0.1 dB.
48. Press REPEAT.
49. Press SHIFT and MKR(OFF).
50. Press SRCH, FREQ, more 1/2, Presel Tune and AUTO Tune.
51. Press SINGLE, SRCH, MKR, Delta Marker and Fixed Marker O N/OFF(ON).
52. Set the frequency of the SMP03 and NRVS to the following Table 1-21 and
repeat steps 15 through 21.
Table 1-21 Image, Multiple, Out of Band Setting for the R3267
BAND Center Frequency SMP03 Frequency
3.5 GHz to 8 GHz 7.0 GHz 7842.841 MHz 7.84 GHz
8.0 GHz 4632.131 MHz 4.63 GHz
8.0 GHz 3789.29 MHz 3.79 GHz
Correction Frequency of
NRVS
1-66
Measurement at 8 GHz
53. Press FREQ, 8 and GHz.
54. Set the frequency of the SM03 to 8 GHz.
Page 77

R3267 Series Spectrum Analyzer Operation Manual (Vol.2)
1.2.19 Image, Multiple and Out of Band Responses (For the R3267/73)
55. Set the correction frequency of the NRVS to 8 GHz.
56. Repeat Steps 47 through 52 for each frequency setting listed on Table 1-21.
1-67
Page 78

R3267 Series Spectrum Analyzer Operation Manual (Vol.2)
1.2.20 Sweep Time Accuracy
1.2.20 Sweep Time Accuracy
This section explains how to check sweep time a ccuracy, measurin g a square wave in time domain in Zero
Span Mode.
Specifications:
Less than or equal ± 3% of sweep time setting : Span = 0
Instruments Required
Instruments QTY Recommended Model
Function Generator 1 HP3325B
RF Cable BNC(m)-BNC(m) 1 MI-09
Adapter N-BNC 1
Procedures:
Setup
1. Connect the function generator as shown in Figure 1-15.
Figure 1-15 Setup for Measuring a Sweep Time Accuracy
Setting the measurement conditions
2. Set the HP3325B controls as follows:
Frequency: 550 kHz
Output level: -10 dBm
Waveform: SQUARE
Initialization
1-68
3. Press SHIFT and CONFIG(PRESET).
4. Press FREQ, 0 and MHz.
Page 79

R3267 Series Spectrum Analyzer Operation Manual (Vol.2)
1.2.20 Sweep Time Accuracy
5. Press SPAN and Zero Span.
6. Press COUPLE, RBW AUTO/MNL(MNL), 1, 0 and MHz.
7. Press VBW AUTO/MNL(MNL),1,0 and MHz.
8. Press LEVEL, dB/Div and 2dB/Div.
9. Press SWP, Trigger Setup.
10. Select Source:VIDEO using the data knob.
11. Press the data knob.
12. Press
.
13. Turn the data knob slowly to adjust the Trigger Level.
14. Press the data knob.
15. Press SWP and Sweep Time AUTO/MNL(NML).
16. Set the output frequency on the HP3325B to 550 kHz.
17. Press SWP, 2 and Hz(µµµµs).
18. Press TriggerDelay, 0 and Hz(µµµµs).
19. Turn the data knob counter-clockwise until two leading edges appear on the
screen.
20. Press Single.
21. Press Single, after the sweep has completed.
22. Press MKR, after the sweep has completed.
23. Move the marker to the first leading edge using the data knob.
24. Press MKR and Delta Marker.
25. Move the marker to the second leading edge using the data knob.
26. Record the marker readout on the performance check sheet.
27. Press MKR and Marker OFF.
28. Press REPEAT.
29. Repeat steps 16 through 28 for each frequency setting listed on Table 1-22.
1-69
Page 80

R3267 Series Spectrum Analyzer Operation Manual (Vol.2)
1.2.20 Sweep Time Accuracy
Table 1-22 Sweep Time Setting
Function Generator Sweep Time Setting
550 kHz 2 µs
220 kHz 5 µs
110 kHz 10 µs
55 kHz 20 µs
22 kHz 50 µs
11 kHz 100 µs
5.5 kHz 200 µs
2.2 kHz 500 µs
1.1 kHz 1 ms
550 Hz 2 ms
220 Hz 5 ms
110 Hz 10 ms
55 Hz 20 ms
22 Hz 50 ms
11 Hz 100 ms
5.5 Hz 200 ms
2.2 Hz 500 ms
1.1 Hz 1 s
0.55 Hz 2 s
0.22 Hz 5 s
0.11 Hz 10 s
0.055 Hz 20 s
0.022 Hz 50 s
0.011 Hz 100 s
1-70
Page 81

R3267 Series Spectrum Analyzer Operation Manual (Vol.2)
1.3 Performance Check Sheet
1.3 Performance Check Sheet
1.3.1 Frequency Reference Output Accuracy
Setting Spec.(min.) Hz Spec.(max.) Hz Measured value Hz Remarks
30 MHz 29,999,997 30,000,003
1 GHz 999,999,920 1,000,000,080 OPT21
1 GHz 999,999,980 1,000,000,020 OPT22
1 GHz 999,999,995 1,000,000,005 OPT23
1.3.2 Frequency Readout Accuracy and Frequency Counter Marker
(1) Frequency Readout Accuracy
Setting
Frequency
Span
1 MHz 2 GHz 2 GHz
10 MHz 2 GHz 2 GHz
20 MHz 2 GHz 2 GHz
50 MHz 2 GHz 2 GHz
100 MHz 2 GHz 2 GHz
2 GHz 2 GHz 2 GHz
1 MHz 5 GHz 5 GHz
10 MHz 5 GHz 5 GHz
20 MHz 5 GHz 5 GHz
50 MHz 5 GHz 5 GHz
100 MHz 5 GHz 5 GHz
2 GHz 5 GHz 5 GHz
1 MHz 11 GHz 11 GHz
10 MHz 11 GHz 11 GHz
20 MHz 11 GHz 11 GHz
50 MHz 11 GHz 11 GHz
100 MHz 11 GHz 11 GHz
2 GHz 11 GHz 11 GHz
1 MHz 18 GHz 18 GHz
10 MHz 18 GHz 18 GHz
20 MHz 18 GHz 18 GHz
50 MHz 18 GHz 18 GHz
100 MHz 18 GHz 18 GHz
2 GHz 18 GHz 18 GHz
Center
Frequency
SMP03
Frequency
Spec.(min.)
GHz
Spec.(max.)
GHz
1.999989 2.000011
1.99989 2.00011
1.99976 2.00024
1.99946 2.00054
1.9989 2.0011
1.980 2.020
4.999989 5.000011
4.99989 5.00011
4.99976 5.00024
4.99946 5.00054
4.9989 5.0011
4.980 5.020
10.999989 11.000011
10.99989 11.00011
10.99976 11.00024
10.99946 11.00054
10.9989 11.0011
10.980 11.020
17.999989 18.000011
17.99989 18.00011
17.99976 18.00024
17.99946 18.00054
17.9989 18.0011
17.980 18.020
Measuring
GHz
Remarks
R3267/73
R3267/73
R3267/73
R3267/73
R3267/73
R3267/73
R3273 only
R3273 only
R3273 only
R3273 only
R3273 only
R3273 only
R3273 only
R3273 only
R3273 only
R3273 only
R3273 only
R3273 only
(2) Frequency Counter Marker Accuracy
Setting Spec.(min.) GHz Spec.(max.) GHz Measured value GHz Remarks
2 GHz
5 GHz
11 GHz
18 GHz
1.999999994 2.000000006
4.999999994 5.000000006
10.999999989 11.000000011
17.999999979 18.000000021
R3267/73
R3273 only
R3273 only
1-71
Page 82

R3267 Series Spectrum Analyzer Operation Manual (Vol.2)
1.3.3 Frequency Span Accuracy
1.3.3 Frequency Span Accuracy
(1) R3264/67/73
Setting
Frequency Span Center Frequenc y
20 kHz
50 kHz
400 kHz
2 MHz
5 MHz
10 MHz
20 MHz
50 MHz
100 MHz
200 MHz
500 MHz
1 GHz
2 GHz
2 GHz
2 GHz
2 GHz
2 GHz
2 GHz
2 GHz
2 GHz
2 GHz
2 GHz
2 GHz
2 GHz
2 GHz
2 GHz
(2) R3267/73
Setting
Frequency Span Center Frequenc y
4 GHz
8 GHz
4 GHz
4 GHz
Spec.(min.) Spec.(max.)
15.84 kHz 16.16 kHz kHz
39.6 kHz 40.4 kHz kHz
316.8 kHz 323.2 kHz kHz
1.584 MHz 1.616 MHz MHz
3.96 MHz 4.04 MHz MHz
7.92 MHz 8.08 MHz MHz
15.84 MHz 16.16 MHz MHz
39.6 MHz 40.4 MHz MHz
79.2 MHz 80.8 MHz MHz
158.4 MHz 161.6 MHz MHz
396 MHz 404 MHz MHz
792 MHz 808 MHz MHz
1.584 GHz 1.616 GHz GHz
Spec.(min.) Spec.(max.)
3.168 GHz 3.232 GHz GHz
6.336 GHz 6.464 GHz GHz
Measured
value
Measured
value
Remarks
Remarks
1-72
(3) R3273
Setting
Frequency Span Center Frequenc y
10 MHz
100 MHz
1 GHz
2 GHz
10 MHz
100 MHz
1 GHz
2 GHz
5 GHz
10 GHz
19 GHz
10 GHz
10 GHz
10 GHz
10 GHz
17 GHz
17 GHz
17 GHz
17 GHz
10 GHz
10 GHz
10 GHz
Spec.(min.) Spec.(max.)
7.92 MHz 8.08 MHz MHz
79.2 MHz 80.8 MHz MHz
792 MHz 808 MHz MHz
1.584 GHz 1.616 GHz GHz
7.92 MHz 8.08 MHz MHz
79.2 MHz 80.8 MHz MHz
792 MHz 808 MHz MHz
1.584 GHz 1.616 GHz GHz
3.96 GHz 4.04 GHz GHz
7.92 GHz 8.08 GHz GHz
15.048 GHz 15.352 GHz GHz
Measured
value
Remarks
Page 83

1.3.4 Calibration Amplitude Accuracy
Setting Spec.(min.) Spec.(max.) Measured value Remarks
-10 dBm - 10.3 dBm - 9.7 d Bm dBm
1.3.5 IF Gain Uncertainty
(1) RBW: 1 MHz
R3267 Series Spectrum Analyzer Operation Manual (Vol.2)
1.3.4 Calibration Amplitude Accuracy
Reference Level Spec.(mi n. ) Spec.(max.) Measured value Remarks
-1 dBm -0.5 dB +0.5 dB dB
-2 dBm -0.5 dB +0.5 dB dB
-3 dBm -0.5 dB +0.5 dB dB
-4 dBm -0.5 dB +0.5 dB dB
-5 dBm -0.5 dB +0.5 dB dB
-6 dBm -0.5 dB +0.5 dB dB
-7 dBm -0.5 dB +0.5 dB dB
-8 dBm -0.5 dB +0.5 dB dB
-9 dBm -0.5 dB +0.5 dB dB
-10 dBm -0.5 dB +0.5 dB dB
-20 dBm -0.5 dB +0.5 dB dB
-30 dBm -0.5 dB +0.5 dB dB
-40 dBm -0.5 dB +0.5 dB dB
-50 dBm -0.5 dB +0.5 dB dB
-60 dBm -0.7 dB +0.7 dB dB
-70 dBm -0.7 dB +0.7 dB dB
Reference value dBm
1-73
Page 84

R3267 Series Spectrum Analyzer Operation Manual (Vol.2)
1.3.5 IF Gain Uncertainty
(2) RBW: 3 kHz
Reference Level Spec.(mi n. ) Spec.(max.) Measured value Remarks
-1 dBm -0.5 dB +0.5 dB dB
-2 dBm -0.5 dB +0.5 dB dB
-3 dBm -0.5 dB +0.5 dB dB
-4 dBm -0.5 dB +0.5 dB dB
-5 dBm -0.5 dB +0.5 dB dB
-6 dBm -0.5 dB +0.5 dB dB
-7 dBm -0.5 dB +0.5 dB dB
-8 dBm -0.5 dB +0.5 dB dB
-9 dBm -0.5 dB +0.5 dB dB
-10 dBm -0.5 dB +0.5 dB dB
-20 dBm -0.5 dB +0.5 dB dB
-30 dBm -0.5 dB +0.5 dB dB
-40 dBm -0.5 dB +0.5 dB dB
-50 dBm -0.5 dB +0.5 dB dB
-60 dBm -0.7 dB +0.7 dB dB
-70 dBm -0.7 dB +0.7 dB dB
-80 dBm -0.7 dB +0.7 dB dB
Reference value dBm
(3) RBW: 300 kHz
Reference Level Spec.(mi n. ) Spec.(max.) Measured value Remarks
-1 dBm -0.5 dB +0.5 dB dB
-2 dBm -0.5 dB +0.5 dB dB
-3 dBm -0.5 dB +0.5 dB dB
-4 dBm -0.5 dB +0.5 dB dB
-5 dBm -0.5 dB +0.5 dB dB
-6 dBm -0.5 dB +0.5 dB dB
-7 dBm -0.5 dB +0.5 dB dB
-8 dBm -0.5 dB +0.5 dB dB
-9 dBm -0.5 dB +0.5 dB dB
-10 dBm -0.5 dB +0.5 dB dB
-20 dBm -0.5 dB +0.5 dB dB
-20 dBm -0.5 dB +0.5 dB dB
-30 dBm -0.5 dB +0.5 dB dB
-40 dBm -0.5 dB +0.5 dB dB
-50 dBm -0.5 dB +0.5 dB dB
-60 dBm -0.7 dB +0.7 dB dB
-70 dBm -0.7 dB +0.7 dB dB
Reference value dBm
1-74
Page 85

1.3.6 Input Attenuator Accuracy
(1) R3264/67/73
Measurement a center frequency of 2 GHz for the R3264 or 4 GHz for the R3267/73, RBW 3 kHz
R3267 Series Spectrum Analyzer Operation Manual (Vol.2)
1.3.6 Input Attenuator Accuracy
Reference value dBm
Input
Attenuator
10 dB 0 0 0(Ref) Reference 0(Ref) 0
20 dB 10
30 dB 20
40 dB 30
50 dB 40
60 dB 50
70 dB 60
IF Gain
(dB)
IF Gain
Uncertainty
(dB)
Switching Accuracy Step-to-Step Accuracy Remarks
Spec.
(dB)
±
2
±
2
±
2
±
2
±
2
±
2
Actual value
(dB)
Spec.
(dB)
±
1.1
±
1.1
±
1.1
±
1.1
±
1.1
±
1.1
(2) R3273
Measurement a center frequency of 15 GHz, RBW 3 kHz
Input
Attenuator
10 dB 0 0 0(Ref) Reference 0(Ref) 0
20 dB 10
30 dB 20
40 dB 30
50 dB 40
60 dB 50
70 dB 60
IF Gain
(dB)
IF Gain
Uncertainty
(dB)
Switching Accuracy Step-to-Step Accuracy Remarks
Spec.
(dB)
±
2.5
±
2.5
±
2.5
±
2.5
±
2.5
±
2.5
Measured
value
(dB)
Reference value dBm
Spec.
(dB)
±
1.3
±
1.3
±
1.3
±
1.3
±
1.3
±
1.3
Calculated
value
(dB)
Calculated
value
(dB)
Measurement a center frequency of 18 GHz, RBW 3 kHz
Input
Attenuator
10 dB 0 0 0(Ref) Reference 0(Ref) 0
20 dB 10
30 dB 20
40 dB 30
50 dB 40
60 dB 50
70 dB 60
IF Gain
(dB)
IF Gain
Uncertainty
(dB)
Switching Accuracy Step-to-Step Accuracy Remarks
Spec.
(dB)
±
3.5
±
3.5
±
3.5
±
3.5
±
3.5
±
3.5
Measured
value
(dB)
Reference value dBm
Spec.
(dB)
±
1.8
±
1.8
±
1.8
±
1.8
±
1.8
±
1.8
Calculated
value
(dB)
1-75
Page 86

R3267 Series Spectrum Analyzer Operation Manual (Vol.2)
1.3.7 Frequency Respons e
1.3.7 Frequency Response
(1) Frequency band 0 for the R3264/67
Setting Spec.(min.) Spec.(max.) Measured value Remarks
100 MHz -3.0 dB +3.0 dB
200 MHz -3.0 dB +3.0 dB
300 MHz -3.0 dB +3.0 dB
400 MHz -3.0 dB +3.0 dB
500 MHz -3.0 dB +3.0 dB
600 MHz -3.0 dB +3.0 dB
700 MHz -3.0 dB +3.0 dB
800 MHz -3.0 dB +3.0 dB
900 MHz -3.0 dB +3.0 dB
1000 MHz -3.0 dB +3.0 dB
1100 MHz -3.0 dB +3.0 dB
1200 MHz -3.0 dB +3.0 dB
1300 MHz -3.0 dB +3.0 dB
1400 MHz -3.0 dB +3.0 dB
1500 MHz -3.0 dB +3.0 dB
1600 MHz -3.0 dB +3.0 dB
1700 MHz -3.0 dB +3.0 dB
1800 MHz -3.0 dB +3.0 dB
1900 MHz -3.0 dB +3.0 dB
2000 MHz -3.0 dB +3.0 dB
2100 MHz -3.0 dB +3.0 dB
2200 MHz -3.0 dB +3.0 dB
2300 MHz -3.0 dB +3.0 dB
2400 MHz -3.0 dB +3.0 dB
2500 MHz -3.0 dB +3.0 dB
2600 MHz -3.0 dB +3.0 dB
2700 MHz -3.0 dB +3.0 dB
2800 MHz -3.0 dB +3.0 dB
2900 MHz -3.0 dB +3.0 dB
3000 MHz -3.0 dB +3.0 dB
3100 MHz -3.0 dB +3.0 dB
3200 MHz -3.0 dB +3.0 dB
3300 MHz -3.0 dB +3.0 dB
3400 MHz -3.0 dB +3.0 dB
3500 MHz -3.0 dB +3.0 dB
Max. deviation
9 kHz to 3.5 GHz
Max. deviation
100 Hz to 3.5 GHz
Max. deviation
50 MHz to 2.6 GHz
-1.5 dB +1.5 dB R3264 only
-1.5 dB +1.5 dB R3267 only
-1.0 dB +1.0 dB R3267 only
1-76
Page 87

R3267 Series Spectrum Analyzer Operation Manual (Vol.2)
1.3.7 Frequency Response
Frequency band 0 for the R3273
Setting Spec.(min.) Spec.(max.) Measured value Remarks
100 MHz -5.0 dB +5.0 dB
200 MHz -5.0 dB +5.0 dB
300 MHz -5.0 dB +5.0 dB
400 MHz -5.0 dB +5.0 dB
500 MHz -5.0 dB +5.0 dB
600 MHz -5.0 dB +5.0 dB
700 MHz -5.0 dB +5.0 dB
800 MHz -5.0 dB +5.0 dB
900 MHz -5.0 dB +5.0 dB
1000 MHz -5.0 dB +5.0 dB
1100 MHz -5.0 dB +5.0 dB
1200 MHz -5.0 dB +5.0 dB
1300 MHz -5.0 dB +5.0 dB
1400 MHz -5.0 dB +5.0 dB
1500 MHz -5.0 dB +5.0 dB
1600 MHz -5.0 dB +5.0 dB
1700 MHz -5.0 dB +5.0 dB
1800 MHz -5.0 dB +5.0 dB
1900 MHz -5.0 dB +5.0 dB
2000 MHz -5.0 dB +5.0 dB
2100 MHz -5.0 dB +5.0 dB
2200 MHz -5.0 dB +5.0 dB
2300 MHz -5.0 dB +5.0 dB
2400 MHz -5.0 dB +5.0 dB
2500 MHz -5.0 dB +5.0 dB
2600 MHz -5.0 dB +5.0 dB
2700 MHz -5.0 dB +5.0 dB
2800 MHz -5.0 dB +5.0 dB
2900 MHz -5.0 dB +5.0 dB
3000 MHz -5.0 dB +5.0 dB
3100 MHz -5.0 dB +5.0 dB
3200 MHz -5.0 dB +5.0 dB
3300 MHz -5.0 dB +5.0 dB
3400 MHz -5.0 dB +5.0 dB
3500 MHz -5.0 dB +5.0 dB
Max. deviation
100 Hz to 3.5 GHz
Max. deviation
50 MHz to 2.6 GHz
-1.5 dB +1.5 dB
-1.0 dB +1.0 dB
1-77
Page 88

R3267 Series Spectrum Analyzer Operation Manual (Vol.2)
1.3.7 Frequency Respons e
(2) Frequency band 1 for the R3267
Setting Spec.(min.) Spec.(max.) Measured value Remarks
1.7 GHz -3.0 dB +3.0 dB
1.8 GHz -3.0 dB +3.0 dB
1.9 GHz -3.0 dB +3.0 dB
2.0 GHz -3.0 dB +3.0 dB
2.1 GHz -3.0 dB +3.0 dB
2.2 GHz -3.0 dB +3.0 dB
2.3 GHz -3.0 dB +3.0 dB
2.4 GHz -3.0 dB +3.0 dB
2.5 GHz -3.0 dB +3.0 dB
2.6 GHz -3.0 dB +3.0 dB
2.7 GHz -3.0 dB +3.0 dB
2.8 GHz -3.0 dB +3.0 dB
2.9 GHz -3.0 dB +3.0 dB
3.0 GHz -3.0 dB +3.0 dB
3.1 GHz -3.0 dB +3.0 dB
3.2 GHz -3.0 dB +3.0 dB
3.3 GHz -3.0 dB +3.0 dB
3.4 GHz -3.0 dB +3.0 dB
3.5 GHz -3.0 dB +3.0 dB
Max. deviation
1.6 GHz to 3.5 GHz
-1.5 dB +1.5 dB
1-78
Page 89

R3267 Series Spectrum Analyzer Operation Manual (Vol.2)
1.3.7 Frequency Response
Frequency band 1 for the R3273
Setting Spec.(min.) Spec.(max.) Measured value Remarks
3.6 GHz -5.0 dB +5.0 dB
3.8 GHz -5.0 dB +5.0 dB
4.0 GHz -5.0 dB +5.0 dB
4.2 GHz -5.0 dB +5.0 dB
4.4 GHz -5.0 dB +5.0 dB
4.6 GHz -5.0 dB +5.0 dB
4.8 GHz -5.0 dB +5.0 dB
5.0 GHz -5.0 dB +5.0 dB
5.2 GHz -5.0 dB +5.0 dB
5.4 GHz -5.0 dB +5.0 dB
5.6 GHz -5.0 dB +5.0 dB
5.8 GHz -5.0 dB +5.0 dB
6.0 GHz -5.0 dB +5.0 dB
6.2 GHz -5.0 dB +5.0 dB
6.4 GHz -5.0 dB +5.0 dB
6.6 GHz -5.0 dB +5.0 dB
6.8 GHz -5.0 dB +5.0 dB
7.0 GHz -5.0 dB +5.0 dB
7.2 GHz -5.0 dB +5.0 dB
7.4 GHz -5.0 dB +5.0 dB
Max. deviation
3.5 GHz to 7.5 GHz
-1.5 dB +1.5 dB
1-79
Page 90

R3267 Series Spectrum Analyzer Operation Manual (Vol.2)
1.3.7 Frequency Respons e
(3) Frequency band 2 for the R3267
Setting Spec.(min.) Spec.(max.) Measured value Remarks
3.6 GHz -3.0 dB +3.0 dB
3.7 GHz -3.0 dB +3.0 dB
3.8 GHz -3.0 dB +3.0 dB
3.9 GHz -3.0 dB +3.0 dB
4.0 GHz -3.0 dB +3.0 dB
4.1 GHz -3.0 dB +3.0 dB
4.2 GHz -3.0 dB +3.0 dB
4.3 GHz -3.0 dB +3.0 dB
4.4 GHz -3.0 dB +3.0 dB
4.5 GHz -3.0 dB +3.0 dB
4.6 GHz -3.0 dB +3.0 dB
4.7 GHz -3.0 dB +3.0 dB
4.8 GHz -3.0 dB +3.0 dB
4.9 GHz -3.0 dB +3.0 dB
5.0 GHz -3.0 dB +3.0 dB
5.1 GHz -3.0 dB +3.0 dB
5.2 GHz -3.0 dB +3.0 dB
5.3 GHz -3.0 dB +3.0 dB
5.4 GHz -3.0 dB +3.0 dB
5.5 GHz -3.0 dB +3.0 dB
5.6 GHz -3.0 dB +3.0 dB
5.7 GHz -3.0 dB +3.0 dB
5.8 GHz -3.0 dB +3.0 dB
5.9 GHz -3.0 dB +3.0 dB
6.0 GHz -3.0 dB +3.0 dB
6.1 GHz -3.0 dB +3.0 dB
6.2 GHz -3.0 dB +3.0 dB
6.3 GHz -3.0 dB +3.0 dB
6.4 GHz -3.0 dB +3.0 dB
6.5 GHz -3.0 dB +3.0 dB
6.6 GHz -3.0 dB +3.0 dB
6.7 GHz -3.0 dB +3.0 dB
6.8 GHz -3.0 dB +3.0 dB
6.9 GHz -3.0 dB +3.0 dB
Max. deviation
3.5 GHz to 7.0 GHz
-1.5 dB +1.5 dB
1-80
Page 91

R3267 Series Spectrum Analyzer Operation Manual (Vol.2)
1.3.7 Frequency Response
Frequency band 2 for the R3273
Setting Spec.(min.) Spec.(max.) Measured value Remarks
7.5 GHz -5.0 dB +5.0 dB
7.7 GHz -5.0 dB +5.0 dB
7.9 GHz -5.0 dB +5.0 dB
8.1 GHz -5.0 dB +5.0 dB
8.3 GHz -5.0 dB +5.0 dB
8.5 GHz -5.0 dB +5.0 dB
8.7 GHz -5.0 dB +5.0 dB
8.9 GHz -5.0 dB +5.0 dB
9.1 GHz -5.0 dB +5.0 dB
9.3 GHz -5.0 dB +5.0 dB
9.5 GHz -5.0 dB +5.0 dB
9.7 GHz -5.0 dB +5.0 dB
9.9 GHz -5.0 dB +5.0 dB
10.1 GHz -5.0 dB +5.0 dB
10.3 GHz -5.0 dB +5.0 dB
10.5 GHz -5.0 dB +5.0 dB
10.7 GHz -5.0 dB +5.0 dB
10.9 GHz -5.0 dB +5.0 dB
11.1 GHz -5.0 dB +5.0 dB
11.3 GHz -5.0 dB +5.0 dB
11.5 GHz -5.0 dB +5.0 dB
11.7 GHz -5.0 dB +5.0 dB
11.9 GHz -5.0 dB +5.0 dB
12.1 GHz -5.0 dB +5.0 dB
12.3 GHz -5.0 dB +5.0 dB
12.5 GHz -5.0 dB +5.0 dB
12.7 GHz -5.0 dB +5.0 dB
12.9 GHz -5.0 dB +5.0 dB
13.1 GHz -5.0 dB +5.0 dB
13.3 GHz -5.0 dB +5.0 dB
13.5 GHz -5.0 dB +5.0 dB
13.7 GHz -5.0 dB +5.0 dB
13.9 GHz -5.0 dB +5.0 dB
14.1 GHz -5.0 dB +5.0 dB
14.3 GHz -5.0 dB +5.0 dB
14.5 GHz -5.0 dB +5.0 dB
14.7 GHz -5.0 dB +5.0 dB
14.9 GHz -5.0 dB +5.0 dB
15.1 GHz -5.0 dB +5.0 dB
15.3 GHz -5.0 dB +5.0 dB
Max. deviation
7.4 GHz to 15.4 GHz
-3.5 dB +3.5 dB
1-81
Page 92

R3267 Series Spectrum Analyzer Operation Manual (Vol.2)
1.3.7 Frequency Respons e
(4) Frequency band 3 for the R3267
Setting Spec.(min.) Spec.(max.) Measured value Remarks
7.0 GHz -3.0 dB +3.0 dB
7.1 GHz -3.0 dB +3.0 dB
7.2 GHz -3.0 dB +3.0 dB
7.3 GHz -3.0 dB +3.0 dB
7.4 GHz -3.0 dB +3.0 dB
7.5 GHz -3.0 dB +3.0 dB
7.6 GHz -3.0 dB +3.0 dB
7.7 GHz -3.0 dB +3.0 dB
7.8 GHz -3.0 dB +3.0 dB
7.9 GHz -3.0 dB +3.0 dB
Max. deviation
6.9 GHz to 8.0 GHz
-1.5 dB +1.5 dB
Frequency band 3 for the R3273
Setting Spec.(min.) Spec.(max.) Measured value Remarks
15.4 GHz -5.0 dB +5.0 dB
15.6 GHz -5.0 dB +5.0 dB
15.8 GHz -5.0 dB +5.0 dB
16.0 GHz -5.0 dB +5.0 dB
16.2 GHz -5.0 dB +5.0 dB
16.4 GHz -5.0 dB +5.0 dB
16.6 GHz -5.0 dB +5.0 dB
16.8 GHz -5.0 dB +5.0 dB
17.0 GHz -5.0 dB +5.0 dB
17.2 GHz -5.0 dB +5.0 dB
17.4 GHz -5.0 dB +5.0 dB
17.6 GHz -5.0 dB +5.0 dB
17.8 GHz -5.0 dB +5.0 dB
18.0 GHz -5.0 dB +5.0 dB
18.2 GHz -5.0 dB +5.0 dB
18.4 GHz -5.0 dB +5.0 dB
18.6 GHz -5.0 dB +5.0 dB
18.8 GHz -5.0 dB +5.0 dB
19.0 GHz -5.0 dB +5.0 dB
19.2 GHz -5.0 dB +5.0 dB
19.4 GHz -5.0 dB +5.0 dB
19.6 GHz -5.0 dB +5.0 dB
19.8 GHz -5.0 dB +5.0 dB
20.0 GHz -5.0 dB +5.0 dB
20.2 GHz -5.0 dB +5.0 dB
20.4 GHz -5.0 dB +5.0 dB
20.6 GHz -5.0 dB +5.0 dB
20.8 GHz -5.0 dB +5.0 dB
21.0 GHz -5.0 dB +5.0 dB
21.2 GHz -5.0 dB +5.0 dB
21.4 GHz -5.0 dB +5.0 dB
21.6 GHz -5.0 dB +5.0 dB
21.8 GHz -5.0 dB +5.0 dB
22.0 GHz -5.0 dB +5.0 dB
22.2 GHz -5.0 dB +5.0 dB
22.4 GHz -5.0 dB +5.0 dB
22.6 GHz -5.0 dB +5.0 dB
1-82
Page 93

22.8 GHz -5.0 dB +5.0 dB
23.0 GHz -5.0 dB +5.0 dB
23.2 GHz -5.0 dB +5.0 dB
23.4 GHz -5.0 dB +5.0 dB
23.6 GHz -5.0 dB +5.0 dB
23.8 GHz -5.0 dB +5.0 dB
24.0 GHz -5.0 dB +5.0 dB
24.2 GHz -5.0 dB +5.0 dB
24.4 GHz -5.0 dB +5.0 dB
24.6 GHz -5.0 dB +5.0 dB
24.8 GHz -5.0 dB +5.0 dB
25.0 GHz -5.0 dB +5.0 dB
25.2 GHz -5.0 dB +5.0 dB
25.4 GHz -5.0 dB +5.0 dB
25.6 GHz -5.0 dB +5.0 dB
25.8 GHz -5.0 dB +5.0 dB
26.0 GHz -5.0 dB +5.0 dB
26.2 GHz -5.0 dB +5.0 dB
26.4 GHz -5.0 dB +5.0 dB
Max. deviation
15.4 GHz to 26.5 GHz
-4.0 dB +4.0 dB
R3267 Series Spectrum Analyzer Operation Manual (Vol.2)
1.3.7 Frequency Response
1-83
Page 94

R3267 Series Spectrum Analyzer Operation Manual (Vol.2)
1.3.8 Scale Fidelity
1.3.8 Scale Fidelity
(1) Log scale Fidelity
0 to -10 dB/1 dB Step
Input Signa l
Level (dBm)
nominal
0 0 0 (Ref) 0 (Ref) 0 (Ref) 0 (Ref)
-1 -1 -1.2 -0.8
-2 -2 -2.4 -1.6
-3 -3 -3.6 -2.4
-4 -4 -4.8 -3.2
-5 -5 -5.85 -4.15
-6 -6 -6.85 -5.15
-7 -7 -7.85 -6.15
-8 -8 -8.85 -7.15
-9 -9 -9.85 -8.15
-10 -10 -10.85 -9.15
0 to -90 dB/10 dB Step
Input Signa l
Level (dBm)
nominal
0 0 0 (Ref) 0 (Ref) 0 (Ref)
-10 -10 -10.85 -9.15
-20 -20 -20.85 -19.15
-30 -30 -30.85 -29.15
-40 -40 -40.85 -39.15
-50 -50 -50.85 -49.15
-60 -60 -60.85 -59.15
-70 -70 -70.85 -69.15
-80 -80 -80.85 -79.15
-90 -90 -90.85 -89.15
dB from
Reference Level
(nominal)
dB from
Reference Level
(nominal)
Delta Marker Level Measured
Spec.(min.)
dB
Spec.(max.)
dB
Reference output level dBm
Delta Marker Level Measured
Spec.(min.)
dB
Spec.(max.)
dB
value
dB
value
dB
Incremental
Error
dB
Remarks
Remarks
1-84
Page 95

R3267 Series Spectrum Analyzer Operation Manual (Vol.2)
(2) Linear scale Fidelity
0 to 10 div
1.3.9 Resolution Band wid t h Switch i ng
Reference output level dBm
Input Signal Level Div. from Reference
(dB, nominal) Spec.(min.)mVSpec.(max.) mVMeasured
0 (Ref) 0 223.6 223.6 223.6 (Ref)
-0.92 1 190.06 212.42
-1.94 2 167.7 190.06
-3.10 3 145.34 167.7
-4.44 4 122.98 145.34
-6.02 5 100.62 122.98
-7.96 6 78.26 100.62
-10.46 7 55.9 78.26
-13.98 8 33.54 55.9
-20 9 11.18 33.54
Level
1.3.9 Resolution Bandwidth Switching
Setting Spec.(min.)
RBW Frequency Span
5 MHz 8 MHz -0.3 +0.3
3 MHz 5 MHz -0.3 +0.3
1 MHz 2 MHz -0.3 +0.3
100 kHz 200 kHz -0.3 +0.3
30 kHz 50 kHz -0.3 +0.3
10 kHz 20 kHz -0.3 +0.3
3 kHz 5 kHz -0.3 +0.3
1 kHz 2 kHz -0.3 +0.3
300 Hz 500 Hz -0.3 +0.3
100 Hz 200 Hz -0.3 +0.3
30 Hz 200 Hz -1 +1
dB
Marker Level Remarks
value mV
Spec.(max.) dBMeasured value
dB
Remarks
1-85
Page 96

R3267 Series Spectrum Analyzer Operation Manual (Vol.2)
1.3.10 Resolution Bandwidth Accuracy and Selectivity
1.3.10 Resolution Bandwidth Accuracy and Selectivity
3 dB bandwidth
Setting Sp ec.(min.) Spec.(max.) Measured value Remar ks
RBW Frequency Span
5 MHz 10 MHz 3.75 MHz 6.25 MHz MHz
3 MHz 5 MHz 2.25 MHz 3.75 MHz MHz
1 MHz 2 MHz 850 kHz 1150 kHz kHz
300 kHz 500 kHz 255 kHz 345 kHz kHz
100 kHz 200 kHz 85 kHz 115 kHz kHz
30 kHz 50 kHz 25.5 kHz 34.5 kHz kHz
10 kHz 20 kHz 8.5 kHz 11.5 kHz kHz
3 kHz 5 kHz 2.55 kHz 3.45 kHz kHz
1 kHz 2 kHz 850 Hz 1150 Hz Hz
300 Hz 500 Hz 255 Hz 345 Hz Hz
100 Hz 200 Hz 85 Hz 115 Hz Hz
30 Hz* 200 Hz 22.5 Hz 37.5 Hz Hz
Note: * the Spec(min.) and Spec(max.) values for RBW 30 Hz are those when the temperature is 25
°C±10 °C.Values for other temperature are not specified.
60 dB bandwidth and Selectivity
Setting Measured value Spec.(max.) Selectivity
RBW Frequency Span
5 MHz 30 MHz MHz 15 : 1 : 1
3 MHz 25 MHz MHz 15 : 1 : 1
1 MHz 20 MHz kHz 15 : 1 : 1
300 kHz 5 MHz kHz 15 : 1 : 1
100 kHz 1 MHz kHz 15 : 1 : 1
30 kHz 500 kHz kHz 15 : 1 : 1
10 kHz 200 kHz kHz 15 : 1 : 1
3 kHz 50 kHz kHz 15 : 1 : 1
1 kHz 20 kHz Hz 15 : 1 : 1
300 Hz 5 kHz Hz 15 : 1 : 1
100 Hz 2 kHz Hz 15 : 1 : 1
30 Hz 1 kHz Hz 20 : 1 : 1
1.3.11 Noise Sidebands
Frequency 1.5 GHz
Offset Spec.(min.) Spec.(max.) Measured value Remarks
1 kHz offset - - -100 dBc/Hz dBc/Hz
10 kHz offset - - -110 dBc/Hz dBc/Hz
100 kHz offset - - -118 dBc/Hz dBc/Hz
1000 kHz offset - - -135 dBc/Hz dBc/Hz
Remarks
60dB : 3 dB
bandwidth
1-86
Page 97

1.3.12 Displayed Average Noise Level
Center Frequency Spec.(min.) Spec.(max.) Measured value Remar ks
1 kHz - - -90 dBm dBm
10 kHz - - -100 dBm dBm
100 kHz - - -101 dBm dBm
1 MHz - - -125 dBm dBm
10.1 MHz - - -130 dBm dBm
101 MHz - - -129.8 dBm (R3264)
501 MHz - - -129 dBm (R3264)
1001 MHz - - -128 dBm (R32 64)
1.5 GHz - - -127 dBm (R3264)
2.0 GHz - - -126 dBm (R3264)
2.5 GHz - - -125 dBm (R3264)
3.0 GHz - - -124 dBm (R3264)
3.5 GHz - - -123 dBm (R3264)
R3267 Series Spectrum Analyzer Operation Manual (Vol.2)
1.3.12 Displayed Average Noise Level
dBm
-129.9 dBm (R3267/73)
dBm
-129.5 dBm (R3267/73)
dBm
-129 dBm (R3267/73)
dBm
-128.5 dBm (R3267/73)
dBm
-128 dBm (R3267/73)
dBm
-127.5 dBm (R3267/73)
dBm
-127 dBm (R3267/73)
dBm
-126.5 dBm (R3267/73)
For the R3267 only
Frequency Band Spec.(min.) Spec.(max.) Measured value Remarks
3.5 GHz to 8.0 GHz - - -125 dBm dBm
For the R3273 only
Frequency Band Spec.(min.) Spec.(max.) Measured value Remarks
3.5 GHz to 7.5 GHz - - -125 dBm dBm
7.5 GHz to 15.4 GHz - - -122 dBm dBm
15.2 GHz to 22 GHz - - -120 dBm dBm
22 GHz to 26.5 GHz - - -117 dBm dBm
1.3.13 Residual FM
Marker Reading 3 dB Slope FM Deviation Spec.
f
∆
∆ level
1.3.14 Residual Response
Frequency Band Spec.(min.) Spec.(max.) Measured value Remarks
1 MHz to 3.5 GHz - - -100 dBm dBm
3.5 GHz to 7.5 GHz - - -90 dBm dBm R3267/73
Spec.
(min)
Hz/dB dB - - 3 Hz Hz
(max)
Calculated
Residual FM
Remarks
1-87
Page 98

R3267 Series Spectrum Analyzer Operation Manual (Vol.2)
1.3.15 Gain Compression
1.3.15 Gain Compression
Setting MHz Spec.(min. ) Spec.(max.) Measured
Center
Frequency
10.5 MHz 10 MHz 11 MHz -3 dBm - - dBm
200.5 MHz 200 MHz 201 MHz 0 dBm - - dBm
3600.5 MHz 3600 MHz 3601 MHz Note*1 - - dBm R3267/73
7600.5 MHz 7600 MH z 7601 MHz -3 dBm - - dBm R3273 only
SMP02 SMP03
Note*1 : For R3267: 0dBm R3273: -10 dBm
1.3.16 Second Harmonics Distortion
Frequency Band Center Freq uency Spec.(min.) Spec.(max.) Measured value Remarks
100 MHz to 3.5 GHz 1.5 GHz - - -70 dBc dB c
Bands excluding the
above
Note*2 : For R3267: -90dBc R3273: -100 dBc
1.9 GHz - - Note*2 dBc R3267/73
1.3.17 Third Order Intermodulation Distortion
For the R3264/67
Center Frequency Spec.(min.) Spec.(max.) dBc
20.5 MHz - - -50
105 MHz - - -60
1500 MHz - - -65
2000 MHz - - -70 R3267 only
3600 MHz - - -70 R3267 only
value
Measured value
dBc
Remarks
Remarks
1-88
For the R3273
Center Frequency Spec .(min.) Spec.(max.) dBc
20.5 MHz - - -50
105 MHz - - -60
1500 MHz - - -65
3600 MHz - - -50
8000 MHz - - -55
Measured value
dBc
Remarks
Page 99

1.3.18 Image, Multiple, Out of Band
For the R3273
R3267 Series Spectrum Analyzer Operation Manual (Vol.2)
1.3.18 Image, Multiple, Out of Band
Setting
BAND
100 Hz to 3.6 GHz 2 GHz 1957.159 MHz - - - 70 dBc dBc
3.5 GHz to
7.5 GHz
7.4 GHz to
15.4 GHz
15.2 GHz to
23.3 GHz
23 GHz to
26.5 GHz
Center
Frequency
2 GHz 1157.159 MHz - - - 70 dBc dBc
2 GHz 10.462841 GHz - - - 70 dBc dBc
2 GHz 8.2314205 GHz - - - 70 dBc dBc
5.5 GHz 6.342841 GHz - - - 70 dBc dBc
5.5 GHz 11.421421 GHz - - - 70 dBc dBc
5.5 GHz 17.342841 GHz - - - 70 dBc dBc
5.5 GHz 23.264262 GHz - - - 50 dBc dBc
12 GHz 12.842841 GHz - - - 70 dBc dBc
12 GHz 5.78929 GHz - - - 70 dBc dBc
12 GHz 18.21071 GHz - - - 60 dBc dBc
12 GHz 24.421421 GHz - - - 50 dBc dBc
21 GHz 21.842841 GHz - - - 60 dBc dBc
21 GHz 6.719053 GHz - - - 70 dBc dBc
21 GHz 13.859527 GHz - - - 70 dBc dBc
24.4 GHz 25.242841 GHz - - - 50 dBc dBc
24.4 GHz 5.783935 GHz - - - 70 dBc dBc
24.4 GHz 11.98929 GHz - - - 70 dBc dBc
24.4 GHz 18.194645 GHz - - - 60 dBc dBc
SMP03
Spec.
(min.)
Spec.(max.)
Measured
value
Remarks
For the R3267
Setting
BAND
100 Hz to 3.6 GHz 2 GHz 1957.159 MHz - - - 70 dBc
3.5 GHz to 8 GHz 7 GHz 7.842841 GHz - - - 70 dBc
Center
Frequency
2 GHz 1157.159 MHz - - - 70 dBc
2 GHz 10.462841 GHz - - - 70 dBc
2 GHz 8.2314205 GHz - - - 70 dBc
8 GHz 4.632131 GHz - - - 70 dBc
8 GHz 3.78929 GHz - - - 70 dBc
SMP03
Spec.
(min.)
Spec.(max.)
Measured
value
dBc
dBc
dBc
dBc
dBc
dBc
dBc
Remarks
1-89
Page 100

R3267 Series Spectrum Analyzer Operation Manual (Vol.2)
1.3.19 Sweep Time Accuracy
1.3.19 Sweep Time Accuracy
Setting
HP3325B
Frequency
550 kHz 2 µs 1.7 7µs 1.87 µs µs
220 kHz 5 µs 4.41 µs 4.68 µs µs
110 kHz 10 µs 8.82 µs 9.36 µs µs
55 kHz 20 µs 17.7 µs 18.7 µs µs
22 kHz 50 µs 44. 1µs 46.8 µs µs
11 kHz 100 µs 88.2 µs 93.6 µs µs
5.5 kHz 200 µs 177 µs 187 µs µs
2.2 kHz 500 µs 441 µs 468 µs µs
1.1 kHz 1 ms 882 µs 936 µs µs
550 Hz 2 ms 1.77 ms 1.87 ms ms
220 Hz 5 ms 4.41 ms 4.68 ms ms
110 Hz 10 ms 8.82 ms 9.36 ms ms
55 Hz 20 ms 17.7 ms 18.7 ms ms
22 Hz 50 ms 44.1 ms 46.8 ms ms
11 Hz 100 ms 88.2 ms 93.6 ms ms
5.5 Hz 200 ms 177 ms 187 ms ms
2.2 Hz 500 ms 441 ms 468 ms ms
1.1 Hz 1 s 882 ms 936 ms ms
0.55 Hz 2 s 1.77 s 1.87 s s
0.22 Hz 5 s 4.41 s 4.68 s s
0.11 Hz 10 s 8.82 s 9.36 s s
0.055 Hz 20 s 17.7 s 18.7 s s
0.022 Hz 50 s 44.1 s 46.8 s s
0.011 Hz 100 s 88.2 s 93.6 s s
Frequency
Span
Spec.(min.) Spec.(max.) Measured value Remarks
1-90
 Loading...