

Page 1

Cover
R3267 Series
Spectrum Analyzer
Operation Manual (Vol.1)
MANUAL NUMBER
Applicable models
R3264
R3267
R3273
FOE-8335033H00
1998
C
ADVANTEST CORPORATION
All rights reserved.
First printing October 1, 1998
Printed in Japan
Page 2

Safety Summary
No. ESG00
Safety Summary
To ensure thorough understanding of all functions and to ensure efficient use of this instrument, please read the
manual carefully before using. Note that Advantest b ear s absolutely no responsibility for the result of oper ations
caused due to incorrect or inappropriate use of this instrument.
If the equipment is used in a manner not specified by Advantest, the protection provided by the equipment may
be impaired.
• Warning Labels
Warning labels are applied to Advantest products in locations where specific dangers exist. Pay
careful attention to these label s during handling . Do not rem ove or tear these l abels. If yo u have
any questions regarding warning labels, please ask your nearest Advantest dealer. Our address
and phone number are listed at the end of this manual.
Symbols of those warning labels are shown below together with th eir meaning.
DANGER
WARNING
CAUTION
• Basic Precautions
Please observe the following precautions to prevent fire, burn, electric shock, and personal injury.
• Use a power cable rated for the voltage in question. Be sure however to use a power cable
conforming to safety standards of your nation when using a product overseas.
• W hen inserting the plug into the electrical outlet, first turn the power switch OFF and then
insert the plug as far as it will go.
• When removing the plug from the electrical outlet, first turn the power switch OFF and then
pull it out by gripping the plug. Do not pull on the power cabl e its el f. Make sure your hand s
are dry at this time.
• Before turning on the power, be sure to check that the supply voltage matches the voltage
requirements of the instrument.
: Indicates an imminently hazardous situation which will result in death or serious
personal injury.
: Indicates a potentially hazardous situation which w ill result in death or serious
personal injury.
: Indicates a potentially hazardous situation which will result in personal injury or
a damage to property including the product.
• B e sure to plug the power cable into an electrical ou tlet wh ich has a safety ground terminal.
Grounding will be defeated if you use an extension cord which does not include a safety
ground ter minal.
• Be sure to use fuses rated for the voltage in question.
• Do not use this instrument with the case open.
• Do not place objects on top of this product. Also, do not place flower p ots or other contain ers
containing liquid such as chemicals near this product.
Safety-1
Page 3
Safety Summary
• When the product has ventilation outlets, do not stick or drop metal or easily flammable objects into the ventilation outlets.
• When using the product on a cart, fix it with belts to avoid its drop.
• When connecting the product to peripheral equipment, turn the power off.
• Caution Symbols Used Within this Manual
Symbols indicating items requiring caution w hich are used in this m anual are s hown below to gether with their meaning.
DANGER
WARNING
CAUTION
• Safety Marks on the Product
The following safety marks can be found on Advantest products.
: Indicates an item where there is a danger of serious personal injur y (d eath or seri-
ous injury).
: Indicates an item relating to personal safety or health.
: Indicates an item relating to possible damage to the product or instrument or relat-
ing to a restriction on operation.
: ATTENTION - Refer to manual.
: Protective ground (earth) terminal.
: DANGER - High voltage.
: CAUTION - Risk of electric shock.
• Replacing Parts with Limited Life
The following parts used in the instrument are main parts with limited life.
Replace the parts listed below before their expected lifes pan has ex pired to maintain the performance and function of the instrument.
Note that the estimated lifespan for the parts listed below may be shortened by factors such as
the environment where the instrument is stored or used, and how often the instrument is used.
The parts inside are not user-replaceable. For a part replacement, please contact the Advantest
sales office for servicing.
There is a possibility that each product uses different parts with limited life. For more information, refer to Chapter 1.
Safety-2
Page 4

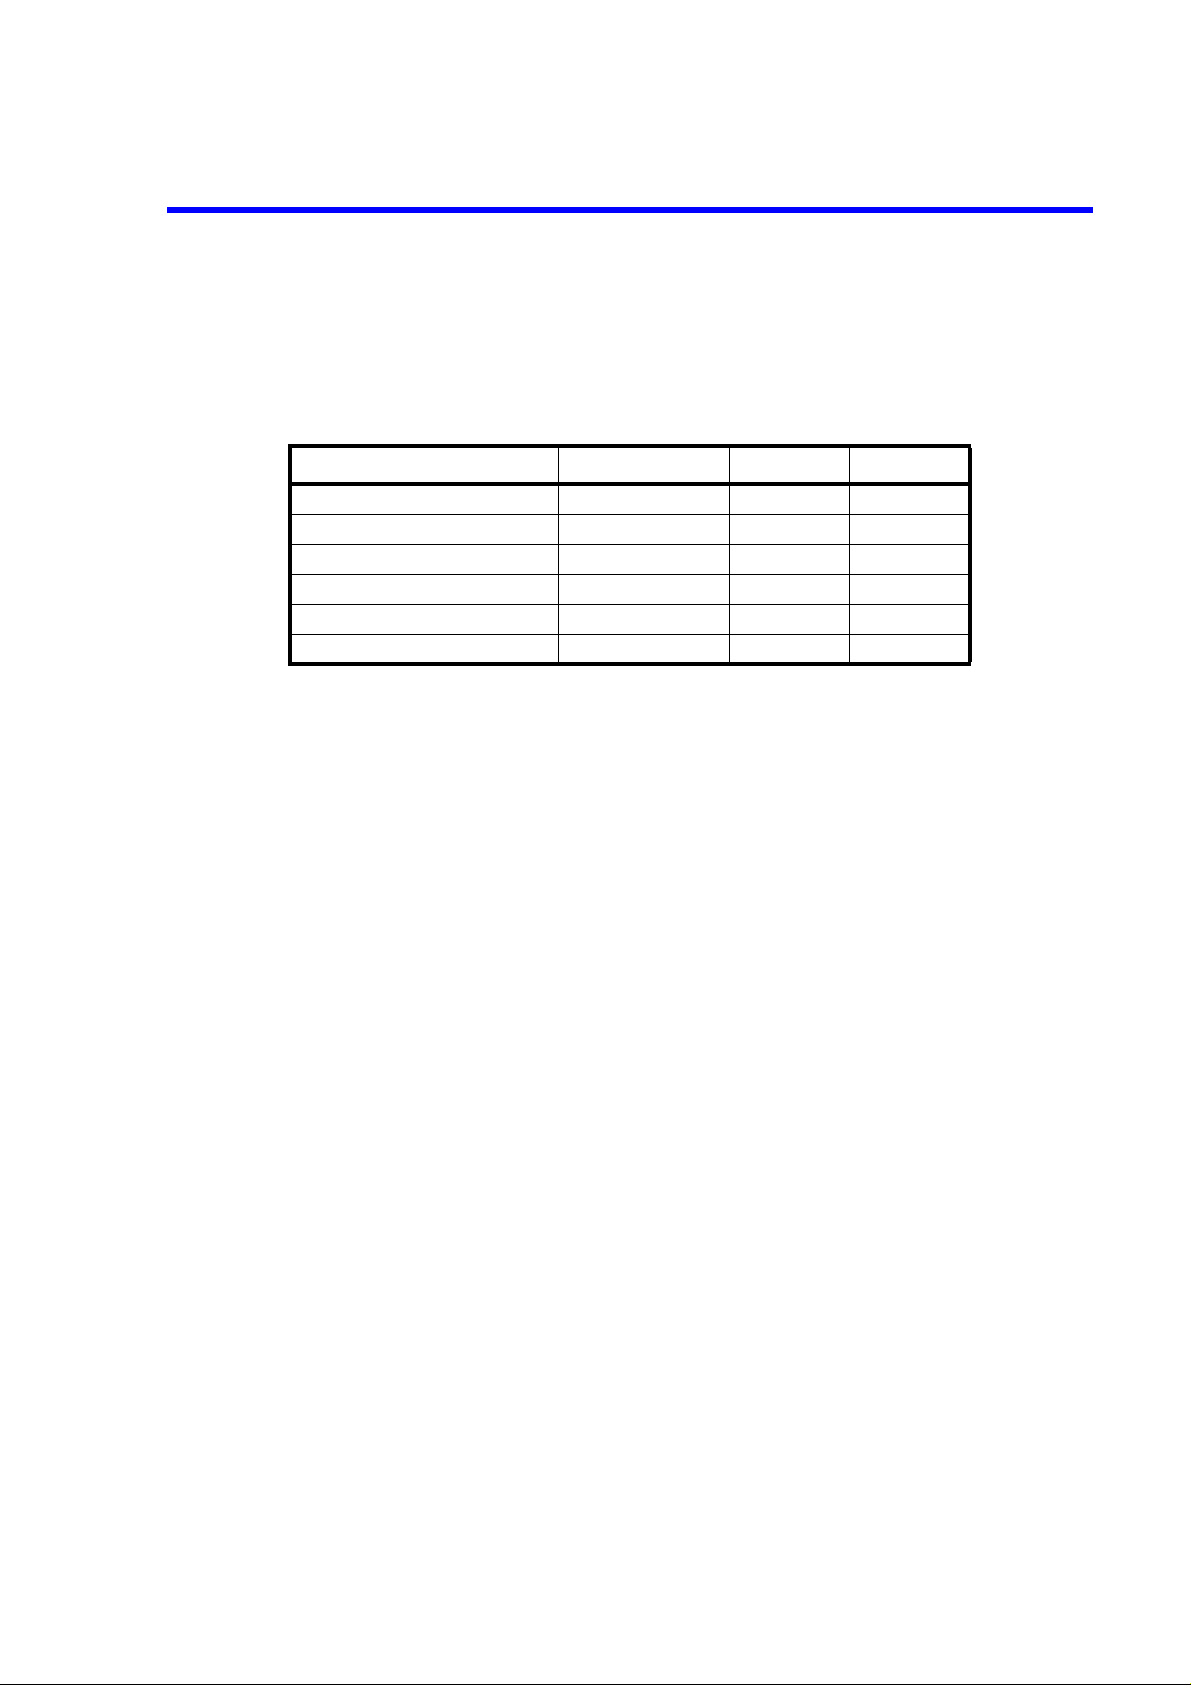
Main Parts with Limited Life
Part name Life
Unit power supply 5 years
Fan motor 5 years
Electrolytic capacitor 5 years
LCD display 6 years
LCD backlight 2.5 years
Floppy disk drive 5 years
Memory backup battery 5 years
• Hard Disk Mounted Products
The operational warnings are listed below.
• Do not move, shock and vibrate the product while the power is turned on.
Reading or writing data in the hard disk unit is performed with the memory disk turning at a
high speed. It is a very delicate process.
Safety Summary
• Store and operate the products under the following environmental conditions.
An area with no sudden temperature changes.
An area away from shock or vibrations.
An area free from moisture, dirt, or dust.
An area away from magnets or an instrument which generates a magnetic field.
• Make back-ups of important data.
The data stored in the dis k may b ecome damag ed if the prod uct is mishand led. The h ard disc
has a limited life span which depends on the operational conditions. Note that there is no
guarantee for any loss of data.
• Precautions when Disposing of this Instrument
When disposing of harmful substances, be sure dispose of them properly with abiding by the
state-provided law.
Harmful substances: (1) PCB (polycarbon biphenyl)
(2) Mercury
(3) Ni-Cd (nickel cadmium)
(4) Other
Items possessing cyan, organic phosphorous and hexadic chromium
and items which may leak cadmium or arsenic (excluding lead in sol
der).
Example: fluorescent tubes, batteries
Safety-3
Page 5
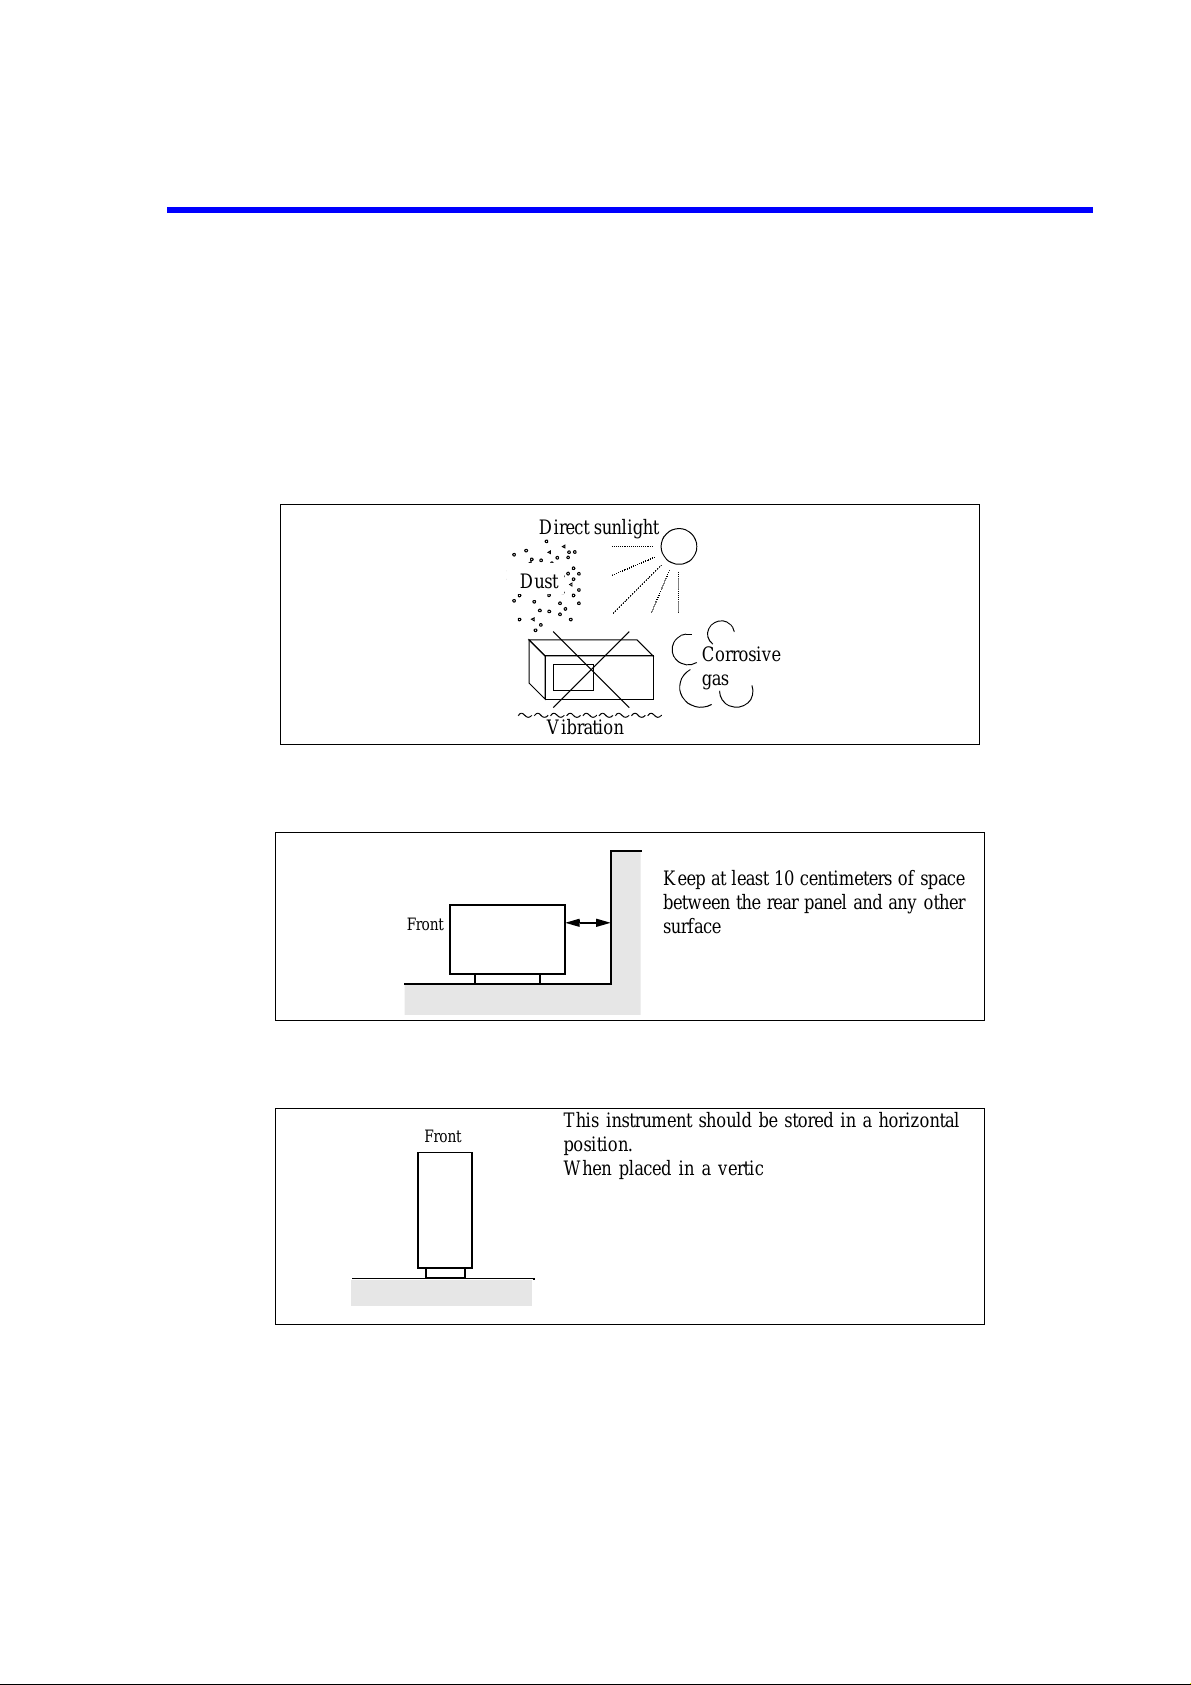
Environmental Conditions
This instrument should be only be used in an area which satisfies the following conditions:
• An area free from corrosive gas
• An area away from direct sunlight
• A dust-free area
• An area free from vibrations
Direct sunlight
Dust
Corrosive
gas
Vibration
Figure-1 Environmental Conditions
• Operating position
Keep at least 10 centimeters of space
between the rear panel and any other
Front
Figure-2 Operating Position
• Storage position
Front
This instrument can be used safely under the following conditions:
• Altitude of up to 2000 m
This instrument should be stored in a horizontal
position.
When placed in a vertical (upright) position for
storage or transportation, ensure the instrument is
stable and secure.
-Ensure the instrument is stable.
-Pay special attention not to fall.
Figure-3 Storage Position
surface
Safety-4
• Installation Categories II
• Polluti on Degree 2
Page 6
Other Information for the R3267 Series
R3267 Series Spectrum Analyzer Operation Manual (Vol.1)
Other Information for the R3267 Series
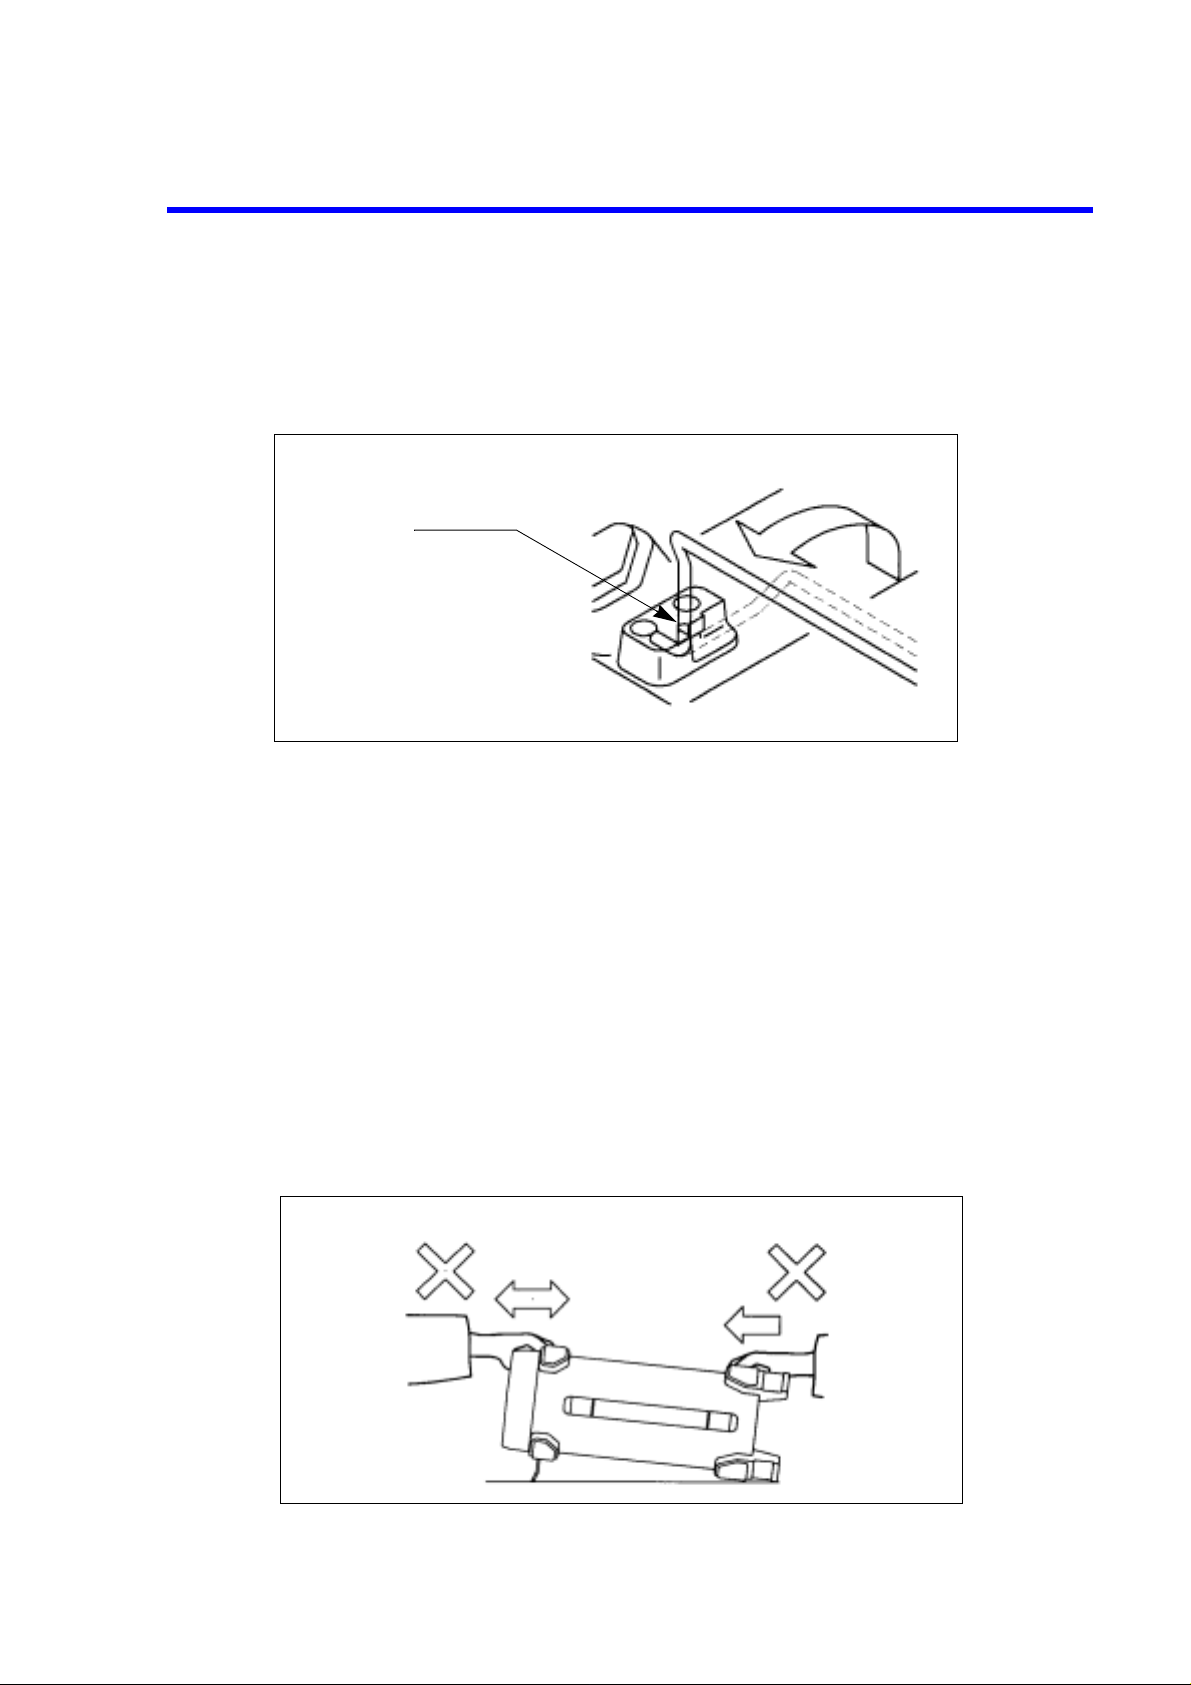
Flip Down Stand
The metal flip down stand beneath the front panel can be used to provide a better viewing angle.
Use the instrument with the flip down stand opened all the way.
Insert this end into the h ole
(for both sides).
Be sure to support the analyzer firmly with one hand when opening or closing the stand.
Note the following when using the flip down stand:
Use the analyzer on flat surfaces so that the weight of the analyzer is evenly distributed.
• Do not put any objects on the analyzer.
• Do not lean on the analyzer.
• Do not place anything under the analyzer.
• Do not slide the analyzer.
• Do not use excessive force when pressing keys.
• Do not use the analyzer on a slippery place.
• Do not use the wire flip down stand as a carry handle.
• Never drag the instrument or push it from behind when the flip down stand is opened because the
stand may close shut and jar the instrument..
Cautions-1
Page 7

R3267 Series Spectrum Analyzer Operation Manual (Vol.1)
Other Information for the R3267 Series
Make sure the flip down stand is folded shut when:
• The spectrum analyzer is not in use.
• Connecting or disconnecting cables
• Using the analyzer on a cart
CAUTION:
1. Make sure that the flip down stand is in the normal position when the instru ment is used with the flip down stan d
swung open.
2. Make sure that the instrument is used according to the instructions presented in this section and be careful not
to catch your fingers when opening or cl osing the stand.
Memory Cards
There is a possibility that writing, reading or formatting memory cards, which comply with the JEIDA standard, may fail when used with this instrument. In particular, a memory card with no attribute memory or the
one whose attribute memory is not d efined cannot be used with the instrument, even if it is normally u sed
with personal computers.
The following are the restrictions on the memory cards that can be used with the instrument.
(1) Memory Cards Compliant with the Instrument
SRAM Cards
• The ones that have a memory space of 64 KB or more and are compliant with JEIDA 4.0
(PCMCIA 2.0) or later
• The ones with or without the attribute memory
• For the ones without attribute m emory or with an em pty attribute memory, the following must be
met:
1. Writing, reading, and physically and logically formatting the media are possible.
2. Sectors are arranged from the head of common memory in a single partition without ECC
(Error Check Code).
• For the ones with Level 1 device information as attribute information, the following must be
met:
1. Writing, reading, and physically and logically formatting the media are possible.
2. Sectors are arranged from the head of common memory in a single partition without ECC.
• For the ones with Level 2 device information as attribute information, the following must be
met:
1. Physically formatting the media is not possible.
2. Reading or writing the media is possible depending on whether it has ECC o r not.
Without ECC: Reading, writing and logically formatting the media are possible.
With ECC: Reading the media only is possible.
Cautions-2
• For the ones with plural partitions, the partitions written in the first format information can be
Page 8

R3267 Series Spectrum Analyzer Operation Manual (Vol.1)
used (the partitions, however, must be according to the basic DOS partitions).
Disk Cards compliant with the PCcard-ATA standard
• I/O cards compliant with JEIDA4.2 (PCMCIA2.1) or later under the PCMCIA-ATA standard
• For flash disk cards and hard disk cards, the following must be met:
1. Logically and physically formatting the media is not possible.
2. For the ones with plural partitions, the partitions written in the first format information can be
used (the partitions, however, must be according to the basic DOS partitions).
EPROM cards and plane flash memory cards
• Reading only is possible when data is written in the same format as SRAM cards.
(2) Cards that cannot be used with the instrument
DRAM cards
I/O cards
Other Information for the R3267 Series
Cautions-3
Page 9

Certificate of Conformity
Certificate of Conformity
This is to certify, that
complies with the provisions of the EMC Directive 89/336/EEC in accordance with
EN61326 and Low Voltage Directive 73/23/EEC in accordance with EN61010.
Spectrum Analyzer
R3264 / R3267 / R3273 Series
instrument, type, designation
ADVANTEST Corp. ROHDE&SCHWARZ
Tokyo, Japan Engineering and Sales GmbH
Munich, Germany
3267.04
Page 10

PREFACE
R3267 Series Spectrum Analyzer Operation Manual (Vol.1)
PREFACE
This manual(Vol.1) provides the inform ation necessary to check fu nctionality, operate and program the R 3267
Series.
The procedure for conducting the performance test is described in a separate volume (Vol.2).
(1) Organization of this manual
This manual consists of the following chapters:
Safety Summary
1. Introduction
• Product Description
• Standard Accessories and Power Cable Options
• Operating Environment
• Operation Check
• Cleaning, Storing and Transporting
2. Operation
• Controls and Connectors on the Front and Rear Panels
• Screen Annotation
• Basic Operation
• Measurement Examples
3. Reference
• Menu Index
• Menu Map
• Functional Description
4. Principle of measurement
• Input saturation
• ACP measurements (internal processing and setting the Root
Nyquist filter for both the Full screen and Separate screen
modes)
• Operation of the gated sweep
To use the analyzer safely, be sure to read
this manual first.
Includes a description of the analyzer and
its’ parts along with information on its’
operating environment and how to perform a system checkout.
Describes the names, functions and annotations of each part on the panels. You can
learn the basic operations of the analyzer
through the examples shown in this chapter.
Shows a list of operation keys, and
describes the function of each key.
Describes the principle of operation necessary for taking measurements more
accurately.
5. Remote Control
•GPIB
•RS-232
6. Specifications Shows the specifications of the analyzer.
APPENDIX A.1 Before Contacting ADVANTEST with a problem Refer to this section when you have any
Gives an outline of the GPIB and RS-232
interfaces, and how to connect and set
them up. Also included are a list of commands necessary for programming and
using the program examples.
problems.
Preface-1
Page 11

R3267 Series Spectrum Analyzer Operation Manual (Vol.1)
Preface
APPENDIX A.2 Error Messages If an error occurs during operation, an
error number and its corresponding error
message are displayed. The meaning of
each error is explained in this section.
APPENDIX A.3 Glossary Terminology related to the spectrum ana-
lyzer is explained in this section.
APPENDIX A.4 dB Conversion Formulas
(2) Typeface conventions used in this manual
• Panel keys and soft keys are printed in a contrasting typeface to make them stand out from the text as
follows:
Panel keys: Boldface type Example: FREQ, FORMAT
Soft keys: Boldface and italic type Example:
• When a series of key operations are described using a comma between two keys.
• There are various soft menus used to switch between two states such as ON/OFF and AUTO/MNL.
For example, when turning off the
is used.
When switching the
is used.
RBW AUTO/MNL
Display ON/OFF
function to MNL, the annotation “
function, the annotation “
Center, Trace Detector
Display ON/OFF
RBW AUTO/MNL
(MNL)”
(OFF)”
(3) Trademarks
• Epson is a registered trademark of EPSON Corp.
• Hewlett Packard is a registered trademarks of Hewlett-Packard Company.
Preface-2
Page 12

TABLE OF CONTENTS
TABLE OF CONTENTS
R3267 Series Spectrum Analyzer Operation Manual (Vol.1)
1 INTRODUCTION
1.1 Product Description ............................................................................................. 1-1
1.2 Accessories .......................................................................................................... 1-2
1.3 Operating Environment ....................................................................................... 1-4
1.3.1 Environmental Conditions ............................................................................ 1-4
1.3.2 Power Supply Specifications ........................................................................ 1-5
1.3.3 Power Fuse .................................................................................................... 1-5
1.3.4 Power Cable .................................................................................................. 1-7
1.4 Precautions in Use ............................................................................................... 1-8
1.5 System Checkout ................................................................................................. 1-10
1.6 Cleaning, Storing and Transporting the R3267 Series ........................................ 1-13
1.6.1 Cleaning ........................................................................................................ 1-13
1.6.2 Storing ........................................................................................................... 1-14
1.6.3 Transporting .................................................................................................. 1-14
1.7 About Calibration ................................................................................................ 1-15
1.8 Concerning Limited-life Parts ............................................................................. 1-15
2 OPERATION
2.1 Panel Description ................................................................................................. 2-1
2.1.1 Front Panel .................................................................................................... 2-1
2.1.1.1 Display Section ........................................................................................... 2-2
2.1.1.2 Power Switch/Connector Section ............................................................... 2-3
2.1.1.3 Floppy Disk Drive Section ......................................................................... 2-4
2.1.1.4 MEASUREMENT Section ......................................................................... 2-4
2.1.1.5 MARKER Section ...................................................................................... 2-5
2.1.1.6 Save/Recall Section .................................................................................... 2-5
2.1.1.7 DISPLAY CONTROL Section ................................................................... 2-6
2.1.1.8 ENTRY Section .......................................................................................... 2-7
2.1.1.9 REMOTE Section ....................................................................................... 2-8
2.1.1.10 Control Section ......................................................................................... 2-9
2.1.1.11 Option Section .......................................................................................... 2-9
2.1.2 Screen Annotation ......................................................................................... 2-10
2.1.3 Rear Panel ..................................................................................................... 2-12
2.2 Basic Operation ................................................................................................... 2-14
2.2.1 Operating Menus and Entering Data ............................................................ 2-14
2.2.2 Displaying Spectrums and Operating the Markers ....................................... 2-18
2.2.3 Measuring Frequency Using Counter ........................................................... 2-23
2.2.4 Display Line and Measuring Window .......................................................... 2-26
2.2.5 Entering Level Correction Data .................................................................... 2-29
2.2.6 Separating Two Signals ................................................................................ 2-33
2.2.7 Dynamic Range ............................................................................................. 2-36
........................................................................................... 1-1
.................................................................................................... 2-1
C-1
Page 13

R3267 Series Spectrum Analyzer Operation Manual (Vol.1)
Table of Contents
2.2.8 UNCAL Message .......................................................................................... 2-39
2.2.9 Zooming the Frequency Domain .................................................................. 2-41
2.2.10 Zooming the Time Domain ........................................................................... 2-44
2.2.11 Measurement Using the F/T Function .......................................................... 2-49
2.2.12 Measuring Dual Parameters .......................................................................... 2-53
2.2.12.1 Measuring Dual Parameters in the Frequency Domain ............................ 2-53
2.2.12.2 Measuring Dual Parameters in the Time Domain .................................... 2-57
2.2.13 Calibration .................................................................................................... 2-61
2.2.13.1 Cal All ....................................................................................................... 2-62
2.2.13.2 Total Gain ................................................................................................. 2-63
2.2.13.3 Cal Each Item ............................................................................................ 2-64
2.2.14 Pass/Fail Judgments Using the Limit line Function ..................................... 2-65
2.3 Measurement Examples ....................................................................................... 2-71
2.3.1 Measuring Average Power of Digital Modulation Signal ............................ 2-71
2.3.2 Measuring CDMA Wave’s Total Power ...................................................... 2-75
2.3.3 Measuring the Power Density of Wide Band Digital Modulation Signal .... 2-78
2.3.4 Measuring CDMA Channel Power ............................................................... 2-81
2.3.5 Measuring the Occupied Bandwidth (OBW) ................................................ 2-84
2.3.6 Measuring Adjacent Channel Leakage Power (ACP) .................................. 2-87
2.3.6.1 Full Screen Mode ........................................................................................ 2-87
2.3.6.2 SEPARATE Display ................................................................................... 2-93
2.3.7 Measuring Burst Signals Using the Gated Sweep ........................................ 2-97
2.3.8 Measuring Burst signals in the Time Domain .............................................. 2-101
2.3.9 Harmonic Distortion Measurements ............................................................. 2-105
2.3.9.1 Using the Normal and Delta Markers ......................................................... 2-105
2.3.9.2 Using the Peak List ..................................................................................... 2-108
2.3.9.3 Using the Fixed Marker Function ............................................................... 2-111
2.3.10 Third Order Intermodulation Distortion ....................................................... 2-114
2.3.11 AM Modulation Frequency and Modulation Factor of AM Signals ............ 2-117
2.3.12 Measuring Frequency deviation of FM Signals ............................................ 2-120
2.3.13 Measuring Modulation Index of FM Signals ................................................ 2-123
2.3.14 Carrier Frequency and Power Measurements Using Pulsed RF Signals ...... 2-125
2.4 Expanded Functions ............................................................................................ 2-130
2.4.1 Saving/Recalling Measurement Conditions .................................................. 2-130
2.4.1.1 Saving/Recalling Basic Measurement Conditions ...................................... 2-130
2.4.1.2 Saving/Recalling OBW Measurement Conditions ..................................... 2-137
2.4.1.3 Saving/Recalling ACP Measurement Conditions ....................................... 2-137
2.4.2 Saving Screen Data ....................................................................................... 2-138
2.4.3 Obtaining a Hard Copy of screen data .......................................................... 2-140
2.4.4 Formatting Media ......................................................................................... 2-142
2.4.4.1 Formatting a Floppy Disk ........................................................................... 2-142
2.4.4.2 Formatting the Memory Card (Option) ...................................................... 2-143
2.4.5 Setting Date and Time .................................................................................. 2-146
2.4.6 Setting the Screen Label ............................................................................... 2-147
C-2
Page 14

R3267 Series Spectrum Analyzer Operation Manual (Vol.1)
Table of Contents
3 REFERENCE
.................................................................................................... 3-1
3.1 Menu Index .......................................................................................................... 3-1
3.2 Menu Map ........................................................................................................... 3-7
3.3 Functional Description ........................................................................................ 3-20
3.3.1 A Key (Trace A) ........................................................................................... 3-20
3.3.2 ATT Key (Attenuator) .................................................................................. 3-24
3.3.3 B Key (Trace B) ............................................................................................ 3-25
3.3.4 CAL Key (Calibration) ................................................................................. 3-28
3.3.5 CONFIG Key (Configuration) ...................................................................... 3-30
3.3.6 COPY Key (Copy) ........................................................................................ 3-36
3.3.7 COUPLE Key (Couple Function) ................................................................. 3-37
3.3.8 FORMAT Key (Display format) .................................................................. 3-40
3.3.9 FREQ Key (Frequency) ................................................................................ 3-45
3.3.10 LCL Key (GPIB Remote Control) ................................................................ 3-48
3.3.11 LEVEL Key (Level) ..................................................................................... 3-49
3.3.12 MEAS Key (Measurement) .......................................................................... 3-51
3.3.13 MKR Key (Marker) ...................................................................................... 3-53
3.3.14 MKR
Key (Marker
→→→→
) ............................................................................ 3-56
→→→→
3.3.15 OFF Key (Marker off) .................................................................................. 3-57
3.3.16 POWER Key (Power Measurement) ............................................................ 3-58
3.3.17 PRESET Key (Initialization) ........................................................................ 3-63
3.3.18 RCL Key (Data Readout) ............................................................................. 3-64
3.3.19 REPEAT Key (Continuous Sweep) .............................................................. 3-65
3.3.20 SAVE Key (Saving Data) ............................................................................. 3-66
3.3.21 SINGLE Key (Single Sweep) ....................................................................... 3-70
3.3.22 SPAN Key (Frequency Span) ....................................................................... 3-71
3.3.23 SRCH Key (Peak Search) ............................................................................. 3-72
3.3.24 SWP Key (Sweep Time) ............................................................................... 3-75
3.3.25 UTIL Key (Utility) ........................................................................................ 3-78
3.3.26 WINDOW Key ............................................................................................. 3-84
3.4 List of Settings ..................................................................................................... 3-86
3.4.1 Set Resolution ............................................................................................... 3-86
3.4.2 Set Values for RBW, VBW and Sweep-Time .............................................. 3-86
3.4.3 Factory Defaults ............................................................................................ 3-87
3.4.4 Defaults Configuration Values ..................................................................... 3-87
3.4.5 Parameters Range ......................................................................................... 3-90
4 PRINCIPLE OF MEASUREMENT
........................................................... 4-1
4.1 Input Saturation ................................................................................................... 4-1
4.2 Measuring Adjacent Channel Leakage Power (ACP) ......................................... 4-3
4.2.1 Differences between Full Screen and Separate Screen Operation Processes 4-3
4.2.2 Root Nyquist Filter ....................................................................................... 4-6
4.2.3 Noise Correction Function ............................................................................ 4-7
C-3
Page 15

R3267 Series Spectrum Analyzer Operation Manual (Vol.1)
Table of Contents
4.3 Operation of the Gated Sweep ............................................................................. 4-8
4.4 Eye Opening Calculation ..................................................................................... 4-10
4.4.1 Calculation Using No Measurement Window .............................................. 4-10
4.4.2 Calculation using the Measurement Window ............................................... 4-11
4.5 Phase Jitter Measurement .................................................................................... 4-12
4.5.1 Additional Functions ..................................................................................... 4-12
5 REMOTE PROGRAMMING
....................................................................... 5-1
5.1 GPIB Command Index ........................................................................................ 5-1
5.2 GPIB Remote Programming ................................................................................ 5-7
5.2.1 GPIB ............................................................................................................. 5-7
5.2.2 GPIB Setup ................................................................................................... 5-8
5.2.3 GPIB Interface Functions ............................................................................. 5-9
5.2.4 Responses to Interface Messages .................................................................. 5-10
5.2.5 Message Exchange Protocol ......................................................................... 5-11
5.2.6 Command Syntax .......................................................................................... 5-12
5.2.7 Data Formats ................................................................................................. 5-13
5.2.8 Status Bytes ................................................................................................... 5-14
5.2.9 GPIB Command Codes ................................................................................. 5-21
5.2.10 Example Programs ........................................................................................ 5-45
5.2.10.1 Sample Programs for Setting or Reading Measurement Conditions ........ 5-45
5.2.10.2 Sample Programs for Reading Data .......................................................... 5-47
5.2.10.3 Sample Programs for Inputting or Outputting Trace Data ....................... 5-52
5.2.10.4 Program Examples Using the Status Byte ................................................ 5-56
5.3 RS-232 Remote Control Function ....................................................................... 5-59
5.3.1 GPIB and RS-232 Compatibility .................................................................. 5-59
5.3.2 Features of RS-232 Remote Control ............................................................. 5-59
5.3.3 Parameter Setup Window ............................................................................. 5-59
5.3.4 Interface connection ...................................................................................... 5-60
5.3.5 Data Format .................................................................................................. 5-61
5.3.6 Differences Between RS-232 and GPIB ....................................................... 5-62
5.3.7 Panel Control ................................................................................................ 5-62
5.3.8 Remote Control Usage Examples ................................................................. 5-63
6 SPECIFICATIONS
.......................................................................................... 6-1
6.1 R3264 Specifications ........................................................................................... 6-1
6.2 R3267 Specifications ........................................................................................... 6-7
6.3 R3273 Specifications ........................................................................................... 6-14
6.4 Specifications for the Memory Card (Option) ..................................................... 6-21
APPENDIX
................................................................................................................ A-1
A.1 Before Contacting with a Problem ...................................................................... A-1
A.2 Error Message ...................................................................................................... A-3
C-4
Page 16

R3267 Series Spectrum Analyzer Operation Manual (Vol.1)
Table of Contents
A.3 Glossary ............................................................................................................... A-9
A.4 dB Conversion Formulas ..................................................................................... A-16
DIMENSIONAL OUTLINE DRAWING
ALPHABETICAL INDEX
.................................................................................... I-1
......................................................... EXT-1
C-5
Page 17

R3267 Series Spectrum Analyzer Operation Manual (Vol.1)
LIST OF ILLUSTRATIONS
No. Title Page
1-1 Operating Environment ..................................................................................................... 1-4
1-2 Replacing the Power Fuse ................................................................................................. 1-6
1-3 Power Cable ...................................................................................................................... 1-7
1-4 Human body ...................................................................................................................... 1-9
1-5 Floor in the work area ....................................................................................................... 1-9
1-6 Benchboard ....................................................................................................................... 1-9
1-7 Connecting the Power Supply Cable ................................................................................ 1-10
1-8 Start-up Screen .................................................................................................................. 1-11
1-9 Config Menu ..................................................................................................................... 1-11
1-10 Selftest Menu .................................................................................................................... 1-12
1-11 Selftest Result ................................................................................................................... 1-12
1-12 Removing the Display Filter ............................................................................................. 1-13
2-1 Front Panel ........................................................................................................................ 2-1
2-2 Display Section ................................................................................................................. 2-2
2-3 Power Switch/Connector Section ..................................................................................... 2-3
2-4 Floppy Disk Drive Section ............................................................................................... 2-4
2-5 MEASUREMENT Section ............................................................................................... 2-4
2-6 MARKER Section ............................................................................................................ 2-5
2-7 Save/Recall Section .......................................................................................................... 2-5
2-8 DISPLAY CONTROL Section ......................................................................................... 2-6
2-9 ENTRY Section ................................................................................................................ 2-7
2-10 REMOTE Section ............................................................................................................. 2-8
2-11 Control Section ................................................................................................................. 2-9
2-12 Option Section .................................................................................................................. 2-9
2-13 Screen Annotation ............................................................................................................. 2-10
2-14 Display Area Names ......................................................................................................... 2-11
2-15 Rear Panel ......................................................................................................................... 2-12
2-16 Span Menu ........................................................................................................................ 2-14
2-17 Soft Menu Configuration (CONFIG Key) ........................................................................ 2-16
2-18 Factory Defaults ................................................................................................................ 2-19
2-19 Calibration Output ............................................................................................................ 2-19
2-20 Frequency Menu ............................................................................................................... 2-20
2-21 Setting the Center Frequency ............................................................................................ 2-20
2-22 Setting Measurement Conditions ...................................................................................... 2-21
2-23 Peak Search ....................................................................................................................... 2-21
2-24 Frequency Difference Between the Peak Point and a Point 3 dB Levels Down .............. 2-22
2-25 Frequency Difference Between the Peak Point and a Point 60 dB Levels Down ............ 2-22
2-26 Setting Measurement Conditions ...................................................................................... 2-24
2-27 Frequency Counter Measurement ..................................................................................... 2-24
2-28 Frequency Counter Measurement (Resolution: 10 Hz) .................................................... 2-25
2-29 The Display Line .............................................................................................................. 2-27
2-30 Measuring the Values Relative to the Display Line ......................................................... 2-27
2-31 The Measuring Window ................................................................................................... 2-28
2-32 Setting Measurement Conditions ...................................................................................... 2-30
2-33 Displaying the Correction Table ....................................................................................... 2-30
F-1
Page 18

R3267 Series Spectrum Analyzer Operation Manual (Vol.1)
List of Illustrations
No. Title Page
2-34 Entering Frequency Data .................................................................................................. 2-31
2-35 Showing a Trace Whose Level Is Corrected .................................................................... 2-31
2-36 Corrected Compensation Data .......................................................................................... 2-32
2-37 Setup for Measuring Two Signals Separately ................................................................... 2-33
2-38 Two Superimposed Peaks ................................................................................................. 2-34
2-39 Two Discernible Peaks .....................................................................................................2-34
2-40 Two Distinct Peaks Can Now Be Seen ............................................................................. 2-35
2-41 Setup for Verifying the Dynamic Range .......................................................................... 2-36
2-42 Trace Prior to Changing the RBW .................................................................................... 2-37
2-43 Trace After Changing the RBW ....................................................................................... 2-37
2-44 Trace After Changing the VBW ....................................................................................... 2-38
2-45 The Trace after Averaging ................................................................................................ 2-38
2-46 Measuring AM Signal in Separate Screen Mode .............................................................. 2-39
2-47 Screen with UNCAL Message .......................................................................................... 2-40
2-48 UNCAL Message Removed ............................................................................................. 2-40
2-49 Measuring AM Signal in Separate Screen Mode .............................................................. 2-41
2-50 Displaying the Trace in Full Screen Mode ....................................................................... 2-42
2-51 Displaying the Trace in Separate Screen Mode ................................................................ 2-42
2-52 Displaying the Magnified Lower Screen .......................................................................... 2-43
2-53 Measuring Burst Signal in Separate Screen Mode ........................................................... 2-44
2-54 Trace of a Burst Signal ..................................................................................................... 2-45
2-55 Burst Signal in the Zero Span ........................................................................................... 2-46
2-56 Displaying the Trace in the Separate Screen Mode .......................................................... 2-46
2-57 Observing the Leading Edge in the Separate Screen Mode .............................................. 2-47
2-58 Observing the Trailing Edge in Separate Screen Mode .................................................... 2-47
2-59 Setup to Measure Pulse Signal Using 2 Screens ............................................................... 2-49
2-60 Trace of a Burst Signal ..................................................................................................... 2-50
2-61 F/T Function Displayed in Separate Screen Mode ........................................................... 2-51
2-62 F/T Mode in Zoom Display .............................................................................................. 2-51
2-63 Setup to Measure Dual Parameters ................................................................................... 2-53
2-64 Displaying in Separate Screen Mode ................................................................................ 2-54
2-65 Setting for the Upper Screen in Separate Screen Mode .................................................... 2-55
2-66 Setting for the Lower Screen in Separate Screen Mode ................................................... 2-55
2-67 Magnified Trace for the Lower Screen ............................................................................. 2-56
2-68 Setup to Measure Pulse Signals with Different Frequencies Using 2 Screens ................. 2-57
2-69 Upper Screen in Sync with the Trigger Signal ................................................................. 2-58
2-70 Displaying the Traces of 900 MHz and 1800 MHz in the Separate Screen Mode ........... 2-59
2-71 Displaying the Trace of 1800 MHz for the Lower Screen ............................................... 2-60
2-72 Cal Menu ........................................................................................................................... 2-62
2-73 Editing the Limit Line 1 .................................................................................................... 2-66
2-74 Screen Displayed after Limit Line 1 Data Has Been Entered .......................................... 2-67
2-75 Screen Displayed after Limit Line 2 Data Has Been Entered .......................................... 2-67
2-76 Setting Limit Line PASS/FAIL ........................................................................................ 2-68
2-77 PASS/FAIL Result using Limit Line 1 ............................................................................. 2-68
2-78 PASS/FAIL Result using Limit Lines 1 and 2 ................................................................. 2-69
2-79 Judgment Result after the Offset Has Been Changed ....................................................... 2-70
2-80 Setup for the Average Power Measurement ..................................................................... 2-71
2-81 Checking the Input Signal .................................................................................................2-73
F-2
Page 19

R3267 Series Spectrum Analyzer Operation Manual (Vol.1)
List of Illustrations
No. Title Page
2-82 Setting Measurement Conditions for Average Power Measurement ................................ 2-73
2-83 Result of an Average Power Measurement ....................................................................... 2-74
2-84 Moving the Measurement Result ...................................................................................... 2-74
2-85 Setup for Measuring the Total Power ............................................................................... 2-75
2-86 Setting Conditions for the Total Power Measurement ...................................................... 2-77
2-87 Result of Total Power Measurement ................................................................................ 2-77
2-88 Setup for Measuring the Total Power ............................................................................... 2-78
2-89 Displaying the Measuring Window .................................................................................. 2-80
2-90 Power Density Measurement ....... ...... .................................. ..... .................................. ...... 2-80
2-91 Setup for Measuring the Channel Power .......................................................................... 2-81
2-92 Result of Channel Power Measurement ............................................................................ 2-83
2-93 Setup for Measuring the Occupied Bandwidth ................................................................. 2-84
2-94 OBW Measurement Results .............................................................................................. 2-86
2-95 Setup Measuring Adjacent Channel Leakage Power ................................. ....................... 2-88
2-96 PDC trace .......................................................................................................................... 2-89
2-97 CS/BS Setup dialog box ................................................................................................... 2-90
2-98 Root Nyquist Filter dialog box ......................................................................................... 2-91
2-99 ACP Measurement Display in Full Screen Mode ............................................................. 2-91
2-100 Measurement Using ACP GRAPH ................................................................................... 2-92
2-101 ACP at the 100 kHz .......................................................................................................... 2-92
2-102 Setup Measuring Adjacent Channel Leakage Power ........................................................ 2-93
2-103 PHS Trace ......................................................................................................................... 2-94
2-104 CS/BS Setup dialog box ...................................................................................................2-95
2-105 Measurement Result in ACP Separate Screen Mode ........................................................ 2-96
2-106 Setup for Measuring a Burst Signal .................................................................................. 2-97
2-107 Burst Signal Displayed in Split Screen Mode .................................................................. 2-98
2-108 Trigger Setup .................................................................................................................... 2-98
2-109 Burst Signal by Use of the Gated Sweep (Separate Screen Mode) .................................. 2-99
2-110 Burst Signal by Use of the Gated Sweep (Full Screen Mode) .......................................... 2-100
2-111 Setup for Measuring a Burst wave signal ......................................................................... 2-101
2-112 Burst signal in the frequency domain ............................................................................... 2-102
2-113 Burst Signal in the Time Domain ..................................................................................... 2-102
2-114 Burst Signal in Synchronization with the Trigger Signal ................................................. 2-103
2-115 Measuring Burst Signal Leading Edge ............................................................................. 2-104
2-116 Measuring Burst Signal Trailing Edge ............................................................................. 2-104
2-117 Setup for Measuring the Harmonic Distortion ................................................................. 2-105
2-118 Trace of Harmonics .......................................................................................................... 2-106
2-119 Secondary Harmonics ....................................................................................................... 2-107
2-120 Tertiary Harmonics ........................................................................................................... 2-107
2-121 Setup for Measuring the Harmonic Distortion ................................................................. 2-108
2-122 Trace of Harmonics .......................................................................................................... 2-109
2-123 Peak List Display .............................................................................................................. 2-110
2-124 Setup for Measuring the Harmonic Distortion ................................................................. 2-111
2-125 Trace of Harmonics .......................................................................................................... 2-112
2-126 Secondary Harmonics ....................................................................................................... 2-113
2-127 Tertiary Harmonics ........................................................................................................... 2-113
2-128 Setup for Measuring the Third Order Intermodulation Distortion ................................... 2-114
2-129 Third Order Intermodulation Distortion ........................................................................... 2-115
F-3
Page 20

R3267 Series Spectrum Analyzer Operation Manual (Vol.1)
List of Illustrations
No. Title Page
2-130 Third Order Intermodulation Distortion (Peak Æ Ref) .................................................... 2-116
2-131 Measurement Result of the Third Order Intermodulation Distortion ............................... 2-116
2-132 Setup for Measuring AM Signal ...................................................................... ..... ...... ...... 2-117
2-133 AM Signal with Low Modulation Factor ......................................................................... 2-118
2-134 Relationship between DLevel (dB) and Modulation Factor m(%) ................................... 2-119
2-135 Setup for Measuring FM Signal ........................................................................................ 2-120
2-136 Trace of an FM Signal ...................................................................................................... 2-121
2-137 Measuring a frequency deviation ...................................................................................... 2-121
2-138 Modulation Frequency of the FM Signal .......................................................................... 2-122
2-139 Setup for Measuring Modulation Index ............................................................................ 2-123
2-140 FM Signal with Low Modulation Index ........................................................................... 2-124
2-141 Setup for Measuring Pulsed RF Signal ............................................................................. 2-125
2-142 Spectrum of a Pulsed Signal ............................................................................................. 2-127
2-143 Measuring Peak Power ..................................................................................................... 2-127
2-144 Measuring the pulse repetition frequency ......................................................................... 2-129
2-145 Selecting Destination Device ............................................................................................ 2-131
2-146 Save Item Setup dialog box .............................................................................................. 2-131
2-147 File Saved ......................................................................................................................... 2-132
2-148 File Protection Enabled ..................................................................................................... 2-133
2-149 Selected File ...................................................................................................................... 2-135
2-150 Read Data .......................................................................................................................... 2-135
2-151 File to Be Deleted ............................................................................................................. 2-136
2-152 File Already Deleted ......................................................................................................... 2-136
2-153 Specifying ......................................................................................................................... 2-138
2-154 File Dialog Box ................................................................................................................. 2-139
2-155 Printer dialog box ........................................................... ...... ..... ........................................ 2-141
2-156 Floppy Disk Write Protection ........................................................................................... 2-142
2-157 Media Menu ...................................................................................................................... 2-143
2-158 Slots in the Memory Card Drive ....................................................................................... 2-144
2-159 Date/Time Dialog Box ...................................................................................................... 2-146
2-160 Dialog Box Used to Enter Labels ..................................................................................... 2-147
2-161 Displaying the Screen Label ............................................................................................. 2-148
4-1 Input Section Block Diagram ........................................................................................... 4-1
4-2 Relationship between the Input and Output of the Mixer ................................................. 4-1
4-3 Full Screen Mode .............................................................................................................. 4-3
4-4 Separate Screen Mode ...................................................................................................... 4-4
4-5 Characteristics of the Root Nyquist Filter ........................................................................ 4-6
4-6 Internal Block Diagram .................................................................................................... 4-8
4-7 Generating the Internal Gate Signal .................................................................................. 4-9
4-8 Eye Opening Ratio Calculation (Using No Measurement Window) ................................ 4-10
4-9 Eye Opening Calculation (Using the Measurement Window) ......................................... 4-11
4-10 RMS Phase Jitter Measurement Method .......................................................................... 4-12
5-1 Arrangement of the Three Status Registers ...................................................................... 5-15
5-2 Details of the Three Status Registers ................................................................................ 5-16
5-3 Structure of the Status Byte Register ................................................................................ 5-18
5-4 Relationship between Screen Graticule and Trace Data ................................................... 5-52
F-4
Page 21

R3267 Series Spectrum Analyzer Operation Manual (Vol.1)
List of Illustrations
No. Title Page
5-5 Parameter Setup ................................................................................................................ 5-59
5-6 Connection Between the Controller and the analyzer ...................................................... 5-60
5-7 Cable Wiring Diagram ...................................................................................................... 5-61
5-8 Data Format ...................................................................................................................... 5-61
A-1 Bandwidth Selectivity ....................................................................................................... A-9
A-2 Bandwidth Switching Uncertainty .................................................................................... A-10
A-3 IF Gain Uncertainty .......................................................................................................... A-10
A-4 Noise Sidebands ................................................................................................................ A-11
A-5 Occupied Bandwidth .........................................................................................................A-12
A-6 Resolution Bandwidth .......................................................................................................A-13
A-7 Spurious Response ............................................................................................................ A-14
A-8 V.S.W.R ............................................................................................................................ A-14
F-5
Page 22

R3267 Series Spectrum Analyzer Operation Manual (Vol.1)
LIST OF TABLES
No. Title Page
1-1 Standard Accessories List .................................................................................................1-2
1-2 Power Cable Options ........................................................................................................ 1-3
1-3 Power Supply Specifications ............................................................................................ 1-5
2-1 Correction ........................................................................................................................ 2-29
2-2 Calibration Items ............................................................................................................... 2-61
2-3 Setting Limit Line 1 .......................................................................................................... 2-66
2-4 Setting Limit Line 2 .......................................................................................................... 2-66
2-5 Recommended Printers ..................................................................................................... 2-140
3-1 Center Frequency Set Resolution vs. Frequency Span ..................................................... 3-86
3-2 Values for RBW, VBW and Sweep-Time (using AUTO) ................................................ 3-86
3-3 Factory Defaults ................................................................................................................ 3-87
3-4 Default Settings (1 of 3) .................................................................................................... 3-87
3-5 Parameters Range ............................................................................................................. 3-90
5-1 A Key/B Key (Trace A/Trace B) (1 of 3) ......................................................................... 5-21
5-2 ATT Key (Attenuator) ......................................................................................................5-23
5-3 CAL Key (Calibration) .....................................................................................................5-24
5-4 CONFIG Key (Configuration) .......................................................................................... 5-25
5-5 COUPLE Key (Couple Function) ..................................................................................... 5-26
5-6 FORMAT Key (Display Format) (1 of 2) ........................................................................ 5-27
5-7 FREQ Key (Frequency) .................................................................................................... 5-29
5-8 LEVEL Key ...................................................................................................................... 5-30
5-9 MEAS Key ........................................................................................................................ 5-31
5-10 MKR key (1 of 2) .............................................................................................................. 5-32
5-11 MKR → Key (Maker →) .................................................................................................. 5-34
5-12 POWER Key (Power measurement) (1 of 2) .................................................................... 5-34
5-13 PRESET Key (Initialization) ............................................................................................ 5-36
5-14 RCL Key (Reading Data) ................................................................................................. 5-36
5-15 SAVE Key (Saving Data) ................................................................................................. 5-36
5-16 SPAN Key (Frequency Span) ........................................................................................... 5-36
5-17 SRCH Key (Peak Search) ................................................................................................. 5-37
5-18 SWP/SINGLE Key (Sweep Time) ................................................................................... 5-38
5-19 UTIL Key (Utility) (1 of 3) ............................................................................................... 5-39
5-20 WINDOW Key (Window) ................................................................................................ 5-42
5-21 Numeric keys/Step keys/Data knob/Unit keys (Entering data) ........................................ 5-43
5-22 Miscellaneous ................................................................................................................... 5-44
5-23 Trace Accuracy Specification Codes ................................................................................ 5-52
5-24 I/O formatI ........................................................................................................................ 5-53
T-1
Page 23

1 INTRODUCTION
This chapter includes the accessories along with information on the analyzers’ operating environment, and
information on how to perform a system checkout for users who operate the analyzer for the first time.
1.1 Product Description
The R3267 Series spectrum analyzers are high-performance and multi-featured analyzers (with basic functions) that respond to customer demands for the Future Public Land Mobile Telecommun ication System and
have a high ratio of C/N (carrier to noise).
The key features of the analyzer are listed below:
• Wide frequency ranges: R3264 9 kHz to 3.5 GHz
• Excellent signal purity: -110 dBc/Hz 10 kHz offset
• Low noise level: R3264 -146 dBm/Hz or less (at 2 GHz)
R3267 Series Spectrum Analyzer Operation Manual (Vol.1)
1.1 Product Description
R3267 100 Hz to 8 GHz
R3273 100 Hz to 26.5 GHz
R3267/73 -148 dBm/Hz or less (at 2 GHz)
• High-speed zero span sweep: 1 µsec
• Precision level measurements
• High-speed measurements with 20 traces/sec
• Various types of interface that permit an easy systematization: GPIB, parallel and RS232 interfaces
• A 3.5-inch floppy disk drive equipped as standard (Compatible with MS-DOS)
1-1
Page 24
R3267 Series Spectrum Analyzer Operation Manual (Vol.1)
1.2 Accessories
1.2 Accessories
Table 1-1 lists the standard accessories shipped with the analyzer. If any of the accessories are damaged or
missing, contact a sales representative. Order new accessories by type name.
Table 1-1 Standard Accessories List
Name of accessory Type name Quantity Remarks
Power cable A01413 1 *1
Input cable A01036-0150 1
N-BNC through connector JUG-201A/U 1
Power fuse T6.3A/250V 1
Front cover 1 *2
R3267 Series Operation manual ER3267/73 1 English
* 1: Depends on the type specified when purchasing the R3267 Series
(see Table 1-2).
*2: The front cover does not come with the analyzer when OPT 85 (JIS Rack
Mount Set) or OPT 86 (EIA Rack Mou nt S et ) is specified in a purchase or der.
1-2
Page 25
R3267 Series Spectrum Analyzer Operation Manual (Vol.1)
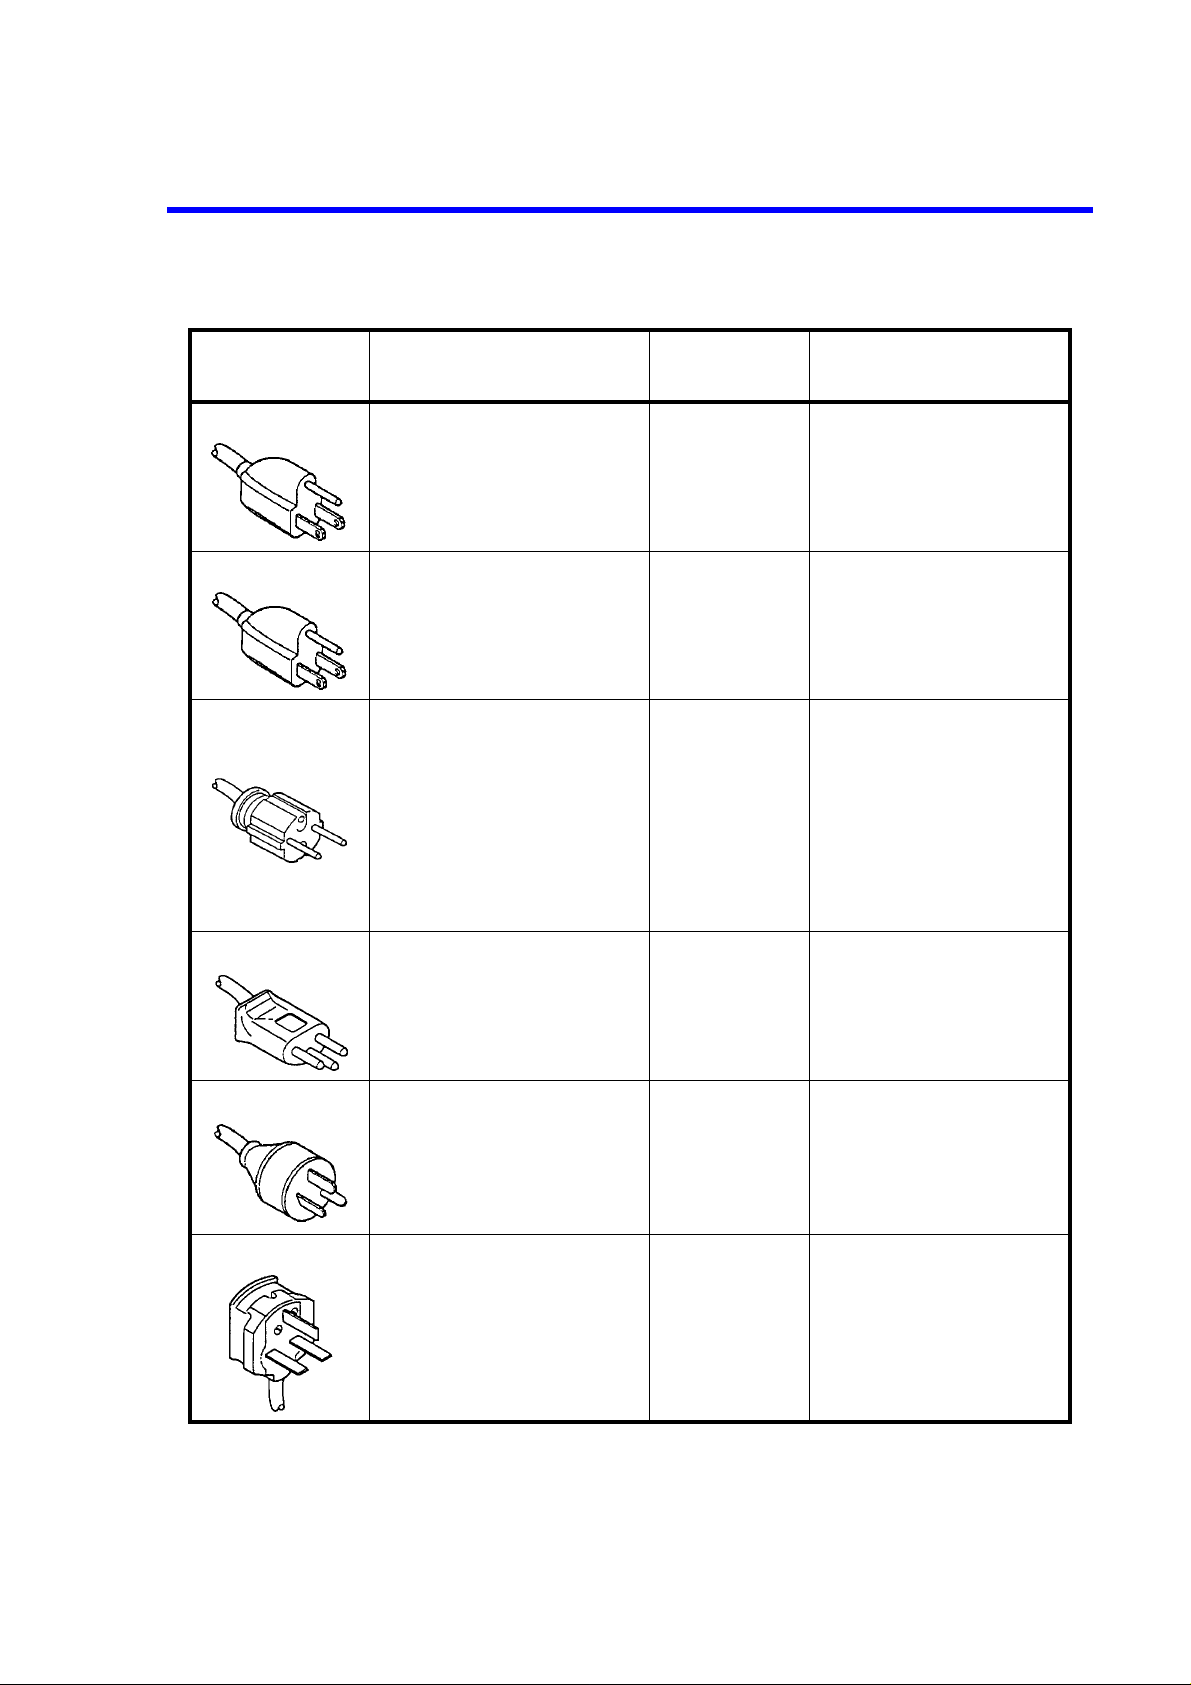
Table 1-2 Power Cable Options
1.2 Accessories
Plug configuration Standards
JIS: Japan
Law on Electrical Appliances
UL: United States of America
CSA: Canada
CEE: Europe
DEMKO: Denmark
NEMKO: Norway
VDE: Germany
KEMA: The Netherlands
CEBEC: Belgium
OVE: Austria
FIMKO: Finland
SEMKO: Sweden
Rating, color
and length
125 V at 7 A
Black
2 m (6 ft)
125 V at 7 A
Black
2 m (6 ft)
250 V at 6 A
Gray
2 m (6 ft)
Model number
(Option number)
Straight: A01402
Angled: A01412
Straight: A01403
(Option 95)
Angled: A01413
Straight: A01404
(Option 96)
Angled: A01414
SEV: Switzerland 250 V at 6 A
Gray
2 m (6 ft)
SAA: Australia, New Zealand 250 V at 6 A
Gray
2 m (6 ft)
BS: United Kingdom 250 V at 6 A
Black
2 m (6 ft)
Straight: A01405
(Option 97)
Angled: A01415
Straight: A01406
(Option 98)
Angled: ---------
Straight: A01407
(Option 99)
Angled: A01417
1-3
Page 26
R3267 Series Spectrum Analyzer Operation Manual (Vol.1)
1.3 Operating Environment
1.3 Operating Environment
This section describes the environmental c onditions and power requirements n ecessary to u se the R326 7 Series.
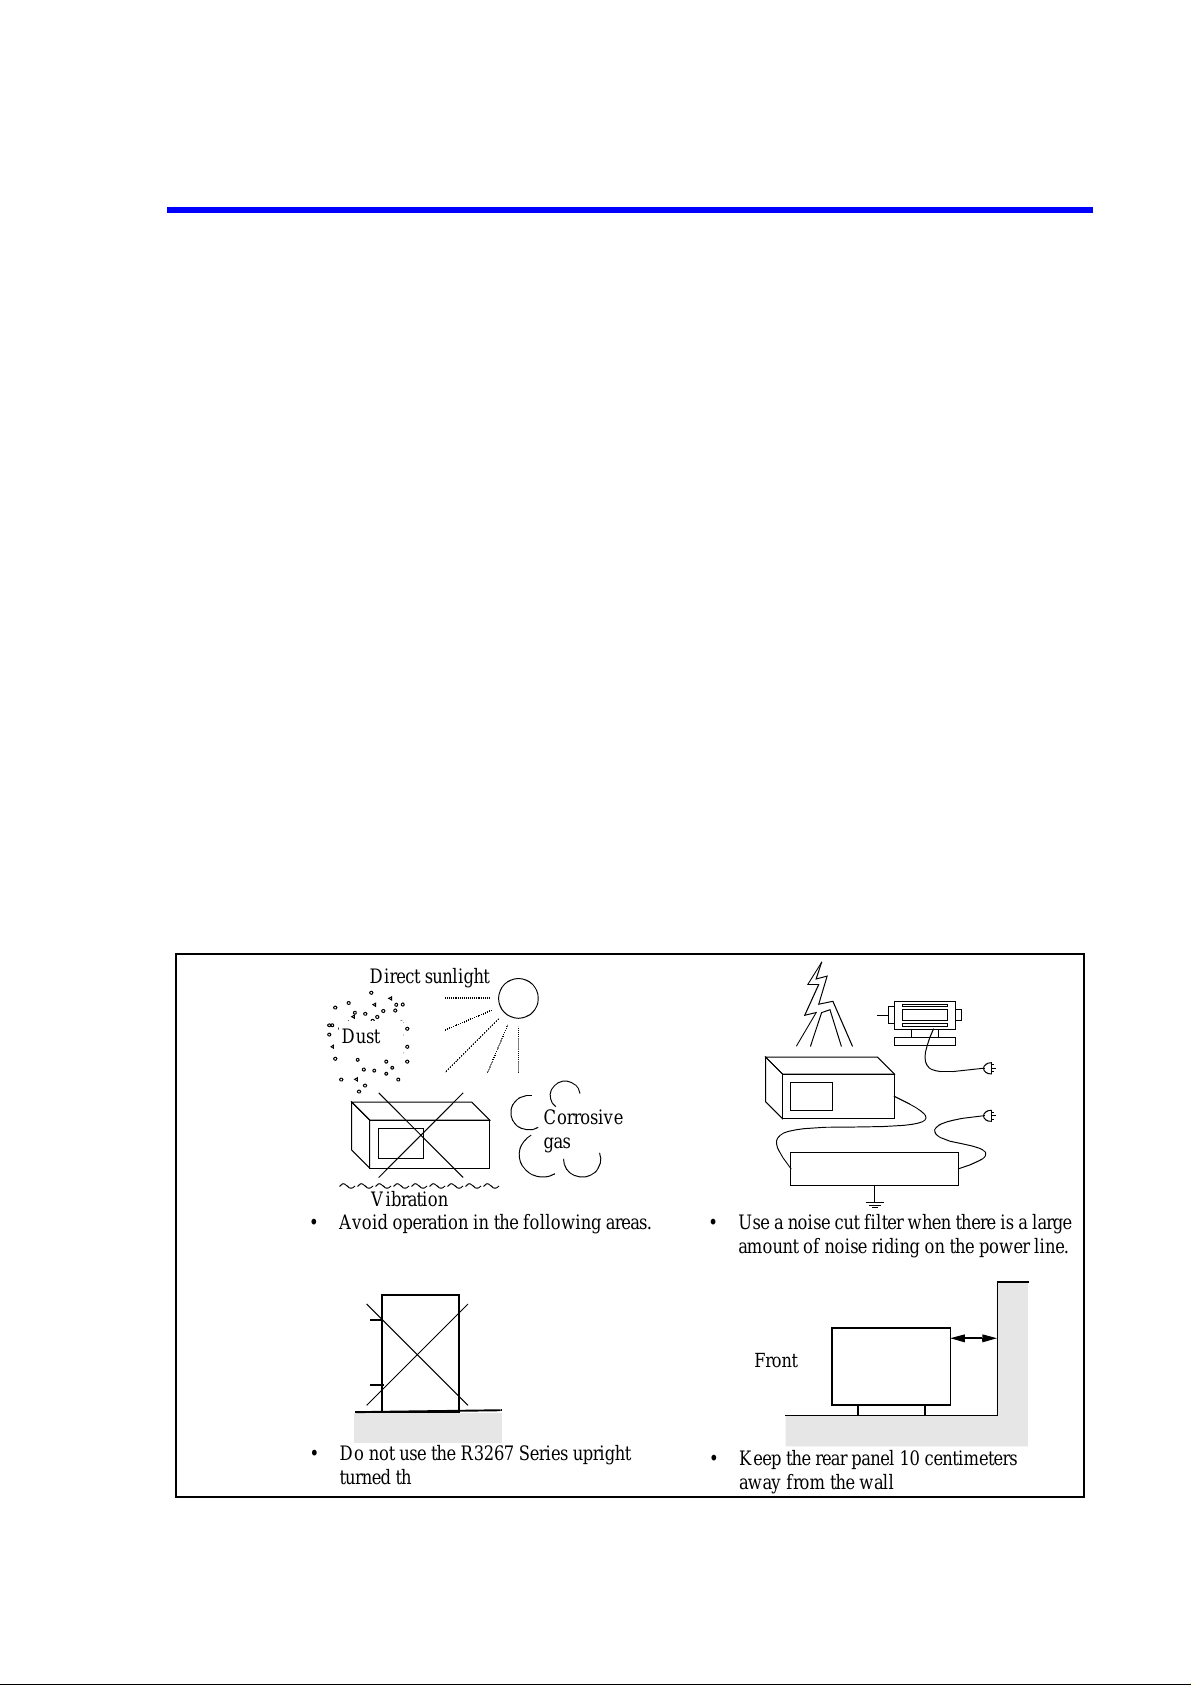
1.3.1 Environmental Conditions
The R3267 Series should be only be used in an area which satisfies the following conditions:
• Ambient temperature: 0°C to +50°C (operating temperature)
• Relative humidity: 85% or less (without condensation)
• An area free from corrosive gas
• An area away from direct sunlight
• A dust-free area
• An area free from vibrations
• A low noise area
Although the R3267 Series has been designe d to withstand a certain amoun t of noise ri ding on the A C
power line, it should be used in an area of low noise. Use a noise cut filter when ambient noise is
unavoidable.
• An area allowing unobstructed air flow
There is an exhaust cooling fan on the rear panel and exhaust vents on both sides and the bottom
(toward the front) of the R3267 Series. Never block the fan and these vents.
Keep the rear panel 10 centimeters away from the wall. In addition, do not use the R3267 Series
upright turned the rear panel side down. The resulting internal temperature rise will affect measurement accuracy.
Direct sunlight
Dust
Corrosive
gas
Line Filter
Vibration
• Avoid operation in the following areas.
Front
• Use a noise cut filter when there is a large
amount of noise riding on the power line.
Front
1-4
• Do not use the R3267 Series upright
turned the rear panel side down.
Figure 1-1 Operating Environment
• Keep the rear panel 10 centimeters
away from the wall
Page 27
R3267 Series Spectrum Analyzer Operation Manual (Vol.1)
1.3.2 Power Su pply Specifications
The R3267 Series can be used safely under the following conditions:
• Altitude of up to 2000 m
• Installation Categories II
• Polluti on Degree 2
1.3.2 Power Supply Specifications
The power supply specifications of the R3267 Series are listed in Table 1-3.
Table 1-3 Power Supply Specifications
100 VAC Operation 220 VAC Operation Remarks
Input voltage range 90 V to 132 V 198 V to 250 V Automatically switches
Frequency range 48Hz to 66Hz
Power consumption 300 VA or below
between input levels of
100 VAC and 220 VAC.
CAUTION To prevent damage, ope rate the R3267 Series within the specified input voltage and freq uency
1.3.3 Power Fuse
CAUTION:
1. When a fuse blows, there may be some problem with the R3267 Series. Contact a sales representative before
replacing the fuse.
2. For fire prevention, use only fuses with the same rating and same type.
The power fuse is placed in the fuse holder which is mounted on the rear panel. A spare fuse is located in
the fuse holder.
To check or replace the power fuse, use the following procedure:
ranges.
1. Press the
2. Press the
POWER
MAIN POWER
switch (on the front panel) to the OFF position.
switch (on the rear panel) to the OFF position.
3. Disconnect the power cable from the AC power outlet.
4. Remove the fuse holder on the rear panel (See Figure 1-2).
5. Check (and replace if necessary) the power fu se and put it back in the fuse holder.
1-5
Page 28

R3267 Series Spectrum Analyzer Operation Manual (Vol.1)
r
1.3.3 Power Fuse
Power fuse
Fuse holder (removed)Fuse holder (removed)
Use a flat blade screwdrive
Figure 1-2 Replacing the Power Fuse
1-6
Page 29
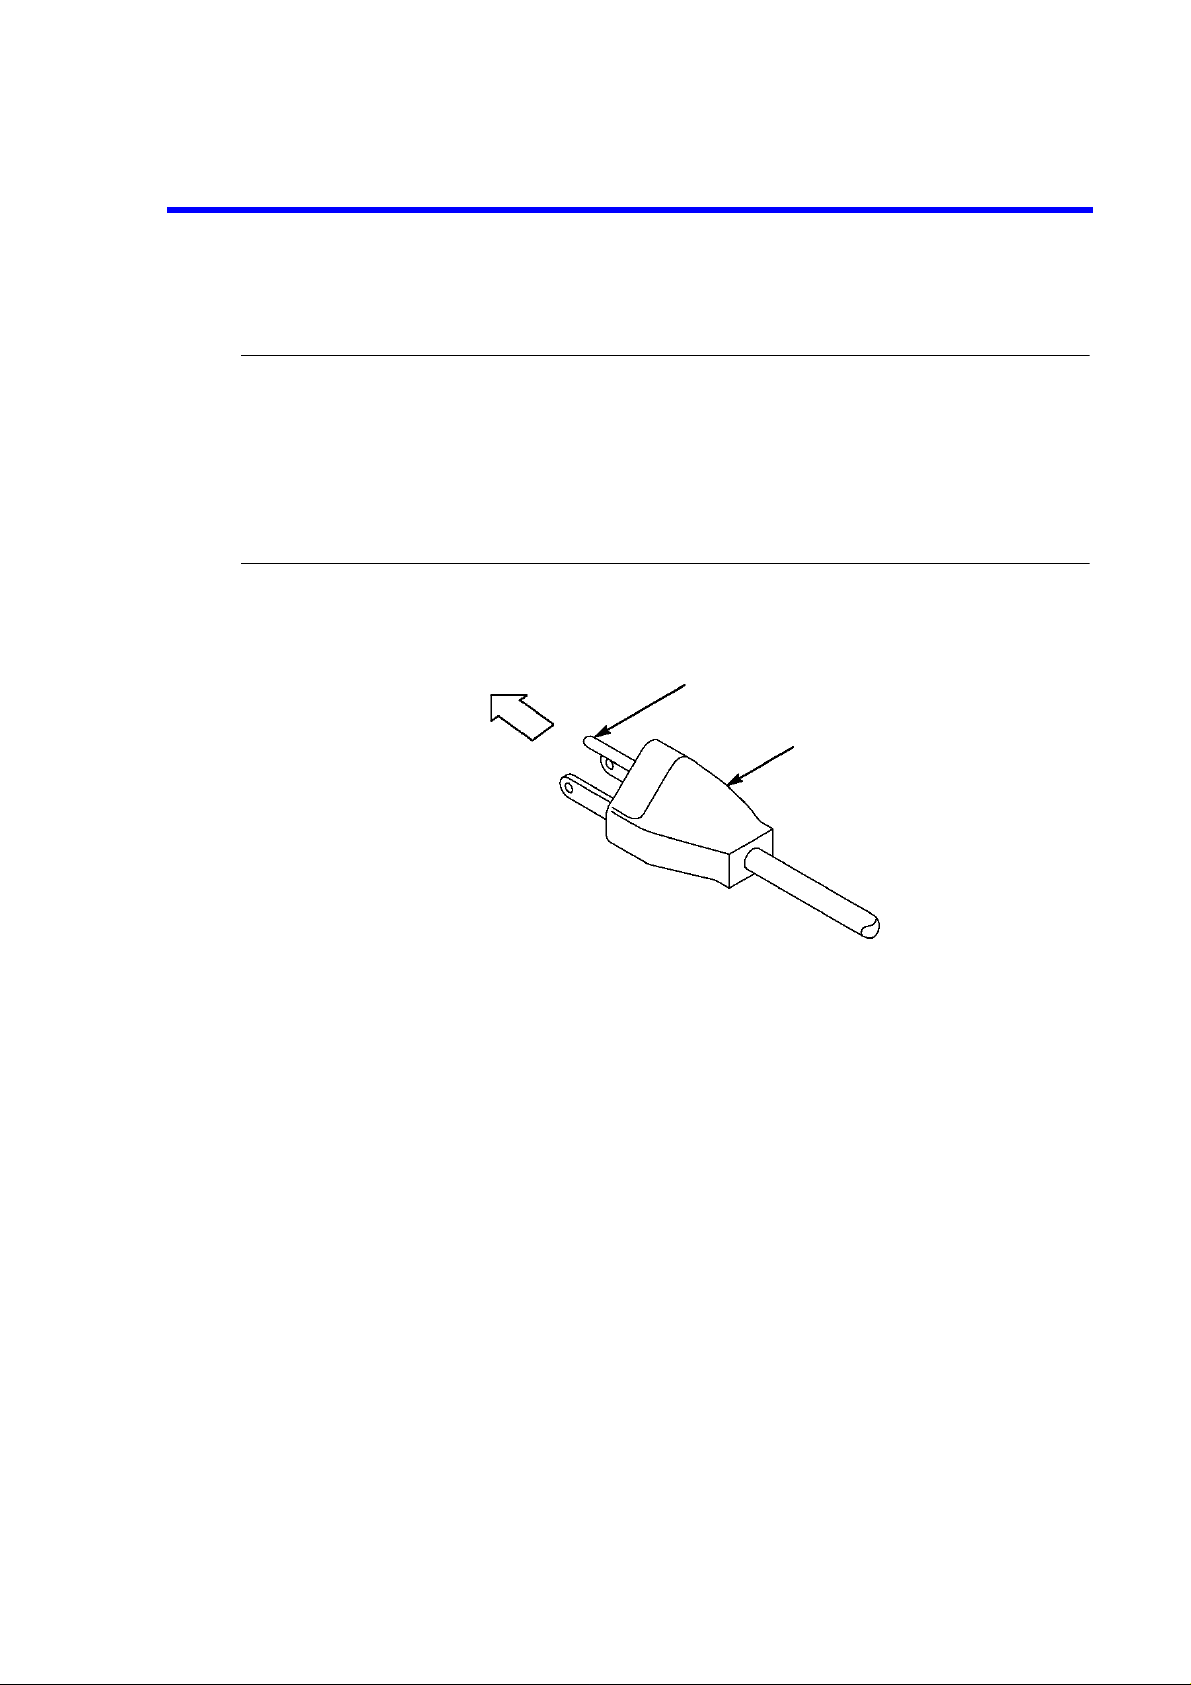
1.3.4 Power Cable
3-pin power cable
CAUTION:
1. Use a power cable rated for the voltage in question. Be sure however to use a power cable conforming to safety
standards of your nat ion when using a product overseas (See Table 1-2).
2. Be sure to plug the power cable into an electrical outlet which has a safety ground terminal. Grounding will
be defeated if you use an extension cord which dose not include a safety ground terminal.
3. Turn the MAIN POWER switch (on the rear panel) and the POWER switch (on the front panel) off prior to
connecting the power cab le.
R3267 Series Spectrum Analyzer Operation Manual (Vol.1)
1.3.4 Power Cable
To AC power outlet Ground pin
Figure 1-3 Power Cable
1-7
Page 30

R3267 Series Spectrum Analyzer Operation Manual (Vol.1)
1.4 Precautions in Use
1.4 Precautions in Use
(1) Before starting the measurement
When turning on the power, don’t connect DUT.
Before starting the measurement, check to see the output power level.
(2) Removing of case
Do not open the case to one except service man of our company.
The R3267 Series has a high temperature part and a high pressure part.
(3) When abnormality occurs
When smoke rises from the R3267 Series, smell nastily, o r rear unusual sound feel, turn off the
power switch. Pull out power cable from the outlet. And contact to our company.
The address and the telephone number of our company are in the end of this manual.
(4) Electromagnetic interference.
Electromagnetic interference may be caused to the television or the radio.
If the R3267 Series power is turned off and the electromagnetic interference is reduced, then the
R3267 Series has caused the problem.
Prevent electromagnetic interference by the following procedure.
• Change the direction of antenna of the television or the radio.
• Place the R3267 Series the other side of the television or the radio.
• Place the R3267 Series away from the television or the radio.
• Use another line of power source for the television or the radio than the R3267 Series.
(5) Prevention of Electrostatic Buildup
To prevent damages to semiconductor parts from electrostatic discharg e (ESD), the precautions
shown below should be taken. We recommend that two or more measures be combined to provide
adequate protection from ESD. (Static electricity can easily be built up when a person moves or an
insulator is rubbed.)
Countermeasure example
Human body: Use of a wrist strap (see Figure 1-4).
Floor in the work area: Installation of a conductive mat, the use of conductive shoes, and
grounding (see Figure 1-5).
Benchboard: Installation of a conductive mat and grounding (see Figure 1-6).
1-8
Page 31

Ground
Figure 1-4 Human body
Benchboard
R3267 Series Spectrum Analyzer Operation Manual (Vol.1)
1.4 Precautions in Use
Wrist strap
Equivalent resistance
Approx.1M
Ω
Copper foil
tape
Conductive mat
Benchboard
Floor
Conductive
shoes
Conductive
mat
Figure 1-5 Floor in the work area
Conductive mat
Benchboard
Ω
1M
Equivalent resistance
6
9
Ω
10
to 10
Ω
1M
Ground
Conductive mat
Conductor
Ω
1M
Benchboard
1M
Ω
1M
Ω
(Method 1)
Ground
(Method 2)
Ground
Figure 1-6 Benchboard
Ground
(Method 3)
1-9
Page 32
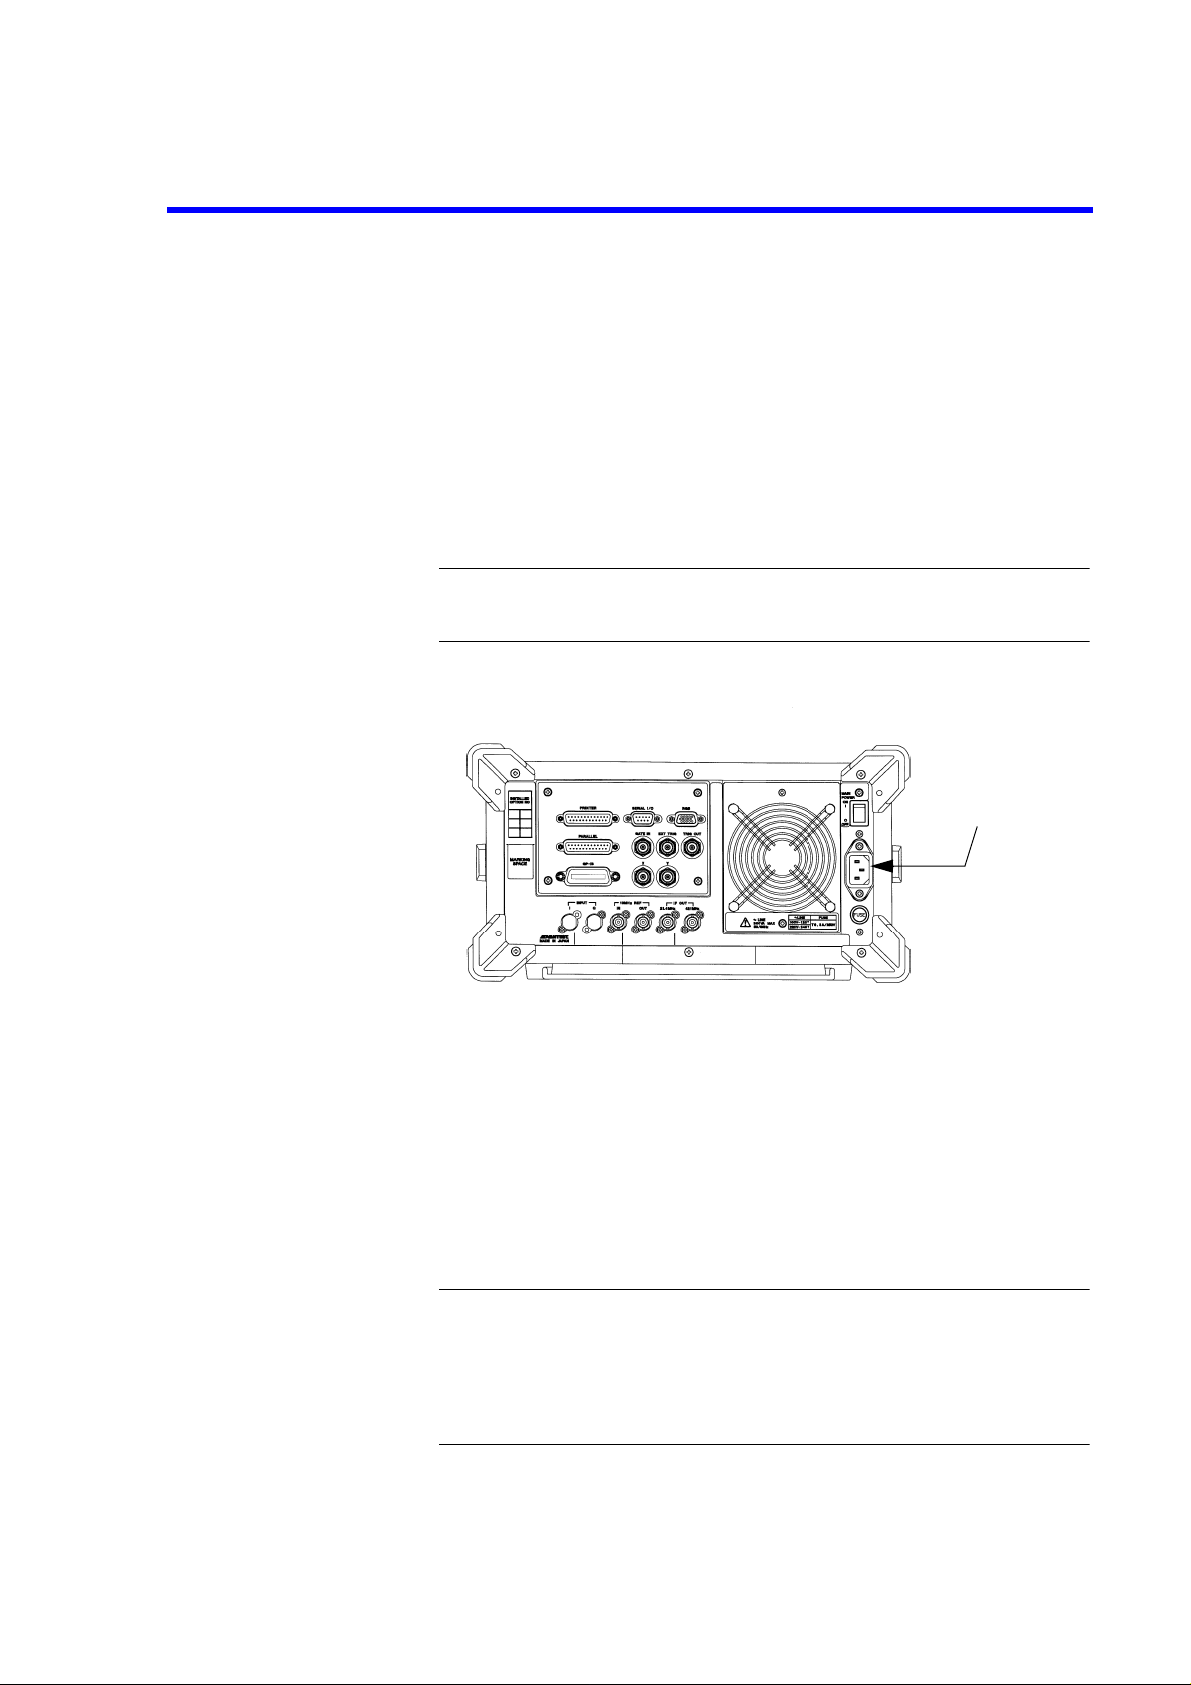
R3267 Series Spectrum Analyzer Operation Manual (Vol.1)
1.5 System Checkout
1.5 System Checkout
This section describes the Selftest which must be performed when operating the R3267 Series for the first
time. Follow the procedure below:
1. Check to see that the
POWER
switch (on the rear panel) are turned off.
POWER
switch (on the front panel) and the
MAIN
2. Connect the power cable provided to the AC power supply connector on the rear
panel.
CAUTION: To prevent damage, operate th e R3267 Series within specified input
voltage and frequency ranges.
AC power supply
connector
1-10
Figure 1-7 Connecting the Power Supply Ca ble
3. Connect the power cable to the outlet.
4. Turn on the
5. Turn on the
MAIN POWER
POWER
switch (on the front panel).
switch (on the rear panel).
The R3267 Series performs the Initial test (processing time: approximately 10
seconds). The start-up screen is displayed as shown in Figure 1-8.
NOTE:
1. There is a possibility that the screen displa y is differe nt from the one shown in Fig-
ure 1-8, depen ding on previously saved conditions.
2. An error message will be displayed when an abnormal conditio n is detected. Refer
to the list of error messages to solve the problem (Refer to Section A.2).
Page 33
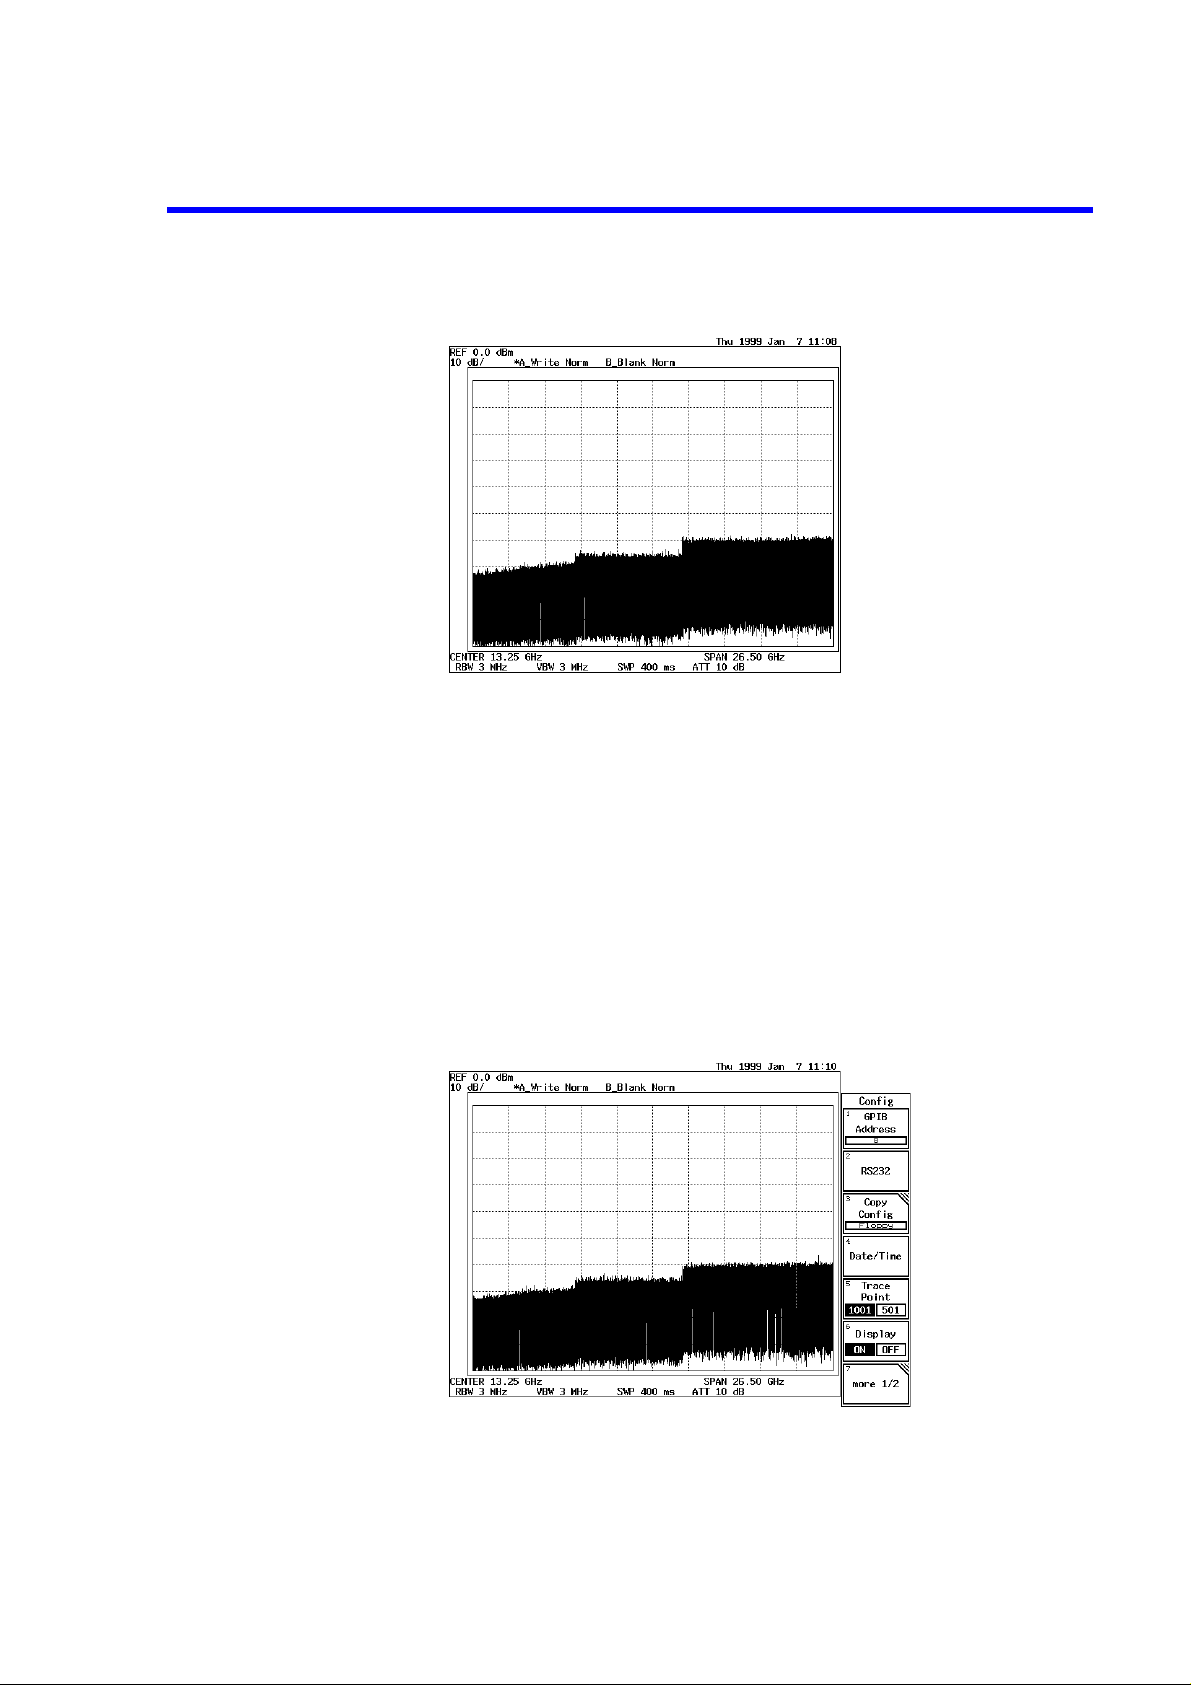
R3267 Series Spectrum Analyzer Operation Manual (Vol.1)
Figure 1-8 Start-up Screen
1.5 System Checkout
6. Attach the N-BNC adapter to the
nect the Input cable from the
7. Press
The SHIFT lamp lights.
8. Press
The default settings have now been reset.
The start-up screen is displayed as shown in Figure 1-8.
9. Press
The Config menu is displayed.
.
SHIFT
CONFIG(PRESET)
CONFIG
.
INPUT
CAL OUT
.
connector on the front panel and con-
connector to the
INPUT
connector.
Figure 1-9 Config Menu
10. Press
more 1/2
The Selftest menu is displayed.
and
Selftest
.
1-11
Page 34
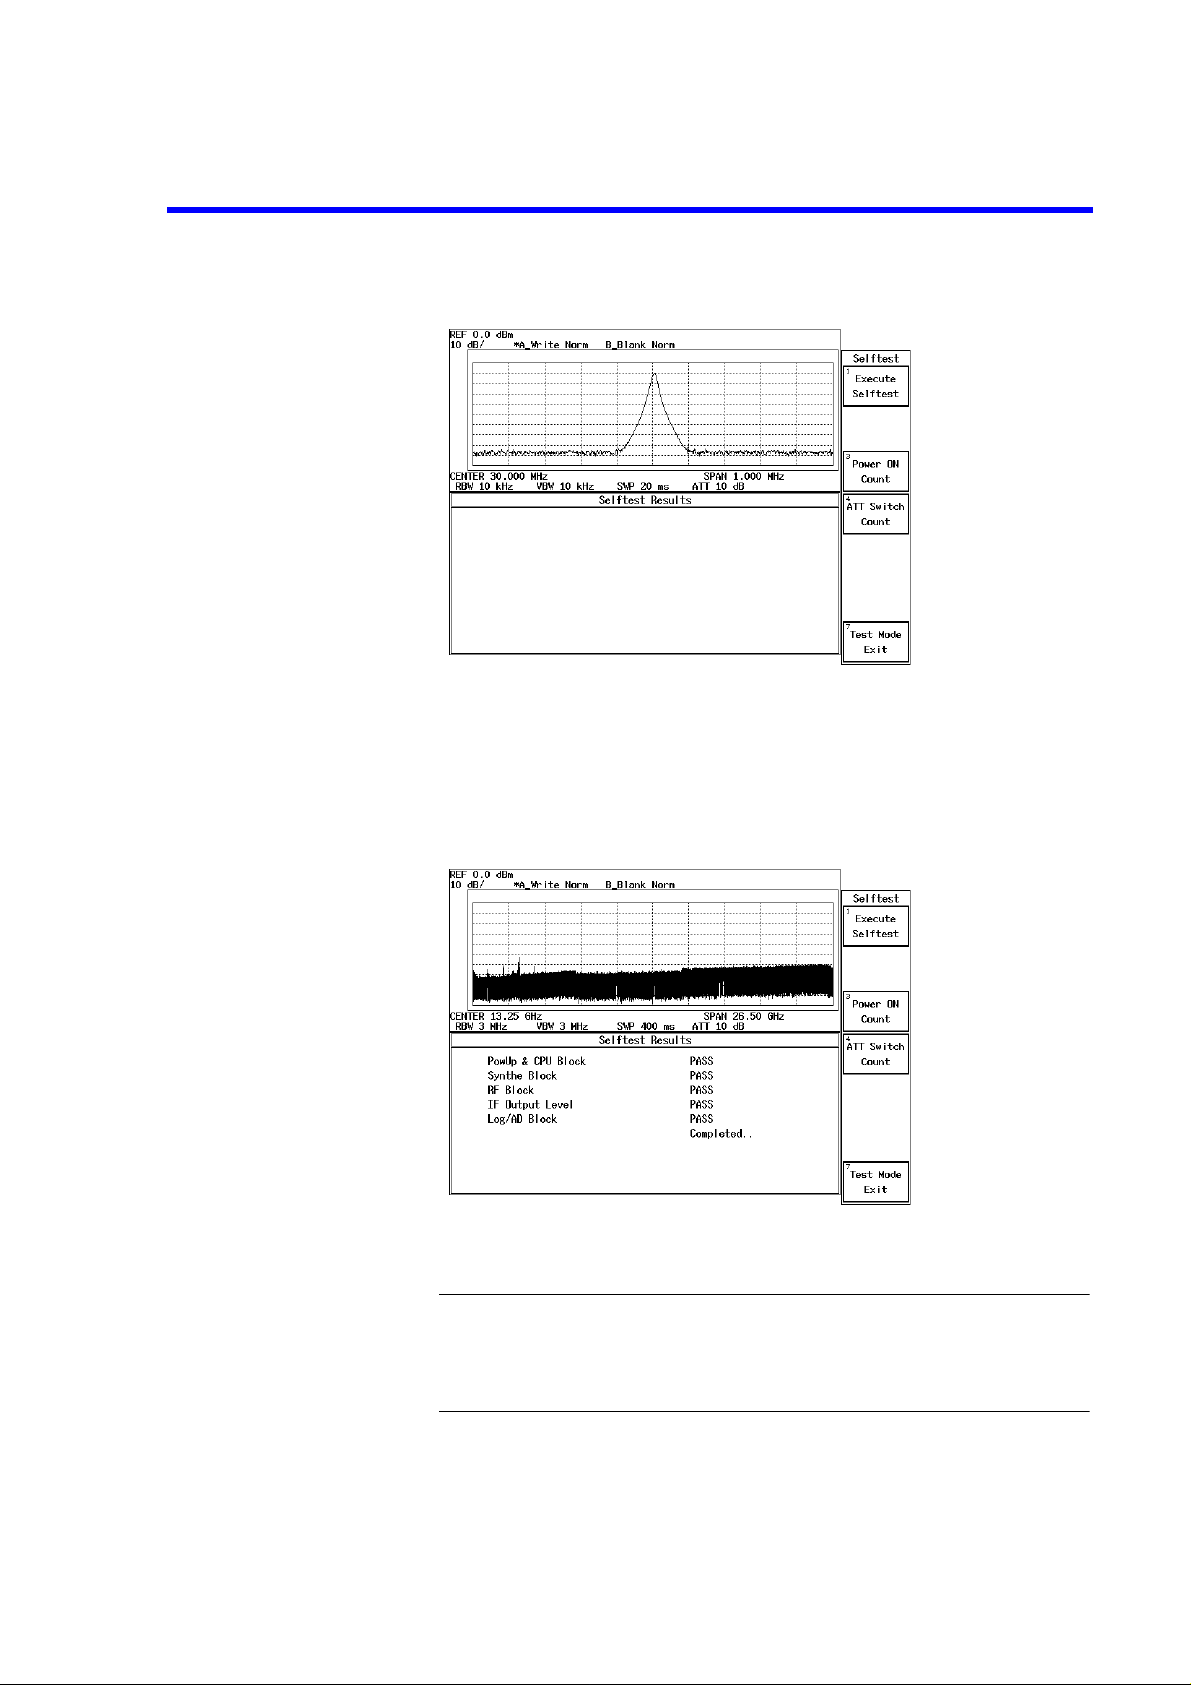
R3267 Series Spectrum Analyzer Operation Manual (Vol.1)
1.5 System Checkout
Figure 1-10 Selftest Menu
11. Press
Execute Selftest
.
The selftest consisting of following items is executed in sequence and the result
is displayed.
Figure 1-11 Selftest Result
NOTE: If the Selftest detects any errors, do not attempt to use the R3267 Series any
further. Contact a sales representative as soon as possible. If the selftest is
executed without a calibra tion signa l, it fai ls, so ma ke sure to sup ply t he calibration signal.
1-12
12. Press
RETURN
.
This completes the system checkout.
Page 35
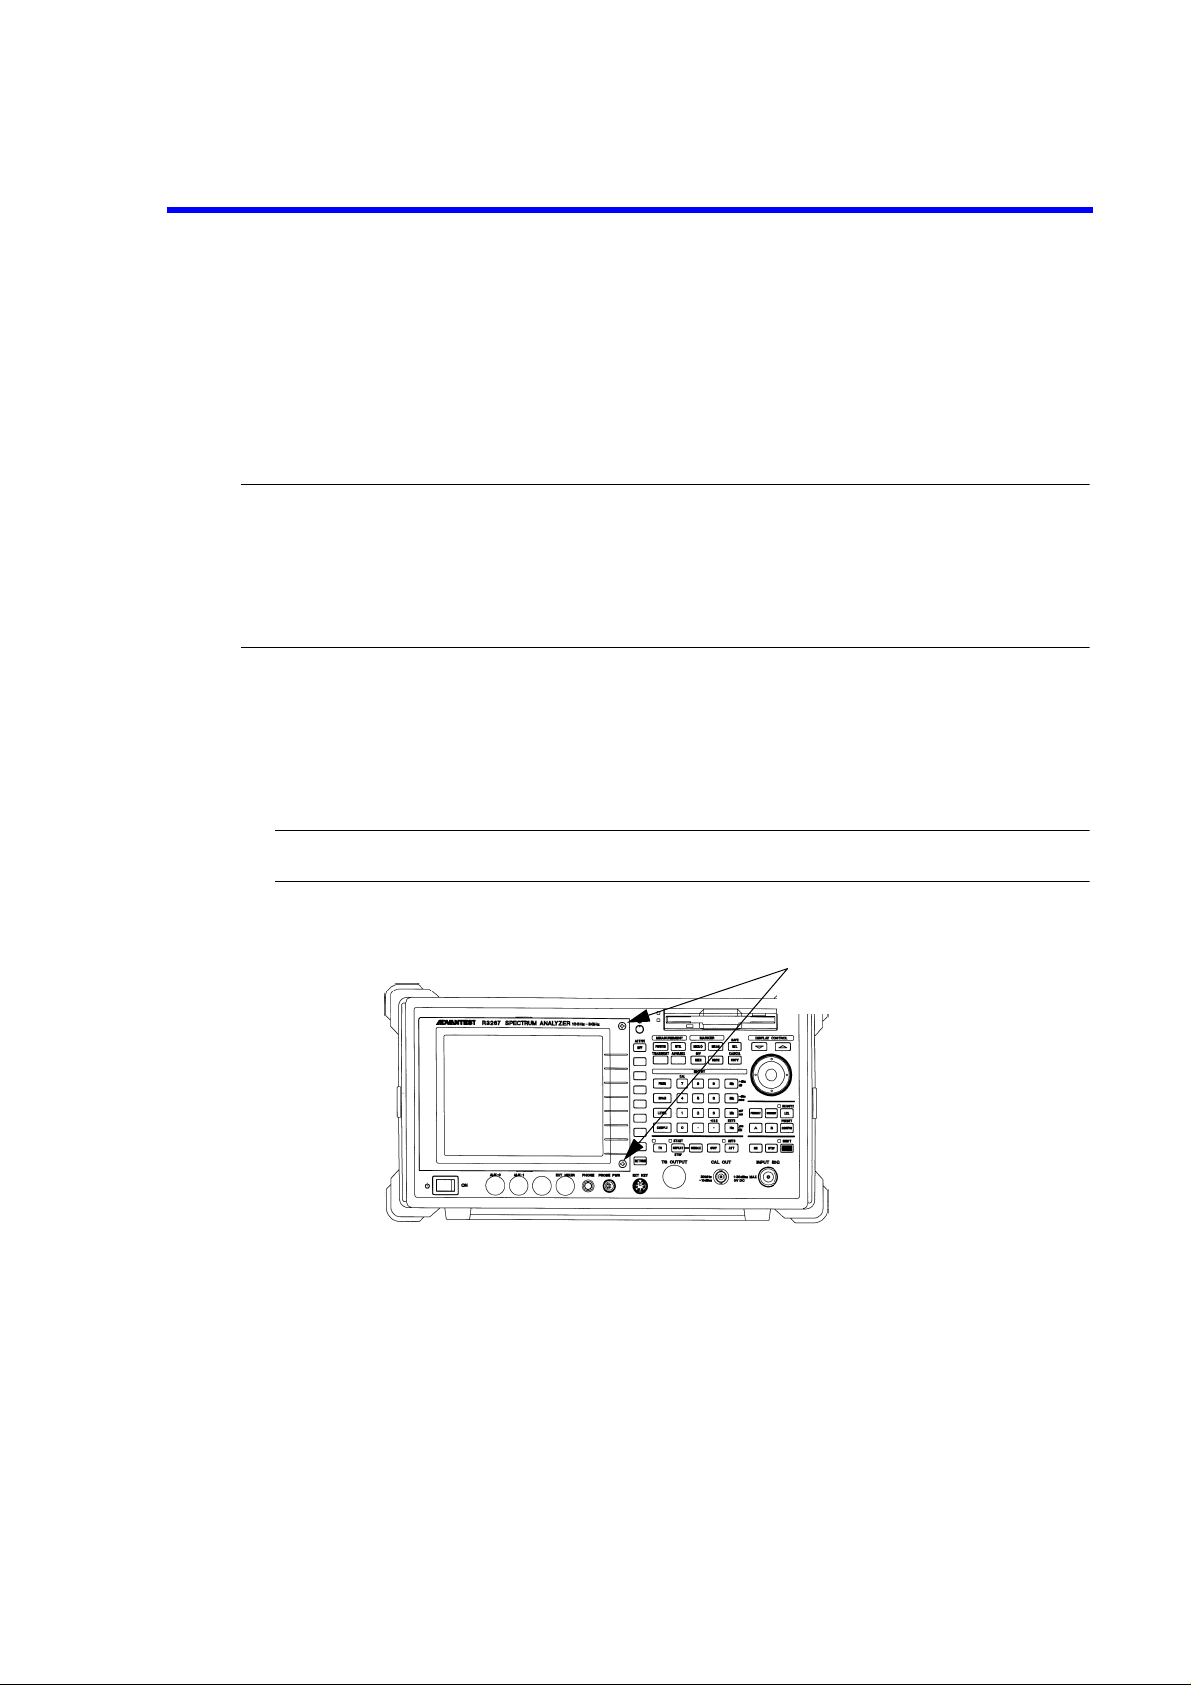
R3267 Series Spectrum Analyzer Operation Manual (Vol.1)
Display filter comes off
by removing two screws
1.6 Cleaning, Storing and Transporting the R3267 Series
1.6 Cleaning, Storing and Transporting the R3267 Series
1.6.1 Cleaning
Remove dust from the outside of the R3267 Series by wiping or brushing the surface with a soft cloth or
small brush. Use a brush to remove dust from around the panel keys. Hardened dirt can be removed by
using a cloth which has been dampened in water containing a mild detergent.
CAUTION:
1. Do not allow water to get inside the R3267 Series.
2. Do not use organic cleaning solvents, such as benzene, toluene, xylene, acetone or similar compounds, since
these solvents may damage the plastic parts.
3. Do not use abrasive cleaners.
• Removing the Display Filter
Normally cleaning the display filter from the front shou ld be sufficie nt. However, if the inside of th e
filter or the LCD surface is dirty, you can detach the screen filter from the R3267 Series by removing
the two screws on the front and pulling the right-hand part of the filter forward. Clean the filter with a
piece of soft close.
CAUTION Do not touch the LCD display with your finger when the fi lter has been removed.
Figure 1-12 Removing the Display Filter
1-13
Page 36

R3267 Series Spectrum Analyzer Operation Manual (Vol.1)
1.6.2 Storing
1.6.2 Storing
Store the R3267 Series in an area which has a temperature from -20°C to +60°C. If you plan to store the
R3267 Series for a long period (more than 90 days), put the R3267 Series in a vapor-barrier bag with a
drying agent and store the R3267 Series in a dust-free location out of direct sunlight.
1.6.3 Transporting
When you ship the R3267 Series, use the original container and p acking material. If the original packaging
is not available, use the following repackaging guidelines:
1. To allow for cushioning, use a corrugated cardboard container that is at least 15
centimeters larger than those of the R3267 Series.
2. Surround the R3267 Series with protective sheeting.
3. Cushion the R3267 Series on all sides with packing material.
4. Seal the corrugated cardboard container with shipping tape or an industrial stapler.
If you are shipping the R3267 Series to a sales representative for service or repair, attach a tag to the R3267
Series that shows the following information:
• Owner and address
• Name of a contact person at your location
• Serial number of the R3267 Series (located on the rear panel)
• Description of the service requested
1-14
Page 37
1.7 About Calibration
When you want to calibrate the R3267 Series, please contact a sales representative.
Desirable Period One year
1.8 Concerning Limited-life Parts
The R3267 Series uses the following parts with limited life that are not listed in Safety Summary.
Replace the parts listed below after their expected lifespan has expired.
Part Name Life Description
Input attenuator R3264: 1 million times When the error message "Input ATT Cal failed" (under the
R3267: 2 million times
R3273: 5 million times
Mechanical relays 100,000 times Applicable to the relays used with Opt01 only.
R3267 Series Spectrum Analyzer Operation Manual (Vol.1)
1.7 About Calibration
message code "400") is displayed, run the user selftest.
If the RF BLOCK error occurred during the user selftest,
contact a sales representative.
1-15
Page 38
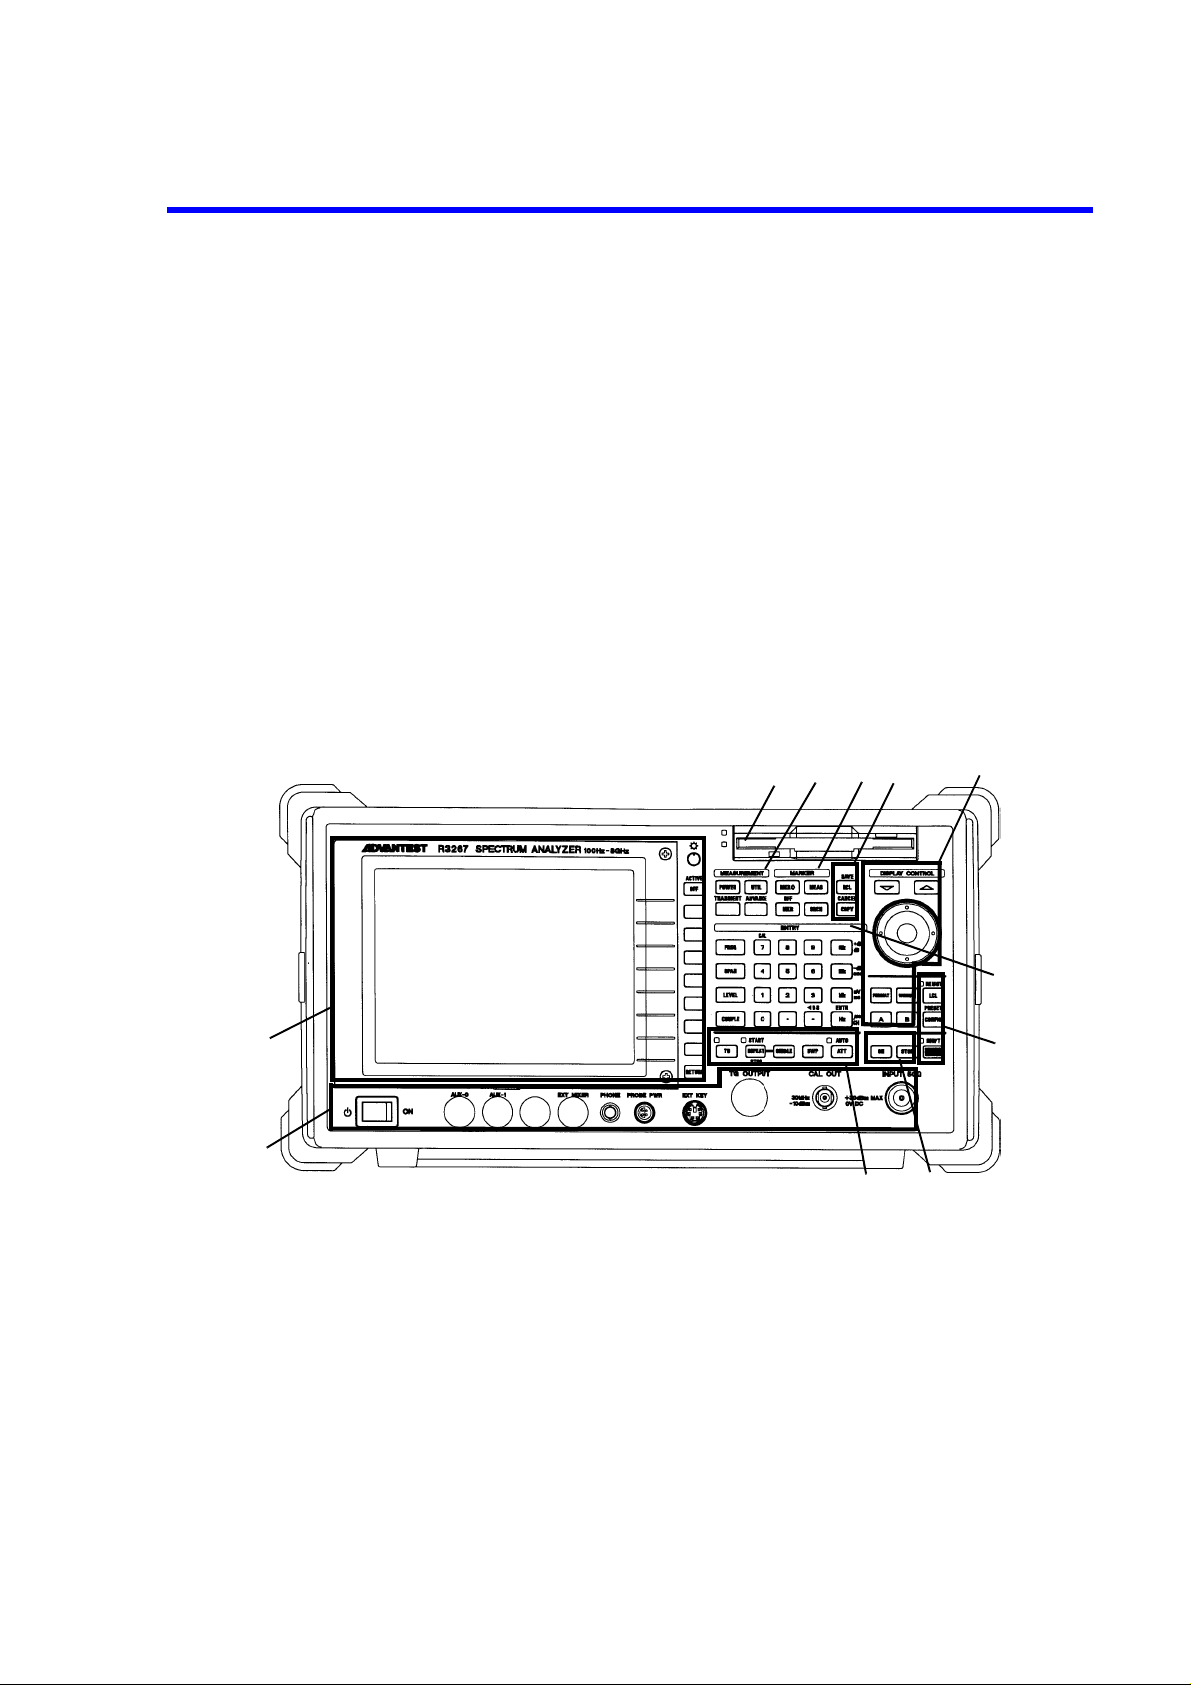
2 OPERATION
This chapter describes the following.
• Description on the front and rear panels
• Screen annotation
• Basic operation
• Measurement examples
• Expanded functions
2.1 Panel Description
This section describes the names, functions and screen annotations of the front and rear panels.
2.1.1 Front Panel
The panel keys and connectors are described below for each section of the front panel.
R3267 Series Spectrum Analyzer Operation Manual (Vol.1)
2.1 Panel Description
1
2
Figure 2-1 Front Panel
The front panel consists of 11 sections as shown below.
1. Display Section
2.
POWER
3. Floppy Disk Drive Section
4. MEASUREMENT Section
5. MARKER Section
6. Save/Recall Section
7. DISPLAY CONTROL Section
8. ENTRY Section
9. REMOTE Section
10. Control Section
11. Option Section
Switch/Connector Section
5
10
6
4
3
7
8
9
11
2-1
Page 39

R3267 Series Spectrum Analyzer Operation Manual (Vol.1)
2.1.1 Front Panel
2.1.1.1 Display Section
1
2
3
4
5
Figure 2-2 Display Section
1. Liquid crystal display (LCD) Displays trace and measured data.
2. Contrast control Adjusts the display contrast.
3.
ACTIVE OFF
4. Soft keys Seven keys corresponding to the soft-menu display on the left;
5.
RETURN
key Turns off the active area removing any displayed information.
pressing a soft key selects the corresponding menu item.
k ey Used to return the screen display to the previous level of the
hierarchical soft-menu structure.
2-2
Page 40
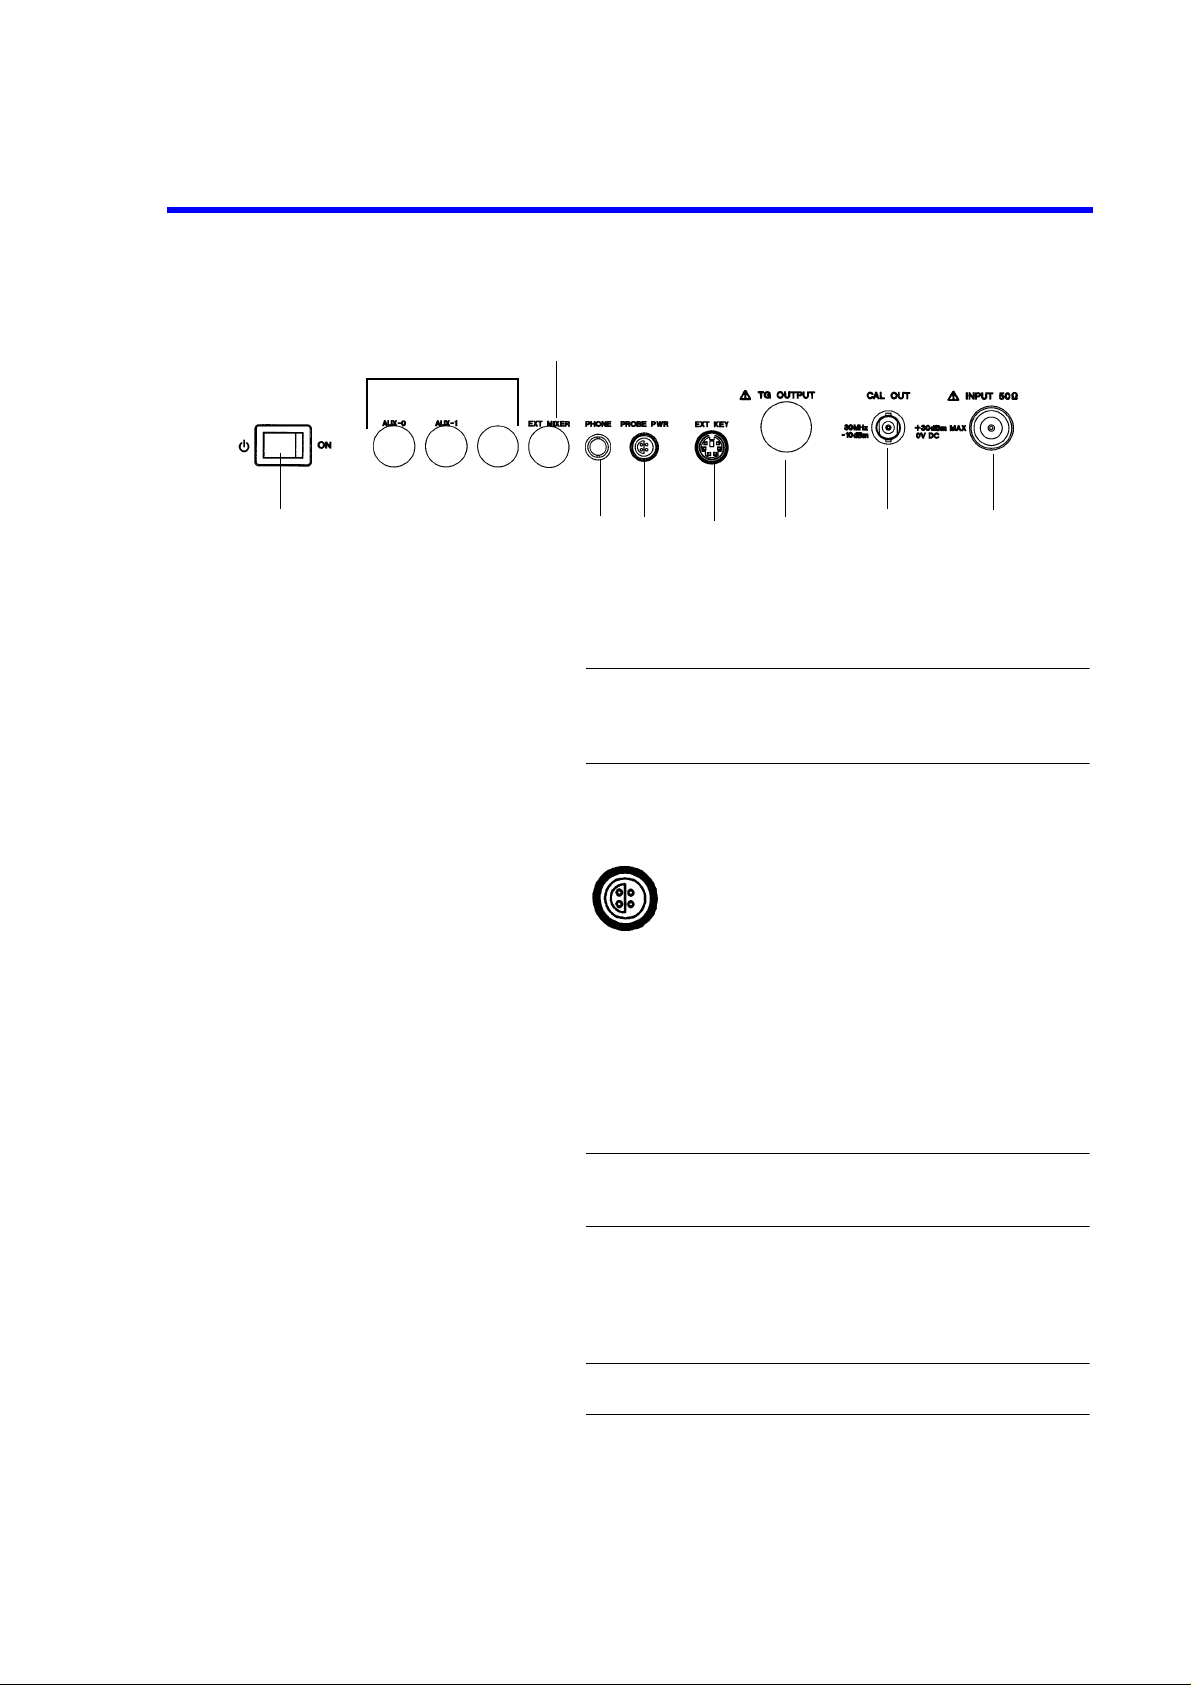
2.1.1.2 Power Switch/Connector Section
R3267 Series Spectrum Analyzer Operation Manual (Vol.1)
2.1.1 Front Panel
1
1.
POWER
2.
PHONE
3.
PROBE PWR
8
9
3
2
4
5
6
Figure 2-3 Power Switch/Connector Section
Switch Turns the power on or off.
CAUTION: To turn the analyzer power on, turn on the Main
Power switch (on the rear panel) and then turn this
POWER switch on.
connector Unused
connector Power supply for accessories such as the active probe.
1: NC
2: GND
3: -12.6V
4: +12.6V
1
2
4
3
7
(Not available when OPT 22 or OPT23 is installed.)
4.
EXT KEY
5.
TG OUTPUT
6.
CAL OUT
7.
INPUT
connector Unused
connector Outputs the TG signal. (option)
connector Outputs the calibration signal.
connector Inputs the signal to be measured.
CAUTION: Do not apply signal s whose RF level and D C voltage
8. Unused
9.
EXT MIXER
connector Used to connect an external mixer to widen measurable fre-
quency range.
CAUTION: The external mixer can be used only for the R3273.
exceed the values prescri bed by the specification.
2-3
Page 41

R3267 Series Spectrum Analyzer Operation Manual (Vol.1)
2.1.1 Front Panel
2.1.1.3 Floppy Disk Drive Section
1
Figure 2-4 Floppy Disk Drive Section
1. Eject button Used to eject floppy disks from the drive.
2. Floppy disk drive door Insert floppy disks here.
3. Access lamp Turns on when the floppy disk in the drive is being accessed.
2.1.1.4 MEASUREMENT Section
1
Figure 2-5 MEASUREMENT Section
3
2
2
3
4
2-4
1.
POWER
2.
UTIL
3.
TRANSIENT
4.
ADVANCE
key Used to measure power.
key Used to measure the occupied bandwidth (OBW), harmonics
and so on.
key Unused (option)
key Unused (option)
Page 42

2.1.1.5 MARKER Section
R3267 Series Spectrum Analyzer Operation Manual (Vol.1)
2.1.1 Front Panel
1.
2.
3.
4.
→
MKR
MEAS
MKR
OFF
SRCH
key Used to obtain marker values so that they can be used as data
key Used to set the measurement mode.
key Used to display t he marker.
key
(SHIFT, MKR)
key Used to search for the peak point on the trace.
2.1.1.6 Save/Recall Section
1
3
Figure 2-6 MARKER Section
for other functions.
Used to turn the marker off.
1
2
4
2
1.
2.
Figure 2-7 Save/Recall Section
key Used to recall set conditions and traces previously saved.
RCL
key
SAVE
COPY
CANCEL
(SHIFT, RCL)
key Us e d to outp u t the disp layed data to the printer or save it to a
key
(SHIFT, COPY)
Used to save measurement conditions and traces.
floppy disk.
Used to cancel the copy operation in progress.
2-5
Page 43

R3267 Series Spectrum Analyzer Operation Manual (Vol.1)
2.1.1 Front Panel
2.1.1.7 DISPLAY CONTROL Section
1
2
3
56
Figure 2-8 DISPLAY CONTROL Section
1. Step keys Used to enter data in predefined steps.
2. Data knob Used to finely adjust input data by turn ing the data knob clockwise or counterclockwise.
In the dialog box, turn the data knob, select the items to be set
and press the knob.
3.
FORMAT
4.
WINDOW
5.A key Used to set trace A.
6.B key Used to set trace B.
key Used to set up display lines and limit lines, and to enter labels.
key Used to set up measuring windows and separate windows.
4
2-6
Page 44

2.1.1.8 ENTRY Section
R3267 Series Spectrum Analyzer Operation Manual (Vol.1)
2.1.1 Front Panel
1
2
3
4
5
Figure 2-9 ENTRY Section
1.
2.
3.
4.
5. Numeric keys Used to enter numeric values.
6.
7. Units keys These are used to select a unit and enter a numeric value.
key Used to set center, start or stop frequency.
FREQ
key Used to set the frequency span, full span or zero span.
SPAN
LEVEL
COUPLE
CAL
-(BS)
key Used to set the reference level, vertical axis scale or unit.
key Use to set the resolution bandwidth (RBW), video bandwidth
(VBW) and sweep time.
There are ten number keys (0 through 9) and a decimal pointkey (.).
key
(SHIFT, 7)
key Used to remove data you have entered or to enter a minus (-)
key Sets GHz, +dBm or dB.
GHz
key Sets MHz, -dBm or sec.
MHz
key Sets kHz, mV or msec.
kHz
Used to execute calibrations for the analyzer.
sign.
6
7
Hz (ENTR)
key Sets Hz or µsec.
This key is also used to confirm data.
2-7
Page 45

R3267 Series Spectrum Analyzer Operation Manual (Vol.1)
2.1.1 Front Panel
2.1.1.9 REMOTE Section
2
5
Figure 2-10 REMOTE Section
1
3
4
1.
2. REMOTE lamp Lit when in the remote state.
3.
4.
5. SHIFT lamp The LED is lit when the shift key has been pressed.
key Turns off the GPIB remote control mode (this applies only
LCL
when the REMOTE lamp is lit).
CONFIG
PRESET
SHIFT
key Sets interface operation conditions, etc.
key
(SHIFT, CONFIG)
key SHIF T is used to select the secondary functions that are labeled
Resets all analyzer settings to the factory defaults, or to the
user-defined presets.
in blue above the panel keys.
2-8
Page 46

2.1.1.10 Control Section
R3267 Series Spectrum Analyzer Operation Manual (Vol.1)
2.1.1 Front Panel
1.
2.
3. Sweep indicator Lit while sweeping.
4.
5.
6.
7. AUTO lamp Lit when the input attenuator is set to AUTO.
key Unused (TG option)
TG
REPEAT (START/STOP)
SINGLE
SWP
ATT
key Executes a single sweep or resets the sweep in progress.
key Sets the sweep time.
key Sets the input attenuator.
2.1.1.11 Option Section
3
1
2
Figure 2-11 Control Section
key Starts a continuous sweep or resets the sweep in progress.
4
7
56
1
Figure 2-12 Option Section
1.
2.
key Unused (option)
ON
key Unused (option)
STOP
2
2-9
Page 47

R3267 Series Spectrum Analyzer Operation Manual (Vol.1)
2.1.2 Screen Annotation
2.1.2 Screen Annotation
This section describes both the annotation and display areas of the screen.
(1) Screen Annotation
5
3
2
1
20
19
6
4
7
6
8
7
21
18
17
16
15
14
13
12
Figure 2-13 Screen Annotation
1. Level offset mark
2. Reference level
3. Trigger position mark (only for Zero span)
4. Trace active mark
5. Display line set-up display
6. Trace mode
7. Detector mode
8. Date
9. UNCAL message
10. Frequency span/Stop frequency
11. Attenuator
12. Sweep time
13. Manual mark
14. Video bandwidth (VBW)
15. Resolution bandwidth (RBW)
16. Center frequency/Start frequency
17. Frequency offset mark
18. External 10 MHz reference mark
19. Trigger level mark
20. Correction factor mark
21. Error message
22. IF/ADC overrange message (Only for digital filters)
11
10
OVER
22
9
2-10
Page 48
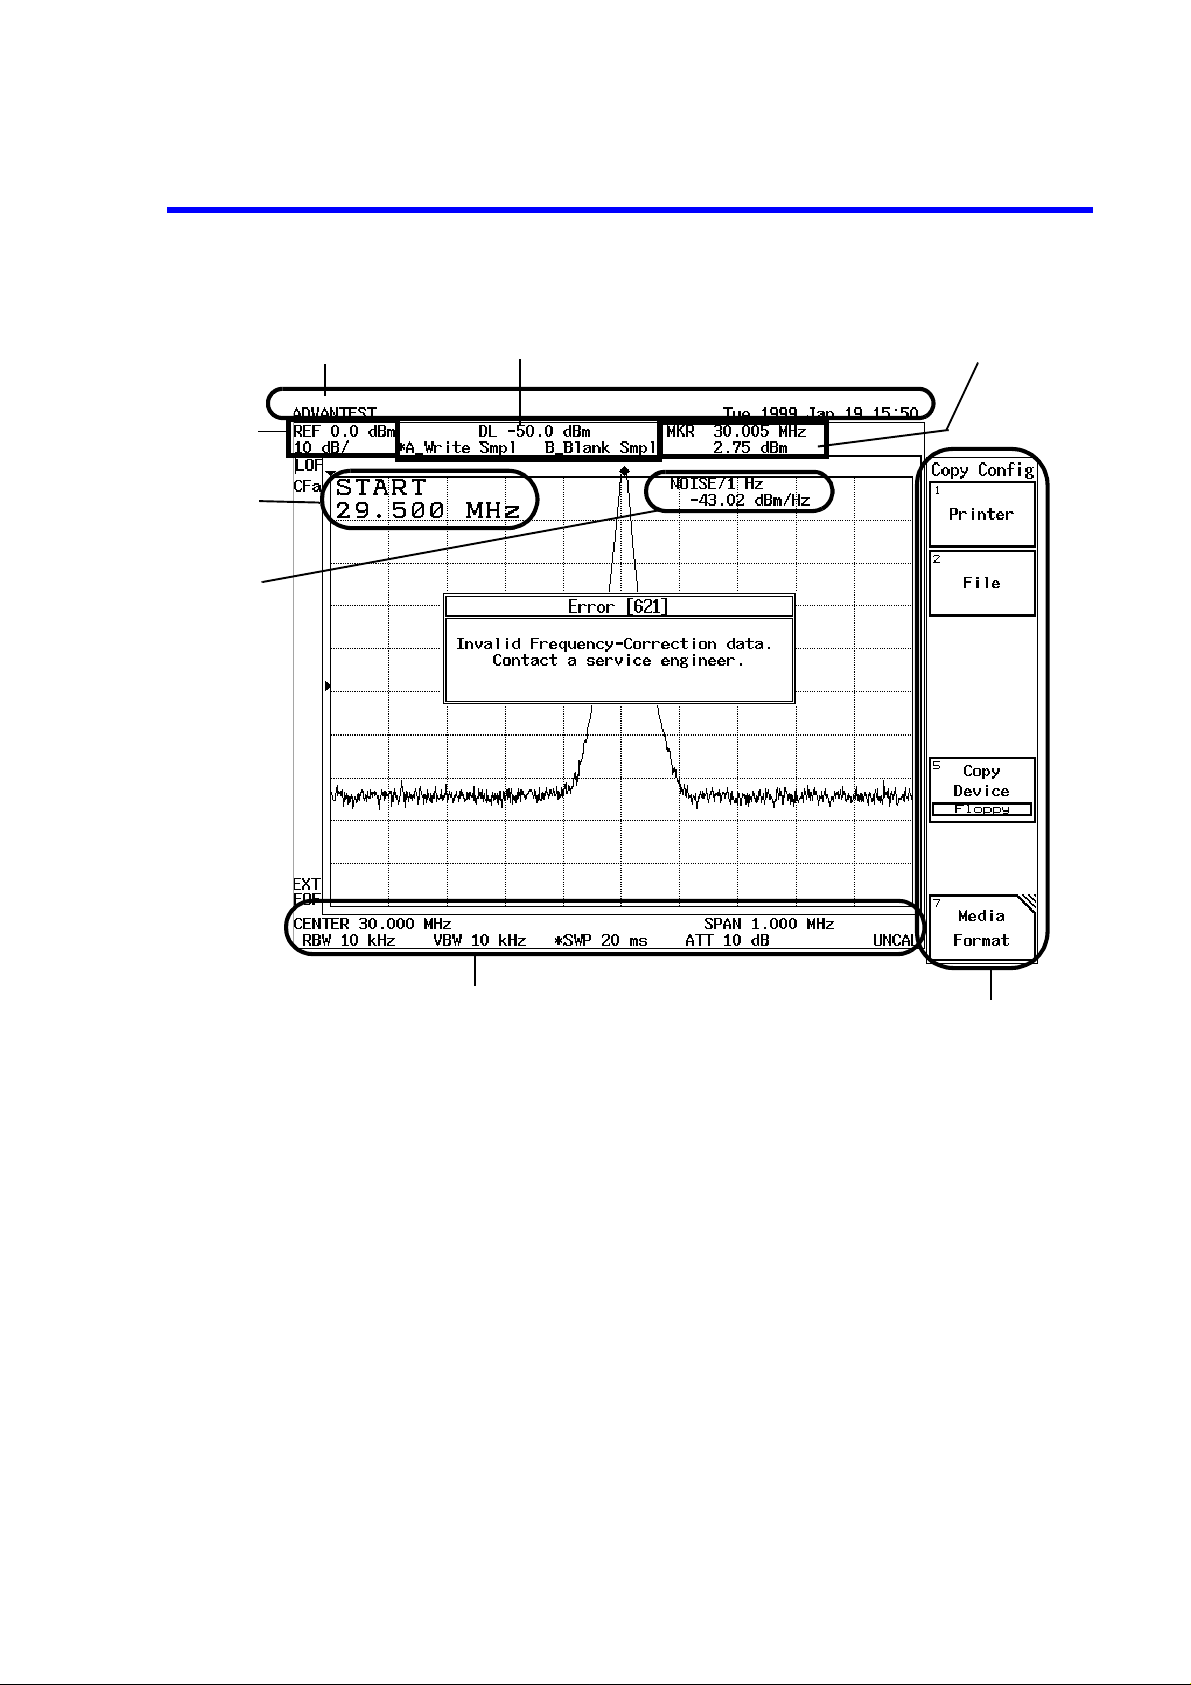
(2) Display Area
R3267 Series Spectrum Analyzer Operation Manual (Vol.1)
2.1.2 Screen Annotation
1
2
5
6
3
4
1. Title area
2. Reference area
3. Trace status area
4. Marker area
5. Active area
6. Result area
7. Frequency area
8. Soft menu display area
7
Figure 2-14 Display Area Names
8
2-11
Page 49
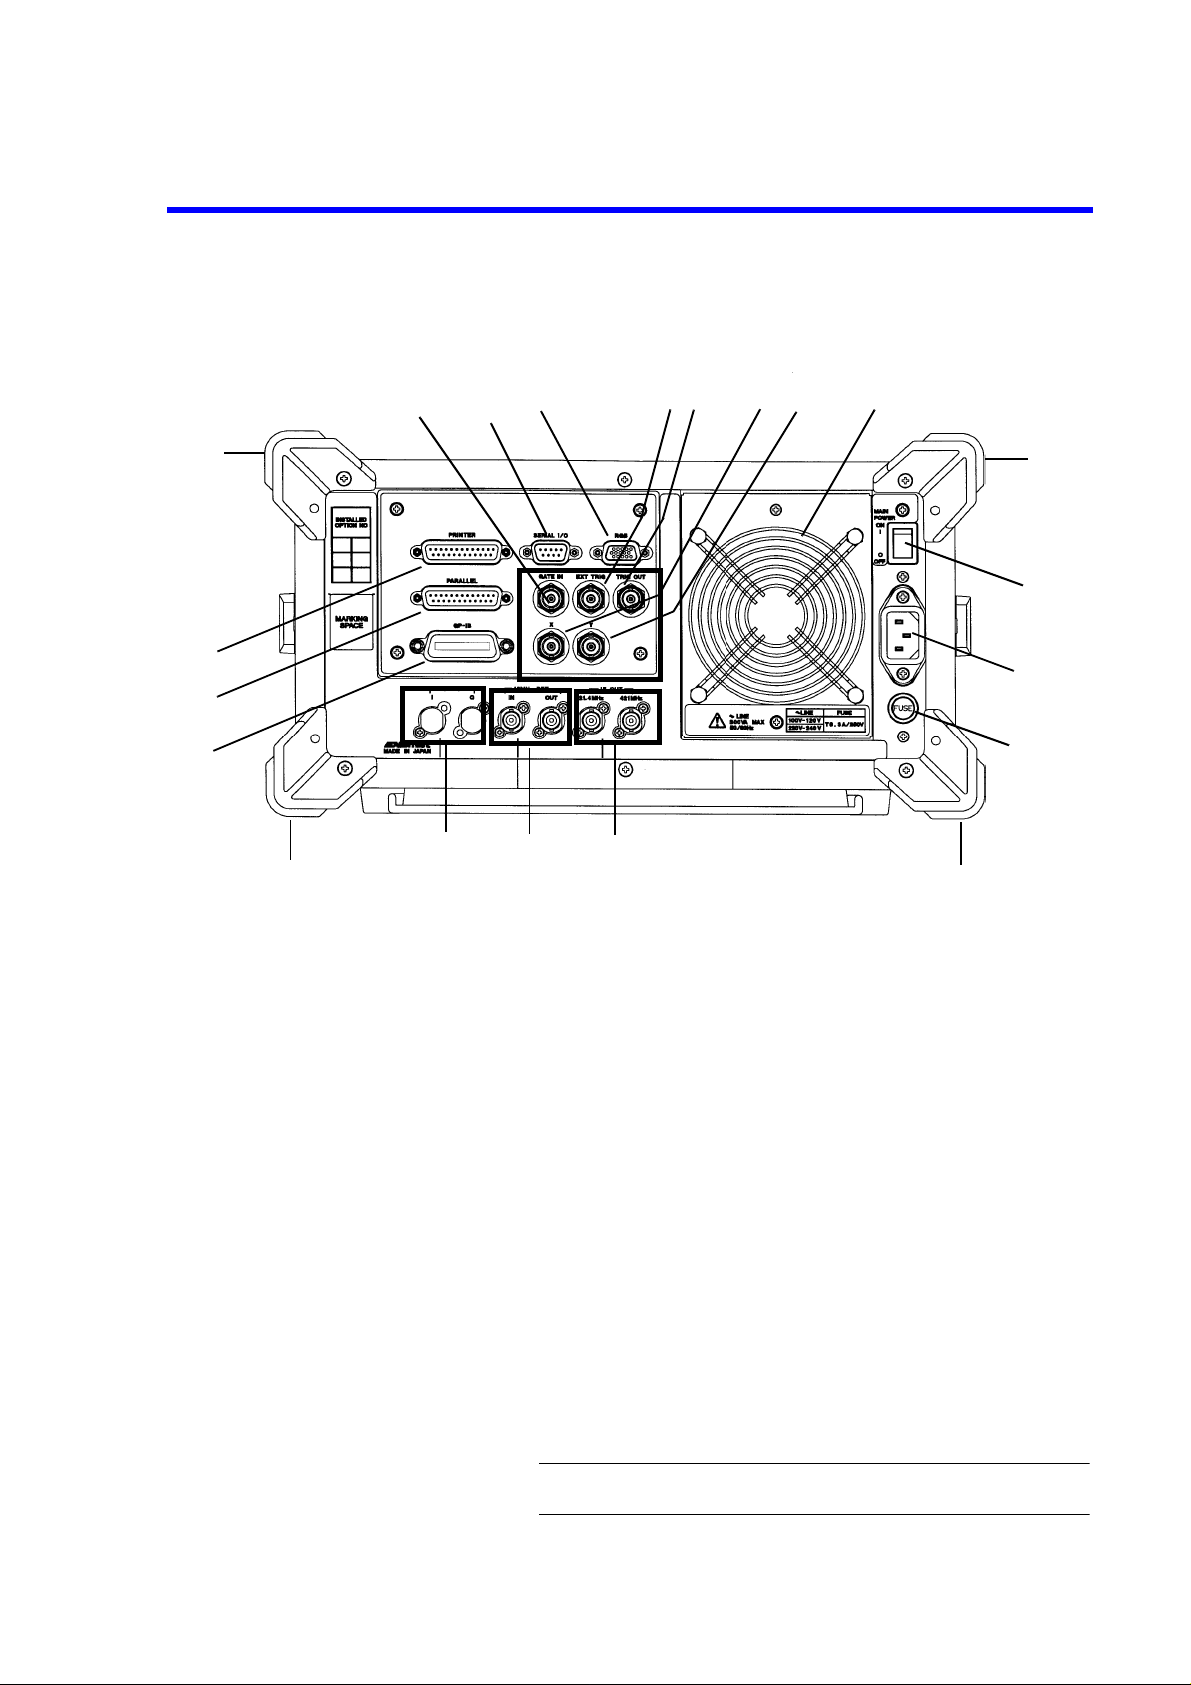
R3267 Series Spectrum Analyzer Operation Manual (Vol.1)
2.1.3 Rear Panel
2.1.3 Rear Panel
This subsection shows the rear panel and describes its terminals and connectors.
18
6
1
2
3
17
18
1.
PRINTER
connector Connector for a printer
5
4
16
Figure 2-15 Rear Panel
15
8
7
10
9
11
18
12
13
14
18
2-12
2.
PARALLEL
3.
GPIB
4.
SERIAL I/O
5.
6.
7.
8.
9.
10.
11. Exhaust vent Cooling fan
co nnector Connector for an external monitor compatible with VGA specifica-
RGB
GATE IN
EXT TRIG
TRIG OUT
X-OUT
Y-OUT
connector Unused
connector Connector for an external controller used when set to remote control
through GPIB interface.
connector Connector for an external controller used when set to remote control
through RS232 interface.
tions.
terminal Connector for inputting the gate signal of the gated sweep.
terminal Connector for inputting not only the external t rigger signal but the
gate timing signal of the gated sweep.
terminal Connector for outputting a signal in synchronization with the trigger
signal.
terminal Connector for outputting the ramp voltage proportional to sweep.
terminal Connector for outputting the signal proportional to power level.
CAUTION: Do not block the vent.
Page 50

R3267 Series Spectrum Analyzer Operation Manual (Vol.1)
2.1.3 Rear Panel
12.
MAIN POWER
13.
power connector Connect the input power cable from the analyzer to the outlet of the
AC
switch Used to turn the Main power on or off.
AC power source.
14. Fuse holder Used to hold a power fuse to protect the analyzer from an overcurrent.
15.
IF OUT 21.4 MHz
IF OUT 421 M Hz
16.
10 MHz REF IN
10 MHz REF OUT
17.
INPUT I
INPUT Q
terminal Unused (option)
terminal Unused (option)
terminal Connector for outputting the 3rd IF (21.4 M Hz) signal.
terminal Connector for outputting the 2nd IF (421 MHz) signal.
terminal Connector for inputting the 10 MHz reference signal.
terminal Connector for outputting the 10 MHz reference signal.
18. Rear feet This is to protect the projections such as the fan and connectors.
CAUTION: Never use the analyzer upright with the rear panel to the
bottom.
2-13
Page 51
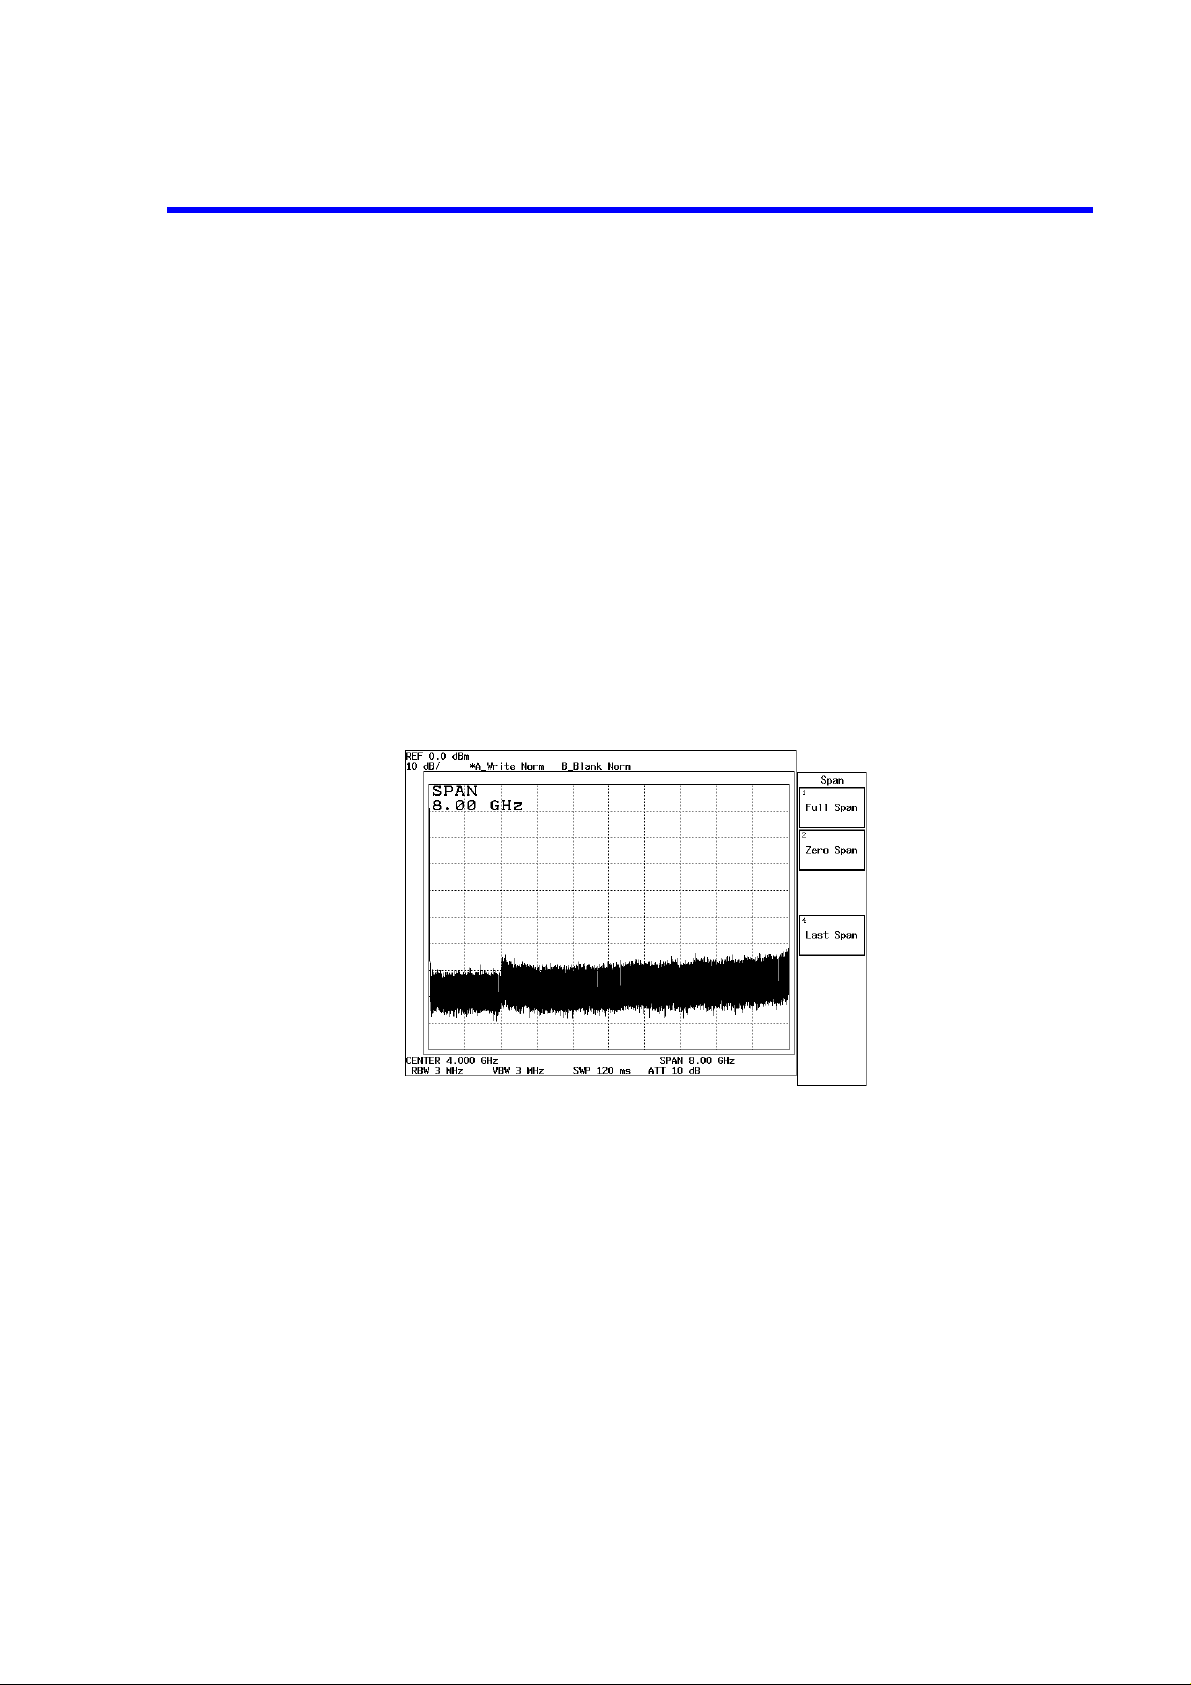
R3267 Series Spectrum Analyzer Operation Manual (Vol.1)
2.2 Basic Operation
2.2 Basic Operation
This section describes the method of how to go through the menus and use the measurement functions.
2.2.1 Operating Menus and Entering Data
This section explains how the panel keys and soft keys are used.
(1) Selecting the menu
If you press a panel key , the soft menu associated with that key is displayed in the soft menu area on
the screen.
To make a soft menu selection, press the soft key next to the menu item.
When a soft menu is selected and any item corresponding to this soft menu has previously been set,
the titles and values which are currently set are displayed in the active area (Refer to (2) Entering
data). In addition, if there is an associated menu s are also d isplay ed (Refer to (3) Soft menu configuration).
For example, the following soft menu will be displayed when you press SPAN.
2-14
Figure 2-16 Span Menu
When selecting an item from the soft menu, press the corresponding soft key on the right.
Page 52

R3267 Series Spectrum Analyzer Operation Manual (Vol.1)
2.2.1 Operating Menus and Entering Data
(2) Entering data
When a value is displayed in the active area, yo u can change it using the nu meric keys, the s tep keys
or the data knob.
• Entering Data Using the Numeric Keys
You use the following keys to enter data: the number keys (0 through 9), the decimal point key,
the
backspace
can use the
(BS) or minus (-) key. If you make a mistake when using the numeric keys, you
backspace
(BS) key to delete the last digit entered. If you have not entered any data,
pressing the BS key enters a minus (-) sign. After entering the data, pressing the
one of the other unit keys completes the operation.
CAUTION: Data entered with the numeric keys that is not terminated with a units terminator is
aborted when you press any panel key.
Example 1: The following exam ple sets the reference lev el to -20 dBm using the n umeric keys:
Press
LEVEL, -, 2, 0
and
GHz(+dBm)
or
LEVEL, 2, 0 and MHz(-dBm)
• Entering Data Using the Step Keys
The step keys are used to enter data in a predefined step size. Press the step key to decrease
the value and the step key to increase the value. You can enter data while looking at the active
area and the trace on the screen using the step key s. You can also define the step size manually.
ENTR
key or
.
Example 2: The following example sets the reference level to 0 dBm using the step keys:
Press the step key following Example 1. This sets the reference level to -10.0
dBm. If you press the step key once more, the level is set to 0.0 dBm.
• Entering Data Using the Data Knob
The data knob is used to set data in increments smaller than the step size. This is convenient
when making fine adjustments to data already entered.
Example 3: The following example sets the reference level to 0.5 dBm using the data knob.
Turning the data knob clockwise increases the reference level in increments of 0.1
dB. Continue to turn it until the active area shows a setting of 0.5 dBm.
Turning the data knob counter clockwise decreases the reference level by 0.1 dB.
(3) Soft menu configuration
Menus consist of the main menu, associated submenus and dialog boxes.
In addition, there are some soft keys with which you can switch the setting each time you press them.
In this section, the menus associated with the
CONFIG
key are shown as an example of a typical
menu configuration (See Figure 2-17).
2-15
Page 53
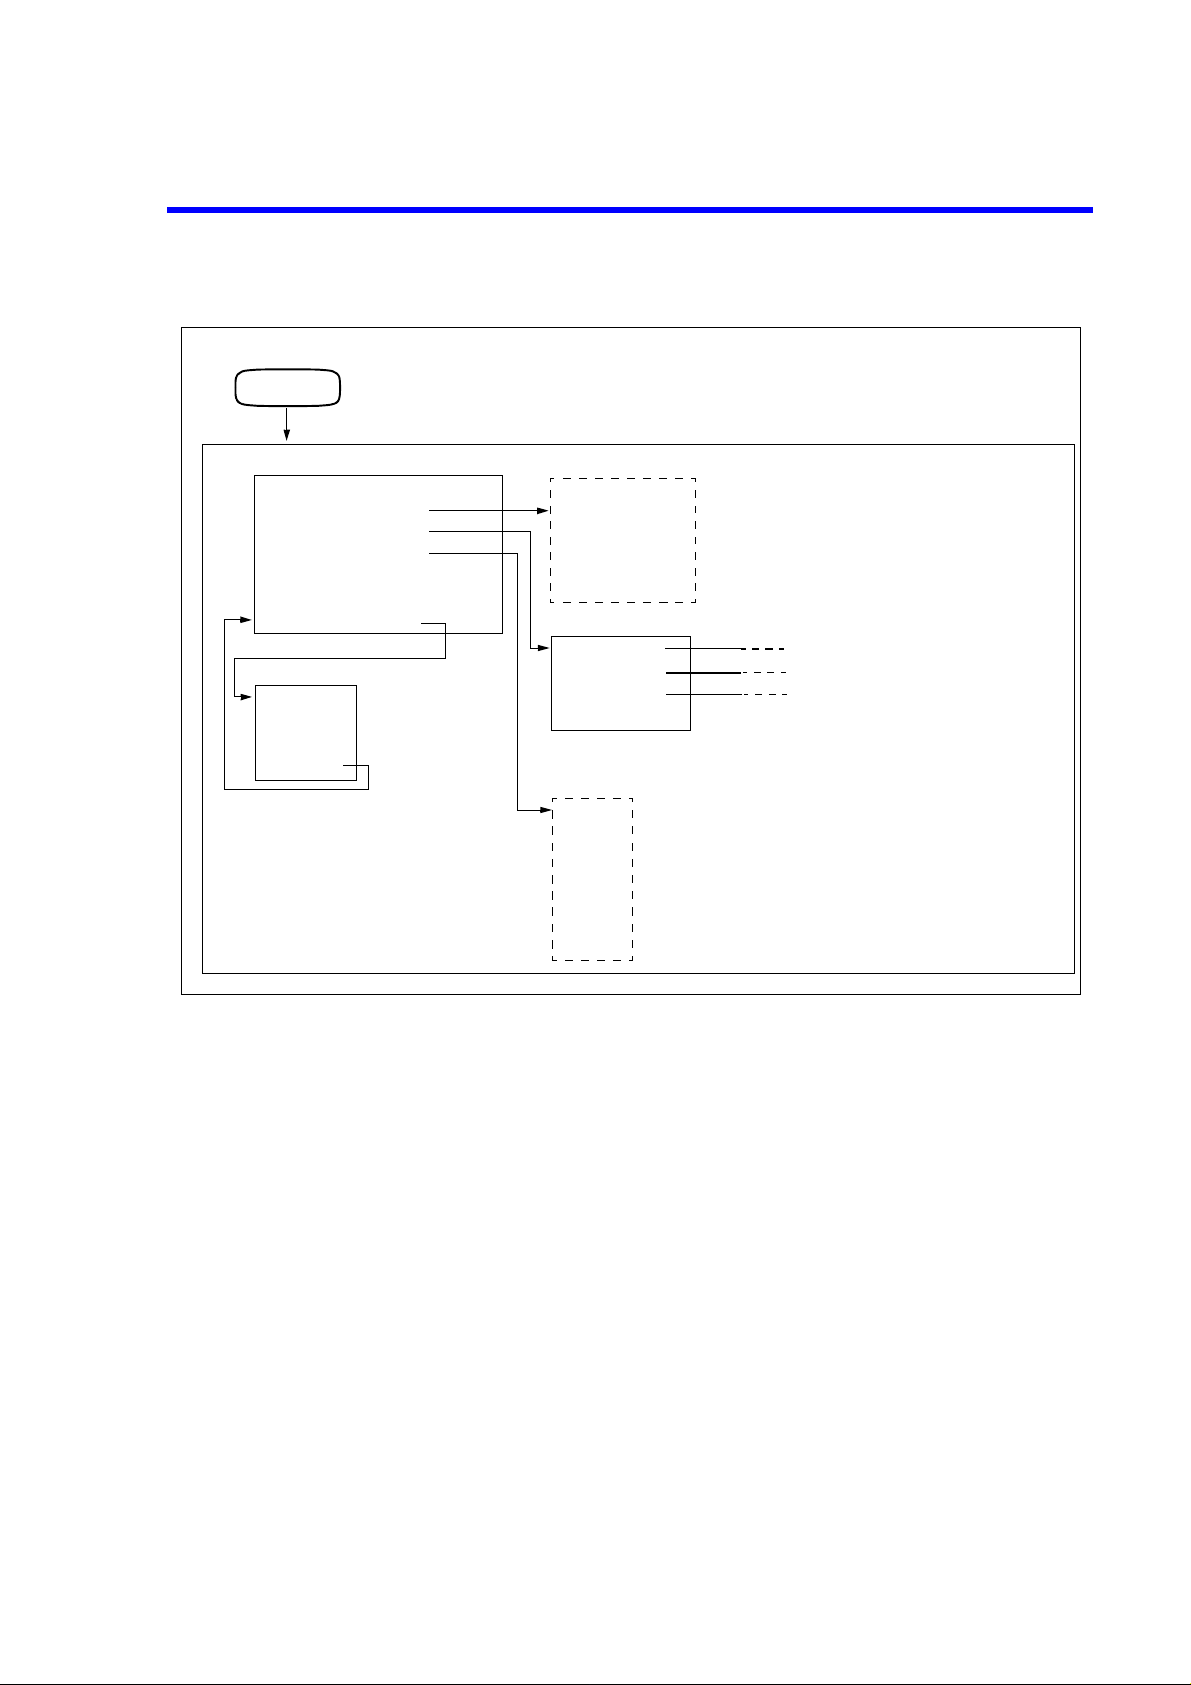
R3267 Series Spectrum Analyzer Operation Manual (Vol.1)
2.2.1 Operating Menus and Entering Data
Panel key
CONFIG
Main menu
GPIB&Others
RS232
Copy Config
Date/Time
Trace Point 1001/501
Annotation Display ON/OFF
more 1/2
Main menu
Selftest
Service
Revision
more 2/2
dialog box
Baud Rate
Data Length
Stop Bit
Parity Bit
Flow Control
Sub menu
Printer
File
Copy Device
Media Format
dialog box
Year
Month
Day
Hour
Minute
Format
Order
soft menu
(Can be omitted)
2-16
Figure 2-17 Soft Menu Conf iguration (CONFIG Ke y)
(4) Main menu and sub menu
• Displaying the main menu
Pressing a panel key displays the main menu.
• Displaying the second screen of the main menu (the same level as the main menu)
Pressing
more 1/2
in the main menu displays the rest of the main menu. Pressing
the second page returns to the first page.
• Displaying the submenu
Pressing a soft key in the soft menu with a mark in the right-hand corner will display the next or
previous submenu.
• Switching between settings on a toggle button.
Press the soft key under the soft menu with switching capability to toggle between settings for
ON/OFF, AUTO/MNL and similar switches each time you press the soft key.
more 2/2
on
Page 54

R3267 Series Spectrum Analyzer Operation Manual (Vol.1)
2.2.1 Operating Menus and Entering Data
(5) Displaying a dialog box
Some soft key menu items display a dialog box when pressed.
• How to select a setting
To select a setting, use the step keys (to move the cursor upwards) and (to move the cur-
sor downwards).
• Choosing the contents from the selected setting
Turn the data knob to select the desired setting and press the data knob to set the data.
• Entering numeric values
Use the numeric and unit keys to set the data.
• Exiting from the dialog box
Press the
(6) ACTIVE OFF
Pressing
is done. To turn the active area again, press the panel or soft key whose function you wish to use.
(7) RETURN key
RETURN
ACTIVE OFF
key or the same key that you pressed to display the dialog box again.
removes all information from the active area. Data cannot be entered if this
Press the
(8) SHIFT key
SHIFT
There are five such functions:
•CAL
•CANCEL
•OFF
•PRESET
•SAVE
To select one of these functions, press
Pressing
tion is active.
To cancel the shift function, press
tions.
The LED goes off indicating that the Shift function is no longer active.
RETURN
is used to select the functions that are labeled in blue above the panel keys.
SHIFT
key to return to the previous menu.
and the appropriate panel key.
SHIFT
lights the green LED (on the left side above the key) to indicate that the Shift func-
a second time before selecting other blue-labeled func-
SHIFT
2-17
Page 55

R3267 Series Spectrum Analyzer Operation Manual (Vol.1)
2.2.2 Displaying Spectrums and Operating th e Markers
2.2.2 Displaying Spectrums and Operating the Markers
The following example measures the frequ ency diff erence between the peak point and a p oint 3 d B levels
lower, and the frequency difference between the peak point and a point 60 dB levels lower.
Use the CAL signal of the analyzer as an input signal.
Power on
NOTE: To tak e acc urate me asurements, u se the a nalyzer within th e spec ified tem peratur e
range, and wait at least 60 min utes after turning on the power bef ore performing
the Calibrations. In this exercise example, the warm-up and calib ration are omitted.
Initialization
1. Check to see if the
POWER
switch (on the front panel) and
MAIN POWER
switch (on the rear panel) are turned off.
2. Connect the power cable provided to the AC power supply connector on the rear
panel.
CAUTION: To avoid damage to the analyzer, operate the analyzer within the spec-
ified input voltage and frequency ranges.
3. Connect the power cable to the outlet.
4. Turn on the
5. Turn on the
MAIN POWER
POWER
switch (on the front panel).
switch (on the rear panel).
When the self-test has completed, the start-up screen is displayed.
NOTE: The scree n displayed after the powe r is turned on may differ fro m the one
shown here depending on the current settings.
2-18
This resets the current settings to the factory defaults or user-defined presets.
6. Press
SHIFT
and
CONFIG(PRESET)
.
This sets the analyzer to its presets values.
Page 56
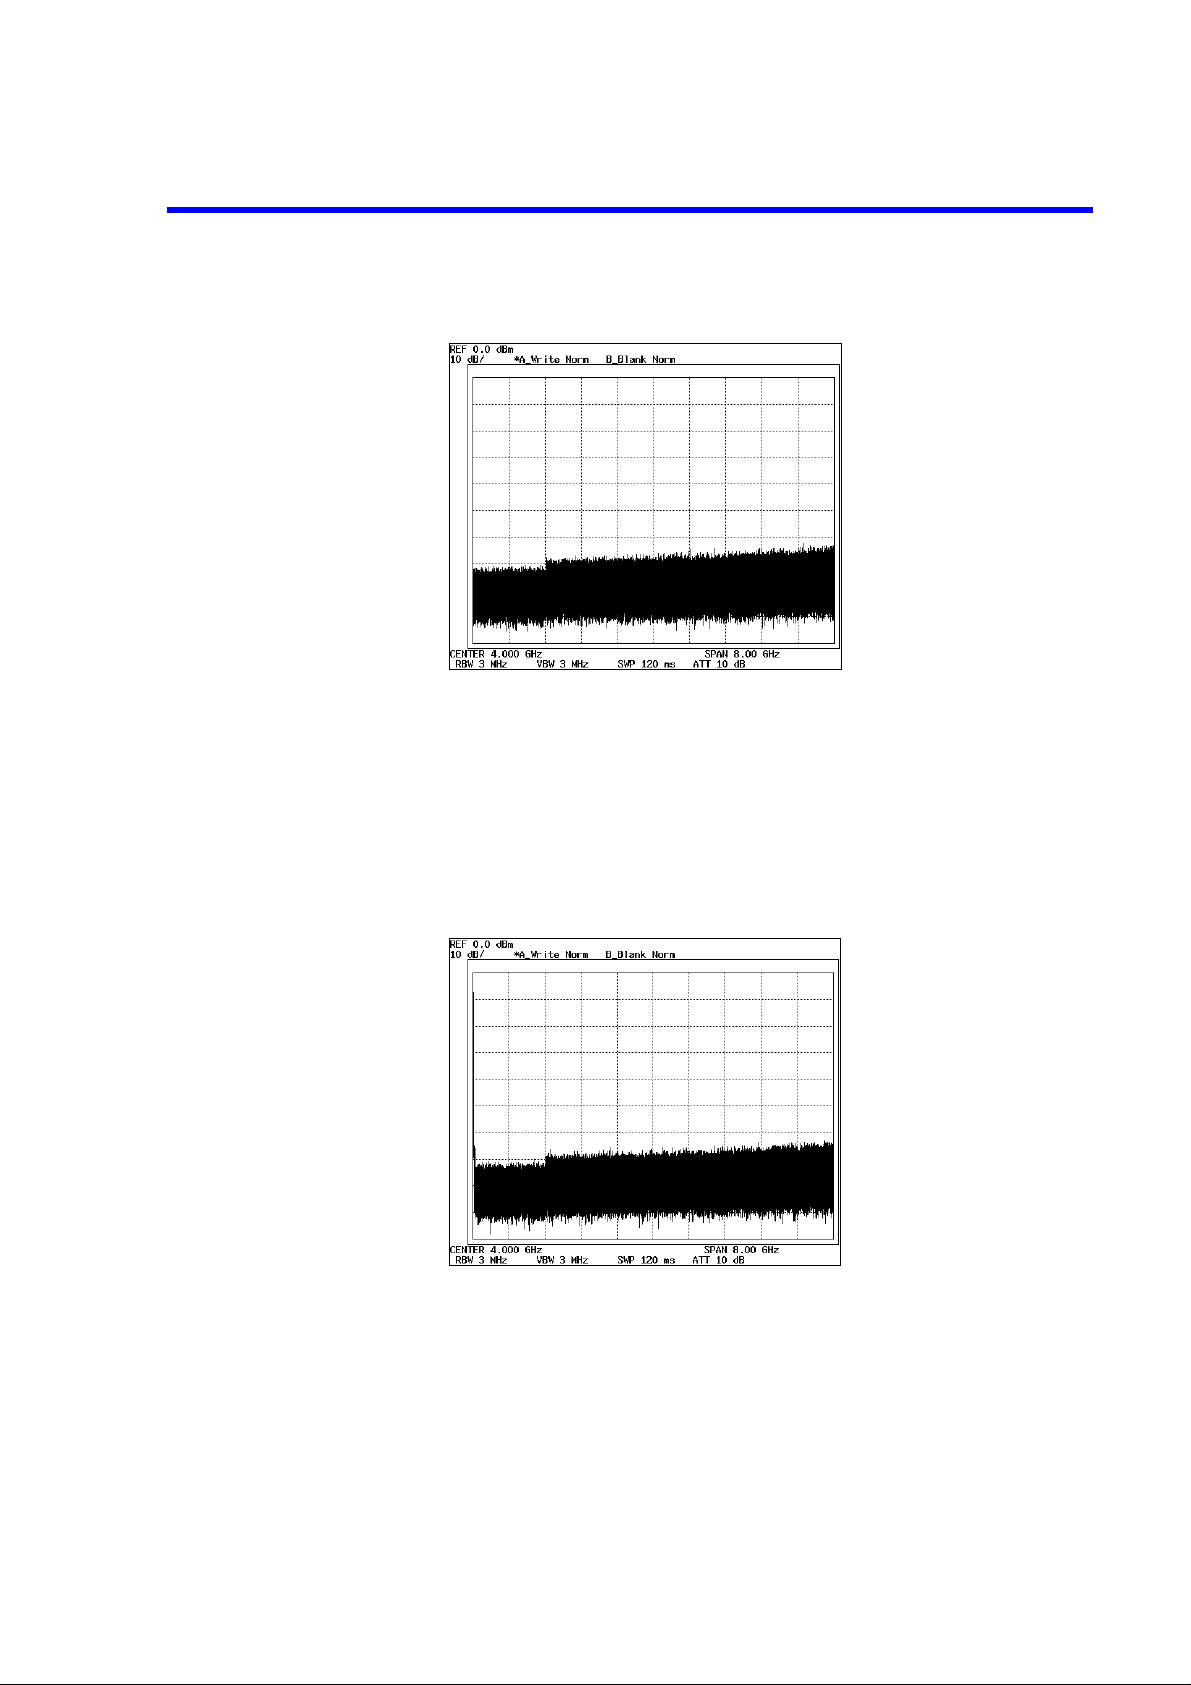
Connecting calibration signal
R3267 Series Spectrum Analyzer Operation Manual (Vol.1)
2.2.2 Displaying Spectrums and Operati ng the Markers
Figure 2-18 Factory Defaults
Connect the calibration signal used in the measurement.
7. Attach the N-BNC adapter to the
8. Connect the Input cable from the
Figure 2-19 Cali bration Ou tput
Setting the measurement conditions
INPUT
CAL OUT
connector on the front panel.
connector to the
INPUT
connector.
This changes the analyzer settings so that the input signal is displayed more clearly.
9. Press
The current center frequency is displayed in the active area, and the Freq menu
used to select the frequency type appears on the right.
FREQ
.
2-19
Page 57
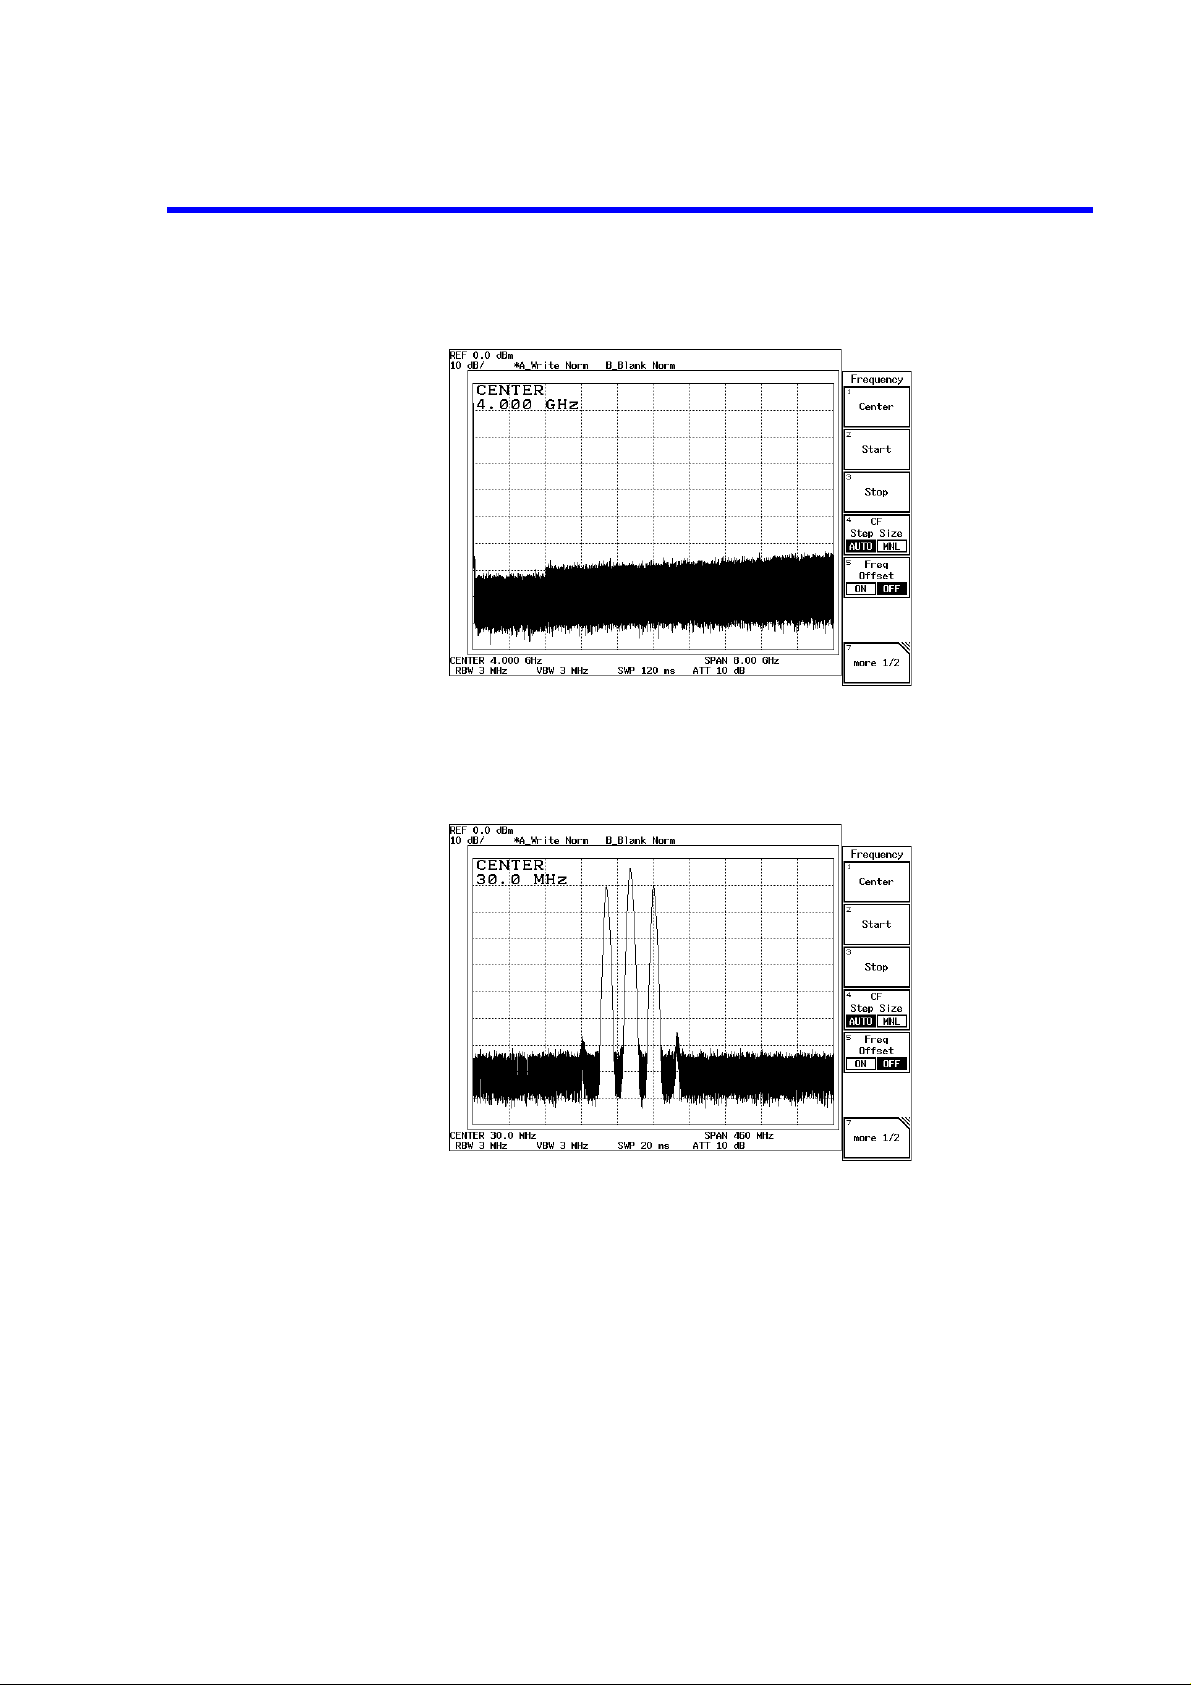
R3267 Series Spectrum Analyzer Operation Manual (Vol.1)
2.2.2 Displaying Spectrums and Operating th e Markers
Figure 2-20 Frequency Menu
10. Press
A center frequency of 30 MHz is set.
Figure 2-21 Setting the Center Frequency
11. Press
The current frequency span is displayed in the active area, and the Span menu
used for setting the frequency span appears on the right.
12. Press
A frequency span of 20 MHz is set.
3, 0
SPAN
2, 0
and
and
MHz
.
MHz
.
.
2-20
13. Press
LEVEL
The current reference level is displayed in the active area, and the Level menu
used for setting the level appears on the right.
.
Page 58

R3267 Series Spectrum Analyzer Operation Manual (Vol.1)
2.2.2 Displaying Spectrums and Operati ng the Markers
14. Press
Displaying the normal marker on the trace peak
15. Press
1, 0, MHz(-dBm)
A reference level of -10 dBm is set.
Figure 2-22 Setting Measurement Conditions
.
SRCH
The normal marker is displayed on the trace peak, and the marker frequency
(approximately 30 MHz) and level (approximately -10 dBm) are displayed in the
marker area.
.
Displaying the delta marker
This measures the frequency difference between a point 3 dB levels down and a point
60 dB levels down from the peak.
16. Press
The Marker (1) menu used with the marker function is displayed.
Figure 2-23 Peak Search
.
MKR
2-21
Page 59

R3267 Series Spectrum Analyzer Operation Manual (Vol.1)
2.2.2 Displaying Spectrums and Operating th e Markers
17. Press
18. Move the marker to the -3 dB point using the data knob while looking at the level
Delta Marker
The delta marker is displayed, and the differences (relative values) between the
normal marker and delta marker frequency and level are displayed
indication in the marker area and set it as pr ecisely as p ossible (an exact se tting
may not be possible due to resolution limitations).
The frequency difference (relative value) between the peak point and a point 3
dB levels lower is displayed in the marker area.
.
Figure 2-24 Frequency Difference Between the Peak Point and a Point 3 dB Levels Down
19. Next, move the marker to a point 60 d B levels down from the p eak using the data
knob.
The display in the marker area is the frequency dif ference between the peak point
and a point 60 dB levels down from the peak.
Figure 2-25 Frequency Difference Between the Peak Point and a Point 60 dB Levels Down
2-22
Page 60

R3267 Series Spectrum Analyzer Operation Manual (Vol.1)
2.2.3 Measuring Frequency Using Counter
Frequencies are measured using the counter function. Use the CAL signal of the analyzer as input signal.
The counter function measures the signal frequency at the marker with high accuracy.
The value of an amplitude indicates the amplitude at the marker point.
The maximum resolution possible for the counter function display is 1 Hz. As you increase the resolution,
you will have to increase the gate time to compensate.
CAUTION:
1. The counter function may not work normally if the span is greater than 1 GHz or the difference between the
marker and the noise level is 25 dB or less.
2. The signal track mode cannot be used with this function.
Power on
1. Turn the analyzer power on.
Initialization
2.2.3 Measuring Frequency Using Counter
This resets the current settings to the factory defaults or user-defined presets.
2. Press
SHIFT
This sets the analyzer to its presets values.
Connecting calibration signal
Connect the calibration signal used in the measurement.
3. Attach the N-BNC adapter to the
4. Connect the Input cable from the
Setting the measurement conditions
This changes the analyzer settings so that the input signal is displayed more clearly.
5. Press
FREQ, 3, 0
A center frequency of 30 MHz is set.
6. Press
SPAN, 5, 0
A frequency span of 50 MHz is set.
and
CONFIG(PRESET)
and
MHz
and
MHz
.
.
.
INPUT
connector on the front panel.
CAL OUT
connector to the
INPUT
connector.
2-23
Page 61

R3267 Series Spectrum Analyzer Operation Manual (Vol.1)
2.2.3 Measuring Frequency Using Counter
Figure 2-26 Setting Measurement Conditions
Measuring frequency by counter
This measures the frequency using the counter function.
7. Press
Figure 2-27 Frequency Counter Measurement
8. Press
MEAS
The Counter menu used to set the frequency counter resolution is displayed and
the frequency measurement by the frequency counter is started.
Resolution 10 Hz
The frequency counter resolution is set to 10 H z and is displayed in the Result
area.
and
Counter
.
.
2-24
Page 62

R3267 Series Spectrum Analyzer Operation Manual (Vol.1)
2.2.3 Measuring Frequency Using Counter
Figure 2-28 Frequency Counter Measurement (Resolution: 10 Hz)
9. Press
Counter ON/OFF
The counter function is turned off.
(OFF).
2-25
Page 63

R3267 Series Spectrum Analyzer Operation Manual (Vol.1)
2.2.4 Display Line and Measuring Window
2.2.4 Display Line and Measuring Window
This section describes the display line used to compare the levels between traces and the measuring window used to take measurements within a limited area.
Power on
1. Turn the analyzer power on.
Initialization
This resets the current settings to the factory defaults or user-defined presets.
2. Press
Connecting the calibration signal
Connect the calibration signal used in the measurement.
3. Attach the N-BNC adapter to the
4. Connect the Input cable from the
Setting the measurement conditions
This changes the analyzer settings so that the input signal is displayed more clearly.
5. Press
6. Press
Turning on the display line
7. Press
SHIFT
This sets the analyzer to its presets values.
FREQ, 3, 0
A center frequency of 30 MHz is set.
SPAN, 8, 0
A frequency span of 80 MHz is set.
FORMAT
The display line is displayed.
and
CONFIG(PRESET)
and
MHz
and
MHz
and
Display Line ON/OFF
.
.
.
INPUT
CAL OUT
connector on the front panel.
connector to the
(ON).
INPUT
connector.
2-26
Page 64

R3267 Series Spectrum Analyzer Operation Manual (Vol.1)
2.2.4 Display Line and Measuring Window
Figure 2-29 The Display Line
8. Align the Display line to a peak on the right.
9. Press
10. Press
Figure 2-30 Measuring the Values Relative to the Display Line
Removing the Display line
.
SRCH
A marker is displayed on the trace peak.
,
MKR
Reference Object
The values shown by the marker are the values relative to the Display line.
and
Display L i ne
.
11. Press
FORMAT,
The Display line and the values relative are removed.
Display Line ON/OFF
(ON) and
Display Line ON/OFF
(OFF).
2-27
Page 65
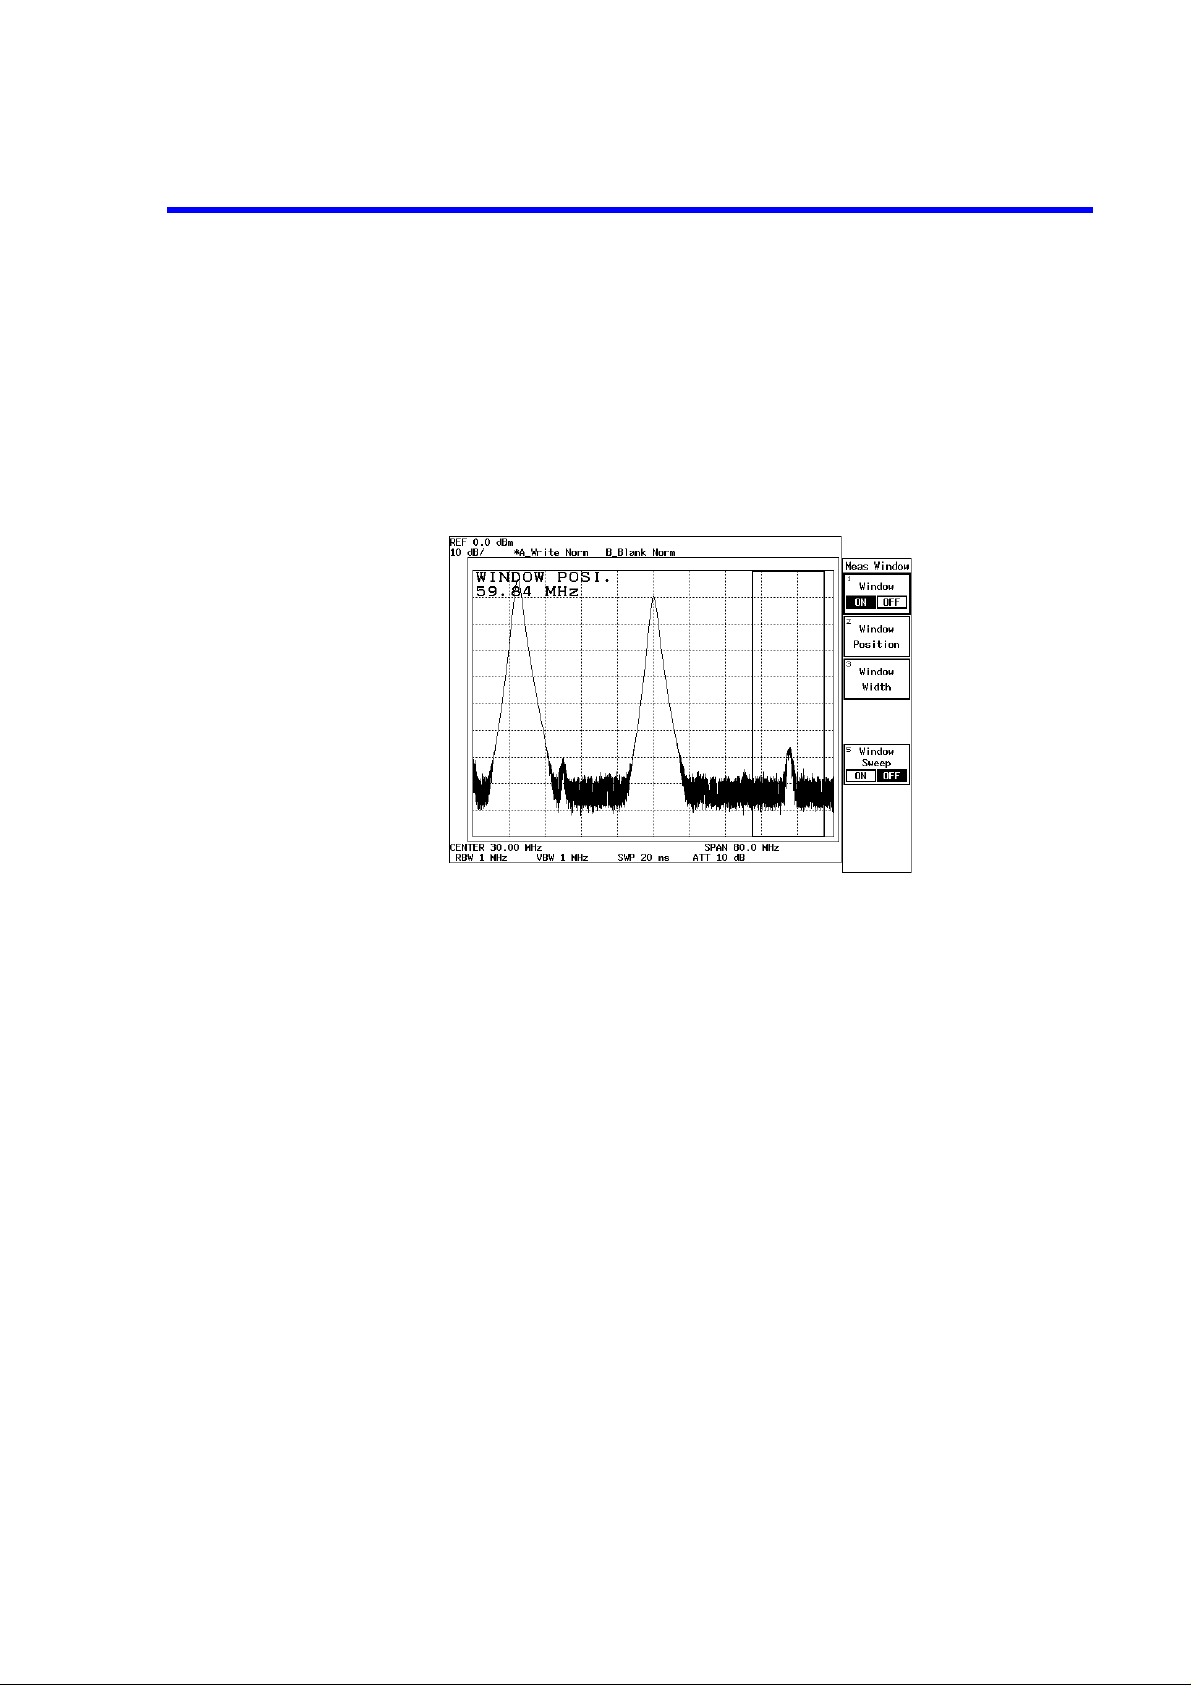
R3267 Series Spectrum Analyzer Operation Manual (Vol.1)
2.2.4 Display Line and Measuring Window
Using the measuring window
12. Press
13. Press
WINDOW
A measuring window is opened, and the Measuring Window menu is displayed.
In the active area, the frequency in the center of the window is displayed.
Window position
knob until the right-hand peak is in the center of the measuring window (See Figure 2-31).
Figure 2-31 The Measuring Window
and
Measuring Window
and move the measuring window by turning the data
.
14. Press
Removing the measuring window
15. Press
Window w idt
The width of the measuring window is set to 10 MHz.
Window ON/OFF
The measuring window is removed.
h, 1, 0
and
(OFF).
MHz
.
2-28
Page 66

2.2.5 Entering Level Correction Data
Measurement objects (such as input cables, antennas and adapters used with amplifiers), which have proper frequency characteristics, can be measured by using correction tables on a measurement object basis.
The frequency characteristics of the instruments used are listed in Table 2-1. This section describes how
to enter data into the correction table and use it.
Table 2-1 Correction Table
Frequency Correction Value
1 660 MHz -20 dB
2 670 MHz -10 dB
3 690 MHz +10 dB
4 730 M Hz +20 dB
5 740 MHz -30 dB
Power on
R3267 Series Spectrum Analyzer Operation Manual (Vol.1)
2.2.5 Entering Level Correction Data
1. Turn the analyzer power on.
Initialization
This resets the current settings to the factory defaults or user-defined presets.
2. Press
Setting the measurement conditions
This changes the analyzer settings so that the correction signal is reflected more
clearly.
3. Press
4. Press
5. Press
SHIFT
This sets the analyzer to its presets values.
FREQ, 7, 0, 0
A center frequency of 700 MHz is set.
SPAN, 1, 0, 0
A frequency span of 100 MHz is set.
LEVEL, 4, 0
The reference level is set to -40 dBm.
and
CONFIG(PRESET)
and
MHz
and
MHz
and
MHz(-dBm)
.
.
.
.
2-29
Page 67
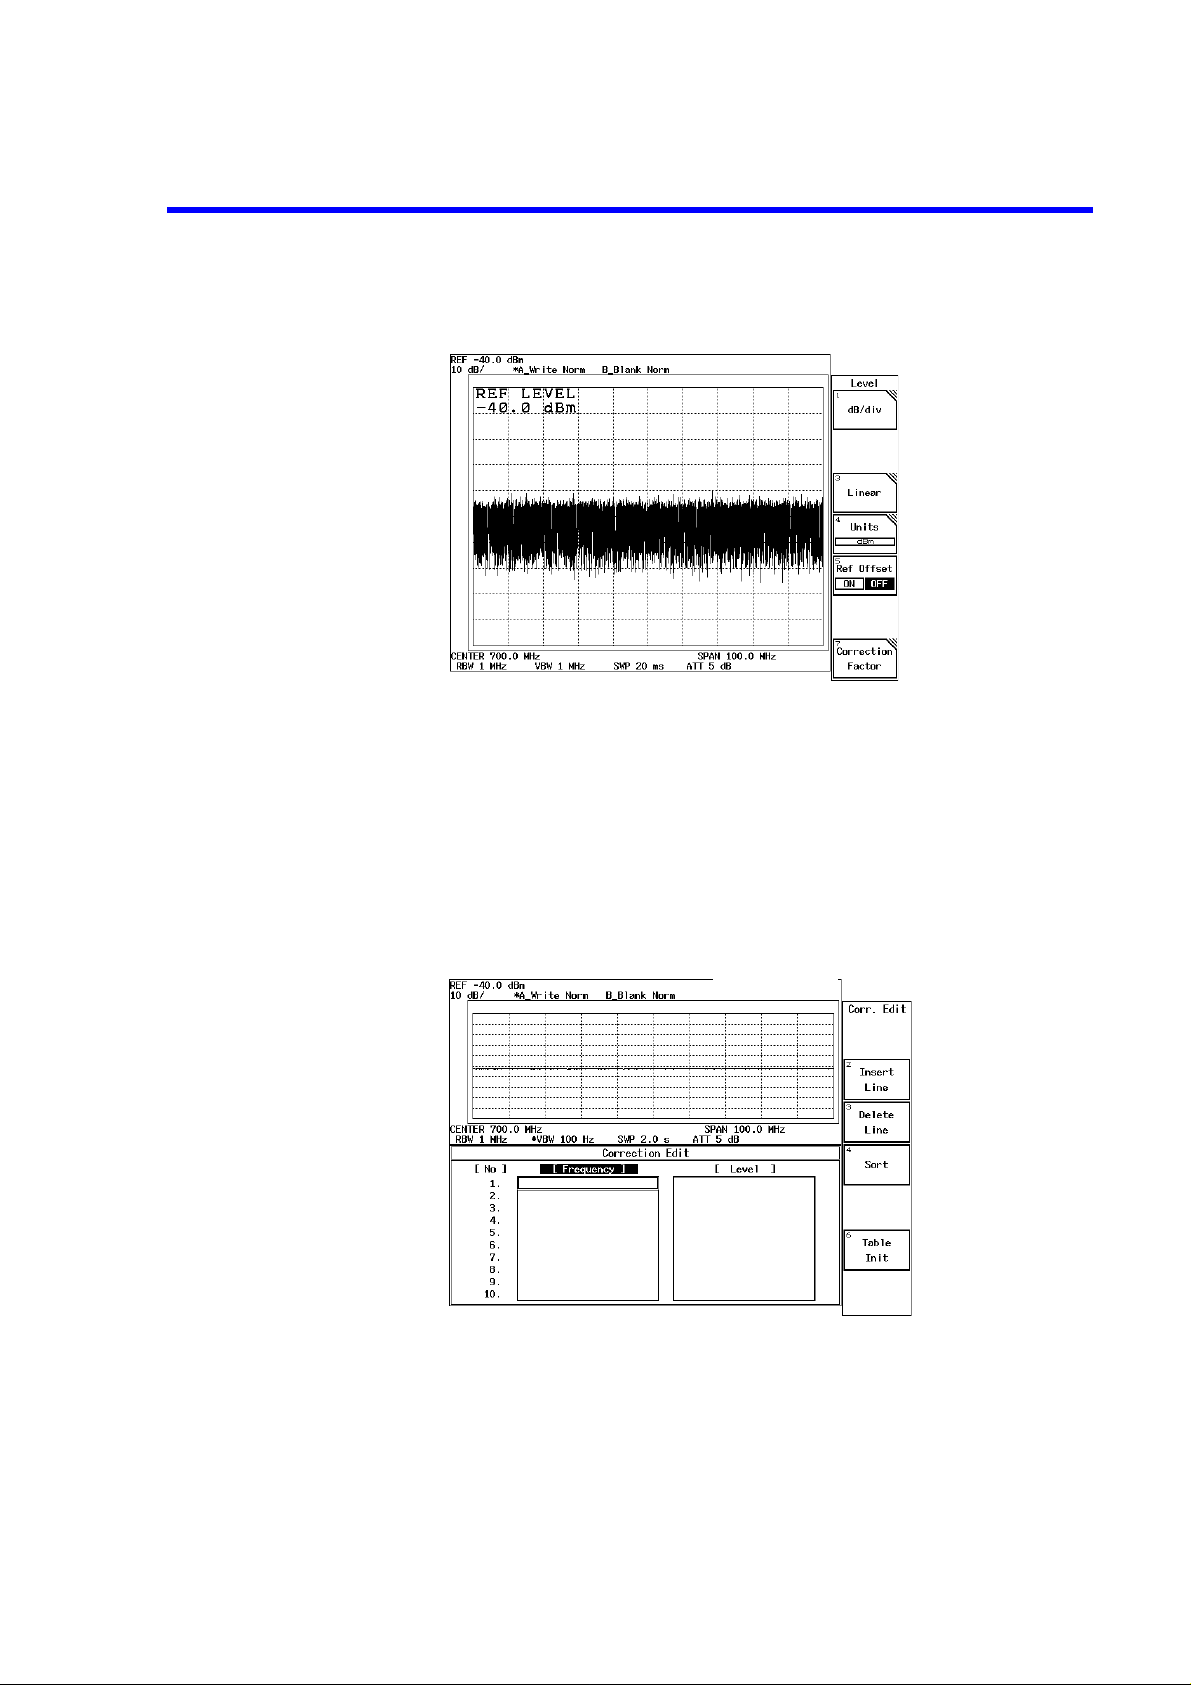
R3267 Series Spectrum Analyzer Operation Manual (Vol.1)
2.2.5 Entering Level Correction Data
Figure 2-32 Setting Measurement Conditions
Entering the correction data
The correction table is composed of frequency and level column s, and is used to s et a
maximum of 50 sets of data. The interpolation method is applicable between correction data.
6. Press
LEVEL
The Correction Edit menu and the correction table are displayed and you are
allowed to enter frequency data (See Figure 2-33).
Figure 2-33 Displaying the Correction Table
,
Correction Factor
and
Correction Edit
.
2-30
7. Press
A frequency of 660 MHz is displayed in the first frequency item, and the cursor
moves to the level item (See Figure 2-34).
6, 6, 0
and
MHz
.
Page 68
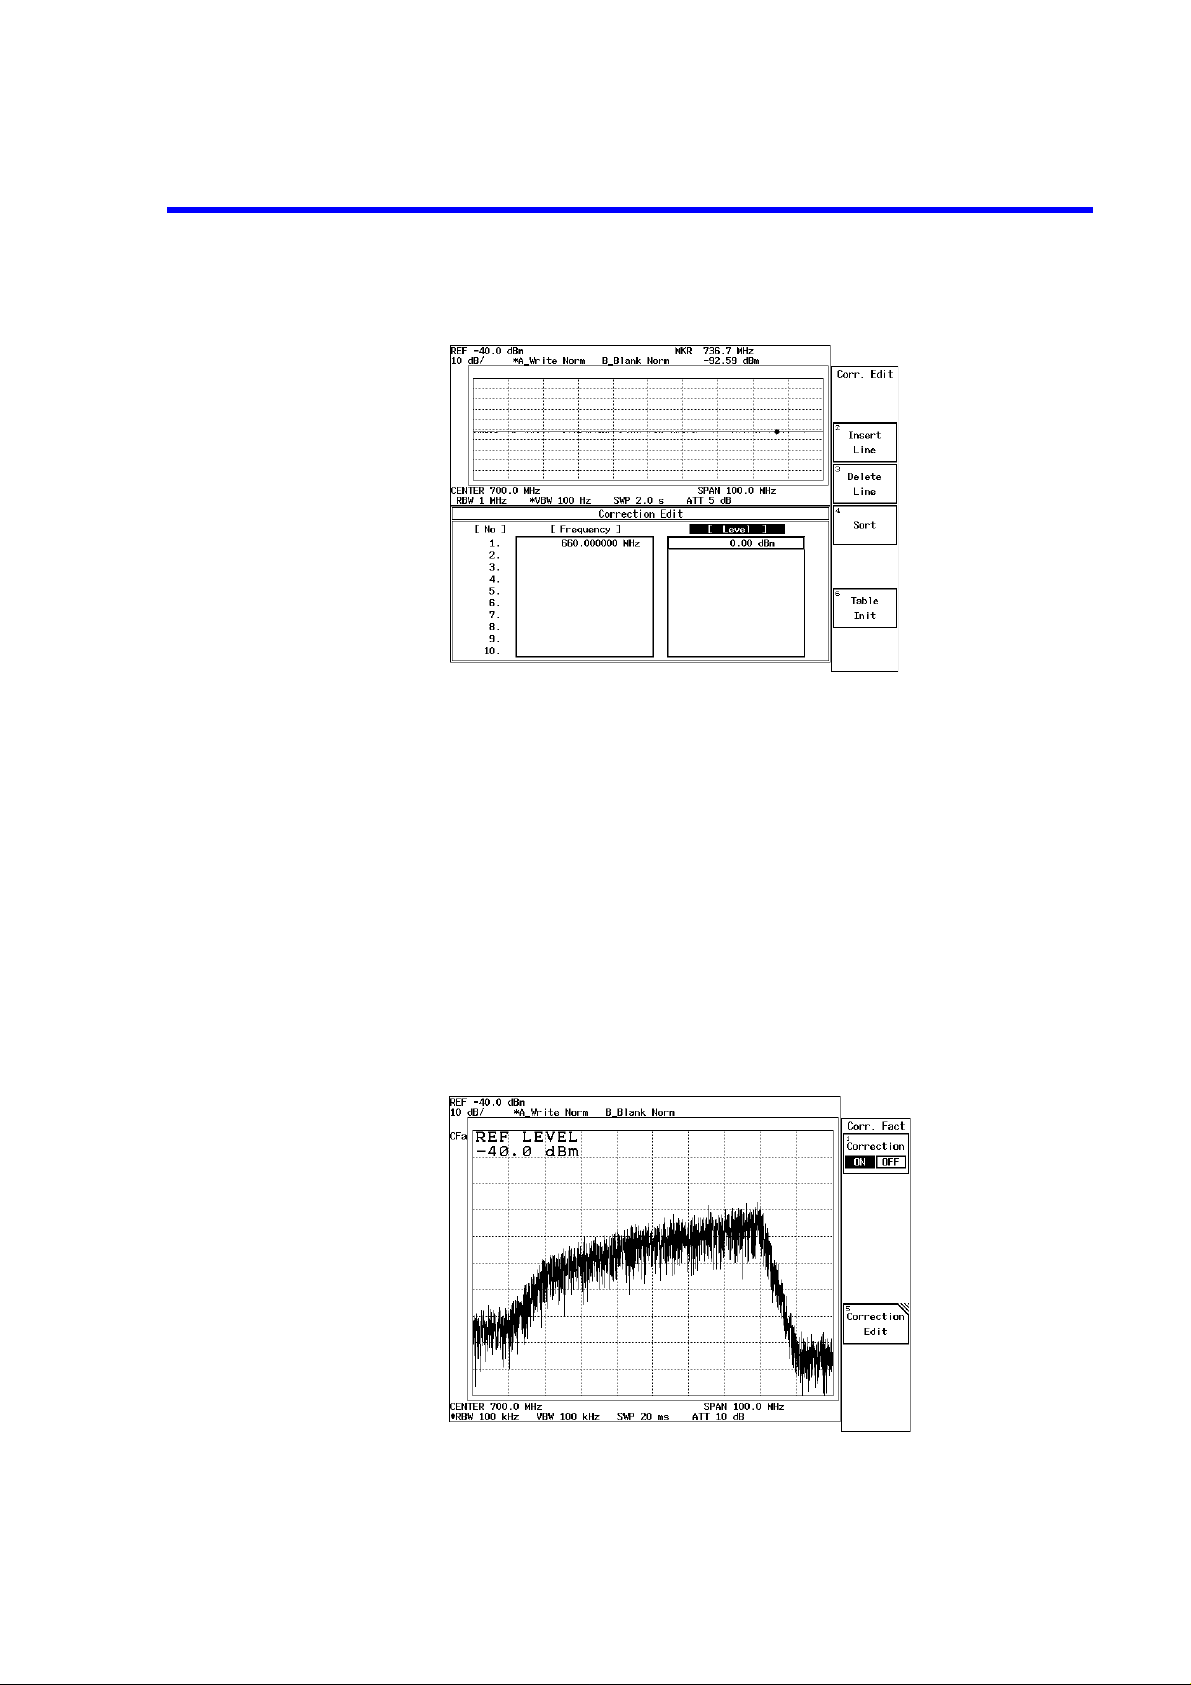
R3267 Series Spectrum Analyzer Operation Manual (Vol.1)
Figure 2-34 Entering Frequency Data
2.2.5 Entering Level Correction Data
8. Press
9. Enter the correction data one by one according to Table 2-1.
10. Press
Reflecting the level correction data
11. Press
2, 0
A level of -20 dBm is displayed in the level item and the cursor moves to the frequency item on the second line.
RETURN
The correction table is removed.
Correction ON/OFF
The trace, whose noise level was corrected using the data previously entered, is
displayed.
and
MHz(-dBm)
.
.
(ON).
Figure 2-35 Showing a Trace Whose Level Is Corrected
2-31
Page 69
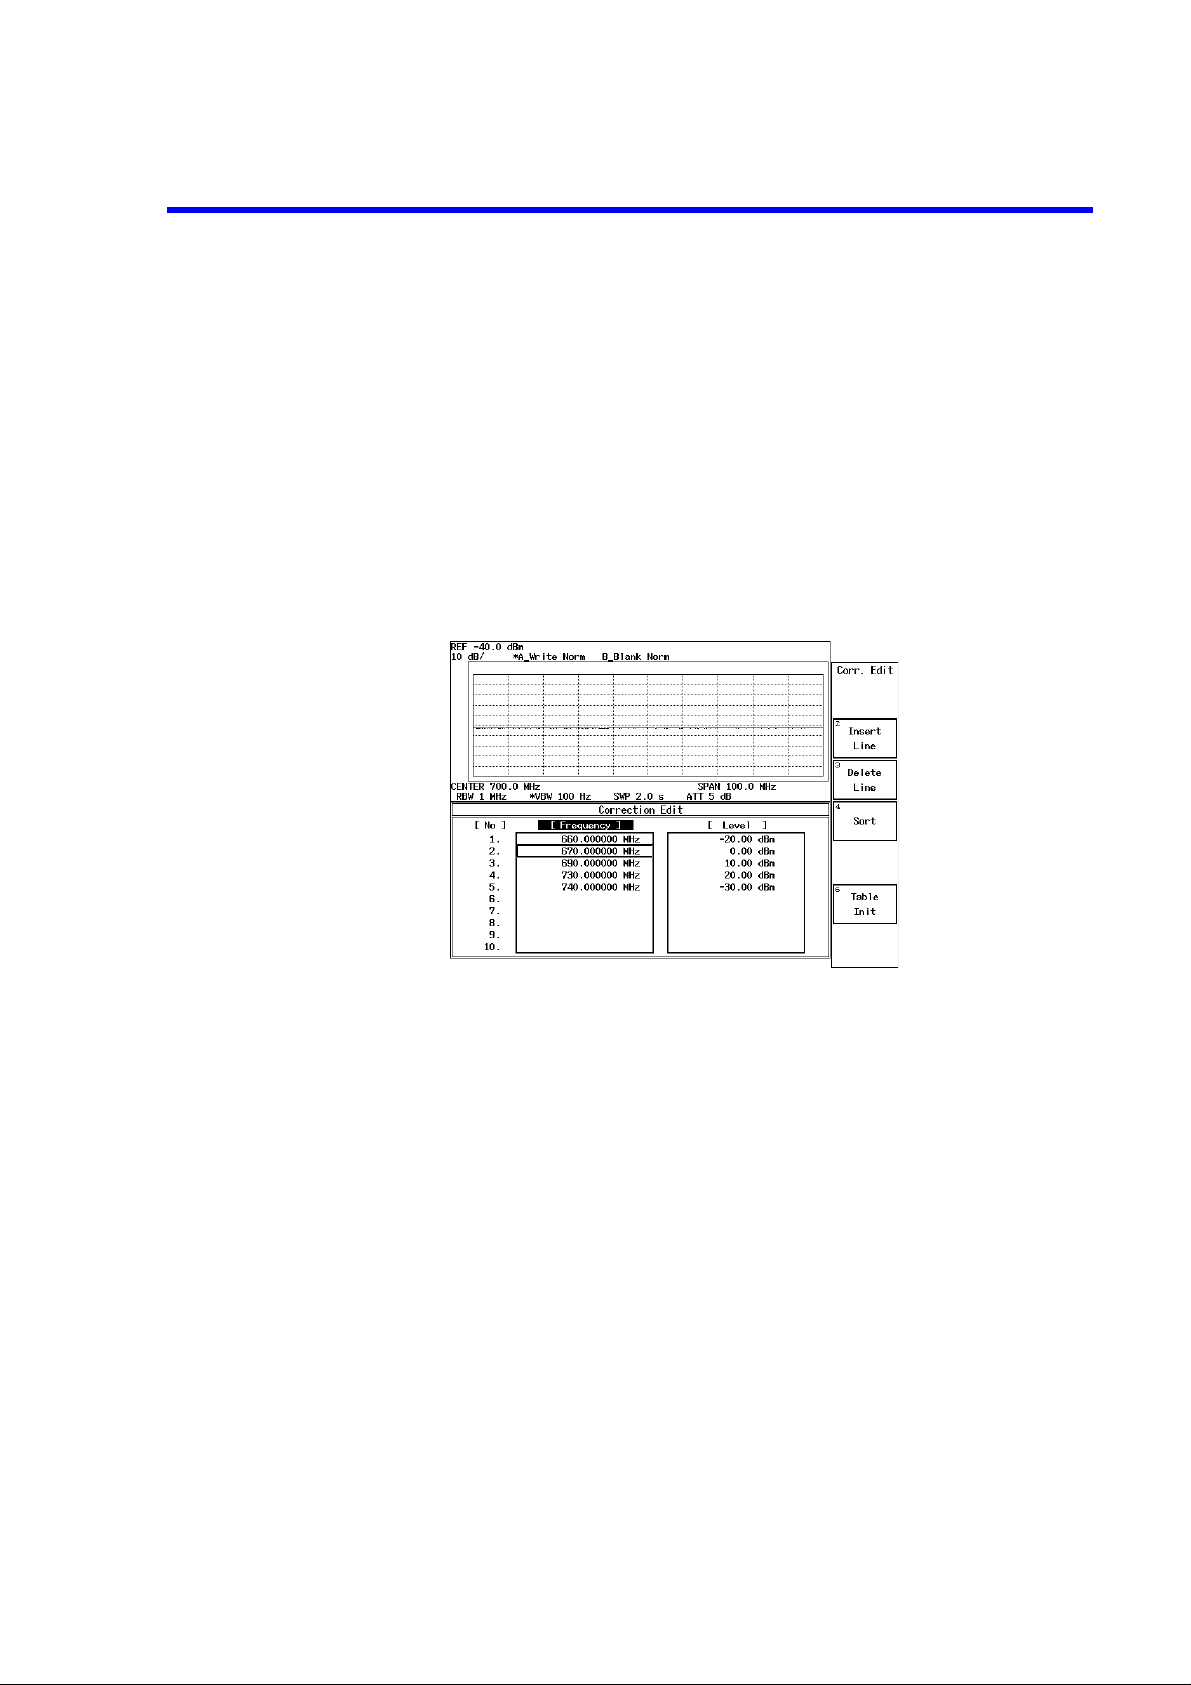
R3267 Series Spectrum Analyzer Operation Manual (Vol.1)
2.2.5 Entering Level Correction Data
12. Press
The level correction function is turned off.
Correcting the entered data
The data you entered can be corrected using the step keys or the data knob. In this
example, the level data on the second line is changed from -10 dBm to 0 dBm.
1. Move the cursor to the level data on the second line using the step keys or the data
knob.
2. Press 0 and
The level data on the second line is changed to 0 dBm.
Correction ON/OFF
MHz(-dBm)
.
(OFF).
2-32
Figure 2-36 Corrected Compensation Data
3. Press
RETURN
The correction table is removed.
.
Page 70
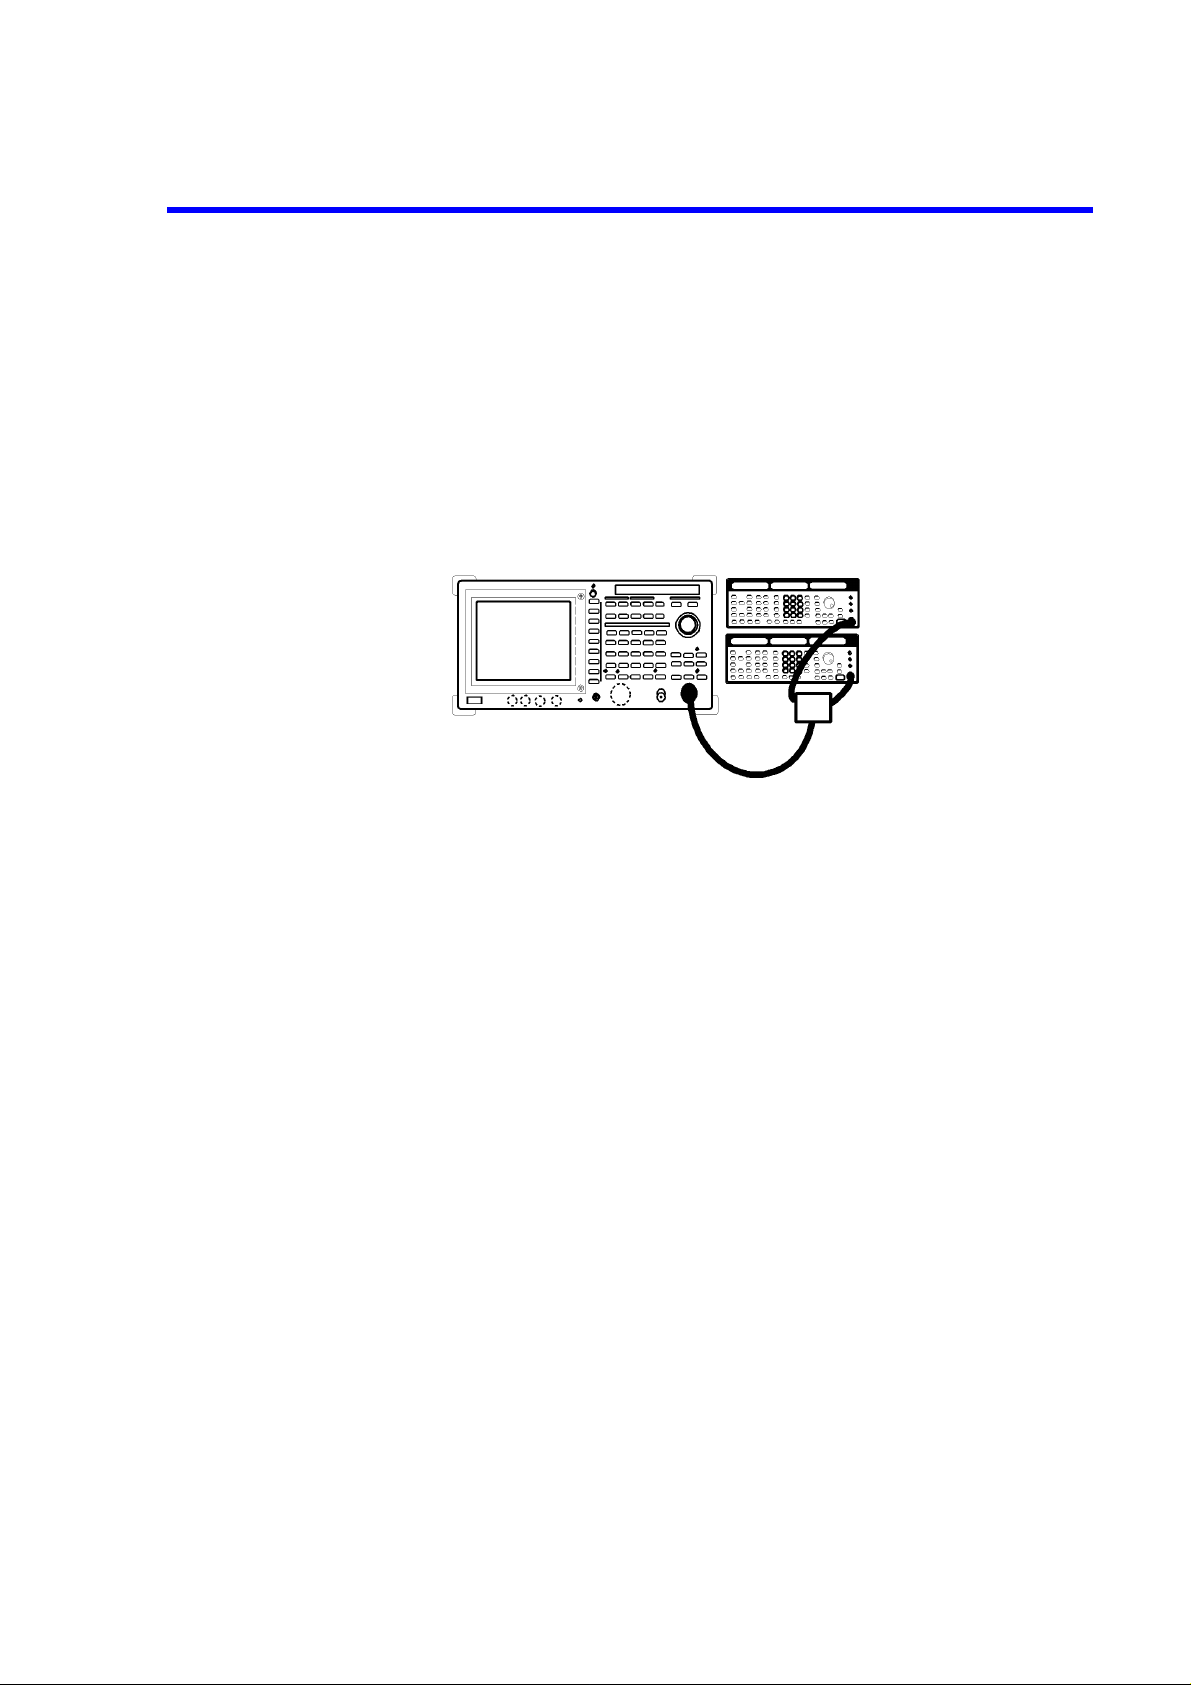
2.2.6 Separating Two Signals
This section describes how RBW should be set to properly observe adjacent signals using the analyzer.
Measurement conditions: The two signals used are as follows.
Signal 1: A frequency of 200.00 MHz and a Level of -10 dBm
Signal 2: A frequency 200.25 MHz and a Level of -40 dBm
Setup
1. Connect the signal generators as shown in Figure 2-37.
R3267 Series Spectrum Analyzer Operation Manual (Vol.1)
2.2.6 Separating Two Signals
Figure 2-37 Setup for Measuring Two Signals Separately
Power on
2. Turn the analyzer and the signal generators power on.
Setting the signal generators
This prepares the signal generators for output.
3. For Signal generator 1, set the frequency to 200.00 MHz; the level to -10 dBm;
and the output to the ON position.
4. For Signal generator 2, set the frequency to 200.25 MHz; level to -40 dBm; and
the output to the ON position.
Initialization
This resets the current settings to the factory defaults or user-defined presets.
5. Press
Setting the measurement conditions
SHIFT
This sets the analyzer to its presets values.
and
CONFIG(PRESET)
.
This changes the analyzer settings so that the input signal is displayed more clearly.
6. Press
FREQ, 2, 0, 0
A center frequency of 200 MHz is set.
and
MHz
.
2-33
Page 71
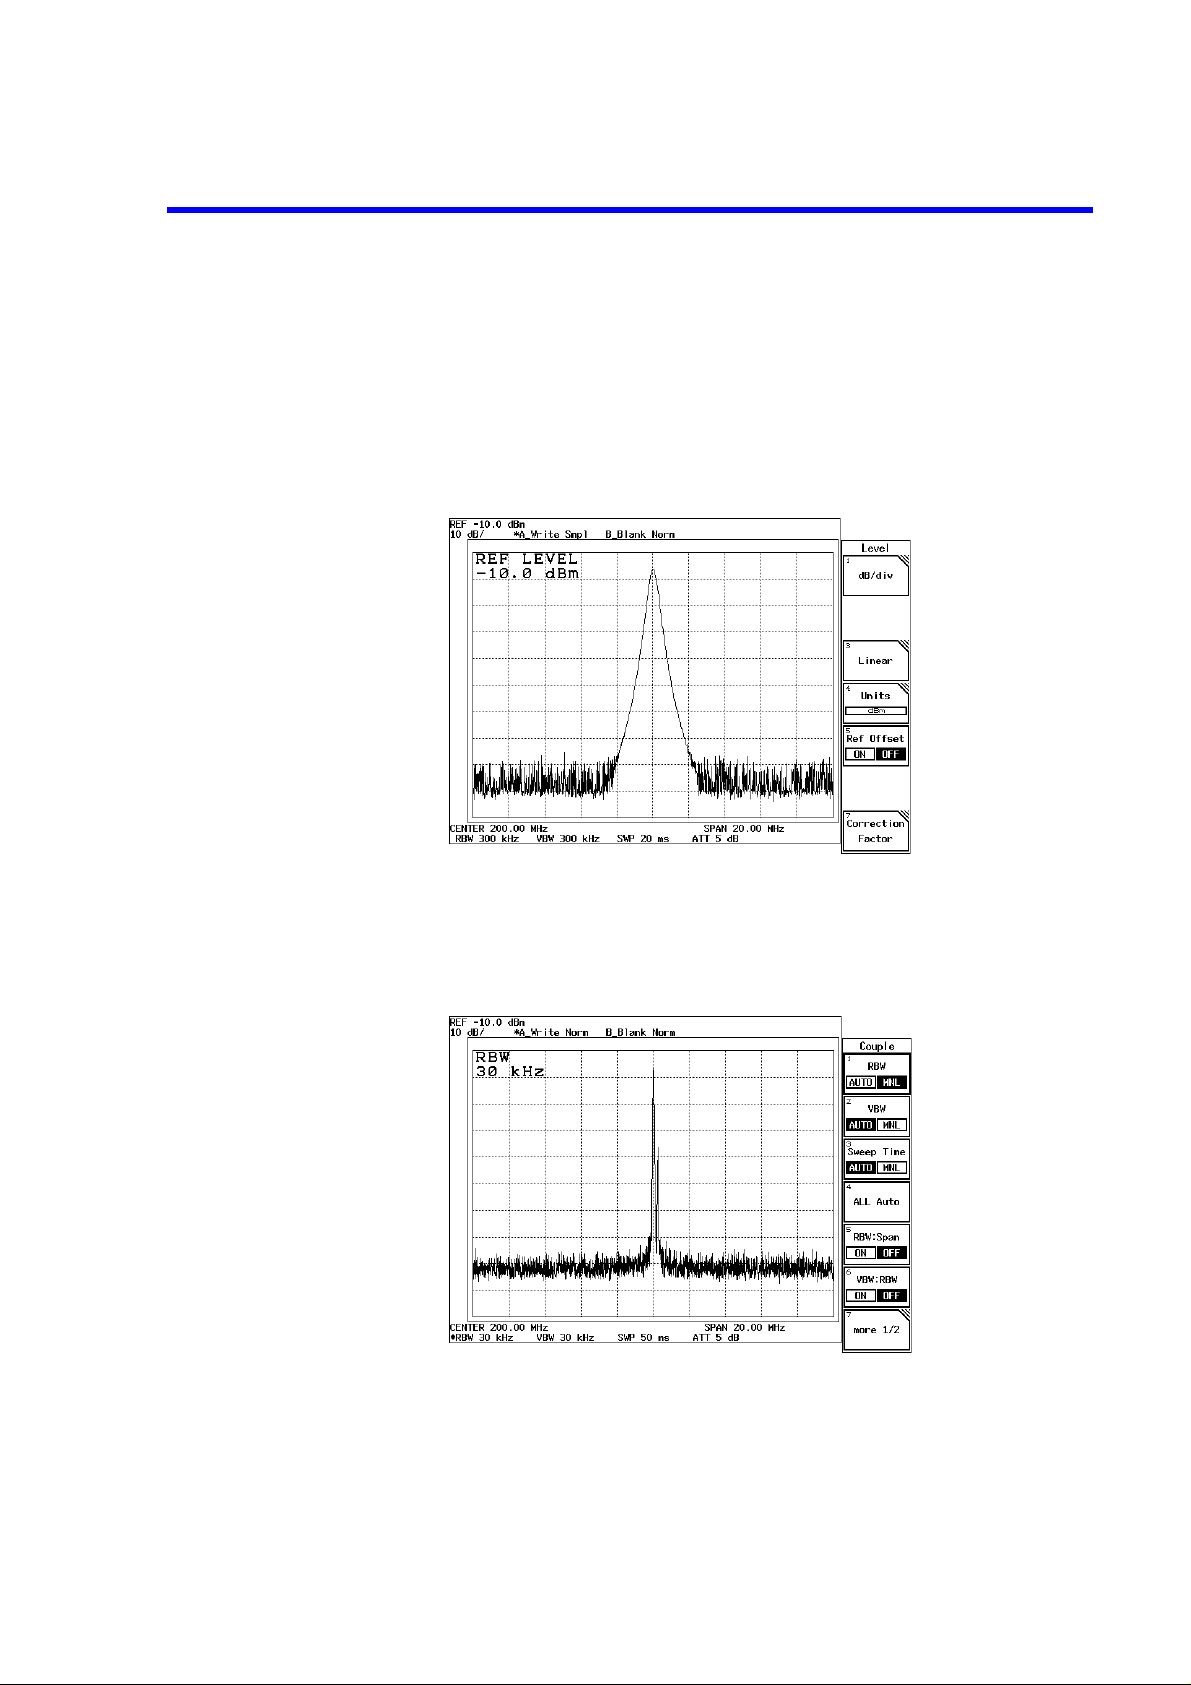
R3267 Series Spectrum Analyzer Operation Manual (Vol.1)
2.2.6 Separating Two Signa l s
7. Press
8. Press
SPAN, 2, 0
A frequency span of 20 MHz is set.
LEVEL, 1, 0
The reference level of -10 dBm is set.
The spectrums are not fully separated because the RBW default setting is 300
kHz. As a result, the display shows only one input signal even though there are
actually two.
Figure 2-38 Two Superimposed Peaks
and
and
.
MHz
MHz(-dBm)
.
9. Press
10. Press
COUPLE,
The RBW is set to 30 kHz.
Two peaks are now discernible but they are still not clearly separated.
Figure 2-39 Two Discernible Peaks
and
1, 0
The RBW is set to 10 kHz.
Two peaks can now be distinctly seen.
RBW AUTO/MNL
.
kHz
(MNL),
3, 0
and
kHz
.
2-34
Page 72
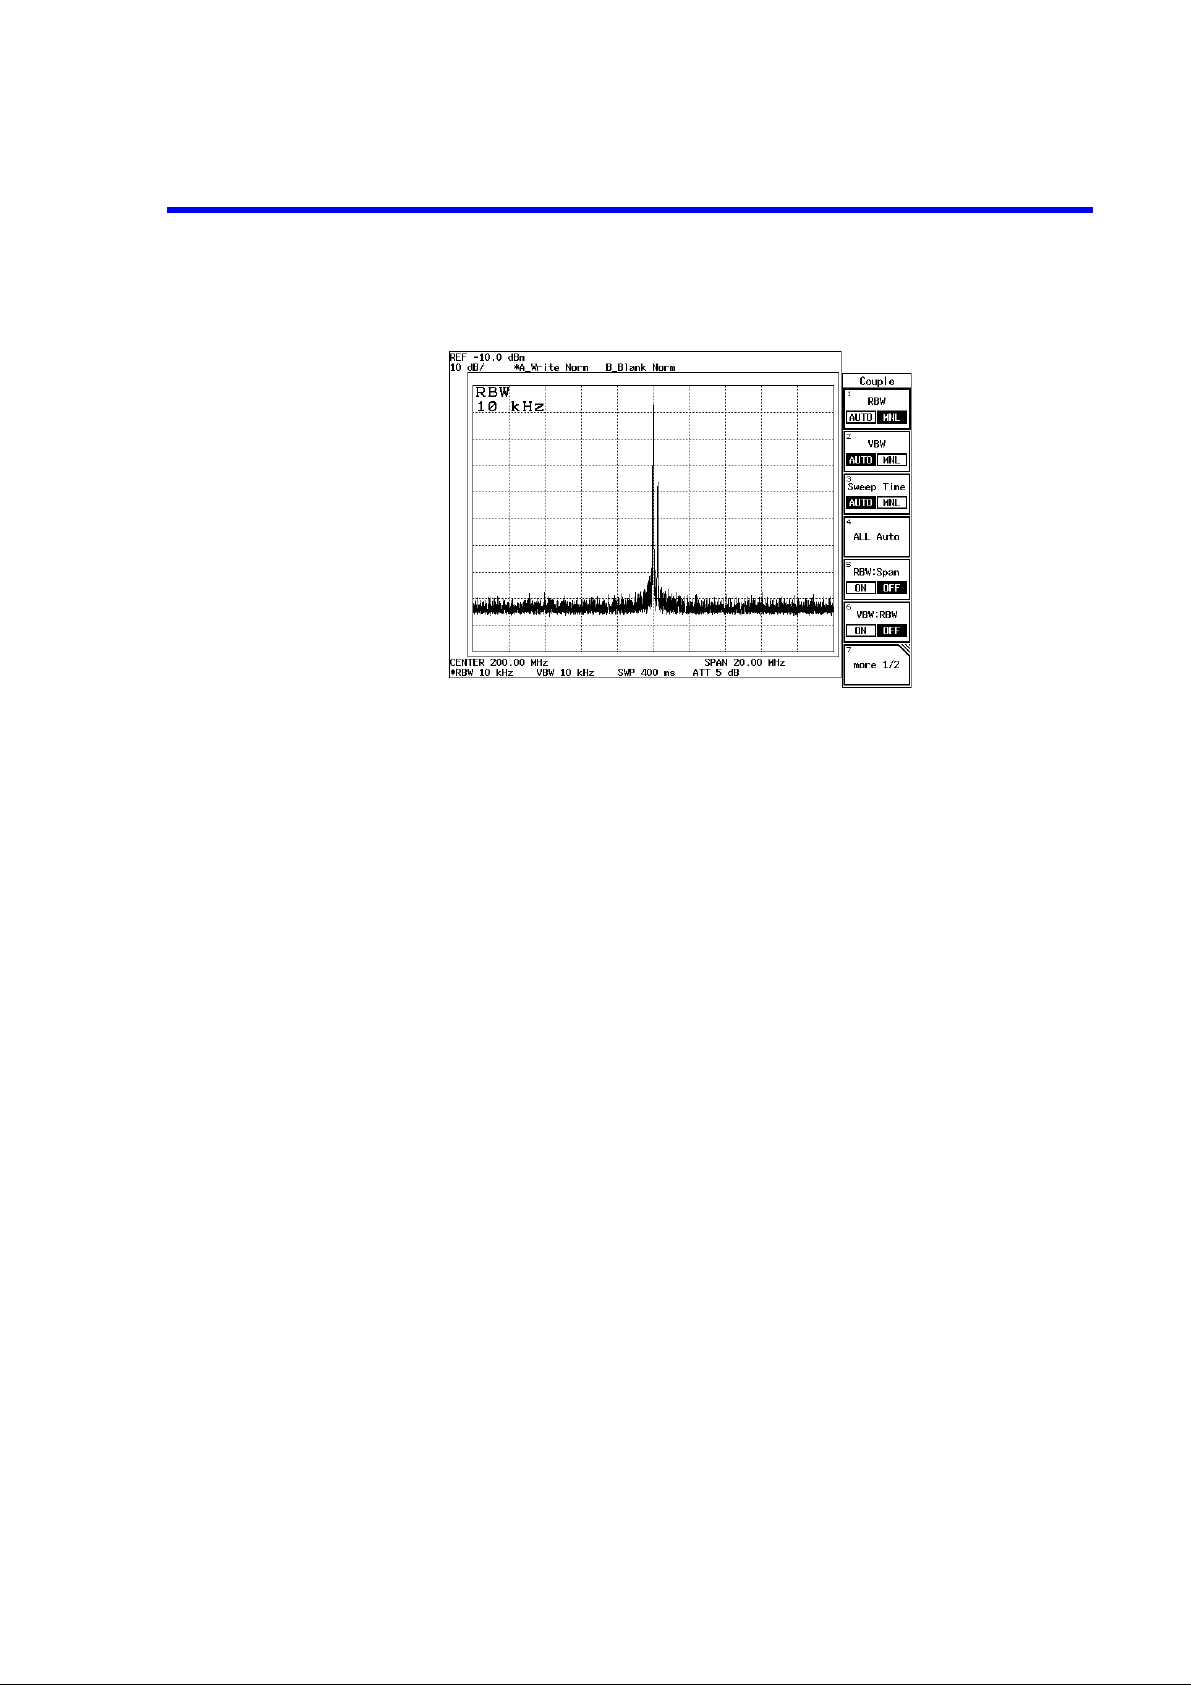
R3267 Series Spectrum Analyzer Operation Manual (Vol.1)
Figure 2-40 Two Distinct Peaks Can Now Be Seen
2.2.6 Separating Two Signals
2-35
Page 73
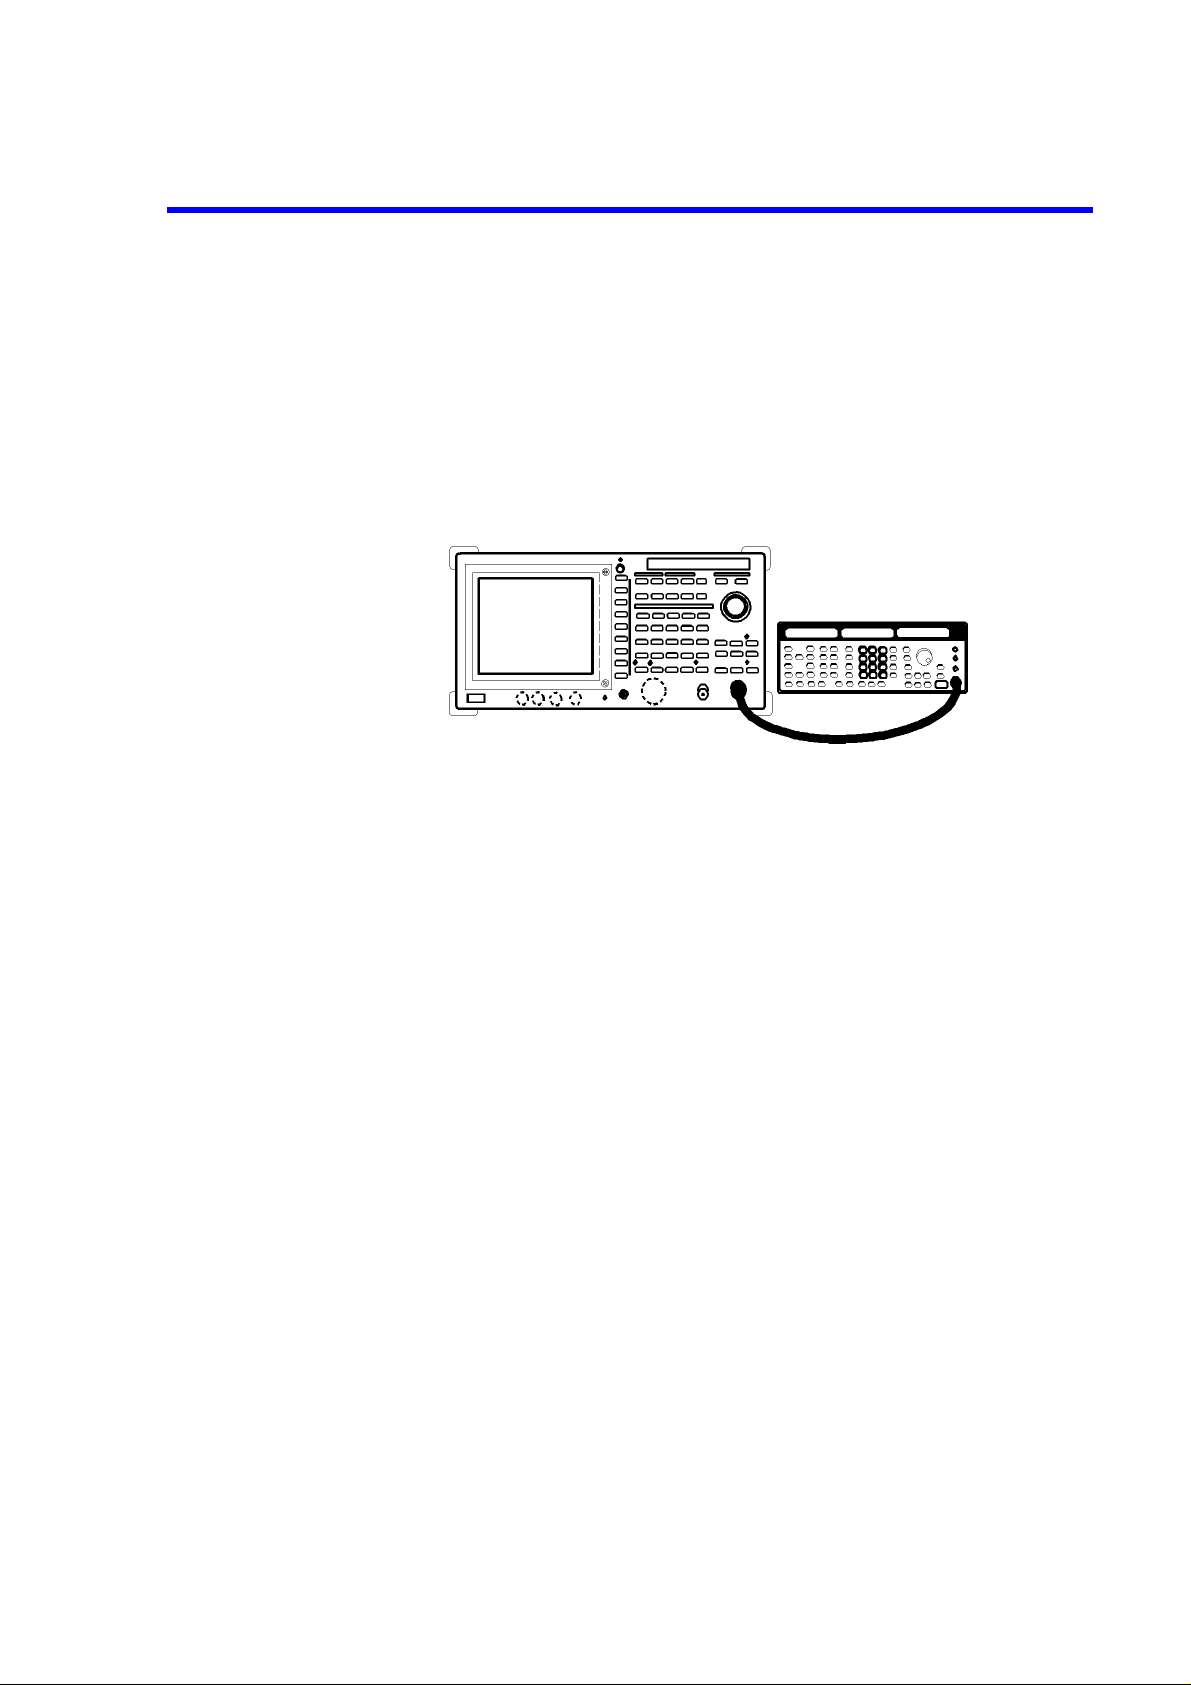
R3267 Series Spectrum Analyzer Operation Manual (Vol.1)
2.2.7 Dynamic Range
2.2.7 Dynamic Range
The dynamic range can be increased by reducing the noise level, which is accomplished by making the
resolution bandwidth narrower. The noise level can be further reduced by setting the video bandwidth
(VBW) to approximately 1/10 of the resolution bandwidth (RBW). In addition, noise level can be reduced
in a short time using the average function.
Setup
1. Connect the signal generator as shown in Figure 2-41.
Figure 2-41 Setup for Verifying the Dynamic Range
Power on
2. Turn the analyzer and the signal generator power on.
Setting the signal generator
This prepares the signal generators for output.
3. For Signal generator, set the frequency to 200 MHz; the level to -50 dBm; and
the output to the ON position.
Initialization
This resets the current settings to the factory defaults or user-defined presets.
4. Press
Setting the measurement conditions
This changes the analyzer settings so that the input signal is displayed more clearly.
SHIFT
This sets the analyzer to its presets values.
and
CONFIG(PRESET)
.
2-36
5. Press
6. Press
FREQ, 2, 0, 0
A center frequency of 200 MHz is set.
SPAN, 1, 0, 0
A frequency span of 100 MHz is set.
and
and
MHz
MHz
.
.
Page 74

R3267 Series Spectrum Analyzer Operation Manual (Vol.1)
2.2.7 Dynamic Range
Changing the RBW
7. Press
Figure 2-42 Trace Prior to Changing the RBW
The RBW is set to 1 MHz according to the current center frequency and frequency
span. The noise can be reduced by making this value smaller.
LEVEL, 4, 0
The reference level is set to -40 dBm.
and
MHz(-dBm)
.
Changing the VBW
8. Press
The noise width can be further reduced by setting the VBW to 1/10 of the RBW.
COUPLE,
An RBW of 100 kHz is set. Check that the noise level is reduced by 10 dB and
the dynamic range is widened.
Figure 2-43 Trace After Changing the RBW
RBW AUTO/MNL
(MNL),
1, 0, 0
and
kHz
.
2-37
Page 75

R3267 Series Spectrum Analyzer Operation Manual (Vol.1)
2.2.7 Dynamic Range
9. Press
Performing the averaging function
This function can improve the S/N ratio faster than the VBW method shown above.
This function makes it possible to quantify random components and measure signals
buried in the noise.
VBW AUTO/MNL
A VBW of 10 kHz is set. Check that the noise level is reduced more.
Figure 2-44 Trace After Changing the VBW
(MNL)
, 1, 0
and
kHz
.
10. Press A and
Average A (with a default setting of 20) has reduced the noise level considerably .
Figure 2-45 The Trace after Averaging
Average A
.
2-38
Page 76

2.2.8 UNCAL Message
The settin gs of th e reso lution bandwi dth (R BW), vi deo b andwid th (VB W), fr equen cy span (SPAN ) and
sweep time (SWP) are interrelated. The message UNCAL is displayed in the frequency area when any item
is inappropriately set. If this happens, proceed as follows to remove the UNCAL message.
• Make the resolution bandwidth (RBW) wider.
• Make the video bandwidth (VBW) wider.
• Make the sweep time (SWP) longer.
• Make the frequency span (SPAN) narrower when the RBW or VBW cannot be changed.
CAUTION: Measured data may be inaccurate if you take measurements while the UNCAL message is dis-
played.
In this section, the following example shows how to remove an UNCAL message, which was caused by
making the sweep time shorter, by changing the RBW setting.
Setup
R3267 Series Spectrum Analyzer Operation Manual (Vol.1)
2.2.8 UNCAL Message
Power on
Initialization
1. Connect the unit under test as shown in Figure 2-46.
Figure 2-46 Measuring AM Signal in Separate Screen Mode
2. Turn the analyzer and the signal generator power on.
This resets the current settings to the factory defaults or user-defined presets.
3. Press
This sets the analyzer to its presets values.
SHIFT
and
CONFIG(PRESET)
.
Setting the measurement conditions
This changes the analyzer settings so that the input signal is displayed more clearly.
4. Press
FREQ, 1
A center frequency of 1 GHz is set.
and
GHz
.
2-39
Page 77

R3267 Series Spectrum Analyzer Operation Manual (Vol.1)
2.2.8 UNCAL Message
5. Press
6. Press
SPAN, 5, 0
A frequency span of 50 kHz is set.
The following are automatically set:
RBW = 1 kHz, VBW = 1 kHz, Sweep time = 100 ms.
SWP,
Sweep time is set to 20 ms and UNCAL is displayed in the lower right hand frequency area on the screen.
A Sweep time of 20 msec is too short.
and
Sweep Time AUTO/MNL
kHz
.
(MNL),
2, 0
and
kHz(ms)
.
Figure 2-47 Screen with UNCAL Message
Coping with the UNCAL message
7. Press
COUPLE,
Once the RBW is set to 10 kHz, the UNCAL message will disappear be cause a
sweep time of 20 msec meets the required condition.
Figure 2-48 UNCAL Message Removed
RBW AUTO/MNL
(MNL), 1, 0 and
kHz
.
2-40
Page 78

2.2.9 Zooming the Frequency Domain
The analyzer has a function that allows you to display a par t of magnified upper screen trace on the lower
screen in the frequency domain.
This section describes the zoom function in the frequency domain.
Measurement conditions: The target of the measurement below is a signal whose characteristics consist
of an output frequency of 100 MHz, a level of -1 0 dBm, a modulation frequ ency of 10 kHz and an AM modulation factor of 3%.
Use appropriate parameter values when making the measurements in the example shown below.
Setup
1. Connect the unit under test as shown in Figure 2-49.
R3267 Series Spectrum Analyzer Operation Manual (Vol.1)
2.2.9 Zooming the Frequency Domain
Figure 2-49 Measuring AM Signal in Separate Screen Mode
Power on
2. Turn the analyzer and the signal generator power on.
Setting the signal generator
This prepares the signal generator for output.
3. Set the frequency to 100 MHz; the level to -10 dBm; the modulation frequency
to 10 kHz; AM modulation factor to 3% and the output to the ON position.
Initialization
This resets the current settings to the factory defaults or user-defined presets.
4. Press
Setting the measurement conditions
This changes the analyzer settings so the input signal is displayed more clearly.
5. Press
SHIFT
This sets the analyzer to its presets values.
FREQ,1, 0, 0
A center frequency of 100 MHz is set.
and
CONFIG(PRESET)
and
MHz
.
.
2-41
Page 79

R3267 Series Spectrum Analyzer Operation Manual (Vol.1)
2.2.9 Zooming the Frequenc y Domai n
Figure 2-50 Displaying the Trace in Full Screen Mode
Separate screen mode
6. Press
7. Press
SPAN, 2, 5
A frequency span of 25 kHz is set.
WINDOW
The screen display is in Separate screen mode and the Zoom menu is displayed.
The cursor for the zoom position and the cursors for the zoom width are displayed
on the upper screen.
and
and
kHz
Zoom
.
.
2-42
Figure 2-51 Displaying the Trace in Separate Screen Mode
8. Press
9. Press
Zoom Width,
A frequency span of the lower screen is set to 1 kHz.
Zoom Position
using the da ta knob.
The center frequency on the lower screen moves to the peak on the modulating
signal.
and
1
and move the cursor to the peak on the modulating signal
kHz
.
Page 80
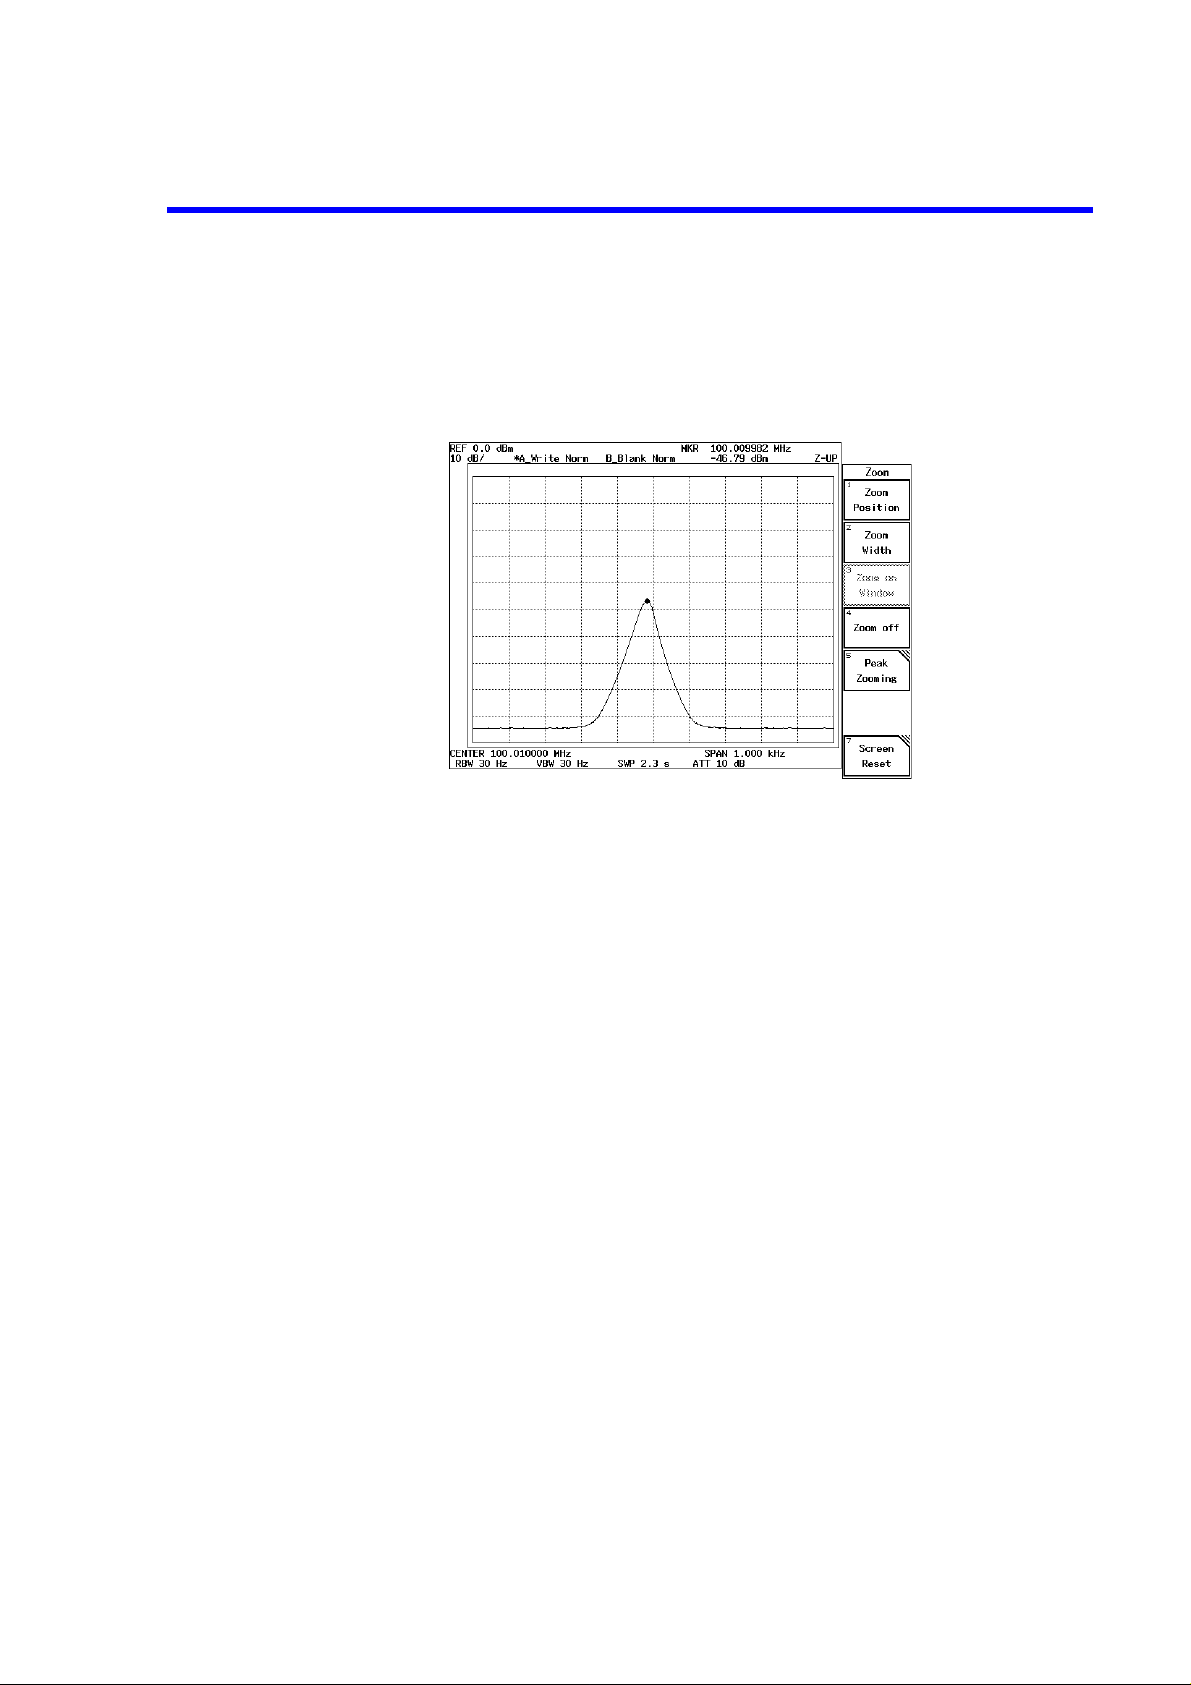
R3267 Series Spectrum Analyzer Operation Manual (Vol.1)
Displaying a magnified lower screen in Full screen mode
2.2.9 Zooming the Frequency Domain
10. Press
Figure 2-52 Displaying the Magnified Lower Screen
Turning off the magnified display
11. Press
Zoom on Window
The lower screen is magnified and displayed in Full screen mode.
The spectrum can be analyzed using this magnified display.
Zoom off
The screen display returns to Separate screen mode from the magnified lower
screen mode.
.
.
Turning off the Separate s creen mode
12. Press
Screen Reset
The screen display returns to Full screen mode for displaying only the upper
screen.
.
2-43
Page 81

R3267 Series Spectrum Analyzer Operation Manual (Vol.1)
2.2.10 Zooming the Time Domain
2.2.10 Zooming the Time Domain
The analyzer has a function that allows you to display a par t of magnified upper screen trace on the lower
screen in the time domain. This section describes the zoom function in the time domain.
Measurement conditions: The target of the measurement below is a signal whose characteristics consist
of an output frequency of 1 GHz, a le vel of -10 dBm, a pulse wi dth of 0.8 msec
and a pulse period of 10 msec.
Use appropriate parameter values when making the measurements in the example shown below.
Setup
1. Connect the unit under test as shown in Figure 2-53.
Figure 2-53 Measuring Burst Signal in Separate Screen Mode
Power on
2. Turn the analyzer and the signal generator power on.
Setting the signal generator
This prepares the signal generator for output.
3. Set the frequency to 1 GHz; the level to -10 dBm; the pulse width to 0.8 msec;
pulse period to 10 msec and the output to the ON position.
Initialization
This resets the current settings to the factory defaults or user-defined presets.
4. Press
Setting the measurement conditions
This changes the analyzer settings so the input signal is displayed more clearly.
5. Press
SHIFT
This sets the analyzer to its presets values.
FREQ, 1
A center frequency of 1 GHz is set.
and
CONFIG(PRESET)
and
GHz
.
.
2-44
Page 82
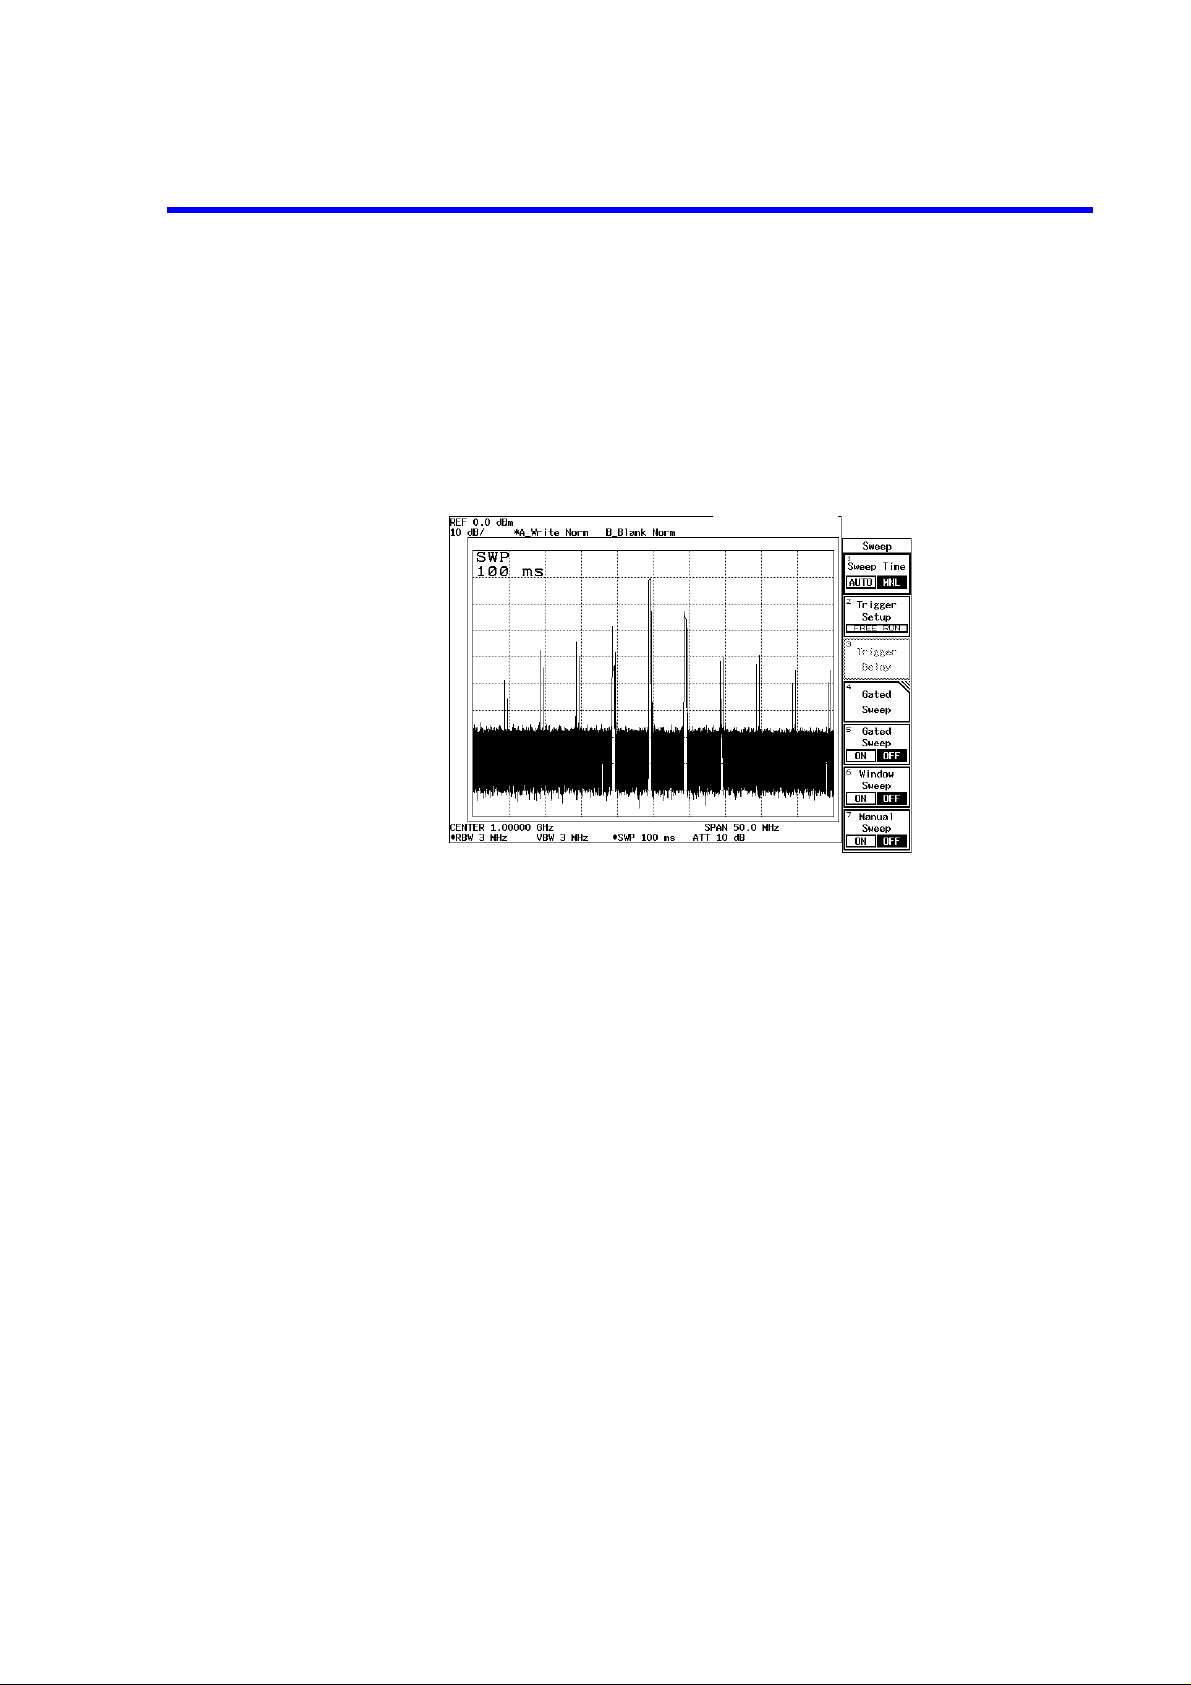
R3267 Series Spectrum Analyzer Operation Manual (Vol.1)
2.2.10 Zoo ming the Ti me Domain
6. Press
7. Press
8. Press
SPAN, 5, 0
A frequency span of 50 MHz is set.
SWP,
A sweep time of 100 msec is set.
COUPLE,
A resolution bandwidth of 3 MHz is set. The burst signal can be identified.
Figure 2-54 Trace of a Burst Signal
and
Sweep Time AUTO/MNL
RBW AUTO/MNL
MHz
.
(MNL)
, 1, 0, 0
(MNL), 3 and
and
MHz
kHz(ms)
.
.
9. Press
The frequency span is set to zero span.
10. Press
The Trigger Setup dialog box is displayed.
11. Set
12. Press
13. Adjust the trigger level.
14. Press
Source
The trigger source is set to VIDEO. The cursor moves to Slope. The trigger level
mark "→" is displayed on the left-hand side of the scale.
The trigger slope is set to "+" and the cursor moves to Trigger Level.
Adjust the trigger level to the middle of the burst signal turning the data knob.
A stably triggered display is obtained.
The Trigger Setup dialog box is removed.
and
SPAN
SWP
Hz(ENTER)
RETURN
Zero Span
and
Trigger Setup
to
VIDEO
.
.
.
.
.
2-45
Page 83
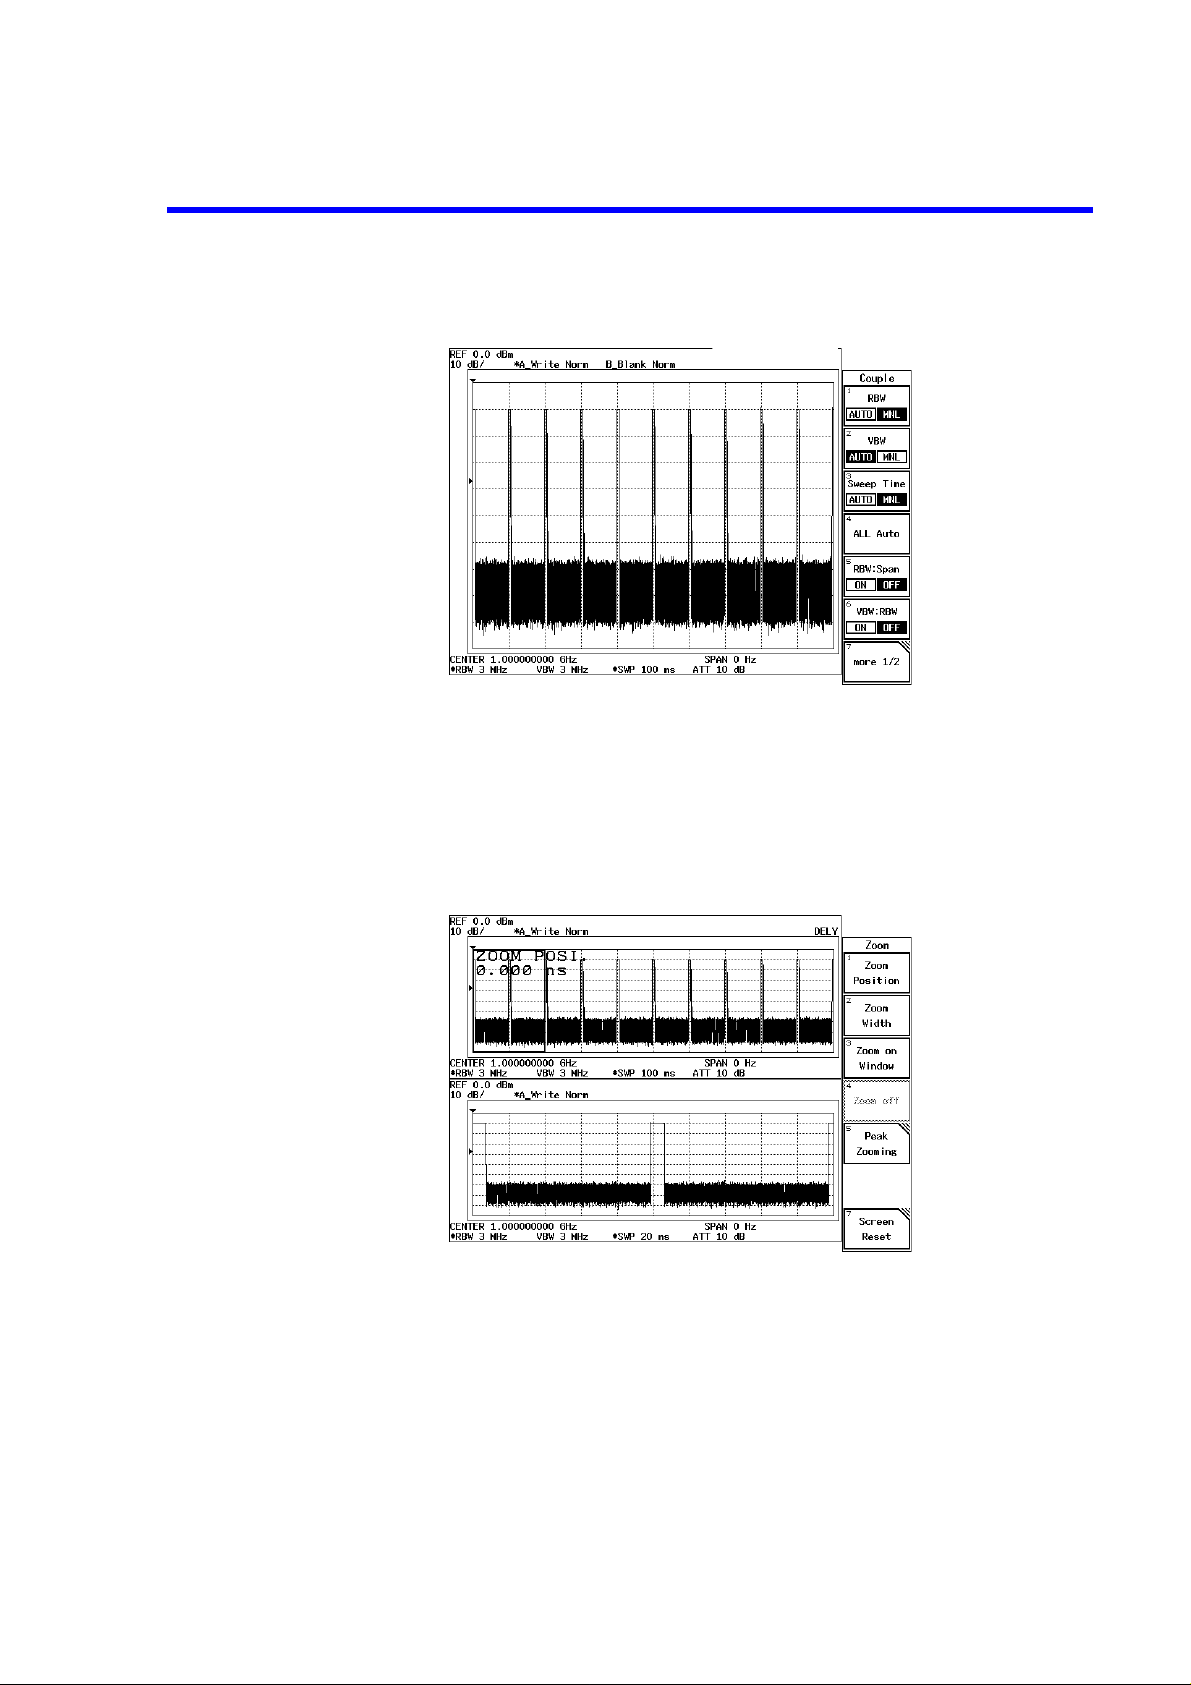
R3267 Series Spectrum Analyzer Operation Manual (Vol.1)
2.2.10 Zooming the Time Domain
Figure 2-55 Burst Signal in the Zero Span
Separate screen mode
15. Press
The screen display is in Separate screen mode and the Zoom menu is displayed.
The cursor for the zoom position and the cursors for the zoom width are displayed
on the upper screen.
Figure 2-56 Displaying the Trace in the Separate Screen Mode
Observing the leading edge
16. Press
the data knob.
The leading edge of the signal is displayed on the lower screen.
WINDOW
Zoom Position
and
.
Zoom
and move the cursor to the lead ing edge of the signal using
2-46
17. Press
Zoom Width
The leading edge is magnified on the lower screen.
and move the zoom width to the leading edge of the signal.
Page 84
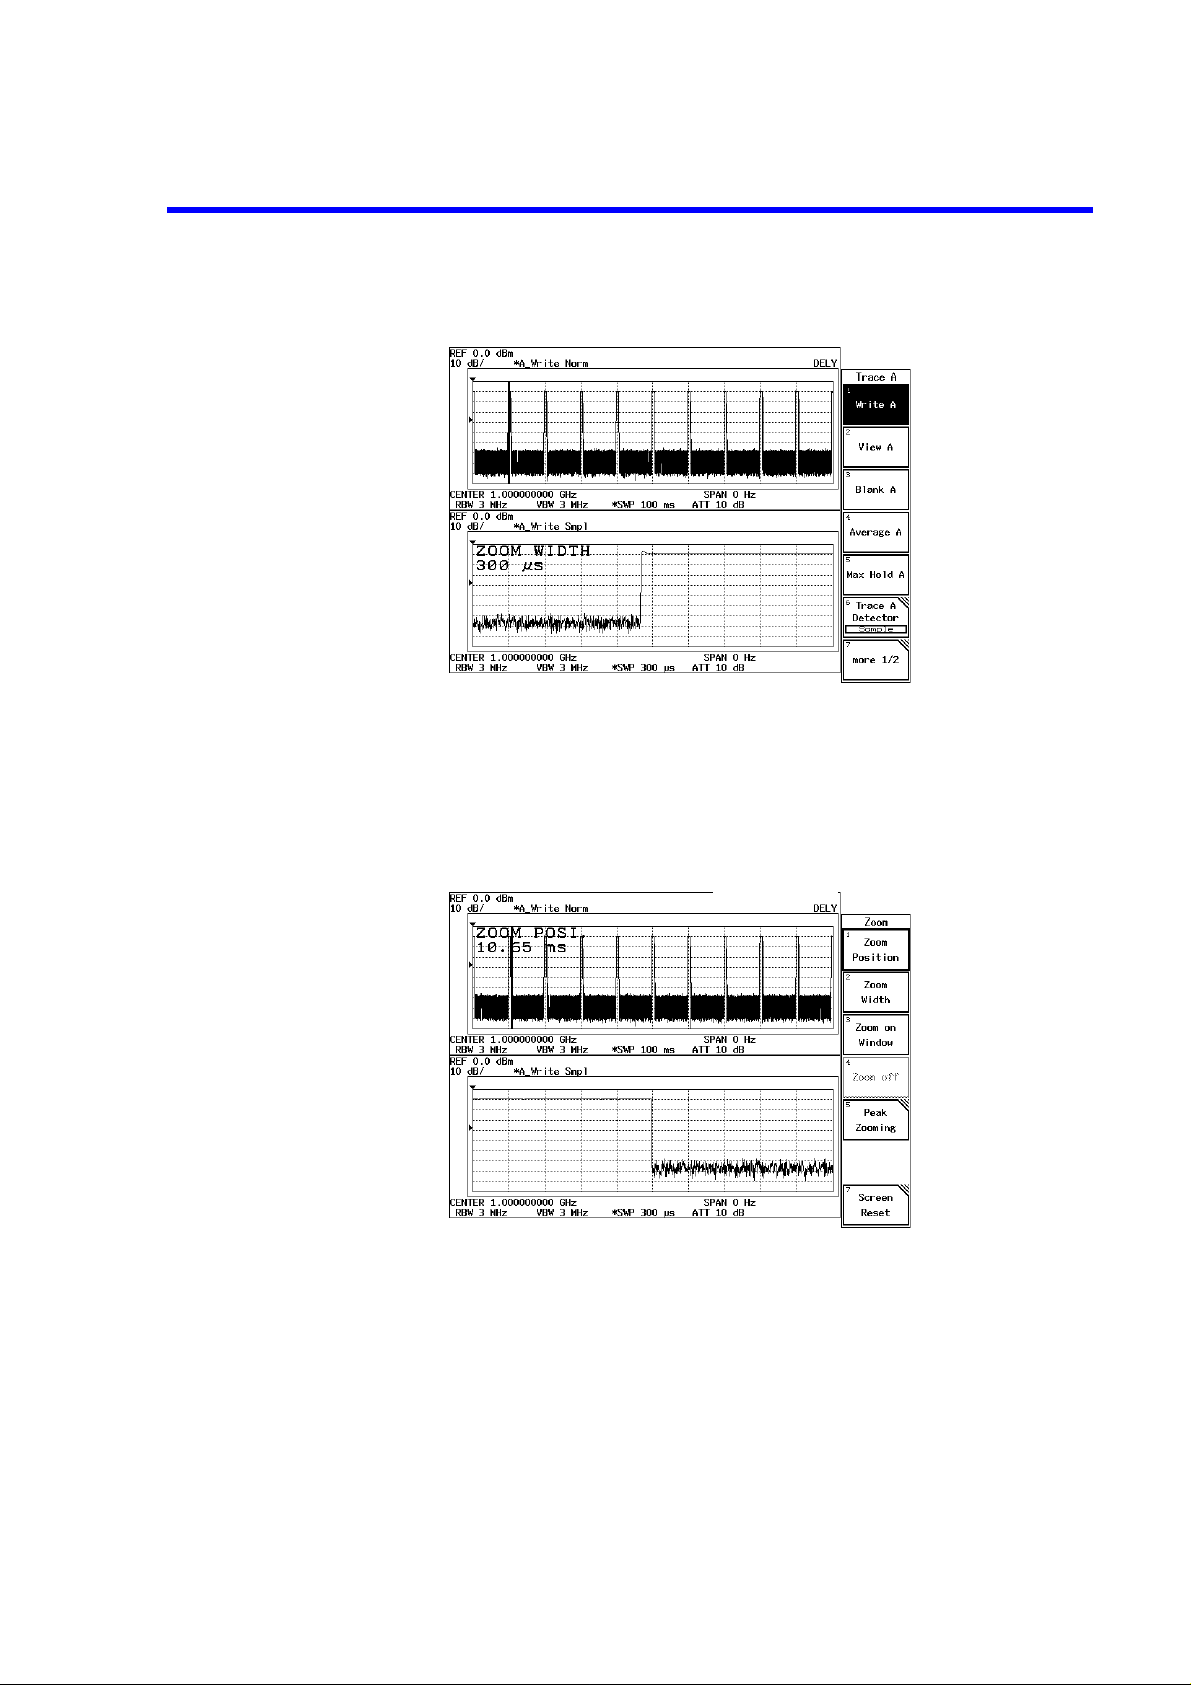
Figure 2-57 Observing the Leading Edge in the Separate Screen Mode
Observing the trailing edge
R3267 Series Spectrum Analyzer Operation Manual (Vol.1)
2.2.10 Zoo ming the Ti me Domain
18. Press
Figure 2-58 Observing the Trailing Edge in Separate Screen Mode
Displaying the lower screen in Full screen mode
19. Press
Zoom Position
data knob.
The trailing edge of the signal is displayed on the lower screen.
Zoom on Window
The leading edge is magnified on the lower screen.
You can analyze the time axis using this magnified display.
. Move the cursor to the trailing edge of the signal using the
.
2-47
Page 85

R3267 Series Spectrum Analyzer Operation Manual (Vol.1)
2.2.10 Zooming the Time Domain
Returning to Separate screen mode from the magnified lower screen
20. Press
Entering Full screen mode
21. Press
Zoom off
The screen display returns to Separate screen mode from the magnified lower
screen.
Screen Reset
The screen display now returns to Full screen mode (displaying the trace on the
upper screen).
.
.
2-48
Page 86
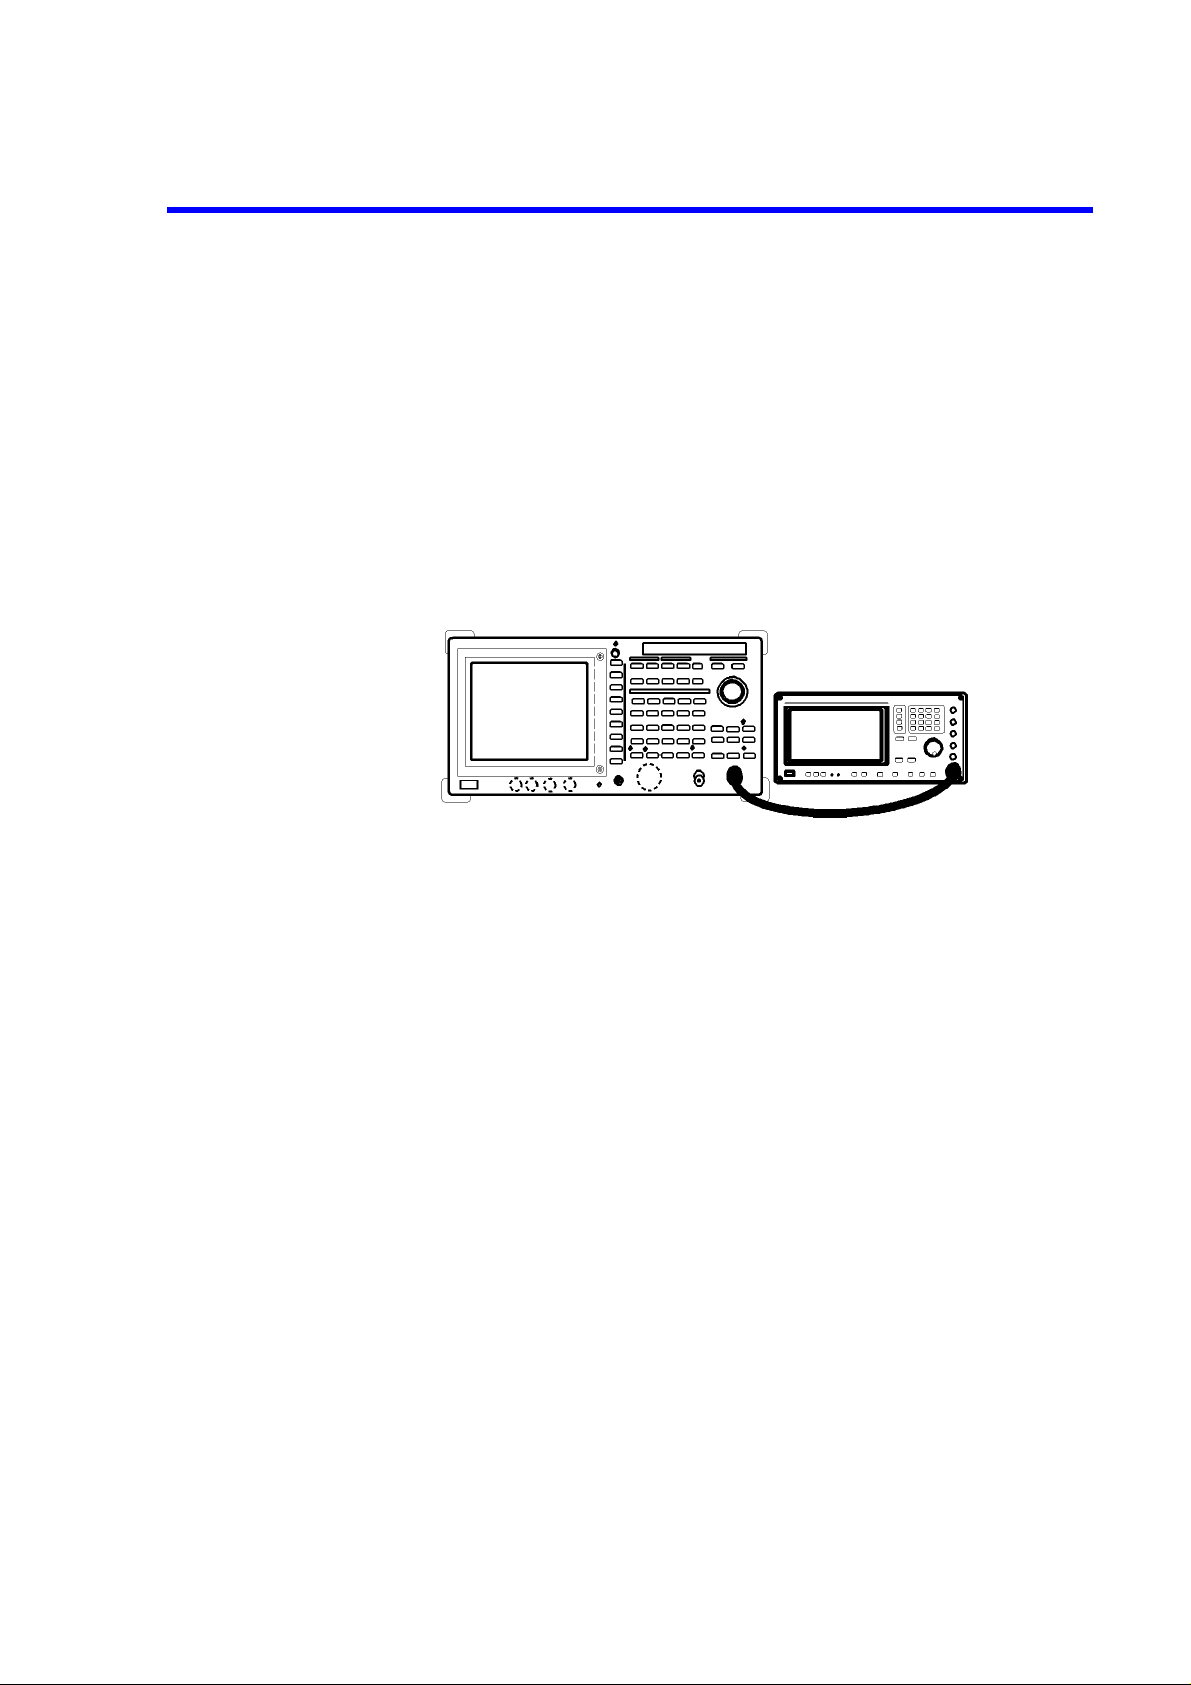
R3267 Series Spectrum Analyzer Operation Manual (Vol.1)
2.2.11 Measurement Using the F/T Function
The analyzer provides the F/T function that allows you to measure using two screens (one is in the frequency domain; and the other is in the time domain) simultaneously.
Measurement conditions: The target of the measurement below is a signal whose characteristics consist
of an output frequency of 1 GHz, a level of -10 dBm, a pulse width of 4 msec
and a pulse period of 10 msec.
Use appropriate parameter values when making the measurements in the example shown below.
Setup
1. Connect the unit under test as shown in Figure 2-59.
2.2.11 Measurement Using the F/T Function
Figure 2-59 Setup to Measure Pulse Signal Using 2 Screens
Power on
2. Turn the analyzer and the signal generator power on.
Setting the signal generator
This prepares the signal generator for output.
3. Set the frequency to 1 GHz; the level to -10 dBm; the pulse width to 4 msec; pulse
period to 10 msec and the output to the ON position.
Initialization
This resets the current settings to the factory defaults or user-defined presets.
4. Press
Setting the measurement conditions
This changes the analyzer settings so that the input signal is displayed more clearly.
5. Press
SHIFT
This sets the analyzer to its presets values.
FREQ, 1
A center frequency of 1 GHz is set.
and
CONFIG(PRESET)
and
GHz
.
.
2-49
Page 87
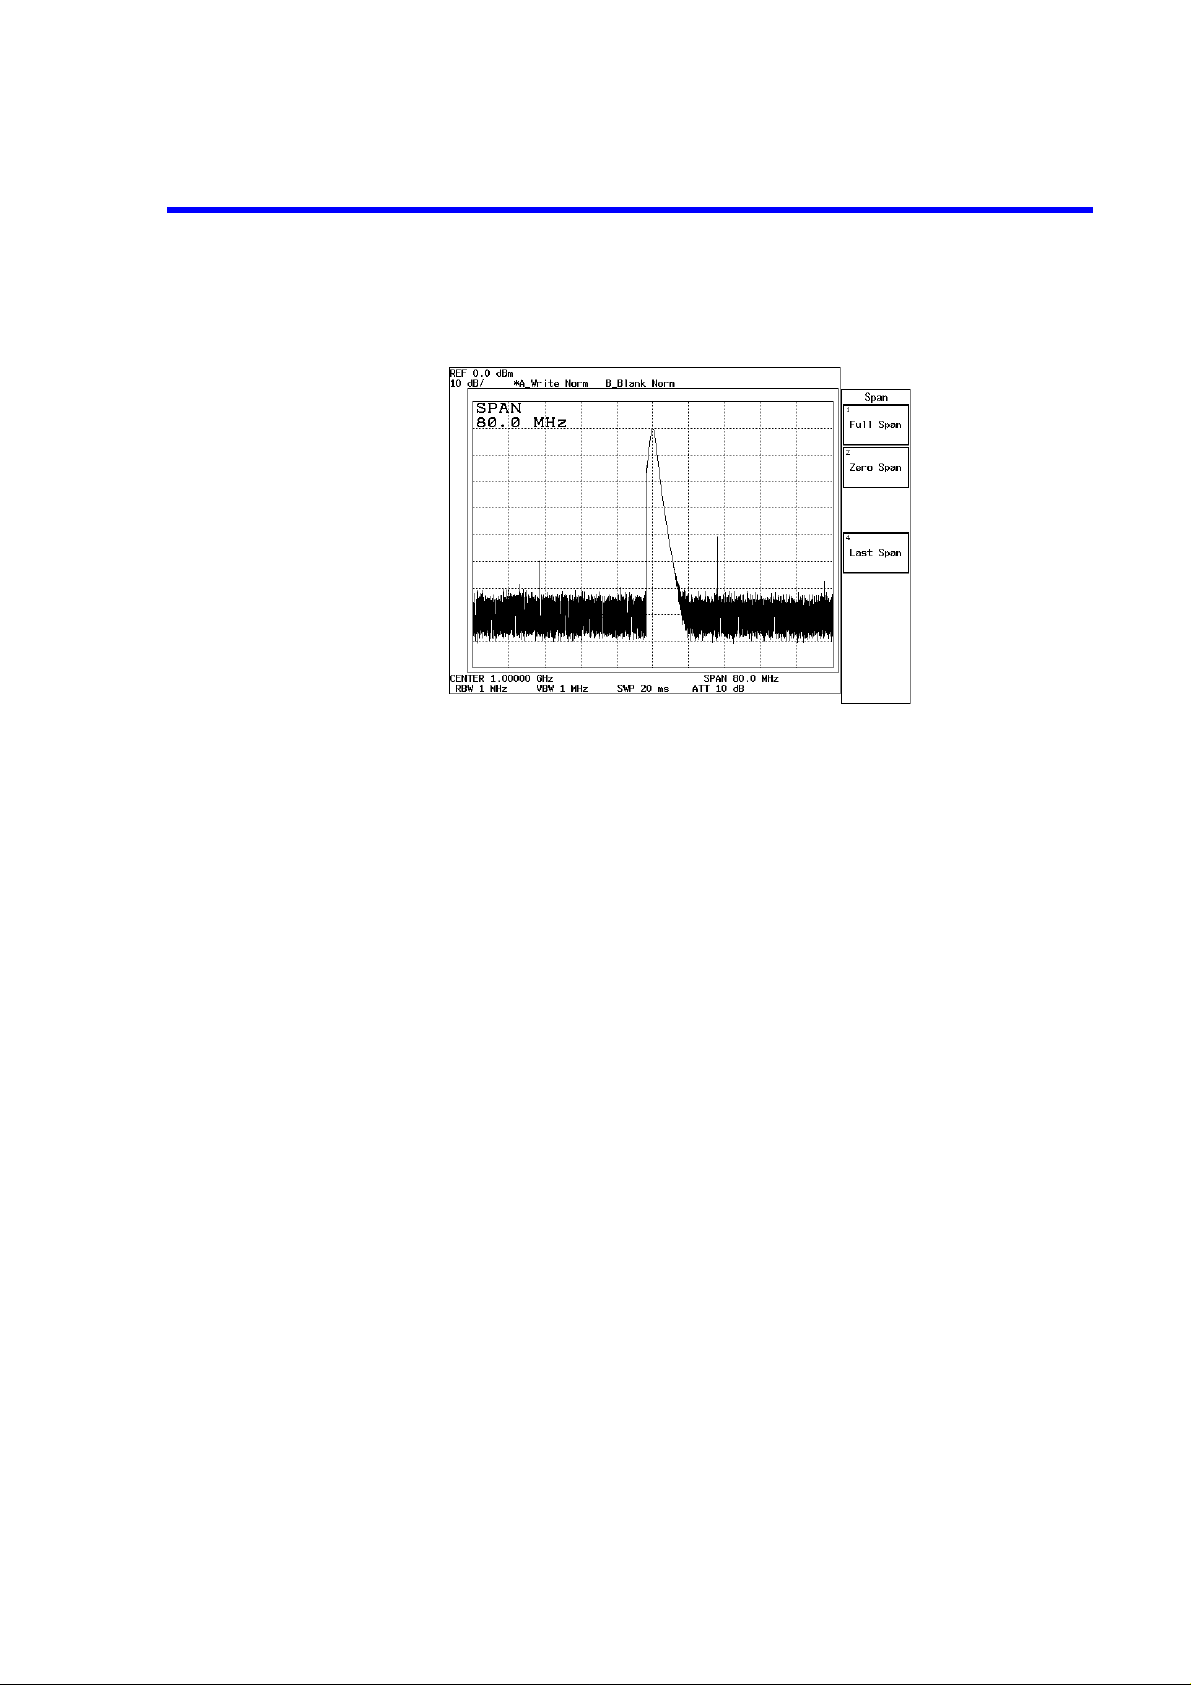
R3267 Series Spectrum Analyzer Operation Manual (Vol.1)
2.2.11 Measurement Using the F/T Function
Separate screen mode
6. Press
7. Press
SPAN, 8, 0
A frequency span of 80 MHz is set.
Figure 2-60 Trace of a Burst Signal
WINDOW
The display is now in the Separate screen mode. The frequency domain is displayed on the upper screen, and the time domain is displayed on the lower screen.
and
and
MHz
F/T
.
.
8. Press B.
The lower screen is active.
9. Press
10. Press
11. Set
12. Press
13. Adjust the trigger level.
14. Press
SWP,
Sweep Time AUTO/MNL
The sweep time for the lower screen is set to 10 msec.
Trigger Setup
The Trigger Setup dialog box is displayed.
to
Source
The trigger source is set to VIDEO. The cursor moves to Slope. The trigger level
mark "→" is displayed on the left-hand side of the scale.
Hz(ENTER)
The trigger slope is set to "+" and the cursor moves to Trigger Level.
Adjust the trigger level to the middle of the burst signal turning the data knob. A
stably triggered display is obtained.
RETURN
The Trigger Setup dialog box is removed.
.
VIDEO
.
.
.
(MNL)
, 1, 0
and
kHz(ms)
.
2-50
Page 88
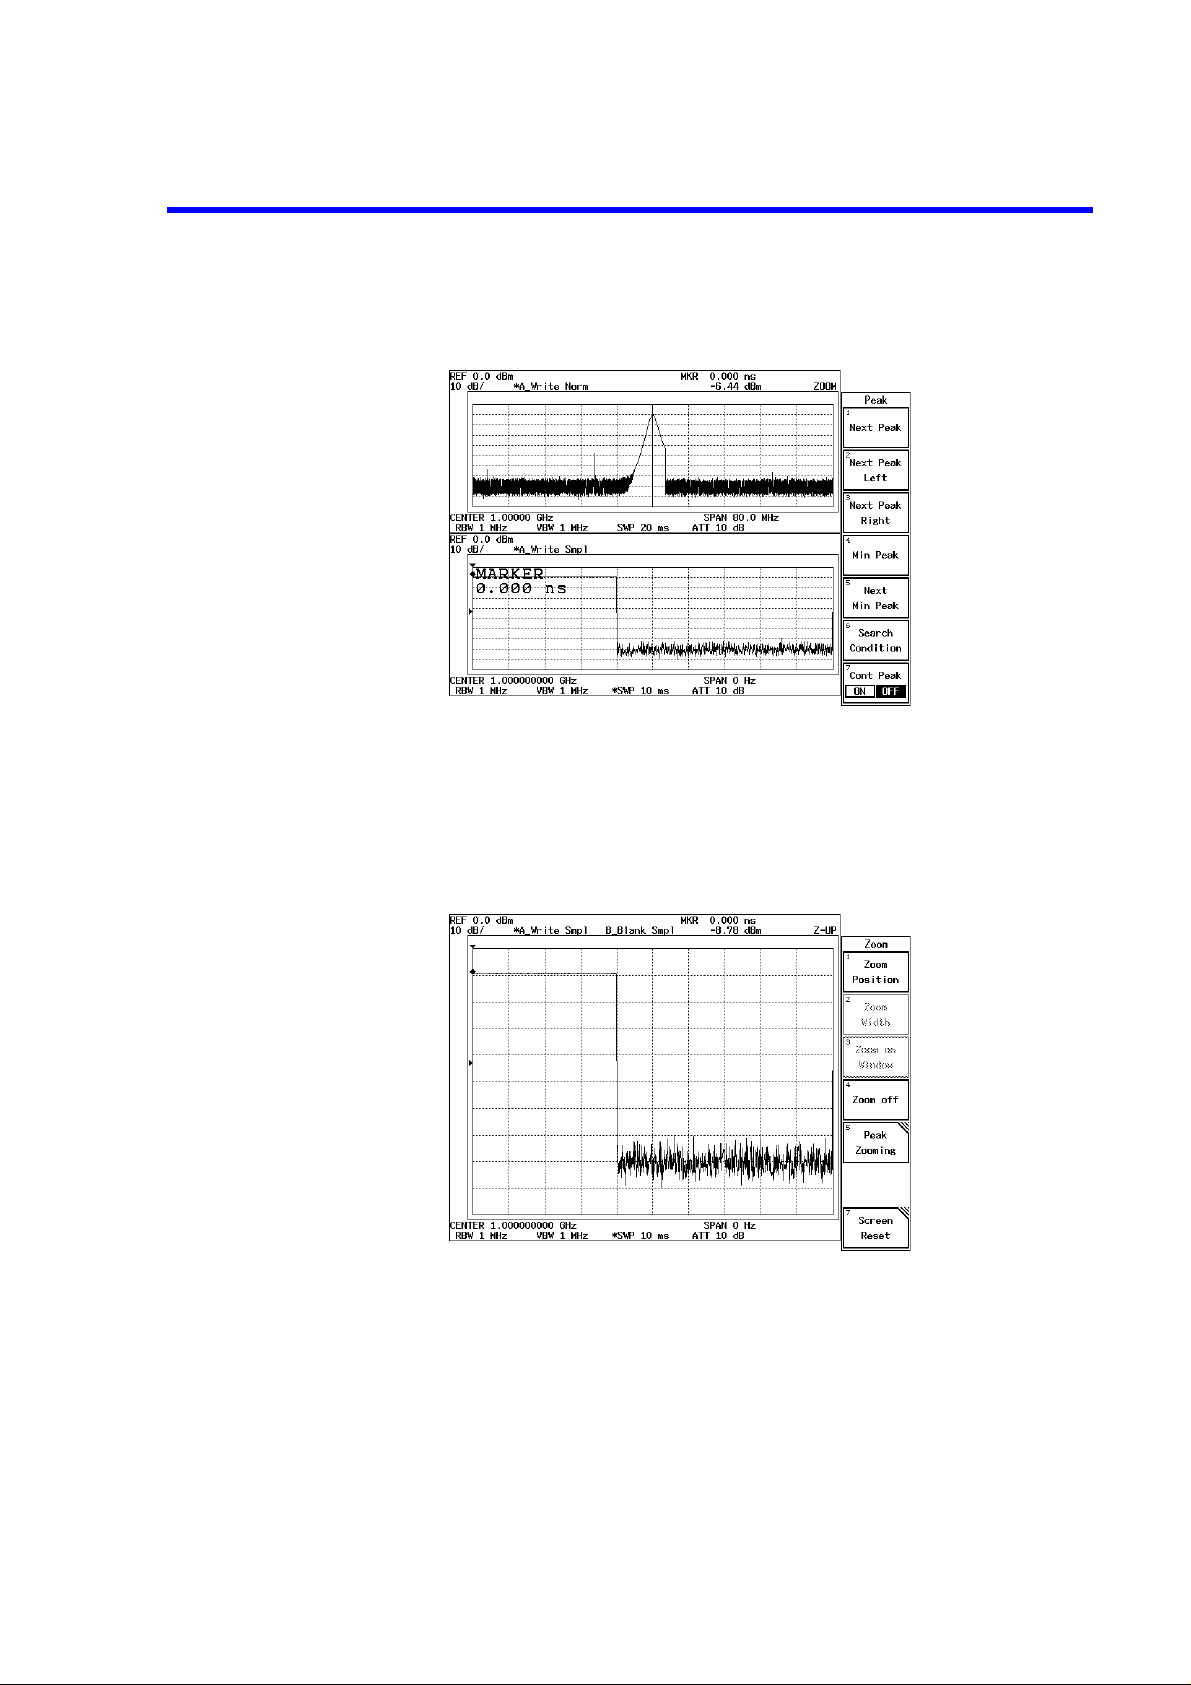
R3267 Series Spectrum Analyzer Operation Manual (Vol.1)
2.2.11 Measurement Using the F/T Function
15. Press
The marker is displayed on the lower screen.
Figure 2-61 F/T Function Displayed in Separate Screen Mode
Displaying the lower trace in Full screen mode
16. Press
The leading edge is magnified on the lower screen.
You can analyze the time axis using this magnified display.
.
SRCH
WINDOW
and
Zoom on Window
.
Figure 2-62 F/T Mode in Zoom Display
Entering Separate screen mode
17. Press
The screen display changes from the magnified mode (of the lower screen) to
Separate screen mode.
Zoom off
.
2-51
Page 89

R3267 Series Spectrum Analyzer Operation Manual (Vol.1)
2.2.11 Measurement Using the F/T Function
Entering Full screen mode
18. Press
Screen Reset
The screen display now returns to Full screen mode (displaying the trace on the
upper screen).
.
2-52
Page 90

R3267 Series Spectrum Analyzer Operation Manual (Vol.1)
2.2.12 Measuring Dual Parameters
The analyzer is capable of displaying traces using two screens simultaneously with d ifferent measurement
conditions to each other.
2.2.12.1 Measuring Dual Parameters in the Frequency Domain
This section describes how to set the center frequency for each screen and display them.
Measurement conditions: The two signals used are as follows.
Signal 1: A center frequency of 100 MHz and a level of -10 dBm.
Signal 2: A center frequency of 650 MHz and a level of -10 dBm.
Use appropriate parameter values when making the measurements in the
example shown below.
Setup
1. Connect the unit under test as shown in Figure 2-63.
2.2.12 Measuring Dual Parameters
Figure 2-63 Setup to Measure Dual Parameters
Power on
2. Turn the analyzer and the signal generators power on.
Setting the signal generators
This prepares the signal generators for output.
3. For signal generator 1, set the frequency to 100 MHz; the level to -10 dBm and
the output to the ON position.
4. For signal generator 2, set the frequency to 650 MHz; the level to -10 dBm and
the output to the ON position.
Initialization
This resets the current settings to the factory defaults or user-defined presets.
2-53
Page 91

R3267 Series Spectrum Analyzer Operation Manual (Vol.1)
2.2.12 Measuring Dual Par ameters
5. Press
Setting the measurement conditions
This changes the analyzer settings so that the input signal is displayed more clearly.
6. Press
SHIFT
This sets the analyzer to its presets values.
WINDOW
The Zoom menu is displayed and the screen d isplay is changed to Separate screen
mode.
and
CONFIG(PRESET)
and
Zoom
.
.
Figure 2-64 Displaying in Separate Screen Mode
Setting for the upper screen
7. Press
A center frequency of 100 MHz is set for the upper screen.
8. Press
A frequency span of 10 MHz is set for the upper screen.
Trace 1 is displayed on the upper screen.
FREQ, 1, 0, 0
SPAN, 1, 0
and
and
MHz
MHz
.
.
2-54
Page 92

Figure 2-65 Setting for the Upper Screen in Separate Screen Mode
Setting for the lower screen
R3267 Series Spectrum Analyzer Operation Manual (Vol.1)
2.2.12 Measuring Dual Parameters
9. Press B.
The lower screen is active.
10. Press
11. Press
Figure 2-66 Setting for the Lower Screen in Separate Screen Mode
FREQ, 6, 5, 0
A center frequency of 650 MHz is set for the lower screen.
SPAN, 5
A frequency span of 5 MHz is set for the lower screen.
and
and
MHz
MHz
.
.
2-55
Page 93

R3267 Series Spectrum Analyzer Operation Manual (Vol.1)
2.2.12 Measuring Dual Par ameters
Magnified display for the lower screen
12. Press
Figure 2-67 Magnified Trace for the Lower Screen
Changing the screen display to Separate screen mode
13. Press
WINDOW
The trace for the lower screen is now displayed in Full screen mode.
Zoom off
The screen display is changed from the magnified mode (of the lower trace) to
Separate screen mode.
and
Zoom on Window
.
.
2-56
Changing the screen display to Full screen mode (for displaying the upper screen)
14. Press
Screen Reset
The screen display is changed to Full screen mode for displaying the upper
screen.
.
Page 94

R3267 Series Spectrum Analyzer Operation Manual (Vol.1)
2.2.12.2 Measuring Dual Parameters in the Time Domain
This section describes how to set the center frequency for each screen and analyze them in the time
domain.
Measurement conditions: The signal to be measured consists of the signal specified below.
Signal 1: A frequency of 900 MHz, a Level of 0 dBm, a pu lse width of 1 msec
and a pulse period of 10 msec.
Signal 2: A frequency of 1800 MHz, a Level of 0 dBm, a pulse width of 1
msec and a pulse period of 10 msec.
Use appropriate parameter values when making the measurements in the
example shown below.
Setup
1. Connect the unit under test as shown in Figure 2-68.
2.2.12 Measuring Dual Parameters
Figure 2-68 Setup to Measure Pulse Signals with Different Frequencies Using 2 Screens
Power on
2. Turn the analyzer and the unit under test power on.
Setting the unit under test
3. Couples Signal 1 with Signal 2 and outputs the total signal.
Initialization
This resets the current settings to the factory defaults or user-defined presets.
4. Press
This sets the analyzer to its presets values.
Setting the measurement conditions
This changes the analyzer settings so that the input signal is displayed more clearly.
5. Press
Both screens are set to Zero span in the Separate screen.
and
SHIFT
WINDOW
CONFIG(PRESET)
and
T/T
.
.
2-57
Page 95

R3267 Series Spectrum Analyzer Operation Manual (Vol.1)
2.2.12 Measuring Dual Par ameters
Setting for the upper screen
6. Press
7. Press
8. Press
9. Press
10. Set
11. Press
12. Adjust the trigger level.
13. Press
FREQ, 9, 0, 0
A center frequency of 900 MHz is set for the upper screen.
COUPLE,
A resolution bandwidth of 3 MHz is set for the upper screen.
SWP,
Sweep Time AUTO/MNL
A sweep time of 10 msec is set for the upper screen.
Trigger Setup
The Trigger Setup dialog box is displayed.
to
Source
The trigger source is set to VIDEO. The cursor moves to Slope. The trigger level
mark "→" is displayed on the left-hand side of the scale.
Hz(ENTER)
The trigger slope is set to "+" and the cursor moves to Trigger Level.
Adjust the trigger level to the middle of the burst signal turning the data knob. A
stably triggered display is obtained.
RETURN
The Trigger Setup dialog box is removed.
and
MHz
RBW AUTO/MNL
.
VIDEO
.
.
.
.
(MNL), 3 and
(MNL),
1, 0
MHz
and
.
kHz(ms)
.
2-58
Figure 2-69 Upper Screen in Sync with the Trigger Signal
Setting for the lower screen
14. Press B.
The lower screen is active.
Page 96
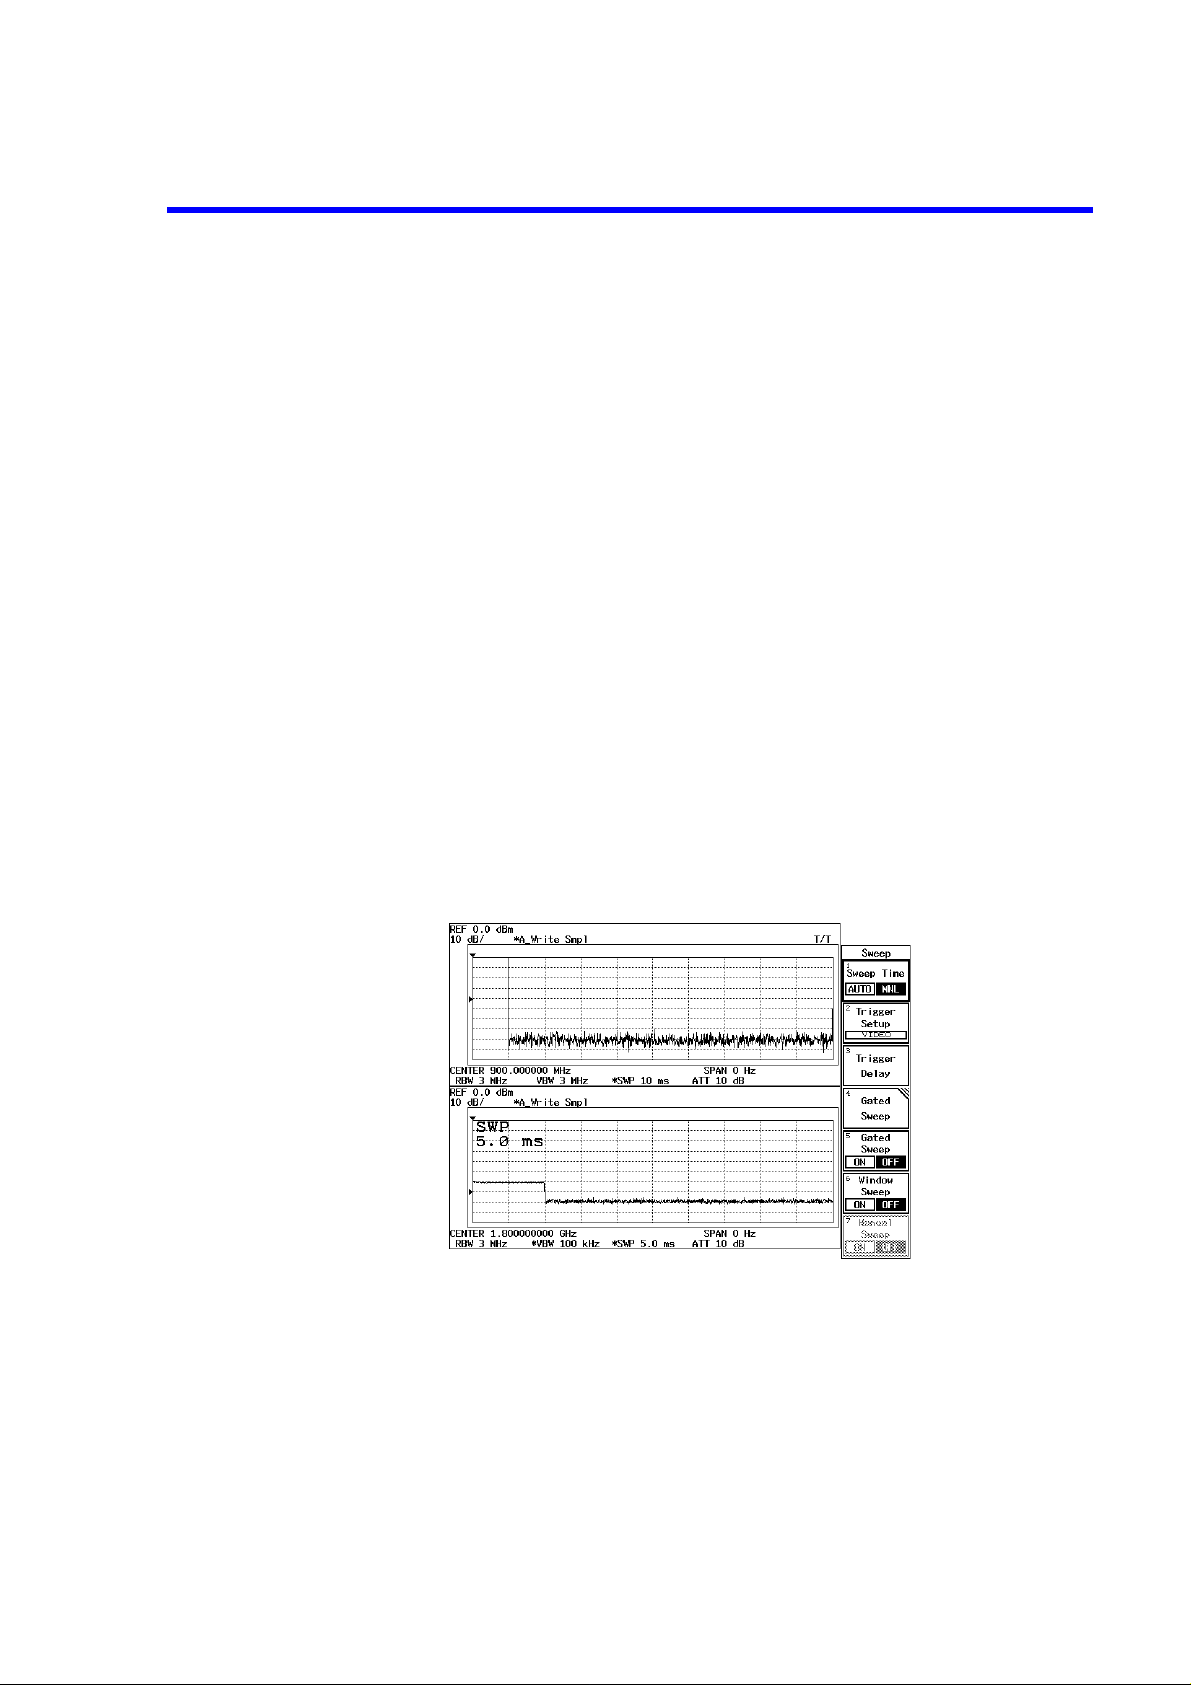
R3267 Series Spectrum Analyzer Operation Manual (Vol.1)
2.2.12 Measuring Dual Parameters
15. Press
16. Press
17. Press
18. Set
19. Press
20. Adjust the trigger level.
21. Press
22. Press
FREQ, 1, 8, 0, 0
A center frequency of 1800 MHz is set for the lower screen.
COUPLE,
A VBW of 100 kHz is set for the lower screen.
and
SWP
The Trigger Setup dialog box is displayed.
to
Source
The trigger source is set to VIDEO. The cursor moves to Slope. The trigger level
mark "→" is displayed on the left-hand side of the scale.
Hz(ENTER)
The trigger slope is set to "+" and the cursor moves to Trigger Level.
Adjust the trigger level to the middle of the burst signal turning the data knob. A
stably triggered display is obtained.
RETURN
The Trigger Setup dialog box is removed.
Sweep Time AUTO/MNL
A sweep time of 5 msec is set for the lower screen.
VIDEO
and
MHz
VBW AUTO/MNL
Trigger Setup
.
.
.
.
(MNL)
.
, 1, 0, 0
and
, 5
and
kHz
kHz(ms)
.
.
Figure 2-70 Displaying the Traces of 900 MHz and 1800 MHz in the Separate Screen Mode
23. Press
The level on the lower screen can be measured using the marker.
SRCH
.
2-59
Page 97
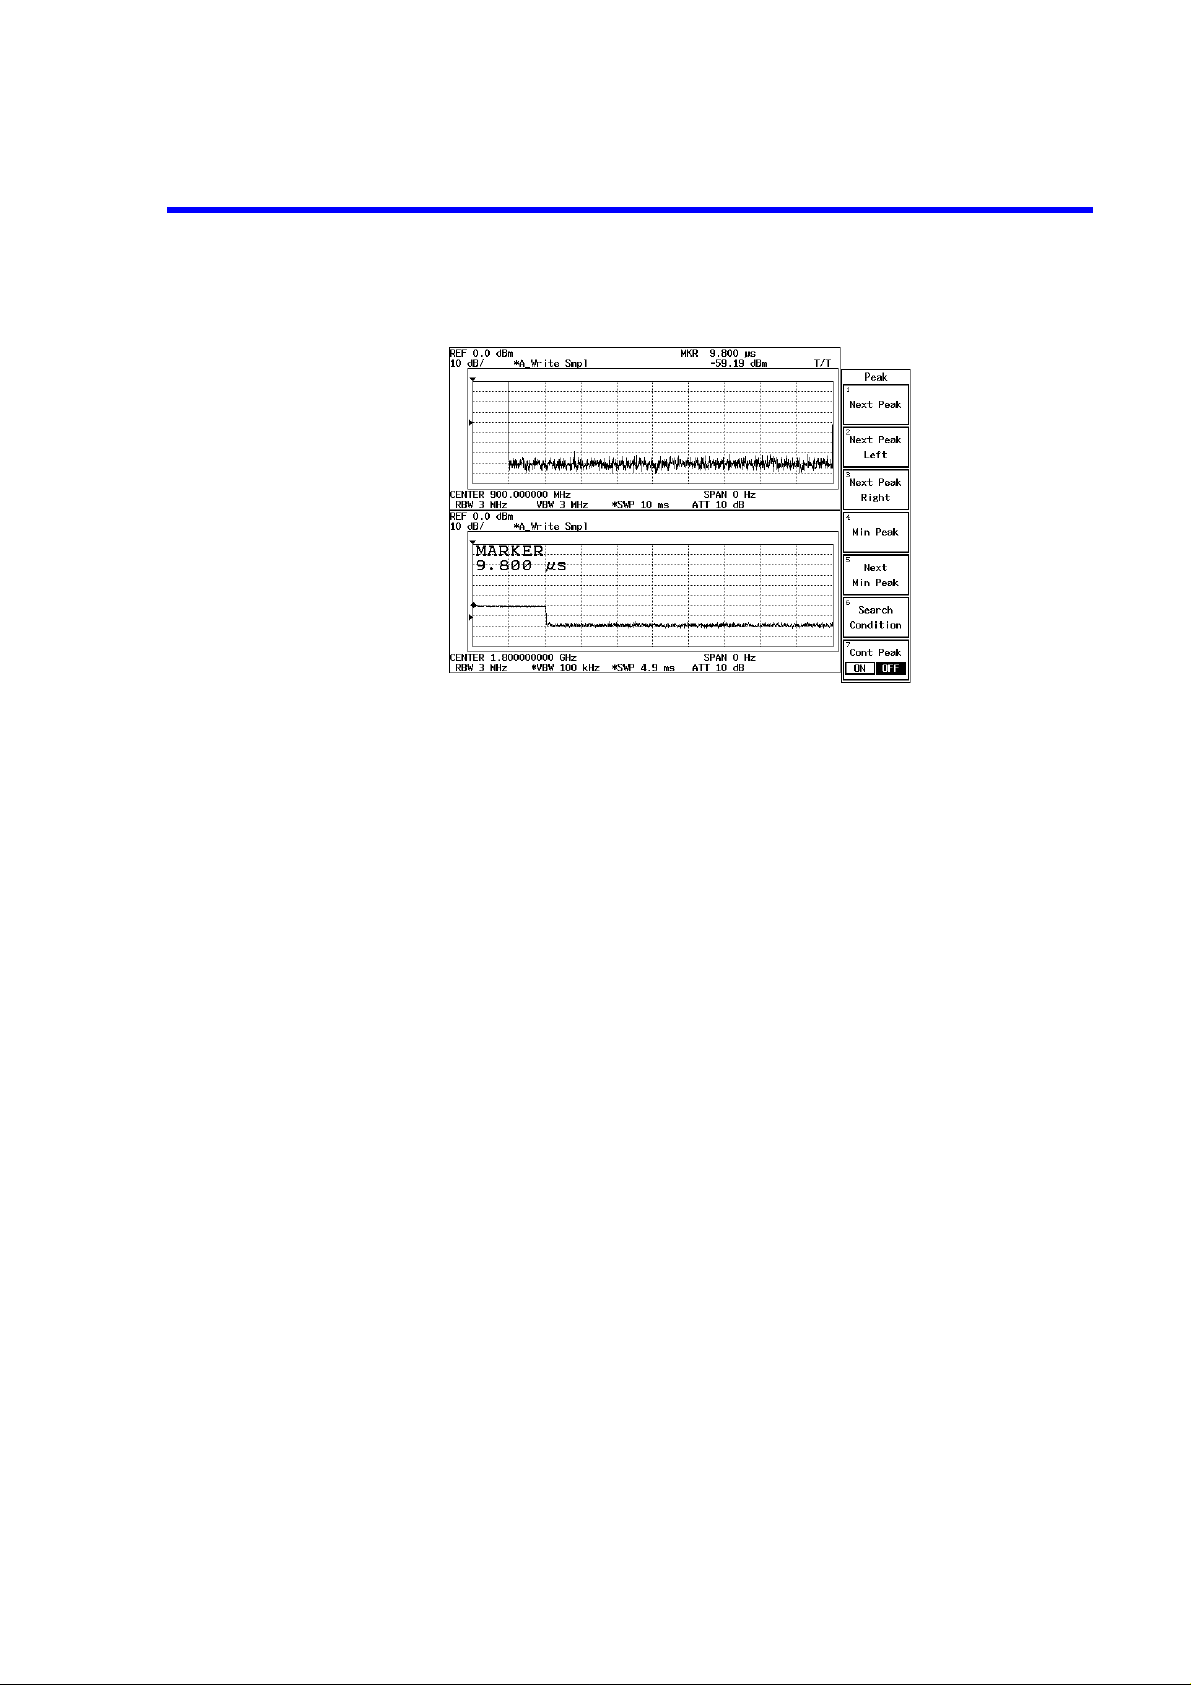
R3267 Series Spectrum Analyzer Operation Manual (Vol.1)
2.2.12 Measuring Dual Par ameters
Figure 2-71 Displaying the Trace of 1800 MHz for the Lower Screen
Changing the screen display to Full screen mode for displaying only the upper screen.
24. Press
WINDOW
The screen display returns to Full screen mode for displaying only the upper
screen.
and
Screen Reset
.
2-60
Page 98
2.2.13 Calibration
Calibrations are required to take measurements within the specifications of the analyzer.
CAUTION:
1. Wait 60 minutes after turning the power on before performing the calibrations.
2. If a calibration is performed during the first 10 minutes after the power is turned on, spectrum analyzers with
OPT 23 installed may occasionally display error messages since the reference frequency source is not stable.
There are three methods to calibrate the analyzer as shown below.
•Cal All
Performs calibrations for all items to see if they meet the specifications.
Perform them before taking measurements. Processing time: Approximately 9 minutes.
•Total Gain
Performs calibrations with more accuracy than Cal All, because user-d efined measu rement conditions
are used. Set the conditions first before the calibrations. Processing time: Approximately 1 minute.
R3267 Series Spectrum Analyzer Operation Manual (Vol.1)
2.2.13 Cali bration
• Cal Each Item
Performs calibration on only one item.
Table 2-2 Calibration Items
Input ATT
IF Step AMP
RBW Switching
Log Linearitry
Amplitude MAG
PBW
NOTE: You may hear some clicking noises during calibration. This is normal.
2-61
Page 99
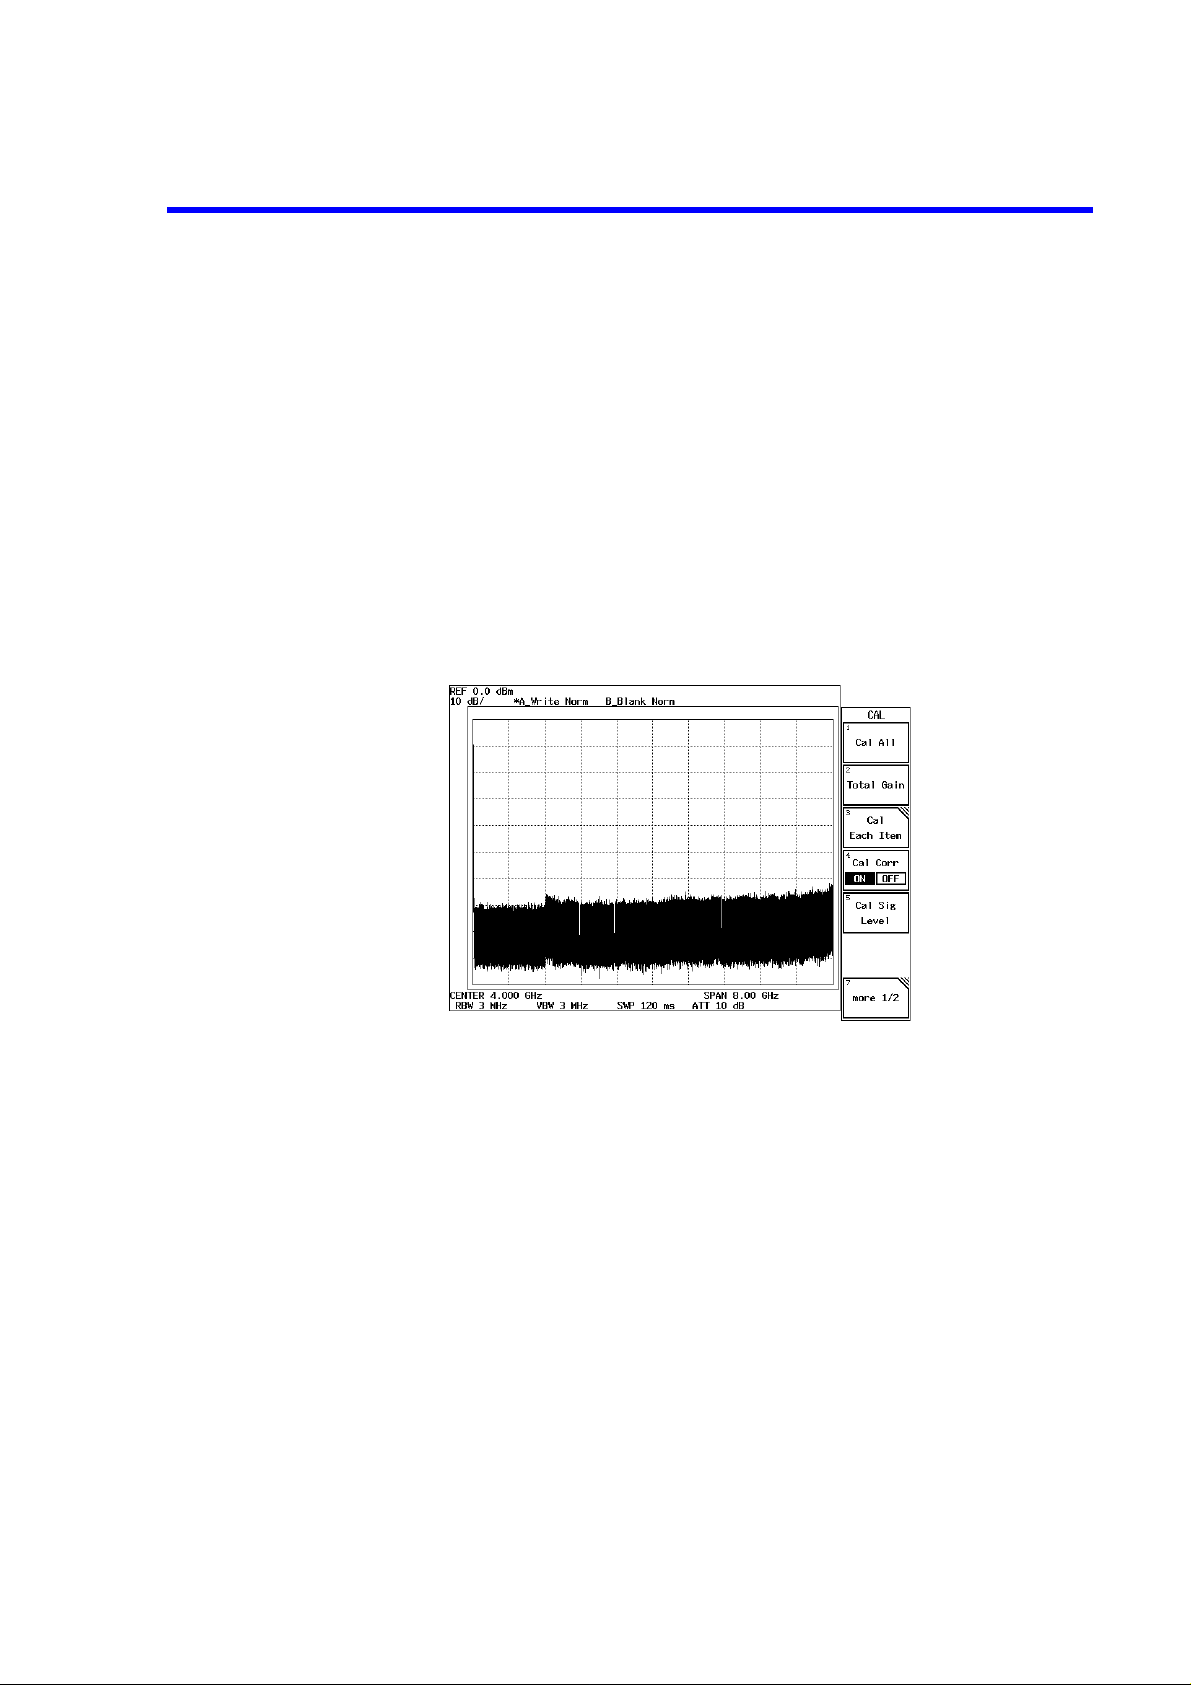
R3267 Series Spectrum Analyzer Operation Manual (Vol.1)
2.2.13 Calibration
2.2.13.1 Cal All
Setup
Connect the calibration signal.
1. Connect the N-BNC adapter to the
2. Connect the Input cable between the
Performing the calibration
3. Press
INPUT
front panel.
and
SHIFT
The menu used for calibration appears (See Figure 2-72).
7(CAL)
.
connector on the front panel.
CAL OUT
and
INPUT
connectors on the
2-62
Figure 2-72 Cal Menu
4. Press
All calibration items are performed.
Cal All
.
Page 100

2.2.13.2 Total Gain
Prior to performing this calibration, be sure to set the RB W, dB/div and reference level as the measurement conditions.
Setup
R3267 Series Spectrum Analyzer Operation Manual (Vol.1)
2.2.13 Cali bration
Connect the calibration signal.
1. Connect the N-BNC adapter to the
2. Connect the Input cable between the
front panel.
Setting measurement conditions
3. Set the RBW, dB/div and the reference lev el to the values which are a ctually used
in measurements.
Performing the calibration
4. Press
The menu used for calibration appears (See Figure 2-72).
5. Press
Calibration is performed using the current measurement conditions.
CAUTION: Perform the Total Gain calibration again if you have changed the
SHIFT
and
Total Gain
connector on the front panel.
CAL OUT
and
INPUT
connectors on the
7(CAL)
INPUT
.
.
RBW, dB/div and reference level after completing the Total Gain calibration.
2-63
 Loading...