

Page 1

Application Note
Cell Analysis
Dynamic Monitoring of Cell Adhesion
and Spreading
xCELLigence real-time cell analysis
Author
Brandon Lamarche,
JoyceVelez, and Leyna Zhao
Agilent Technologies, Inc.
Introduction
The cells that make up the various tissues and organs are held together by specific
molecules that essentially serve as “biological glue”. These molecules confer shape,
structure, rigidity, or plasticity to the cells. During embryogenesis, these biological
molecules, referred to as extracellular matrix (ECM) proteins, serve as “tracks” that
direct cells to the appropriate region within the embryo. This is so they can give rise
to different tissues and organ systems. ECM proteins also play a prominent role
during wound healing and also are involved in directing many important cellular
processes such as proliferation, survival, and differentiation. Failure of cells to
interact with the appropriate biological surface or molecule can be detrimental to the
fate of the cells and can contribute to cancer cell metastases.
The various ECM components, such as fibronectin (FN), collagens (CL),
laminins(LM), and vitronectin (VN), interact specifically with different cells through
specialized cell surface receptors called integrins. Integrins recognize and bind to
specific motifs within the ECM proteins, mediating the ability of cells to specifically
adhere to and interact with the appropriate matrix proteins.1 Integrin receptor
interaction with ECM proteins also begins an intracellular signaling cascade
that directs cellular processes, such as cell survival, proliferation, differentiation,
andmigration.
1
Page 2

The ECM proteins must be purified from
human or animal serum before any
biological effects on cells can be studied.
The purified ECM proteins are then
applied to an appropriate surface, such
as a plastic tissue culture dish or a glass
surface. When applied to an appropriate
surface at low concentrations, the
ECM proteins precipitate and coat the
surface. Cells can be applied to the
coated surface and cellular events,
such as cell adhesion and spreading,
can be assessed by various cellular
and molecular techniques. In general,
these adhesion and spreading assays
determine:
– If a certain cell type can adhere to a
specific adhesive substrate
– Whether the adhesive substrate is
capable of supporting spreading
(a process that requires both
cell adhesion and activation of
intracellular signaling pathways)
– Whether cell adhesion and spreading
are sensitive to specific reagents that
block cell/ECM interaction, interfere
with cell signaling pathways, or
disrupt cytoskeletal architecture
There are several methods for assessing
and quantifying cellular adhesion and
spreading on an ECM-coated surface:
1. The most widely used method
involves applying the cells to
surfaces coated with appropriate
ECM components, allowing the cells
to attach and adhere for a specified
length of time, then washing away the
unbound cells. The attached cells are
then fixed, labeled with fluorescent
reagent, such as rhodamine
phalloidin, and pictured using an
epifluorescence microscope or an
epifluorescence confocal microscope.
2. Alternatively, cells can be labeled
with a dye, such as crystal violet,
and quantified. Quantification
involves either manually counting
the cells under a light microscope
or measuring the absorbance of the
stain after it is solubilized.
3. Cells can also be prelabeled
with a fluorescent dye, such as
6-carboxyfluorescein diacetate
(CFDA), and then applied to an
appropriate ECM-coated surface. The
unbound cells are washed off and
the bound cells are quantified using a
plate reader.
4. A method that is designed to assess
the role of integrins and other
adhesion proteins. This method
involves coating different surfaces
with antibodies or peptides, which
are specific for the various receptors,
then seeding those surfaces with
cells that express the appropriate
integrin receptors. The interaction of
integrin receptors on the cell surface
with the antibody or peptide-coated
surface allows the cells to adhere and
undergo specific morphological and
biological changes. These changes
can then be assessed using one of
the three methods discussed above.
While the assays described above
have been informative, they all have
limitations. All are endpoint assays,
providing only a “snapshot” of the
adhesion process. Further, the assays
involve labor- and cost-intensive
prelabeling or postlabeling of cells.
Finally, they all involve fixation and
permeabilization, which destroys the cell
before it can be analyzed.
The xCELLigence system allows
label-free, dynamic monitoring of cell
events in real time. It addresses some
of the major limitations of the assays
described in this application note. For
instance, because the technique is
noninvasive, it does not require the cells
to be fixed or lysed. That means it can
be used to monitor biological events that
occur after adhesion and spreading, such
as proliferation and differentiation.
In this application note, a series of
experiments is described to demonstrate
that this new impedance-based system
is suitable for monitoring cell adhesion
and spreading.
Materials and methods
Cells
All the cells used in this study were
obtained from ATCC and maintained in a
37°C incubator with 5% CO2 saturation.
NIH3T3 cells were maintained in DMEM
media containing 10% FBS, 1% penicillin,
and 1% streptomycin. Jurkat T cells and
BxPC3 cells were maintained in RPMI
containing 10% FBS, 1% penicillin, and
1% streptomycin.
Cell adhesion assays using
impedance technology
The indicated concentration of either
FN or the control PLL was added into
the wells of 96-well E-Plates, then the
plates were incubated for one hour at
37°C. The protein‑coated plates were
washed with PBS and incubated with
0.5% BSA solution in PBS for 20 minutes
at 37°C. The wells of the treated plates
were washed with PBS before media and
cells were added. Cells were trypsinized,
spun, resuspended in serum-free media
containing 0.25% BSA and adjusted to
an appropriate concentration. A 100µL
volume of the cell suspension was
transferred to ECM- or PLL-coated wells
on E-Plates. The extent of cell adhesion
and spreading, measured as changes
in impedance with the xCELLigence
2
Page 3
system, was monitored every three
PLL
minutes for 1to3 hours depending
on the experiment. The assay system
expresses impedance in arbitrary Cell
Index (CI) units. The CI at each time
point is defined as (Rn – Rb)/15, where
Rn is the cell-electrode impedance of the
well when it contains cells and Rb is the
background impedance of the well with
the media alone.
Treatment with inhibitors
For each inhibitor, cells were
pre‑incubated for 15to30 minutes with
the indicated inhibitor concentrations
and then added to ECM-coated wells of
E-Plates. All other steps were the same
as previously mentioned.
1.2
A
Cell Index
Poly-L-
1.0
Fibronectin
0.8
0.6
0.4
0.2
0
0 0.5 1.0 1.5 2.0 2.5
Time (hours)
siRNA Transfection
BxPc3 cells were transfected with 20 nM
of siSRC using siPORTamine at a final
volume of 60 µL. Cells were assayed
for adhesion function 48 hours after
transfection.
Immunofluorescence and light
microscopy
Cells were seeded into PLL- or FN-coated
16-well chamber slides. The cells
were allowed to attach, and then were
fixed with 4% paraformaldehyde at
the indicated time points. The cells
were permeabilized, stained with
rhodamine-phalloidin, then photographed
using an epifluorescence microscope
connected to a digital camera.
Results and discussion
Dynamic monitoring of cell adhesion
and spreading on different surfaces
using impedance technology
To assess the extent of adhesion and
spreading, E-Plates were coated with
either FN or PLL (control). NIH3T3 cells
were applied to the coated wells and the
extent of adhesion and spreading was
monitored using the impedance-based
system. Simultaneously, chamber slides
were also coated with FN or PLL and
the same number of cells were added
to each well. To assess cell attachment
and spreading, cells were stained with
rhodamine‑phalloidin and analyzed with
an epifluorescence microscope.
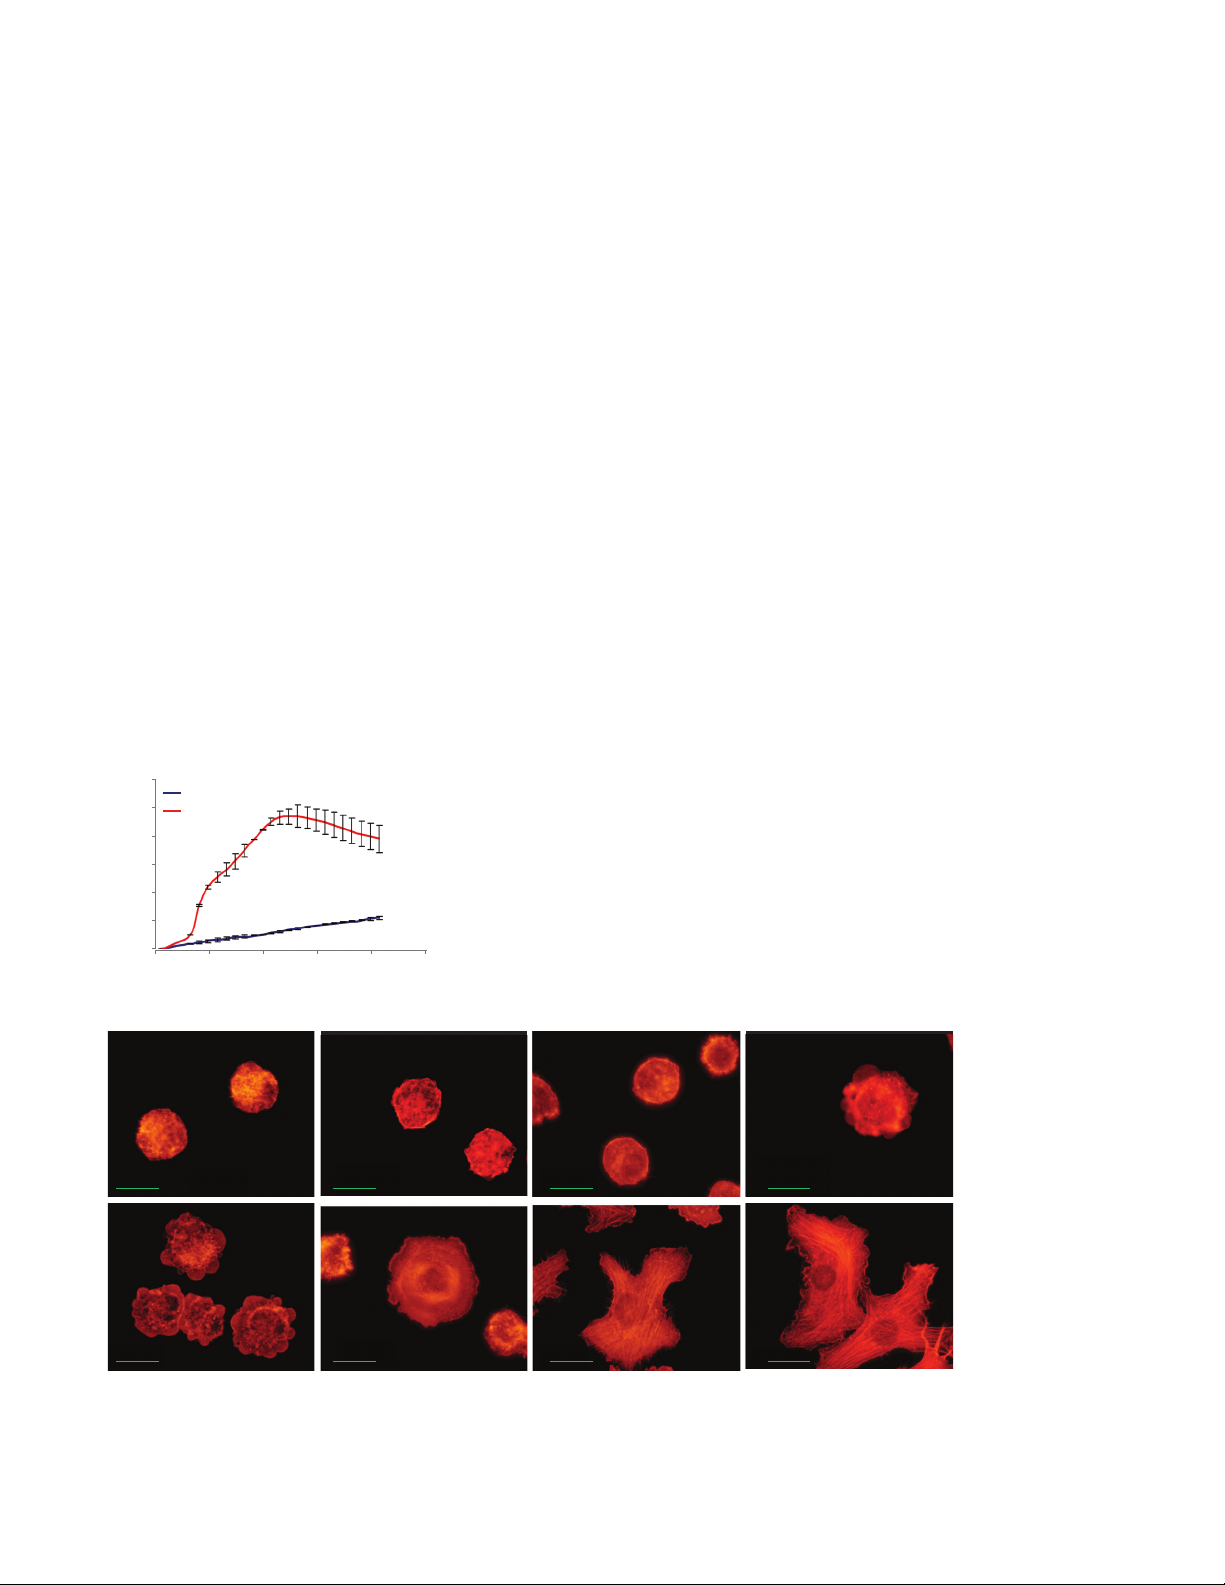
As shown in Figure 1A, the Cell Index (CI)
increased dramatically when cells are
applied to FN-coated wells. In contrast,
the CI increased slowly and steadily
when cells are applied to PLL-coated
wells. Similarly, immunofluorescent
images (Figure 1B) showed that cell
attachment on FN was accompanied by
immediate spreading. The spreading was
maximal after one hour. On PLL‑coated
wells, the cells tend to remain round even
two hours after initial attachment.
B
5 minutes 30 minutes 60 minutes 120 minutes
25 µm 25 µm 25 µm 25 µm
FN
25 µm 25 µm 25 µm 25 µm
Figure 1. (A) Dynamic monitoring of cell attachment and spreading on PLL- and FN-coated surfaces. (B) The Cell Index correlates
with the extent of cell attachment and spreading observed using conventional phalloidin staining of the actin cytoskeleton and
immunofluorescence microscopy.
3
Page 4

To determine the effect of FN
1.4
L
L
Cell Index
concentration on cell adhesion and
spreading, E-Plates were coated with
increasing concentrations of FN,
ranging from 0 to 20 µg/mL. NIH3T3
cells were added to the wells and the
extent of attachment and spreading was
monitored using the impedance-based
system. As shown in Figure 2A, the CI
increased proportionately as the amount
of FN coating increases. To demonstrate
that CI was proportional to the number
of cells adhering to the substrate, the
cells were trypsinized at three hours
postadhesion and counted manually. As
shown in Figure 2B, the raw cell number
obtained at three hours for the different
FN concentrations was proportional to
the CI obtained at three hours.
The above experiments demonstrate
that impedance technology can be used
to quantitatively assess cell attachment
and spreading in real time, under
label-free conditions.
1.2
1.0
0.8
0.6
0.4
0.2
0
0 µg/mL
0.1 µg/m
0.5 µg/m
1 µg/mL
5 µg/mL
10 µg/mL
20 µg/mL
Cell Index
A
1.2
1.0
0.8
0.6
Cell Index
0.4
0.2
0
0 0.5 1.0 1.5 2.0 2.5 3.0
12,000
10,000
Figure 2. (A) Quantitative, dynamic monitoring of cell attachment and spreading in
response to increasing concentrations of FN. (B) Comparison of Cell Index units with
manual cell counts obtained for different FN concentrations. Analysis was performed
after three hours of treatment.
8,000
6,000
4,000
2,000
B
0
20 10 510.5 0.1 0
Time (hours)
Manual count
xCELLigence
FN concentration (µg/mL)
4
Page 5

Inhibition of cell attachment and
Control 0.1 µM cRGD 10 µM cRGD
Cell IndexRelative attachment and spreading
1.2
e
spreading with peptides that
containRGD
Integrin heterodimers on the cell surface,
that bind to FN (for example, α5β1
integrins), recognize a specific motif in
FN, namely the arginine-glycine-aspartic
acid (RGD) motif.1 It has been shown that
peptides containing the RGD motif can
competitively inhibit the binding of these
cell surface receptors to FN.2
To evaluate the inhibitory effects
of RGD-containing peptides on cell
attachment to FN, NIH3T3 cells were
detached and incubated in the presence
of increasing amounts of cyclic-RGD
peptides. Treated cells were plated
onto FN-coated E-Plates and monitored
with the impedance-based system. As
seen in Figure 3A, cyclic-RGD peptides
blocked NIH3T3 cell adhesion and
spreading in a concentration-dependent
manner. A control peptide, which lacked
the RGD motif, had no effect on cell
attachment and spreading. After three
hours, the 0.1and 10 µM concentrations
of cyclic-RGD peptides blocked cell
adhesion and spreading by 20 and
40%, respectively (Figure 3B). These
experiments indicate that the disruption
of integrin receptor function can be
assessed quantitatively and in real time
using impedance-based technology.
A
1.0
0.8
0.6
0.4
0.2
0
0 0.5 1.0 1.5 2.0 2.5 3.0
1.2
B
1.0
0.8
0.6
0.4
0.2
0
Figure 3. (A) Dose-dependent inhibition of cell attachment and spreading in response to
cyclic-RGD peptides. (B) Effect of treating cells with either a control peptide or with cyclic-RGD
peptides. Cell attachment and spreading was measured after three hours of treatment.
Time (hours)
Control
0.1 µM cRGD Peptid
10 µM cRGD Peptide
5
Page 6

Inhibition of cell attachment and
733 nM
244 nM
Latrunculin (nM)
Cell Index
1.8
spreading with actin-disrupting
agents or with specific inhibitors
of signaling proteins involved in
attachment and spreading
Integrin-mediated cell adhesion is known
to organize the actin cytoskeleton in a
specific manner. The reverse is also true;
the actin cytoskeleton helps organize
integrins and other intracellular signaling
proteins into signaling modules that
regulate cell attachment and spreading.1
To determine the role of the actin
cytoskeleton in cell attachment and
spreading, NIH3T3 cells were detached
and pre-incubated with increasing
concentrations of Latrunculin, a potent
inhibitor of actin polymerization. The
cells were then seeded onto FN-coated
wells in E-Plates and the extent of
adhesion and spreading was monitored
using the impedance-based system.
As shown in Figure 4A, Latrunculin
inhibited cell attachment and spreading
in a concentration-dependent manner.
When cells are analyzed after two
hours of treatment, the results clearly
demonstrated that Latrunculin is a
potent inhibitor of cell attachment and
spreading (Figure 4B).
A
1.6
1.4
1.2
1.0
0.8
Cell Index
0.6
0.4
0.2
0
0 0.5
1.6
B
1.4
1.2
1.0
0.8
0.6
0.4
0.2
0
1 10 100 1,000
Figure 4. (A) Dynamic monitoring of the dose-dependent effect of Latrunculin on
cell attachment and spreading. NIH3T3 cells were pre-incubated with the indicated
concentrations of Latrunculin, then seeded onto FN-coated wells. (B) Analysis
of the dose-dependent effect of Latrunculin on NIH3T3 cell attachment and
spreading, measured two hours after seeding.
1.0 1.5 2.0
Time (hours)
81 nM
27 nM
9 nM
3 nM
1 nM
DMSO
6
Page 7

The group of signaling proteins that
DMSO PP2
Cell IndexRelative attachment and spreading
DMSO
3.5
participate in integrin-mediated cell
attachment and spreading includes
the Src family of nonreceptor tyrosine
kinases.1
To determine the contribution of Src
family kinases to cell attachment
and spreading, BxPC3 cells were
pre-incubated with the Src kinase
inhibitor PP2 and then seeded onto
FN-coated wells in E-Plates. The extent
of cell attachment and spreading was
monitored using the impedance-based
system. As shown in Figure 5A,
cell attachment and spreading was
significantly inhibited by the presence
of the Src inhibitor. At two hours after
seeding, the cells treated with the PP2
compound displayed approximately
60% less cell attachment and spreading
than DMSO‑treated cells (Figure 5B).
This finding confirmed previous results
obtained with conventional methods.
3
A
3.0
2.5
2.0
1.5
1.0
0.5
0
0 0.5 1.0 1.5 2.0 2.5 3.0 3.5
1.2
B
1.0
0.8
0.6
0.4
0.2
0
Figure 5. (A) Dynamic monitoring of the effect of the Src inhibitor, PP2, on cell
attachment and spreading. BxPC3 cells were pre-incubated with either PP2 or
DMSO, then seeded onto FN‑ coated wells. (B) Comparison of the effect of treating
cells with either DMSO or PP2. The extent of cell attachment and spreading on FN
was measured two hours after the treated cells were seeded onto FN -coated wells.
Time (hours)
PP2
7
Page 8

Cell IndexRelative attachment and spreading
l
4.0
An additional impedance-based method
for assessing the role of Src kinase in
cell attachment and spreading was
developed. BxPC3 cells were transfected
with either a control siRNA or a siRNA
specific for the c-Src mRNA. Forty-eight
hours after transfection, the cells were
detached and seeded onto FN-coated
wells in E-Plates and the extent of cell
adhesion and spreading was monitored.
As shown in Figures6A and B, down
regulation of the c-Src gene product led
to a 30% decrease in cell attachment
and spreading within twohours of cell
seeding. The disparity between the
inhibitory effects of the PP2 inhibitor
and the c-Src siRNA can be explained by
the fact that PP2 inhibits all Src family
members, and the siRNA specifically
inhibits c-Src.
In summary, these experiments
demonstrate that an impedance-based
system can monitor and quantitatively
assess cell attachment and spreading
in real time. Since the system does
not require labor- and cost-intensive
cell labeling, it is quicker and more
economical than conventional
methods. The noninvasive nature
of the impedance-based technique
allows the user to monitor the effect of
matrix proteins on adhesion, spreading,
and other biological events, such as
differentiation or proliferation, in a single
experiment. Traditional methods would
require separate experiments to monitor
each of these events.
A
3.5
3.0
2.5
2.0
1.5
1.0
0.5
0
0 0.5 1.0 1.5 2.0 2.5 3.0 3.5
1.2
B
1.0
0.8
0.6
0.4
0.2
0
Control siRNA c-Src siRNA
Figure 6. (A) Dynamic monitoring of cell attachment and spreading observed after
BxPC3 cells are transfected with either an siRNA specific for c-Src or a control
siRNA. (B) Comparison of the effect of c-Src siRNA and a control siRNA . The extent
of cell attachment and spreading was measured two hours after transfected BxPC3
cells were seeded onto FN-coated wells.
Time (hours)
siRNA-contro
siRNA-Src
References
1. Hynes, R. O. Cell 2002, 110, 673–87.
2. Koivunen, E.; Gay, D. A.; Ruoslahti, E.
J. Biol. Chem. 1993, 268, 20205–10 .
3. Duxbury, M. S. et al. Biochem.
Biophys. Res. Commun. 2004, 317,
133–41.
www.agilent.com/chem
For Research Use Only. Not for use in diagnostic procedures.
RA.0687615741
This information is subject to change without notice.
© Agilent Technologies, Inc. 2020, 2021
Printed in the USA, February 2, 2021
5994-1691EN
 Loading...